Embed Size (px)
Citation preview
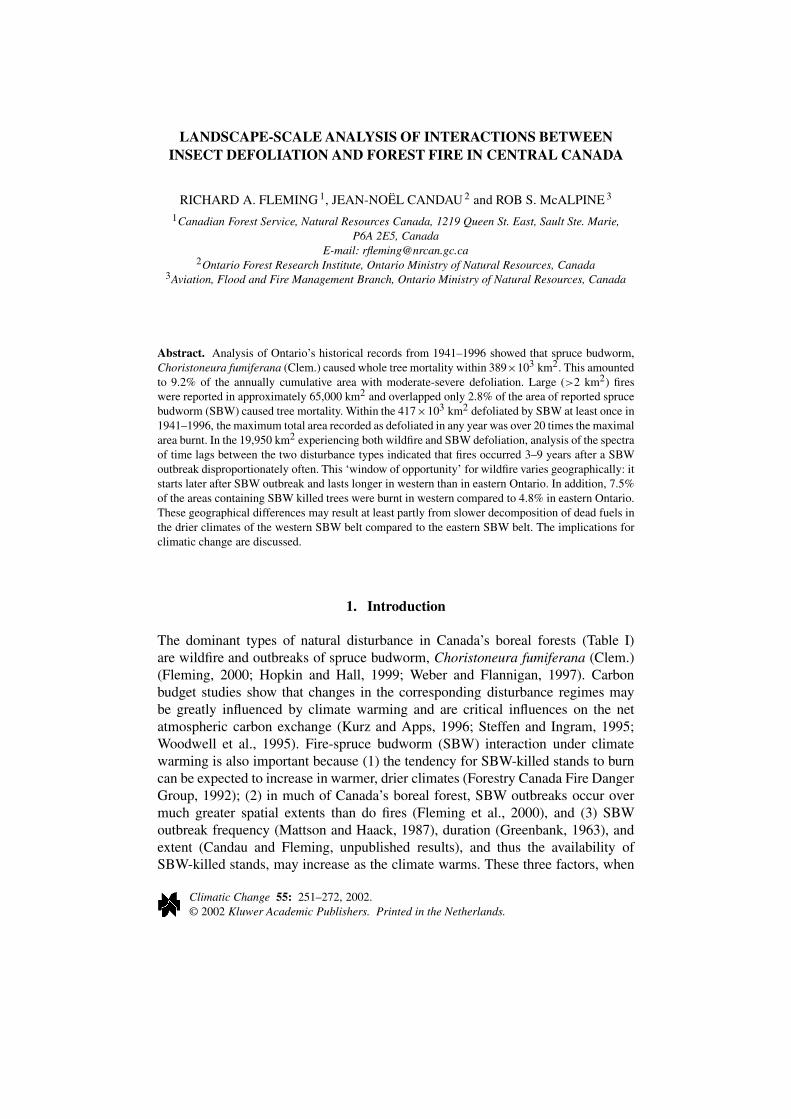
LANDSCAPE-SCALE ANALYSIS OF INTERACTIONS BETWEENINSECT DEFOLIATION AND FOREST FIRE IN CENTRAL CANADA
RICHARD A. FLEMING 1, JEAN-NOËL CANDAU 2 and ROB S. McALPINE 3
1Canadian Forest Service, Natural Resources Canada, 1219 Queen St. East, Sault Ste. Marie,P6A 2E5, Canada
E-mail: [email protected] Forest Research Institute, Ontario Ministry of Natural Resources, Canada
3Aviation, Flood and Fire Management Branch, Ontario Ministry of Natural Resources, Canada
Abstract. Analysis of Ontario’s historical records from 1941–1996 showed that spruce budworm,Choristoneura fumiferana (Clem.) caused whole tree mortality within 389×103 km2. This amountedto 9.2% of the annually cumulative area with moderate-severe defoliation. Large (>2 km2) fireswere reported in approximately 65,000 km2 and overlapped only 2.8% of the area of reported sprucebudworm (SBW) caused tree mortality. Within the 417×103 km2 defoliated by SBW at least once in1941–1996, the maximum total area recorded as defoliated in any year was over 20 times the maximalarea burnt. In the 19,950 km2 experiencing both wildfire and SBW defoliation, analysis of the spectraof time lags between the two disturbance types indicated that fires occurred 3–9 years after a SBWoutbreak disproportionately often. This ‘window of opportunity’ for wildfire varies geographically: itstarts later after SBW outbreak and lasts longer in western than in eastern Ontario. In addition, 7.5%of the areas containing SBW killed trees were burnt in western compared to 4.8% in eastern Ontario.These geographical differences may result at least partly from slower decomposition of dead fuels inthe drier climates of the western SBW belt compared to the eastern SBW belt. The implications forclimatic change are discussed.
1. Introduction
The dominant types of natural disturbance in Canada’s boreal forests (Table I)are wildfire and outbreaks of spruce budworm, Choristoneura fumiferana (Clem.)(Fleming, 2000; Hopkin and Hall, 1999; Weber and Flannigan, 1997). Carbonbudget studies show that changes in the corresponding disturbance regimes maybe greatly influenced by climate warming and are critical influences on the netatmospheric carbon exchange (Kurz and Apps, 1996; Steffen and Ingram, 1995;Woodwell et al., 1995). Fire-spruce budworm (SBW) interaction under climatewarming is also important because (1) the tendency for SBW-killed stands to burncan be expected to increase in warmer, drier climates (Forestry Canada Fire DangerGroup, 1992); (2) in much of Canada’s boreal forest, SBW outbreaks occur overmuch greater spatial extents than do fires (Fleming et al., 2000), and (3) SBWoutbreak frequency (Mattson and Haack, 1987), duration (Greenbank, 1963), andextent (Candau and Fleming, unpublished results), and thus the availability ofSBW-killed stands, may increase as the climate warms. These three factors, when
Climatic Change 55: 251–272, 2002.© 2002 Kluwer Academic Publishers. Printed in the Netherlands.
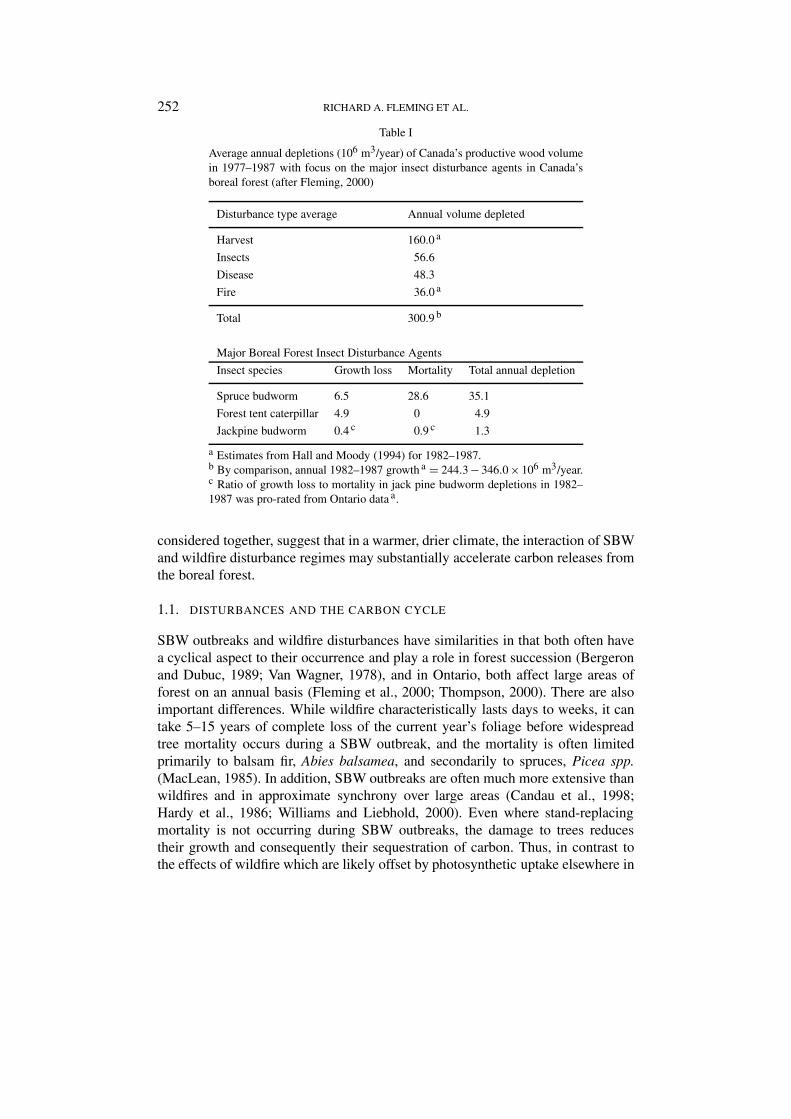
252 RICHARD A. FLEMING ET AL.
Table I
Average annual depletions (106 m3/year) of Canada’s productive wood volumein 1977–1987 with focus on the major insect disturbance agents in Canada’sboreal forest (after Fleming, 2000)
Disturbance type average Annual volume depleted
Harvest 160.0 a
Insects 56.6
Disease 48.3
Fire 36.0 a
Total 300.9 b
Major Boreal Forest Insect Disturbance Agents
Insect species Growth loss Mortality Total annual depletion
Spruce budworm 6.5 28.6 35.1
Forest tent caterpillar 4.9 0 4.9
Jackpine budworm 0.4 c 0.9 c 1.3
a Estimates from Hall and Moody (1994) for 1982–1987.b By comparison, annual 1982–1987 growth a = 244.3 − 346.0 × 10⁶ m3/year.c Ratio of growth loss to mortality in jack pine budworm depletions in 1982–1987 was pro-rated from Ontario data a.
considered together, suggest that in a warmer, drier climate, the interaction of SBWand wildfire disturbance regimes may substantially accelerate carbon releases fromthe boreal forest.
1.1. DISTURBANCES AND THE CARBON CYCLE
SBW outbreaks and wildfire disturbances have similarities in that both often havea cyclical aspect to their occurrence and play a role in forest succession (Bergeronand Dubuc, 1989; Van Wagner, 1978), and in Ontario, both affect large areas offorest on an annual basis (Fleming et al., 2000; Thompson, 2000). There are alsoimportant differences. While wildfire characteristically lasts days to weeks, it cantake 5–15 years of complete loss of the current year’s foliage before widespreadtree mortality occurs during a SBW outbreak, and the mortality is often limitedprimarily to balsam fir, Abies balsamea, and secondarily to spruces, Picea spp.(MacLean, 1985). In addition, SBW outbreaks are often much more extensive thanwildfires and in approximate synchrony over large areas (Candau et al., 1998;Hardy et al., 1986; Williams and Liebhold, 2000). Even where stand-replacingmortality is not occurring during SBW outbreaks, the damage to trees reducestheir growth and consequently their sequestration of carbon. Thus, in contrast tothe effects of wildfire which are likely offset by photosynthetic uptake elsewhere in
INTERACTIONS BETWEEN INSECT DEFOLIATION AND FOREST FIRE 253
the forest (McNaughton et al., 1997), SBW are capable of imposing the oscillatorysignature of their 35-year outbreak cycle on net carbon fluxes, even at nationalscales (compare Figure 3 of Kurz and Apps, 1999, with Figure 2 of Candau et al.,1998).
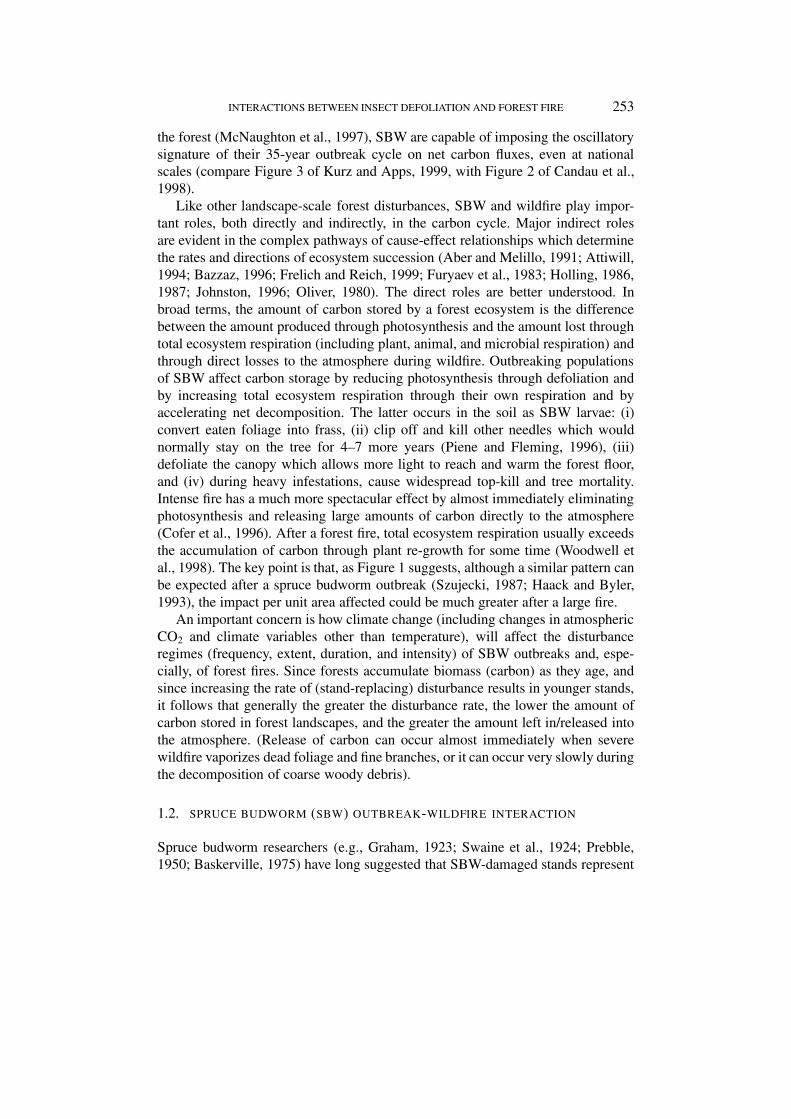
Like other landscape-scale forest disturbances, SBW and wildfire play impor-tant roles, both directly and indirectly, in the carbon cycle. Major indirect rolesare evident in the complex pathways of cause-effect relationships which determinethe rates and directions of ecosystem succession (Aber and Melillo, 1991; Attiwill,1994; Bazzaz, 1996; Frelich and Reich, 1999; Furyaev et al., 1983; Holling, 1986,1987; Johnston, 1996; Oliver, 1980). The direct roles are better understood. Inbroad terms, the amount of carbon stored by a forest ecosystem is the differencebetween the amount produced through photosynthesis and the amount lost throughtotal ecosystem respiration (including plant, animal, and microbial respiration) andthrough direct losses to the atmosphere during wildfire. Outbreaking populationsof SBW affect carbon storage by reducing photosynthesis through defoliation andby increasing total ecosystem respiration through their own respiration and byaccelerating net decomposition. The latter occurs in the soil as SBW larvae: (i)convert eaten foliage into frass, (ii) clip off and kill other needles which wouldnormally stay on the tree for 4–7 more years (Piene and Fleming, 1996), (iii)defoliate the canopy which allows more light to reach and warm the forest floor,and (iv) during heavy infestations, cause widespread top-kill and tree mortality.Intense fire has a much more spectacular effect by almost immediately eliminatingphotosynthesis and releasing large amounts of carbon directly to the atmosphere(Cofer et al., 1996). After a forest fire, total ecosystem respiration usually exceedsthe accumulation of carbon through plant re-growth for some time (Woodwell etal., 1998). The key point is that, as Figure 1 suggests, although a similar pattern canbe expected after a spruce budworm outbreak (Szujecki, 1987; Haack and Byler,1993), the impact per unit area affected could be much greater after a large fire.
An important concern is how climate change (including changes in atmosphericCO2 and climate variables other than temperature), will affect the disturbanceregimes (frequency, extent, duration, and intensity) of SBW outbreaks and, espe-cially, of forest fires. Since forests accumulate biomass (carbon) as they age, andsince increasing the rate of (stand-replacing) disturbance results in younger stands,it follows that generally the greater the disturbance rate, the lower the amount ofcarbon stored in forest landscapes, and the greater the amount left in/released intothe atmosphere. (Release of carbon can occur almost immediately when severewildfire vaporizes dead foliage and fine branches, or it can occur very slowly duringthe decomposition of coarse woody debris).
1.2. SPRUCE BUDWORM (SBW) OUTBREAK-WILDFIRE INTERACTION
Spruce budworm researchers (e.g., Graham, 1923; Swaine et al., 1924; Prebble,1950; Baskerville, 1975) have long suggested that SBW-damaged stands represent
254 RICHARD A. FLEMING ET AL.
Figure 1. Schematic comparing expected impacts of SBW outbreak and wildfire on stand carbon, C,reservoirs from the (indicated) start of disturbance until stand maturity. Depending on disturbanceintensity, much C stored in living tree biomass is quickly converted to dead organic matter, includingdead trees and breakage from surviving trees. Shortly after the disturbance is over, tree biomassC increases through uptake by growing trees as the stand regenerates, and dead organic matterC declines due to decomposition and reduced transfers from living tree biomass. These transfersincrease later as the regenerated stand matures. The ecosystem is a net C source until uptake by theregrowing stand exceeds losses from dead organic matter. Throughout the bottom panel’s shadedregion, this stand would be a C source after SBW attack or C sink following fire.

INTERACTIONS BETWEEN INSECT DEFOLIATION AND FOREST FIRE 255
an increased risk of wildfire. There are also records of major forest fires occurringin areas shortly after SBW outbreaks. Notable examples include New Brunswick’s‘Miramichi’ fire in 1825 (Flieger, 1971), Minnesota’s ‘Isle Royale’ fire in 1936(Hansen et al., 1973), and Ontario’s ‘Mississagi’ fire in 1948 (Stocks and Walker,1973).
Nonetheless, many fire managers remained skeptical of the importance of thisinteraction so a joint Canadian Forest Service-Ontario Ministry of Natural Re-sources series of experimental burns was undertaken at a site near the AubinadongRiver (latitude 46◦53′ N, longitude 83◦24′ W) from 1976–1982 (Stocks, 1985,1987). The burns occurred in mixedwood stands typical of Canada’s Great Lakes– St. Lawrence and boreal forest regions (Rowe, 1972) where balsam fir grows inthe understory in a heterogenous mix of tree species which often includes spruce,pine (Pinus spp.), and birch (Betula spp.). Although too few (n = 5) experimentalplots were successfully burnt to statistically identify patterns among plots with ac-ceptable power (Cohen, 1988), the results suggested that the abundance of ‘ladderfuels’ can make SBW-killed stands an extreme fire risk (Stocks, 1985, 1987). ‘Lad-der fuels’ are the dead and broken tops and branches which, as they fell, becameentangled by other branches and are thus positioned to conduct relatively harmlessground fires up into the crown. After these experimental burns, spruce budwormkilled balsam fir became recognized as an important fuel type in operational wild-fire risk assessment (Forestry Canada Fire Danger Group, 1992). In this paper, webegin to quantify the wildfire-SBW interaction and its variability over space andtime on a regional basis.
2. Methods
2.1. DATA
The analysis brings together data from a number of sources. The fire occurrencedata comes partly from an extensive GIS-based data set of all fires exceeding 2km2 in area that have occurred since 1980. The data set was built through detailedanalysis of individual fire reports collected from all Canadian fire managementagencies (Stocks et al., 1996). The Ontario aspects of this large fire data basehave been augmented by digitizing the fire history maps produced by Donnellyand Harrington (1978) for Ontario for 1921–1976, inclusively. Ontario Ministry ofNatural Resources (OMNR) has filled in gaps by digitizing other data to producean extensive and thorough database for all large (>2 km2) fires that occurred inOntario since 1921. We use only the large fires because, even though they repre-sent only 3.5% of Canada’s recorded wildfires, they account for 97% of total areaburned (Stocks et al., 1996).
The main limitation to the wildfire database arises from the likely presence ofsome fire location errors and the possibility that a few fires in remote northern
256 RICHARD A. FLEMING ET AL.
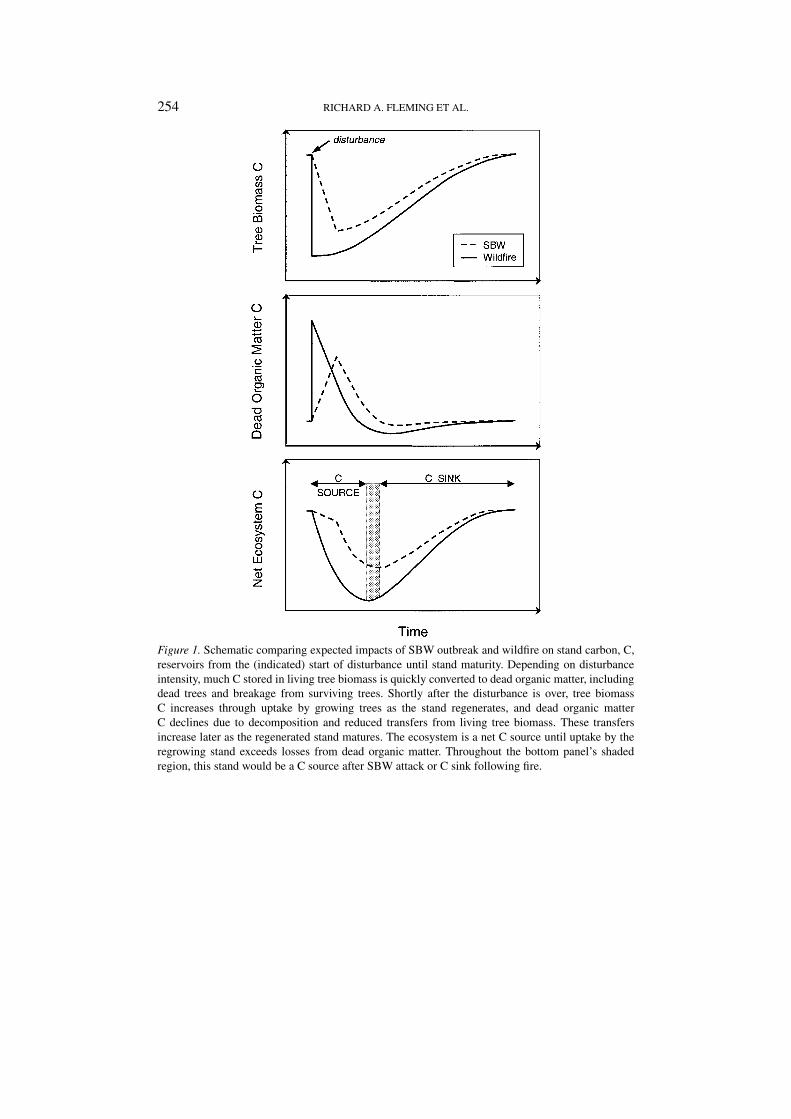
Figure 2. Locations of the two major natural disturbance types in Ontario’s forests from 1941–1996.(a) Frequency (see legend) of moderate to severe SBW defoliation recorded by FIDS aerial survey. (b)Occurrence of large (>2 km2) forest fire (black) overlaid on the ‘belt’ experiencing SBW defoliationat least once (grey). Two vertical lines on each map separate the western (W), central (C), and eastern(E) zones of SBW defoliation identified by Candau et al. (1998). In (b), the circled ‘X’ and the dashedline running it through respectively indicate the location of the Aubinadong River experimental burns(Stocks, 1985, 1987) and 47◦ N (after Fleming et al., 2000).
regions may have been overlooked altogether (Stocks et al., 1996). This last lim-itation is of questionable relevance here since our analysis focuses more on thesouthern regions of Ontario where SBW outbreaks are recorded (Figure 2).
The SBW defoliation data comes from survey data collected by the Forest In-sect and Disease Survey (FIDS) of the Canadian Forest Service. FIDS has beenconducting aerial reconnaissance of large-scale SBW defoliation in Ontario’s pro-ductive and exploitable forests since 1941. Reconnaissance flights are plannedannually to begin as soon as the current season’s defoliation is completed, generallyin mid- to late-July. During survey flights, the observer relies on the telltale signs(Sippell, 1983) of SBW infestation to delineate defoliation on maps, usually withan error under 500 m. During their most active feeding stages (i.e., 4th–6th instars),budworm larvae lay down a fine silk thread as they crawl about the foliage of theirhost conifer, and when they stop to feed, the larvae tie up the surrounding needlesin their silk. As this silk dries, it contracts, pulling the needles together to form asort of shelter for each feeding larva. The larvae feed on the new shoots, cuttingoff needles near their base rather than consuming all the green tissue. The severedneedles are prevented from falling by the silken webbing which attaches them tothe tree. These severed needles slowly develop the brick red colour which providesthe distinctive tinge to trees defoliated by the spruce budworm that is so evidentfrom the air.

INTERACTIONS BETWEEN INSECT DEFOLIATION AND FOREST FIRE 257
There are a number of potential sources of error in FIDS’ aerial surveys of SBWdefoliation (Sippell, 1983). Heavy rain can wash away dead foliage causing defo-liated trees to lose their distinctive reddish brown hue before the survey plane fliesover. Underestimating defoliation also occurs in the first year of heavy defoliationon white spruce when the proportion of the total foliage that becomes discolouredis so small that it is barely detectable from the air. The scale of the infestationalso affects survey accuracy. Observers typically map with less relative, but greaterabsolute, error when an infestation is extensive (e.g., over 100,000 km2) than whenit is small (e.g., under 200 km2). The phase of an outbreak also has an influenceon survey accuracy. Budworm damage is more conspicuous during the peak thanduring either the build-up or the collapse. Large flower or cone crops and injuriescaused by other pests and frosts can all create difficulties.
FIDS also recorded the presence of spruce budworm-caused tree mortality in1941–1960 and 1973–1996. Observers looked for totally grey trees from the air.Subsequent ground checks (for brown cambium on both sides of some boles) wereneeded for confirmation, however, because trees appearing grey from the air are notnecessarily dead – they may have only dead crowns (Sippell, 1983). From 1961–1972, FIDS did not record tree mortality so it is often difficult to determine whenFIDS first noticed tree mortality in a particular area.
While fire control has clearly affected the wildfire data (Donnelly and Harring-ton, 1978), there is reason to suspect that, as Hardy et al. (1986) imply, sprayinggenerally has had little effect on the large-scale patterns of spruce budworm de-foliation in Ontario. The largest spray program occurred in 1986 (Howse et al.,1995) but this amounted to only 1.7% of the 8.75 × 10⁴ km2 of moderate andsevere defoliation that year (Howse, 1995). Furthermore, Lysyk’s (1990) analysisof Ontario survey data from 1968–1988 indicated that ‘sprays . . . overall, did notconfer a high level of foliage protection’. Similar results have been reported forsome other jurisdictions (e.g., Fleming et al., 1984).
2.2. ANALYSIS
The 56 annual survey maps (from 1941 to 1996), which delineate areas of Ontariowithin which SBW caused defoliation occurred that year, were digitized for use ina geographic information sysem (GIS) by depicting areas moderately or severelydefoliated as polygons. Using the GIS, various arithmetic manipulations (Candauet al., 1998) were performed on the digitized SBW defoliation maps to calculate(1) the total area defoliated in any year in all, or selected parts, of the province and(2) the overall frequency of defoliation from 1941 to 1996 everywhere within theprovince.
With this approach, Candau et al. (1998) showed that from 1941–1996, SBWdefoliation in Ontario has occurred in a belt running east-west between 45◦ and52◦ N latitude (Figure 2a). The northern and southern fringes of this belt have rarelybeen defoliated. Within this belt, one can distinguish three somewhat autonomous
258 RICHARD A. FLEMING ET AL.
zones of relatively frequent SBW defoliation separated by two narrow corridorsrunning approximately north-south in which SBW defoliation occurs less often(Figure 2a). Part of our analysis compares the SBW-wildfire interaction in thesedifferent zones.
Since SBW-caused tree mortality is the cumulative effect of years of defoli-ation (MacLean, 1985), we report tree mortality as a net value resulting fromeach outbreak. To calculate this value, the total area within which tree mortalityoccurred during and following an outbreak, we summed the areas within whichFIDS recorded SBW-caused tree mortality up to the start of the next outbreak.In doing so, we took care not to count any areas more than once. Accordingly,FIDS records of SBW-caused tree mortality in 1941–1960 and 1973–1996 wererespectively assigned to the first and second outbreaks. FIDS did not record SBW-caused tree mortality from 1961–1972 when the first outbreak subsided and thesecond later began.
The data set of digitized SBW defoliation maps was combined on a GIS with thedigitized maps of the large wildfire data set for Ontario described above. A wildfire-SBW combined data set emerged which identified every non-contiguous (polygon)area with a unique combination of wildfire and SBW defoliation histories. Thelags between the time an area was burned and the closest incidences of reportedSBW defoliation in the same area were of particular interest. Positive lags werecalculated as the time between the last incidence of defoliation before a fire, andthe occurrence of that fire. Negative lags apply when fire precedes defoliation. Zerolags indicate that fire and SBW defoliation were reported in the same year for thesame area. The frequency of each possible lag was calculated for all Ontario and forstratifications based on SBW defoliation zone. The lag frequencies were weightedby the total area over which they occurred to provide a measure of relative impor-tance. Histograms were then constructed showing spectra of these area-weightedfrequencies of occurrence against time lag.
Regression analysis (Draper and Smith, 1981) was used to explore the relation-ship between an area’s propensity for fire and its frequency of defoliation by SBWfrom 1941–1996. The independent variable, X, was the number of years defoliated.The dependent variable, Y , measured the total area burnt (with multiple burns in thesame area counted multiple times) relative to the total area defoliated X = x years.The Anderson-Darling normality test (Anderson and Darling, 1954) was appliedto test the regression assumption of normally distributed residuals. The residualswere also examined to verify that other regression assumptions were adequatelysatisfied.
Null models (Gotelli and Graves, 1996) were used to test whether the timelags between wildfire occurrence and the most recent (or next) occurrence ofSBW defoliation in the same area were explainable by chance alone. In general,null models provide frameworks for generating the patterns expected in non-experimental data when a particular effect, or relationship between variables, isnot present. Thus, in the terminology of inferential statistics, these patterns can be
INTERACTIONS BETWEEN INSECT DEFOLIATION AND FOREST FIRE 259
thought of as manifestations of the ‘null’ hypothesis. We used the ‘bootstrapping’option (Efron and Tibshirani, 1991) in Bruce et al.’s (1999) package for computer-intensive statistical methods to generate these patterns. This involved randomlyassigning (with replacement) time-series of wildfire occurrence(s) and, separately,time-series of SBW defoliation records to the different non-contiguous polygonareas in the combined wildfire-SBW data set. The positive, negative, and zero timelags were then calculated for each area. All areas experiencing a given time lagwere then summed. When this was done for all time lags, a histogram resultedwith its height representing cumulative area and its horizontal axis denoting thetime lag. This process was repeated 500 times to produce a frequency distributionreflecting natural variability in the cumulative area at each time lag. The 2.5 and97.5 percentiles of these distributions were calculated as non-parametric estimatesof 95% confidence limits for the pattern expected if the null hypothesis were true(i.e., that wildfire events are completely independent of the occurrence of SBWdefoliation). Time lags at which the height of the histogram of observations fallsoutside the 95% confidence interval cannot be easily explained by random variationand hence are considered ‘statistically significant’.
A complication exists with this approach because different time lags, whenmeasured within the same polygon, are not necessarily temporally independent.At most a single value of a positive and negative lag, however, could be calcu-lated for over 93% of either the 2666 polygons or the 19950 km2 experiencingboth fire and SBW disturbance, because they were only burnt once. The rest wereburnt twice. Since we focus on the positive lags with fire succeeding defoliation,dependencies between positive and negative lags are not important. We are moreconcerned that different polygons are not necessarily spatially independent. A largearea may have a common defoliation history because it has been subject to the samelarge outbreaks. However, because fires tend to have smaller extents, the largearea can become broken up into a number of polygons which differ in their firehistories. Because of these concerns and because our analysis treats all polygons astotally independent, the resulting P -values should be regarded as under-estimatedapproximations.
Preliminary comparison of the large fire and defoliation databases revealed afew areas which had been misclassified as having ‘moderate-severe defoliation’in 1985 and 1986. Reclassifying these areas as ‘not defoliated’ in these yearsreduced the data set from 21934 to 19950 km2. After further error-proofing anddata verification, the statistical methods described above were applied to revealgeneral, large-scale patterns of the interaction of wildfire and SBW defoliation.
To develop inferences about possible geographic effects on the spectrum oftime lags between SBW defoliation and wildfire, the data were stratified by zone(Figure 2a). Histograms of area-weighted frequencies of different time lags weredeveloped from the data in each zone. Null models were used to design ‘bootstrap-ping’ computer algorithms for estimating 95% confidence limits for the spectrumillustrated in each zone individually.
260 RICHARD A. FLEMING ET AL.
A non-parametric procedure was developed to compare the patterns of statisticalsignificance (shown in the histograms) by which fire follows SBW defoliation ineach zone. For each time lag of fire following SBW defoliation between 1–16 years,the estimated statistical significance of the lag’s frequency of occurrence was givena value from 1–3, respectively, depending on whether its area-weighted frequencywas significantly low, was not significant, or was significantly high. This producedan ordinal representation of the occurrence of statistical significance in the time lagspectrum for each zone. Cross-correlation time-series analysis (Chatfield, 1989)provided comparisons of these ordinal representations among zones. Because or-dinal data do not strictly satisfy the assumptions for cross-correlation time-seriesanalysis, the P -values should be regarded as approximations.
3. Results
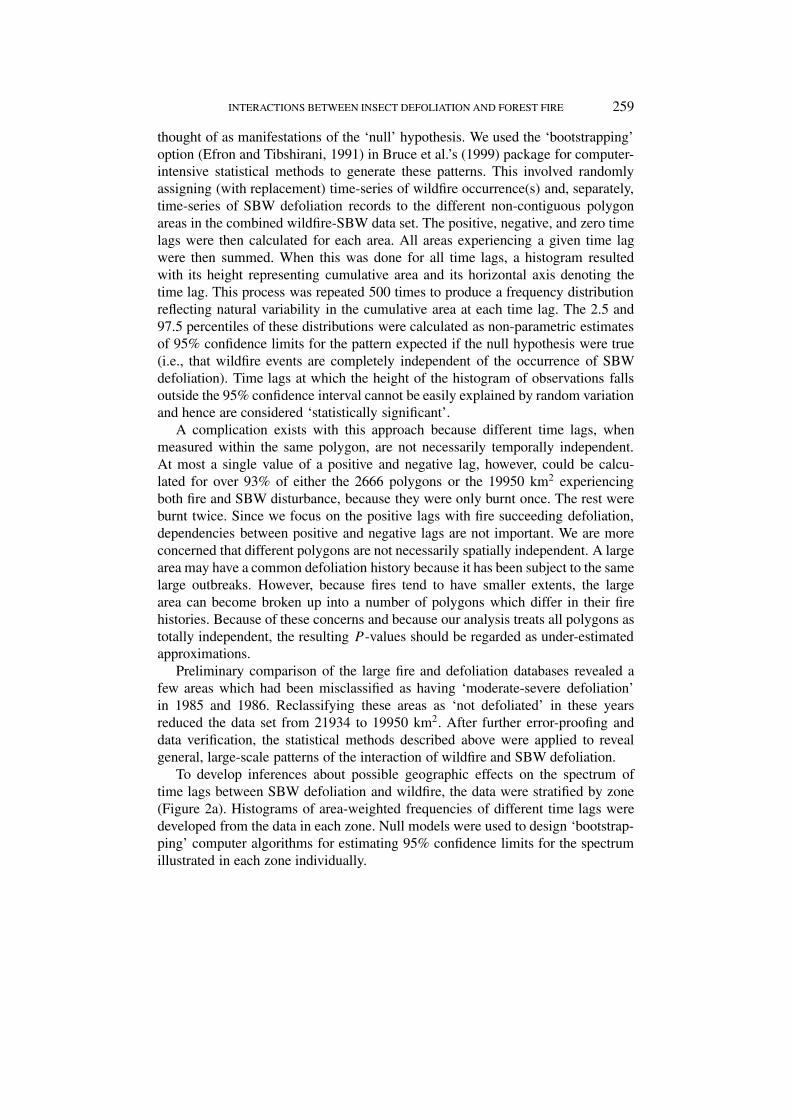
Figures 2 and 3 indicate that the areal extent of SBW disturbances greatly exceedsthat of wildfire. In Figure 2a, some of the areas have been reported defoliated asmuch as 25 times, while few of the areas reported burnt in Figure 2b have experi-enced more than one wildfire. Figure 2b shows that over half of the area burned inOntario from 1941–1996 was north of the SBW belt. Wildfire activity, particularlyin the western and central zones, decreased after 1941 when FIDS became fullyoperational (Figure 3) and fire control efforts increased.
Wildfire was reported in 10.45 × 10³ km2 of SBW-caused tree mortality duringthe same outbreak. This is likely an underestimate because (1) the FIDS programwas not fully operational at the start of the first outbreak in the Eastern zone(Figure 3c), and (2), the data ends in 1996, just as the last outbreak collapsed,so wildfires lagging the final years of defoliation, particularly in the central andwestern zones (Figure 3), may have been missed. With this qualification, this over-lap amounts to at least 46% and 2.7%, respectively, of the total areas attributed towildfire and SBW-caused tree mortality from 1941–1996.
Other general relationships in the wildfire and SBW defoliation data can bederived from Table II. For example, SBW caused tree mortality over much largerareas than wildfire. Table II gives the extents of tree mortality associated with the1940s–1950s and the late 1960s–1996 outbreaks, respectively, as 148 × 103 km2
and 241 × 103 km2. From 1941–1996, 22.5 × 10³ km2 burned.Consider a second example. It takes some years of moderate-severe SBW defo-
liation to kill trees (MacLean, 1985) and because the infestations move from year toyear, most stands survive defoliation. To quantify this relationship, 6 ‘independent’ratios of tree mortality to defoliation can be calculated from Table II by stratifyingby zone x outbreak period. The range, mean, and standard deviation of these 6ratios are 0.0714–0.115, 0.0916, and 0.0179, respectively.
INTERACTIONS BETWEEN INSECT DEFOLIATION AND FOREST FIRE 261
Figure 3. Time series of total area defoliated by SBW (dashed line, right axis) and of total area oflarge (>2 km2) burns (solid line, left axis) within the SBW belt’s (a) western, (b) central, and (c)eastern zones (Figure 2).

262 RICHARD A. FLEMING ET AL.
Table II
Areal extent of spruce budworm (SBW) outbreaks and large (>2 km2) wildfiresin each defoliation zone (Figure 2), and for all of Ontario’s SBW belt. Unitsof km2 × yrs indicate that areas were counted each time they experienced thedisturbance during the given time period
Zone of Spruce Budworm Defoliation
East Central West Whole
SBW belt
Area (103 km2): 255 66.0 96.0 417
Defoliation (103 km2 × yrs)
1941–1963 769 a 187 a 426 a 1380 a
1967–1996 1780 392 610 2780
Tree mortality (103 km2)
1941–1960 85.2 b 14.0 b 48.9 b 148 b
1973–1996 159 28.0 c 53.8 c 241 c
Wildfire (103 km2 × yrs)
1941–1966 10.5 1.54 2.36 14.4
1967–1996 1.28 1.48 c 5.38 c 8.14 c
a Underestimated because the first outbreak was already underway in 1941 whenthe data begins.b Underestimated because records are incomplete.c Underestimated because the data ends as defoliation collapses in 1996.
3.1. FIRE-DEFOLIATION SPATIAL ASSOCIATION
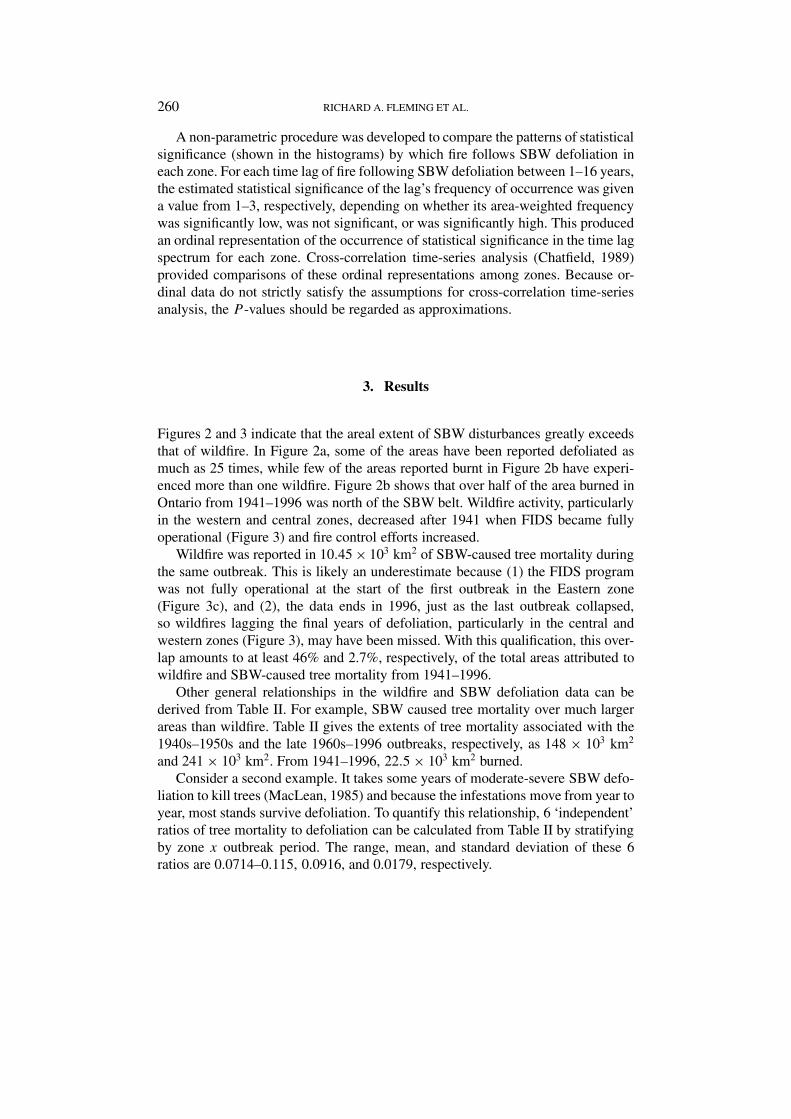
Figure 4 shows the general relationship between an area’s defoliation frequency(X) and its propensity to burn. The fitted model is
Y = aX2 + bX + c ,
where Y is the total area burnt as a percentage of all area defoliated X = x years(R2 = 70.4%, F2,22 = 26.76, P < 0.0001). The precision (standard error of theestimate) of the curve was 2.62%. The Anderson-Darling normality test revealed nostatistically significant deviations (A2 = 0.451, P = 0.252) of the residuals from anormal distribution. The parameter estimates (and their associated standard errorsand P -values, respectively) were a = −0.0549 (0.0113, P < 0.0001), b = 1.03(0.303, P = 0.003), and c = 8.79 (1.71, P < 0.0001).
Figure 4 indicates that areas within the SBW belt that suffered moderate fre-quencies (9–11 years) of defoliation were the most likely to be burnt. The locationsof the frequently defoliated areas may explain their relative rarity of wildfire. Theselocations (Figure 2a) tend to have high percentages of forest cover (Perera andBaldwin, 2000, Figure 5.5a), much of it with a large coniferous component (Perera
INTERACTIONS BETWEEN INSECT DEFOLIATION AND FOREST FIRE 263
Figure 4. The horizontal axis indicates the number of years that different areas of the SBW beltwere defoliated from 1941–1996 (Figure 2a). The vertical axis shows the total area-years burnt from1921–1996 as a percentage of the total area at each defoliation frequency. (Areas were counted everytime they were burnt). Observations (•), a fitted regression curve (solid line), and the curve’s 95%confidence limits about the mean (dashed lines) are shown.
and Baldwin, 2000, Figure 5.10). Gauthier et al. (1996) and Bergeron and Leduc(1998) suggest a cause-effect relationship which may apply in these circumstances.As time since fire increases, they suggest that SBW host trees become an increasingproportion of the forest, and forests dominated by these species often support SBWpopulations capable of causing aerially visible defoliation. Thus, their hypothesisassociates low fire frequencies with high defoliation frequencies.
Figure 4, however, also associates low fire frequencies with low defoliationfrequencies, and Figure 2 suggests this may occur predominantly near urbanized,south-eastern Ontario. Here farms and large pockets of dense deciduous forest pre-vent the continuity of SBW host tree species that is found further north (Perera andBaldwin, 2000, Figures 5.5b, 5.10, 5.12) and this fragmentation may limit SBWdefoliation. In addition, the proximity of the area to urban centres calls for vigorousfire control. Support for this reasoning comes from summing the areas burnt eachyear from 1921–1996 in areas defoliated infrequently (i.e., 1–8 years). North andsouth of 47◦ N (Figure 2b) these sums respectively represent 14.5% and 3.4% of thetotal area infrequently defoliated. In addition, fitting the model to only data fromnorth of 47◦ N showed considerably less downward curvature at low defoliationfrequencies. This reduced curvature is quantified by the model’s new (north of47◦ N) curvature parameter, a = −0.0005 (standard error = 0.0001, P = 0.0001),
264 RICHARD A. FLEMING ET AL.
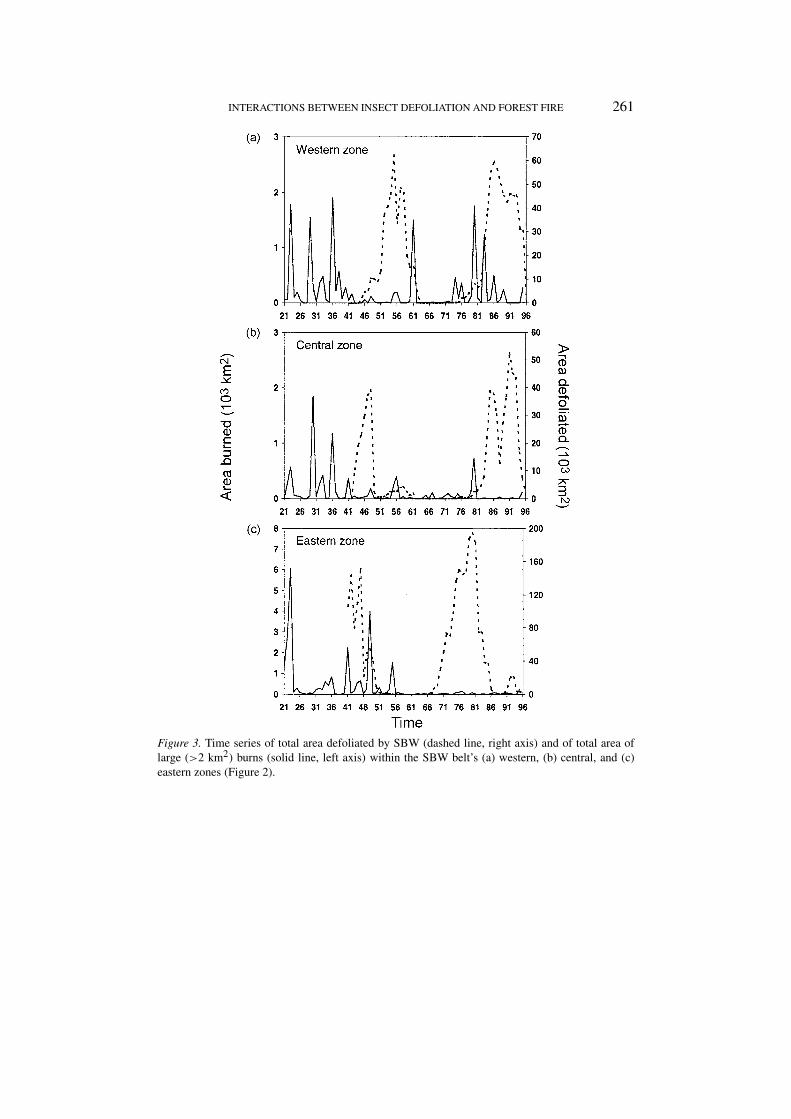
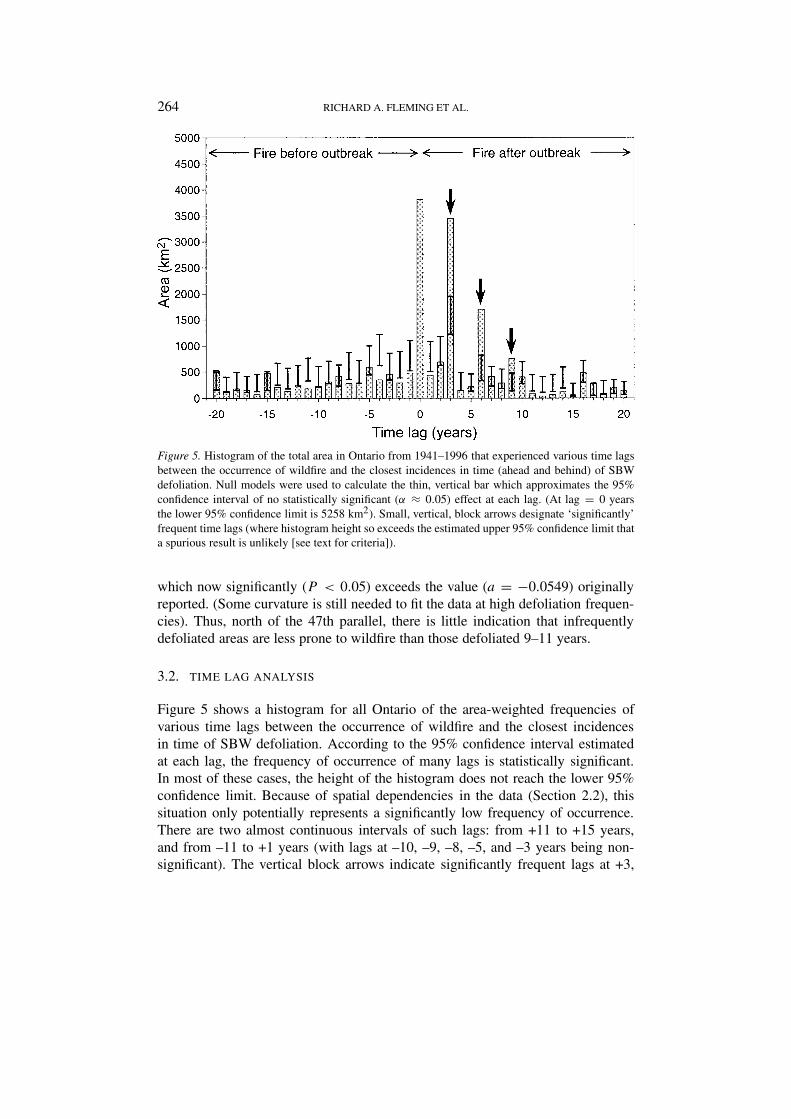
Figure 5. Histogram of the total area in Ontario from 1941–1996 that experienced various time lagsbetween the occurrence of wildfire and the closest incidences in time (ahead and behind) of SBWdefoliation. Null models were used to calculate the thin, vertical bar which approximates the 95%confidence interval of no statistically significant (α ≈ 0.05) effect at each lag. (At lag = 0 yearsthe lower 95% confidence limit is 5258 km2). Small, vertical, block arrows designate ‘significantly’frequent time lags (where histogram height so exceeds the estimated upper 95% confidence limit thata spurious result is unlikely [see text for criteria]).
which now significantly (P < 0.05) exceeds the value (a = −0.0549) originallyreported. (Some curvature is still needed to fit the data at high defoliation frequen-cies). Thus, north of the 47th parallel, there is little indication that infrequentlydefoliated areas are less prone to wildfire than those defoliated 9–11 years.
3.2. TIME LAG ANALYSIS
Figure 5 shows a histogram for all Ontario of the area-weighted frequencies ofvarious time lags between the occurrence of wildfire and the closest incidencesin time of SBW defoliation. According to the 95% confidence interval estimatedat each lag, the frequency of occurrence of many lags is statistically significant.In most of these cases, the height of the histogram does not reach the lower 95%confidence limit. Because of spatial dependencies in the data (Section 2.2), thissituation only potentially represents a significantly low frequency of occurrence.There are two almost continuous intervals of such lags: from +11 to +15 years,and from –11 to +1 years (with lags at –10, –9, –8, –5, and –3 years being non-significant). The vertical block arrows indicate significantly frequent lags at +3,
INTERACTIONS BETWEEN INSECT DEFOLIATION AND FOREST FIRE 265
+6, and +9 years. Although the 534 km2 observed exceeds the 97.5 percentileof 502 km2 in the randomly generated data at lag = −20, this is so close as tobe seemingly explainable by spatial dependencies (see above). Hence, we do notconsider –20 a ‘significantly’ frequent lag. In any case, these results suggest that anarea generally takes at least 20 years to recover from a large [>2 km2] fire beforeit can support enough SBW to cause aerially visible defoliation. The 9437 km2
shown with lags between –17 and +1 were probably not actually defoliated in theyears indicated, but rather fell within larger areas mapped and classified by FIDSas ‘areas within which defoliation occurred’.
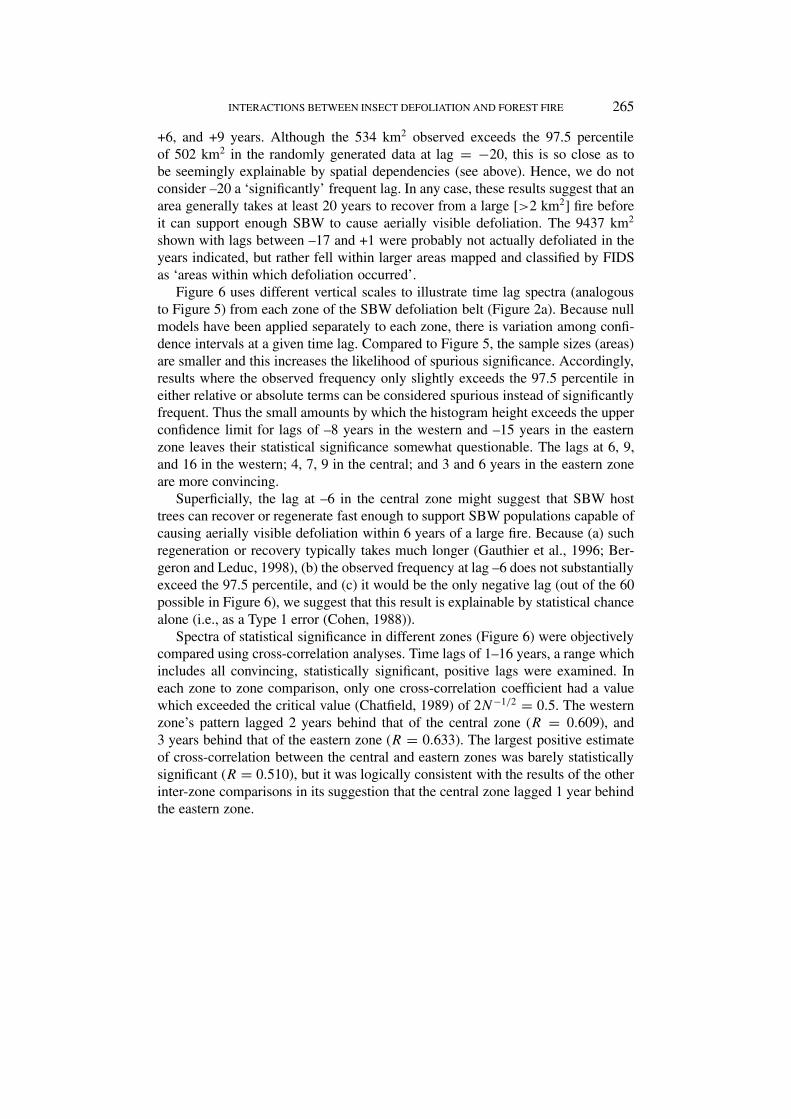
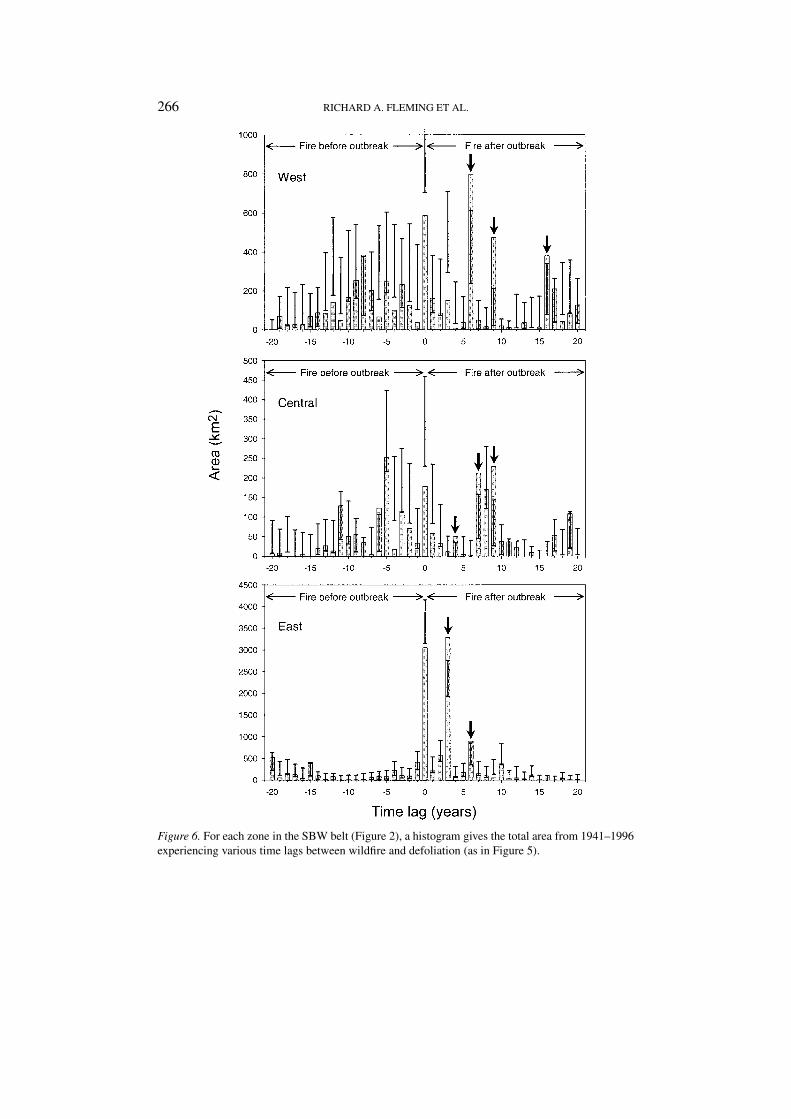
Figure 6 uses different vertical scales to illustrate time lag spectra (analogousto Figure 5) from each zone of the SBW defoliation belt (Figure 2a). Because nullmodels have been applied separately to each zone, there is variation among confi-dence intervals at a given time lag. Compared to Figure 5, the sample sizes (areas)are smaller and this increases the likelihood of spurious significance. Accordingly,results where the observed frequency only slightly exceeds the 97.5 percentile ineither relative or absolute terms can be considered spurious instead of significantlyfrequent. Thus the small amounts by which the histogram height exceeds the upperconfidence limit for lags of –8 years in the western and –15 years in the easternzone leaves their statistical significance somewhat questionable. The lags at 6, 9,and 16 in the western; 4, 7, 9 in the central; and 3 and 6 years in the eastern zoneare more convincing.
Superficially, the lag at –6 in the central zone might suggest that SBW hosttrees can recover or regenerate fast enough to support SBW populations capable ofcausing aerially visible defoliation within 6 years of a large fire. Because (a) suchregeneration or recovery typically takes much longer (Gauthier et al., 1996; Ber-geron and Leduc, 1998), (b) the observed frequency at lag –6 does not substantiallyexceed the 97.5 percentile, and (c) it would be the only negative lag (out of the 60possible in Figure 6), we suggest that this result is explainable by statistical chancealone (i.e., as a Type 1 error (Cohen, 1988)).
Spectra of statistical significance in different zones (Figure 6) were objectivelycompared using cross-correlation analyses. Time lags of 1–16 years, a range whichincludes all convincing, statistically significant, positive lags were examined. Ineach zone to zone comparison, only one cross-correlation coefficient had a valuewhich exceeded the critical value (Chatfield, 1989) of 2N−1/2 = 0.5. The westernzone’s pattern lagged 2 years behind that of the central zone (R = 0.609), and3 years behind that of the eastern zone (R = 0.633). The largest positive estimateof cross-correlation between the central and eastern zones was barely statisticallysignificant (R = 0.510), but it was logically consistent with the results of the otherinter-zone comparisons in its suggestion that the central zone lagged 1 year behindthe eastern zone.
266 RICHARD A. FLEMING ET AL.
Figure 6. For each zone in the SBW belt (Figure 2), a histogram gives the total area from 1941–1996experiencing various time lags between wildfire and defoliation (as in Figure 5).
INTERACTIONS BETWEEN INSECT DEFOLIATION AND FOREST FIRE 267
4. Discussion
Most of our analyses pertain to the 417 × 103 km2 defoliated by SBW at least oncein 1941–1996. This area is contiguous and crosses Ontario in an east-west striptermed the ‘SBW belt’ (Figure 2a). The eastern, central, and western parts of theSBW belt each have unique histories of disturbance (Figure 3; Candau et al., 1998).
4.1. WILDFIRE-SBW INTERACTION
In Ontario as a whole, spruce budworm (SBW) disturbances are typically muchmore extensive than wildfire: from 1941–1996 fires were reported in approxi-mately 65.0 × 10³ km2 while SBW caused whole tree mortality within 389 × 103
km2. Within the SBW belt the maximum total area recorded as defoliated in anyyear from 1941–1996 is over 20 times the maximal area burnt from 1921–1996(Figure 3).
Within this belt, areas that suffered moderate frequencies (9–11 years) of SBWdefoliation were the most likely to be burnt (Figure 4). That a large part of the rarelydefoliated area occurs near urbanized south-eastern Ontario where fire control isvigorous explains the reduced proportion burnt at low defoliation frequencies. Atthe other extreme, high fire frequencies prevent the development of extensive ar-eas of forest heavily populated by SBW host tree species. Hence, the most oftendefoliated areas also have low fire frequencies.
Fires occurred 3–9 years after a SBW outbreak disproportionately often (Fig-ure 5). The timing of this ‘window of opportunity’ for wildfire depends largelyon the vertical structure of the available fuel (Stocks, 1985, 1987). After SBWattack, breakage of dead tree tops and windthrow of dead trees gradually buildup an accumulation of ‘ladder fuels’ in a stand which provide small surface firesaccess to the canopy. Once in the canopy, fire severity increases dramatically, andwhat otherwise might have remained a small surface fire can spread quickly. Later,as the balsam fir fuel on the ground begins to rot and decompose, and a herbaceousunderstory thickens, fire potential declines.
The timing and width of this ‘window of opportunity’ vary geographically. To-gether, Figure 6 and the cross-correlation analyses suggest the presence of a trendfrom west to east for wildfire to follow a period of SBW defoliation more quicklyand over a shorter range of time lags.
4.2. CLIMATIC INFLUENCES
Climatic influences may at least partially explain many of these results. Generally,a continental climate of low precipitation and relatively warm temperatures occursin the western zone of the SBW belt in early to mid-summer (Baldwin et al., 2000),when fire risk is greatest (Stocks, 1985, 1987). This produces much more prolongedperiods of water deficit in the western than in the eastern zone. In this drier climateof the western zone, large fires happen often (Figure 3), particularly north of the
268 RICHARD A. FLEMING ET AL.
SBW belt where control efforts are weak (Figure 2b). In the eastern zone, largefires are rarer, especially since the late 1950s when active fire suppression becamewidely practiced within Ontario’s commercial forests (Thompson, 2000). In thenorthern part of this zone, wet soils and common intrusions of damp, cool air fromHudson Bay limit wildfire (Figure 2b). Nonetheless, drought and large fuel loadshave occasionally produced extensive fires in the eastern zone.
The climatic gradients described above also offer at least a partial explanationfor differences (Figure 6) in the wildfire-SBW interaction across the SBW belt.In the wetter climate of eastern Ontario (Baldwin et al., 2000), decomposition ofground fuel likely proceeds more quickly than in the dryer, western zone. Twolikely effects of increased rates of decomposition are shortening the length of timeafter SBW-caused tree mortality at which fire potential remains high, and reducingthe likelihood that a SBW killed stand will be burnt at all before it regenerates. Theresults in Figure 6 and the cross-correlation analyses of these results reported aboveprovide evidence supporting the first of these inferred effects. Some evidence forthe second comes from the data in Table II which shows that from 1941–1996, theratios of area burnt in the SBW belt relative to the area within which tree mortalityoccurred was 0.0482, 0.0719, and 0.0754 in the eastern, central, and western zones,respectively. The ratios of the western and central zones are likely underestimated.Widespread defoliation occurred there in the early 1990s (Figure 3), but our data,which ends in 1996, misses some resulting fires with longer time lags (Figure 6).
In a climate change scenario of warmer and dryer future climates, one couldexpect slower rates of decomposition, more frequent drought conditions, and con-sequently, more fires in post-outbreak stands. It has also been suggested that thedurations (Greenbank, 1963), extents (Candau and Fleming, preliminary results),or frequencies (Mattson and Haack, 1987) of SBW outbreaks may increase in suchclimates. If so, the resulting increase in the availability of insect-killed stands as cli-mate change proceeds may further accelerate fire activity, and consequently, causeadditional C losses from SBW-killed stands. Whether these increased C losses willcompare with those due to possible direct effects of climatic change on fire regimesis uncertain.
A number of authors (e.g., Fleming, 2000; Kurz and Apps, 1996; Stocks etal., 1996; Woodwell et al., 1998) have wondered whether the future scale of fireor SBW disturbances could become large enough to affect the rates of climaticchange on a regional basis. The interaction of these disturbances also deservesconsideration in this question. Because of the vast extents of SBW outbreaks andthe low proportions of stands attacked by SBW which subsequently burn underpresent conditions (Table II), there is much potential for SBW to boost fire activityeven more in future climates (Fleming, 2000). Depending partly on the additionalC released to the atmosphere (Figure 1) – and theory suggests C released by firefrom SBW-killed stands exceeds that from otherwise similar but unattacked stands(Forestry Canada Fire Danger Group, 1992) – increased promotion of fire by SBWcould help accelerate warming on a regional basis. Accordingly, we would expect
INTERACTIONS BETWEEN INSECT DEFOLIATION AND FOREST FIRE 269
such increased warming to increase further both SBW activity and the proportionof SBW-killed stands that burn. This positive feedback process provides a mecha-nism additional to those considered by Woodwell et al. (1998) through which thewarming could speed the warming.
Acknowledgements
This research has been funded, in part, through Collaborative Research Agree-ments with the Ontario Ministry of Natural Resources, through the CCAF (ClimateChange Action Fund) program managed by Environment Canada, and throughthe ENFOR (ENergy from the FORest) program managed by Natural ResourcesCanada. We thank the Canadian Forest Service’s Fire Danger Group and ForestInsect and Disease Survey and the Ontario Ministry of Natural Resources for data.We also thank Matt Ayres for a very helpful review, Tony Hopkin and Brian Stocksfor discussion, Tim Burns for help with data processing and analysis, and JohnMason for explanation of the large fire data base.
References
Aber, J. D. and Melillo, J. M.: 1991, Terrestrial Ecosystems, Saunders College Publishing, HoltRinehart and Winston, Orlando, Florida.
Anderson, T. W. and Darling, D. A.: 1954, ‘A Test for Goodness of Fit’, J. Amer. Statist. Ass. 49,765–769.
Attiwill, P. M.: 1994, ‘The Disturbance of Forest Ecosystems: The Ecological Basis for ConservativeManagement’, Forest Ecol. Manage. 63, 247–300.
Baldwin, D. J. B., Desloges, J. R., and Band, L. E.: 2000, ‘Physical Geography of Ontario’, in Perera,A. H., Euler, D. E., and Thompson, I. D. (eds.), Ecology of a Managed Terrestrial Landscape:Patterns and Processes of Forest Landscapes in Ontario, University of British Columbia Press,Vancouver, B. C., pp. 141–162.
Baskerville, G. L.: 1975, ‘Spruce Budworm: Super Silviculturist’, For. Chron. 61, 138–140.Bazzaz, F. A.: 1996, Plants in Changing Environments, Cambridge University Press, Cambridge,
U.K.Bergeron, Y. and Dubuc M.: 1989, ‘Succession in the Southern Part of the Canadian Boreal Forest’,
Vegetatio 79, 51–63.Bergeron, Y. and Leduc, A.: 1998, ‘Relationships between Change in Fire Frequency and Mortality
due to Spruce Budworm Outbreak in the Southeasterrn Part of the Canadian Boreal Forest’, J.Veg. Sci. 9, 492–500.
Bruce, P., Simon, J., and Oswald, T.: 1999, Resampling Stats User’s Guide, Resampling Stats Inc.,Arlington, Viginia, U.S.A., p. 122.
Candau, J-N., Fleming, R. A., and Hopkin, A. A.: 1998, ‘Spatio-Temporal Patterns of Large-ScaleDefoliation Caused by the Spruce Budworm in Ontario since 1941’, Can. J. Forest Res. 28, 1–9.
Chatfield, C.: 1989, The Analysis of Time Series: An Introduction, Chapman and Hall, London, U.K.,p. 241.
Cofer, W. R. III, Winstead, E. L., Stocks, B. J., Cahoon, D. R., Goldammer, J. G., and Levine, J. S.:1996, ‘Composition of Smoke from North American Boreal Forest Fires’, in Goldammer, J. G.
270 RICHARD A. FLEMING ET AL.
and Furyaev, V. V. (eds.), Fire in Ecosystems of Boreal Eurasia, Kluwer Academic Publishers,Dordrecht, pp. 465–475.
Cohen, J.: 1988, Statistical Power Analysis for the Behavioral Sciences, Lawrence ErlbaumAssociates, Hillsdale, N. J., p. 567.
Donnelly, E. and Harrington, J. B.: 1978, Forest Fire History Map of Ontario, MiscellaneousReport FF-Y-6, Forest Fire Research Institute, Canadian Forestry Service, Department of theEnvironment, Ottawa, Ontario, p. 15.
Draper, N. R. and Smith, H.: 1981, Applied Regression Analysis, Second Edition, John Wiley andSons, New York, p. 709.
Efron, B. and Tibshirana, R.: 1991, ‘Statistical Data Analysis in the Computer Age’, Science 253,390–395.
Fleming, R. A.: 2000, ‘Climate Change and Insect Disturbance Regimes in Canada’s Boreal Forests’,World Resour. Rev. 12, 520–554.
Fleming, R. A., Hopkin, A. A., and Candau, J.-N.: 2000, ‘Insect and Disease Disturbance Regimes inOntario’s Forest Ecosystems’, in Perera, A. H., Euler, D.E., and Thompson, I. D. (eds.), Ecologyof a Managed Terrestrial Landscape: Patterns and Processes of Forest Landscapes in Ontario,University of British Columbia Press, Vancouver, B. C., pp. 141–162.
Fleming, R. A., Shoemaker, C. A., and Stedinger J. R.: 1984, ‘An Assessment of the Impact ofLarge Scale Spraying Operations on the Regional Dynamics of Spruce Budworm, (Lepidoptera:Tortricidae), Populations’, Can. Entomologist 116, 633–644.
Flieger, B. W.: 1971, ‘Forest Fire and Insects: The Relation of Fire to Insect Outbreak’, in Proc.Annu. Tall Timbers Fire Ecol. Conf. 10, 107–114.
Forestry Canada Fire Danger Group: 1992, Development and Structure of the Canadian ForestFire Behavior Prediction System, Information Report ST-X-3, Forestry Canada Science andSustainable Development Directorate, Ottawa, p. 62.
Frelich, L. E. and Reich, P. B.: 1999, ‘Neighborhood Effects, Disturbance Severity, and CommunityStability in Forests’, Ecosystems 2, 151–166.
Furyaev, V. V., Wein, R. W., and MacLean, D. A.: 1983, ‘Fire Influences in Abies-dominated Forests’,in Wein, R. W. and MacLean, D. A. (eds.), The Role of Fire in Northern Circumpolar Ecosystems,Wiley, New York, pp. 221–234.
Gauthier, S., Leduc, A., and Bergeron, Y.: 1996, ‘Forest Dynamics Modelling under Natural FireCycles: a Tool to Define Natural Mosaic Diversity for Forest Management’, Environ. Monitor.Assess. 39, 417–434.
Gotelli, N. J. and Graves, G. R.: 1996, Null Models in Ecology, Smithsonian Institute Press,Washington, p. 368.
Graham, S. A.: 1923, ‘The Dying Balsam Fir and Spruce in Minnesota’, Univ. Minn., Agric. Ext.Div., St. Paul, Spec. Bull. 68, 12.
Greenbank, D. O.: 1963, ‘Climate and the Spruce Budworm’, Memoirs Entomol. Soc. Can. 31, 174–180.
Haack, R. A. and Byler, J. W.: 1993, ‘Insects and Pathogens: Regulators of Forest Ecosystems’, J.Forestry 91, 32–37.
Hall, J. P. and Moody, B. H. (compilers): 1994, Forest Depletions Caused by Insects and Diseases inCanada 1982–1987, Information Report ST-X-8, Canadian Forest Service, Ottawa, p. 14.
Hansen, H. L., Krefting, L. W., and Kurmis, V.: 1973, ‘The Forest of Isle Royale in Relation to FireHistory and Wildlife’, Univ. Minn., Agric. Exp. Stn., St. Paul, Tech. Bull. 294, 43.
Hardy, Y., Mainville, M., and Schmitt, D. M.: 1986, An Atlas of Spruce Budworm Defoliation inEastern North America, 1938–1980, Miscellaneous Publication No. 1449, USDA Forest Service,Cooperative State Research Service, USDA, Washington.
Holling, C. S.: 1986, ‘The Resilience of Terrestrial Ecosystems: Local Surprise and Global Change’,in Clark, W. C. and Munn, R. E. (eds.), Sustainable Development of the Biosphere, CambridgeUniversity Press, Cambridge, U.K., pp. 292–317.
INTERACTIONS BETWEEN INSECT DEFOLIATION AND FOREST FIRE 271
Holling, C. S.: 1987, ‘Simplifying the Complex: the Paradigms of Ecological Structure andFunction’, Europ. J. Operation. Res. 30, 139–146.
Hopkin, A. A. and Hall, J. P.: 1999, ‘Monitoring the Health of Canada’s Boreal Forest’, in Wox-holtt, S. (ed.), Proceedings of the 9th International Boreal Forest Research Association (IBFRA)Conference, Norsk institutt for skogforskning (NISK), Ås, Norway, pp. 29–34.
Howse, G. M.: 1995, ‘Forest Insect Pests in the Ontario Region’, in Armstrong, J. A. and Ives,W. G. H. (eds.), Forest Insect Pests in Canada, Natural Resources Canada, Canadian ForestService, Ottawa, Ontario, pp. 41–57.
Howse, G. M., Meating, J. H., and Churcher, J. J.: 1995, ‘Insect Control in Ontario, 1974–1987’,in Armstrong, J. A. and Ives, W. G. H. (eds.), Forest Insect Pests in Canada, Canadian ForestService, Ottawa, Ontario, pp. 679–700.
Johnston, M.: 1996, ‘The Role of Disturbance in Boreal Mixedwood Forests of Ontario’, in Smith,C. R. and Crook, G. W. (compilers), Advancing Boreal Mixedwood Management in Ontario:Proceedings of a Workshop, Canadian Forest Service and Ontario Ministry of Natural Resources,Sault Ste. Marie, Ontario, pp. 33–40.
Kurz, W. A. and Apps, M. J.: 1996, ‘Retrospective Assessment of Carbon Flows in Canadian BorealForests’, in Apps, M. J. and Price, D. T. (eds.), Forest Ecosystems, Forest Management and theGlobal Carbon Cycle, Springer-Verlag, Heidelberg, pp. 173–182.
Kurz, W. A. and Apps, M. J.: 1999, ‘A 70-year Retrospective Analysis of Carbon Fluxes in theCanadian Forest Sector’, Ecol. Appl. 9, 526–547.
Lysyk, T. J.: 1990, ‘Relationship between Spruce Budworm (Lepidoptera: Tortricidae) Egg MassDensity and Resultant Defoliation of Balsam Fir and White Spruce’, Can. Entomol. 122, 253–262.
MacLean, D. A.: 1985, ‘Effects of Spruce Budworm Outbreaks on Forest Growth and Yield’, inSanders, C. J., Stark, R. W., Mullins, E. J., and Murphy, J. (eds.), Recent Advances in SpruceBudworms Research, Canada and U.S.A. spruce budworm program, Canadian Forest Service,Ottawa, pp. 148–175.
Mattson, W. J. and Haack, R. A.: 1987, ‘The Role of Drought in Outbreaks of Plant-eating Insects’,BioScience 37, 110–118.
McNaughton, S. J., Sronach, N. R., and Georgiadis, N. J.: 1997, ‘Combustion in Natural Fires andGlobal Emission Budgets’, Ecol. Appl. 8, 464–468.
Oliver, C. D.: 1980, ‘Forest Development in North America Following Major Disturbance’, ForestEcol. Manage. 3, 153–168.
Perera, A. H. and Baldwin, D. J. B.: 2000, ‘Spatial Patterns in the Managed Forest Landscape ofOntario’, in Perera, A. H., Euler, D. E., and Thompson, I. D. (eds.), Ecology of a ManagedTerrestrial Landscape: Patterns and Processes of Forest Landscapes in Ontario, University ofBritish Columbia Press, Vancouver, B. C., pp. 74–99.
Piene, H. and Fleming, R. A.: 1996, ‘Spruce Budworm Defoliation and Growth Loss in YoungBalsam Fir: Spacing Effects on Needlefall in Protected Trees’, For. Sci. 42, 282–289.
Prebble, M. L.: 1950, ‘The Battle of the Budworm’, Pulp Paper Mag. Can. 51, 150–155.Rowe, J. S.: 1972, Forest Regions of Canada, Publication No. 1300, Canadian Forestry Service,
Department of the Environment, Ottawa, Ontario.Sippell, W. L.: 1983, ‘A Review of the Spruce Budworm and its Outbreak History’, in Sanders, C. J.
and Carrow, J. R. (co-chairs), The Spruce Budworm Problem in Ontario – Real or Imaginary?,Canadian Forest Service, Sault Ste. Marie, Ontario, Canada, pp. 17–25.
Steffen, W. L. and Ingram, J. S. I.: 1995, ‘Global Change and Terrestrial Ecosystems: An InitialIntegration’, J. Biogeogr. 22, 165–174.
Stocks, B. J.: 1985, ‘Forest Fire Behavior in Spruce Budworm-killed Balsam Fir’, in Recent Advancesin Spruce Budworms Research. Proc. CANUSA Spruce Budworms Res. Symp., 16–20 Sept., 1984,Bangor, Maine. Can. For. Serv., Ottawa, Ontario.
272 RICHARD A. FLEMING ET AL.
Stocks, B. J.: 1987, ‘Fire Potential in the Spruce Budworm-damaged Forests of Ontario’, For. Chron.63, 8–14.
Stocks, B. J., Lee, B. S., and Martell, D. L.: 1996, ‘Some Potential Carbon Budget Implications ofFire Management in the Boreal Forest’, in Apps, M. J. and Price, D. T. (eds.), Forest Ecosys-tems, Forest Management and the Global Carbon Cycle, NATO ASI Series 1, Vol. 40, Globalenvironmental change, Springer-Verlag, Heidelberg, Germany.
Stocks, B. J. and Walker, J. D.: 1973, Climatic Conditions before and during Four Significant ForestFire Situations in Ontario, Inf. Rep. O-X-187, Dep. Environ., Can. For. Serv., Sault Ste. Marie,Ont., p. 19.
Swaine, J. M., Craighead, F. C., and Bailey, I. W.: 1924, ‘Studies on the Spruce Budworm (Cacoeciafumiferana Clem.)’, Dom. Can. Dep. Agric., Ottawa, Ont. Bull. 37, 91.
Szujecki, A.: 1987, Ecology of Forest Insects, Junk, Boston, p. 600.Thompson, I. D.: 2000, ‘Forest Vegetation of Ontario: Factors Influencing Landscape Change’, in
Perera, A. H., Euler, D. E., and Thompson, I. D. (eds.), Ecology of a Managed Terrestrial Land-scape: Patterns and Processes of Forest Landscapes in Ontario, University of British ColumbiaPress, Vancouver, B. C., pp. 30–53.
van Wagner, C. E.: 1978, ‘Age Class Distribution and the Fire Cycle’, Can. J. Forest Res. 8, 220–227.Weber, M. G. and Flannigan, M. D.: 1997, ‘Canadian Boreal Forest Ecosystem Structure and
Function in a Changing Climate: Impact on Fire Regimes’, Environ. Rev. 5, 145–166.Williams, D. W. and Liebhold, A. M.: 2000, ‘Spatial Synchrony of Spruce Budworm Outbreaks in
Eastern North America’, Ecology 81, 2753–2766.Woodwell, G. M., Mackenzie, F. T., Houghton, R. A., Apps, M. J., Gorham, E., and Davidson, E. A.:
1995, ‘Will the Warming Speed the Warming?’, in Woodwell, G. M. and Mackenzie, F. T. (eds.),Biotic Feedbacks in the Global Climatic System: Will the Warming Feed the Warming?, OxfordUniversity Press, New York, pp. 393–411.
Woodwell, G. M., Mackenzie, F. T., Houghton, R. A., Apps, M., Gorham, E., and Davidson, E.:1998, ‘Biotic Feedbacks in the Warming of the Earth’, Clim. Change 40, 495–518.
(Received 23 January 2001; in revised form 20 March 2002)