Embed Size (px)
Citation preview
Landowners on the Metropolitan Fringe: Results from a Survey of Owners in Four US Metropolitan Areas
Jennifer Hrabchak Molinsky
© 2006 Lincoln Institute of Land Policy
Lincoln Institute of Land Policy
Working Paper
The findings and conclusions of this paper are not subject to detailed review and do not necessarily reflect the official views and policies of the Lincoln Institute of Land Policy.
Please do not photocopy without permission of the Institute. Contact the Institute directly with all questions or requests for permission.
Lincoln Institute Product Code: WP06JM1
Abstract
The Lincoln Institute of Land Policy conducted a study of metropolitan fringe landowners between 2002 and 2003, surveying by telephone over 2,000 owners of open, undeveloped fringe land in four US metropolitan regions: Austin, Texas; Charlotte, North Carolina; Portland, Oregon; and Sacramento, California. The project examined owners’ identities; their behaviors, including when and how owners acquired their property, how they currently use their land, and their intentions going forward; and the interests they have in their land. This paper presents results from the survey, highlighting two areas of findings in particular. First, the paper explores owners’ identities and behaviors, highlighting the many ways in which land use patterns, owners’ characteristics, and owners’ behaviors are consistent across the metropolitan fringes Austin, Charlotte, Portland, and Sacramento. The overall survey findings reveal that fringe areas are characterized by a mix of land uses but dominated by agriculture, though the owner population is composed primarily of retirees and professionals not involved in land-intensive work. There is a mix of parcel sizes, from large open and agricultural land to smaller home lots. There are significant groups of both longtime owners and relative newcomers. Most are individuals and families and not corporate owners. A significant group inherited their land and an overlapping set of owners wish to pass on their land to children, the majority of whom believe their children will use the land in the same way. Across all regions, there is a fair amount of consistency in owners’ propensity to have sold or transferred portions of their land in the past, in their general land market participation, and in their future plans for their land. The survey showed two significant differences from previous empirical studies of landowners: first, geographic location within the fringe was found to be less meaningful to predicting owners’ identities and behaviors, and there were few owners who appeared to fit the description of land “speculators,” I discuss possible reasons for these discrepancies between previous work and the current research in the paper. Despite the regional similarities in ownership patterns, however, regional differences do emerge in the data. To understand these, I then present an original framework of owners’ interests in their fringe land (with interests defined as the benefits owners receive from possessing land, including economic return on land, use of land for specific activities, and emotional fulfillment from enjoyment of the property, specific uses, or ownership itself). Applying this framework to the survey data, I argue that owners’ interest profiles vary by region and account for differences in behaviors and owners’ stated motivations for their behaviors. In particular, I provide evidence for the relative strength of exchange interests in Portland and Sacramento, legacy interests in Charlotte, and use interests in Austin. The findings imply that different policy approaches may be needed by location, depending on regional interests and the interests of specific groups of owners (such as farmers), in order to motivate owners to participate in conservation programs or other voluntary programs aimed at managing growth or environmental protection. I conclude with a discussion of potential avenues for future research.
About the Author Many people provided their support to make possible the landowner research described in this paper. I am grateful to Roz Greenstein for her insights and advice on this document, as well as the guidance she’s provided me over the years. I appreciate Greg Ingram’s helpful comments on this paper. For his leadership on the project as a whole, I thank Jim Brown, and for their advice on earlier stages of the landowner research and my own closely-related doctoral work, I also thank Eric Belsky, Harvey Jacobs, Eran Ben Joseph, Gerritt Knapp, and Martin Rein. I greatly appreciate Justin Huxol’s valuable contributions to the research and thank him for the maps used in this paper. Eric Feldman provided thoughtful research assistance, and Chase Harrison at the University of Connecticut supplied welcome advice on the sampling design. I also thank the staff at the Lincoln Institute for all of their generous help. Finally, much appreciation is due to the landowners who gave their time to participate in this project, and to the many individuals who provided detailed information on each region and who assisted us so patiently with the technology needed to draw our survey sample.
Table of Contents
Introduction 1 The Fringe and its Landowners as a Subject of Inquiry 2 Owners’ Characteristics, Behaviors, and Roles in the Development Process 4 Owners’ Interests and Decisions 5 The Need for New Research 7 Study Methodology 8 Region Selection 8 Sampling Methodology 10 Survey Instrument and Implementations 11 Data Analysis 12 Study Findings 13 Part I: Overall and Regional Findings on Owner Characteristics And Behaviors 14 Owner Characteristics 14 Parcel Sizes and Owners’ Uses of Land 17 Land Acquisition 19 Land Sales and Transfers 20 Income From Land 21 Conservation 21 Current Interest in Selling 22 Future Plans for Property and Decision Criteria 22 General Participation in Land Markets 23 Owners Perceptions of Growth 24 Geographic Location on the Fringe 26 Findings Part II: Landowners’ Motivations 28 A Framework for Ezxploring Owners’ Interests in Land 29 Operationalizing the Interest Framework 30
Interests by Region 31 Portland and Sacramento: Exchange Interests 32
Charlotte: Legacy Interests 34 Austin: Recreation and Amenity Interests 37 Discussion 38 Tables 41 Figures 58 Charts 62 References 63
1
Landowners on the Metropolitan Fringe: Results from a Survey of Owners in Four US Metropolitan Areas
Introduction
The owners of undeveloped land on the metropolitan fringe are important but understudied actors in the process of urbanization. Much fringe land is, by definition, under significant development pressure now or is likely to face such pressure within the next decade. Its owners, therefore, control the sites on which future metropolitan expansion will occur, and their decisions about their properties, particularly those related to land use, subdivision, development, sale, or transfer to family members, influence future patterns of urbanization. Yet our knowledge of these owners’ identities and behaviors is limited: although the owners of fringe land were the focus of a modest body of empirical work, mostly in the 1980s, relatively little recent research has examined owners’ current characteristics and activities, or the roles they are playing in today’s processes of metropolitan development. Furthermore, owners’ interests in landownership – the benefits they derive from possessing land – and the relationship of these interests to land decisions have been under-explored. To begin to address these gaps, the Lincoln Institute of Land Policy conducted a study of landowners between 2002 and 2003, surveying by telephone over 2,000 owners of open, undeveloped fringe land in four US metropolitan regions: Austin, Texas; Charlotte, North Carolina; Portland, Oregon; and Sacramento, California. The project examined owners’ identities; their behaviors, including when and how owners acquired their property, how they currently use their land, and their intentions going forward; and the interests they have in their land. This paper presents results from the survey, highlighting two areas of findings in particular. In Part I of the findings, the paper revisits owners’ identities and behaviors, informing our understanding of present landownership patterns (including who owns land, how that land is used, and how and when that land changes hands and becomes developed). The current research finds commonalities among owners of fringe land and ownership patterns in all regions, and compares the profile of owners that emerges from the study to those presented in previous research. Despite overarching similarities among owners and ownership patterns in all regions, however, regional variations do emerge in the survey data. In Part II of the findings, I explore this regional variation by focusing on differences in landowners’ interests in their land. Using an original framework of interests in fringe land, I discuss how, relative to one another, each region differs somewhat in why owners possess land and in the benefits they seek from landownership. The paper ends with a discussion of the research and policy implications of these findings. Before turning to the findings, I first summarize relevant research on landowners and present the methodology and case studies used in the Lincoln Institute’s landowner survey.
2
The Fringe and its Landowners as a Subject of Inquiry
In general, most authors use “fringe” to refer to the dynamic area between built-up suburb and open countryside where metropolitan growth is occurring or is expected to occur in the near future. A basic attribute of the fringe is its changing nature: urban influences and land uses push out from the metropolitan core through the fringe in what has been described as a wave-like pattern (Blumenfeld, 1954; Hart, 1991), and the fringe itself pushes deeper into the countryside. Examining a specific point in the fringe, some see the transformation from predominately agriculture to predominately urban use as taking twenty to thirty years to complete (Audirac, 1999; Brown et al., 1981), though Theobold (2001) notes that the rate, extent, and pattern of land use changes on the fringe are difficult to measure. Previous research has offered a host of criteria for identifying the fringe, using such factors as population density or distance from an urban center1, and authors have often applied specific terms such as “urban fringe,” “rural-urban fringe,” or “rurban fringe” to their particular definitions.2 In this paper, I define the metropolitan fringe as the physically expansive, dynamic area beginning at the current suburban edge, where pressure to convert land is intense, and extending to the outermost point where significant urban developments is likely to occur within the next ten to fifteen years. The fringe may appear to be primarily rural in character, with some spotty low-density residential or commercial development and the occasional subdivision, but more substantial urban development is probable within a decade or two, and with it, a mostly suburban rather than rural character is likely to emerge.3 At any given point in time, the fringe is characterized by a mix of land uses, including low-density residential development and subdivisions; agricultural uses such as farms,
1 While some describe the fringe as lying “within 40 to 50 miles” of urban areas (Lapping & Furuseth, 1999), its proximity to an urban area is more accurately predicted by the size of the city with which it is associated; according to Daniels (1999), the fringe lies 10 to 50 miles from a major urban center of 500,000 or more people, or five to 30 from a smaller city of at least 50,000 people. Not surprisingly, as an area in gradual transition from rural to urban, population densities in the fringe are between those expected in urbanized and truly rural areas, with Daniels defining fringe densities as less than 500 people per square mile (Daniels, 1999). In addition, conceptions of the size of the fringe differ in previous research, from that of a narrow band to a more expansive area over which metropolitan development is moving (Hawley, 1946, in a response to Firey, 1946, p. 421). As a result of this multitude of terms, Thomas noted a “confusion in terminology” that “is compounded by the span in time over which the studies were undertaken, the great range in size of the urban centers under investigation, the variations in the degree of control exercised over the fringe area, and the differing aims and contexts of the several pieces of research” (Thomas, 1990, p. 134). 2 See Firey, 1946 (“rurban fringe”), Pryor, 1968 (“rural-urban fringe”), Furuseth and Lapping, 1999 (“rural-urban fringe”; the authors also then define a distinct “urban fringe” and a “rural fringe”). In some cases, “exurbia” is used synonymously with fringe, though in other cases it refers to a subarea of the fringe (Patel, 1980; Morrill, 1992; Pond & Yeates, 1993, 1994a; Davis et al., 19942). 3 As I explain in the methodology section, these expectations about the timing and patterns of future development are necessarily subjective, but in operationalizing them in this study, I base them on the opinions and perceptions of numerous local experts closely familiar with the pace and pattern of growth in specific regions and sub-regions.
3
ranches, greenhouses and nurseries, and forestry enterprises; rural industries such as mineral extraction operations or commercial uses that support agriculture; urban industries requiring large spaces not available within cities; recreation such as camps and golf courses; institutions such as hospitals or schools; newer pockets of urban retail and office development that serve fringe residences; energy, transportation, and communications infrastructure (e.g. radio towers) (Pond & Yeates, 1993). Scattered villages, towns, and even small cities (e.g. the county seat of a county lying in the metropolitan fringe) dot the fringe. Numerous authors have described specific bands within the fringe representing different mixes and intensities of land uses and progressive stages of development and urban influences (Pryor, 1968; Bryant et al., 1982; Hart, 1991; Lapping & Furuseth 1999). At a basic level, most descriptions of the fringe show new residential development occurring closest to the urban core, active speculation in land occurring further out, and rural uses such as farming occurring deeper into the fringe (e.g., as in Brown et al., 1981), where there are fewer urban influences. However, in practice, development may not occur evenly in all directions throughout the fringe, and may also press in from other metro regions, complicating the classic model of a monocentric metropolis (Audirac, 1999), and of fringe development itself. As the interface of rural and urban land uses, and as the site of current and future growth, the fringe is perhaps where we can best understand processes of land conversion and development. It follows that fringe landowners are also an important focus of study. Long before land conversion occurs, a host of actors and forces influence the fringe’s social, economic, environmental, and aesthetic future, including developers and policymakers, but also the current owners of fringe land, a heterogeneous group including longtime residents and newcomers; for-profit and hobby farmers and ranchers; exurban dwellers; second-home owners; natural resource users; investors and speculators; and developers and builders (Brown et al., 1981; Bryant et al., 1982; Daniels 1999; Pond & Yeates, 1994a; Pryor, 1968). These landowners currently control the sites of future development, and through their land uses and decisions have a good deal of influence over the conversion of land on the fringe to urban uses: they may supply land to the development process when they sell their property; ready land for development by making site improvements, obtaining needed permits, and subdividing; develop land themselves; or deliberately hold land out of development as the surrounding area urbanizes, perhaps placing conservation easements on the land that are enforceable after the owner’s tenure is over. (Owners may also pass land to children through gift or inheritance, so that these options become available to a new generation of owners.) Owners are particularly influential in determining the timing at which specific land parcels are sold into the development process, directly influencing the uncoordinated, patchy, piecemeal shape of development that characterizes growth in the metropolitan fringe (e.g. Clawson 1962; Sargent 1976; Lee 1979; Brown et al. 1981; Pyle 1985, 1986, 1989): it is well documented that development in the metropolitan fringe occurs in a piecemeal fashion, with some land parcels converting early from rural to urban uses, and others remaining in rural uses even when completely surrounded by subdivisions or commercial development. As Strong noted in 1969: “Urban growth patterns are, in part, a by-product of the sales decisions of owners of urban fringe land” (Strong, 1969, p. 1), and as Baerwald stated: “Given the many individuals making decisions in their own ways about
4
many parcels at various stages of development in the metropolis, it is understandable how the metropolis grows through seemingly random eruptions rather than by contiguous accretion at its margins” (Baerwald 1981, p. 344). Additionally, because the fringe’s natural features and existing communities are all affected by urbanization, it is also a place in which to observe conflicts over land uses, growth, scarce natural resources, and even the evolving character of communities (Bryant et al., 1982; Dubbink, 1984; Lapping & Furuseth, 1999; Spain, 1993). Beyond understanding landowners’ roles in the mechanisms of development, a deeper understanding of the policy controversies over development also requires research into landowners, including their political participation but also into their interests in and attitudes toward their land and communities. Yet fringe owners are understudied, partly because the entire fringe has not received its due attention.4 As a result, we lack satisfying explanations for the ways in which the fringe develops on a parcel-by-parcel basis that would inform our understanding of the low-density “sprawling” development patterns characterizing much current growth in the fringe; we particularly lack information on landowners’ roles as suppliers of land to the processes of urbanization, especially in comparison with the roles of better-studied actors like developers and new homebuyers. I now turn to findings from previous research, summarizing what we do know about owners, their roles in the development process, and their interests in their land. Owners’ Characteristics, Behaviors, and Roles in the Development Process Previous research has identified different types of fringe landowners, categorizing them by their specific roles as buyers and sellers of land in the development process.5 This research has noted that land typically passes through the hands of different owner types as it is urbanized. Several authors relate how farmers and other rural users, who own land to use it for immediate production, sell to speculators; speculators, who seek profit and hold the still-rural land for a shorter period, sell to developers; and finally developers actually convert the land from rural to urban and profit from its sale to the end-users of new suburban housing (Brown et al. 1981, Clawson 1971, Sargent 1976, Pond and
4 Some have attributed the relative lack of attention to the fringe to divisions within the academic community: as Audirac (1999) notes, drawing from Hart, “[The fringe] is too urban to attract traditional rural researchers and too rural to incite urban scholarly inquiry (Hart 1991)” (p. 7); the same divide may exist within the realm of planning (Evans and Mabbitt, 1997). Audirac also suggests that the fringe has received less than its share of attention as a result of “simplistic notions of sprawl that reify and obscure, rather than illuminate, the complexity of economic and sociospatial forces shaping the edge” (p. 7). Indeed, “sprawl,” the consequences of which drive much of the practical and academic interest in the fringe, is itself an underdeveloped concept (Galster et al., 2001) that fails to capture the dynamics at work on the fringe, dynamics that are often not visible until physical land conversion actually begins (Brown et al., 1981). Theobold (2001) also notes the difficulty of measuring land use change on the fringe, leading to the underestimation or undervaluing of land-use dynamics at the rural-urban interface (Theobold, 1991). 5 This research falls within a larger body of “behavioral” research, which looks at a range of decision agents in the development process (Healey, 1991; Leung, 1987.
5
Yeates 1994a).6 Spatially, one expects to find the developer operating in closest proximity to the urbanized area, at the urban-rural edge, with the speculator in the next ring, and the farmer or other rural users in the least developed, farthest reaches of the fringe or beyond, although in reality this order in space and time is not as neat (Brown et al., 1981).7 Authors of previous research drew policy implications from these insights, finding that the characteristics of landowners, their land, and the factors influencing their property decisions sometimes differed from policymakers’ expectations, resulting in policies that unintentionally provided incentives to the “wrong” owners. For example, Brown et al. (1981) found that urban/rural fringe land often changes ownership at least twice over a period of 15 or so years before physical land conversion occurs, as farmers sell to speculators, and as these parties sell to developers. Though the physical land itself may have changed little, underlying ownership had, and policies intended to provide farmers with preferential tax treatment as an incentive to preserve rural character and protect prime farmland were actually benefiting speculators, who had already purchased land from farmers. Research also found that some public policies were ineffective or had unintended results because they were crafted without a clear understanding of how landowners would respond to them, as when subdivision controls were preventing owners strapped for cash from selling off small pieces of their land, and instead forcing owners to sell large parcels or their entire properties, perhaps hastening the transfer of land to owners interested specifically in development in some areas of the fringe. Owners’ Interests and Decisions In categorizing owners by their roles in the development process, the research cited above touches on why owners possess land. Typically authors have ascribed to owners a single motive for owning land: farmers own to earn income on their land from agricultural activities, investors to earn a return from appreciating land values, and developers to profit in the short-term; or, in different conceptualizations, some owners posses land either to use it for traditional rural or suburban/urban uses (Coughlin, 1985), or to derive immediate economic benefit or to hold for anticipated future benefits (Lindeman, 1976). A few have suggested that owners may have multiple reasons for owning land, simultaneously at any given point in time, and over the course of their land tenures (e.g. Baerwald, 1981; Healey and Short, 1981); I explored owners’ multiple interests in their land in depth in my dissertation (Hrabchak, 2005).
6 In much of the literature on the development of the fringe, “landowner” primarily refers to those owners who use their undeveloped land for rural purposes, with subsequent owners identified separately as “speculators” or investors, developers, and homebuyers, although some authors (e.g. Brown et al., 1981) use landowner more broadly to refer to all types. Additionally, the purchasers of new homes constructed on the fringe are a fourth owner group, but one that comes after land has been developed, and so they too are often separated from pre-development owners. 7 Other authors develop similar categories of owners, also with the expectation that land will pass between different types of owners until it is developed (e.g. Baerwald, 1981; Bryant et al., 1982; and Pond and Yeates, 1994).
6
More research has been conducted on owners’ land decisions. One area has explored owners’ economic attachments to land and their optimal time to sell into land markets (Batabyal, 2000; Brown et al., 1981; Healey & Short, 1981; Kaiser & Weiss, 1970; Lee, 1979; Pyle, 1985; Rodriquez-Bachiller, 1986; Sargent, 1972).8 Various authors have tried to predict land sales using indicators such as acreage, date of acquisition, age, family ties to land, owners’ occupations, motivations for purchasing land, legal form of ownership, whether the owner resides on the land or is absentee, and owners’ perceptions of area development pressures are all important to owners’ decisions (Adams & May, 1991; Bancroft et al., 1977; Brown et al., 1981; Goodchild and Munton, 1985; Kaiser et al., 1968; Pyle, 1986, 1989). While much research has focused on financial factors, some have also considered non-financial motives for land use decisions (including the decision to hold land out of development (Pyle, 1986)), such as owners’ “relative satisfaction from such qualitative aspects as farming as a way of life, the land as a residence, love of the land, or privacy and status” (Kaiser and Weiss, 1970), personal emotional attachments to land, enjoyment of local amenities, and other personal and lifecyle factors such as health, retirement, divorce, death or the desire to give land to children (Brown & Roberts, 1978; Brown et al., 1981; Goodchild & Munton, 1985; Healey & Short, 1981; Pyle, 1985; Pyle, 1989).9 Finally, research has explored the relationship between public policies and owners’ land decisions. Kaiser and Weiss (1970) examined how tax policies influence owners’ financial calculations by altering both owners’ future income and expenses and the market value of their land (Kaiser & Weiss, 1970). Recent empirical work has focused on the characteristics and motivations predicting participation in voluntary conservation and environmental protection programs. For example, Gan et al. (2005) considered race and participation in conservation incentive programs in Alabama; Langpap (2004) examined land and demographic factors, finding woodland acreage, date of land acquisition, interest in conservation, and age important factors in participation in incentive programs for endangered species in Oregon and Washington; Lynch and Lovell (2003) considered such factors as parcel size, agricultural use, family interest in farming, income from rural land uses, and geographic location on the fringe in owners’ participation in farmland preservation programs in Maryland; and Rilla and Sokolow (2000) examined owners’ desires to preserve land for farming or open space, financial motivations, stewardship values, attachment to land, and family connections to land in relation to participation in conservation easement programs in California.10 8 A great deal of research is focused on developer behavior (see Leung, 1987 for a review of early work on developer behavior, as well as Arnott and Lewis, 1979; and Batabyal, 2000), but in this paper the focus is on all types of landowners. 9 Several authors concerned with theories of the land market have argued that mainstream economics must explore the role of individual landowners’ utility and preferences in models of land supply for development (Evans, 1983; Evans, 1986; Neutze, 1987; Wiltshaw, 1985; Wiltshaw, 1988; this debate is also reviewed in Adams and May, 1991). 10 See also earlier work by Conrad and LeBlanc (1979) on participation in development rights transfer programs and Hansen and Schwartz (1975) on participation in preferential property tax programs. Additionally, another area of work, primarily from the 1980s, has examined landownership data and its usefulness to planners and others seeking to monitor growth and track trends in land development; in particular see large-scale empirical studies of ownership conducted U.S. farmland (Lewis, 1980) and of the Appalachian region (The Appalachian Land Ownership Task Force, 1983), and writings by Frank Popper
7
The Need for New Research Previous research tells us that landowners on the metropolitan fringe are influential in shaping patterns of growth, that they are heterogeneous and likely to have different purposes in owning and different time horizons for selling land, and that their decisions are based on economic calculations as well as personal and family circumstances and attachments. This literature has added considerably to our understanding of processes and patterns of metropolitan development, particularly providing insight into why land conversion occurs in a patchy manner rather than the theoretical smooth wave. However, relatively little comprehensive empirical research on owners’ identities, behaviors, plans, and interests has been conducted in the last 20 years, and yet the dynamics of metropolitan growth have changed. Today, businesses increasingly locate outside of cities, creating edge cities that expand the commuting range farther into the fringe. Indeed, increasing numbers of Americans are making their homes at the suburb/fringe edge as well as on scattered, large lots deeper into the fringe, and the fringe as a whole is now growing more rapidly than either urban or suburban areas (Daniels, 1999; Nelson, 199211). Heimlich and Anderson (2001) report that the edges of metropolitan areas, those counties adjacent to metropolitan areas, are growing at the highest rates, higher than the core metropolitan area itself. As a recent study has discussed, even in metropolitan regions that are losing population overall, low-density growth is increasingly occurring in the fringe, although development densities differ by region (Fulton et al., 2001). In addition, land trusts and policies to protect open space and farmland have expanded greatly, giving landowners voluntary options they may not have had twenty years ago. Recent research noted above (Gan et al., 2005; Langpap, 2004; Lynch and Lovell, 2003; Rilla and Sokolow, 2000) have explicitly examined owners’ participation in specific programs; additional and larger studies that examine both owners and their land could further inform our understanding of owners’ motivations and incentives for participation in voluntary programs, providing insight to program design and implementation efforts (Lynch and Lovell, 2003). Planning practices have changed too, as have our awareness of them: like most of the public, landowners certainly have a heightened awareness of growth and sprawl and local and regional attempts to manage it. The current landowner study was developed to add to our understanding of owners and their decision processes regarding their land under these new conditions.
and others arguing for research on owners’ motivations, changes in ownership patterns, the increasing diversity of interests within rural populations, the role of large owners and concentrated ownership, absentee and foreign ownership, and the extent of urban owners’ influence in rural areas (Popper, 1976, 1978, 1981; see also Barrett & Healey, 1985; Brown et al., 1981; Bunce, 1985; Goodchild & Munton, 1985; Healey & Short, 1979; Ilbery, 1985; Jacobs & Moyer, 1986). Also, several researchers, primarily from the field of geography, have considered landownership patterns (and changes in them) as a useful lens for tracking and understanding land use changes: see Bryant et al., 1982; Pond and Yeates, 1994a; Pond and Yeates, 1994b. 11 Nelson uses the term “exurbia” and is particularly concerned with counties contiguous to, but not within, metropolitan areas.
8
Furthermore, as I explained above, owners’ interests in their land, and how these influence their land decisions, has been explored only to a limited extent, and so the Lincoln landowner study also gathered data on owners’ reasons for owning land and the benefits they feel they derive from ownership. In my dissertation (Hrabchak, 2005), I presented a theory of owners’ interests in their land, in which I drew from the literature cited above as well as urban politics literature on interests (Molotch, 1976; Davis, 1991; Logan and Molotch, 1987) to devise a framework by which we might analyze owners’ interests. I apply that framework in this paper to the landowner study, in order to explore owners’ interests at the regional level.
Study Methodology
Between 2002 and 2003, the Lincoln Institute of Land Policy, with its partner, the Joint Center for Housing Studies of Harvard University, utilized telephone interviews to gather information from 2,023 owners of open, undeveloped fringe land in Sacramento, California; Charlotte, North Carolina; Portland, Oregon; and Austin, Texas. The interviews queried owners about their identities, behaviors regarding their land, intentions for their property, and their interests in their land, all with the intention of advancing our understanding of landownership patterns in the fringe. Developing and implementing the survey involved several steps: selecting regions for study, defining the fringe and delineating specific study areas within each region, identifying landowners for the sample pool, developing the survey instrument, and contacting owners and conducting the survey. These steps are described in more detail below.
Region Selection We selected the four regions included in the landowner project based on a number of criteria. The regions provided geographic diversity but were similarly sized, with Metropolitan Statistical Area (MSA) populations in 2000 of between one and two million people, and all saw rapid population growth between 1990 and 2000 (see Table 1). This growth resulted from quality of life factors, such as desirable climates, cultural amenities, and opportunities for recreation and enjoyment of natural resources, as well as the growth of specific industries in each region (the high tech industry in Austin and Portland, information and telecom services in Sacramento, and financial services in Charlotte, as well as state government in Austin, Charlotte, and Sacramento, and employment and amenities offered by academia and health care facilities). See Table 1 In all cases, this population growth has affected the fringe, bringing new subdivisions for commuters; new communities of second homes catering to those seeking recreation; new commercial development to serve the growing population; and new infrastructure, including transportation, water, and sewer services. While much of this development is
9
occurring at the suburban/fringe edge, some of it is deeper into the fringe, such as recreation-oriented developments and low-density hobby farms and “ranchettes.” Because of these changes to the fringe, it was possible, in the regions selected for inclusion in the study, to find landowners who were experiencing the effects of significant urbanization in their areas, including rising property values, new residential construction, and a growing population, and with these changes, new options for their land. At the same time, the metropolitan areas of the regions selected were all extensive and did not overlap significantly with other urban areas, making it possible to find owners of still-rural land not yet under intense development pressures, even within the MSA boundaries. This variation in development pressures and, as an extension, landowners’ experiences, provided the opportunity to compare owners’ characteristics and behaviors in higher demand areas with those in areas that remained rural in character and in land values, both within each region and across the regions. Furthermore, it was possible to find viable commercial agricultural uses in all regions’ fringes, from pick-your-own fruit and vegetable farms to large-scale farming operations, thus allowing us to capture a range of owner types, from commuters to farmers. In terms of policy approaches to development and land uses, our four cases covered a large range. The Portland fringe is governed by the most extensive growth regulations of all of the regions included in the landowner study. The state of Oregon holds cities and counties responsible for adopting local comprehensive plans and the regulations to support them, and these plans are reviewed by the state for compliance with state standards and planning goals. Each Oregon city has its own urban growth boundary (UGB), outside of which land is slated to remain in low density residential or farming or forestry uses without urban services. Metro, the first US elected metropolitan council, plays a large role in setting the UGB for the Portland area and periodically amending it, though the fringe of the Portland region included in our study includes land governed by smaller cities outside of Metro’s UGB that have their own boundaries. In the Sacramento region, cities and counties are required by the state to prepare comprehensive long-term plans as well as specific plans for smaller geographic areas. A variety of entities also regulate land use and development, including Local Agency Formation Commissions (LAFCOs), which seek to preserve agricultural lands and discourage urban sprawl through their regulation of local activities. In the region, farmland protection is accomplished through a variety of tools, and the state’s Williamson Act also plays an important role in the protection of agricultural land, wildlife habitat, and open space. In the Charlotte region (which includes counties in both North and South Carolina), cities and counties engage in comprehensive planning supported by zoning, subdivision, watershed and flood control ordinances, but without the same strong requirements for consistency with statewide goals that marks Oregon’s approach. Finally, in Austin, there appeared to be relatively little comprehensive planning in fringe counties – in fact, the counties are not even granted zoning power – though many of the towns and cities in our fringe study areas are engaged in their own efforts to plan for and manage growth.
10
It bears noting that, in all regions, there is great variation within each fringe area in the nature and intensity of growth pressures and actual development, and in policy approaches, depending on the particular county and locality within the fringe. Additionally, other factors shape land use beyond state and local regulations and planning efforts, from water and topographical constraints to the presence of endangered species or their habitat (which, for example, has led to the application of the Endangered Species Act and its particular requirements for and limits to development in areas of the Austin fringe). Our methodology, described next, attempted to capture and account for some of this variation within regions. The last criterion used to select the study regions was the availability of public tax records, in an accessible electronic format, which we used to identify landowners (according to methods described below). The counties selected for study in the Austin, Charlotte, Portland, and Sacramento regions had such data available and many individuals in those counties graciously facilitated our use of it. Sampling Methodology Identifying the study areas within each region involved several steps: defining the general contours of the fringe in each region; selecting three specific corridors within each region that would be the subject of the research; stratifying each of those three corridors into areas facing intense, moderate, and weak development pressures to ensure that we captured landowner experiences in areas at different states of urbanization. To do so, we relied on plans, reports, and data on local and regional development and public efforts to manage and direct growth; press clippings on growth issues; publicly available data on building permits, land uses, and agriculture; and maps and aerial images. More importantly, we conducted numerous interviews with experts in regional and local development, who provided their opinions about the current state of development and the likely pace and pattern of growth in the short and long term. Our experts included staff and officials in state, county, and local offices dedicated to planning, infrastructure, agriculture, environment, and water resources; academics in areas universities; developers, realtors, assessors, and homebuilding associations; and farming and conservation advocates. We selected three corridors in each region (with the exception of Sacramento, where data constraints allowed only two) that capture a good deal of the diversity of each region’s fringe and landowners’ experiences within it. The spines of the corridors generally followed major transportation routes through the fringe, most often state and US highways, as well as some well-traveled county roads, since previous literature has underscored the importance of transportation access in influencing fringe development (Bryant et al., 1982; LaGro and DeGloria, 1992; Lee, 1979; Pyle, 1985; Sargent, 1972; Whitehand, 1987). With the help of local experts, we then subdivided each of the corridors into three sub-zones that captured variation in development pressure (following Brown et al. 1981 and Pyle 1985). In areas facing “intense” pressure, significant development is occurring now or is expected within five years; in areas facing “moderate” development pressure, significant urbanization is expected in the next five to
11
10 years; and in areas facing “weak” development pressure, significant urbanization is not expected for 10 or more years. 12 In general, intense areas are closer to metropolitan areas, moderate areas lie just beyond the intense, and weak areas are furthest from the metro areas, though more intense and moderate nodes can be found farther out in all regions, particularly close to highways and surrounding the cities and towns of the fringe. See Figures 1-4 Once the study areas were identified and stratified, we used publicly available property assessment data in electronic form to construct populations of landowners within each area. We omitted public landowners at all levels of government, as well as owners of parcels under five acres, in order to focus on larger parcels with greater impact on urbanization patterns (Massie 1968, Strong 1969), and because these smaller parcels were more likely to be located in towns and cities and therefore already developed.13 In addition, owners of multiple parcels who appeared multiple times in the sample were removed according to a schedule of priorities designed to fill out the strata in each region, so that only one entry remained and each owner’s probability of selection was equal. The Lincoln Institute retained the University of Connecticut’s Center for Survey Research and Analysis to implement the survey. After removing duplicates from the population described above and matching telephone numbers, between one quarter and 60% of the landowners remained, depending on region, and over 16,600 landowners formed the sample pool from which 2,021 interviews were actually conducted.
Survey Instrument and Implementation To introduce the survey, a letter was sent to landowners explaining the project and asking for the owners’ participation. Trained interviewers using Computer Assisted Telephone Interviewing technology contacted owners via telephone to conduct the survey. Interviewers specifically asked owners about the particular parcel of land identified in the sample, providing its address at key junctures throughout the interview (for the few 12 The survey design followed methods used by Brown et al., 1981 (see also Brown et al. 1980 and Philips et al, 1980), updated to take advantage of electronic mapping and assessment data and modified so that each owner had an equal probability of selection. Brown et al., also used the designations “intense”, “moderate”, and “weak” development pressures; however, they identified “intense” as likely to see significant development pressures within 10 years, rather than five. We found in preliminary interviews with local experts on development and planning that 10 or more years was very difficult for people to describe; people were much more confident in their designations as “intense”, less so for “moderate,” and least for the “weak” pressures. We found that focusing on zero to five, five to 10, and 10-plus years to be most useful for discussions with experts on regional and local growth. 13 Indeed, as a result of these “rules,” much of the land within the towns and small cities of the fringe was automatically omitted, because it was either public, under five acres, or already developed; we also did not capture land outside of fringe towns that was subdivided into plots under five acres but undeveloped. Also note that because of land regulations in Portland and Sacramento, experts identified fewer areas identified as “intense” or “moderate” than they did in Austin and Charlotte. We therefore included some two to five acre parcels in Sacramento’s intense and moderate strata, and some two to five acre parcels in Portland’s intense strata, in order to increase the sample population of landowners in these strata.
12
questions on landownership in general, the interviewers also made clear that the owner should consider any other property owned in the metro area). The survey questionnaire covered owners’ identities, behaviors, plans, and attitudes related to the land owned (the full survey instrument is included in the Appendix). Most questions were closed-ended, though in many cases respondents were given opportunities to provide additional responses if the categories provided were not applicable. The survey included several series of related questions, and the order of these was rotated randomly. Interviews averaged 25 minutes in length. The response rate among the sample with valid phone numbers was 28%; the cooperation rate, which omitted those with health or language barriers, was 39% overall. Interviewers made multiple attempts to reach the respondents and calling hours were staggered to reach people who may have been at home during the day, at night, or weekends. Special efforts were made to reach owners during business hours who, by the appearances of their names, appeared to be corporate or nonprofit entities.14 We tested the questionnaire in a pretest of Austin-area owners in 2001. It was revised and pretested again in Portland in 2002, after which it was implemented in full in all regions. Data Analysis Survey data were analyzed using Stata 7.0, which offers a family of commands specifically for the analysis of survey data that are particularly helpful when the data
14 Rigorous attempts were made to minimize bias in the survey; however, there were a number of areas in sampling worth noting: Telephone match. It is impossible to know if those landowners for whom a telephone number could
be identified varied significantly from those with unlisted numbers. The latter may have guarded their privacy more carefully, but it is not clear that this in turn suggests they differed in their characteristics, interests, or decisions regarding their land.
Multiple owners and relatives. More than one individual often owns a single parcel of land. Different individuals in a family or partners in a partnership may have answered survey questions differently. However, there is no reason to believe that there was any bias either in the type of person who answered the phone (e.g. a younger or older co-owner, or a male or female co-owner) or in who agreed to complete the survey. In addition, of the respondents to our survey, 96% described themselves as the actual owners of the properties identified in the appraisal records, and 4% (74) described themselves as related to or otherwise authorized to speak for the legal owner(s); these individuals were likely relations of legal owners (e.g. spouses or children). It is possible that these owners’ responses to historical questions were less accurate than those of other respondents. We do not report demographic data for these respondents.
Reliability of retrospective questions. One section of the survey inquired about owners’ intentions for their land at the time they acquired it. While historical behavioral questions require special consideration (Sudman and Bradburn 1982), we provided memory cues to aid the respondent, and the majority of questions about land acquisition required only straightforward yes/no responses.
Sampling by owners. By giving each owner in the sample an equal probability of selection (rather than sampling by parcel, giving more weight to larger parcels), it is possible that by chance, private owners of particularly large tracts of land were missed. Our methods, however, were intended to reveal the characteristics and behaviors of the “average” owner rather than the large owner.
13
involves stratification (as described above) and weighting. We used two weights in the analysis. The first accounted for the number of owners in the survey pool in each strata and the number of interviews actually conducted in each, so that the survey would be generalizable to the populations in each study area. Thus, because of unequal size of sample pools, some strata received more weight and others less, and overall, some regions received more weight and others less because of differences in the numbers of owners in each sample area. The second weight was used only for analysis of current land uses. It combined the first weight and a weight based on each parcel’s acreage, so that land use figures represent overall acres captured in the survey.15 Data were analyzed using a variety of different statistical tests (e.g. logit, ANOVA). Because my goal is to provide a sense of the overall character, behaviors, and interests of the owners of fringe land and to report basic differences in key characteristics among regions, and given the large amount of data collected in the survey, I do not, for reasons of parsimony, report the details of all statistical tests used. However, all claims of statistical significance in the text of this paper refer to significance levels at p<.05 or greater.
Study Findings
Below I present selected findings from the Lincoln Institute’s landowner study. Part I discusses owners’ characteristics and behaviors, both overall and by region. Despite different policy approaches, histories, economies, and topographies in each of the four study regions, the findings show that across all regions, owners share a similar profile and exhibit many of the same behaviors. But differences do exist by region, both in who owners are and in what they do. In Part II of the findings, I examine more deeply the meaning of these regional differences. I suggest that the differences are best described and summarized by variation in the interests fringe owners hold in their land, which I define as the reasons that they own their land and the benefits they receive from landownership. I begin below with the overall picture, the characteristics and behaviors that owners have in common across regions. I then probe more closely the regional differences that do exist, and discuss how these are related to differences in owners’ interests and values in land, providing a framework for examining owners’ interests in their land and then exploring the unique interest profile of each region. 15 This second acre weight could also be used if one wished to weight responses by acreage, giving more weight to owners of large parcels than those possessing smaller parcels.
14
Part I: Overall and Regional Findings on Owner Characteristics and Behaviors The survey data regarding owners’ identities and behaviors provide a snapshot of who owns fringe land and how those owners are using their land and participating in land markets in the fringes of Austin, Charlotte, Portland, and Sacramento. Below I describe owner characteristics and behaviors, presenting the overall profile of owners that emerges across all regions. I highlight particularly significant differences among regions as well, though I discuss these in greater detail in Part II of the findings, in the context of owners’ interests in their land. Owner Characteristics The most basic manner of describing landowners is by their legal status. In all regions, the overwhelming majority of owners of fringe land legally possess their property as individuals or as groups of individuals (e.g. as couples or families); smaller numbers of owners hold their land through partnerships or family-held corporations formed primarily to conduct agriculture or for investment. The survey identified very few non-family corporations in any region (of these, most were for-profit corporations, though the survey captured a handful of non-profit owners, largely religious institutions). This finding suggests that, at least in the study regions, decisions about how fringe land is used and if, when, and why it is subdivided, sold, and developed are decentralized among thousands of individual owners. Furthermore, individual and family owners’ motivations and land decision processes are likely more complex than those of corporate owners, which may view land more simply through the lens of investment or an input to production, without emotional connections to land. I discuss these issues in greater detail later in Part II of the findings. See Table 2 The survey inquired about owners’ primary professions16 (defined as the employment where they spent 50% or more of their time in the previous year), focusing primarily on whether or not owners were involved in land-intensive professions such as farming, ranching, land investment, or real estate development. The survey revealed that only a minority was employed in such professions. Relatively few owners, only 5%, were employed in land investment or real estate development as their primary profession (which may or may not have involved land in the fringe areas studied, as the survey did
16 Demographic data is presented only for those respondents who were the actual owner of the property, and not for the 4% of respondents who answered the survey on behalf of the owner (these included representatives of corporations, or in some cases, a landowner’s relative). The responses of this other 4% are included in results for other topics besides demographics. Also, as noted earlier, owners may possess land jointly with others, but we have no reason to believe there was a demographic bias in the group who did respond to the survey.
15
not inquire what specific land these owners invested in or developed). Farmers, ranchers, and foresters comprised a larger group, with significant variation across regions: in the Austin and Charlotte regions, only 8% and 6% respectively described their primary profession as farmer, rancher, or forester, while in contrast, 16% of Portland area owners and 22% of Sacramento area owners described their profession this way. (However, across all regions, 15% of those who are not full-time farmers were involved in agriculture as a part-time for-profit activity). Overall, most landowners were employed not in land intensive work but at other professions (48%) (with a significantly higher rate in Austin than in other regions (58%)), or were retired (36% overall). See Table 3 Landowners averaged 59 years of age at the time of the survey, with no significant differences in mean age among regions. In all regions, older and retired owners tended to own parcels of higher acreage (parcel acreage is significantly negatively correlated with year of birth in all regions and positively correlated with being retired). Retired owners also tended to be longtime owners, acquiring their parcels, on average, before farmers and ranchers, real estate professionals, and those employed in other work, suggesting most are not acquiring their land in their retirement but before it; anecdotal evidence from interviews suggests, however, that retirees may change how they use their land once they are retired. Respondents were slightly more likely to be male: 57% overall. However, in Sacramento the male/female breakdown was even, while Charlotte had a more dramatic split, at 62% male. See Table 4 In all regions, the majority of owners described their race as white. The Sacramento region had more racial diversity; however, the specific nature of that diversity is difficult to identify: though Sacramento had a higher Asian/Pacific Islander owner population than other regions, this group was still a relatively small percentage of the entire population; the larger gap with the other regions was in the number of Sacramento respondents who described their race as “other” or refused to answer questions on race. Owners were more likely to be white than the general populations described by 2000 Census data for each county included in the study. See Table 5 Fringe landowners in the four regions studied also reported more years of education than is reported by the 2000 Census for the general populations in the counties studied. In all regions, educational attainment even exceeded that of persons in the most urbanized county where the central city (Austin, Charlotte, Portland, or Sacramento) is located. Austin area owners have the most years of education: 56% of owners had a college degree or post-graduate education, compared to an average of 39% for all other regions, perhaps due to the region’s concentration of high-tech industry and academia.
16
See Table 6 Since land is an important financial asset to many owners, owners’ income, wealth, and debt were important areas of questioning in the survey. When discussing income, interviewers first asked landowners if their household income was $40,000 or less, or over $40,000. Across all regions, 19% of respondents fell in the lower category and 70% in the higher (excluding the 11% who refused to answer or did not know their incomes). The regions were similar in this breakdown, with the exception of Charlotte, where owners were more likely to report incomes below $40,000. Similarly, at the high end of the income spectrum, Charlotte owners were less represented: 30% of Austin, Portland, and Sacramento owners had incomes of $100,000 or more, while 19% of those in Charlotte reported incomes in this range. Most landowners reported net worths under $1,000,000, though owners in the Portland and Sacramento areas reported significantly greater wealth overall: of those who responded to the wealth question, with 23% and 29% respectively reporting over $1,000,000 net worth in these regions, compared to 13% in both Austin and Charlotte. Much of the net worth in Portland and Sacramento is in the form of landholdings: owners in the Portland area report that 59% of their net worth is in land, and 64% of owners in Sacramento report the same, compared with 46% of Austin owners and 53% of Charlotte owners. At the same time, Charlotte and Austin owners were less likely to have mortgages on their fringe parcel than those in Sacramento and Portland. (It is not surprising that fewer Charlotte owners carry mortgages, given the high rate of inherited land in that region, as I discuss later; however, Austin’s relatively lower rate is more surprising, given that Austin area owners, on average, also purchased land most recently). See Table 7 Who has the highest incomes and the most wealth? By profession, real estate professionals earn the most, followed by other professionals, farmers and ranchers, and retirees in all regions. Wealth has a different pattern: in all regions, farmers and ranchers reported the highest net worths, followed by real estate professionals, retirees, and lastly, other professionals. Not surprisingly, farmers and real estate professionals hold higher percentages of their wealth in land than do retirees or other professionals. Personal debt varied widely by profession and region: for example, in Sacramento, farmers held higher average monthly debts (22%) than others within the region, while in Austin, farmers and ranchers had the lowest debt of all professional categories. As I discuss in greater detail below, not all owners reside on their land full-time; figures range from nearly half of Austin-area owners to nearly three-quarters of those in the Portland region. Of those who do maintain their primary residence on their fringe parcel, the survey gathered some data on the character of their previous residence: most owner-residents reported that it was more urban in nature than their current location, while a lesser but still substantial number reported that it was about the same in terms of level of development in the surrounding area. Those who had moved from more rural locales
17
were in the minority. One might speculate, therefore, that the resident owner population on the fringe is generally more urban than rural in its outlook and attitudes. See Table 8 With this snapshot of owners, I now turn to the land they own, describing the parcel sizes and current uses to which owners put their land. Parcel Sizes and Owners’ Uses of Land Parcel size varied significantly by region. The average acreage of parcels captured in the survey was highest in Austin, at 45 acres (median 14 acres), and lowest in Portland, at 16 acres (median 8 acres). In all regions, parcel size was largest in areas of the fringe with weak development pressures (which were generally farthest from the urban core), though regions differed in the percent change in parcel size from areas facing intense development pressure to areas of weak development pressure (more than doubling in Portland, but just barely rising in Charlotte, where the change was not statistically significant). Note also that the smallest parcel size in Sacramento was in areas with moderate development pressure, though parcel size rose dramatically in the areas with weak development pressures. Overall, larger land parcels were also correlated with earlier dates of acquisition, with inheritance (rather than purchase) of the land, with full-time farmers and ranchers, and with higher percents of land in agricultural use. Parcel size was also positively related to the percent of owners’ net worth in land, as well as with income. See Table 9 Overwhelmingly, landowners reported using their land for agriculture; however, of the total acreage captured in the survey,17 the range in agricultural use varied, from a low of 57% in Charlotte to 81% in both Austin and Sacramento. Note, however, that though overall amounts of land in agricultural use varied, Austin, Charlotte, and Sacramento all had similar percentages of owners with any agricultural use on their property, while Portland had the highest number of owners with some form of agricultural use. Not surprisingly, farmers/ranchers, part-time farmers/ranchers, and those retirees and others who worked in agriculture full-time reported the largest parcels and the most acreage in agricultural use. (Hobby farmers actually had the smallest sized parcels, followed closely by those with those with minimal to no agricultural involvement.) Of those owners with agricultural use on their property, about one-third reported that they lease some or all of their fringe parcel to others for agricultural purposes; thus, even if an owner had no personal involvement in agriculture, he or she may have had such uses on
17 As noted previously, owners responded to questions regarding the specific tax parcel identified in the survey sample. Land use figures were derived using the “land weight” described in the methods section, which weighted responses by acreage as well as accounting for differences in sample size by strata.
18
their property. In terms of acreage leased out to others, lease rates are highest in Austin and Sacramento.18 Another significant portion of fringe land was described as open or idle, from 11% in Sacramento to 30% in Charlotte, and a much smaller percent is in residential use (5% in all regions but Charlotte, where 11% was in residential use). In all regions, only a minimal amount, 3% or less, was in commercial use, though this number is underestimated for the fringe, since the survey was not intended to focus on already-developed land and therefore omitted small parcels (either under two or five acres, depending on region), most of which were located in the developed towns and cities of the fringe where commercial uses are likely to be found. As noted above, not all owners maintained their primary residence on their land, with some regional differences: Portland-area owners had the highest rate of residence, and Austin-area owners the lowest. However, across all regions, 18% of those who reported that their primary residence was elsewhere still had residential use on their fringe parcel, likely a vacation home or cabin, or potentially a rental home or homes, with no significant differences in this percentage by region. Of those owners who did not reside on their land, anecdotal evidence and questions about distance to their primary residence suggested that owners lived on other land they possessed in the fringe, in the urbanized area of their region, or even outside of the region (owners averaged 76 miles, or a median of 20 miles, from primary residence to their parcel), Many non-residents used their fringe parcel for recreation, agriculture (farmed or ranched themselves or leased to others), or some combination of these. There were no overall significant differences by profession among those who live on their land versus those who did not, with the exception of owners in the Sacramento region, where those in “other” professions were more likely to reside on their property. In all regions, those who live on their land tend to be slightly younger than those who do not. There are no consistent differences across regions in residence by location on the fringe (e.g. in Austin, fewer owners live on their property in the more weakly developing portions of the fringe, but this is not true of other regions). An average of 32% reported their land was used by for recreation (a use which can occur concurrently with other uses), though recreational use varied significantly by region, being more popular in the Austin and Charlotte fringe than in the Portland and Sacramento fringe. See Table 10
18 The survey captured 210 owners with agriculture on their land but who reported minimal to no involvement in agriculture and who did not lease their land to others. The meaning of this finding is unclear, but might indicate that others in the household besides the owner responding to the survey dealt with agriculture.
19
Land Acquisition Survey respondents were asked a series of questions about when, how, and for what intended purpose(s) they acquired the fringe parcel identified in the survey sample. The median date of land acquisition ranged from the mid-1980s (in Portland and Sacramento) to 1990 in Austin. There were a good number of long-time owners participating in the survey: one-quarter of all owners surveyed acquired their land before 1975 and at the time of the survey had owned it for nearly 30 years. However, another one-quarter of all owners had acquired their land in the seven to eight years preceding the survey; in Austin, one-quarter had acquired in the five years preceding the survey. Thus in all regions we found a mix of long-time owners and more recent owners. See Table 11 See Chart 1 Across all regions, most landowners (73%) acquired their land by buying it. Most often, these owners first identified their parcel through a family member, friend, or neighbor (35%), through a broker or real estate agent (27%), by a sign on the property itself or via an advertisement (22%), or through self-initiated contact with the then-owner of the property (11%). Comparing regions, Austin and Portland owners were more likely to identify land via an advertisement, while Charlotte owners were more likely to use informal methods, locating land through family, friends, neighbors, or self-initiated contact, than to use an advertisement or broker. Owners who bought their properties used a number of criteria to select their specific parcel of land. Overall, besides the suitability of the parcel for uses owners had in mind (e.g. agriculture or residence) and its price, the most important factor to owners was area amenities, which might include scenery, open space, or schools: features that contribute to quality of life. Proximity to sewer or water hookups (which would likely be important to those considering developing their property), property taxes, and even commute were, overall, less important to purchase decisions. Regionally, Sacramento stood apart on several of these factors, with owners placing significantly higher value on the suitability of land for agriculture, price, and on commute distance than owners in other regions, and a lower value on area amenities. While the majority of owners surveyed reported purchasing their land, another 26% inherited their parcel, received it as a gift, or acquired it through some combination of inheritance, gift, and purchase (e.g. the owner inherited a portion and then purchased another portion of the parcel). Inheritance rates were significantly higher among Charlotte owners: over 40% acquired their land (or a portion of it) through inheritance or gift. Inheritance of land was correlated with parcel size, so inheritors tended to have larger parcels, nearly twice the size of non-inheritors (the mean parcel size for inheritors was 42 acres, versus 25 for purchasers); disparities in parcel size between inheritors and buyers were significant in all regions.
20
See Table 12 When asked about their intentions at the time of acquiring their land (whatever the method of land acquisition), overall, owners primarily intended agricultural, open, residential, and recreational uses, and these matched fairly closely the current uses owners reported. Interestingly, however, 19% of owners reported that they intended some form of commercial use on their property, though only 6% of owners reported any such uses at the time of the survey. (Current land uses, provided earlier, are again provided for comparison purposes in the table below.) Interviewers also queried owners regarding the plans they may have had at the time of land acquisition to aggregate, subdivide, and develop their property. Roughly similar numbers reported interest in aggregating to create larger parcels as were interested in subdividing their properties, though in Sacramento, owners more clearly reported plans to subdivide. Roughly a quarter reported that, at the time of acquisition, they intended some form of development on their land at a future date, though it is unclear whether the intended improvements were solely for the family’s benefit (e.g. a new homestead) or constituted more significant development (e.g. a subdivision). In all cases, the majority of owners planned to hold onto their property for ten or more years, with only a small percentage (3%) reporting that they acquired their land with the intention of disposing of it within five years. See Table 13 Land Sales and Transfers Interviewers asked landowners if they had ever sold or given away a portion of the specific parcel that was the focus of the survey. A number had done so, ranging from 9% of Austin area owners to 18% of Charlotte area owners, and many reported having done so multiple times. Owners of larger parcels were more likely to have sold or transferred pieces of their properties (and not surprisingly those who had owned longer were more likely to have sold or transferred land), though location on the fringe was not a significant factor in having sold or transferred land. There were, however, significant regional differences in the timing of sales/transfers, with Sacramento owners reporting an average year of sale or transfer of 1981 and Austin owners reporting an average year of 1992; this may reflect that Austin’s development has been more recent and, indeed, as noted above, property acquisition in general has occurred more recently. Owners who have sold or given land away are directly involved in the parcelization of fringe land, and the survey asked for their main reasons for selling or transferring property. A near equal percentage of owners in all regions (15%) sold because they received a good offer for their property. However, in Austin, a need for money led a significantly higher proportion of owners to sell, 33% compared to 11% overall in the other three regions.
21
In Charlotte, where more owners overall reported having sold or given away part of their land, and where inheritance rates are higher, 44% reported that they sold/transferred land in order to transfer it to family, significantly higher than in other regions. Interestingly, transfers to family were lowest in Portland, but other non-financial issues were more highly reported there than in other regions: Portland owners were significantly more likely to state they sold/transferred land as a result of a lifecycle issue (such as retirement, new job, divorce, etc.) or to assist a neighbor or friend. See Table 14 Income From Land Less than half of all owners surveyed earn income from their land (through any means, including agriculture, rents, fees charged for recreation such as hunting, etc.). There are regional differences in income earned on land. More owners in Portland and Sacramento, about 50%, report earning income on their land, and this income comprised about one-third of their total income. In contrast, owners in Austin and Charlotte were less likely to report earning income, and the income earned comprised a less significant portion of total income. See Table 15 Conservation The survey asked a series of questions about owners’ awareness of and participation in wildlife, agricultural, and other conservation programs. The data gathered, however, were problematic. Despite our careful attempts to ask about voluntary, optional conservation programs, such as conservation easements, it was obvious from some open-ended responses that, in their responses, many landowners grouped regulatory programs with those that were truly voluntary. For example, many in Portland who reported awareness of and participation in “optional” programs actually referred to land use regulations, and some in Texas who reported participation in voluntary programs were actually speaking about federal endangered species regulations. There are some methodological lessons here: it was difficult to craft questions about conservation for a study encompassing multiple regions, since programs varied across regions and within them as well (since county programs varied and nonprofit land conservancies often operated in specific areas only), particularly when the size, features, and suitability of land for conservation programs varied so much from owner to owner. Research on owners’ involvement in conservation programs is likely better pursued through program-specific, state-specific, or region-specific studies.
22
Current Interest in Selling Just under one quarter of all owners reported they were, at the time of the survey, considering selling or giving away their property, with no significant differences among regions. When asked to rate the importance of various factors in their current considerations to sell/transfer land, owners in all regions ranked the receipt of a good offer most highly. Owners gave less importance to other factors, such as a need for money, the desire to transfer land to children, lifecycle issues, and tax advantages. The desire to assist a family or friend, important to 11% of owners in past sales/transfers of portions of their land parcels, was only minimally cited as a “very important” factor in current considerations to sell or transfer. It is interesting that there were few striking differences in these factors by region, even though owners reported regional differences in their reasons for past sales/transfers. Whether or not owners were interested in selling their land, a large number in all regions have been approached with offers from interested buyers. In the year preceding the survey alone, 33% of owners reported fielding at least one offer on their property (with significantly higher rates of interest reported in Charlotte and Sacramento). Nearly the same amount stated that they have received an offer in the past from someone they knew wanted to develop their land. Strikingly, over half of owners in all regions report that they would take into account a prospective buyer’s intentions for their land in making a decision to sell; future research might examine whether and how buyers’ intentions do indeed influence owners’ decisions to sell. See Table 16 Future Plans for Property and Decision Criteria Using a five-year time frame, interviewers asked owners to describe the likelihood of their holding, buying, selling, or transferring their land parcels. Unquestionably, owners’ stated plans are no guarantees that they will behave in certain ways in the future, and they cannot take into account unforeseen circumstances, from lifecycle events to unexpected offers from potential buyers, that may alter owners’ decision processes. Nonetheless, data on owners’ stated plans to reveal some overall trends and a great deal of similarity across regions. Most owners reported that they planned to hold their land in its current use(s) within the next five years. A small percent, 7% overall, stated they were extremely likely to purchase property surrounding their land parcel, adding to land holdings. However, more reported interest in giving land away to family (15%) or selling it (16%). A small number planned to develop and sell their property (4%), while 5% planned to subdivide their land, many for estate planning, but the majority for unspecified reasons. Future plans vary little by region. Sacramento owners were significantly more likely to report plans to sell or subdivide, though these were not hugely out of line with other
23
regions, and other plans to hold land, purchase surrounding properties, give land to family, and develop land were similar by region. See Table 17 Similarly, when asked to rank the importance of various factors in their decisions about the use or disposition of their land parcel, owners across regions gave similar responses. A quarter ranked neighbors’ land decisions as “very important” in their decisions, suggesting the interacting influence owners have on the use and development of fringe land. Taxes and zoning and subdivision regulations received the most responses overall, though there was variation by region, with Portland and Sacramento owners particularly concerned about the land use regulations. In terms of taxes, those owners who thought taxes in general were important to their land decisions ranked the property tax as most critical, while those in Sacramento were more concerned in general with the income, capital gains, and estate taxes as well. In the longer term, over three-quarters of owners reported that they had children to whom they would like to pass their land on one day. While there was some uncertainty, the majority still agreed that their children would likely use the parcel in the same way as it was currently being used. However, only one-quarter overall report having sought the advice of an estate planner. See Table 18 Similarities in owners’ plans and in their rankings of important factors in land decisions suggest that, going forward, owners in all regions actually think and will act similarly. However, the reliability of questions about prospective actions and decisions is unclear; it is not clear if owners will act on the factors they describe, or take the actions they describe as extremely likely; and it is unclear whether the nature of the prospective question might obscure actual regional differences (that is, owners in the four regions may in fact act differently from one another in the future, despite the results here). General Participation in Land Markets Across regions, there was remarkable similarity in owners’ propensity to own other land besides the parcel that was the subject of the survey, in their current interest in buying or selling other properties, and in the frequency with which they participate in land markets as buyers and sellers of land. Roughly one-third of all owners surveyed possessed other land in their metropolitan areas (which includes the fringe as well as urbanized areas), with no significant differences among regions. In terms of acreage, Sacramento fringe owners possessed the largest amount of other land. Ownership of other parcels was positively correlated with the size of the specific parcel that was the subject of the survey, so that those with bigger parcels were more likely to own other land (though this finding was not true in Charlotte). Farmers and those employed primarily in real estate development or investment were significantly more likely to own other parcels, while
24
those in non-land intensive professions were less likely to own other land in their metro areas. There were significant differences by region in why owners possessed other land. In Austin, more than half of owners noted they possessed other land primarily for recreational or residential use, and though agriculture and investment were also important, few held land specifically so they could develop it in the future. In the other regions, however, development was cited by about 10% of owners as an important reason for owning other land. Agriculture was more important in Portland and Sacramento, and, as can be expected based on other results, more owners in Charlotte noted that they had inherited their other parcels and wished to keep land in the family. Smaller numbers of owners volunteered that they owned other land parcels to protect themselves from development or to ensure privacy from neighbors (one imagines that in these cases, owners were speaking about their ownership of abutting parcels, though the survey did not ask where other land was located). Fifteen percent of owners reported that they were looking to buy new parcels in their metropolitan areas, with no significant differences among regions (10% of those seeking new properties owned single parcels at the time of the survey; 23% were the multiple parcel owners described above), with most owners reporting that, in general, they bought land infrequently. Twenty-three percent of those who own other properties in their metro areas were currently considering selling some of this other property at the time of the survey. While most reported that they “never” sell or sell infrequently, Sacramento owners were most likely to report selling at least once every five years (most of those reported selling every three to five years on average). Not surprisingly, owners who possessed multiple parcels in their metro areas reported selling land with greater frequency, though 56% of these still reported that they “never” sold. See Table 19 Owners’ Perceptions of Growth The survey interviewers queried owners about their perceptions of growth in their areas and its potential effects on a host of issues, from property values to quality of life.
Thinking back to the time they acquired their land, most owners described the area surrounding their properties as rural (64%) or rural with scattered suburban development (32%); the remaining few percent thought their area was best described as mostly suburban or did not know. Asked to describe their areas now, however, the majority thought “rural with scattered suburban development” best described their surroundings (51%), with about equal numbers reporting their area remained rural (24%) or was now mostly suburban (23%). There are some perception issues here: those who acquired later, and those residents who moved from more rural locales, were more likely to perceive their area as currently rural or mostly rural.
25
According to the majority of owners in all regions (71%) and in all portions of the fringe, owners reported that growth was a big topic of conversation among neighbors and elected officials, though particularly in areas with moderate and intense development pressures. Even owners in areas described as “rural” have seen signs that their areas are changing: 64% have seen higher land values, 48% have seen higher value agriculture or hobby farms replacing existing farms and ranches, 43% have seen new infrastructure, and 56% new development. Thirty-three percent of these owners think significant development was occurring in their areas at the time of the survey. Of those who think their areas were mostly suburban, most reported that much of the growth had taken place within the last 10 years. Of those who reported that their areas were mostly suburban or who had seen some signs of growth in their areas19 88% agreed that if development were to occur at its current pace in their areas, new development would result in higher land values, 80% thought it would increase property taxes, 40% saw the potential for more options for how owners could use their land, 62% predicted a decrease in the ease of conducting agriculture (particularly in Sacramento and Charlotte), 71% predicted a loss of open space and scenery, and 58% predicted a loss of environmental quality in the area. Interestingly, these owners were split on whether more development would bring about an increased or decreased sense of community: 30% believe more development would increase the sense of community, 35% believe it would cause it to decline, and 24% anticipated no change. Overall, 44% believed more development would bring a lower quality of life, with Portland area owners least sanguine about the possibility of a better quality of life (52% of Portland owners thought quality of life would decrease, compared to 42% in all other regions). There were just 74 owners whose survey responses suggested that they had not seen significant signs of growth in their areas (these owners reported that they had not seen higher land values, higher value agriculture, new infrastructure, or new suburban-style development in their areas since acquiring their land). Interestingly, these owners appear slightly more optimistic about the likely effects of new development in their areas. While they expected higher property values and property taxes, they were more optimistic about the ease of conducting agriculture, with 50% believing new development would have no effect. Forty-three percent anticipated that future growth would have little effect on environmental quality, 67% anticipated the sense of community would be about the same or actually increase, and only 31% thought quality of life will decline, while 46% anticipated no change to their existing quality of life. There are striking regional differences, but since frequencies are low, additional research would be needed to clarify whether these differences hold on a larger scale; figures are presented in Table 19 below.
19 Respondents to these questions included those who described their areas as “mostly suburban;” those who described them as “rural” or “rural with scattered suburban development” who had also seen some signs of growth or growth pressures (higher land values, higher value agriculture, new infrastructure, or new suburban-style development); and those who described their areas as “rural” or “rural with scattered suburban development” but were unsure whether they had seen specific signs of growth (giving no positive responses to having seen signs of growth, but responding “don’t know” to at least one of the questions).
26
Most owners, whether they had seen signs of development or not, suspected that further growth would detract from the character of their communities. Finally, most (whether they had seen growth in their areas or not) agreed with the statement that, given the choice, they would keep their land in its current use indefinitely (80%), and that increased development in their areas would, overall, detract from the characters of their communities (70%). See Table 20 The responses to this series of questions reflect owners’ recognition of the mixed impacts of growth and development on one’s larger community as well as on one’s land – the ease of keeping land in its current use as well as its value. Geographic Location on the Fringe In this study, location on the fringe is useful for understanding each region and each study corridor on its own, but is not as helpful in drawing broader conclusions about fringe development across all the study regions: the study revealed that the role of geographic location on the fringe, at least as tested in this study through stratification by development pressure, is surprisingly inconsistent across and within regions. As noted in the methods section, study areas in all four regions studied were stratified by development pressure in order to ensure that the project captured landowner experiences in a range of fringe settings. In areas of intense development pressure, where significant development is occurring or is expected to occur within five years, we expected owners were seeing, or were about to see, development in their immediate surroundings. In areas of moderate development pressure significant development pressures and actual development were estimated to be five to 10 years away. Areas of weak development pressure were estimated to be 10 or more years away from significant urban development, and owners likely had seen very little external change. As noted earlier, stratification of this kind has been used in previous empirical research (e.g. Brown et al., 1981 and Pyle, 1985), which has shown that certain types of owners are expected to be concentrated in specific areas of development pressure: farmers and ranchers generally possess land farthest from the urbanized core in areas with weak development pressures, speculators in a closer band to the city, and closest of all, developers, builders, and new homeowners. This study did not find such distinctions. Only in Sacramento were any patterns discernible by the owner types familiar in previous literature (e.g. farmers, real estate speculators (in the current study, real estate developers and investors are grouped together), and new homeowners): in Sacramento farmers were significantly concentrated in areas of weakest development pressure areas, real estate investors and developers in the intense areas, and other professionals in the moderate regions (with retirees spread throughout). In all other regions, we found no significant differences in concentrations by owner professions throughout the fringe.
27
The same lack of geographic differentiation was found with other characteristics. For example, one might expect that those who had inherited their land might be concentrated in areas that have seen less development pressures, as families have not yet faced pressure to sell property but have instead been able to pass it through their family. However, only in Austin were inheritors significantly more concentrated in areas of weak development pressure; in other regions, they are spread throughout. There were also, surprisingly, no statistically significant differences in the mean year in which land was acquired in areas of intense, moderate, or weak development pressures in each region. The only significant, predictable difference among areas of development pressure was in parcel size: it rose in all regions as one moved from intense to moderate, and moderate to weak, areas of development pressure (in Charlotte the change from intense to weak areas was not statistically significant, though it was in all other regions). Though our designation of specific areas as facing intense, moderate, or weak development pressure appears to be reasonably consistent with owners’ own perceptions of their areas,20 part of the reason for the lack of consistent and strong results by geographic location across all regions may stem from our study design. The types and values of development occurring in one “intense” area of a region may differ from “intense” areas in that same region, and from “intense” areas in other regions. For example, local experts described development pressures in the intense areas of the Hays County study corridor as very high, with development occurring at a rapid pace, and the types of development as the most expensive of all the study areas in Austin, while the areas with the highest development pressures in the Caldwell County study corridor, also in Austin, which we also labeled intense, were not as strong as those in Hays County. While we attempted a finer approach than selecting rings of development pressures around the central city in each region, and used local expertise so that we could be as precise as possible (even capturing pockets of higher development pressure located within more weakly developing areas), it would have been more desirable – though difficult – to refine the methods further so that we could accurately compare the pace and quality of development pressures across each study corridor in all regions.21 20 We asked owners to describe the state of their areas at the time they acquired their property and at the time of the survey, offering “rural,” “mostly rural with scattered development,” and “mostly suburban” as choices. These categories were not directly equivalent to our designations of development pressure as intense, moderate, or weak. However, we would expect that owners whose land lay in areas of weaker pressure, in general, to describe them as rural or rural with scattered development, and, overall, 61% did. Ninety percent of those in intense areas saw their areas as mostly suburban or as rural with scattered development. In Portland, where 65% of those describing their areas as mostly suburban were actually located in areas we designated as facing weak pressures, I speculate that despite the current state of development future growth is restricted and the areas have a realistically low chance of seeing more development in the short term. An additional complication is that the terms “rural,” “mostly rural,” and “mostly suburban” may have been interpreted differently depending on individuals’ perceptions: for example, those who formerly resided in more urban locales were significantly more likely than others to see their areas as currently “rural” or “rural with scattered development.” 21 Another option would have been to stratify not by perceived development pressure but by market price for land. Accurate land value data was, at the time of the study, extremely difficult to identify (particularly in areas seeing rapid changes in land values), and even now, with more and more information available on-line, still difficult to locate and assign to specific, idiosyncratic pieces of land, particularly given the large sample size and geographic scope of the study.
28
Yet even with this issue, we should still expect to see more relative and predictable differences within each study corridor, as one moves from areas of intense to weak development pressure. Significantly, we do not se the concentration of certain types of owners (farmers/ranchers, real estate investors, developers, new homeowners) in specific areas of the fringe, as predicted by the models in earlier research. Our classifications of “farmer/rancher,” “real estate investor/developer,” retiree, and other professional may have contributed to this lack of a match with previous research, as it is unclear how previous studies assigned owners to professional categories. Still, there are good reasons to suspect that the previous identification of different parts of the fringe with specific types of owners may no longer hold true. The nature of and interest in speculation in land has likely changed: with greater public awareness of growth and its management, farmers and ranchers may themselves have stronger investment interests and may be more savvy about the potential for appreciating land values: they may hold land longer to develop themselves or to sell to developers rather than to a middle-man speculator. At the same time, other professionals are increasingly electing to live farther out on the fringe, on scattered large-lot developments. The way the fringe is developing appears to be changing, and further research is needed to assess the characteristics and quality of the new communities emerging as a result, as well as the effect on existing communities and resources.
Findings Part II: Landowners’ Motivations Section I presented overall results from the landowner survey, highlighting the many ways in which owners, ownership patterns, and owner behaviors are similar across regions. This data updates previous studies and also suggests that land ownership patterns on the fringe may have changed since this research was conducted. However, as I noted throughout Section I, some statistically significant regional variation did emerge in the survey results, and some of the differences are striking. For example, in Austin, parcel sizes were larger and fewer owners reported using their land for a primary residence, while the residence rate was significantly higher than all other regions in Portland; in Sacramento, there was a greater percentage of full-time farmers and owners who held more of their wealth in land; in Charlotte, a higher percentage of owners had inherited their land. I argue that the regional differences we see in the survey results group together and represent different interests in land, with interests defined as the benefits or advantages one gains through owning land. In other words, the average owner in each of the four regions derived a different set of benefits from land ownership. While each individual may have a distinct set of interests in land, aggregating to the regional level, interests provide a useful lens for distilling what is important to owners in each region and relative to other regions. Furthermore, since landowners’ interests and land decisions are closely intertwined, interests have meaning to policy that seeks to influence this behavior: I argue that, as interests vary by location, so too must policy incentives that are intended to influence owners’ behaviors. Below, I define interests and present a framework for examining owners’ interests in their land, and I then turn to a discussion of regional differences in owners’ interests.
29
A Framework for Exploring Owners’ Interests in Land I define interests as the benefits or advantages that a landowner derives from ownership, at a particular point in time, that the owner sees as enhancing (or potentially enhancing) his or her well being, physically, financially, or emotionally. Interests are, in other words, the positive value generated by landownership. It follows that they play a role in land decisions, since owners’ calculations about buying, selling, transferring, subdividing, developing, and using their land will depend, at least in part, on the value they currently gain from ownership or the value they believe they might gain in the future. In my dissertation (Hrabchak 2005), I developed a framework of interests that owners may hold in fringe land. The framework built upon studies of fringe land and urbanization (e.g. Bryant et al. 1982, drawing from Russwurm, 1975; Harvey, 1966), but primarily from theories of urban land (Davis, 1991; Logan and Molotch, 1987; Molotch, 1976). In developing my framework, I modified the models offered by Davis, Logan, and Molotch, primarily to include subjective as well as objective interests, and to apply them specifically to fringe land, where it is possible to hold some interests not relevant to urban land (such as an interest in earning agricultural income from land).22 As in the work of Davis and Logan and Molotch (who use the term “values” rather than interests), I divided interests into two categories of benefits that ownership might provide, “exchange” or “economic” interests, and “use/emotional” interests. Exchange interests provide the opportunity for economic gain from ownership, while use/emotional interests provide a location for activities and/or the potential to experience pleasure, enjoyment, satisfaction, pride, or a sense of identity from land ownership. Owners’ “exchange” or “economic” interests in fringe land may include the following: Equity: the potential to earn money through increasing land values. Rural income: the potential to generate income through rural land uses like
agriculture, forestry, recreation, mineral, timber, or rents from leasing for rural uses. Development income: the potential to generate income by improving land and
selling land and structures. Liquidity: the potential to sell land quickly for cash.
Legacy: the desire to pass land to heirs, as well as the connection to previous
generations and other family felt by owners who have received land through family gift or inheritance.
Owners’ “emotional/use” interests in fringe land include:
22 Please see Hrabchak, 2005, for a complete discussion of the interest framework, including supporting literature and such features of interests as their temporality, subjectivity/objectivity, latency, and relation to a particular parcel of land.
30
The use of land as a location for a specific activity, such as residence, commerce,
recreation, etc. Amenities: the enjoyment of services and amenities in one’s area, such as schools,
open space, scenery, natural resources, proximity to employment, or other qualities of the land or its location that contribute to quality of life
Legacy: as a use value, the potential to gain satisfaction from connecting to other
generations of family through family ownership of land Other emotional values, such as satisfaction, pride, or pleasure from owning and
working land or caring for natural resources on land; or a sense of identity or community through one’s role as a landowner or a member of a particular community.
I posit that individuals hold sets of interests; that is, very few landowners are uniquely motivated by a single interest. Instead most hold a package of interests, likely including both use and exchange interests, though the strength of particular interests will vary (one may hold a strong interest in building equity and a lesser but still important interest in gaining satisfaction from recreating on land, for example) (see Hrabchak, 2005). The framework of owners’ interests is also useful for examining owners and ownership on higher levels of analysis beyond the individual owner: one might, for example, compare interests for different categories of owners (such as owners of large and small parcels, or owners with different professions or lengths of tenure on the fringe). In this paper I use the framework to identify overarching themes in ownership at a regional level. Operationalizing the Interest Framework A number of questions in the survey instrument were intended to elicit information on landowners’ interests. Some of these questions asked owners directly about their interests, requesting that they rank the importance to them of various reasons for owning land, such as to build equity, earn income, or enjoy amenities. Much useful information was gathered from questions that asked owners to discuss and rank factors important in their decisions about acquiring, using, and selling/transferring land. Information on owners’ interests was also extrapolated from their behaviors, such as their land uses and whether or not they earn income on their property. Specifically regarding exchange interests, the survey asked owners directly about the importance of potentially earning a return on land through appreciating land values and/or through development of the property (equity), earning income through rural land uses (rural income), selling land quickly for cash (liquidity), and giving land to children (legacy). The survey also posed other questions related to exchange interests, particularly about owners’ plans and previous actions related to giving land to children, and about
31
income generation through rural land uses and development, including the significance of income earned on the property, the importance of factors influence income and investment in land to land decisions, and future plans to subdivide or develop. Similarly, regarding use values, the survey queried owners directly about the use of land for various purposes (primarily agriculture, other commerce, residence, and recreation), as well as the importance of amenities and services to owners. Legacy, which has a use/emotional component, was, as noted above, the topic of a series of questions. Other emotional interests, such as pride in owning or working land, were more difficult to study via a survey method. Interviews, some of which I conducted in the Austin fringe region, proved far more helpful at supplying data on emotional interests, but more research is needed to explore these emotional interests fully and across multiple regions.23 Interests by Region Using the framework presented above, I now turn to the interest profile evident in the four regions of the fringe examined in the landowner study. The interests I highlight in each region are those that stand out as particularly strong relative to the other regions studied. These are not the only interests held by owners in the regions: indeed, there remains a great deal of variation among owners’ interests within each region. They are simply, of the regions studied and data gathered, the interests that stand out most clearly as belonging particularly to each region. Where do regional interest profiles come from? There are a myriad of explanations for differences in interests by region, including the unique histories, topographies, policies, and economics of each region. The type of agriculture conducted on fringe land differs in each region, as does its viability as a profit-making enterprise (influenced by a host of factors both in the fringe region, such as weather conditions, and market conditions far beyond). Natural impediments to growth (e.g. topography or water constraints) vary in each region, as do policy approaches to directing or managing new development. Growth itself is being driven by different industries, from high tech to financial services, and although owners may be drawn by natural amenities in all regions, these specific amenities also vary. Numerous other reasons for regional differences can be cited. However, my aim is not to solve precisely why regions are different. Rather, in this section, I seek to probe these differences more deeply and to identify how they are important for policymakers. Below I discuss the strong exchanges interests among Portland and Sacramento fringe owners, particularly in rural income; the unique legacy interest among Charlotte fringe owners; and the greater focus on use interests that characterizes Austin’s fringe owners.
23 Some of these values are touched on in research on landowner participation in conservation programs, cited earlier. For example, see Rilla and Sokolow (2000), whose interviews provided insight into owners’ emotional connections to their property, particularly through family history with land.
32
Portland and Sacramento: Exchange Interests Owners in Portland and Sacramento appear to be particularly interested in the potential to earn money from their land, including income through particular land uses as well as financial gain through eventual sale. A higher percentage of owners in these two regions was interested in earning income on their land (from any source, including agriculture, fees paid by others using land for recreation, and rents), as is evident both from owners’ actual behaviors as well as their expressed opinions about the importance of earning income. First, in terms of behaviors, owners in Portland and Sacramento were actually more likely to earn income from their land (49% in Portland and 50% in Sacramento, compared to 39% in Austin and 29% in Charlotte), and to earn higher percentages of their incomes in this way (of those who earn income, Portland owners on average earned 20% of their incomes from their land and Sacramento owners earned 27%, compared to 14% in Austin and 11% in Charlotte). While this income may come from any source, agricultural income (including rents) appears to be particularly important. Owners in Portland and Sacramento were more likely to practice agriculture: both regions had higher percentages of full-time farmers and ranchers than did Austin or Charlotte, as well as high percentages of part-time farmers; and the regions had high percentages of land in agricultural use. At the time they acquired their property, a higher percentages of Portland and Sacramento owners intended to use it to farm or ranch (even controlling for numbers of full-time professional farmers). Looking only at full-time farmers and ranchers, those in Portland and Sacramento were not more likely to earn income from their land than their counterparts in other regions (90% and 92% of Austin and Charlotte’s full-time farmers and ranchers earned income from their land, respectively, while 88% and 78% of Portland and Sacramento owners did), but they did earn higher percentages of their incomes (41% in Portland and 36% in Sacramento, compared to 26% in Austin and 19% in Charlotte). Second, in terms of their own rankings of interests, significantly more owners in the Portland and Sacramento regions ranked earning income on land through rural land uses such as agriculture as a “very important” reason for owning (an average of 22% in Portland and Sacramento versus 12% in Austin and Charlotte). While the interest in agricultural and income from rural land uses is strong in Portland and Sacramento, there are clear differences between these two regions. Sacramento stands out as the region where owners were most engaged in earning income on their land, certainly among those who farm full-time, but also among those who do not. For example, excluding full-time farmers, owners in Sacramento were more likely to earn income on their land, and to earn a higher percentage of their total income from their property, than those in other regions. A higher percentage of non-farmers (including both full-time and part-time farmers) owned other land in the region for the purposes of conducting agriculture. And even among those with no agricultural uses on their land, Sacramento owners still reported a greater interest in rural income than their counterparts elsewhere, with 10% of this group rating it as a very important reason for owning land, compared to 6% in Austin, 3% in Charlotte, and 1% in Portland. Sacramento owners were also more likely than those in any regions to report that the expected return on
33
agriculture was important in their land decisions. In Portland, however, while a relatively high percentage of owners may have intended to farm at the time they acquired their land, those who reported minimal involvement in agriculture at the time of the survey were on the lowest end of the spectrum in terms of amount of income earned, propensity to own other land for agriculture, and rankings on the importance of earning income on their land. Agriculture is a major land use in Charlotte and Austin, particularly in Austin, but we do not find the same value placed on earning income through rural uses, nor do we find that owners in these regions actually earn as much income from their land. Austin deserves special note here because it had as much land in agricultural use as did the Portland and Sacramento regions and, despite having a lower percentage of full-time farmers and ranchers than these other regions, it had a high level of part-time farmers. However, though the full-time farmers were as interested in earning income in their land as those in Portland and Sacramento, in practice they earned less of their income from rural uses. Interestingly, Austin owners who were not farmers did earn more of their income from their land here than in any other region besides Sacramento, suggesting that they earned it through rents or other sources (e.g. fees charged for recreation like hunting) than directly from agricultural production. Charlotte differs most from all the other regions in that it had the lowest percentage of full-time and part-time farmers and ranchers, the lowest percentage of land in agriculture, and the lowest ranking of the importance of earning income on land from rural uses, even among full-time farmers and ranchers. Farmers and ranchers here were both more likely to live on their land and to own as individuals (as opposed to family corporations or partnerships, which were more prevalent among farmers and ranchers in other regions), which may suggest smaller operations. Agriculture may remain a critical and economically viable land use in the Charlotte region, with over half the fringe land captured in the survey in agricultural use, but relative to the other regions, agricultural use and earning income from land do not stand out as strongly as reasons for owning land. See Table 21 There is evidence that Portland and Sacramento owners also put high value on other exchange interests. According to their rankings of various reasons for owning land, owners in both regions placed higher value on liquidity, the potential to sell their land quickly for cash, than did owners in Austin and Charlotte. They also appeared more interested in earning income from rising land values and potential development on their land. First, owners in the Portland and Sacramento regions ranked the importance of building equity more highly as a reason for owning land when compared with the average of owners in Austin and Charlotte (though Charlotte itself did not significantly differ from Sacramento). Second, Portland and Sacramento owners were more likely to report that their land decisions were influenced by development pressures in their areas, as well as zoning and subdivision regulations, all of which would be particularly important to those interested in the investment and development potential of their land. (However,
34
these owners were not necessarily more influenced by transportation access, sewer and water availability, or environmental regulations; this may relate to the fact that the provision of infrastructure and the nature of regulations vary so much from region to region as well as within regions.) Sacramento owners were more likely to report that the potential to develop (improve land and sell land and structures) was a very important reason for owning land in general, and were more likely to report plans to develop within the next five years.24 See Table 22 Compared to owners in Austin and charlotte, those in Portland and Sacramento had more of their net worth tied up in land (owners in Portland estimate, on average, that 59% of their net worth is in their land, while those in Sacramento estimate 64%, compared with 46% in Austin and 53% in Charlotte), suggesting earning a financial return on landownership may indeed be of higher priority. Yet though the interest in exchange interests appears to have been stronger overall in Portland and Sacramento, owners in both regions placed importance on use interests (at least those that could be assessed through the survey; as noted, some of the more emotional interests in land were difficult to study via a survey method). In Portland in particular, owners placed high value on the enjoyment of amenities, and a higher percentage used their land for a residence. However, in both Portland and Sacramento, owners ranked protecting natural resources as a less important reason to own land than did owners in Austin and Charlotte, and the percentage of those using land for recreation was lowest in Portland and Sacramento (Sacramento owners also gave recreation a low rank as a motive for owning land in comparison to those in other regions; this question was not asked in Portland). Charlotte: Legacy Interests The survey data revealed a particularly strong legacy motivation in Charlotte. Charlotte owners were significantly more likely than owners in all other regions to have acquired their land through inheritance or as a gift from family (I use the term “inheritor” to describe this group, though some may have acquired through a gift or through a combination of gift/inheritance and purchase). In terms of their stated interests in land, Charlotte owners had high regard for the legacy value of land, whether or not they acquired their own property via inheritance. They ranked the “wish to give land to heirs” significantly higher rank than did owners in other regions as a reason for owning land, and a higher percentage of Charlotte owners reported that they have children to whom
24 Portland and Sacramento owners were significantly more likely to report that, at the time they acquired their property, they intended to develop it at some point in the future. However, Austin owners responded in almost the same proportion to the question; it is also unclear in this particular question whether the owner intended simply to improve the property for personal use (building a home or cabin for recreation, for instance) or to develop and sell for profit. Furthermore, though more owners in Portland and Sacramento described their employment as in real estate investment and development, the difference with Austin and Charlotte was not significant.
35
they wish to pass on land.25 In terms of actual behaviors, a higher percentage had made transfers of portions of their parcels in the past to family (interestingly, the rate of previous transfers to family was particularly high among Charlotte owners who did not inherit their own land). In general, in all regions, inheritance was positively correlated with parcel size, greater agricultural use, and slightly lower incomes, and Charlotte’s inheritors were no exception. Across all regions, inheritors held slightly more land in agricultural use.26 But on other dimensions, owners in all regions who had inherited land, as well as the overlapping but larger group of those wishing to pass land to their children at some future point, were fairly representative of the general sample in each region. In terms of wealth, there were no significant differences within any region between non-inheritors and inheritors, or between those wishing to pass land to family and those who did not have this wish, in wealth or in percent of wealth held in land (though, as reported earlier, Charlotte owners did tend to have lower incomes and lower wealth overall than owners in other regions). In no region was there a disproportionate concentration among the professions of inheritors or of those who wished to pass land to family in the future.27 Finally, in Charlotte, as in Portland and Sacramento, both groups of inheritors and those who wished to pass land to their children were evenly spread throughout all levels of development pressure on the fringe (in Austin inheritors were more concentrated in areas with weaker development pressure). Additionally, in Charlotte, the strength of owners’ stated interest in legacy (their ranking of legacy as a reason for owning or continuing to own land), was not significantly different by area of development pressure on the fringe; this was true of all owners in general, of inheritors, and those who wished to pass land to children. However, in Austin and Sacramento there were significant differences in the strength of the legacy ranking among all of these groups: the rank rose significantly as development pressure decreased. In these regions, it is possible that the legacy interest is more tied to land values, as these tend to rise with development pressure, but more research would be needed to clarify this relationship. In short, inheritors and would-be givers of land were not significantly different from other owners on most dimensions, and Charlotte’s inheritors and those who intend to pass land to family were not significantly different from their counterparts in other regions, 25 Legacy can be fulfilled in two ways: owners can transfer land to their family while they are alive or upon their deaths. The survey did not ask owners to specify their particular plans. 26 Overall, inheritors’ average parcel size was 42 acres, while those who acquired through other means had an average parcel size of 24 acres; average acreage varied by region but the difference between inheritors and non-inheritors was significant in all regions. In terms of agricultural use, an average of 79% of inheritors’ land was in agricultural use, versus 71% of other owners’ land. And in all regions but Sacramento, inheritors earned slightly lower incomes than non-inheritors, averaging between $40,000 to $50,000 as compared to non-inheritors, who averaged $50,000 to $75,000. 27 That is, 12% of inheritors and 12% of those who wished to pass land to their children were farmers (and farmers comprised 12% of the sample), 4% of inheritors and 4% of those who wished to pass land to their children were real estate professionals (5% of the sample), 42% of inheritors and 37% of those who wished to pass land to their children were other professionals (48% of the sample), and 42% of inheritors and 47% of those who wished to pass land to their children were retirees (36% of the sample).
36
but for the facts that the strength of legacy interest did not diminish significantly as land values rose, and that there were simply higher percentages of these owners in Charlotte than elsewhere. It is unclear from the survey whether Charlotte’s strong legacy motivation will continue. Although a higher percentage of Charlotte area owners reported that they wished to pass land to their children at some indefinite future point, these owners were no more likely to have short-term plans to transfer land to children. For example, Charlotte owners who reported that they were currently interested in disposing of some or all of their property were not more likely than owners in other regions to report they were doing considering sale or transfer in order to give land to family; nor were Charlotte owners significantly more likely to report plans to give land to family in the next five years.28 Charlotte owners were also no more likely to be concerned with gift or estate taxes than those in other regions; indeed, Sacramento owners reported the most concern with these particular taxes; furthermore, Charlotte owners (along with those in Austin) who reported having children to whom they wished to pass land were least likely to report having consulted with an estate planner. The precise nature of Charlotte owners’ interest in passing land to children is also unknown: it is unclear whether owners were particularly interested in passing on the financial benefits of landownership, the emotional connections to family land, or both. Further research is needed to understand more fully the nature and sources of Charlotte’s strong legacy interest. The survey does make clear, however, that Charlotte area owners do not anticipate that their children will necessarily continue the same land uses as are currently on the property. Indeed, Charlotte inheritors were least likely of all those who had inherited their land to think that if they passed their land to their children, the children would maintain it in its current use. See Table 23 As in other regions, Charlotte owners have an entire package of interests; legacy stands out most strongly relative to the other regions, but Charlotte owners also ranked the potential to earn equity and to develop land relatively highly, and, in terms of use values, Charlotte owners also placed a high value on protecting natural resources as a reason to own land. They placed a lower value on enjoying amenities or recreation on their property, and on the potential to earn income from rural land uses.
28 These questions were about potential behaviors and not past behaviors. It is unclear what role the question type played in the differences between Charlotte and other regions on past behaviors and the lack of differences between Charlotte and other regions on future behaviors.
37
Austin: Recreation and Amenity Interests Austin owners appeared particularly interested in use interests. Austin fringe owners ranked recreation more highly than those in other regions as a reason for possessing land, and, indeed, Austin owners reported using their land for recreation at the highest rate of all regions: 43% noted their land was used for recreation, as opposed to 30% in Charlotte, Portland, and Sacramento. Austin owners were also more likely to intend recreational use at the time they acquired their land. The Austin region reported the lowest percentage of owners using their land for a full-time residence, though many owners had residences on their properties, many of which were apparently for recreational (e.g. weekend or vacation) use. Austin fringe owners also ranked highly the enjoyment of amenities, such as scenery, open space, schools, and other factors that contribute to quality of life. A significantly greater percentage of Austin owners gave these the highest rating of five on a scale of one to five than those in other regions (with the exception of Portland, where amenities were also important; the average ranking was significantly different only from Charlotte, however). Additionally, a significantly greater percentage of Austin area owners who had purchased their land gave the highest ranking to area amenities and services as a key determinant in their land decisions (significantly higher than all other regions besides Portland, though again the average ranking was significantly different only from Sacramento). Austin owners, along with Charlotte owners, also gave high scores to the importance of protecting their land and natural resources on their property as a motivation for owning their land. Scores on this measure were surprisingly high in all regions, but the precise nature of this interest is not clear, and additional research is needed to understand the various meanings owners might have attached to the phrase “protecting land and resources on land.” Interviews and open-ended survey questions suggest that some Austin owners acquired land to buffer existing land holdings from development or to ensure privacy, thereby increasing their enjoyment of their property and perhaps its economic value as well. However, protecting resources, such as trees or other natural features that had existed on the land for previous generations, also appeared to be an ethical concern for some landowners. Finally, for some owners participating in conservation programs, protecting resources was an instrumental way to ensure they could hold onto their land: the programs’ tax benefits made it financially feasible for owners to continue to own their land, both for their own use and, in some cases, so that the land would be available one day to children. Clearly, the topic of stewardship of natural resources as a motivation for ownership (and for continued ownership) is ripe for further research that can inform conservation and other environmental policies and programs. Austin’s use interests stand out most clearly: though Austin owners share concerns for legacy with owners in other regions, in terms of exchange interests, Austin owners reported the lowest scores on the importance of building equity, liquidity, and income from development, and the second lowest score on earning income through rural uses on land.
38
See Table 24
Discussion
In this paper, I have hoped to inform both researchers and policymakers about the identities of fringe landowners; about their behaviors regarding their land, including acquisitions, past sales and transfers, current land uses, and potential plans; and about the related topic of owners’ interests in their land: their motivations for possessing and continuing to hold land. In Part I of the study findings, I focused on the overall character of landownership in all four of the regions included in the Lincoln Institute’s landowner study, highlighting the many ways in which owners’ characteristics and behaviors are consistent across the metropolitan fringes Austin, Charlotte, Portland, and Sacramento. Though these regions vary in their economies, geographies, policies, and histories, they share rapid population growth, and the similarities we see among the survey findings appear to reflect a fairly common state of fringe landownership. Fringe areas are characterized by a mix of land uses but dominated by agriculture, though the owner population is composed primarily of retirees and professionals not involved in land-intensive work. There is a mix of parcel sizes, from large open and agricultural land to smaller home lots. Landowners include significant groups of both longtime owners and relative newcomers. Most owners possess their land as individuals and families, and not corporations. A significant group inherited their land, and an overlapping set of owners wish to pass on their land to children, the majority of whom believe their children will use the land in the same way. Across all regions, there is a fair amount of consistency in owners’ propensity to have sold or transferred portions of their land in the past, in their general land market participation, and in their future plans for their land. However, the findings did not reflect the geographic concentration within each fringe of certain types of owners and uses that we might have expected from previous research; where different owner types and land uses clustered in areas with different development pressures. Instead we find that little can be predicted across all regions about ownership patterns simply by location within the metropolitan fringe, which may reflect greater diffusion in land conversion as commuters, hobby farmers, and others are willing to move deeper into the fringe than in previous generations. A second, but related, difference from previous research is that a clear group of land investors (or speculators) did not emerge. This may result from how the landowner study classified individual owners (by their primary professions, as opposed to some other method of categorization which may have been used previously), or a change in the nature of land investment. Providing evidence of the latter, we see that many farmers and ranchers (“rural users” in previous literature) show strong interests in alternatives to agriculture, including development, as a means to reap financial returns from their land. Indeed, rural users today are likely more savvy about the development potential of their land and may be more apt to hold land themselves to sell directly to developers rather than sell to speculators; at the same time, those who might have once been in the speculator class
39
may today have more attractive investment options outside of real estate. Both findings deserve confirmation through additional research (using additional case studies), but suggest that models of fringe development can be updated to take into account both the changing geography of fringe development and landowners’ specific roles in the processes of land conversion. Despite the similarities in owners’ characteristics and behaviors we saw in Part I of the findings, some characteristics and behaviors do vary, and, importantly, the underlying motivations for even similar behaviors may vary as well. In Part II of the study findings, I explored differences in owner behavior and motives at the regional level. The discussion of exchange interests in Portland and Sacramento, legacy interests in Charlotte, and use interests in Austin summarized what is particularly distinct, relative to all other regions, about the interests held by the average owner in each region.29 The findings suggest that, for those seeking to create incentives for landowners to participate in voluntary programs, such as those related to farmland preservation, wilderness conservation, or habitat protection, the unique interests in each region and sub region are important considerations, as interests are what motivate land ownership and influence decisions about land. For example, in the Charlotte fringe, incentives that help owners keep land in family ownership, or even that market conservation programs as ways to keep family land holdings together, may be more effective overall than in the Portland region (though undoubtedly, owners in the Portland area care about legacy as well). Two critical questions emerge from Part II of the findings. First, will the interests that define each region relative to the rest be as strong going forward? This question relates to the stability of interests over time, and by extension, the factors that influence the strength of owners’ interests. Additional research is needed on both, starting with the latter. Again using the example of legacy, research could explore the role of external factors like land values (notwithstanding the difficulties, noted earlier, of identifying and accessing this data); parcel-specific characteristics such as acreage; and socio-economic and family data, such as the presence of children and their interest in land, family connections to previous generations through ownership, age, and detailed financial status, in shaping owners’ legacy interests. We might then examine how changes in particular factors, like land values, relate to the strength of legacy interests over time. Such research can help us predict, at an individual level, which owners will hold strong legacy interests (data useful to practitioners seeking to encourage the use of conservation easements, for example). At a regional level, this research can help us assess how regions’ interest profiles and, by extension, their characters, may evolve with continued population growth (and with it, demographic shifts) and rising land values. A second and related question raised by Part II of the findings concerns the role of incentives offered by public policies in shaping interests. It is interesting to note that the strongest exchange interests were found in Portland and Sacramento, which have the most stringent regulations for development of the four regions studied. To what extent do
29 Again, these interests do not represent the only interests held by landowners in these regions, nor were they necessarily shared by all owners within the regions; the point was simply to probe, at a high level, what makes each region distinct relative to the others.
40
the constraints placed on land by these regions’ policies increase land’s economic value, thereby increasing owners’ interests in exchange interests? Again, additional research is needed to understand how policies contribute to the strength and stability of owners’ interests. Finally, additional research is warranted concerning how owners deal with multiple interests, and how they make land decisions about land use, sale, subdivision, development, or participation in conservation programs when they hold multiple and sometimes conflicting interests in their properties (e.g. interests in equity and recreation may conflict when an owner receives an offer from a willing buyer of the land). The Lincoln Institute’s landowner study has provided a comprehensive start, but the additional collection of empirical data from owners, through survey but particularly through in-depth interviews, will be key to all of these efforts.
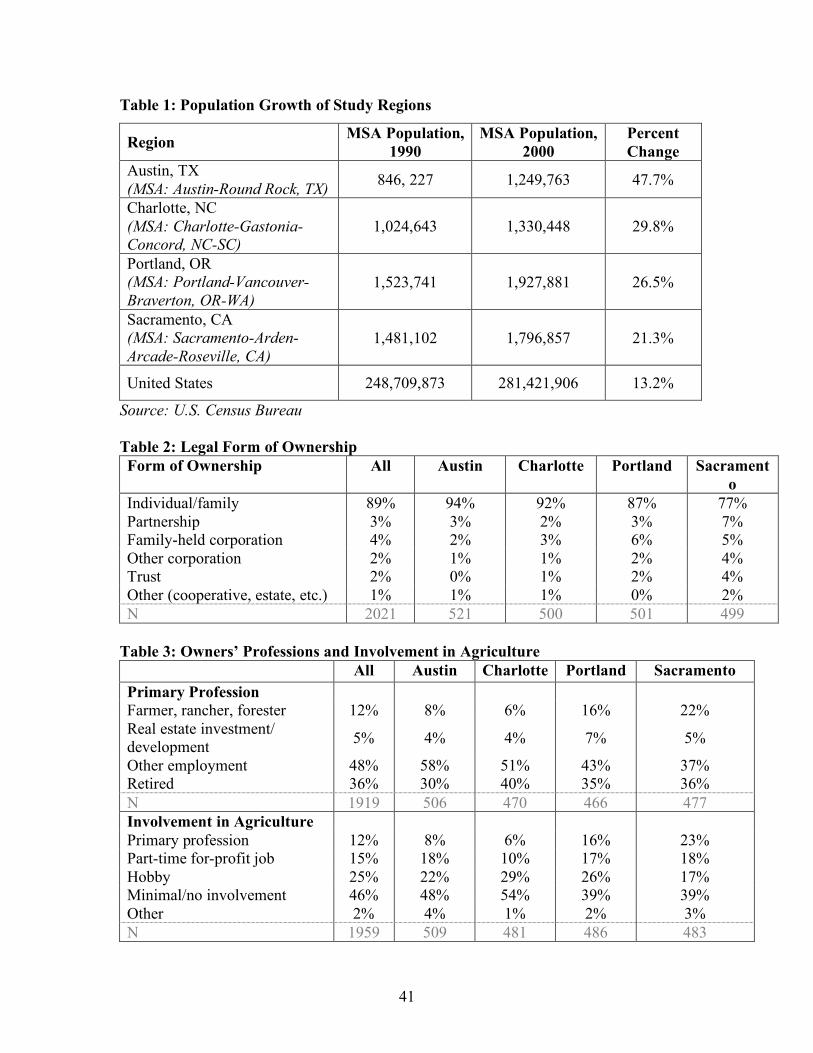
41
Table 1: Population Growth of Study Regions
Region MSA Population, 1990
MSA Population, 2000
Percent Change
Austin, TX (MSA: Austin-Round Rock, TX) 846, 227 1,249,763 47.7%
Charlotte, NC (MSA: Charlotte-Gastonia-Concord, NC-SC)
1,024,643 1,330,448 29.8%
Portland, OR (MSA: Portland-Vancouver-Braverton, OR-WA)
1,523,741 1,927,881 26.5%
Sacramento, CA (MSA: Sacramento-Arden-Arcade-Roseville, CA)
1,481,102 1,796,857 21.3%
United States 248,709,873 281,421,906 13.2%
Source: U.S. Census Bureau Table 2: Legal Form of Ownership Form of Ownership All Austin Charlotte Portland Sacrament
o Individual/family 89% 94% 92% 87% 77% Partnership 3% 3% 2% 3% 7% Family-held corporation 4% 2% 3% 6% 5% Other corporation 2% 1% 1% 2% 4% Trust 2% 0% 1% 2% 4% Other (cooperative, estate, etc.) 1% 1% 1% 0% 2% N 2021 521 500 501 499
Table 3: Owners’ Professions and Involvement in Agriculture All Austin Charlotte Portland Sacramento Primary Profession Farmer, rancher, forester 12% 8% 6% 16% 22% Real estate investment/ development 5% 4% 4% 7% 5%
Other employment 48% 58% 51% 43% 37% Retired 36% 30% 40% 35% 36% N 1919 506 470 466 477 Involvement in Agriculture Primary profession 12% 8% 6% 16% 23% Part-time for-profit job 15% 18% 10% 17% 18% Hobby 25% 22% 29% 26% 17% Minimal/no involvement 46% 48% 54% 39% 39% Other 2% 4% 1% 2% 3% N 1959 509 481 486 483
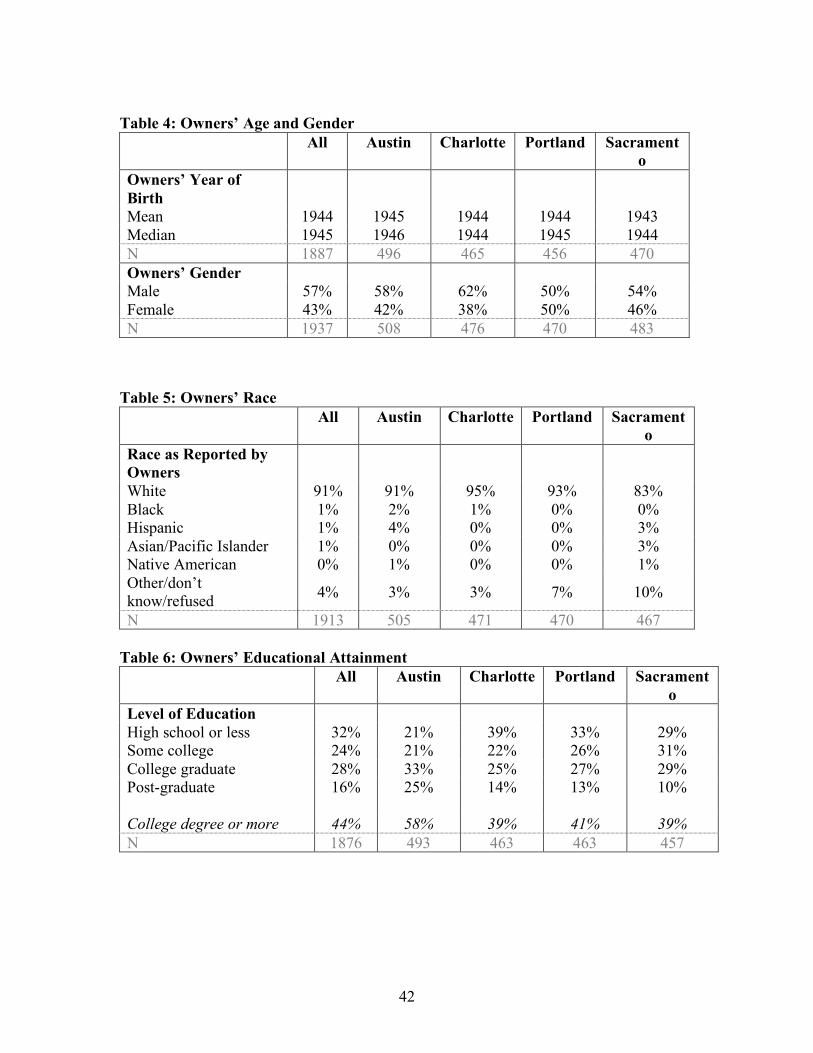
42
Table 4: Owners’ Age and Gender All Austin Charlotte Portland Sacrament
o Owners’ Year of Birth
Mean 1944 1945 1944 1944 1943 Median 1945 1946 1944 1945 1944 N 1887 496 465 456 470 Owners’ Gender Male 57% 58% 62% 50% 54% Female 43% 42% 38% 50% 46% N 1937 508 476 470 483
Table 5: Owners’ Race All Austin Charlotte Portland Sacrament
o Race as Reported by Owners
White 91% 91% 95% 93% 83% Black 1% 2% 1% 0% 0% Hispanic 1% 4% 0% 0% 3% Asian/Pacific Islander 1% 0% 0% 0% 3% Native American 0% 1% 0% 0% 1% Other/don’t know/refused 4% 3% 3% 7% 10%
N 1913 505 471 470 467 Table 6: Owners’ Educational Attainment All Austin Charlotte Portland Sacrament
o Level of Education High school or less 32% 21% 39% 33% 29% Some college 24% 21% 22% 26% 31% College graduate 28% 33% 25% 27% 29% Post-graduate 16% 25% 14% 13% 10% College degree or more 44% 58% 39% 41% 39% N 1876 493 463 463 457
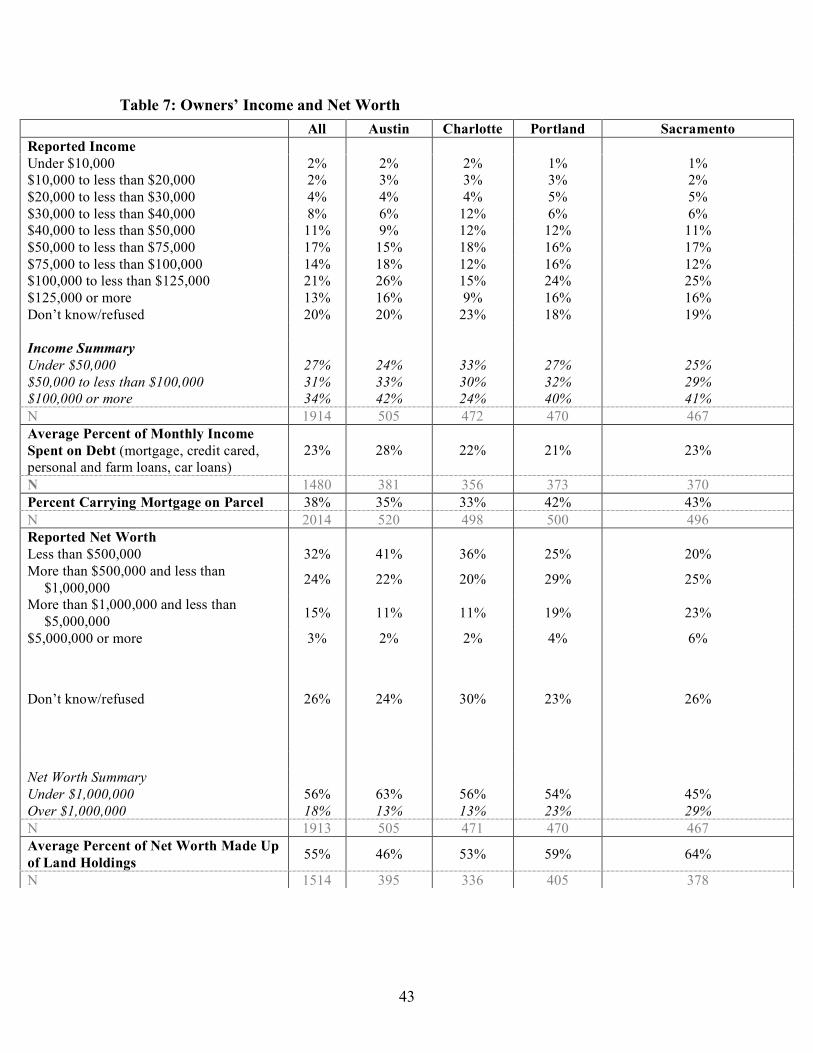
43
Table 7: Owners’ Income and Net Worth
All Austin Charlotte Portland Sacramento Reported Income Under $10,000 2% 2% 2% 1% 1% $10,000 to less than $20,000 2% 3% 3% 3% 2% $20,000 to less than $30,000 4% 4% 4% 5% 5% $30,000 to less than $40,000 8% 6% 12% 6% 6% $40,000 to less than $50,000 11% 9% 12% 12% 11% $50,000 to less than $75,000 17% 15% 18% 16% 17% $75,000 to less than $100,000 14% 18% 12% 16% 12% $100,000 to less than $125,000 21% 26% 15% 24% 25% $125,000 or more 13% 16% 9% 16% 16% Don’t know/refused 20% 20% 23% 18% 19% Income Summary Under $50,000 27% 24% 33% 27% 25% $50,000 to less than $100,000 31% 33% 30% 32% 29% $100,000 or more 34% 42% 24% 40% 41% N 1914 505 472 470 467 Average Percent of Monthly Income Spent on Debt (mortgage, credit cared, personal and farm loans, car loans)
23% 28% 22% 21% 23%
N 1480 381 356 373 370 Percent Carrying Mortgage on Parcel 38% 35% 33% 42% 43% N 2014 520 498 500 496 Reported Net Worth Less than $500,000 32% 41% 36% 25% 20% More than $500,000 and less than
$1,000,000 24% 22% 20% 29% 25%
More than $1,000,000 and less than $5,000,000 15% 11% 11% 19% 23%
$5,000,000 or more 3% 2% 2% 4% 6%
Don’t know/refused 26% 24% 30% 23% 26%
Net Worth Summary Under $1,000,000 56% 63% 56% 54% 45% Over $1,000,000 18% 13% 13% 23% 29% N 1913 505 471 470 467 Average Percent of Net Worth Made Up of Land Holdings 55% 46% 53% 59% 64%
N 1514 395 336 405 378
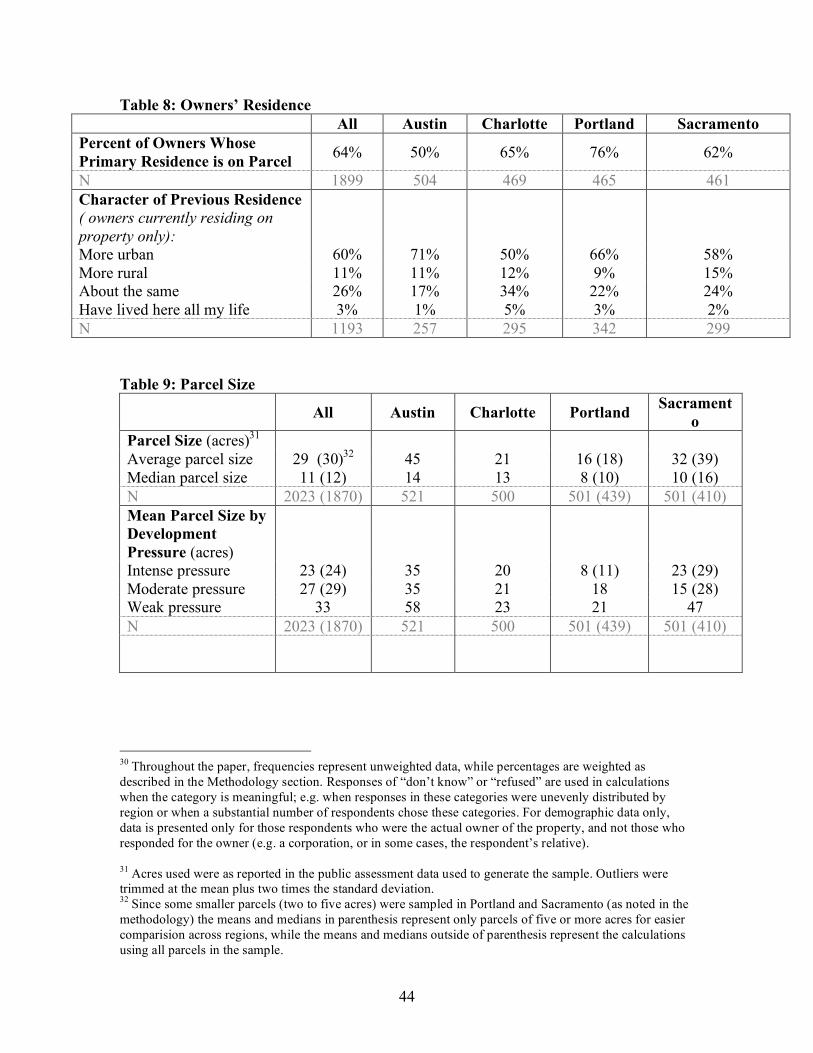
44
Table 8: Owners’ Residence All Austin Charlotte Portland Sacramento Percent of Owners Whose Primary Residence is on Parcel 64% 50% 65% 76% 62%
N 1899 504 469 465 461 Character of Previous Residence ( owners currently residing on property only):
More urban 60% 71% 50% 66% 58% More rural 11% 11% 12% 9% 15% About the same 26% 17% 34% 22% 24% Have lived here all my life 3% 1% 5% 3% 2% N 1193 257 295 342 299
Table 9: Parcel Size
All Austin Charlotte Portland Sacramento
Parcel Size (acres)31 Average parcel size 29 (30)32 45 21 16 (18) 32 (39) Median parcel size 11 (12) 14 13 8 (10) 10 (16) N 2023 (1870) 521 500 501 (439) 501 (410) Mean Parcel Size by Development Pressure (acres)
Intense pressure 23 (24) 35 20 8 (11) 23 (29) Moderate pressure 27 (29) 35 21 18 15 (28) Weak pressure 33 58 23 21 47 N 2023 (1870) 521 500 501 (439) 501 (410)
30 Throughout the paper, frequencies represent unweighted data, while percentages are weighted as described in the Methodology section. Responses of “don’t know” or “refused” are used in calculations when the category is meaningful; e.g. when responses in these categories were unevenly distributed by region or when a substantial number of respondents chose these categories. For demographic data only, data is presented only for those respondents who were the actual owner of the property, and not those who responded for the owner (e.g. a corporation, or in some cases, the respondent’s relative). 31 Acres used were as reported in the public assessment data used to generate the sample. Outliers were trimmed at the mean plus two times the standard deviation. 32 Since some smaller parcels (two to five acres) were sampled in Portland and Sacramento (as noted in the methodology) the means and medians in parenthesis represent only parcels of five or more acres for easier comparision across regions, while the means and medians outside of parenthesis represent the calculations using all parcels in the sample.
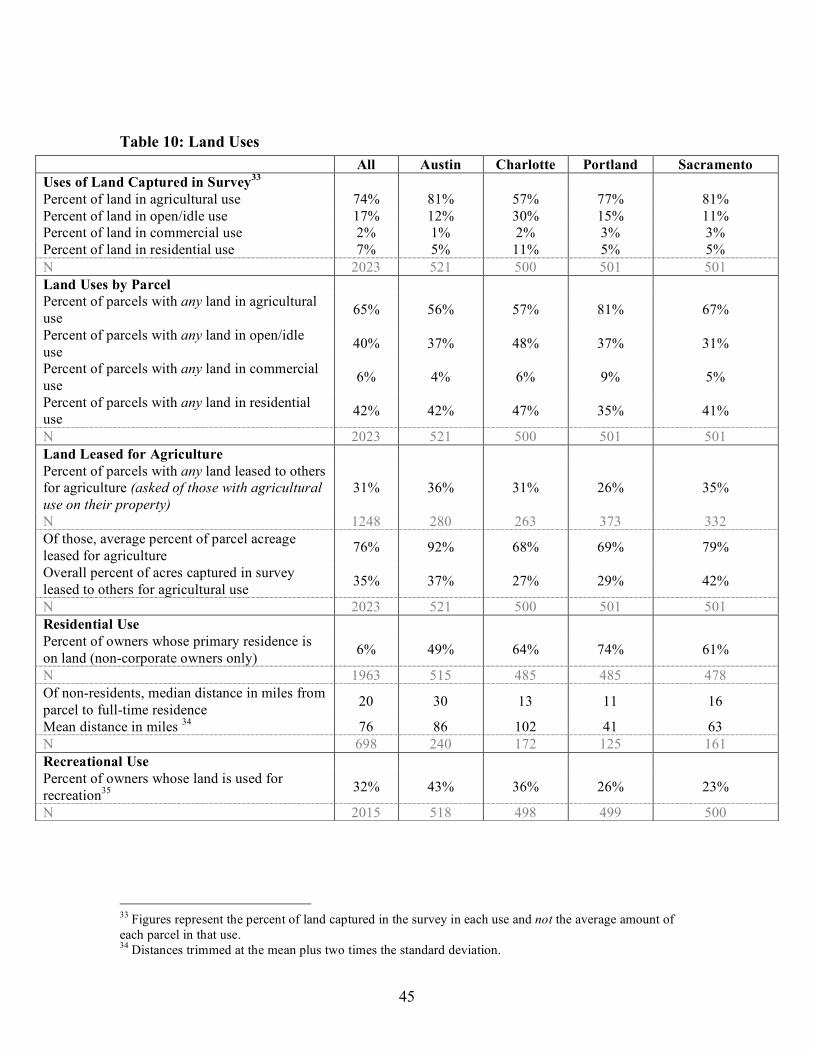
45
Table 10: Land Uses
33 Figures represent the percent of land captured in the survey in each use and not the average amount of each parcel in that use. 34 Distances trimmed at the mean plus two times the standard deviation.
All Austin Charlotte Portland Sacramento Uses of Land Captured in Survey33 Percent of land in agricultural use 74% 81% 57% 77% 81% Percent of land in open/idle use 17% 12% 30% 15% 11% Percent of land in commercial use 2% 1% 2% 3% 3% Percent of land in residential use 7% 5% 11% 5% 5% N 2023 521 500 501 501 Land Uses by Parcel Percent of parcels with any land in agricultural use 65% 56% 57% 81% 67%
Percent of parcels with any land in open/idle use 40% 37% 48% 37% 31%
Percent of parcels with any land in commercial use 6% 4% 6% 9% 5%
Percent of parcels with any land in residential use 42% 42% 47% 35% 41%
N 2023 521 500 501 501 Land Leased for Agriculture Percent of parcels with any land leased to others for agriculture (asked of those with agricultural use on their property)
31% 36% 31% 26% 35%
N 1248 280 263 373 332 Of those, average percent of parcel acreage leased for agriculture 76% 92% 68% 69% 79%
Overall percent of acres captured in survey leased to others for agricultural use 35% 37% 27% 29% 42%
N 2023 521 500 501 501 Residential Use Percent of owners whose primary residence is on land (non-corporate owners only) 6% 49% 64% 74% 61%
N 1963 515 485 485 478 Of non-residents, median distance in miles from parcel to full-time residence 20 30 13 11 16
Mean distance in miles 34 76 86 102 41 63 N 698 240 172 125 161 Recreational Use Percent of owners whose land is used for recreation35 32% 43% 36% 26% 23%
N 2015 518 498 499 500

46
Table 11: Date of Land Acquisition
All Austin Charlotte Portland Sacramento
Date of Acquisition Mean year of acquisition 1983 1987 1983 1981 1981 Median year of acquisition 1986 1990 1987 1985 1984 N 1940 495 470 493 482
Table 12: Acquisition Methods
All Austin Charlotte Portland Sacramento Acquisition Method Bought parcel 73% 79% 58% 85% 80% Inherited parcel 20% 18% 31% 12% 12% Received parcel as gift 3% 1% 5% 3% 4% Multiple methods 3% 2% 6% 0% 4% N 2017 520 497 500 500 Initial Property Identification (buyers only)
Family or friend 35% 29% 41% 37% 30% Sign on property 22% 28% 17% 24% 21% Broker/real estate agent 27% 31% 22% 25% 34% Self-initiated contact 11% 9% 15% 10% 9% Other/don’t know 4% 3% 5% 3% 7% N 1565 428 304 421 412 Important Property Features (buyers only) Percent reporting feature as very important (5 on a scale of 1 to 5)
Proximity to municipal services such as sewer or water 9% 11% 6% 9% 13%
Commute time to job 16% 13% 16% 13% 22% Area amenities and services such as scenery, open space, schools 31% 34% 29% 34% 27%
Land size and property suited for agriculture/ranching 31% 25% 24% 30% 49%
Land size and house suited for family 48% 41% 52% 48% 51% Proximity to family/friends 20% 13% 23% 36 24% Price or terms of sale 44% 39% 42% 45% 50% Property taxes 16% 15% 20% 15% 14% N37 1565 428 304 421 412 Median Years Land in Family at Time of Acquisition (inheritors only) 68 70 60 50 50
N 406 85 170 75 76 35 Because recreational use frequently overlaps with the other uses listed above, the survey asked not for a percent of land in the use but simply whether or not the land was used for recreation, by the owners or by others. 36 Question not asked in Portland survey. 37 N represents all those who were asked this series of questions, including “don’t know” or “refused” responses, though percentages exclude those with these responses.
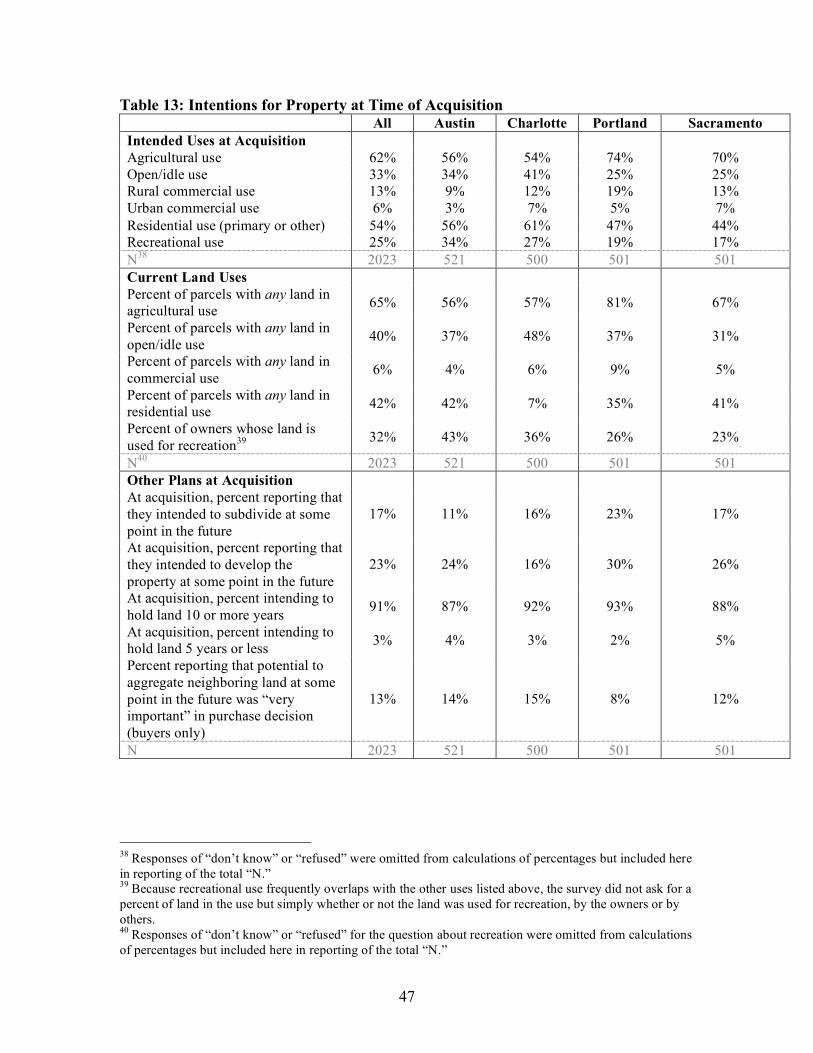
47
Table 13: Intentions for Property at Time of Acquisition All Austin Charlotte Portland Sacramento Intended Uses at Acquisition Agricultural use 62% 56% 54% 74% 70% Open/idle use 33% 34% 41% 25% 25% Rural commercial use 13% 9% 12% 19% 13% Urban commercial use 6% 3% 7% 5% 7% Residential use (primary or other) 54% 56% 61% 47% 44% Recreational use 25% 34% 27% 19% 17% N38 2023 521 500 501 501 Current Land Uses Percent of parcels with any land in agricultural use 65% 56% 57% 81% 67%
Percent of parcels with any land in open/idle use 40% 37% 48% 37% 31%
Percent of parcels with any land in commercial use 6% 4% 6% 9% 5%
Percent of parcels with any land in residential use 42% 42% 7% 35% 41%
Percent of owners whose land is used for recreation39 32% 43% 36% 26% 23%
N40 2023 521 500 501 501 Other Plans at Acquisition At acquisition, percent reporting that they intended to subdivide at some point in the future
17% 11% 16% 23% 17%
At acquisition, percent reporting that they intended to develop the property at some point in the future
23% 24% 16% 30% 26%
At acquisition, percent intending to hold land 10 or more years 91% 87% 92% 93% 88%
At acquisition, percent intending to hold land 5 years or less 3% 4% 3% 2% 5%
Percent reporting that potential to aggregate neighboring land at some point in the future was “very important” in purchase decision (buyers only)
13% 14% 15% 8% 12%
N 2023 521 500 501 501
38 Responses of “don’t know” or “refused” were omitted from calculations of percentages but included here in reporting of the total “N.” 39 Because recreational use frequently overlaps with the other uses listed above, the survey did not ask for a percent of land in the use but simply whether or not the land was used for recreation, by the owners or by others. 40 Responses of “don’t know” or “refused” for the question about recreation were omitted from calculations of percentages but included here in reporting of the total “N.”
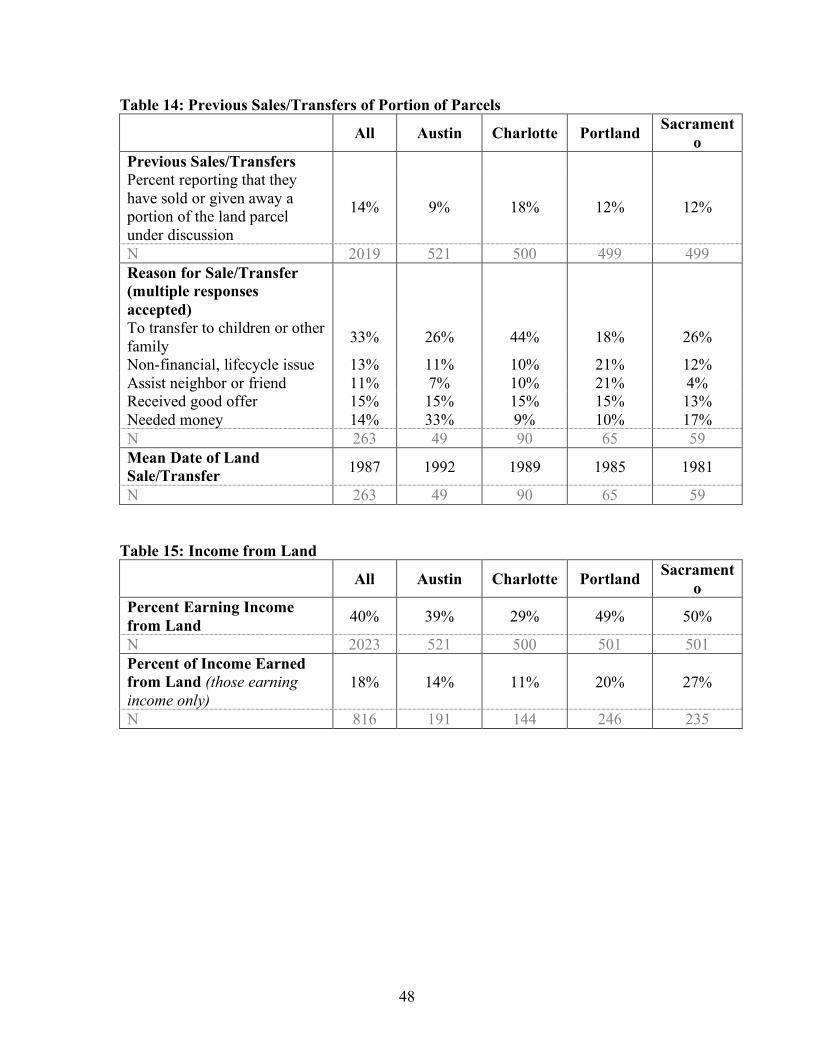
48
Table 14: Previous Sales/Transfers of Portion of Parcels
All Austin Charlotte Portland Sacramento
Previous Sales/Transfers Percent reporting that they have sold or given away a portion of the land parcel under discussion
14% 9% 18% 12% 12%
N 2019 521 500 499 499 Reason for Sale/Transfer (multiple responses accepted)
To transfer to children or other family 33% 26% 44% 18% 26%
Non-financial, lifecycle issue 13% 11% 10% 21% 12% Assist neighbor or friend 11% 7% 10% 21% 4% Received good offer 15% 15% 15% 15% 13% Needed money 14% 33% 9% 10% 17% N 263 49 90 65 59 Mean Date of Land Sale/Transfer 1987 1992 1989 1985 1981
N 263 49 90 65 59 Table 15: Income from Land
All Austin Charlotte Portland Sacramento
Percent Earning Income from Land 40% 39% 29% 49% 50%
N 2023 521 500 501 501 Percent of Income Earned from Land (those earning income only)
18% 14% 11% 20% 27%
N 816 191 144 246 235
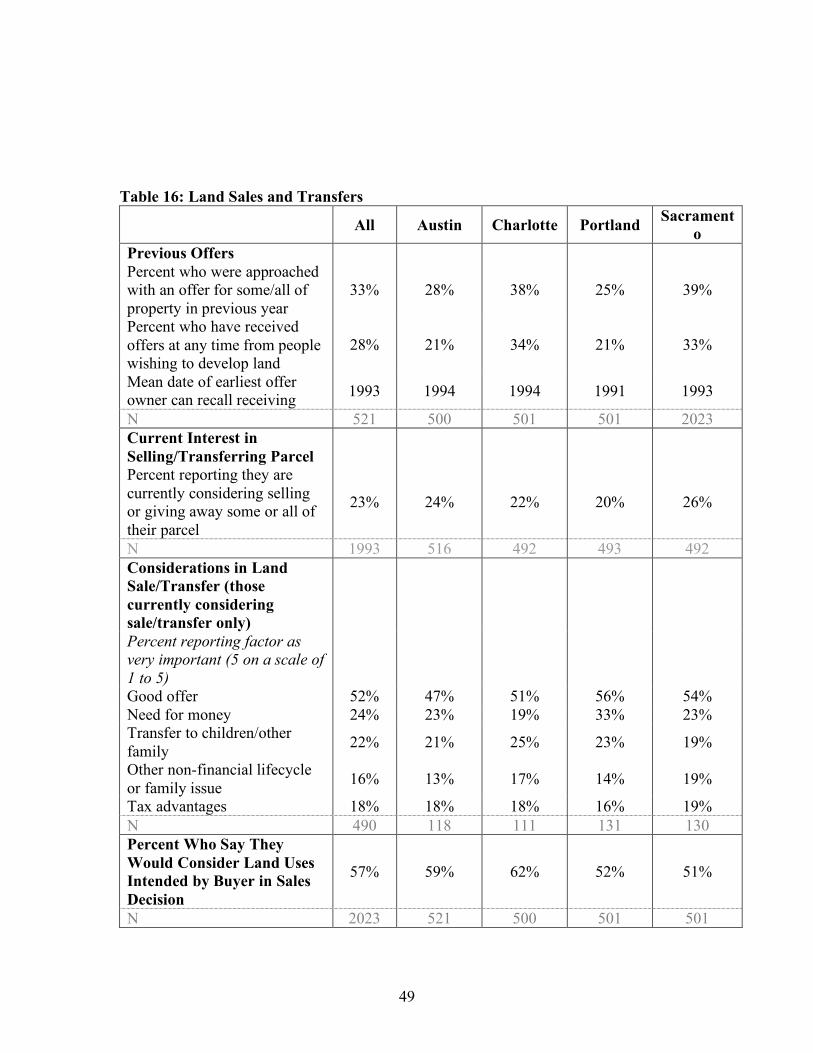
49
Table 16: Land Sales and Transfers
All Austin Charlotte Portland Sacramento
Previous Offers Percent who were approached with an offer for some/all of property in previous year
33% 28% 38% 25% 39%
Percent who have received offers at any time from people wishing to develop land
28% 21% 34% 21% 33%
Mean date of earliest offer owner can recall receiving 1993 1994 1994 1991 1993
N 521 500 501 501 2023 Current Interest in Selling/Transferring Parcel
Percent reporting they are currently considering selling or giving away some or all of their parcel
23% 24% 22% 20% 26%
N 1993 516 492 493 492 Considerations in Land Sale/Transfer (those currently considering sale/transfer only)
Percent reporting factor as very important (5 on a scale of 1 to 5)
Good offer 52% 47% 51% 56% 54% Need for money 24% 23% 19% 33% 23% Transfer to children/other family 22% 21% 25% 23% 19%
Other non-financial lifecycle or family issue 16% 13% 17% 14% 19%
Tax advantages 18% 18% 18% 16% 19% N 490 118 111 131 130 Percent Who Say They Would Consider Land Uses Intended by Buyer in Sales Decision
57% 59% 62% 52% 51%
N 2023 521 500 501 501
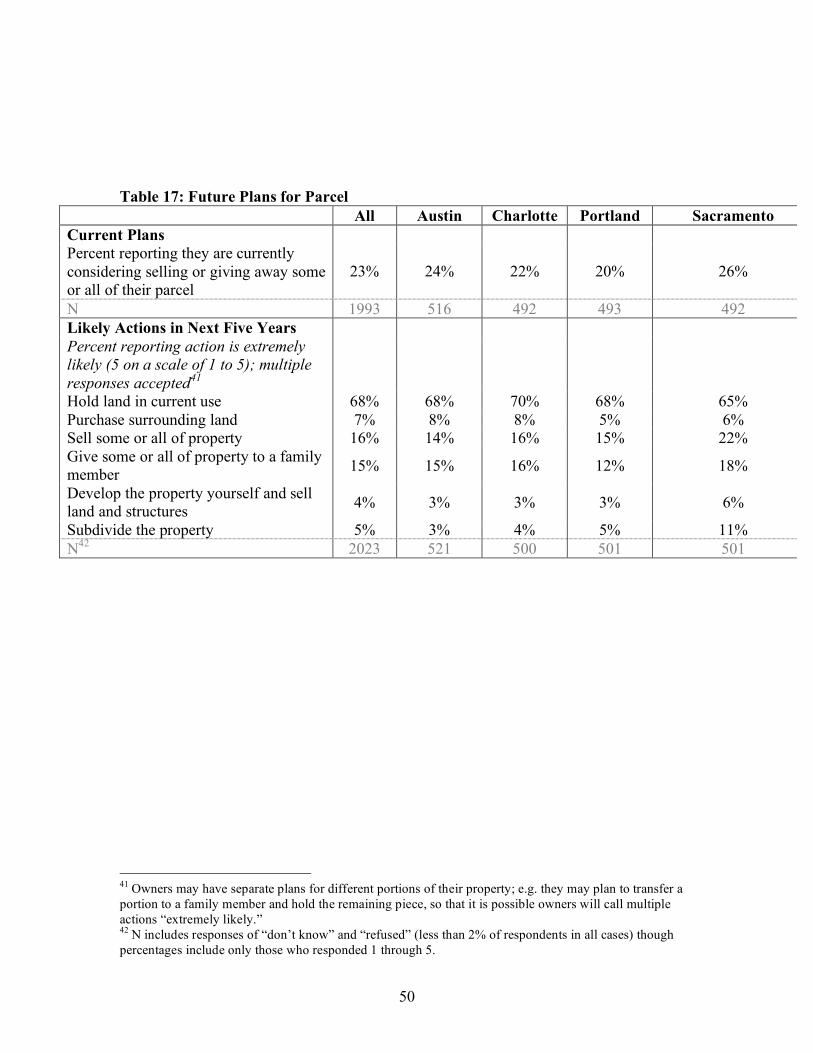
50
Table 17: Future Plans for Parcel
All Austin Charlotte Portland Sacramento Current Plans Percent reporting they are currently considering selling or giving away some or all of their parcel
23% 24% 22% 20% 26%
N 1993 516 492 493 492 Likely Actions in Next Five Years Percent reporting action is extremely likely (5 on a scale of 1 to 5); multiple responses accepted41
Hold land in current use 68% 68% 70% 68% 65% Purchase surrounding land 7% 8% 8% 5% 6% Sell some or all of property 16% 14% 16% 15% 22% Give some or all of property to a family member 15% 15% 16% 12% 18%
Develop the property yourself and sell land and structures 4% 3% 3% 3% 6%
Subdivide the property 5% 3% 4% 5% 11% N42 2023 521 500 501 501
41 Owners may have separate plans for different portions of their property; e.g. they may plan to transfer a portion to a family member and hold the remaining piece, so that it is possible owners will call multiple actions “extremely likely.” 42 N includes responses of “don’t know” and “refused” (less than 2% of respondents in all cases) though percentages include only those who responded 1 through 5.
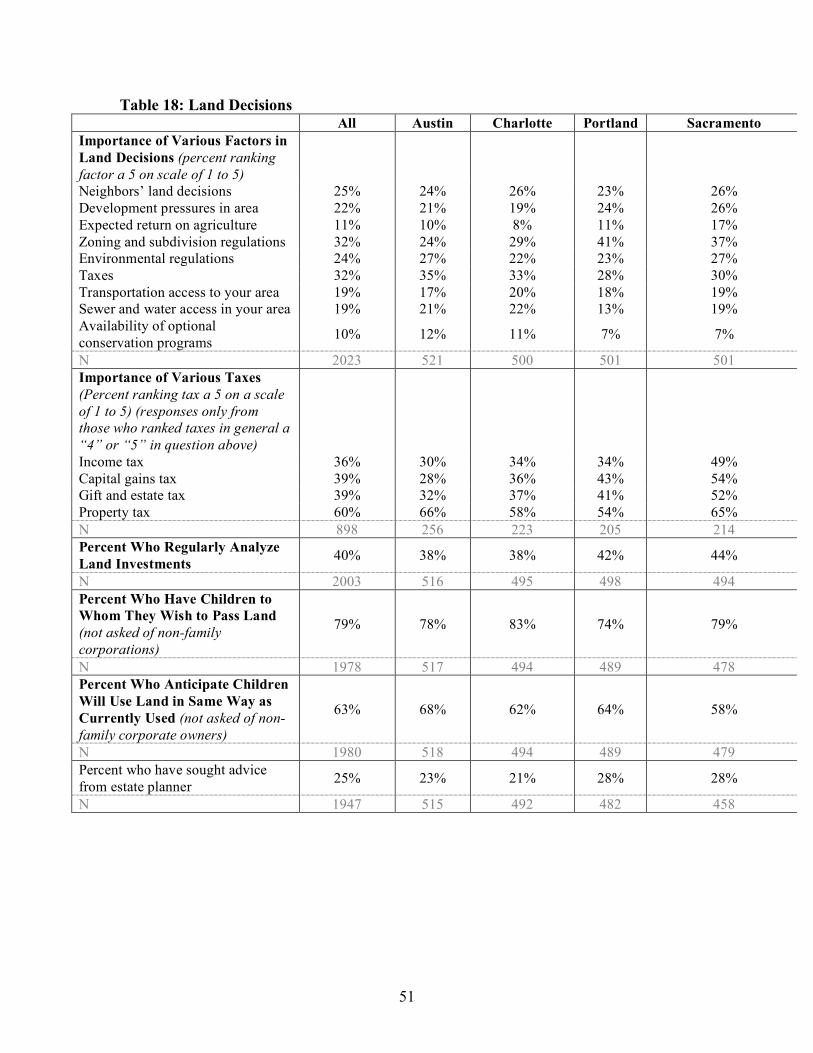
51
Table 18: Land Decisions All Austin Charlotte Portland Sacramento Importance of Various Factors in Land Decisions (percent ranking factor a 5 on scale of 1 to 5)
Neighbors’ land decisions 25% 24% 26% 23% 26% Development pressures in area 22% 21% 19% 24% 26% Expected return on agriculture 11% 10% 8% 11% 17% Zoning and subdivision regulations 32% 24% 29% 41% 37% Environmental regulations 24% 27% 22% 23% 27% Taxes 32% 35% 33% 28% 30% Transportation access to your area 19% 17% 20% 18% 19% Sewer and water access in your area 19% 21% 22% 13% 19% Availability of optional conservation programs 10% 12% 11% 7% 7%
N 2023 521 500 501 501 Importance of Various Taxes (Percent ranking tax a 5 on a scale of 1 to 5) (responses only from those who ranked taxes in general a “4” or “5” in question above)
Income tax 36% 30% 34% 34% 49% Capital gains tax 39% 28% 36% 43% 54% Gift and estate tax 39% 32% 37% 41% 52% Property tax 60% 66% 58% 54% 65% N 898 256 223 205 214 Percent Who Regularly Analyze Land Investments 40% 38% 38% 42% 44%
N 2003 516 495 498 494 Percent Who Have Children to Whom They Wish to Pass Land (not asked of non-family corporations)
79% 78% 83% 74% 79%
N 1978 517 494 489 478 Percent Who Anticipate Children Will Use Land in Same Way as Currently Used (not asked of non-family corporate owners)
63% 68% 62% 64% 58%
N 1980 518 494 489 479 Percent who have sought advice from estate planner 25% 23% 21% 28% 28%
N 1947 515 492 482 458
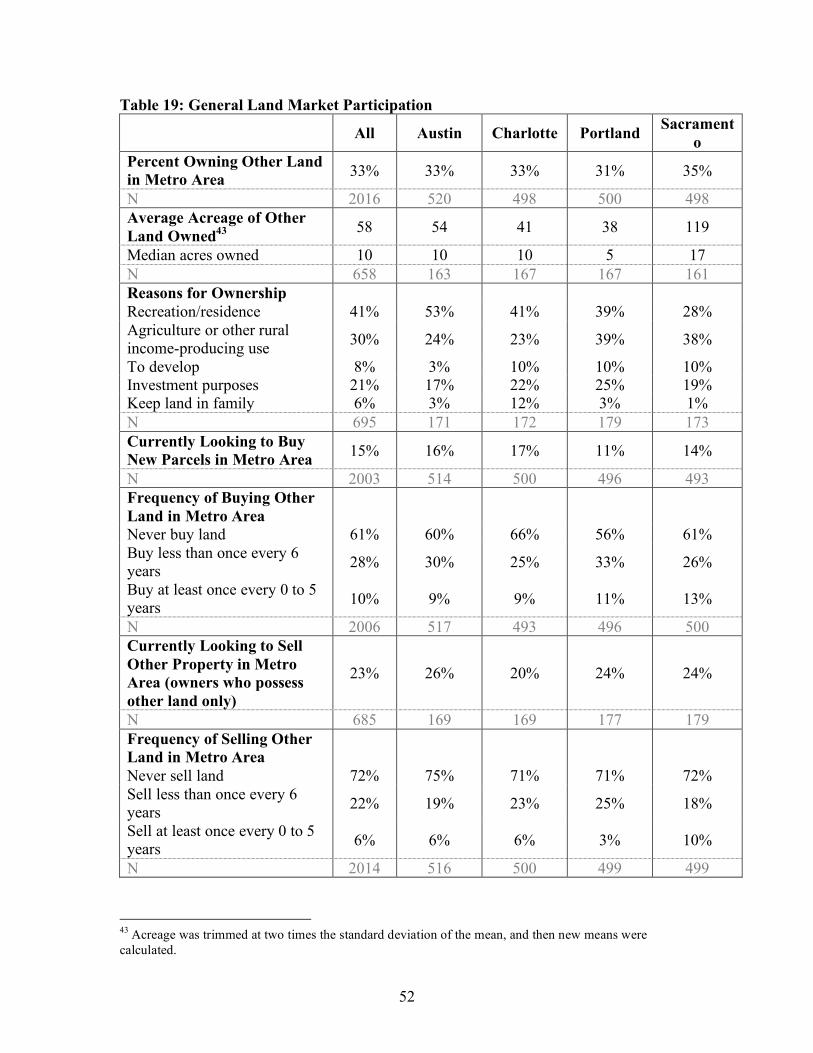
52
Table 19: General Land Market Participation All Austin Charlotte Portland Sacrament
o Percent Owning Other Land in Metro Area 33% 33% 33% 31% 35%
N 2016 520 498 500 498 Average Acreage of Other Land Owned43 58 54 41 38 119
Median acres owned 10 10 10 5 17 N 658 163 167 167 161 Reasons for Ownership Recreation/residence 41% 53% 41% 39% 28% Agriculture or other rural income-producing use 30% 24% 23% 39% 38%
To develop 8% 3% 10% 10% 10% Investment purposes 21% 17% 22% 25% 19% Keep land in family 6% 3% 12% 3% 1% N 695 171 172 179 173 Currently Looking to Buy New Parcels in Metro Area 15% 16% 17% 11% 14%
N 2003 514 500 496 493 Frequency of Buying Other Land in Metro Area
Never buy land 61% 60% 66% 56% 61% Buy less than once every 6 years 28% 30% 25% 33% 26%
Buy at least once every 0 to 5 years 10% 9% 9% 11% 13%
N 2006 517 493 496 500 Currently Looking to Sell Other Property in Metro Area (owners who possess other land only)
23% 26% 20% 24% 24%
N 685 169 169 177 179 Frequency of Selling Other Land in Metro Area
Never sell land 72% 75% 71% 71% 72% Sell less than once every 6 years 22% 19% 23% 25% 18%
Sell at least once every 0 to 5 years 6% 6% 6% 3% 10%
N 2014 516 500 499 499
43 Acreage was trimmed at two times the standard deviation of the mean, and then new means were calculated.
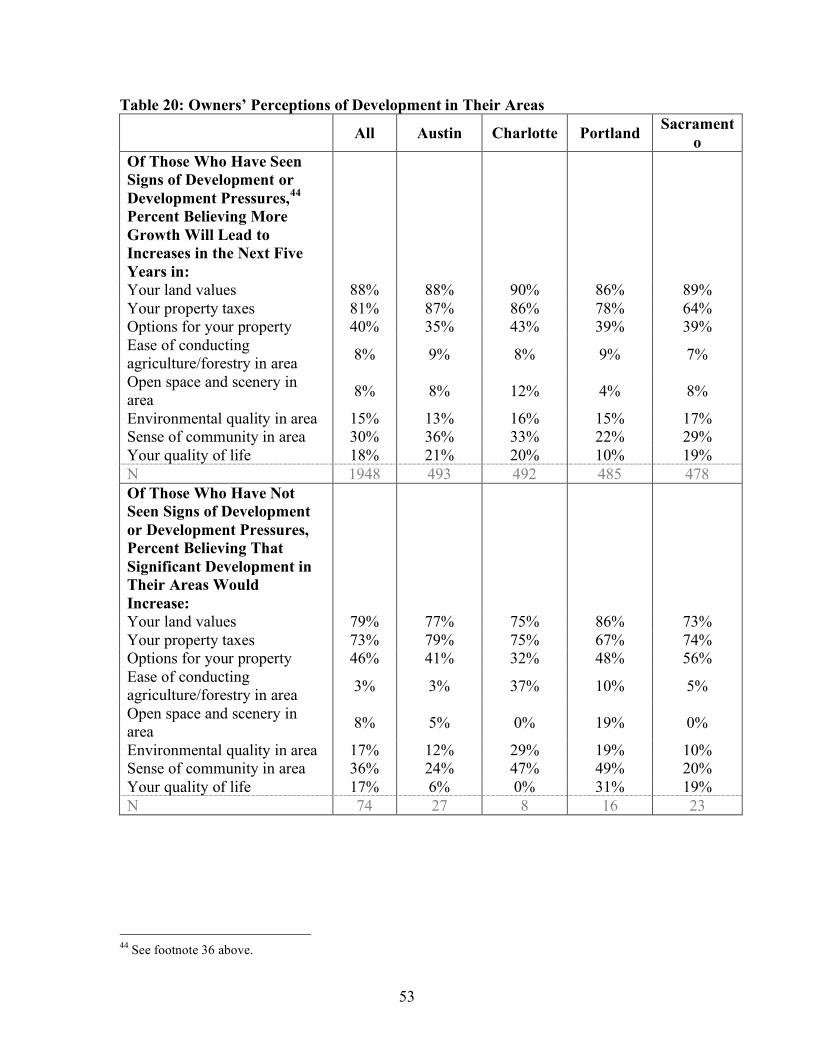
53
Table 20: Owners’ Perceptions of Development in Their Areas
All Austin Charlotte Portland Sacramento
Of Those Who Have Seen Signs of Development or Development Pressures,44 Percent Believing More Growth Will Lead to Increases in the Next Five Years in:
Your land values 88% 88% 90% 86% 89% Your property taxes 81% 87% 86% 78% 64% Options for your property 40% 35% 43% 39% 39% Ease of conducting agriculture/forestry in area 8% 9% 8% 9% 7%
Open space and scenery in area 8% 8% 12% 4% 8%
Environmental quality in area 15% 13% 16% 15% 17% Sense of community in area 30% 36% 33% 22% 29% Your quality of life 18% 21% 20% 10% 19% N 1948 493 492 485 478 Of Those Who Have Not Seen Signs of Development or Development Pressures, Percent Believing That Significant Development in Their Areas Would Increase:
Your land values 79% 77% 75% 86% 73% Your property taxes 73% 79% 75% 67% 74% Options for your property 46% 41% 32% 48% 56% Ease of conducting agriculture/forestry in area 3% 3% 37% 10% 5%
Open space and scenery in area 8% 5% 0% 19% 0%
Environmental quality in area 17% 12% 29% 19% 10% Sense of community in area 36% 24% 47% 49% 20% Your quality of life 17% 6% 0% 31% 19% N 74 27 8 16 23
44 See footnote 36 above.
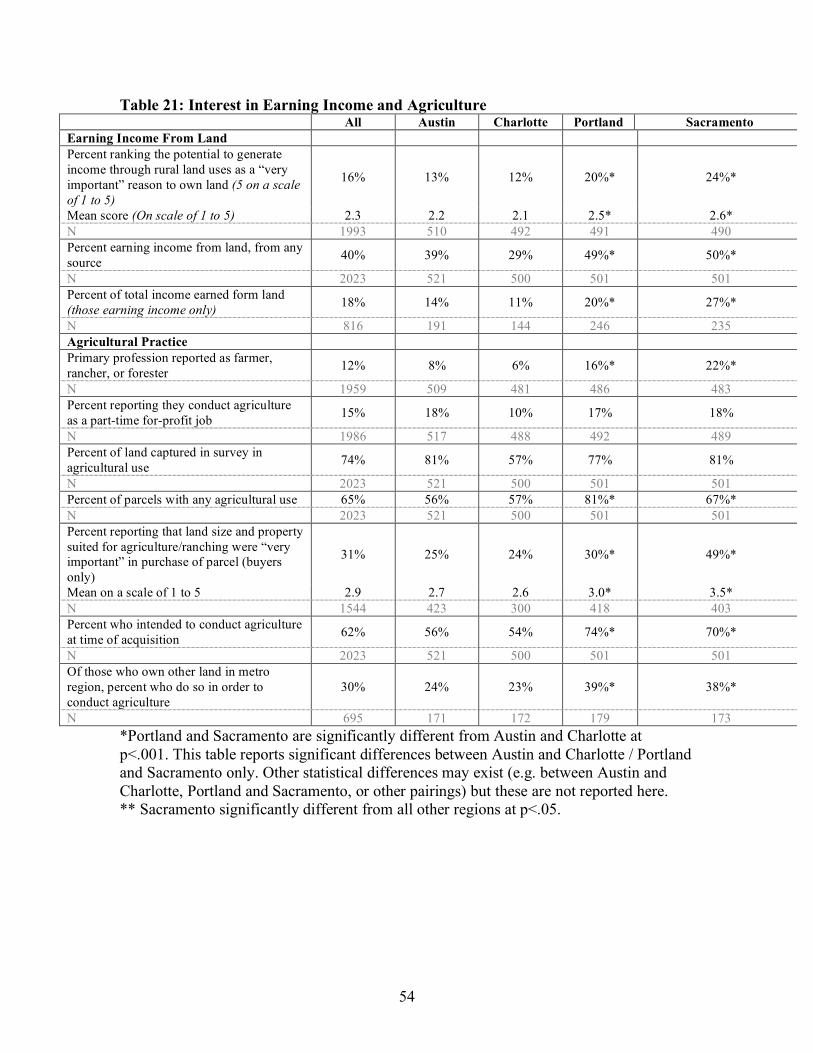
54
Table 21: Interest in Earning Income and Agriculture All Austin Charlotte Portland Sacramento Earning Income From Land Percent ranking the potential to generate income through rural land uses as a “very important” reason to own land (5 on a scale of 1 to 5)
16% 13% 12% 20%* 24%*
Mean score (On scale of 1 to 5) 2.3 2.2 2.1 2.5* 2.6* N 1993 510 492 491 490 Percent earning income from land, from any source 40% 39% 29% 49%* 50%*
N 2023 521 500 501 501 Percent of total income earned form land (those earning income only) 18% 14% 11% 20%* 27%*
N 816 191 144 246 235 Agricultural Practice Primary profession reported as farmer, rancher, or forester 12% 8% 6% 16%* 22%*
N 1959 509 481 486 483 Percent reporting they conduct agriculture as a part-time for-profit job 15% 18% 10% 17% 18%
N 1986 517 488 492 489 Percent of land captured in survey in agricultural use 74% 81% 57% 77% 81%
N 2023 521 500 501 501 Percent of parcels with any agricultural use 65% 56% 57% 81%* 67%* N 2023 521 500 501 501 Percent reporting that land size and property suited for agriculture/ranching were “very important” in purchase of parcel (buyers only)
31% 25% 24% 30%* 49%*
Mean on a scale of 1 to 5 2.9 2.7 2.6 3.0* 3.5* N 1544 423 300 418 403 Percent who intended to conduct agriculture at time of acquisition 62% 56% 54% 74%* 70%*
N 2023 521 500 501 501 Of those who own other land in metro region, percent who do so in order to conduct agriculture
30% 24% 23% 39%* 38%*
N 695 171 172 179 173 *Portland and Sacramento are significantly different from Austin and Charlotte at p<.001. This table reports significant differences between Austin and Charlotte / Portland and Sacramento only. Other statistical differences may exist (e.g. between Austin and Charlotte, Portland and Sacramento, or other pairings) but these are not reported here. ** Sacramento significantly different from all other regions at p<.05.
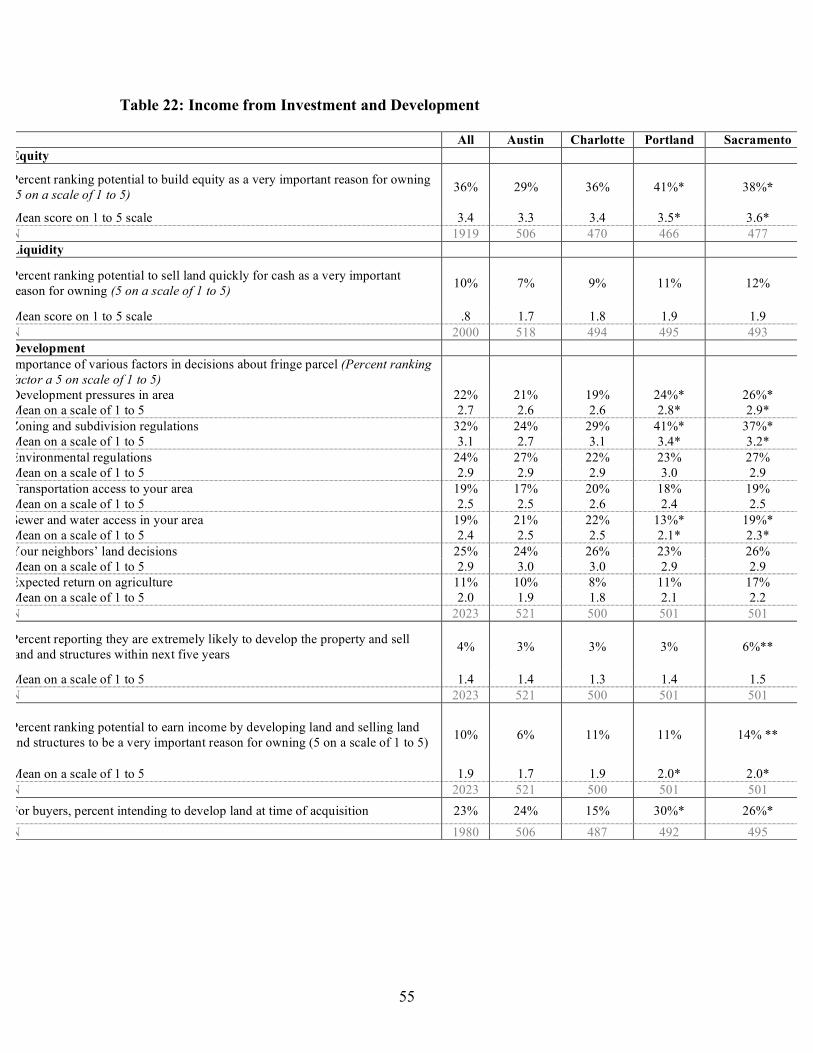
55
Table 22: Income from Investment and Development
All Austin Charlotte Portland Sacramento Equity
Percent ranking potential to build equity as a very important reason for owning (5 on a scale of 1 to 5)
36%
29% 36% 41%* 38%*
Mean score on 1 to 5 scale 3.4 3.3 3.4 3.5* 3.6* N 1919 506 470 466 477 Liquidity
Percent ranking potential to sell land quickly for cash as a very important reason for owning (5 on a scale of 1 to 5) 10% 7% 9% 11% 12%
Mean score on 1 to 5 scale .8 1.7 1.8 1.9 1.9 N 2000 518 494 495 493 Development Importance of various factors in decisions about fringe parcel (Percent ranking factor a 5 on scale of 1 to 5)
Development pressures in area 22% 21% 19% 24%* 26%* Mean on a scale of 1 to 5 2.7 2.6 2.6 2.8* 2.9* Zoning and subdivision regulations 32% 24% 29% 41%* 37%* Mean on a scale of 1 to 5 3.1 2.7 3.1 3.4* 3.2* Environmental regulations 24% 27% 22% 23% 27% Mean on a scale of 1 to 5 2.9 2.9 2.9 3.0 2.9 Transportation access to your area 19% 17% 20% 18% 19% Mean on a scale of 1 to 5 2.5 2.5 2.6 2.4 2.5 Sewer and water access in your area 19% 21% 22% 13%* 19%* Mean on a scale of 1 to 5 2.4 2.5 2.5 2.1* 2.3* Your neighbors’ land decisions 25% 24% 26% 23% 26% Mean on a scale of 1 to 5 2.9 3.0 3.0 2.9 2.9 Expected return on agriculture 11% 10% 8% 11% 17% Mean on a scale of 1 to 5 2.0 1.9 1.8 2.1 2.2 N 2023 521 500 501 501
Percent reporting they are extremely likely to develop the property and sell land and structures within next five years 4% 3% 3% 3% 6%**
Mean on a scale of 1 to 5 1.4 1.4 1.3 1.4 1.5 N 2023 521 500 501 501
Percent ranking potential to earn income by developing land and selling land and structures to be a very important reason for owning (5 on a scale of 1 to 5) 10% 6% 11% 11% 14% **
Mean on a scale of 1 to 5 1.9 1.7 1.9 2.0* 2.0* N 2023 521 500 501 501 For buyers, percent intending to develop land at time of acquisition 23% 24% 15% 30%* 26%* N 1980 506 487 492 495
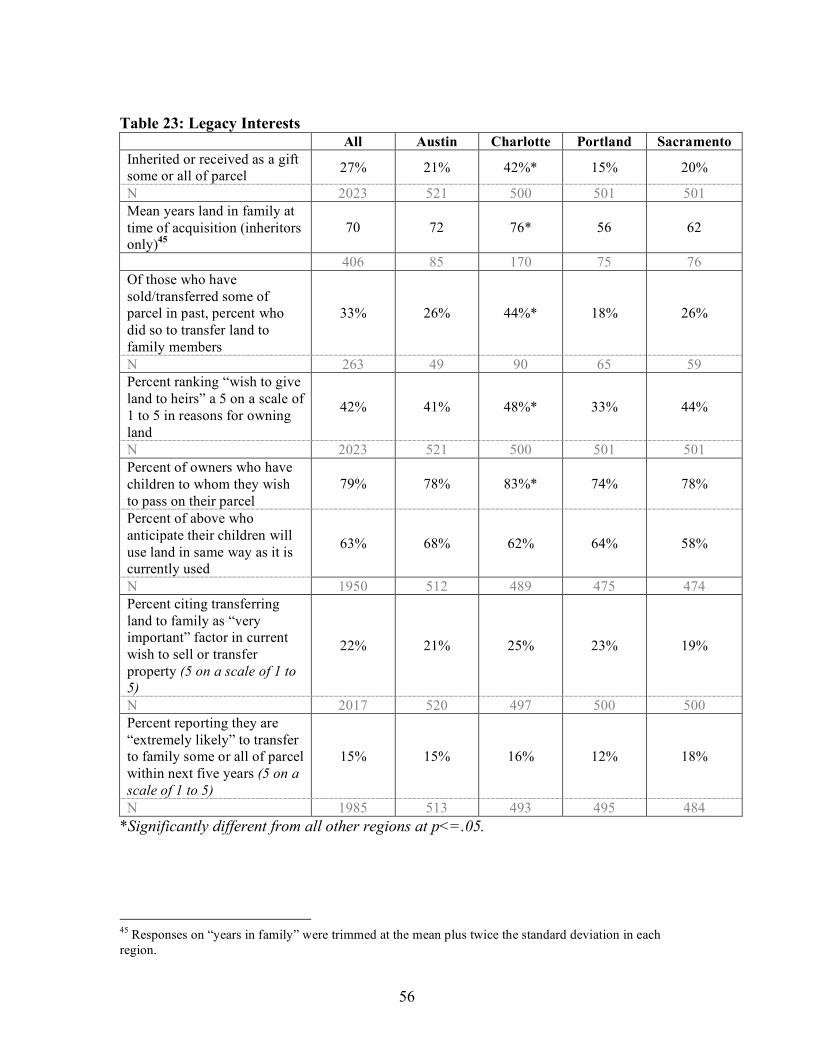
56
Table 23: Legacy Interests
All Austin Charlotte Portland Sacramento Inherited or received as a gift some or all of parcel 27% 21% 42%* 15% 20%
N 2023 521 500 501 501 Mean years land in family at time of acquisition (inheritors only)45
70 72 76* 56 62
406 85 170 75 76 Of those who have sold/transferred some of parcel in past, percent who did so to transfer land to family members
33% 26% 44%* 18% 26%
N 263 49 90 65 59 Percent ranking “wish to give land to heirs” a 5 on a scale of 1 to 5 in reasons for owning land
42% 41% 48%* 33% 44%
N 2023 521 500 501 501 Percent of owners who have children to whom they wish to pass on their parcel
79% 78% 83%* 74% 78%
Percent of above who anticipate their children will use land in same way as it is currently used
63% 68% 62% 64% 58%
N 1950 512 489 475 474 Percent citing transferring land to family as “very important” factor in current wish to sell or transfer property (5 on a scale of 1 to 5)
22% 21% 25% 23% 19%
N 2017 520 497 500 500 Percent reporting they are “extremely likely” to transfer to family some or all of parcel within next five years (5 on a scale of 1 to 5)
15% 15% 16% 12% 18%
N 1985 513 493 495 484 *Significantly different from all other regions at p<=.05.
45 Responses on “years in family” were trimmed at the mean plus twice the standard deviation in each region.
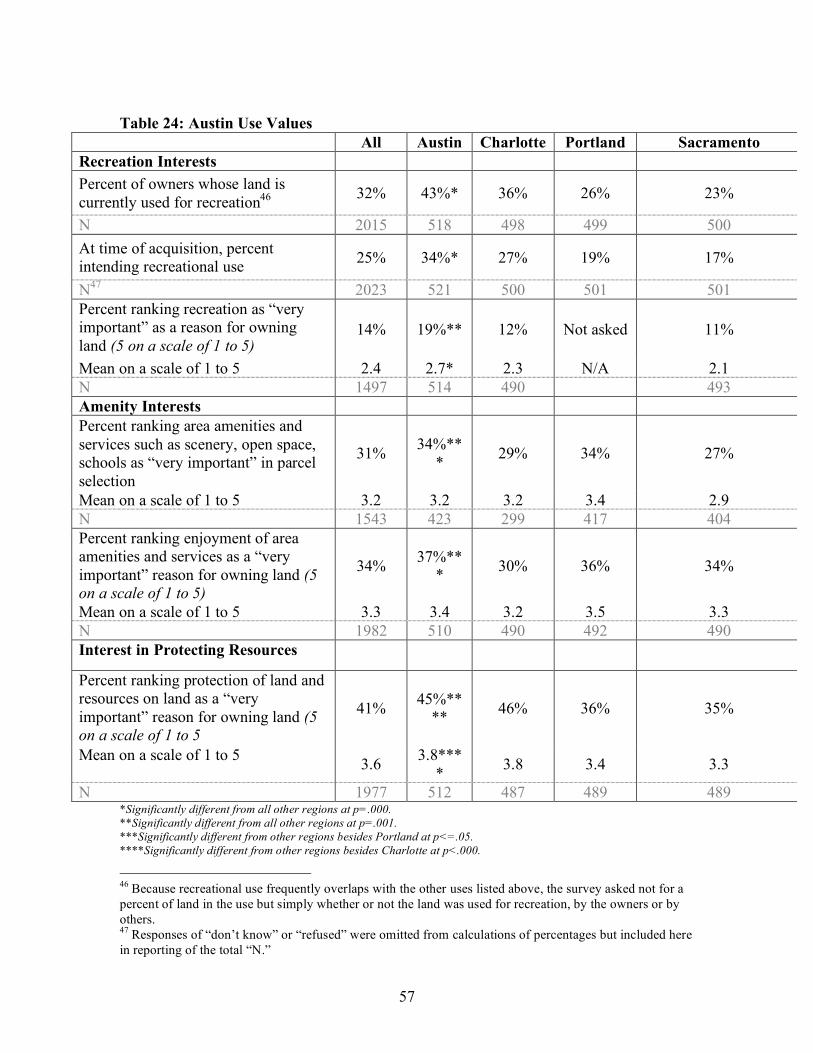
57
Table 24: Austin Use Values
All Austin Charlotte Portland Sacramento Recreation Interests Percent of owners whose land is currently used for recreation46 32% 43%* 36% 26% 23%
N 2015 518 498 499 500 At time of acquisition, percent intending recreational use 25% 34%* 27% 19% 17%
N47 2023 521 500 501 501 Percent ranking recreation as “very important” as a reason for owning land (5 on a scale of 1 to 5)
14% 19%** 12% Not asked 11%
Mean on a scale of 1 to 5 2.4 2.7* 2.3 N/A 2.1 N 1497 514 490 493 Amenity Interests Percent ranking area amenities and services such as scenery, open space, schools as “very important” in parcel selection
31% 34%*** 29% 34% 27%
Mean on a scale of 1 to 5 3.2 3.2 3.2 3.4 2.9 N 1543 423 299 417 404 Percent ranking enjoyment of area amenities and services as a “very important” reason for owning land (5 on a scale of 1 to 5)
34% 37%*** 30% 36% 34%
Mean on a scale of 1 to 5 3.3 3.4 3.2 3.5 3.3 N 1982 510 490 492 490 Interest in Protecting Resources Percent ranking protection of land and resources on land as a “very important” reason for owning land (5 on a scale of 1 to 5
41% 45%**** 46% 36% 35%
Mean on a scale of 1 to 5 3.6 3.8**** 3.8 3.4 3.3
N 1977 512 487 489 489 *Significantly different from all other regions at p=.000. **Significantly different from all other regions at p=.001. ***Significantly different from other regions besides Portland at p<=.05. ****Significantly different from other regions besides Charlotte at p<.000.
46 Because recreational use frequently overlaps with the other uses listed above, the survey asked not for a percent of land in the use but simply whether or not the land was used for recreation, by the owners or by others. 47 Responses of “don’t know” or “refused” were omitted from calculations of percentages but included here in reporting of the total “N.”
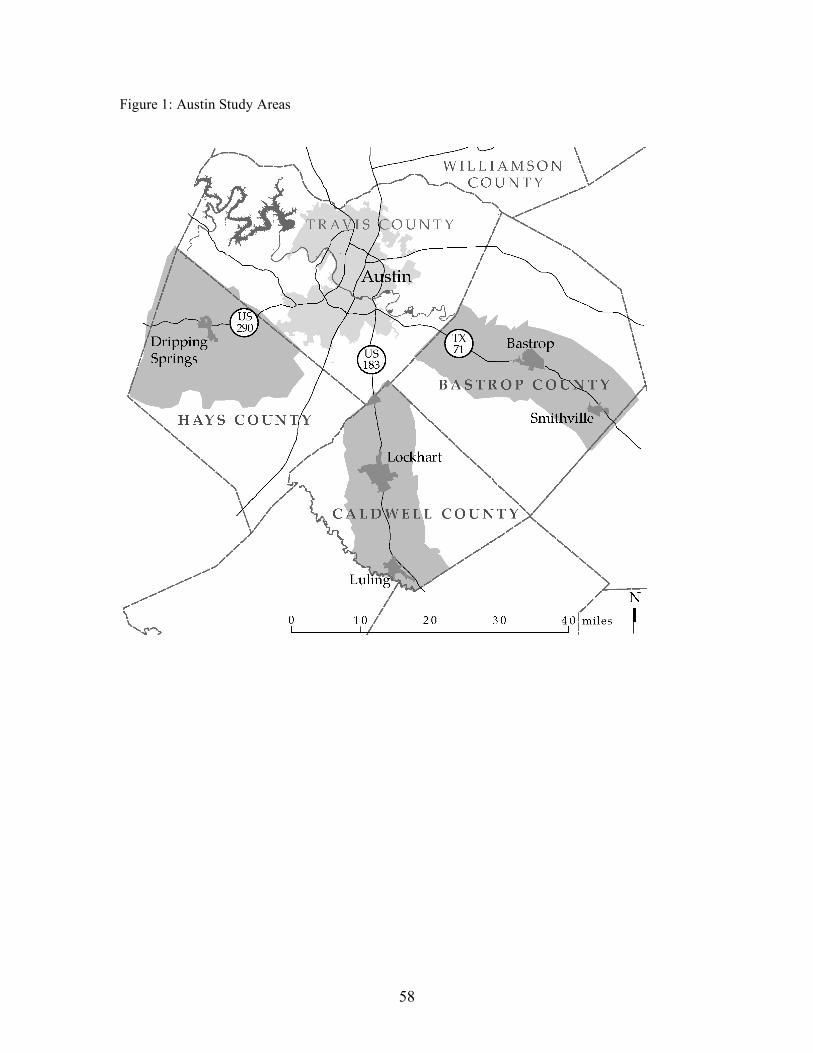
58
Figure 1: Austin Study Areas
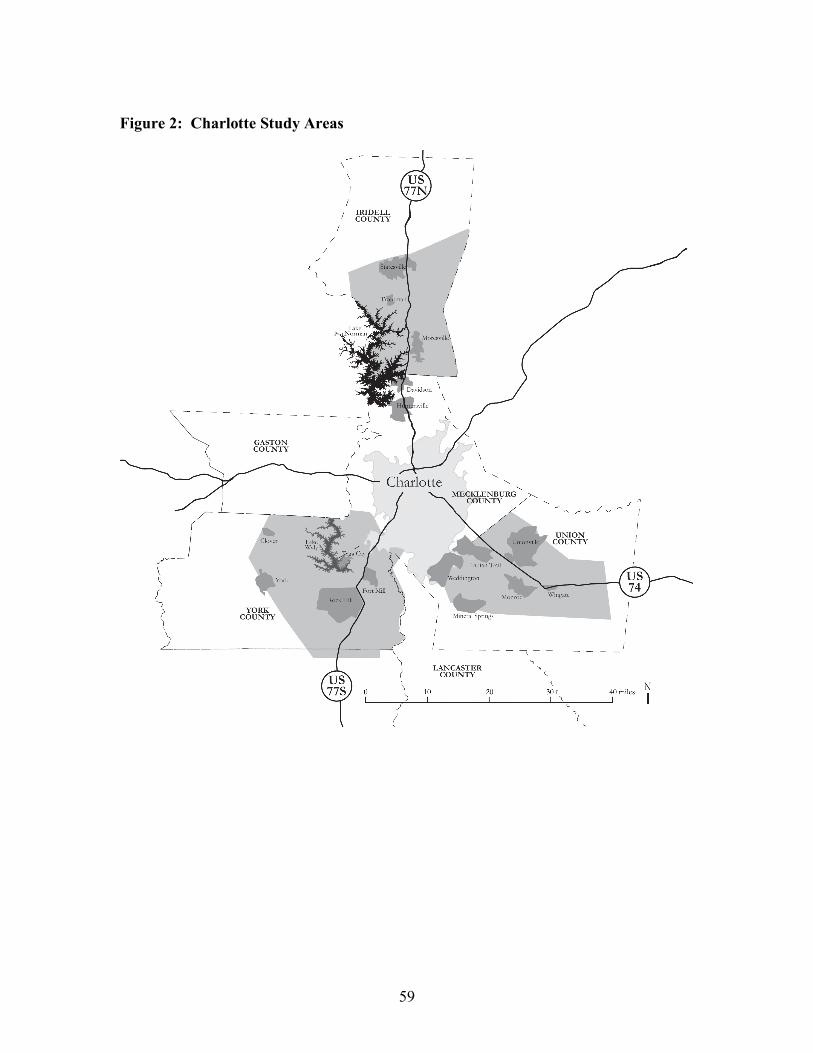
59
Figure 2: Charlotte Study Areas
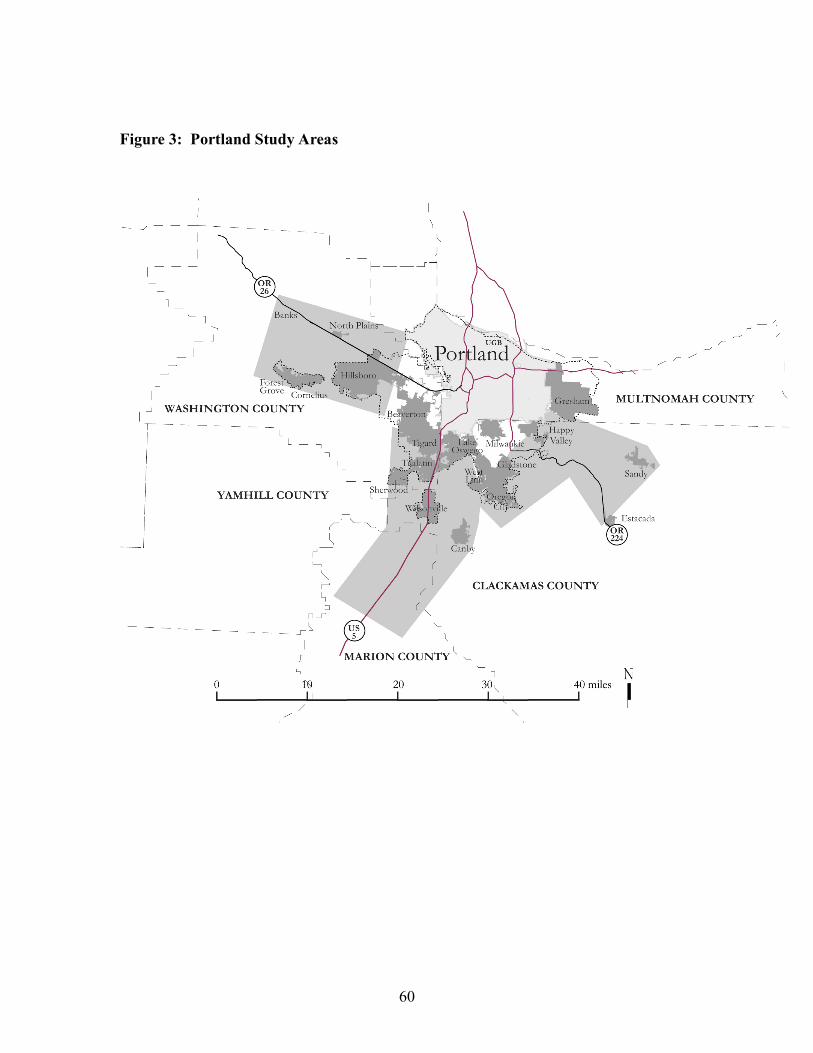
60
Figure 3: Portland Study Areas
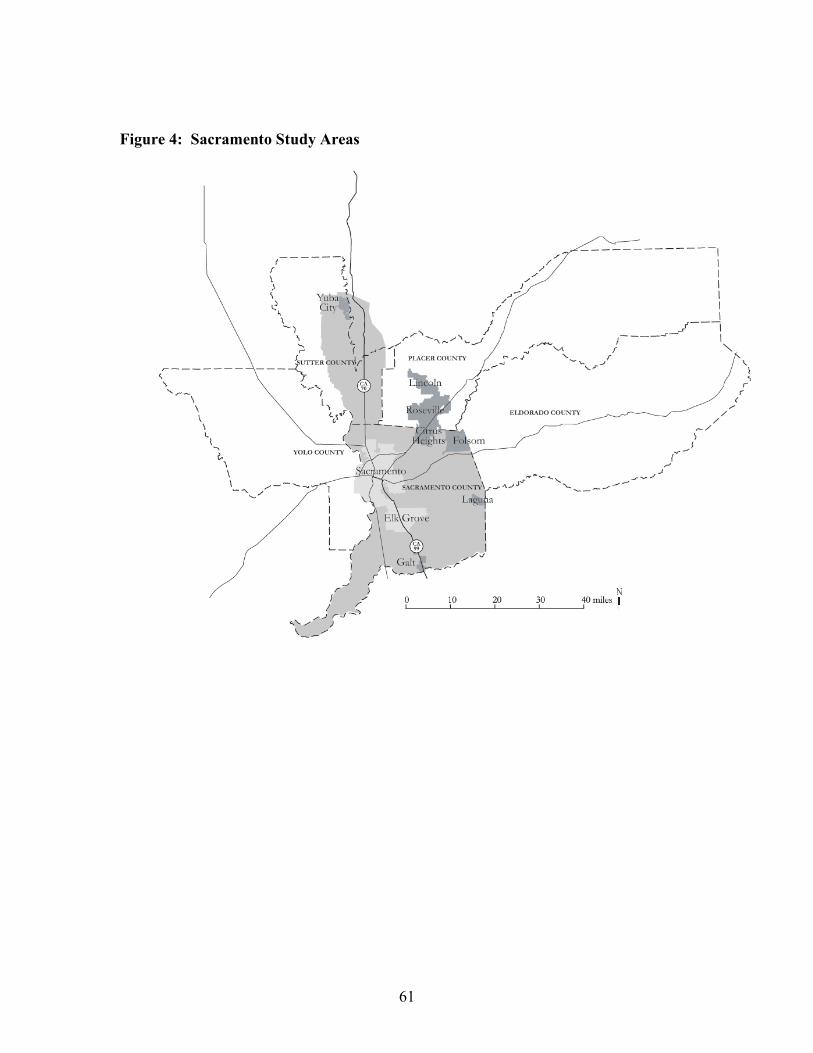
61
Figure 4: Sacramento Study Areas
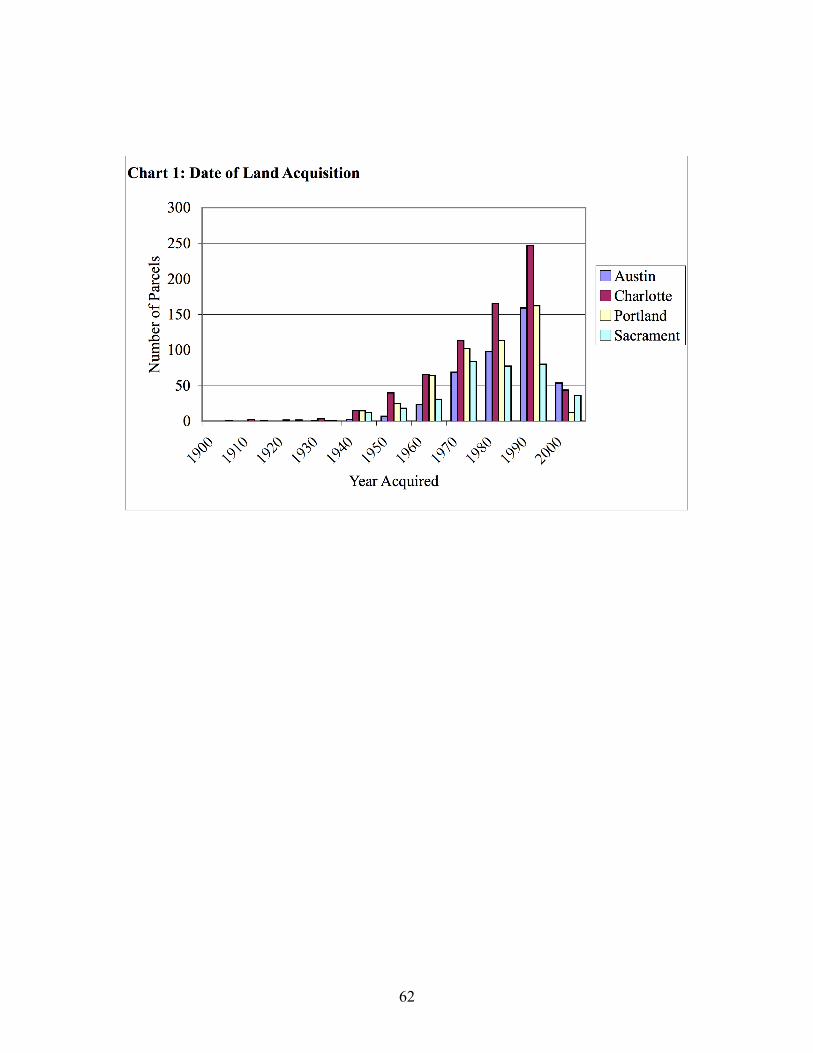
62
63
References
Adams, C., & May, H.. (1991). Active and Passive Behaviour in Land Ownership. Urban Studies, 28 (5), 687-705. The Appalachian Land Ownership Task Force. (1983). Who Owns Appalachia? Land Ownership and Its Impact. Lexington, KY: The University of Kentucky. Arnott, R., & Lewis, F. (1979). The Transition of Land to Urban Uses. The Journal of Political Economy, 87(1), 161-169. Audirac, I. (1999). Unsettled views about the fringe: rural-urban or urban-rural frontiers? In O. Furuseth and M. Lapping (Eds.), Contested Countryside: The Rural Urban Fringe in North America (pp. 7-32). Aldershot, England: Ashgate Publishing Ltd. Baerwald, T. (1981). The Site Selection Process of Suburban Residential Builders. Urban Geography 2(4), 339-357. Bancroft, R., Sinclair, R. & Tremblay, R. (1977). Attitudes toward preserving agricultural land in Vermont. Burlington, Vermont: University of Vermont, Agricultural Experiment Station, Miscellaneous Publication 93. Barrett, S., & Healey, P. (1985). Priorities for Research in Land Policy. In S. Barrett and P. Healey (Eds.), Land Policy: Problems and Alternatives (347-367). Aldershot, England: Gower Publishing. Batabyal, A. (2000). An Optimal Stopping Approach to Land Development Under Uncertainty. The Annals of Regional Science, 34, 147-156. Blumenfeld, H. (1954). The Tidal Wave of Metropolitan Expansion. Journal of the American Institute of Planners, 10, 3-14. Breyer, M. (2003). A burden and a blessing: Signs show area's growth may be at a standstill. Austin American-Statesman, March 1. Brown, H., Phillips, R., & Roberts, N. (1980) Land Ownership and Market Dynamics at the Urban Periphery. Discussion Paper D80-9, Urban Planning, Policy Analysis, and Administration, John F. Kennedy School of Government. Brown, H., Phillips, R., & Roberts, N. (1981). Land Markets at the Urban Fringe. Journal of the American Planning Association, 47(2), 131-144. Bryant, C., Russwurm, L, & McLellan, A. (1982). The City’s Countryside: Land and its Management in the Rural-Urban Fringe. London: Longman Group Limited.
64
Bunce, M. (1985). Urban Fringe Series: Agricultural Land as a Real Estate Commodity: Implications for Farmland Preservation in the North American Urban Fringe. Landscape Planning, 12, 177-192. Clawson, M. (1962).Urban Sprawl and Speculation in Suburban Land. Land Economics, 38(2), 99-111. Clawson, M. (1971). Suburban Land Conversion in the United States: An Economic and Governmental Process. Baltimore: Johns Hopkins University Press, 1973. Conrad, J. and D. LeBlanc. (1979). The Supply of Development Rights: Results from a Survey in Hadley, Massachusetts. Land Economics 55, 269-276. Coughlin, R. (1985). Land Ownership, Use and Regulation: A Case Study Analysis of a Township in the Early Stages of Urban Development. Landscape Planning, 12, 125-140. Daniels, T. (1999). When City and Country Collide: Managing Growth in the Metropolitan Fringe. Washington, DC: Island Press. Davis, J. (1991). Contested Ground: Collective Action and the Urban Neighborhood. Ithaca: Cornell University Press. Davis, J., Nelson, A., and Dueker, K. (1994). The New Burbs: The Exurbs and their Implications for Planning Policy. Journal of the American Planning Association, 60(1), 45-59. Dubbink, D. (1984). I’ll Have My Town Medium Rural, Please. Journal of the American Planning Association, 50(4), 406-418. Evans, A. (1983). The Determination of the Price of Land. Urban Studies, 20, 119-129. Evans, A. (1986). The Supply of Land: A Pedagogic Comment. Urban Studies, 23, 527-530. Evans, S., & Mabbitt, R. (1997). Redefining the Urban Fringe. Town and Country Planning, 66(2), 56-57. Firey, W. (1946). Ecological Considerations in Planning for Rurban-Fringes. American Sociological Review, 11, 411-423. Fulton, W., Pendall, R., Nguyen, M., & Harrison, A. (2001). Who Sprawls Most? How Growth Patterns Differ Across the U.S. Washington, DC: The Brookings Institution Center on Urban & Metropolitan Policy.
65
Galster, G., Hanson, R., Ratcliffe, M., Wolman, H., Coleman, S., & Freihage, J. (2001). Wrestling Sprawl to the Ground: Defining and Measuring an Elusive Concept. Housing Policy Debate 12(4), 681-717. Gan, J., O. Okwudilio, J. Schelhas, G. Wheelock, M. Dubois. (2005). Does Race Matter in Landowners’ Participation in Conservation Incentive Programs? Society and Natural Resources, 18, 431-445. Goodchild, R., & Munton, R. (1985). Development and the Landowner: An Analysis of the British Experience. London: George Allen & Unwin. Hansen, D. and S. Schwartz. 1975. Landowner Behavior at the Rural-Urban Fringe in Response to Preferential Property Taxation. Land Economics 51, 341-354. Hart, J. (1991). The Perimetropolitan Bow Wave. Geographical Review, 81(1), 35-51. Harvey, D. (1966). Theoretical Concepts and the Analysis of Agricultural Land-Use Patterns in Geography. Annals of the Association of American Geographers, 56(2), 361-374. Hawley, A. (1946). Discussion in W. Firey, Ecological Considerations in Planning for Rurban-Fringes, American Sociological Review, 11, 411-23. Healey, P. (1991). Models of the development review process: a review. Journal of Property Research, 8, 219-238. Healey, R., & Short, J. (1979). Rural Land: Market Trends and Planning Implications. Journal of the American Planning Association, 45(3), 305-17. Healy, R., & Short, J. (1981). The Market for Rural Land. Washington, DC: The Conservation Fund. Heimlich, R., & Anderson, W. (2001). Development at the Urban Fringe and Beyond: Impacts on Agriculture and Rural Land. Economic Research Service, US Department of Agriculture. Agricultural Economic Report No. 803. Hrabchak, J. (2005). The Interests of Landowners on the Metropolitan Fringe. Dissertation submitted to MIT Department of Urban Studies and Planning in Fulfillment of the Requirements for the Ph.D. in Urban Planning. Ilbery, B. (1985). Agricultural Geography: A Social and Economic Analysis. Oxford: Oxford University Press. Jacobs, H., &. Moyer, D. (1986). Constructing a National, Rural Land Transfer Data Base. Journal of Soil and Water Conservation, 41(4), 231-234.
66
Kaiser, E., Massie, R., Weiss, S., & Smith, J. (1968). Predicting the Behavior of Predevelopment Landowners on the Urban Fringe. Journal of the American Institute of Planners, 33, 328-333. Kaiser, E., & Weiss, S. (1970). Public Policy and the Residential Development Process. Journal of the American Planning Association, 36(1), 30-37. LaGro, J., & DeGloria, S. (1992). Land use dynamics within an urbanizing non-metropolitan county in New York State (USA). Landscape Ecology, 7(4), 275-289. Langpap, C. (2004). Conservation Incentives Programs for Endangered Species: An Analysis of Landowner Participation. Land Economics. 80(3), 375-388. Lapping, M., & Furuseth, O. (1999). Introduction and Overview. In O. Furuseth & M. Lapping (Eds.), Contested Countryside: The Rural Urban Fringe in North America (pp. 1-5). Aldershot, England: Ashgate Publishing Ltd. Lee, L. (1979). Factors Affecting Land Use Change at the Urban-Rural Fringe. Growth and Change, 10(4), 25-31. Lewis, J. (1980). Landownership in the United States, 1978. Washington: Economics, Statistics, and Cooperatives Service, U.S. Department of Agriculture, Agriculture Information Bulletin no. 435. Leung, H. (1987). Developer behaviour and development control. Land Development Studies, 4, 17-34. Lindeman, B. (1976). Anatomy of Land Speculation. American Institute of Planning Journal, 42(2): 142-152. Logan, J., & Molotch, H. (1987). Urban Fortunes: The Political Economy of Place. Berkeley: University of California Press. Lynch, L. and S. Lovell. (2003). Combining Spatial and Survey Data to Explain Participation in Agricultural Land Preservation Programs. Land Economics 79(2), 259-276. Massie, R. (1968). Landowner Behavior: Factors Influencing the Propensities to Sell Land on the Urban Fringe. Chapel Hill: Center for Urban and Regional Studies, Institute for Research in Social Sciences, University of North Carolina. Molotch, H. (1976). The City as a Growth Machine: Toward a Political Economy of Place. American Journal of Sociology 82(2), 309-330. Morrill, R. (1992). Population Redistribution within Metropolitan Regions in the 1980s: Core, Satellite, and Exurban Growth. Growth and Change, 23(3), 277-302.
67
Nelson, A. (1992). Characterizing Exurbia. Journal of Planning Literature, 6(4), 350-368. Neutze, M. (1987). The Supply of Land for a Particular Use. Urban Studies, 24, 379-388. Patel, D. (1980). Exurbs: Urban Residential Developments in the Countryside. Washington, DC: University Press of America. Phillips, R., Brown, H., & Roberts, N. (1980). Sampling Land and Land Owners. Discussion Paper D80-11, Urban Planning, Policy Analysis, and Administration, John F. Kennedy School of Government. Pond, B., & Yeates, M. (1993). Rural/Urban Land Conversion I: Estimating the Direct and Indirect Impacts. Urban Geography, 14(4), 323-347. Pond, B., & Yeates, M. (1994a). Rural/Urban Land Conversion II: Identifying land in Transition to Urban Use. Urban Geography, 15(1), 25-44. Pond, B., & Yeates, M. (1994b). Rural/Urban Land Conversion III: A Technical Note on Leading Indicators of Urban Land Development. Urban Geography, 15(3), 207-222. Popper, F. (1976). We’ve got to dig deeper into who owns our land. Planning, 42, 17-19. Popper, F. (1978). Commentary: What’s the Hidden Factor in Land Use Regulation? Urban Land, 37(11), 4-6. Popper, F. (1981). Why We Should Care About Who Owns the Land. American Land Forum Magazine, 2, 15-19. Pryor, R. (1968). Defining the Rural-Urban Fringe. Social Forces 47(2), 202-215. Pyle, L. (1985). The Land Market Beyond the Urban Fringe. The Geographical Review, 75, 32-43. Pyle, L. (1986). Sellers and Nonsellers of Land for new Rural Housing. Professional Geographer, 38(4), 343-349. Pyle, L. (1989). Persistent Landownership at the Rural-Urban Fringe. Urban Geographer, 10(2), 157-171. Rilla, E. and A. Sokolow. 2000. California Farmers and Conservation Easements: Motivations, Experiences, and Perceptions in Three Counties. Research Paper 4. University of California, Agricultural Issues Center.
68
Rodriquez-Bachiller, A. (1986). Discontiguous Urban Growth and the New Urban Economics: A Review. Urban Studies, 2, 79-104. Sargent, C. (1972). Toward a Dynamic Model of Urban Morphology. Economic Geography, 48(4), 357-374. Sargent, C. (1976). Land Speculation and Urban Morphology. In J. Adams (Ed.), Urban Policymaking and Metropolitan Dynamics: A Comparative Geographical Analysis (pp. 21-57). Cambridge, MA: Ballinger Publishing Company. Spain, D. (1993). Been-Heres Versus Come-Heres: Negotiating Conflicting Community Identities. Journal of the American Planning Association, 59(2), 156-171. Strong, A. (1969). Factors Affecting Land Tenure on the Urban Fringe. Land Use Controls Quarterly, 3(1): 1-25. Sudman, S., & Bradburn, N. (1982). Asking Questions: A Practical Guide to Questionnaire Design. San Francisco: Jossey-Bass Publishers. Theobold, D. (2001). Land-Use Dynamics Beyond the American Urban Fringe. Geographical Review 91(3), 544. Thomas, D. (1990). The Edge of the City. Transactions of the Institute of British Geographers, 15(2), 131-138. Wiltshaw, D. (1985). The Supply of Land. Urban Studies, 22, 49-56. Wiltshaw, D. (1988). Pedagogic Comment and the Supply of Land for a Particular Use. Urban Studies, 25, 439-447. Whitehand, J. (1987). The Changing Face of Cities: A Study of Development Cycles and Urban Form. New York: B. Blackwell.