Embed Size (px)
Citation preview
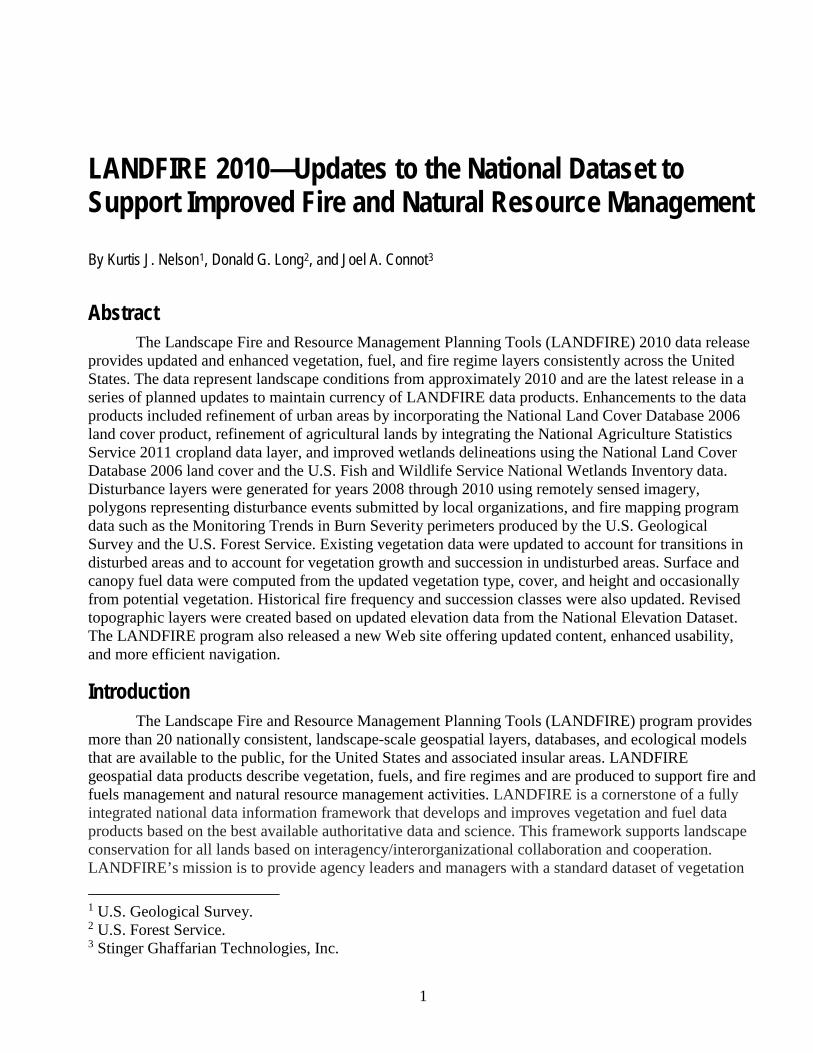
LANDFIRE 2010—Updates to the National Dataset to Support Improved Fire and Natural Resource Management
By Kurtis J. Nelson, Donald G. Long, and Joel A. Connot
Open-File Report 2016–1010
U.S. Department of the Interior U.S. Geological Survey

U.S. Department of the Interior SALLY JEWELL, Secretary
U.S. Geological Survey Suzette M. Kimball, Director
U.S. Geological Survey, Reston, Virginia: 2016
For more information on the USGS—the Federal source for science about the Earth, its natural and living resources, natural hazards, and the environment—visit http://www.usgs.gov or call 1–888–ASK–USGS (1–888–275–8747)
For an overview of USGS information products, including maps, imagery, and publications, visit http://www.usgs.gov/pubprod
To order this and other USGS information products, visit http://store.usgs.gov
Any use of trade, firm, or product names is for descriptive purposes only and does not imply endorsement by the U.S. Government.
Although this information product, for the most part, is in the public domain, it also may contain copyrighted materials as noted in the text. Permission to reproduce copyrighted items must be secured from the copyright owner.
Suggested citation: Nelson, K.J., Long, D.G., and Connot, J.A., 2016, LANDFIRE 2010—Updates to the national dataset to support improved fire and natural resource management: U.S. Geological Survey Open-File Report, 2016–1010, 48 p, http://dx.doi.org/10.3133/ofr20161010.
ISSN 2331-1258 (online)

iii
Acknowledgments
The Landscape Fire and Resource Management Planning Tools (LANDFIRE) 2010 update was completed through the dedicated work of the LANDFIRE science and production teams. The LANDFIRE program would like to extend our gratitude to the many program partners and data contributors, who are integral to the success of LANDFIRE, for their continued support.
iv
Contents
Acknowledgments ...................................................................................................................................................... iii Abstract ...................................................................................................................................................................... 1 Introduction ................................................................................................................................................................. 1 The LANDFIRE 2010 Project ...................................................................................................................................... 2
LANDFIRE 2010 Project Focus Areas .................................................................................................................... 2 Reference Data ........................................................................................................................................................... 4
Product Description ................................................................................................................................................. 4 Update Process....................................................................................................................................................... 4 Update Results ....................................................................................................................................................... 5
Disturbance ................................................................................................................................................................ 5 Product Description ................................................................................................................................................. 5 Update Process: CONUS ........................................................................................................................................ 5
Image Selection ................................................................................................................................................... 7 Image Preprocessing........................................................................................................................................... 7 Product Development .......................................................................................................................................... 7
Update Process: Alaska .......................................................................................................................................... 9 Update Process: Hawaii .......................................................................................................................................... 9 Update Results ....................................................................................................................................................... 9
Existing Vegetation ..................................................................................................................................................... 9 Product Description ................................................................................................................................................. 9 Update Process: CONUS ...................................................................................................................................... 10
Refinements to Existing Vegetation Type .......................................................................................................... 11 Urban, Agricultural, and Ruderal Vegetation .................................................................................................. 11 Life-form changes .......................................................................................................................................... 11 Leaf-Form Changes ....................................................................................................................................... 12 EVT Legend Renumbering ............................................................................................................................ 12 Barren and Sparse Mapping .......................................................................................................................... 12
Refinements to Existing Vegetation Height and Cover ...................................................................................... 13 Vegetation Transition Modeling ......................................................................................................................... 14
Update Process: Alaska ........................................................................................................................................ 15 Refinements to Existing Vegetation Type .......................................................................................................... 15 Remapping of Existing Vegetation Height ......................................................................................................... 16
Update Process: Hawaii ........................................................................................................................................ 16 Update Results: CONUS ....................................................................................................................................... 16
Life-Form Changes ............................................................................................................................................ 17 Leaf-Form Changes........................................................................................................................................... 19 Existing Vegetation Height and Cover ............................................................................................................... 19
Update Results: Alaska ......................................................................................................................................... 19 Life-Form Changes ............................................................................................................................................ 21 Leaf-form Changes ............................................................................................................................................ 21 Existing Vegetation Height ................................................................................................................................ 22
v
Update Results: Hawaii ......................................................................................................................................... 22 Fuel ........................................................................................................................................................................... 26
Product Description ............................................................................................................................................... 26 Update Process..................................................................................................................................................... 26
Surface Fuels .................................................................................................................................................... 26 Canopy fuels ..................................................................................................................................................... 27 Potential Fire Behavior ...................................................................................................................................... 27
Update Results: CONUS ....................................................................................................................................... 28 Surface Fuels .................................................................................................................................................... 28 Potential Fire Behavior ...................................................................................................................................... 29
Update Results: Alaska ......................................................................................................................................... 29 Surface Fuels .................................................................................................................................................... 29
Fire Behavior Analysis .............................................................................................................................................. 30 The Halstead Fire, Idaho, 2012 ............................................................................................................................. 30 The Jeep Fire, Minnesota, 2012............................................................................................................................ 35 The Stuart Creek Fire, Alaska, 2013 ..................................................................................................................... 38
Fire Regime .............................................................................................................................................................. 41 Product Description ............................................................................................................................................... 41 Update Process: CONUS ...................................................................................................................................... 42
Refinements to BpS Mapping ............................................................................................................................ 42 Updates to Historical Fire Frequency and Severity............................................................................................ 42
Update Process: Alaska ........................................................................................................................................ 43 Update Results: CONUS ....................................................................................................................................... 43
Refinements to BpS Mapping ............................................................................................................................ 43 Updates to Historical Fire Frequency and Severity............................................................................................ 43
Update Results: Alaska ......................................................................................................................................... 44 Topographic .............................................................................................................................................................. 45 Product Distribution .................................................................................................................................................. 45 Summary and Conclusions ....................................................................................................................................... 46 References Cited ...................................................................................................................................................... 47
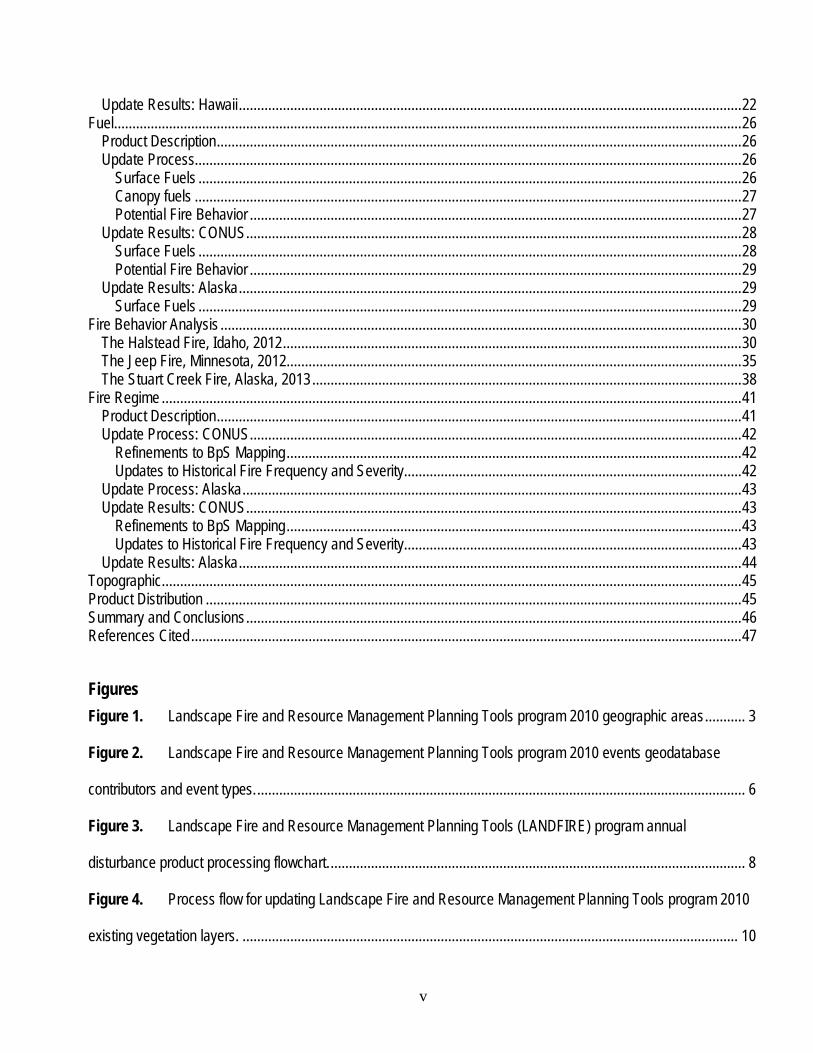
Figures Figure 1. Landscape Fire and Resource Management Planning Tools program 2010 geographic areas ........... 3
Figure 2. Landscape Fire and Resource Management Planning Tools program 2010 events geodatabase
contributors and event types. ..................................................................................................................................... 6
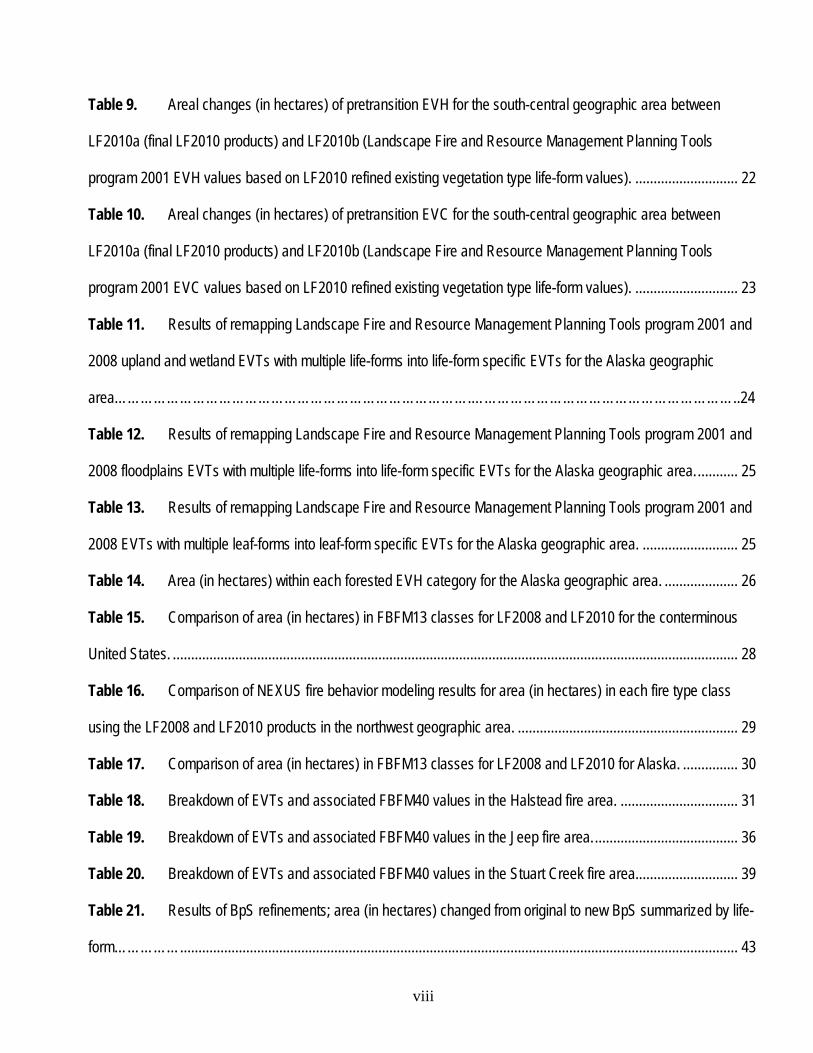
Figure 3. Landscape Fire and Resource Management Planning Tools (LANDFIRE) program annual
disturbance product processing flowchart. ................................................................................................................. 8
Figure 4. Process flow for updating Landscape Fire and Resource Management Planning Tools program 2010
existing vegetation layers. ....................................................................................................................................... 10
vi
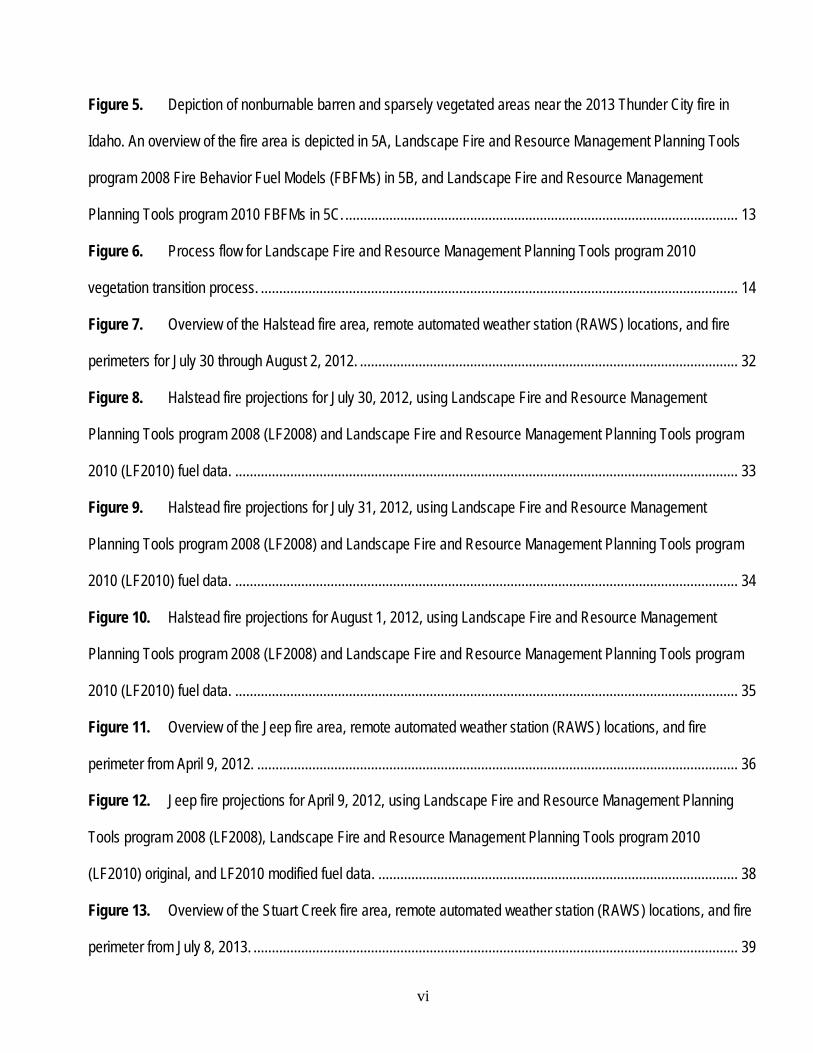
Figure 5. Depiction of nonburnable barren and sparsely vegetated areas near the 2013 Thunder City fire in
Idaho. An overview of the fire area is depicted in 5A, Landscape Fire and Resource Management Planning Tools
program 2008 Fire Behavior Fuel Models (FBFMs) in 5B, and Landscape Fire and Resource Management
Planning Tools program 2010 FBFMs in 5C. ........................................................................................................... 13
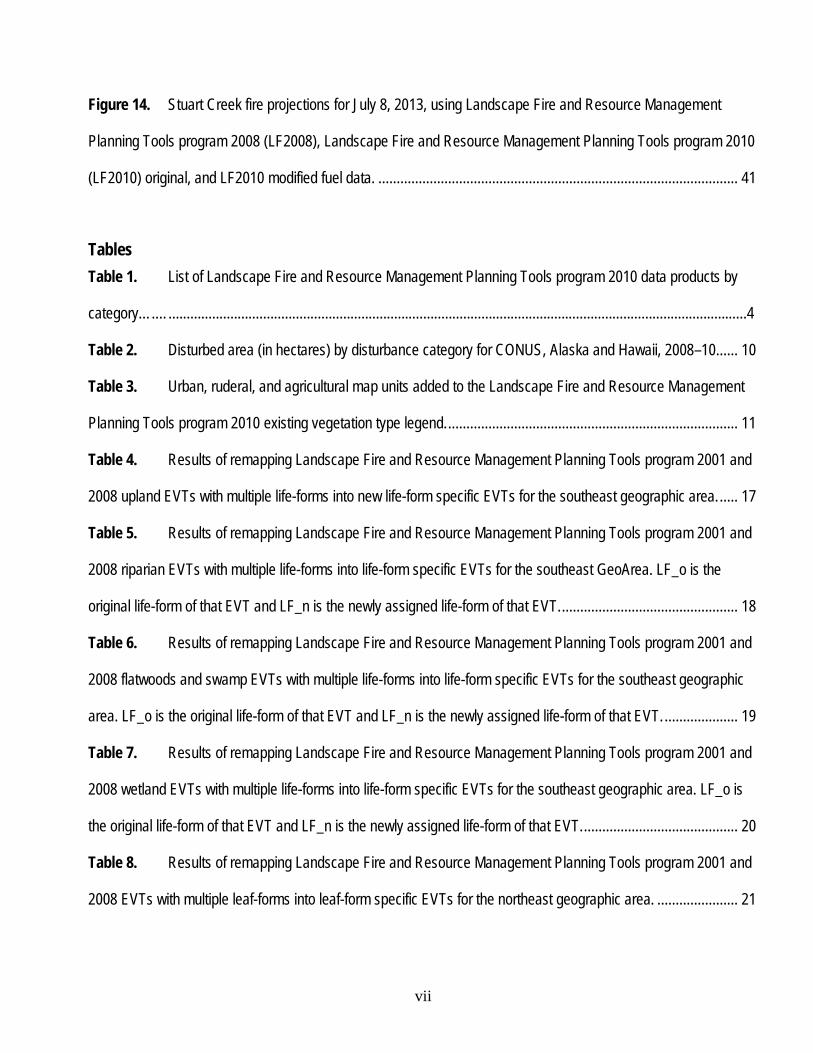
Figure 6. Process flow for Landscape Fire and Resource Management Planning Tools program 2010
vegetation transition process. .................................................................................................................................. 14
Figure 7. Overview of the Halstead fire area, remote automated weather station (RAWS) locations, and fire
perimeters for July 30 through August 2, 2012. ....................................................................................................... 32
Figure 8. Halstead fire projections for July 30, 2012, using Landscape Fire and Resource Management
Planning Tools program 2008 (LF2008) and Landscape Fire and Resource Management Planning Tools program
2010 (LF2010) fuel data. ......................................................................................................................................... 33
Figure 9. Halstead fire projections for July 31, 2012, using Landscape Fire and Resource Management
Planning Tools program 2008 (LF2008) and Landscape Fire and Resource Management Planning Tools program
2010 (LF2010) fuel data. ......................................................................................................................................... 34
Figure 10. Halstead fire projections for August 1, 2012, using Landscape Fire and Resource Management
Planning Tools program 2008 (LF2008) and Landscape Fire and Resource Management Planning Tools program
2010 (LF2010) fuel data. ......................................................................................................................................... 35
Figure 11. Overview of the Jeep fire area, remote automated weather station (RAWS) locations, and fire
perimeter from April 9, 2012. ................................................................................................................................... 36
Figure 12. Jeep fire projections for April 9, 2012, using Landscape Fire and Resource Management Planning
Tools program 2008 (LF2008), Landscape Fire and Resource Management Planning Tools program 2010
(LF2010) original, and LF2010 modified fuel data. .................................................................................................. 38
Figure 13. Overview of the Stuart Creek fire area, remote automated weather station (RAWS) locations, and fire
perimeter from July 8, 2013. .................................................................................................................................... 39
vii
Figure 14. Stuart Creek fire projections for July 8, 2013, using Landscape Fire and Resource Management
Planning Tools program 2008 (LF2008), Landscape Fire and Resource Management Planning Tools program 2010
(LF2010) original, and LF2010 modified fuel data. .................................................................................................. 41
Tables Table 1. List of Landscape Fire and Resource Management Planning Tools program 2010 data products by
category….…...............................................................................................................................................................4
Table 2. Disturbed area (in hectares) by disturbance category for CONUS, Alaska and Hawaii, 2008–10 ...... 10
Table 3. Urban, ruderal, and agricultural map units added to the Landscape Fire and Resource Management
Planning Tools program 2010 existing vegetation type legend. ............................................................................... 11
Table 4. Results of remapping Landscape Fire and Resource Management Planning Tools program 2001 and
2008 upland EVTs with multiple life-forms into new life-form specific EVTs for the southeast geographic area. ..... 17
Table 5. Results of remapping Landscape Fire and Resource Management Planning Tools program 2001 and
2008 riparian EVTs with multiple life-forms into life-form specific EVTs for the southeast GeoArea. LF_o is the
original life-form of that EVT and LF_n is the newly assigned life-form of that EVT. ................................................ 18
Table 6. Results of remapping Landscape Fire and Resource Management Planning Tools program 2001 and
2008 flatwoods and swamp EVTs with multiple life-forms into life-form specific EVTs for the southeast geographic
area. LF_o is the original life-form of that EVT and LF_n is the newly assigned life-form of that EVT. .................... 19
Table 7. Results of remapping Landscape Fire and Resource Management Planning Tools program 2001 and
2008 wetland EVTs with multiple life-forms into life-form specific EVTs for the southeast geographic area. LF_o is
the original life-form of that EVT and LF_n is the newly assigned life-form of that EVT. .......................................... 20
Table 8. Results of remapping Landscape Fire and Resource Management Planning Tools program 2001 and
2008 EVTs with multiple leaf-forms into leaf-form specific EVTs for the northeast geographic area. ...................... 21
viii
Table 9. Areal changes (in hectares) of pretransition EVH for the south-central geographic area between
LF2010a (final LF2010 products) and LF2010b (Landscape Fire and Resource Management Planning Tools
program 2001 EVH values based on LF2010 refined existing vegetation type life-form values). ............................ 22
Table 10. Areal changes (in hectares) of pretransition EVC for the south-central geographic area between
LF2010a (final LF2010 products) and LF2010b (Landscape Fire and Resource Management Planning Tools
program 2001 EVC values based on LF2010 refined existing vegetation type life-form values). ............................ 23
Table 11. Results of remapping Landscape Fire and Resource Management Planning Tools program 2001 and
2008 upland and wetland EVTs with multiple life-forms into life-form specific EVTs for the Alaska geographic
area……………………………………………………………………….……………………………………………………..24
Table 12. Results of remapping Landscape Fire and Resource Management Planning Tools program 2001 and
2008 floodplains EVTs with multiple life-forms into life-form specific EVTs for the Alaska geographic area. ........... 25
Table 13. Results of remapping Landscape Fire and Resource Management Planning Tools program 2001 and
2008 EVTs with multiple leaf-forms into leaf-form specific EVTs for the Alaska geographic area. .......................... 25
Table 14. Area (in hectares) within each forested EVH category for the Alaska geographic area. .................... 26
Table 15. Comparison of area (in hectares) in FBFM13 classes for LF2008 and LF2010 for the conterminous
United States. .......................................................................................................................................................... 28
Table 16. Comparison of NEXUS fire behavior modeling results for area (in hectares) in each fire type class
using the LF2008 and LF2010 products in the northwest geographic area. ............................................................ 29
Table 17. Comparison of area (in hectares) in FBFM13 classes for LF2008 and LF2010 for Alaska. ............... 30
Table 18. Breakdown of EVTs and associated FBFM40 values in the Halstead fire area. ................................ 31
Table 19. Breakdown of EVTs and associated FBFM40 values in the Jeep fire area. ....................................... 36
Table 20. Breakdown of EVTs and associated FBFM40 values in the Stuart Creek fire area............................ 39
Table 21. Results of BpS refinements; area (in hectares) changed from original to new BpS summarized by life-
form…………… ........................................................................................................................................................ 43
ix
Table 22. BpS models added to complete fire regime mapping for Landscape Fire and Resource Management
Planning Tools program 2010. ................................................................................................................................. 44
Table 23. Results of FRG mapping for LF2008 and LF2010 in the conterminous United States, showing the
area in each class (in hectares) and the differences between them. ....................................................................... 44
Table 24. Results of Alaska FRG mapping for LF2008 and LF2010, showing the area in each class (in
hectares) and the differences between them. .......................................................................................................... 45
Conversion Factors Inch/Pound to International System of Units
Multiply By To obtain
Length foot (ft) 0.3048 meter (m)
mile (mi) 1.609 kilometer (km)
Area acre 0.4047 hectare (ha)
square mile (mi2) 259.0 hectare (ha)
x
Abbreviations BpS Biophysical Setting
CBD canopy bulk density
CBH canopy base height
CC forest canopy cover
CH forest canopy height
CONUS conterminous United States
CFFDRS Canadian forest fire danger rating system
EVC existing vegetation cover
EVH existing vegetation height
EVT existing vegetation type
FARSITE Fire Area Simulator
FBFM13 13 Anderson fire behavior fuel models
FBFM40 40 Scott and Burgan fire behavior fuel models
FRG fire regime group
GLAS Geoscience Laser Altimeter System
GeoArea geographic area
GS grass/shrub
LANDFIRE landscape fire and resource management planning tools
LF2001 LANDFIRE 2001
LF2008 LANDFIRE 2008
LF2010 LANDFIRE 2010
LFRDB LANDFIRE reference database
MFRI mean fire return interval
MIICA multi-index integrated change analysis
NED National Elevation Dataset
NLCD National Land Cover Database
RAWS remote automated weather station
RSLC remote sensing of landscape change
TL timber litter
TSD time since disturbance
TU timber understory
USFS U.S. Forest Service
WELD Web-enabled Landsat data
1
LANDFIRE 2010—Updates to the National Dataset to Support Improved Fire and Natural Resource Management
By Kurtis J. Nelson1, Donald G. Long2, and Joel A. Connot3
Abstract The Landscape Fire and Resource Management Planning Tools (LANDFIRE) 2010 data release
provides updated and enhanced vegetation, fuel, and fire regime layers consistently across the United States. The data represent landscape conditions from approximately 2010 and are the latest release in a series of planned updates to maintain currency of LANDFIRE data products. Enhancements to the data products included refinement of urban areas by incorporating the National Land Cover Database 2006 land cover product, refinement of agricultural lands by integrating the National Agriculture Statistics Service 2011 cropland data layer, and improved wetlands delineations using the National Land Cover Database 2006 land cover and the U.S. Fish and Wildlife Service National Wetlands Inventory data. Disturbance layers were generated for years 2008 through 2010 using remotely sensed imagery, polygons representing disturbance events submitted by local organizations, and fire mapping program data such as the Monitoring Trends in Burn Severity perimeters produced by the U.S. Geological Survey and the U.S. Forest Service. Existing vegetation data were updated to account for transitions in disturbed areas and to account for vegetation growth and succession in undisturbed areas. Surface and canopy fuel data were computed from the updated vegetation type, cover, and height and occasionally from potential vegetation. Historical fire frequency and succession classes were also updated. Revised topographic layers were created based on updated elevation data from the National Elevation Dataset. The LANDFIRE program also released a new Web site offering updated content, enhanced usability, and more efficient navigation.
Introduction The Landscape Fire and Resource Management Planning Tools (LANDFIRE) program provides
more than 20 nationally consistent, landscape-scale geospatial layers, databases, and ecological models that are available to the public, for the United States and associated insular areas. LANDFIRE geospatial data products describe vegetation, fuels, and fire regimes and are produced to support fire and fuels management and natural resource management activities. LANDFIRE is a cornerstone of a fully integrated national data information framework that develops and improves vegetation and fuel data products based on the best available authoritative data and science. This framework supports landscape conservation for all lands based on interagency/interorganizational collaboration and cooperation. LANDFIRE’s mission is to provide agency leaders and managers with a standard dataset of vegetation 1 U.S. Geological Survey. 2 U.S. Forest Service. 3 Stinger Ghaffarian Technologies, Inc.
2
and wildland fire and fuels information for strategic fire and resource management planning and analysis.
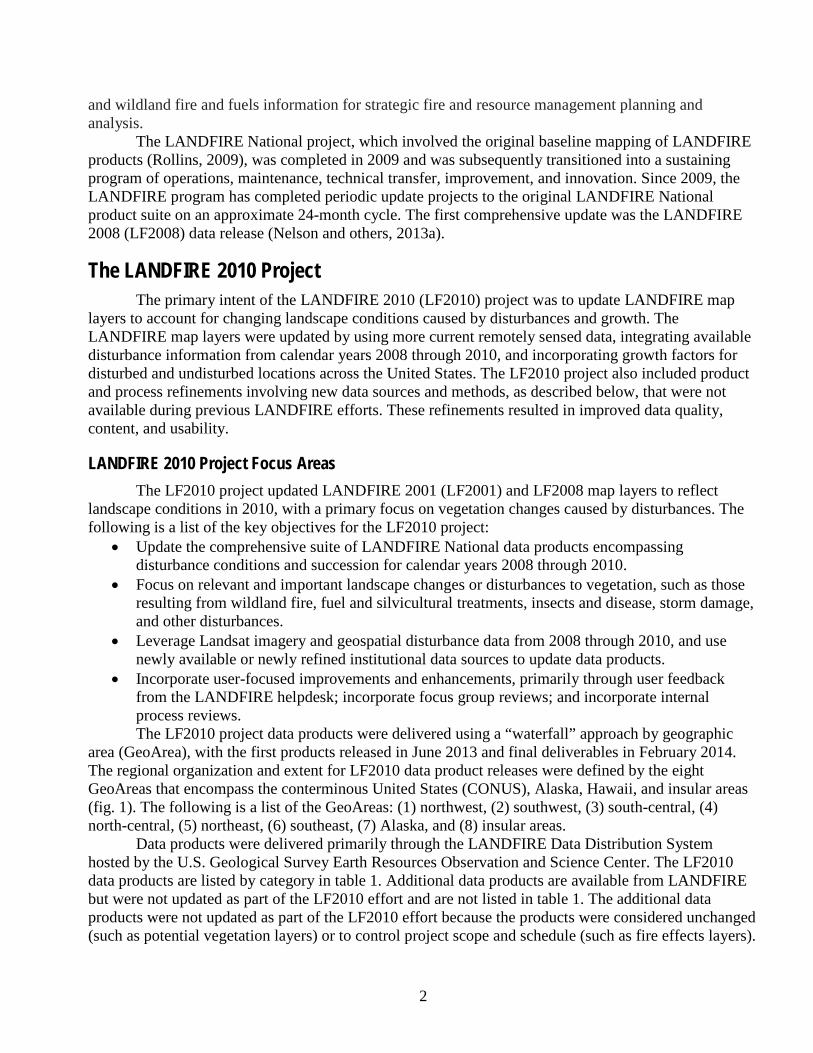
The LANDFIRE National project, which involved the original baseline mapping of LANDFIRE products (Rollins, 2009), was completed in 2009 and was subsequently transitioned into a sustaining program of operations, maintenance, technical transfer, improvement, and innovation. Since 2009, the LANDFIRE program has completed periodic update projects to the original LANDFIRE National product suite on an approximate 24-month cycle. The first comprehensive update was the LANDFIRE 2008 (LF2008) data release (Nelson and others, 2013a).
The LANDFIRE 2010 Project The primary intent of the LANDFIRE 2010 (LF2010) project was to update LANDFIRE map
layers to account for changing landscape conditions caused by disturbances and growth. The LANDFIRE map layers were updated by using more current remotely sensed data, integrating available disturbance information from calendar years 2008 through 2010, and incorporating growth factors for disturbed and undisturbed locations across the United States. The LF2010 project also included product and process refinements involving new data sources and methods, as described below, that were not available during previous LANDFIRE efforts. These refinements resulted in improved data quality, content, and usability.
LANDFIRE 2010 Project Focus Areas The LF2010 project updated LANDFIRE 2001 (LF2001) and LF2008 map layers to reflect
landscape conditions in 2010, with a primary focus on vegetation changes caused by disturbances. The following is a list of the key objectives for the LF2010 project:
• Update the comprehensive suite of LANDFIRE National data products encompassing disturbance conditions and succession for calendar years 2008 through 2010.
• Focus on relevant and important landscape changes or disturbances to vegetation, such as those resulting from wildland fire, fuel and silvicultural treatments, insects and disease, storm damage, and other disturbances.
• Leverage Landsat imagery and geospatial disturbance data from 2008 through 2010, and use newly available or newly refined institutional data sources to update data products.
• Incorporate user-focused improvements and enhancements, primarily through user feedback from the LANDFIRE helpdesk; incorporate focus group reviews; and incorporate internal process reviews. The LF2010 project data products were delivered using a “waterfall” approach by geographic
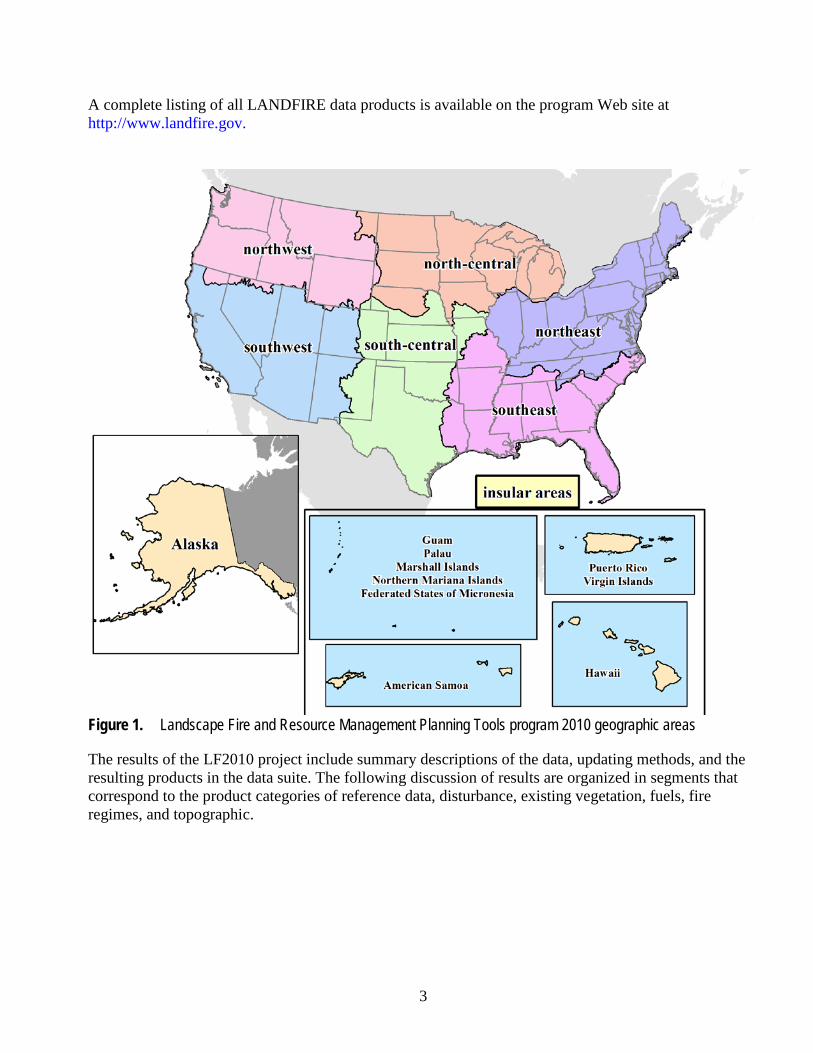
area (GeoArea), with the first products released in June 2013 and final deliverables in February 2014. The regional organization and extent for LF2010 data product releases were defined by the eight GeoAreas that encompass the conterminous United States (CONUS), Alaska, Hawaii, and insular areas (fig. 1). The following is a list of the GeoAreas: (1) northwest, (2) southwest, (3) south-central, (4) north-central, (5) northeast, (6) southeast, (7) Alaska, and (8) insular areas.
Data products were delivered primarily through the LANDFIRE Data Distribution System hosted by the U.S. Geological Survey Earth Resources Observation and Science Center. The LF2010 data products are listed by category in table 1. Additional data products are available from LANDFIRE but were not updated as part of the LF2010 effort and are not listed in table 1. The additional data products were not updated as part of the LF2010 effort because the products were considered unchanged (such as potential vegetation layers) or to control project scope and schedule (such as fire effects layers).
3
A complete listing of all LANDFIRE data products is available on the program Web site at http://www.landfire.gov.
Figure 1. Landscape Fire and Resource Management Planning Tools program 2010 geographic areas
The results of the LF2010 project include summary descriptions of the data, updating methods, and the resulting products in the data suite. The following discussion of results are organized in segments that correspond to the product categories of reference data, disturbance, existing vegetation, fuels, fire regimes, and topographic.
4
Table 1. List of Landscape Fire and Resource Management Planning Tools program 2010 data products by category. [DB, database; FBFM, fire behavior fuel model; CFFDRS, Canadian Forest Fire Danger Rating System]
Reference Disturbance Vegetation Fuel Fire regime Topographic LANDFIRE
reference DB Annual disturbance
(1999–2010) Existing vegetation
type 13 Anderson
FBFMs1 Fire regime
groups Elevation
LANDFIRE events geodatabase
Vegetation disturbance
Existing vegetation cover
40 Scott & Burgan FBFMs2
Mean fire return interval
Aspect
-- Fuel disturbance Existing vegetation height
CFFDRS FBFMs Percent low-severity fire
Slope
-- -- Biophysical Settings
Forest canopy cover
Percent mixed-severity fire
--
-- -- -- Forest canopy height
Percent replacement-severity fire
--
-- -- -- Forest canopy bulk density
-- --
-- -- -- Forest canopy base height
-- --
1Anderson (1982). 2Scott and Burgan (2005).
Reference Data Product Description
The Reference data product suite includes spatial databases containing field referenced point and polygon data describing vegetation and fuel conditions and landscape change events (natural and anthropogenic disturbances). The vegetation and fuel plot data in the LANDFIRE Reference Database (LFRDB) support vegetation transition models to develop rulesets for modifying vegetation attributes based on disturbance and succession. The events geodatabase supports disturbance detection and attribution of disturbance causality. A subset of the LFRDB and events databases are published for public use. Proprietary or otherwise sensitive data that LANDFIRE does not have explicit permission to share are removed from the public databases before dissemination.
Update Process Updates to the LF2010 LFRDB focused primarily on inclusion of updated Forest Inventory and
Analysis data, from the U.S. Forest Service (USFS), to support vegetation transition modeling. Other datasets are added to the LFRDB periodically and are used to support nonforest transition development, legend refinements, and product quality assessments. Newly established Forest Inventory and Analysis plots and repeated measurements of existing plots were acquired and cataloged in the LFRDB. The events geodatabase was built from data that were acquired from national databases and that were contributed to LANDFIRE from many land management groups, which include Federal, State, Tribal, and local agencies and private and nonprofit organizations. These data were initially combined into a spatial layer containing all available features. This layer was further processed through a series of steps to identify overlapping features, reduce them through a hierarchical topology process, and sort multiple disturbance types in the same year by the effect of the different types on landscape conditions relative to the other types. The result was a model-ready spatial layer that contains at most one disturbance per year
5
per location. Where multiple disturbances for one location were reported, the disturbance type with the most effect on vegetation and fuels was retained. At a minimum, the type, location, and year of disturbance were recorded for each event. Additional attributes, including the magnitude or severity of the event and date of occurrence, were captured if available.
Update Results In the LF2010 project, 3,342 Forest Inventory and Analysis plots were added to the LFRDB.
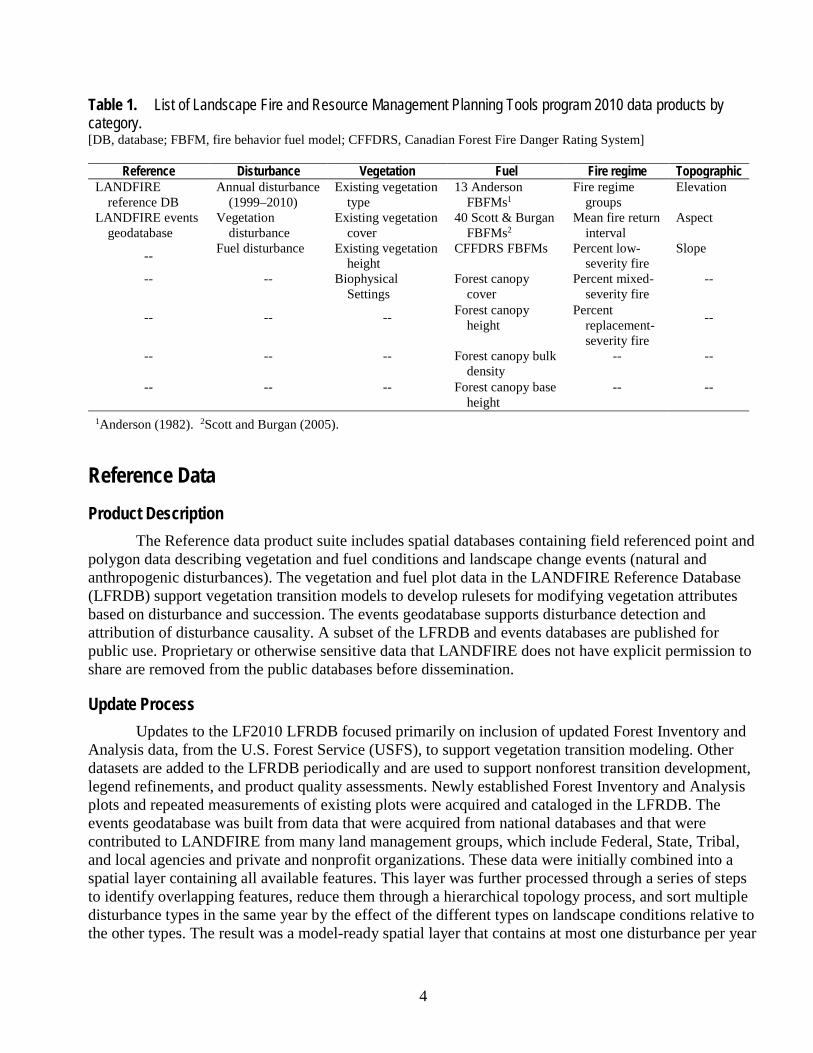
The events geodatabase for LF2010 contained 200,017 total events during 2008 through 2010, which were reduced to 124,724 model-ready events. Of the events data, three-quarters were acquired by LANDFIRE staff from public clearinghouses or data sharing agreements, whereas one-quarter were contributed by users of LANDFIRE data. Of the more than 200,000 LF2010 events, more than 45 percent represented mechanical treatments or harvest activities, 20 percent represented fires, 14 percent represented insects or disease events, and 13 percent represented chemical or biological treatments. The remaining events included reforestation, weather, and development activity. More than 60 percent of the LF2010 events were acquired or contributed by USFS sources, whereas the Bureau of Land Management, State agencies, and multiagency groups (for example, fires reported through the Wildland Fire Decision Support System or Geospatial Multi-Agency Coordination and fuel treatments reported through the National Fire Plan Operations and Reporting System) each contributed more than 10 percent. A larger proportion of events were acquired in the western United States compared to the central and eastern United States, primarily because of the proportion of public to private land is much larger in the west than in the east, and most of the events data depict changes on public lands. See figure 2 for more information on event data types and contributors.
Disturbance Product Description
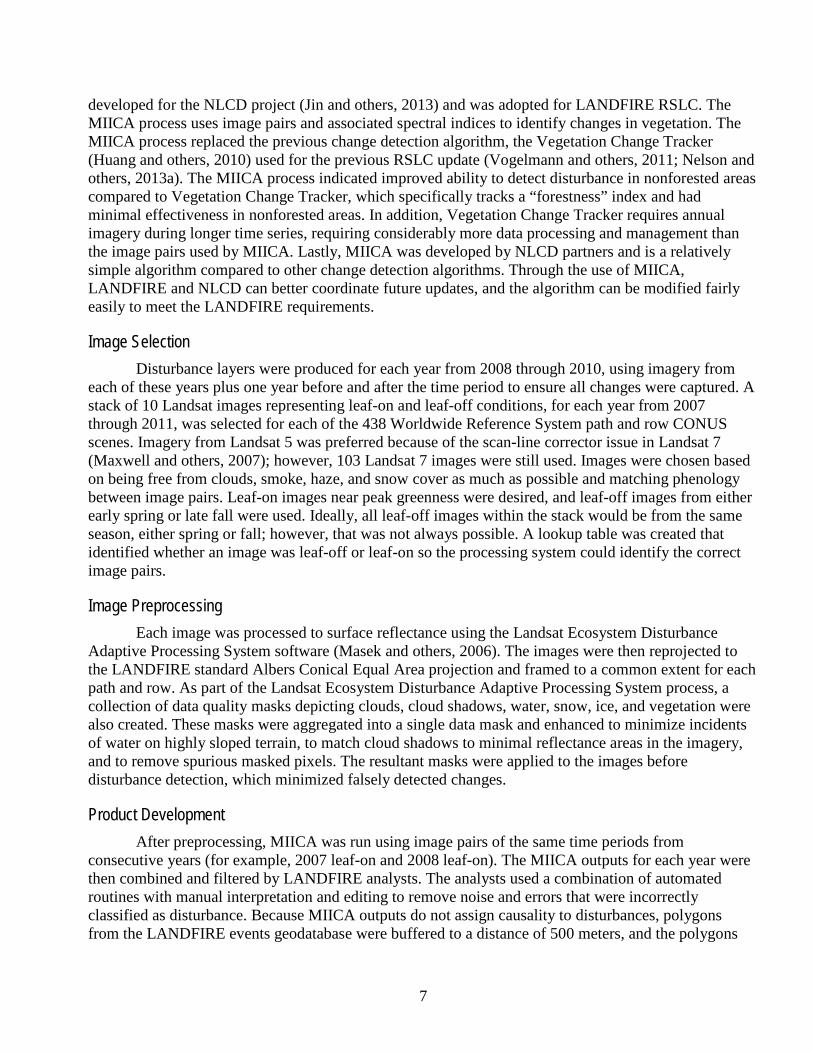
Disturbance products are developed to reflect change on the landscape caused by management activities and natural disturbance and are used to update LANDFIRE vegetation and fuel products. Disturbance products are a compilation of data from Landsat satellite imagery, operational fire mapping programs, the LANDFIRE events geodatabase, and other ancillary sources (for example, National Land Cover Database [NLCD] and National Agricultural Statistics Service Cropland Data Layer). Data products are annual layers depicting disturbances that take place in each year attributed with disturbance type, disturbance severity, confidence in the type and severity attributes, and the sources of disturbance information; along with composite disturbance layers that indicate the disturbance type, severity, and time since disturbance (TSD) for all disturbances during 1999–2010.
Update Process: CONUS The LANDFIRE disturbance mapping process consisted of several data sources and procedures.
The process combined geospatial data depicting areas of disturbance with Remote Sensing of Landscape Change (RSLC) products to develop the annual disturbance layers. Data from national fire mapping programs, including Monitoring Trends in Burn Severity (Eidenshink and others, 2007), Burned Area Reflectance Classification (http://www.fs.fed.us/eng/rsac/baer/barc.html), and Rapid Assessment of Vegetation Condition after Wildfire (http://www.fs.fed.us/postfirevegcondition/index.shtml) produced by the U.S. Geological Survey and USFS were used to locate and characterize large wildfires. Fire
6
perimeters and severity information from these programs were integral to producing the LANDFIRE disturbance layers.
Figure 2. Landscape Fire and Resource Management Planning Tools program 2010 events geodatabase contributors and event types.
In LF2010, the RSLC process was modified to implement a new change detection algorithm (Nelson and others, 2013b). The Multi-Index Integrated Change Analysis (MIICA) process was
7
developed for the NLCD project (Jin and others, 2013) and was adopted for LANDFIRE RSLC. The MIICA process uses image pairs and associated spectral indices to identify changes in vegetation. The MIICA process replaced the previous change detection algorithm, the Vegetation Change Tracker (Huang and others, 2010) used for the previous RSLC update (Vogelmann and others, 2011; Nelson and others, 2013a). The MIICA process indicated improved ability to detect disturbance in nonforested areas compared to Vegetation Change Tracker, which specifically tracks a “forestness” index and had minimal effectiveness in nonforested areas. In addition, Vegetation Change Tracker requires annual imagery during longer time series, requiring considerably more data processing and management than the image pairs used by MIICA. Lastly, MIICA was developed by NLCD partners and is a relatively simple algorithm compared to other change detection algorithms. Through the use of MIICA, LANDFIRE and NLCD can better coordinate future updates, and the algorithm can be modified fairly easily to meet the LANDFIRE requirements.
Image Selection Disturbance layers were produced for each year from 2008 through 2010, using imagery from
each of these years plus one year before and after the time period to ensure all changes were captured. A stack of 10 Landsat images representing leaf-on and leaf-off conditions, for each year from 2007 through 2011, was selected for each of the 438 Worldwide Reference System path and row CONUS scenes. Imagery from Landsat 5 was preferred because of the scan-line corrector issue in Landsat 7 (Maxwell and others, 2007); however, 103 Landsat 7 images were still used. Images were chosen based on being free from clouds, smoke, haze, and snow cover as much as possible and matching phenology between image pairs. Leaf-on images near peak greenness were desired, and leaf-off images from either early spring or late fall were used. Ideally, all leaf-off images within the stack would be from the same season, either spring or fall; however, that was not always possible. A lookup table was created that identified whether an image was leaf-off or leaf-on so the processing system could identify the correct image pairs.
Image Preprocessing Each image was processed to surface reflectance using the Landsat Ecosystem Disturbance
Adaptive Processing System software (Masek and others, 2006). The images were then reprojected to the LANDFIRE standard Albers Conical Equal Area projection and framed to a common extent for each path and row. As part of the Landsat Ecosystem Disturbance Adaptive Processing System process, a collection of data quality masks depicting clouds, cloud shadows, water, snow, ice, and vegetation were also created. These masks were aggregated into a single data mask and enhanced to minimize incidents of water on highly sloped terrain, to match cloud shadows to minimal reflectance areas in the imagery, and to remove spurious masked pixels. The resultant masks were applied to the images before disturbance detection, which minimized falsely detected changes.
Product Development After preprocessing, MIICA was run using image pairs of the same time periods from
consecutive years (for example, 2007 leaf-on and 2008 leaf-on). The MIICA outputs for each year were then combined and filtered by LANDFIRE analysts. The analysts used a combination of automated routines with manual interpretation and editing to remove noise and errors that were incorrectly classified as disturbance. Because MIICA outputs do not assign causality to disturbances, polygons from the LANDFIRE events geodatabase were buffered to a distance of 500 meters, and the polygons
8
were then used to assign disturbance types if an RSLC disturbance was detected within the buffer. Other datasets used to assign disturbance types were the Protected Area Database Gap Analysis Program Status values and the USFS SmartFire system. The Protected Area Database Gap Analysis Program Status values provide an indication of land use and management characteristics, whereas USFS SmartFire provides ignition points indicating active fire detections, which are subsequently buffered. If an RSLC detected disturbance did not intersect with any of these datasets, the disturbance was labeled an unknown disturbance type. Disturbance severity was determined from the source data, in the case of wildfire mapping program and Events data that had severity information available, or from the RSLC data for all other cases. In the RSLC case, the differenced Normalized Burn Ratio was computed from the Landsat imagery and thresholds were developed to separate the data into low, medium, and high severity classes and then used to attribute disturbance severity. Confidence levels of the disturbance type and severity attributes were recorded based on the source of the data used to develop those attributes. Data that were created at least in part by analysts (for example, Monitoring Trends in Burn Severity) were considered to have greater confidence than data that were generated automatically (for example, SmartFire). The entire annual disturbance product mapping process is depicted in figure 3. Once the annual disturbance products were completed, the previous and new layers from 1999 through 2010 were combined and summarized to produce the composite vegetation and fuel disturbance layers. The composite layers were then used to update other LANDFIRE products.
Figure 3. Landscape Fire and Resource Management Planning Tools (LANDFIRE) program annual disturbance product processing flowchart.
9
Update Process: Alaska In Alaska, the disturbance mapping process consisted of several data sources and procedures.
The process combined data from national wildfire mapping programs and the LANDFIRE events geodatabase. The RSLC data products were not used in the Alaska disturbance mapping process due to time and image availability constraints. Tiling and compositing methods are being researched and tested, which may help reduce the image constraints in Alaska. These methods could be a solution for future LANDFIRE updates so that the same process for disturbance mapping could be used.
Wildfire location and severity data from Monitoring Trends in Burn Severity, Burned Area Reflectance Classification, and Rapid Assessment of Vegetation Condition after Wildfire were combined with disturbance data from the LANDFIRE events geodatabase and compiled to generate the record of annual disturbances in Alaska. The same suite of attributed disturbance layers created for CONUS was created for Alaska and included the annual layers and the composite layers depicting all disturbances from 1999 through 2010. Although these layers may not capture the entire record of disturbance in Alaska, this approach was a reasonable compromise, based on local stakeholder input, between data needs and available resources.
Update Process: Hawaii In Hawaii, the necessary imagery was also not available for the RSLC process. In consultation
with local stakeholders, the determination was made that the only real substantial source of landscape disturbance was wildfire; therefore, data from Monitoring Trends in Burn Severity and locally contributed fire perimeters from the LANDFIRE events geodatabase were used to locate and characterize wildfires. Annual disturbance layers were not produced, rather only the composite disturbance layers.
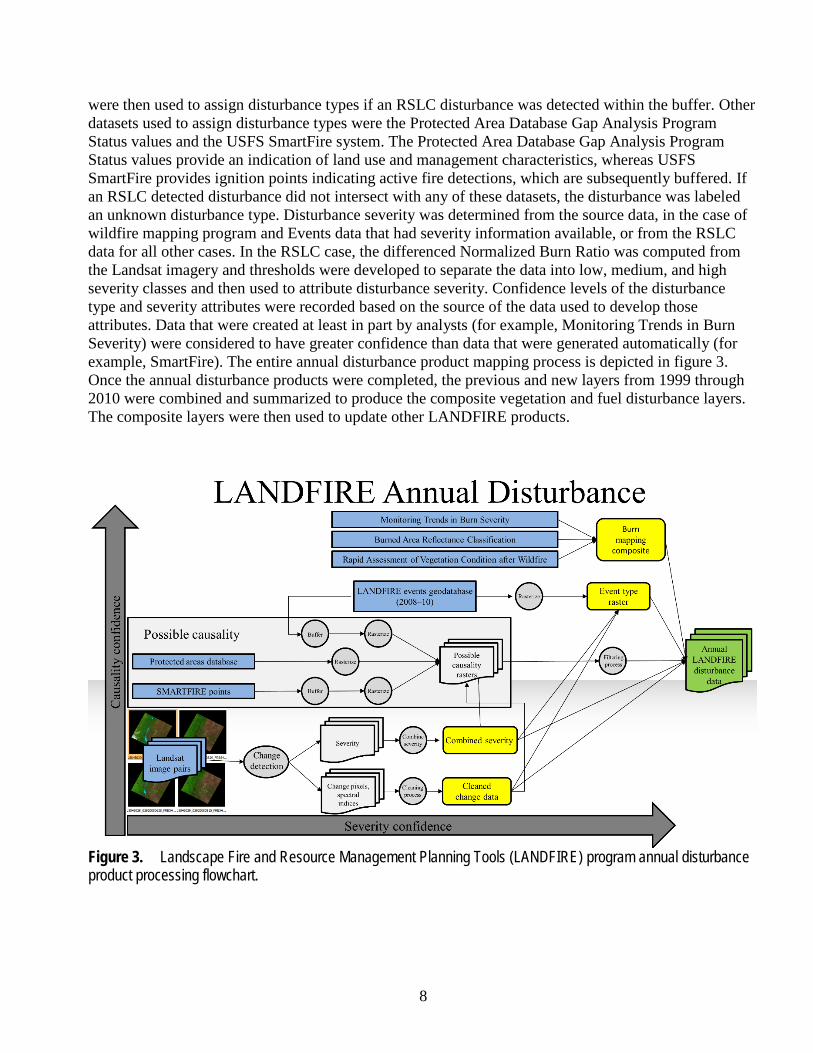
Update Results In LF2010, more than 20 million hectares were mapped as disturbed between 2008 and 2010,
including more than 9 million hectares of fire (prescribed and wildfire) nationwide. In Alaska, nearly 3 million hectares were disturbed by fire and more than 28,000 hectares of fire disturbance was mapped in Hawaii. Mapped disturbances by category across the country are listed in table 2. Among disturbance types, fire is the best characterized because the operational burn mapping programs provide spatially explicit data to LANDFIRE that are directly incorporated into the disturbance products. Other disturbance types have differing degrees of confidence because types such as chemical treatments and weather damage do not always have as great of an effect as fire and may not be visible in imagery of the disturbed areas and also because the events data, which are used for assigning causality, come from multiple sources with different levels of reliability. A qualitative measure of these differing levels of reliability is captured in the confidence attribute of the annual disturbance layers.
Existing Vegetation Product Description
Existing vegetation layers for LANDFIRE include Existing Vegetation Type (EVT), Existing Vegetation Cover (EVC), and Existing Vegetation Height (EVH). All three layers were originally mapped using predictive landscape models based on extensive field-referenced data, satellite imagery, biophysical gradient predictor layers, and classification and regression trees. The EVT layer represents the dominant vegetation using map units derived from NatureServe’s Ecological Systems vegetation
10
classification for natural vegetation (Comer and others, 2003). A suite of other map units were derived internally for nonnatural and seminatural vegetation. The EVC layer represents the average percent cover of the dominant life-form vegetation of the corresponding EVT for each pixel. The EVH layer represents the average height of the dominant life-form vegetation of the corresponding EVT for each pixel.
Table 2. Disturbed area (in hectares) by disturbance category for CONUS, Alaska and Hawaii, 2008–10 [CONUS, Conterminous United States; -, not applicable]
Disturbance type CONUS Alaska Hawaii Total Biological 4,273 - - 4,273 Chemical 855,256 - - 855,256 Mechanical 1,041,710 7,005 - 1,048,715 Development 1,640 3,599 - 5,239 Insects/disease 957,626 988,018 - 1,945,644 Fire 7,079,867 1,894,810 28,091 9,002,767 Weather 51,586 7,102 - 58,687 Unknown 7,832,430 - - 7,832,430 Total 17,824,387 2,900,534 28,091 20,753,011
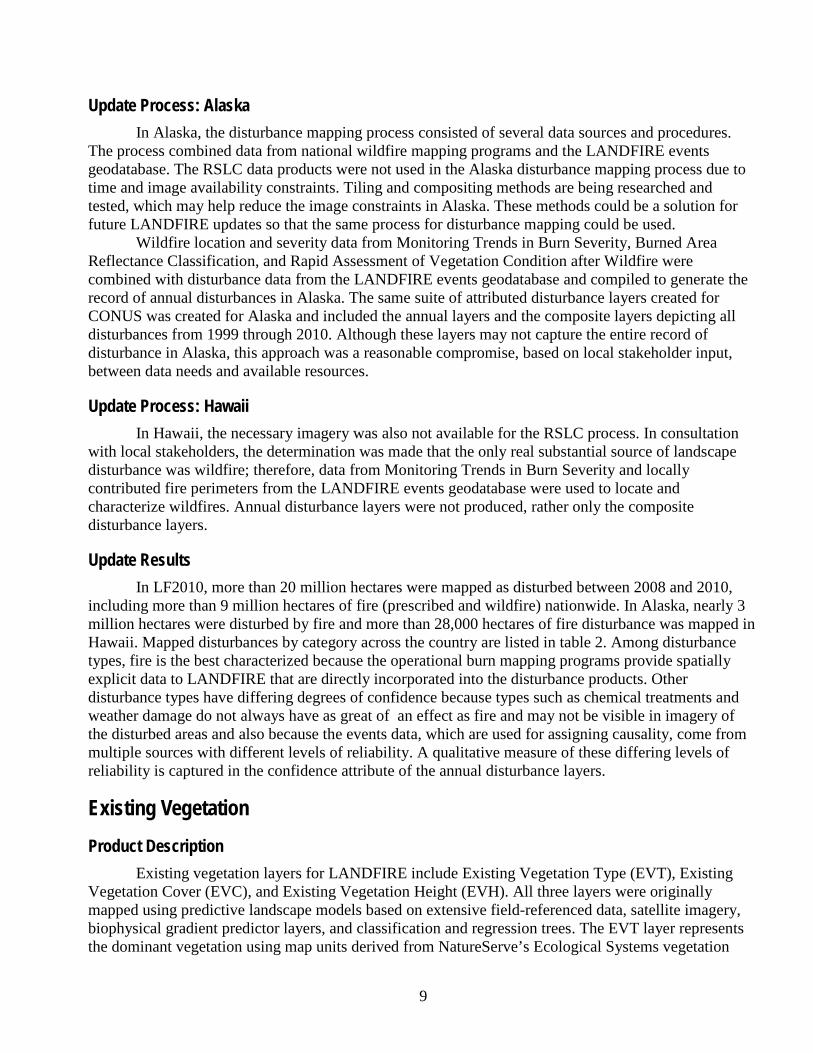
Update Process: CONUS The LF2010 vegetation update process focused first on refinements to certain elements of the
LF2001 EVT data, including adding a previously developed version of the LANDFIRE EVH and EVC data. Then, the refined data were updated to account for disturbances that occurred between 2001 and 2010 using the Vegetation Transition Process, as depicted in figure 4. The LF2010 vegetation update process resulted in the production of the LF2010 EVT, EVH, and EVC layers.
Figure 4. Process flow for updating Landscape Fire and Resource Management Planning Tools program 2010 existing vegetation layers.
11
Refinements to Existing Vegetation Type
Urban, Agricultural, and Ruderal Vegetation In areas where urban, agricultural, and ruderal vegetation exists, the EVT layer was mapped
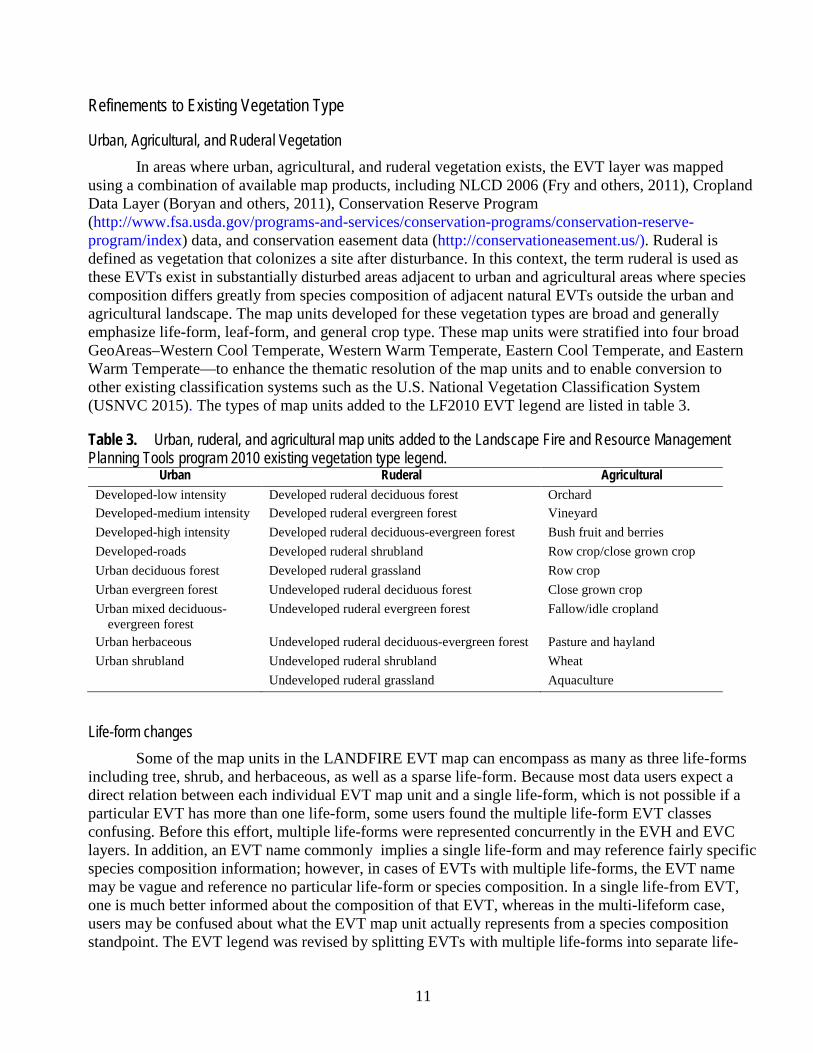
using a combination of available map products, including NLCD 2006 (Fry and others, 2011), Cropland Data Layer (Boryan and others, 2011), Conservation Reserve Program (http://www.fsa.usda.gov/programs-and-services/conservation-programs/conservation-reserve-program/index) data, and conservation easement data (http://conservationeasement.us/). Ruderal is defined as vegetation that colonizes a site after disturbance. In this context, the term ruderal is used as these EVTs exist in substantially disturbed areas adjacent to urban and agricultural areas where species composition differs greatly from species composition of adjacent natural EVTs outside the urban and agricultural landscape. The map units developed for these vegetation types are broad and generally emphasize life-form, leaf-form, and general crop type. These map units were stratified into four broad GeoAreas–Western Cool Temperate, Western Warm Temperate, Eastern Cool Temperate, and Eastern Warm Temperate—to enhance the thematic resolution of the map units and to enable conversion to other existing classification systems such as the U.S. National Vegetation Classification System (USNVC 2015). The types of map units added to the LF2010 EVT legend are listed in table 3.
Table 3. Urban, ruderal, and agricultural map units added to the Landscape Fire and Resource Management Planning Tools program 2010 existing vegetation type legend.
Urban Ruderal Agricultural Developed-low intensity Developed ruderal deciduous forest Orchard Developed-medium intensity Developed ruderal evergreen forest Vineyard Developed-high intensity Developed ruderal deciduous-evergreen forest Bush fruit and berries Developed-roads Developed ruderal shrubland Row crop/close grown crop Urban deciduous forest Developed ruderal grassland Row crop Urban evergreen forest Undeveloped ruderal deciduous forest Close grown crop Urban mixed deciduous-
evergreen forest Undeveloped ruderal evergreen forest Fallow/idle cropland
Urban herbaceous Undeveloped ruderal deciduous-evergreen forest Pasture and hayland Urban shrubland Undeveloped ruderal shrubland Wheat Undeveloped ruderal grassland Aquaculture
Life-form changes Some of the map units in the LANDFIRE EVT map can encompass as many as three life-forms
including tree, shrub, and herbaceous, as well as a sparse life-form. Because most data users expect a direct relation between each individual EVT map unit and a single life-form, which is not possible if a particular EVT has more than one life-form, some users found the multiple life-form EVT classes confusing. Before this effort, multiple life-forms were represented concurrently in the EVH and EVC layers. In addition, an EVT name commonly implies a single life-form and may reference fairly specific species composition information; however, in cases of EVTs with multiple life-forms, the EVT name may be vague and reference no particular life-form or species composition. In a single life-from EVT, one is much better informed about the composition of that EVT, whereas in the multi-lifeform case, users may be confused about what the EVT map unit actually represents from a species composition standpoint. The EVT legend was revised by splitting EVTs with multiple life-forms into separate life-
12
forms. This division retained the original EVT to represent one of the life-forms, whereas new EVT map units were added to the legend to represent any other life-forms potentially included in that EVT. The EVT names were updated to reflect the new life-form. These legend changes were translated into the LF2010 existing vegetation mapping effort by using the EVT and EVC layer concurrently to assign these new map units to the map.
Leaf-Form Changes A similar situation existed with forested EVTs in the LANDFIRE legend where the basic tree
leaf-forms, evergreen and deciduous, were combined. Many aspects of fuel modeling require knowing whether tree leaves are available fuel for burning, will dampen ground level winds, or will provide shading that may attenuate fuel moisture. Similar to the life-form situation, multiple leaf-forms within one EVT is problematic. The EVT legend was revised by dividing EVTs with multiple leaf-forms into separate map units, each with a single leaf-form. This division retained the original EVT to represent one of the leaf-forms, whereas new EVTs were added to the legend to represent other leaf-forms potentially included in that EVT. The EVT names were updated to reflect the new leaf-form. These legend changes were translated into LF2010 existing vegetation mapping effort by using the EVT and by using deciduous, evergreen, and mixed leaf-form themes in the NLCD 2001 layer concurrently to assign these new units to the map.
EVT Legend Renumbering Along with the development of a suite of new LANDFIRE EVTs, a new numbering strategy was
created to accommodate the enhanced map units. A hierarchical set of attributes that provide each unique EVT to increasingly more general attributes was used. The EVT value used numbers ranging from 3,000 to 3,999 with a unique number for all original EVTs, as well as the new EVTs created by life-form, leaf-form, or GeoArea enhancements. The two-digit codes, which were previously used for water, barren, nonvegetated EVTs, urban, agricultural, and ruderal EVTs, were assigned a new four-digit 3,000 series code. A unique name was assigned to each of the EVTs in the attribute “Classname”. The “EVT_Fuel” attribute was created to aggregate many of these 3,000 series EVTs and to renumber them. The primary purpose of this activity was to preserve the linkage to fire behavior fuel model mapping rulesets developed earlier based on the original EVT map unit legend. The “EVT_Fuel” attribute code used numbers ranging from 2,000 to 2,999 and retained most of the original EVT legend. The EVT life-form, or EVT_LF, was created to indicate the final, unique life-form assignment to each EVT map unit. Every EVT split was included, as well as hard-coded life-forms for many of the nonvegetated, urban, agricultural, and ruderal EVTs. The remaining attributes included in the EVT layer are unchanged from previous versions of LANDFIRE EVT legends.
Barren and Sparse Mapping Feedback related to the first version of LANDFIRE fuel data identified a need to improve
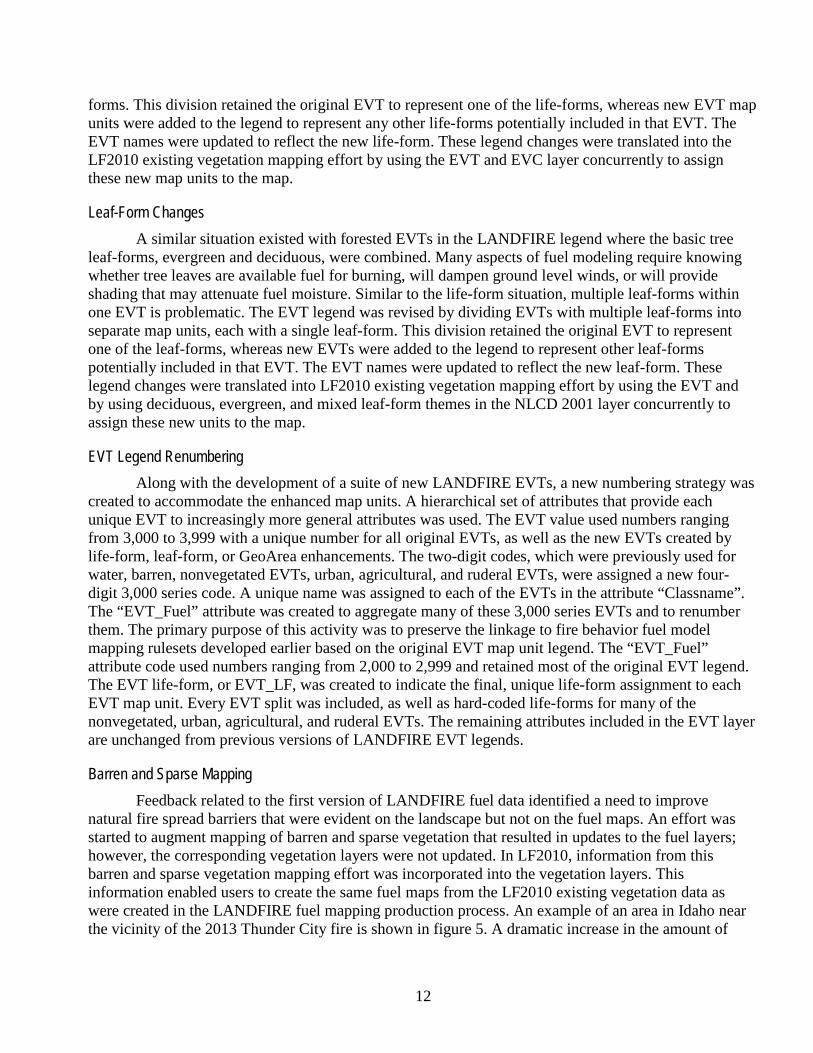
natural fire spread barriers that were evident on the landscape but not on the fuel maps. An effort was started to augment mapping of barren and sparse vegetation that resulted in updates to the fuel layers; however, the corresponding vegetation layers were not updated. In LF2010, information from this barren and sparse vegetation mapping effort was incorporated into the vegetation layers. This information enabled users to create the same fuel maps from the LF2010 existing vegetation data as were created in the LANDFIRE fuel mapping production process. An example of an area in Idaho near the vicinity of the 2013 Thunder City fire is shown in figure 5. A dramatic increase in the amount of
13
nonburnable areas from LF2008 (fig. 5B) to LF2010 (fig. 5C) exists, resulting from the augmented barren and sparse layers.
Figure 5. Depiction of nonburnable barren and sparsely vegetated areas near the 2013 Thunder City fire in Idaho. An overview of the fire area is depicted in 5A, Landscape Fire and Resource Management Planning Tools program 2008 Fire Behavior Fuel Models (FBFMs) in 5B, and Landscape Fire and Resource Management Planning Tools program 2010 FBFMs in 5C.
Refinements to Existing Vegetation Height and Cover The LANDFIRE final deliverables of EVT, EVC, and EVH are separate products that are
consistent by life-form for every pixel. Initial mapping of these products (completed in LANDFIRE National) entailed creating an individual wall-to-wall map for each life-form so that each pixel began with as many as three possible EVC and EVH values. The assignment of EVC and EVH in the final map product was contingent on the life-form of the EVT; therefore, if at a certain pixel the EVT was determined to be a forest EVT, then a forest EVC code and a forest EVH code were mapped into that pixel on the final map. If at a certain pixel the EVT was determined to be a shrub EVT, then a shrub EVC code and a shrub EVH code were mapped into that pixel on the final map. If at a certain pixel the EVT was determined to be an herbaceous EVT, then an herbaceous EVC code and an herbaceous EVH code were mapped into that pixel on the final map.
EVH and EVC were remapped for the LF2001 data release. The primary focus was on remapping of forest cover and forest height (Nelson and others, 2013a). The LF2001 EVH and EVC values for herbaceous and shrub EVTs used the LANDFIRE National EVH and EVC data and were not remapped. As part of the LANDFIRE National mapping process, shrub and herbaceous EVC values were normalized using an algorithm that adjusted shrub and herbaceous cover based on the dominant life-form of the EVT. The EVC had to have a minimum of 10 percent cover of the dominant life-form in that EVT, and the cover of any overstory life-form in the EVC had to be less than 10 percent if the EVT indicated an understory life-form. For example, if the EVT indicated a shrubland EVT, the EVC layer was adjusted so there was less than 10 percent forest cover and at least 10 percent shrubland cover.
For the LF2010 effort, EVH and EVC mapping were completed before transition modeling utilizing the six wall-to-wall intermediate product layers portraying EVH and EVC values for each tree, shrub, and herbaceous life-form for every pixel in the map. Tree EVH and EVC values were derived from wall-to-wall layers based on remapping of tree cover and tree height during the creation of LF2001 data. Shrub and herbaceous EVH and EVC values were based on wall-to-wall layers created during the LANDFIRE National mapping effort, with EVC values used for the layers before being normalized. LF2010 products were then created using an updating process that characterized changes in vegetation due to disturbance activities from 2001 through 2010 and accounted for areas that experienced changes due to vegetation growth and regeneration.
14
Vegetation Transition Modeling The primary focus for updating the LANDFIRE existing vegetation layers was to characterize
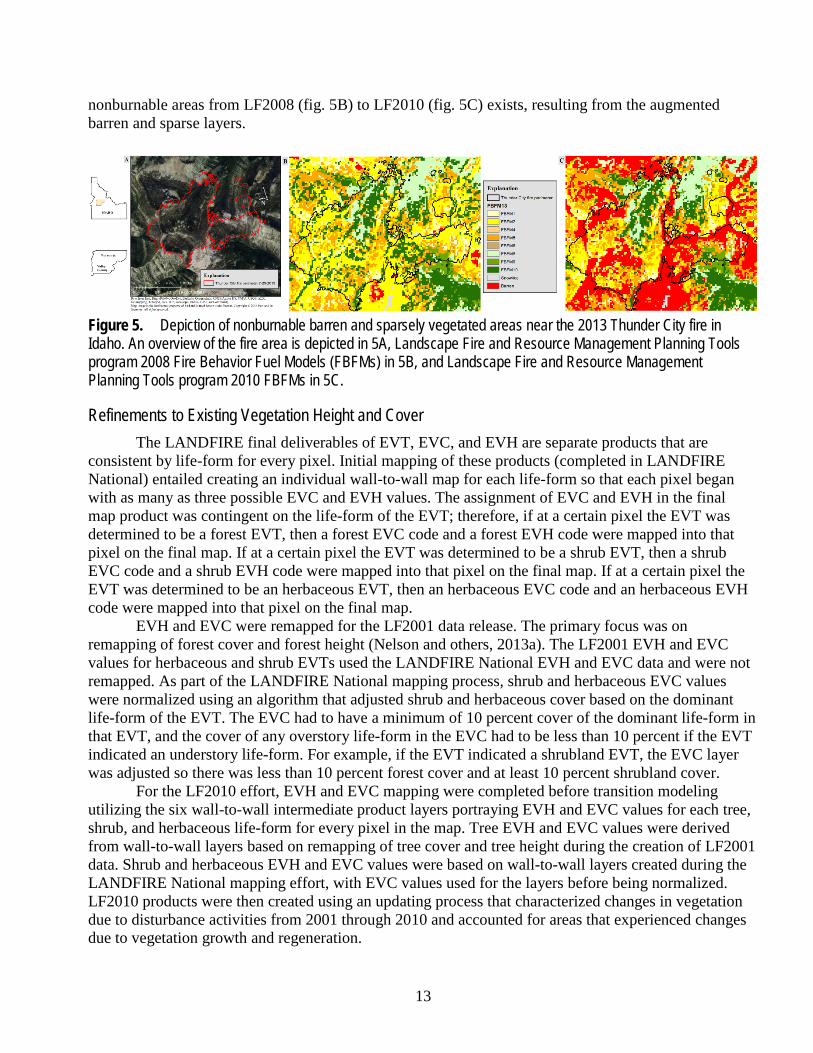
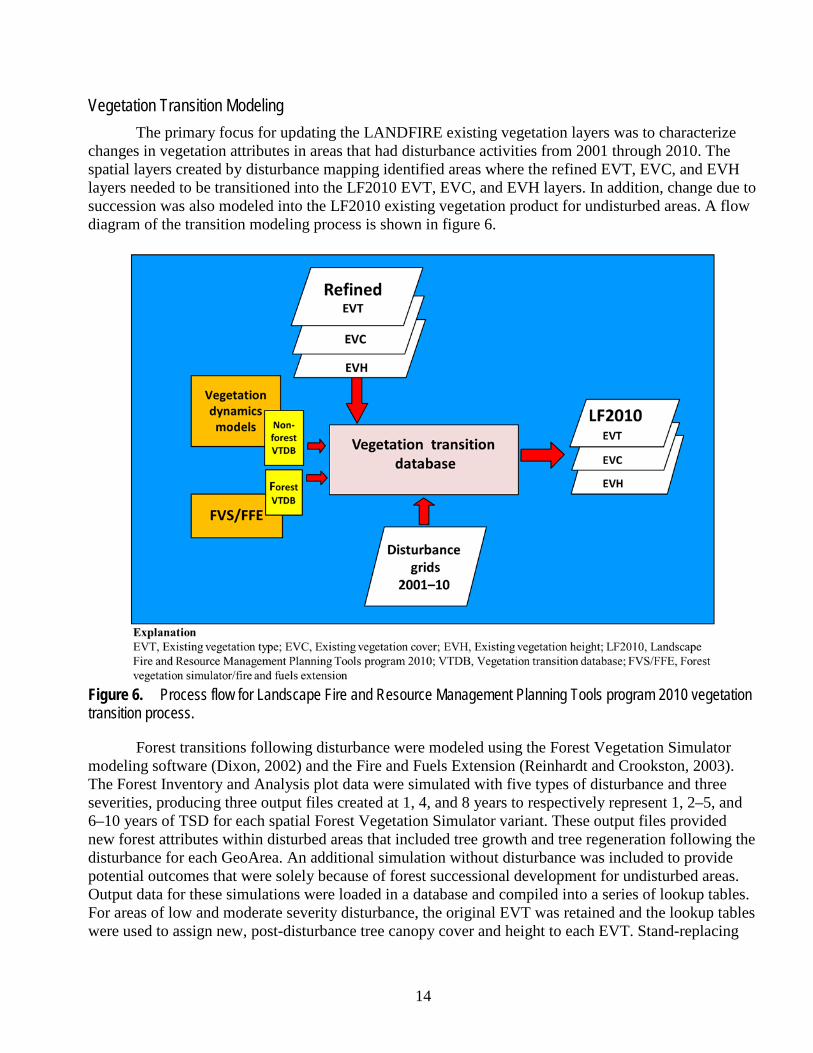
changes in vegetation attributes in areas that had disturbance activities from 2001 through 2010. The spatial layers created by disturbance mapping identified areas where the refined EVT, EVC, and EVH layers needed to be transitioned into the LF2010 EVT, EVC, and EVH layers. In addition, change due to succession was also modeled into the LF2010 existing vegetation product for undisturbed areas. A flow diagram of the transition modeling process is shown in figure 6.
Figure 6. Process flow for Landscape Fire and Resource Management Planning Tools program 2010 vegetation transition process.
Forest transitions following disturbance were modeled using the Forest Vegetation Simulator modeling software (Dixon, 2002) and the Fire and Fuels Extension (Reinhardt and Crookston, 2003). The Forest Inventory and Analysis plot data were simulated with five types of disturbance and three severities, producing three output files created at 1, 4, and 8 years to respectively represent 1, 2–5, and 6–10 years of TSD for each spatial Forest Vegetation Simulator variant. These output files provided new forest attributes within disturbed areas that included tree growth and tree regeneration following the disturbance for each GeoArea. An additional simulation without disturbance was included to provide potential outcomes that were solely because of forest successional development for undisturbed areas. Output data for these simulations were loaded in a database and compiled into a series of lookup tables. For areas of low and moderate severity disturbance, the original EVT was retained and the lookup tables were used to assign new, post-disturbance tree canopy cover and height to each EVT. Stand-replacing
15
events, such as high severity fire and timber harvests in forested EVTs, were transitioned to an herbaceous or shrub EVT with appropriate cover and height for an early seral expression of that EVT and geographic location. These new forest EVT, EVC, and EVH values were then used to create the LF2010 existing vegetation data.
Nonforest transitions were assigned using information developed internally by LANDFIRE staff ecologists. A Vegetation Transition Database was developed for each GeoArea to generate vegetation transitions that were assigned to each EVT, EVC, and EVH for each disturbance type, severity class, and TSD class. Early seral successional class information was mined from the Vegetation Dynamics Models in that GeoArea and was used to inform the cover and height transitions. The Vegetation Transition Database was used to update the existing attribute tables associated with EVT, EVC, and EVH layers. In shrub EVTs, all fire severities were considered stand replacing, so all burned nonforested areas were replaced by an herbaceous EVT that would be expected in that area. Chemical treatments were assumed to be used on exotic species; therefore, a native herbaceous community for that local or regional area replaced the introduced EVT. Mechanical treatments were treated similarly to fire disturbances and transitioned to an herbaceous community. Introduced annual grasses replaced some shrub-dominated EVTs in lowland areas (for example, western U.S. Great Basin and Columbia Plateau shrubland EVTs). In herbaceous EVTs, disturbed areas were not transitioned to different EVTs because these communities rapidly re-establish themselves after disturbance.
During the 10-year modeling interval, the assumption was made that some herbaceous and shrub communities would begin to transition to forested communities in the absence of disturbance. These sites were typically within forested communities where nonforested EVTs existed; generally in areas of older disturbance. In these situations, shrub and herbaceous communities were transitioned to an appropriate forested EVT and assigned a small tree cover and height class. The connections between LANDFIRE Environmental Site Potential data and these shrub and herbaceous communities were used to predict the new forested EVT at a particular site.
Update Process: Alaska The LF2010 vegetation update process in Alaska followed the same refinement and updating
processes as in CONUS. In addition, some further refinement of the EVT layer was completed based on feedback received from local users, and the forested EVH values were remapped using additional datasets and new algorithms (Peterson and Nelson, 2014).
Refinements to Existing Vegetation Type The same processes used in the CONUS vegetation update to account for life-form and leaf-form
delineation, along with renumbering of EVT classes, were used in Alaska with the same legend changes. In addition, several refinements to the EVT map were made based on feedback received from a workshop held in 2011 in Fairbanks, Alaska. Attendees of the workshop reviewed the LANDFIRE vegetation, disturbance, and fire behavior fuel model datasets and provided input on the quality of these data. Most of these changes involved specific areas that used local knowledge to achieve small scale enhancements. Many of these edits involved changing pixel values in response to certain vegetation types being out of range and not existing in particular areas. Confusion in mapping certain species; for example, white spruce as compared to black spruce, western hemlock as compared to mountain hemlock, or alder and salmonberry as compared to willow species, resulted in the vegetation types being mapped out of their expected range. EVT maps from each original mapping zone were addressed individually with the refinements and then combined back together to produce a new pretransition Alaska EVT map.
16
Remapping of Existing Vegetation Height Previous versions of EVH in Alaska were mapped in broad categories because of a lack of
detailed field data to support any additional thematic resolution in the height legend. Forest height in particular was mapped to only two classes with a breakpoint at 10 meters. This lack of resolution in the forest height data limits the utility of the height layer for assigning surface fuel models and for use in fire behavior modeling.
Previous work with spaceborne light detection and ranging data from the Geoscience Laser Altimeter System (GLAS) enabled a remapping effort as part of LF2010 to replace the forest height map with a more accurate and greater thematic resolution layer (Peterson and Nelson, 2014). The GLAS data provide fully digitized waveform samples along orbital tracks approximately 170 meters apart with a nominal footprint size measuring 60 meters (Harding and Carabajal, 2005). The orbital tracks were optimized to collect data near the poles for cryospheric research yielding a dense sampling of Alaska. The data were filtered to remove waveforms in nonforested areas, waveforms with large noise content, and waveforms that failed a series of quality control checks. Waveforms over high relief areas were corrected for slope effects. The resultant waveforms were processed to compute canopy height and each waveform was then used as training data in a regression tree model to extrapolate the canopy height metric spatially across the State. Independent data layers used in the regression tree model included Web-Enabled Landsat Data (WELD) composite imagery, elevation data and derivatives, and life-form data from the LANDFIRE EVT. The WELD provides tiled composites of Landsat 7 data for CONUS and Alaska at weekly, monthly, seasonal, and annual time steps (Roy and others, 2010). Even at annual time steps, areas of no data and noticeable artifact still existed because of scan-line gaps in the WELD composites; therefore, for the EVH remap, annual WELD composites were acquired from 2003 to 2012 and were combined into a single super-composite based on the maximum Normalized Difference Vegetation Index of each pixel within the entire time frame. The incidence of data anomalies and filled in areas of no data, therefore, were substantially reduced. Some scan-line anomalies still persisted, primarily in the southeastern part of the State, but the anomalies were considerably less prevalent than in the individual WELD annual composites (Peterson and Nelson, 2014).
Forest canopy height (CH) was mapped continuously using the regression tree model trained with GLAS data. The resultant map was evaluated qualitatively and quantitatively using sparsely available field data, (Peterson and Nelson, 2014). Modifications to the map were made in specific areas where model errors were noticed. The resultant map was binned into 5-meter classes from 0 to 45 meters. For consistency, the layer was then further collapsed to match the CONUS canopy height legend. This layer was integrated into the updated EVH layer and was used in updating the surface and canopy fuel layers.
Update Process: Hawaii Vegetation updates were developed based on local expert input. A series of rules were created to
capture post-disturbance transitions in vegetation type, height, and cover based on the disturbance severity and TSD. These rules were applied to disturbed areas to produce the updated vegetation layers.
Update Results: CONUS Implementation of refinements to the LF2010 existing vegetation themes had definite results on
the final products. This section relates to some of those changes by focusing on one of the several LF2010 GeoAreas to illustrate each change in a tabular fashion. A spatial agreement assessment that
17
matches the mapped EVT layer to plot data in sampled locations is planned; however, the assessment is not available at this time.
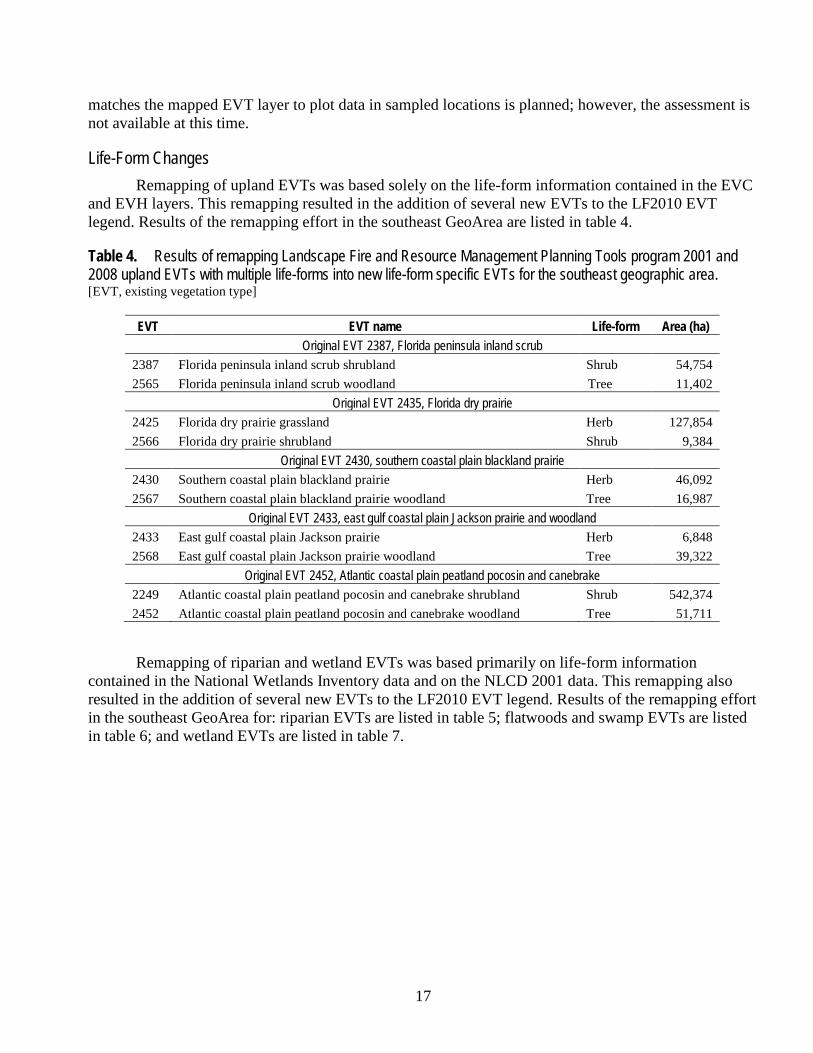
Life-Form Changes Remapping of upland EVTs was based solely on the life-form information contained in the EVC
and EVH layers. This remapping resulted in the addition of several new EVTs to the LF2010 EVT legend. Results of the remapping effort in the southeast GeoArea are listed in table 4.
Table 4. Results of remapping Landscape Fire and Resource Management Planning Tools program 2001 and 2008 upland EVTs with multiple life-forms into new life-form specific EVTs for the southeast geographic area. [EVT, existing vegetation type]
EVT EVT name Life-form Area (ha) Original EVT 2387, Florida peninsula inland scrub
2387 Florida peninsula inland scrub shrubland Shrub 54,754 2565 Florida peninsula inland scrub woodland Tree 11,402
Original EVT 2435, Florida dry prairie 2425 Florida dry prairie grassland Herb 127,854 2566 Florida dry prairie shrubland Shrub 9,384
Original EVT 2430, southern coastal plain blackland prairie 2430 Southern coastal plain blackland prairie Herb 46,092 2567 Southern coastal plain blackland prairie woodland Tree 16,987
Original EVT 2433, east gulf coastal plain Jackson prairie and woodland 2433 East gulf coastal plain Jackson prairie Herb 6,848 2568 East gulf coastal plain Jackson prairie woodland Tree 39,322
Original EVT 2452, Atlantic coastal plain peatland pocosin and canebrake 2249 Atlantic coastal plain peatland pocosin and canebrake shrubland Shrub 542,374 2452 Atlantic coastal plain peatland pocosin and canebrake woodland Tree 51,711
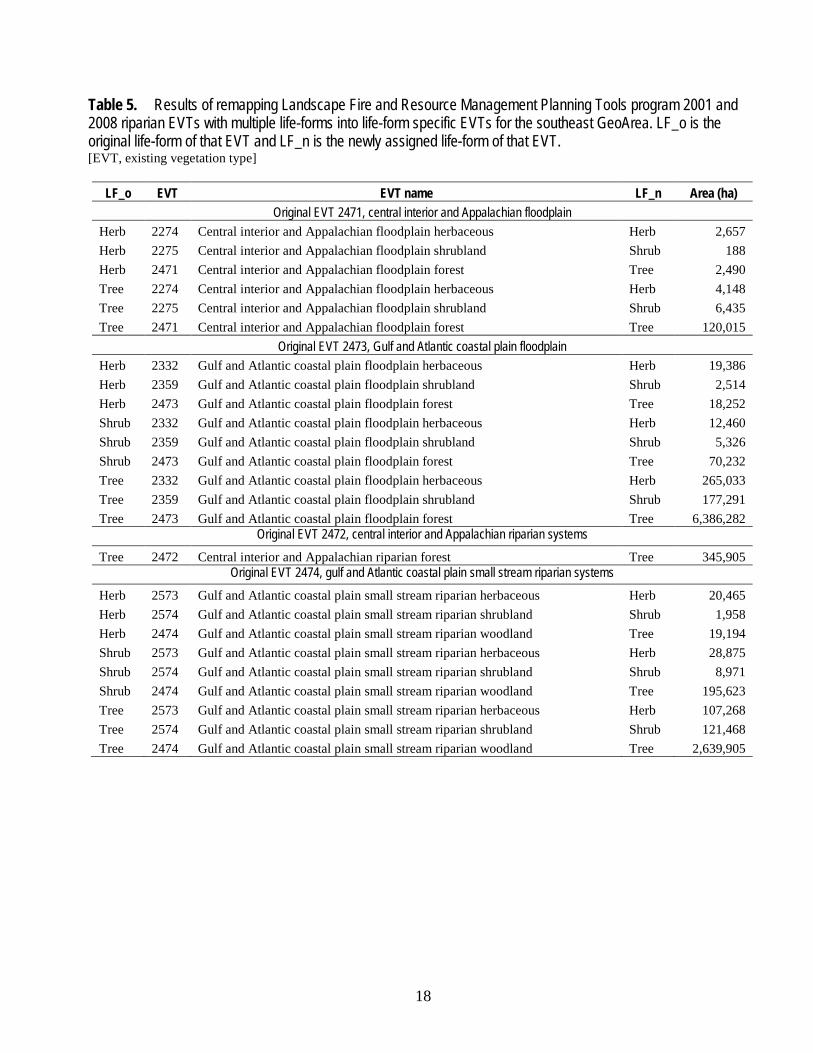
Remapping of riparian and wetland EVTs was based primarily on life-form information contained in the National Wetlands Inventory data and on the NLCD 2001 data. This remapping also resulted in the addition of several new EVTs to the LF2010 EVT legend. Results of the remapping effort in the southeast GeoArea for: riparian EVTs are listed in table 5; flatwoods and swamp EVTs are listed in table 6; and wetland EVTs are listed in table 7.
18
Table 5. Results of remapping Landscape Fire and Resource Management Planning Tools program 2001 and 2008 riparian EVTs with multiple life-forms into life-form specific EVTs for the southeast GeoArea. LF_o is the original life-form of that EVT and LF_n is the newly assigned life-form of that EVT. [EVT, existing vegetation type]
LF_o EVT EVT name LF_n Area (ha) Original EVT 2471, central interior and Appalachian floodplain
Herb 2274 Central interior and Appalachian floodplain herbaceous Herb 2,657 Herb 2275 Central interior and Appalachian floodplain shrubland Shrub 188 Herb 2471 Central interior and Appalachian floodplain forest Tree 2,490 Tree 2274 Central interior and Appalachian floodplain herbaceous Herb 4,148 Tree 2275 Central interior and Appalachian floodplain shrubland Shrub 6,435 Tree 2471 Central interior and Appalachian floodplain forest Tree 120,015
Original EVT 2473, Gulf and Atlantic coastal plain floodplain Herb 2332 Gulf and Atlantic coastal plain floodplain herbaceous Herb 19,386 Herb 2359 Gulf and Atlantic coastal plain floodplain shrubland Shrub 2,514 Herb 2473 Gulf and Atlantic coastal plain floodplain forest Tree 18,252 Shrub 2332 Gulf and Atlantic coastal plain floodplain herbaceous Herb 12,460 Shrub 2359 Gulf and Atlantic coastal plain floodplain shrubland Shrub 5,326 Shrub 2473 Gulf and Atlantic coastal plain floodplain forest Tree 70,232 Tree 2332 Gulf and Atlantic coastal plain floodplain herbaceous Herb 265,033 Tree 2359 Gulf and Atlantic coastal plain floodplain shrubland Shrub 177,291 Tree 2473 Gulf and Atlantic coastal plain floodplain forest Tree 6,386,282
Original EVT 2472, central interior and Appalachian riparian systems Tree 2472 Central interior and Appalachian riparian forest Tree 345,905
Original EVT 2474, gulf and Atlantic coastal plain small stream riparian systems Herb 2573 Gulf and Atlantic coastal plain small stream riparian herbaceous Herb 20,465
Herb 2574 Gulf and Atlantic coastal plain small stream riparian shrubland Shrub 1,958 Herb 2474 Gulf and Atlantic coastal plain small stream riparian woodland Tree 19,194 Shrub 2573 Gulf and Atlantic coastal plain small stream riparian herbaceous Herb 28,875 Shrub 2574 Gulf and Atlantic coastal plain small stream riparian shrubland Shrub 8,971 Shrub 2474 Gulf and Atlantic coastal plain small stream riparian woodland Tree 195,623 Tree 2573 Gulf and Atlantic coastal plain small stream riparian herbaceous Herb 107,268 Tree 2574 Gulf and Atlantic coastal plain small stream riparian shrubland Shrub 121,468 Tree 2474 Gulf and Atlantic coastal plain small stream riparian woodland Tree 2,639,905
19
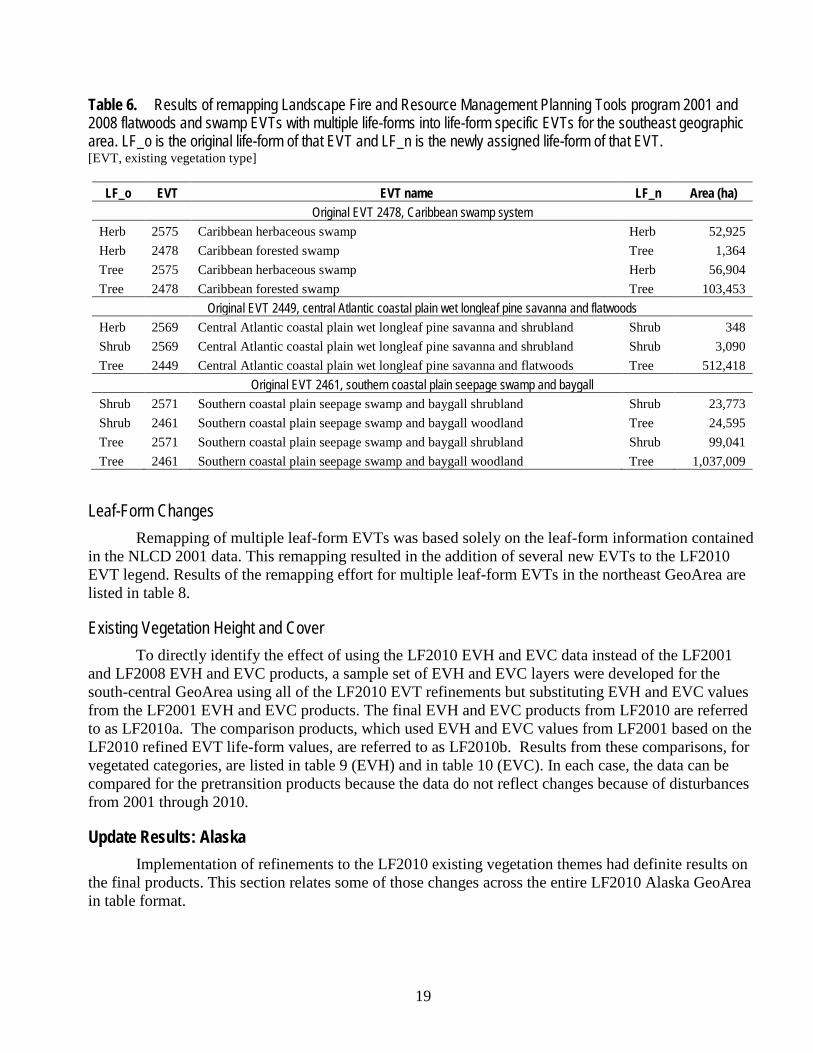
Table 6. Results of remapping Landscape Fire and Resource Management Planning Tools program 2001 and 2008 flatwoods and swamp EVTs with multiple life-forms into life-form specific EVTs for the southeast geographic area. LF_o is the original life-form of that EVT and LF_n is the newly assigned life-form of that EVT. [EVT, existing vegetation type]
LF_o EVT EVT name LF_n Area (ha) Original EVT 2478, Caribbean swamp system
Herb 2575 Caribbean herbaceous swamp Herb 52,925 Herb 2478 Caribbean forested swamp Tree 1,364 Tree 2575 Caribbean herbaceous swamp Herb 56,904 Tree 2478 Caribbean forested swamp Tree 103,453
Original EVT 2449, central Atlantic coastal plain wet longleaf pine savanna and flatwoods Herb 2569 Central Atlantic coastal plain wet longleaf pine savanna and shrubland Shrub 348 Shrub 2569 Central Atlantic coastal plain wet longleaf pine savanna and shrubland Shrub 3,090 Tree 2449 Central Atlantic coastal plain wet longleaf pine savanna and flatwoods Tree 512,418
Original EVT 2461, southern coastal plain seepage swamp and baygall Shrub 2571 Southern coastal plain seepage swamp and baygall shrubland Shrub 23,773 Shrub 2461 Southern coastal plain seepage swamp and baygall woodland Tree 24,595 Tree 2571 Southern coastal plain seepage swamp and baygall shrubland Shrub 99,041 Tree 2461 Southern coastal plain seepage swamp and baygall woodland Tree 1,037,009
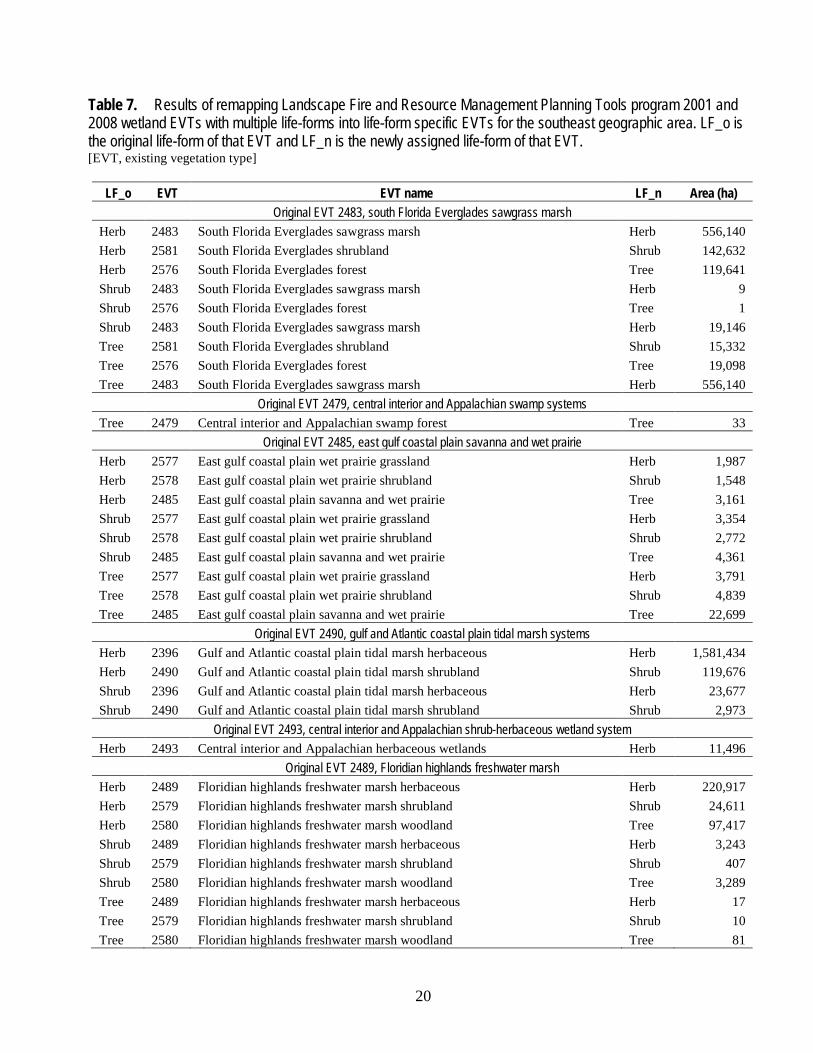
Leaf-Form Changes Remapping of multiple leaf-form EVTs was based solely on the leaf-form information contained
in the NLCD 2001 data. This remapping resulted in the addition of several new EVTs to the LF2010 EVT legend. Results of the remapping effort for multiple leaf-form EVTs in the northeast GeoArea are listed in table 8.
Existing Vegetation Height and Cover To directly identify the effect of using the LF2010 EVH and EVC data instead of the LF2001
and LF2008 EVH and EVC products, a sample set of EVH and EVC layers were developed for the south-central GeoArea using all of the LF2010 EVT refinements but substituting EVH and EVC values from the LF2001 EVH and EVC products. The final EVH and EVC products from LF2010 are referred to as LF2010a. The comparison products, which used EVH and EVC values from LF2001 based on the LF2010 refined EVT life-form values, are referred to as LF2010b. Results from these comparisons, for vegetated categories, are listed in table 9 (EVH) and in table 10 (EVC). In each case, the data can be compared for the pretransition products because the data do not reflect changes because of disturbances from 2001 through 2010.
Update Results: Alaska Implementation of refinements to the LF2010 existing vegetation themes had definite results on
the final products. This section relates some of those changes across the entire LF2010 Alaska GeoArea in table format.
20
Table 7. Results of remapping Landscape Fire and Resource Management Planning Tools program 2001 and 2008 wetland EVTs with multiple life-forms into life-form specific EVTs for the southeast geographic area. LF_o is the original life-form of that EVT and LF_n is the newly assigned life-form of that EVT. [EVT, existing vegetation type]
LF_o EVT EVT name LF_n Area (ha) Original EVT 2483, south Florida Everglades sawgrass marsh
Herb 2483 South Florida Everglades sawgrass marsh Herb 556,140 Herb 2581 South Florida Everglades shrubland Shrub 142,632 Herb 2576 South Florida Everglades forest Tree 119,641 Shrub 2483 South Florida Everglades sawgrass marsh Herb 9 Shrub 2576 South Florida Everglades forest Tree 1 Shrub 2483 South Florida Everglades sawgrass marsh Herb 19,146 Tree 2581 South Florida Everglades shrubland Shrub 15,332 Tree 2576 South Florida Everglades forest Tree 19,098 Tree 2483 South Florida Everglades sawgrass marsh Herb 556,140
Original EVT 2479, central interior and Appalachian swamp systems Tree 2479 Central interior and Appalachian swamp forest Tree 33
Original EVT 2485, east gulf coastal plain savanna and wet prairie Herb 2577 East gulf coastal plain wet prairie grassland Herb 1,987 Herb 2578 East gulf coastal plain wet prairie shrubland Shrub 1,548 Herb 2485 East gulf coastal plain savanna and wet prairie Tree 3,161 Shrub 2577 East gulf coastal plain wet prairie grassland Herb 3,354 Shrub 2578 East gulf coastal plain wet prairie shrubland Shrub 2,772 Shrub 2485 East gulf coastal plain savanna and wet prairie Tree 4,361 Tree 2577 East gulf coastal plain wet prairie grassland Herb 3,791 Tree 2578 East gulf coastal plain wet prairie shrubland Shrub 4,839 Tree 2485 East gulf coastal plain savanna and wet prairie Tree 22,699
Original EVT 2490, gulf and Atlantic coastal plain tidal marsh systems Herb 2396 Gulf and Atlantic coastal plain tidal marsh herbaceous Herb 1,581,434 Herb 2490 Gulf and Atlantic coastal plain tidal marsh shrubland Shrub 119,676 Shrub 2396 Gulf and Atlantic coastal plain tidal marsh herbaceous Herb 23,677 Shrub 2490 Gulf and Atlantic coastal plain tidal marsh shrubland Shrub 2,973
Original EVT 2493, central interior and Appalachian shrub-herbaceous wetland system Herb 2493 Central interior and Appalachian herbaceous wetlands Herb 11,496
Original EVT 2489, Floridian highlands freshwater marsh Herb 2489 Floridian highlands freshwater marsh herbaceous Herb 220,917 Herb 2579 Floridian highlands freshwater marsh shrubland Shrub 24,611 Herb 2580 Floridian highlands freshwater marsh woodland Tree 97,417 Shrub 2489 Floridian highlands freshwater marsh herbaceous Herb 3,243 Shrub 2579 Floridian highlands freshwater marsh shrubland Shrub 407 Shrub 2580 Floridian highlands freshwater marsh woodland Tree 3,289 Tree 2489 Floridian highlands freshwater marsh herbaceous Herb 17 Tree 2579 Floridian highlands freshwater marsh shrubland Shrub 10 Tree 2580 Floridian highlands freshwater marsh woodland Tree 81
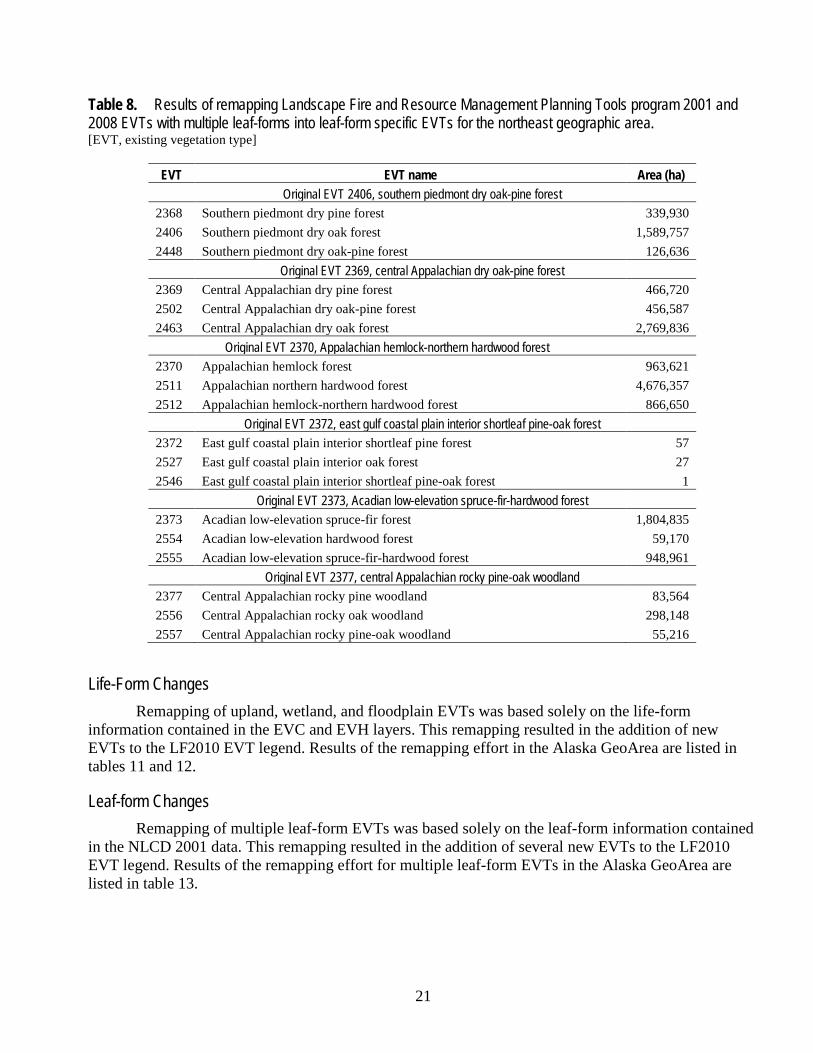
21
Table 8. Results of remapping Landscape Fire and Resource Management Planning Tools program 2001 and 2008 EVTs with multiple leaf-forms into leaf-form specific EVTs for the northeast geographic area. [EVT, existing vegetation type]
EVT EVT name Area (ha) Original EVT 2406, southern piedmont dry oak-pine forest
2368 Southern piedmont dry pine forest 339,930 2406 Southern piedmont dry oak forest 1,589,757 2448 Southern piedmont dry oak-pine forest 126,636
Original EVT 2369, central Appalachian dry oak-pine forest 2369 Central Appalachian dry pine forest 466,720 2502 Central Appalachian dry oak-pine forest 456,587 2463 Central Appalachian dry oak forest 2,769,836
Original EVT 2370, Appalachian hemlock-northern hardwood forest 2370 Appalachian hemlock forest 963,621 2511 Appalachian northern hardwood forest 4,676,357 2512 Appalachian hemlock-northern hardwood forest 866,650
Original EVT 2372, east gulf coastal plain interior shortleaf pine-oak forest 2372 East gulf coastal plain interior shortleaf pine forest 57 2527 East gulf coastal plain interior oak forest 27 2546 East gulf coastal plain interior shortleaf pine-oak forest 1
Original EVT 2373, Acadian low-elevation spruce-fir-hardwood forest 2373 Acadian low-elevation spruce-fir forest 1,804,835 2554 Acadian low-elevation hardwood forest 59,170 2555 Acadian low-elevation spruce-fir-hardwood forest 948,961
Original EVT 2377, central Appalachian rocky pine-oak woodland 2377 Central Appalachian rocky pine woodland 83,564 2556 Central Appalachian rocky oak woodland 298,148 2557 Central Appalachian rocky pine-oak woodland 55,216
Life-Form Changes Remapping of upland, wetland, and floodplain EVTs was based solely on the life-form
information contained in the EVC and EVH layers. This remapping resulted in the addition of new EVTs to the LF2010 EVT legend. Results of the remapping effort in the Alaska GeoArea are listed in tables 11 and 12.
Leaf-form Changes Remapping of multiple leaf-form EVTs was based solely on the leaf-form information contained
in the NLCD 2001 data. This remapping resulted in the addition of several new EVTs to the LF2010 EVT legend. Results of the remapping effort for multiple leaf-form EVTs in the Alaska GeoArea are listed in table 13.
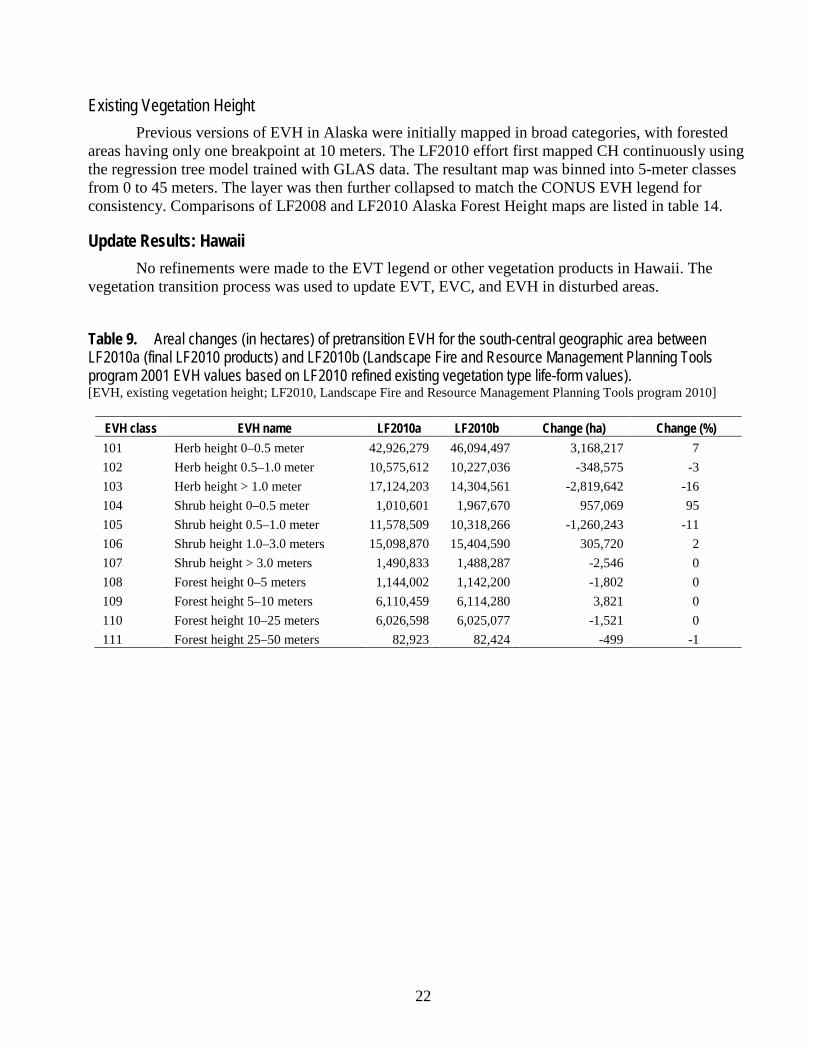
22
Existing Vegetation Height Previous versions of EVH in Alaska were initially mapped in broad categories, with forested
areas having only one breakpoint at 10 meters. The LF2010 effort first mapped CH continuously using the regression tree model trained with GLAS data. The resultant map was binned into 5-meter classes from 0 to 45 meters. The layer was then further collapsed to match the CONUS EVH legend for consistency. Comparisons of LF2008 and LF2010 Alaska Forest Height maps are listed in table 14.
Update Results: Hawaii No refinements were made to the EVT legend or other vegetation products in Hawaii. The
vegetation transition process was used to update EVT, EVC, and EVH in disturbed areas.
Table 9. Areal changes (in hectares) of pretransition EVH for the south-central geographic area between LF2010a (final LF2010 products) and LF2010b (Landscape Fire and Resource Management Planning Tools program 2001 EVH values based on LF2010 refined existing vegetation type life-form values). [EVH, existing vegetation height; LF2010, Landscape Fire and Resource Management Planning Tools program 2010]
EVH class EVH name LF2010a LF2010b Change (ha) Change (%) 101 Herb height 0–0.5 meter 42,926,279 46,094,497 3,168,217 7 102 Herb height 0.5–1.0 meter 10,575,612 10,227,036 -348,575 -3 103 Herb height > 1.0 meter 17,124,203 14,304,561 -2,819,642 -16 104 Shrub height 0–0.5 meter 1,010,601 1,967,670 957,069 95 105 Shrub height 0.5–1.0 meter 11,578,509 10,318,266 -1,260,243 -11 106 Shrub height 1.0–3.0 meters 15,098,870 15,404,590 305,720 2 107 Shrub height > 3.0 meters 1,490,833 1,488,287 -2,546 0 108 Forest height 0–5 meters 1,144,002 1,142,200 -1,802 0 109 Forest height 5–10 meters 6,110,459 6,114,280 3,821 0 110 Forest height 10–25 meters 6,026,598 6,025,077 -1,521 0 111 Forest height 25–50 meters 82,923 82,424 -499 -1
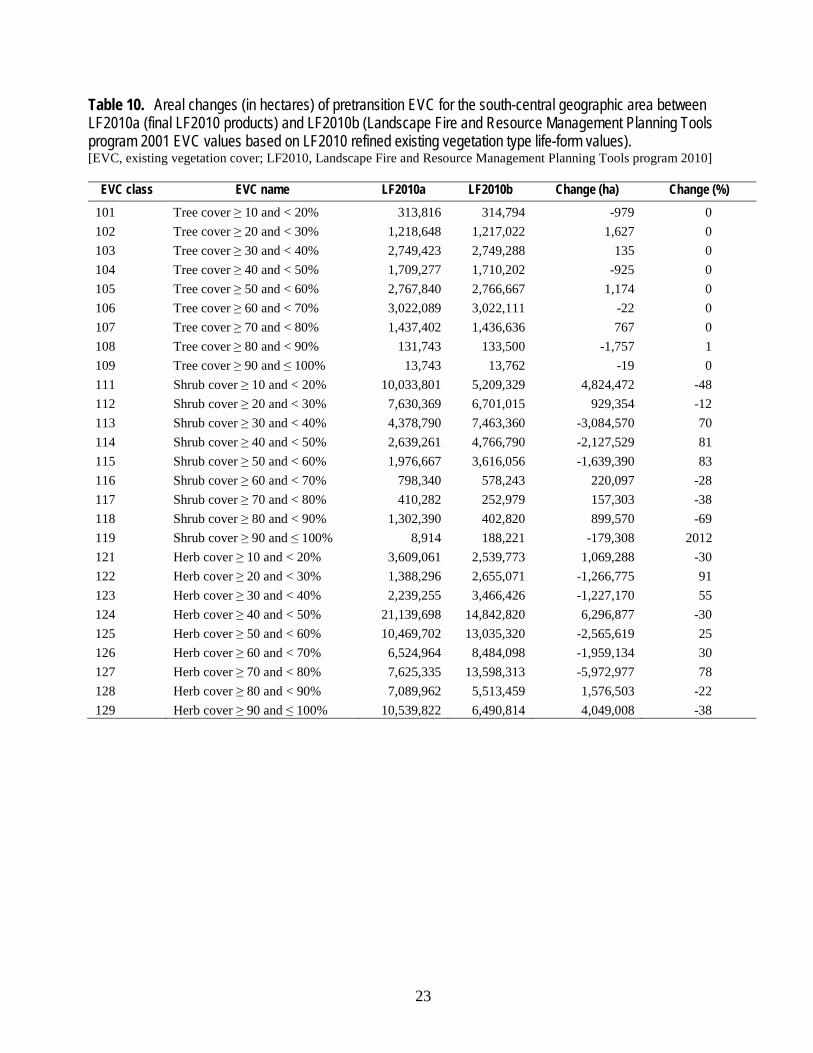
23
Table 10. Areal changes (in hectares) of pretransition EVC for the south-central geographic area between LF2010a (final LF2010 products) and LF2010b (Landscape Fire and Resource Management Planning Tools program 2001 EVC values based on LF2010 refined existing vegetation type life-form values). [EVC, existing vegetation cover; LF2010, Landscape Fire and Resource Management Planning Tools program 2010]
EVC class EVC name LF2010a LF2010b Change (ha) Change (%) 101 Tree cover ≥ 10 and < 20% 313,816 314,794 -979 0 102 Tree cover ≥ 20 and < 30% 1,218,648 1,217,022 1,627 0 103 Tree cover ≥ 30 and < 40% 2,749,423 2,749,288 135 0 104 Tree cover ≥ 40 and < 50% 1,709,277 1,710,202 -925 0 105 Tree cover ≥ 50 and < 60% 2,767,840 2,766,667 1,174 0 106 Tree cover ≥ 60 and < 70% 3,022,089 3,022,111 -22 0 107 Tree cover ≥ 70 and < 80% 1,437,402 1,436,636 767 0 108 Tree cover ≥ 80 and < 90% 131,743 133,500 -1,757 1 109 Tree cover ≥ 90 and ≤ 100% 13,743 13,762 -19 0 111 Shrub cover ≥ 10 and < 20% 10,033,801 5,209,329 4,824,472 -48 112 Shrub cover ≥ 20 and < 30% 7,630,369 6,701,015 929,354 -12 113 Shrub cover ≥ 30 and < 40% 4,378,790 7,463,360 -3,084,570 70 114 Shrub cover ≥ 40 and < 50% 2,639,261 4,766,790 -2,127,529 81 115 Shrub cover ≥ 50 and < 60% 1,976,667 3,616,056 -1,639,390 83 116 Shrub cover ≥ 60 and < 70% 798,340 578,243 220,097 -28 117 Shrub cover ≥ 70 and < 80% 410,282 252,979 157,303 -38 118 Shrub cover ≥ 80 and < 90% 1,302,390 402,820 899,570 -69 119 Shrub cover ≥ 90 and ≤ 100% 8,914 188,221 -179,308 2012 121 Herb cover ≥ 10 and < 20% 3,609,061 2,539,773 1,069,288 -30 122 Herb cover ≥ 20 and < 30% 1,388,296 2,655,071 -1,266,775 91 123 Herb cover ≥ 30 and < 40% 2,239,255 3,466,426 -1,227,170 55 124 Herb cover ≥ 40 and < 50% 21,139,698 14,842,820 6,296,877 -30 125 Herb cover ≥ 50 and < 60% 10,469,702 13,035,320 -2,565,619 25 126 Herb cover ≥ 60 and < 70% 6,524,964 8,484,098 -1,959,134 30 127 Herb cover ≥ 70 and < 80% 7,625,335 13,598,313 -5,972,977 78 128 Herb cover ≥ 80 and < 90% 7,089,962 5,513,459 1,576,503 -22 129 Herb cover ≥ 90 and ≤ 100% 10,539,822 6,490,814 4,049,008 -38
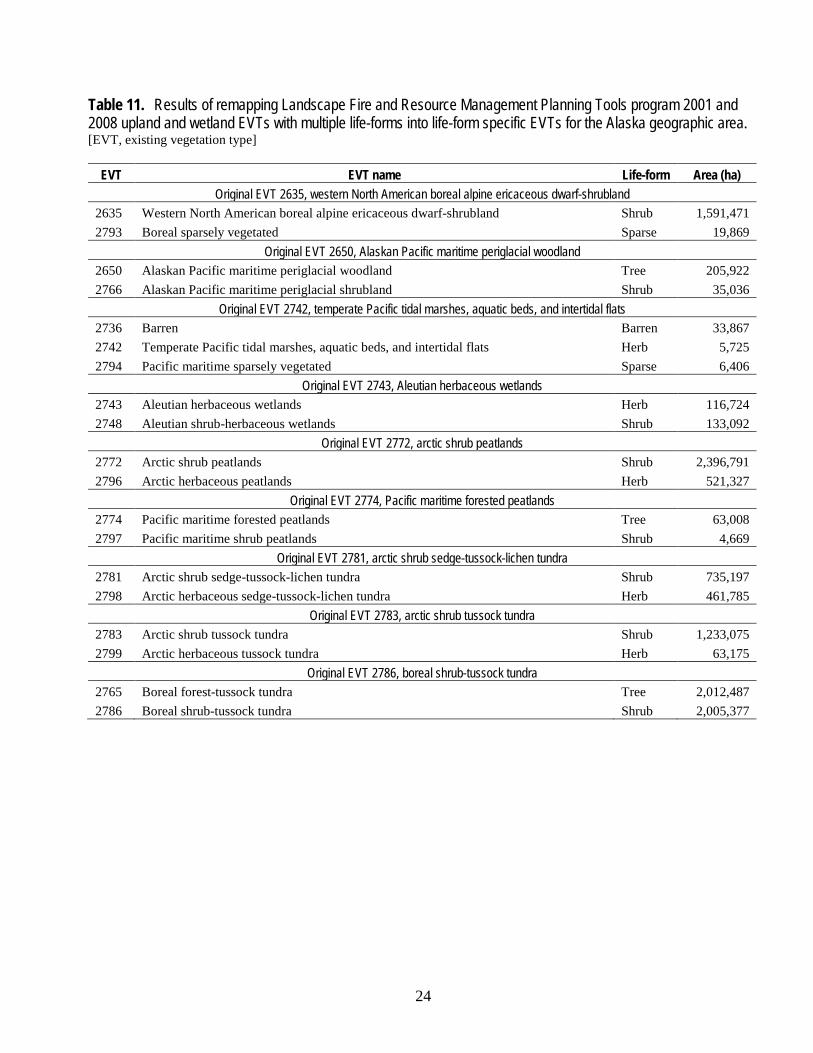
24
Table 11. Results of remapping Landscape Fire and Resource Management Planning Tools program 2001 and 2008 upland and wetland EVTs with multiple life-forms into life-form specific EVTs for the Alaska geographic area. [EVT, existing vegetation type]
EVT EVT name Life-form Area (ha) Original EVT 2635, western North American boreal alpine ericaceous dwarf-shrubland
2635 Western North American boreal alpine ericaceous dwarf-shrubland Shrub 1,591,471 2793 Boreal sparsely vegetated Sparse 19,869
Original EVT 2650, Alaskan Pacific maritime periglacial woodland 2650 Alaskan Pacific maritime periglacial woodland Tree 205,922 2766 Alaskan Pacific maritime periglacial shrubland Shrub 35,036
Original EVT 2742, temperate Pacific tidal marshes, aquatic beds, and intertidal flats 2736 Barren Barren 33,867 2742 Temperate Pacific tidal marshes, aquatic beds, and intertidal flats Herb 5,725 2794 Pacific maritime sparsely vegetated Sparse 6,406
Original EVT 2743, Aleutian herbaceous wetlands 2743 Aleutian herbaceous wetlands Herb 116,724 2748 Aleutian shrub-herbaceous wetlands Shrub 133,092
Original EVT 2772, arctic shrub peatlands 2772 Arctic shrub peatlands Shrub 2,396,791 2796 Arctic herbaceous peatlands Herb 521,327
Original EVT 2774, Pacific maritime forested peatlands 2774 Pacific maritime forested peatlands Tree 63,008 2797 Pacific maritime shrub peatlands Shrub 4,669
Original EVT 2781, arctic shrub sedge-tussock-lichen tundra 2781 Arctic shrub sedge-tussock-lichen tundra Shrub 735,197 2798 Arctic herbaceous sedge-tussock-lichen tundra Herb 461,785
Original EVT 2783, arctic shrub tussock tundra 2783 Arctic shrub tussock tundra Shrub 1,233,075 2799 Arctic herbaceous tussock tundra Herb 63,175
Original EVT 2786, boreal shrub-tussock tundra 2765 Boreal forest-tussock tundra Tree 2,012,487 2786 Boreal shrub-tussock tundra Shrub 2,005,377
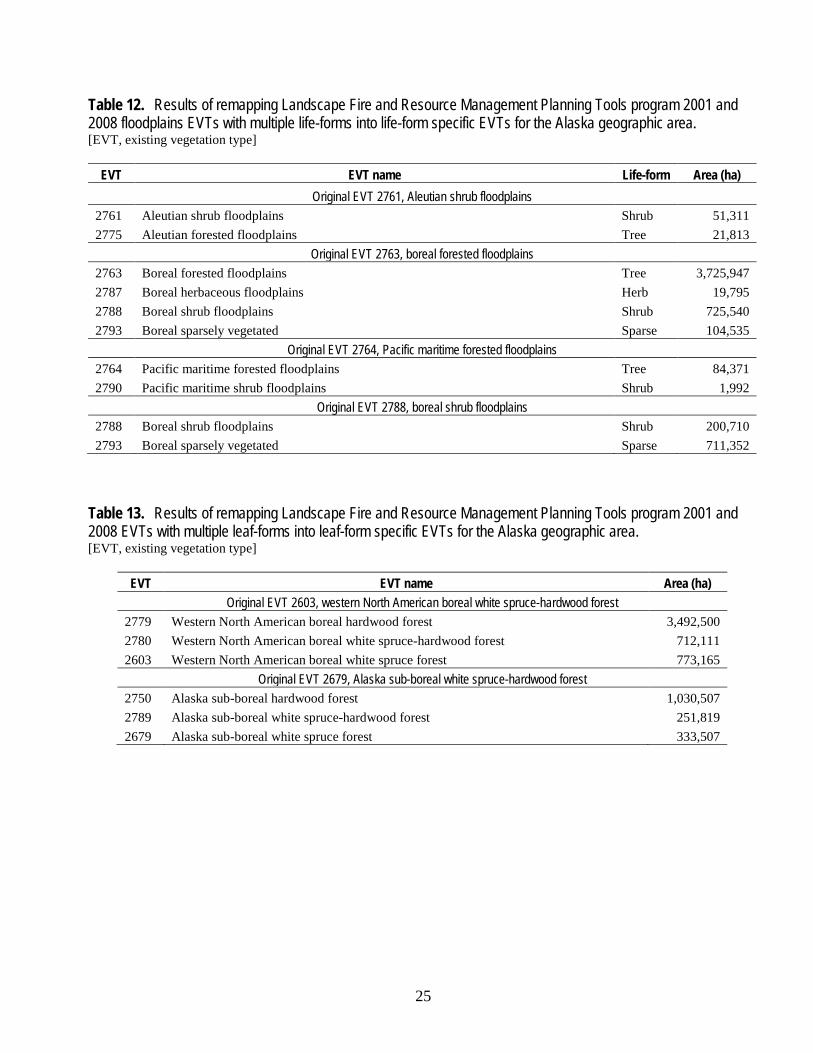
25
Table 12. Results of remapping Landscape Fire and Resource Management Planning Tools program 2001 and 2008 floodplains EVTs with multiple life-forms into life-form specific EVTs for the Alaska geographic area. [EVT, existing vegetation type]
EVT EVT name Life-form Area (ha) Original EVT 2761, Aleutian shrub floodplains
2761 Aleutian shrub floodplains Shrub 51,311 2775 Aleutian forested floodplains Tree 21,813
Original EVT 2763, boreal forested floodplains 2763 Boreal forested floodplains Tree 3,725,947 2787 Boreal herbaceous floodplains Herb 19,795 2788 Boreal shrub floodplains Shrub 725,540 2793 Boreal sparsely vegetated Sparse 104,535
Original EVT 2764, Pacific maritime forested floodplains 2764 Pacific maritime forested floodplains Tree 84,371 2790 Pacific maritime shrub floodplains Shrub 1,992
Original EVT 2788, boreal shrub floodplains 2788 Boreal shrub floodplains Shrub 200,710 2793 Boreal sparsely vegetated Sparse 711,352
Table 13. Results of remapping Landscape Fire and Resource Management Planning Tools program 2001 and 2008 EVTs with multiple leaf-forms into leaf-form specific EVTs for the Alaska geographic area. [EVT, existing vegetation type]
EVT EVT name Area (ha) Original EVT 2603, western North American boreal white spruce-hardwood forest
2779 Western North American boreal hardwood forest 3,492,500 2780 Western North American boreal white spruce-hardwood forest 712,111 2603 Western North American boreal white spruce forest 773,165
Original EVT 2679, Alaska sub-boreal white spruce-hardwood forest 2750 Alaska sub-boreal hardwood forest 1,030,507 2789 Alaska sub-boreal white spruce-hardwood forest 251,819 2679 Alaska sub-boreal white spruce forest 333,507
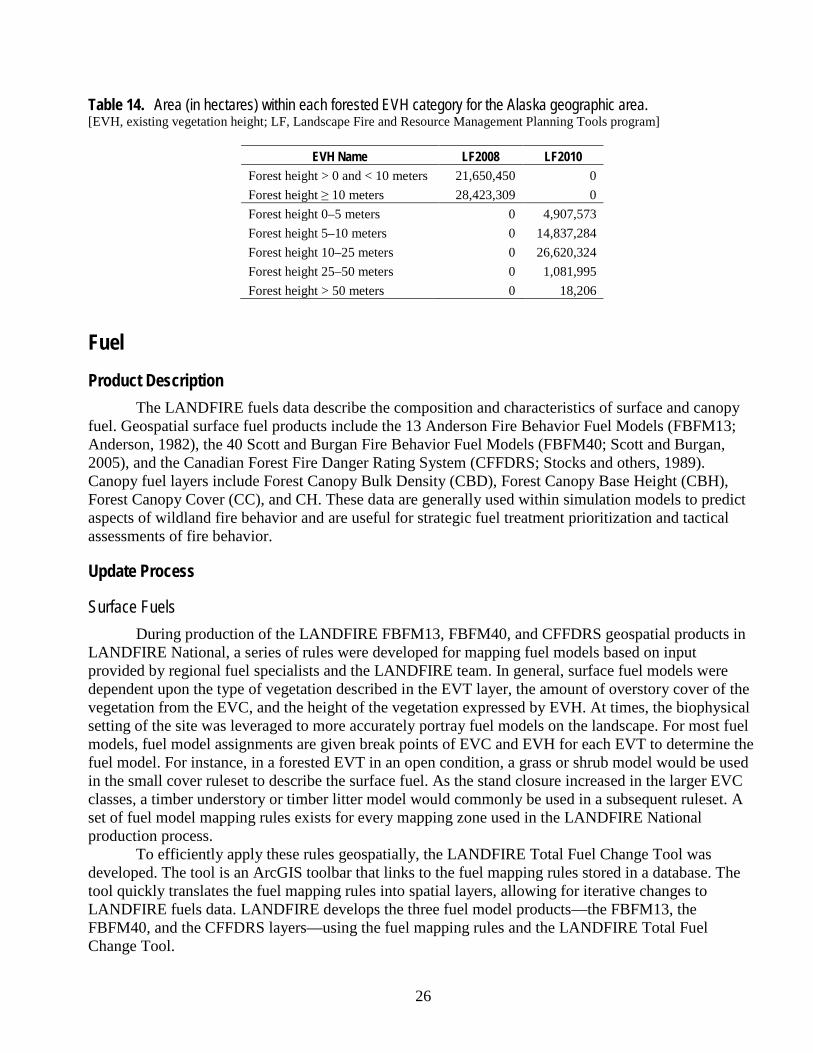
26
Table 14. Area (in hectares) within each forested EVH category for the Alaska geographic area. [EVH, existing vegetation height; LF, Landscape Fire and Resource Management Planning Tools program]
EVH Name LF2008 LF2010 Forest height > 0 and < 10 meters 21,650,450 0 Forest height ≥ 10 meters 28,423,309 0 Forest height 0–5 meters 0 4,907,573 Forest height 5–10 meters 0 14,837,284 Forest height 10–25 meters 0 26,620,324 Forest height 25–50 meters 0 1,081,995 Forest height > 50 meters 0 18,206
Fuel Product Description
The LANDFIRE fuels data describe the composition and characteristics of surface and canopy fuel. Geospatial surface fuel products include the 13 Anderson Fire Behavior Fuel Models (FBFM13; Anderson, 1982), the 40 Scott and Burgan Fire Behavior Fuel Models (FBFM40; Scott and Burgan, 2005), and the Canadian Forest Fire Danger Rating System (CFFDRS; Stocks and others, 1989). Canopy fuel layers include Forest Canopy Bulk Density (CBD), Forest Canopy Base Height (CBH), Forest Canopy Cover (CC), and CH. These data are generally used within simulation models to predict aspects of wildland fire behavior and are useful for strategic fuel treatment prioritization and tactical assessments of fire behavior.
Update Process
Surface Fuels During production of the LANDFIRE FBFM13, FBFM40, and CFFDRS geospatial products in
LANDFIRE National, a series of rules were developed for mapping fuel models based on input provided by regional fuel specialists and the LANDFIRE team. In general, surface fuel models were dependent upon the type of vegetation described in the EVT layer, the amount of overstory cover of the vegetation from the EVC, and the height of the vegetation expressed by EVH. At times, the biophysical setting of the site was leveraged to more accurately portray fuel models on the landscape. For most fuel models, fuel model assignments are given break points of EVC and EVH for each EVT to determine the fuel model. For instance, in a forested EVT in an open condition, a grass or shrub model would be used in the small cover ruleset to describe the surface fuel. As the stand closure increased in the larger EVC classes, a timber understory or timber litter model would commonly be used in a subsequent ruleset. A set of fuel model mapping rules exists for every mapping zone used in the LANDFIRE National production process.
To efficiently apply these rules geospatially, the LANDFIRE Total Fuel Change Tool was developed. The tool is an ArcGIS toolbar that links to the fuel mapping rules stored in a database. The tool quickly translates the fuel mapping rules into spatial layers, allowing for iterative changes to LANDFIRE fuels data. LANDFIRE develops the three fuel model products—the FBFM13, the FBFM40, and the CFFDRS layers—using the fuel mapping rules and the LANDFIRE Total Fuel Change Tool.
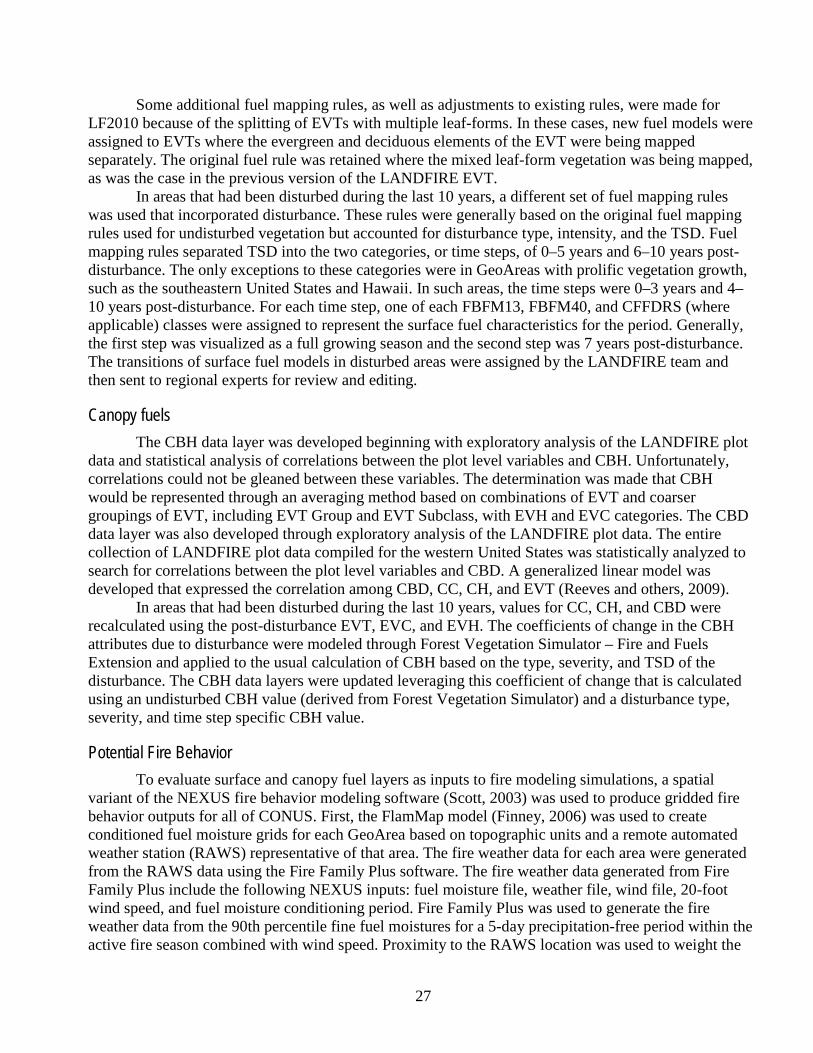
27
Some additional fuel mapping rules, as well as adjustments to existing rules, were made for LF2010 because of the splitting of EVTs with multiple leaf-forms. In these cases, new fuel models were assigned to EVTs where the evergreen and deciduous elements of the EVT were being mapped separately. The original fuel rule was retained where the mixed leaf-form vegetation was being mapped, as was the case in the previous version of the LANDFIRE EVT.
In areas that had been disturbed during the last 10 years, a different set of fuel mapping rules was used that incorporated disturbance. These rules were generally based on the original fuel mapping rules used for undisturbed vegetation but accounted for disturbance type, intensity, and the TSD. Fuel mapping rules separated TSD into the two categories, or time steps, of 0–5 years and 6–10 years post-disturbance. The only exceptions to these categories were in GeoAreas with prolific vegetation growth, such as the southeastern United States and Hawaii. In such areas, the time steps were 0–3 years and 4–10 years post-disturbance. For each time step, one of each FBFM13, FBFM40, and CFFDRS (where applicable) classes were assigned to represent the surface fuel characteristics for the period. Generally, the first step was visualized as a full growing season and the second step was 7 years post-disturbance. The transitions of surface fuel models in disturbed areas were assigned by the LANDFIRE team and then sent to regional experts for review and editing.
Canopy fuels The CBH data layer was developed beginning with exploratory analysis of the LANDFIRE plot
data and statistical analysis of correlations between the plot level variables and CBH. Unfortunately, correlations could not be gleaned between these variables. The determination was made that CBH would be represented through an averaging method based on combinations of EVT and coarser groupings of EVT, including EVT Group and EVT Subclass, with EVH and EVC categories. The CBD data layer was also developed through exploratory analysis of the LANDFIRE plot data. The entire collection of LANDFIRE plot data compiled for the western United States was statistically analyzed to search for correlations between the plot level variables and CBD. A generalized linear model was developed that expressed the correlation among CBD, CC, CH, and EVT (Reeves and others, 2009).
In areas that had been disturbed during the last 10 years, values for CC, CH, and CBD were recalculated using the post-disturbance EVT, EVC, and EVH. The coefficients of change in the CBH attributes due to disturbance were modeled through Forest Vegetation Simulator – Fire and Fuels Extension and applied to the usual calculation of CBH based on the type, severity, and TSD of the disturbance. The CBH data layers were updated leveraging this coefficient of change that is calculated using an undisturbed CBH value (derived from Forest Vegetation Simulator) and a disturbance type, severity, and time step specific CBH value.
Potential Fire Behavior To evaluate surface and canopy fuel layers as inputs to fire modeling simulations, a spatial
variant of the NEXUS fire behavior modeling software (Scott, 2003) was used to produce gridded fire behavior outputs for all of CONUS. First, the FlamMap model (Finney, 2006) was used to create conditioned fuel moisture grids for each GeoArea based on topographic units and a remote automated weather station (RAWS) representative of that area. The fire weather data for each area were generated from the RAWS data using the Fire Family Plus software. The fire weather data generated from Fire Family Plus include the following NEXUS inputs: fuel moisture file, weather file, wind file, 20-foot wind speed, and fuel moisture conditioning period. Fire Family Plus was used to generate the fire weather data from the 90th percentile fine fuel moistures for a 5-day precipitation-free period within the active fire season combined with wind speed. Proximity to the RAWS location was used to weight the
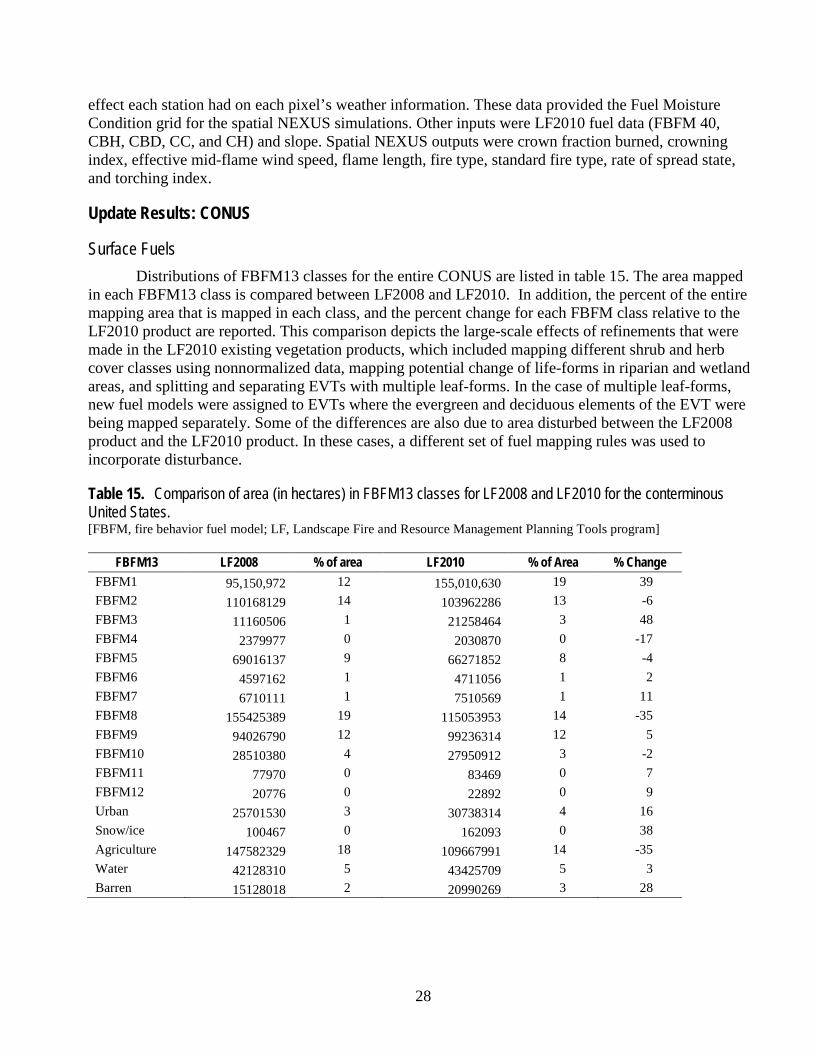
28
effect each station had on each pixel’s weather information. These data provided the Fuel Moisture Condition grid for the spatial NEXUS simulations. Other inputs were LF2010 fuel data (FBFM 40, CBH, CBD, CC, and CH) and slope. Spatial NEXUS outputs were crown fraction burned, crowning index, effective mid-flame wind speed, flame length, fire type, standard fire type, rate of spread state, and torching index.
Update Results: CONUS
Surface Fuels Distributions of FBFM13 classes for the entire CONUS are listed in table 15. The area mapped
in each FBFM13 class is compared between LF2008 and LF2010. In addition, the percent of the entire mapping area that is mapped in each class, and the percent change for each FBFM class relative to the LF2010 product are reported. This comparison depicts the large-scale effects of refinements that were made in the LF2010 existing vegetation products, which included mapping different shrub and herb cover classes using nonnormalized data, mapping potential change of life-forms in riparian and wetland areas, and splitting and separating EVTs with multiple leaf-forms. In the case of multiple leaf-forms, new fuel models were assigned to EVTs where the evergreen and deciduous elements of the EVT were being mapped separately. Some of the differences are also due to area disturbed between the LF2008 product and the LF2010 product. In these cases, a different set of fuel mapping rules was used to incorporate disturbance.
Table 15. Comparison of area (in hectares) in FBFM13 classes for LF2008 and LF2010 for the conterminous United States. [FBFM, fire behavior fuel model; LF, Landscape Fire and Resource Management Planning Tools program]
FBFM13 LF2008 % of area LF2010 % of Area % Change FBFM1 95,150,972 12 155,010,630 19 39 FBFM2 110168129 14 103962286 13 -6 FBFM3 11160506 1 21258464 3 48 FBFM4 2379977 0 2030870 0 -17 FBFM5 69016137 9 66271852 8 -4 FBFM6 4597162 1 4711056 1 2 FBFM7 6710111 1 7510569 1 11 FBFM8 155425389 19 115053953 14 -35 FBFM9 94026790 12 99236314 12 5 FBFM10 28510380 4 27950912 3 -2 FBFM11 77970 0 83469 0 7 FBFM12 20776 0 22892 0 9 Urban 25701530 3 30738314 4 16 Snow/ice 100467 0 162093 0 38 Agriculture 147582329 18 109667991 14 -35 Water 42128310 5 43425709 5 3 Barren 15128018 2 20990269 3 28
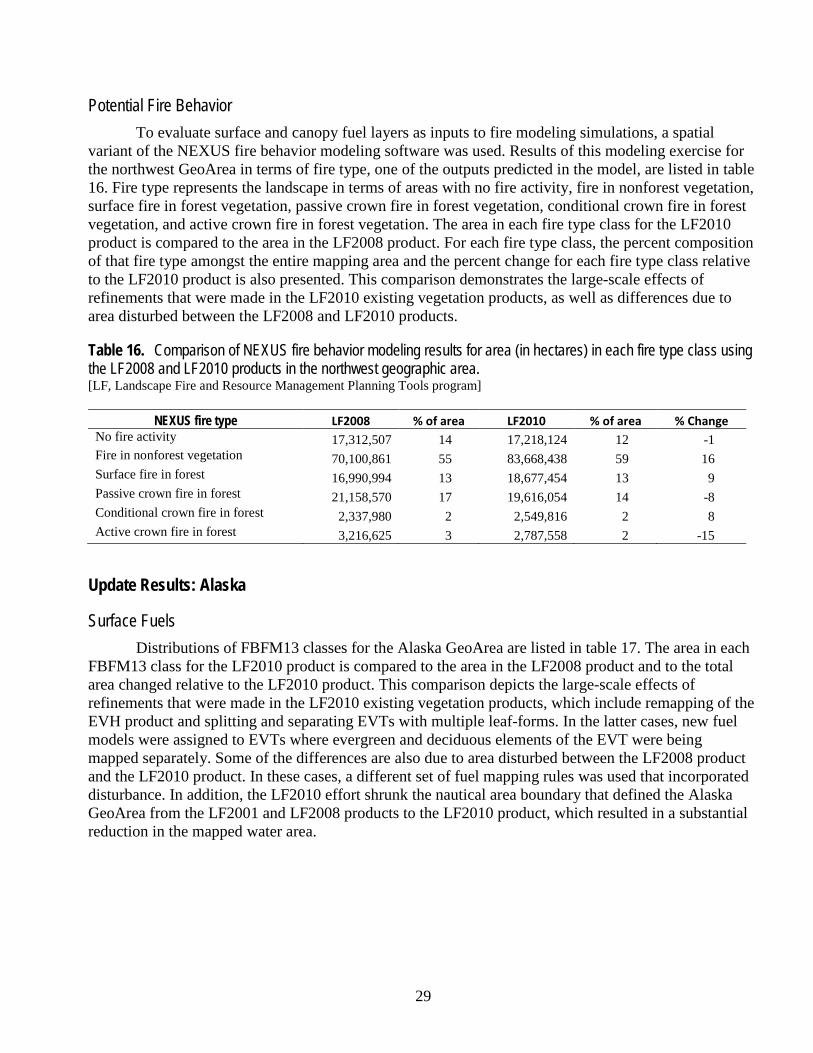
29
Potential Fire Behavior To evaluate surface and canopy fuel layers as inputs to fire modeling simulations, a spatial
variant of the NEXUS fire behavior modeling software was used. Results of this modeling exercise for the northwest GeoArea in terms of fire type, one of the outputs predicted in the model, are listed in table 16. Fire type represents the landscape in terms of areas with no fire activity, fire in nonforest vegetation, surface fire in forest vegetation, passive crown fire in forest vegetation, conditional crown fire in forest vegetation, and active crown fire in forest vegetation. The area in each fire type class for the LF2010 product is compared to the area in the LF2008 product. For each fire type class, the percent composition of that fire type amongst the entire mapping area and the percent change for each fire type class relative to the LF2010 product is also presented. This comparison demonstrates the large-scale effects of refinements that were made in the LF2010 existing vegetation products, as well as differences due to area disturbed between the LF2008 and LF2010 products.
Table 16. Comparison of NEXUS fire behavior modeling results for area (in hectares) in each fire type class using the LF2008 and LF2010 products in the northwest geographic area. [LF, Landscape Fire and Resource Management Planning Tools program]
NEXUS fire type LF2008 % of area LF2010 % of area % Change No fire activity 17,312,507 14 17,218,124 12 -1 Fire in nonforest vegetation 70,100,861 55 83,668,438 59 16 Surface fire in forest 16,990,994 13 18,677,454 13 9 Passive crown fire in forest 21,158,570 17 19,616,054 14 -8 Conditional crown fire in forest 2,337,980 2 2,549,816 2 8 Active crown fire in forest 3,216,625 3 2,787,558 2 -15
Update Results: Alaska
Surface Fuels Distributions of FBFM13 classes for the Alaska GeoArea are listed in table 17. The area in each
FBFM13 class for the LF2010 product is compared to the area in the LF2008 product and to the total area changed relative to the LF2010 product. This comparison depicts the large-scale effects of refinements that were made in the LF2010 existing vegetation products, which include remapping of the EVH product and splitting and separating EVTs with multiple leaf-forms. In the latter cases, new fuel models were assigned to EVTs where evergreen and deciduous elements of the EVT were being mapped separately. Some of the differences are also due to area disturbed between the LF2008 product and the LF2010 product. In these cases, a different set of fuel mapping rules was used that incorporated disturbance. In addition, the LF2010 effort shrunk the nautical area boundary that defined the Alaska GeoArea from the LF2001 and LF2008 products to the LF2010 product, which resulted in a substantial reduction in the mapped water area.
30
Table 17. Comparison of area (in hectares) in FBFM13 classes for LF2008 and LF2010 for Alaska. [FBFM, fire behavior fuel model; LF, Landscape Fire and Resource Management Planning Tools program]
FBFM13 LF2008 LF2010 Change FBFM1 36,067,924 23,369,352 -12,698,572 FBFM2 2583573 3914990 1331416 FBFM3 576749 658837 82089 FBFM4 875 147753 146878 FBFM5 23123611 38134071 15010460 FBFM6 5961311 5719373 -241938 FBFM7 35386 101 -35285 FBFM8 32949473 27844937 -5104536 FBFM9 4313938 4508107 194169 FBFM10 11881110 15376374 3495265 FBFM11 392 477 85 FBFM12 0 29816 29816 Urban 16748 111297 94549 Snow/ice 7318451 7215427 -103024 Agriculture 28911 28911 0 Water 17776921 14995505 -2781416 Barren 20153414 17810791 -2342623
Fire Behavior Analysis To evaluate the relative differences between LANDFIRE fuel datasets when used for fire
behavior modeling, several analyses were done with the Fire Area Simulator (FARSITE; Finney, 2004) fire behavior modeling system. In each analysis, an actual wildfire event from 2012 or from 2013 was identified and the burning conditions (for example, wind and weather) were replicated as closely as possible to the conditions at the time of the fire. Each fire was then modeled using LF2008 fuel and topographic data and then modeled again using LF2010 fuel and topographic data, keeping the burning conditions constant to capture the differences in modeled fire behavior based only on the changes to LANDFIRE data. The goal of these analyses was not to re-create the actual fire perimeter, but rather to use that perimeter as a calibration guide and then show the differences in modeled fire behavior between the two LANDFIRE datasets.
The Halstead Fire, Idaho, 2012 The Halstead fire originated in the Frank Church Wilderness, north of Stanley, Idaho, in late July
2012 and continued to burn throughout most of August and September (fig. 7). The fire grew to a large size with many incredible spread events; however, this analysis took into account the origin of the fire and first several days of spread from July 30 through August 2. The National Fire Danger Rating System energy release component (an indicator of dryness in this type of ecosystem) for the area was in the 90th percentile compared to the previous 10 fire seasons. Energy release component was measured by the Stanley RAWS, which is located south of the fire origin. Dead and live fuel moistures, weather conditions, as well as wind speed and direction were assessed from the Stanley and Bonanza RAWS
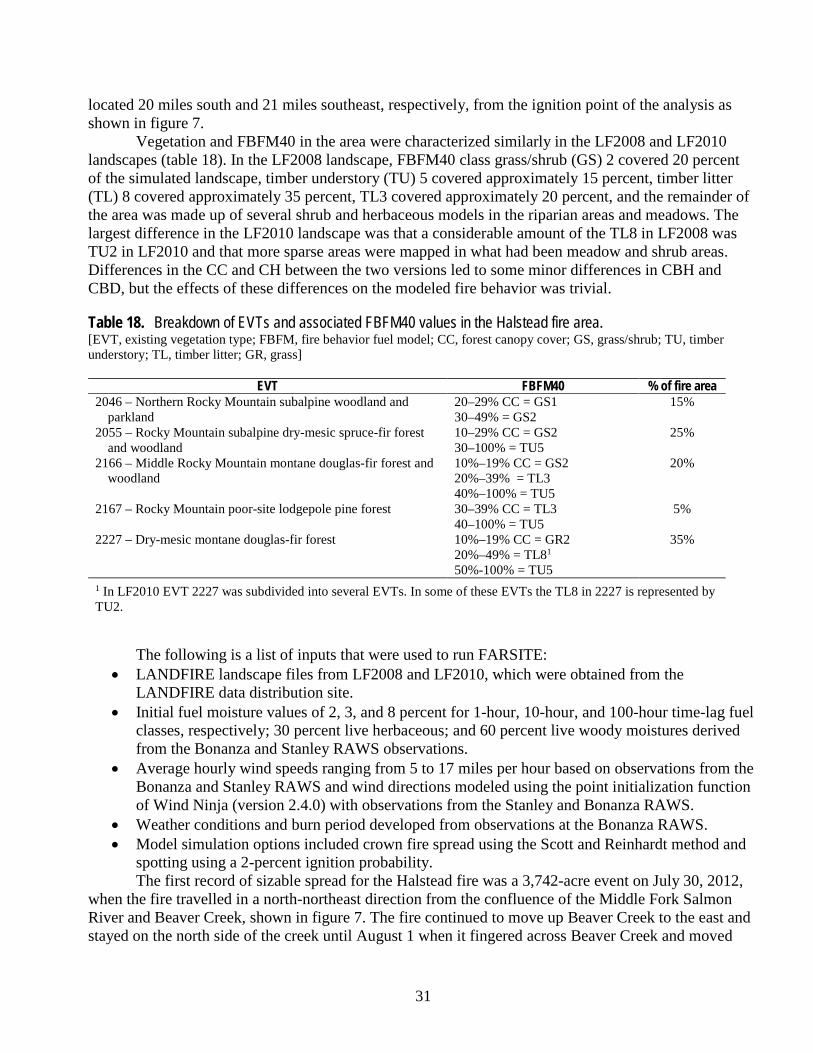
31
located 20 miles south and 21 miles southeast, respectively, from the ignition point of the analysis as shown in figure 7.
Vegetation and FBFM40 in the area were characterized similarly in the LF2008 and LF2010 landscapes (table 18). In the LF2008 landscape, FBFM40 class grass/shrub (GS) 2 covered 20 percent of the simulated landscape, timber understory (TU) 5 covered approximately 15 percent, timber litter (TL) 8 covered approximately 35 percent, TL3 covered approximately 20 percent, and the remainder of the area was made up of several shrub and herbaceous models in the riparian areas and meadows. The largest difference in the LF2010 landscape was that a considerable amount of the TL8 in LF2008 was TU2 in LF2010 and that more sparse areas were mapped in what had been meadow and shrub areas. Differences in the CC and CH between the two versions led to some minor differences in CBH and CBD, but the effects of these differences on the modeled fire behavior was trivial.
Table 18. Breakdown of EVTs and associated FBFM40 values in the Halstead fire area. [EVT, existing vegetation type; FBFM, fire behavior fuel model; CC, forest canopy cover; GS, grass/shrub; TU, timber understory; TL, timber litter; GR, grass]
EVT FBFM40 % of fire area 2046 – Northern Rocky Mountain subalpine woodland and
parkland 20–29% CC = GS1 30–49% = GS2
15%
2055 – Rocky Mountain subalpine dry-mesic spruce-fir forest and woodland
10–29% CC = GS2 30–100% = TU5
25%
2166 – Middle Rocky Mountain montane douglas-fir forest and woodland
10%–19% CC = GS2 20%–39% = TL3 40%–100% = TU5
20%
2167 – Rocky Mountain poor-site lodgepole pine forest 30–39% CC = TL3 40–100% = TU5
5%
2227 – Dry-mesic montane douglas-fir forest 10%–19% CC = GR2 20%–49% = TL81
50%-100% = TU5
35%
1 In LF2010 EVT 2227 was subdivided into several EVTs. In some of these EVTs the TL8 in 2227 is represented by TU2.
The following is a list of inputs that were used to run FARSITE: • LANDFIRE landscape files from LF2008 and LF2010, which were obtained from the
LANDFIRE data distribution site. • Initial fuel moisture values of 2, 3, and 8 percent for 1-hour, 10-hour, and 100-hour time-lag fuel
classes, respectively; 30 percent live herbaceous; and 60 percent live woody moistures derived from the Bonanza and Stanley RAWS observations.
• Average hourly wind speeds ranging from 5 to 17 miles per hour based on observations from the Bonanza and Stanley RAWS and wind directions modeled using the point initialization function of Wind Ninja (version 2.4.0) with observations from the Stanley and Bonanza RAWS.
• Weather conditions and burn period developed from observations at the Bonanza RAWS. • Model simulation options included crown fire spread using the Scott and Reinhardt method and
spotting using a 2-percent ignition probability. The first record of sizable spread for the Halstead fire was a 3,742-acre event on July 30, 2012,
when the fire travelled in a north-northeast direction from the confluence of the Middle Fork Salmon River and Beaver Creek, shown in figure 7. The fire continued to move up Beaver Creek to the east and stayed on the north side of the creek until August 1 when it fingered across Beaver Creek and moved
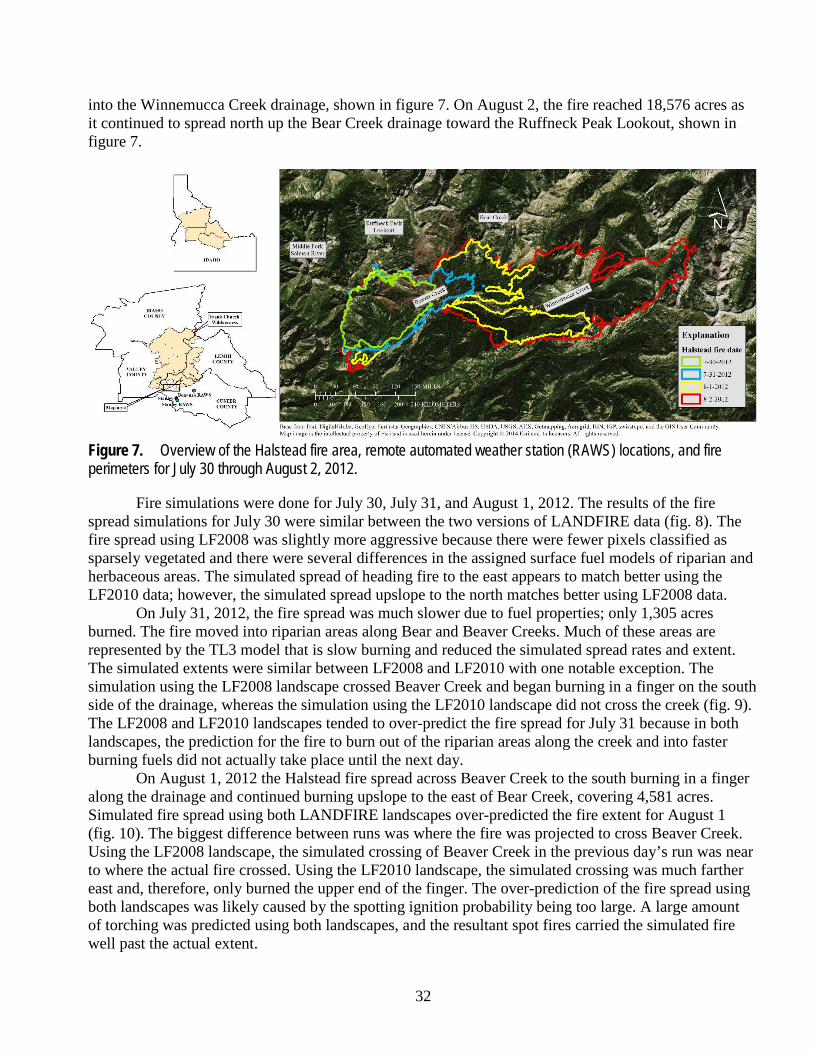
32
into the Winnemucca Creek drainage, shown in figure 7. On August 2, the fire reached 18,576 acres as it continued to spread north up the Bear Creek drainage toward the Ruffneck Peak Lookout, shown in figure 7.
Figure 7. Overview of the Halstead fire area, remote automated weather station (RAWS) locations, and fire perimeters for July 30 through August 2, 2012.
Fire simulations were done for July 30, July 31, and August 1, 2012. The results of the fire spread simulations for July 30 were similar between the two versions of LANDFIRE data (fig. 8). The fire spread using LF2008 was slightly more aggressive because there were fewer pixels classified as sparsely vegetated and there were several differences in the assigned surface fuel models of riparian and herbaceous areas. The simulated spread of heading fire to the east appears to match better using the LF2010 data; however, the simulated spread upslope to the north matches better using LF2008 data.
On July 31, 2012, the fire spread was much slower due to fuel properties; only 1,305 acres burned. The fire moved into riparian areas along Bear and Beaver Creeks. Much of these areas are represented by the TL3 model that is slow burning and reduced the simulated spread rates and extent. The simulated extents were similar between LF2008 and LF2010 with one notable exception. The simulation using the LF2008 landscape crossed Beaver Creek and began burning in a finger on the south side of the drainage, whereas the simulation using the LF2010 landscape did not cross the creek (fig. 9). The LF2008 and LF2010 landscapes tended to over-predict the fire spread for July 31 because in both landscapes, the prediction for the fire to burn out of the riparian areas along the creek and into faster burning fuels did not actually take place until the next day.
On August 1, 2012 the Halstead fire spread across Beaver Creek to the south burning in a finger along the drainage and continued burning upslope to the east of Bear Creek, covering 4,581 acres. Simulated fire spread using both LANDFIRE landscapes over-predicted the fire extent for August 1 (fig. 10). The biggest difference between runs was where the fire was projected to cross Beaver Creek. Using the LF2008 landscape, the simulated crossing of Beaver Creek in the previous day’s run was near to where the actual fire crossed. Using the LF2010 landscape, the simulated crossing was much farther east and, therefore, only burned the upper end of the finger. The over-prediction of the fire spread using both landscapes was likely caused by the spotting ignition probability being too large. A large amount of torching was predicted using both landscapes, and the resultant spot fires carried the simulated fire well past the actual extent.
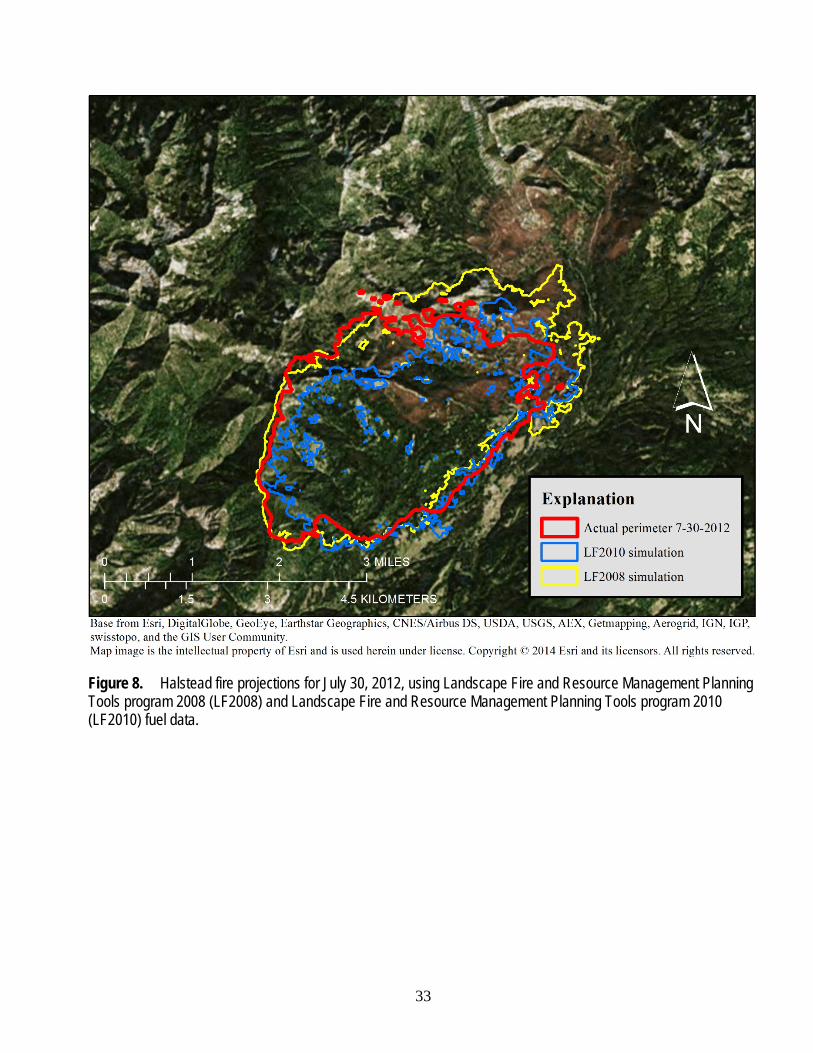
33
Figure 8. Halstead fire projections for July 30, 2012, using Landscape Fire and Resource Management Planning Tools program 2008 (LF2008) and Landscape Fire and Resource Management Planning Tools program 2010 (LF2010) fuel data.
34
Figure 9. Halstead fire projections for July 31, 2012, using Landscape Fire and Resource Management Planning Tools program 2008 (LF2008) and Landscape Fire and Resource Management Planning Tools program 2010 (LF2010) fuel data.
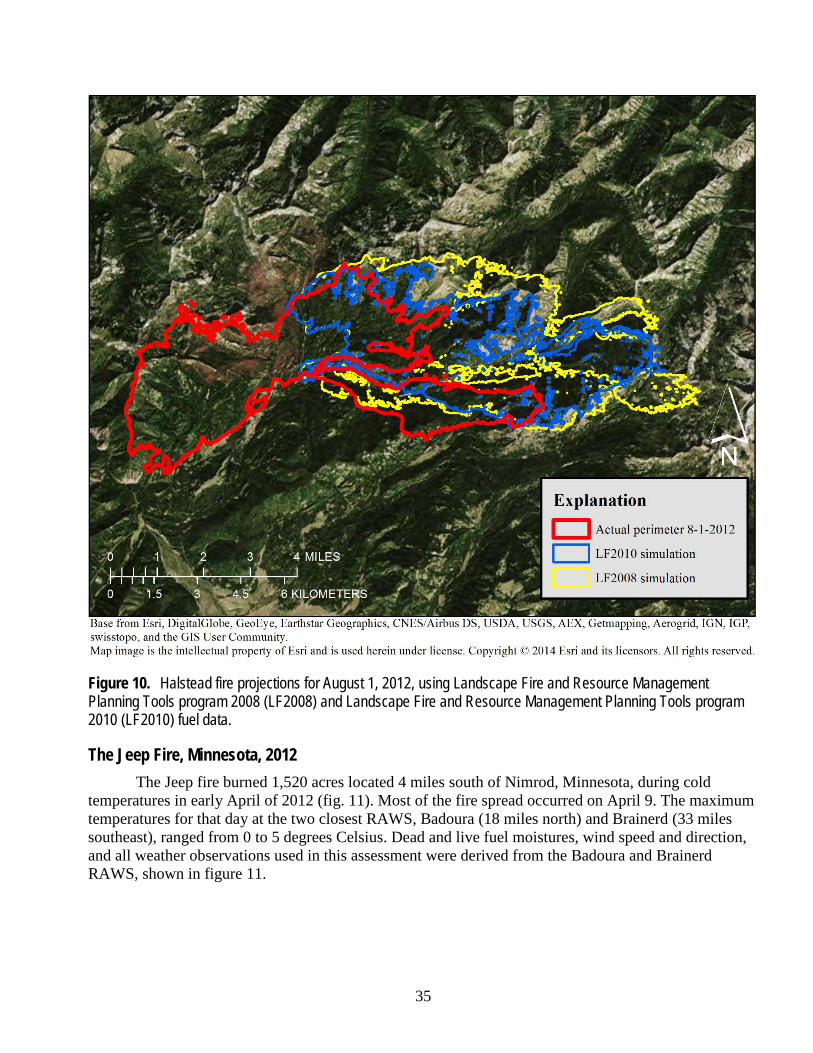
35
Figure 10. Halstead fire projections for August 1, 2012, using Landscape Fire and Resource Management Planning Tools program 2008 (LF2008) and Landscape Fire and Resource Management Planning Tools program 2010 (LF2010) fuel data.
The Jeep Fire, Minnesota, 2012 The Jeep fire burned 1,520 acres located 4 miles south of Nimrod, Minnesota, during cold
temperatures in early April of 2012 (fig. 11). Most of the fire spread occurred on April 9. The maximum temperatures for that day at the two closest RAWS, Badoura (18 miles north) and Brainerd (33 miles southeast), ranged from 0 to 5 degrees Celsius. Dead and live fuel moistures, wind speed and direction, and all weather observations used in this assessment were derived from the Badoura and Brainerd RAWS, shown in figure 11.
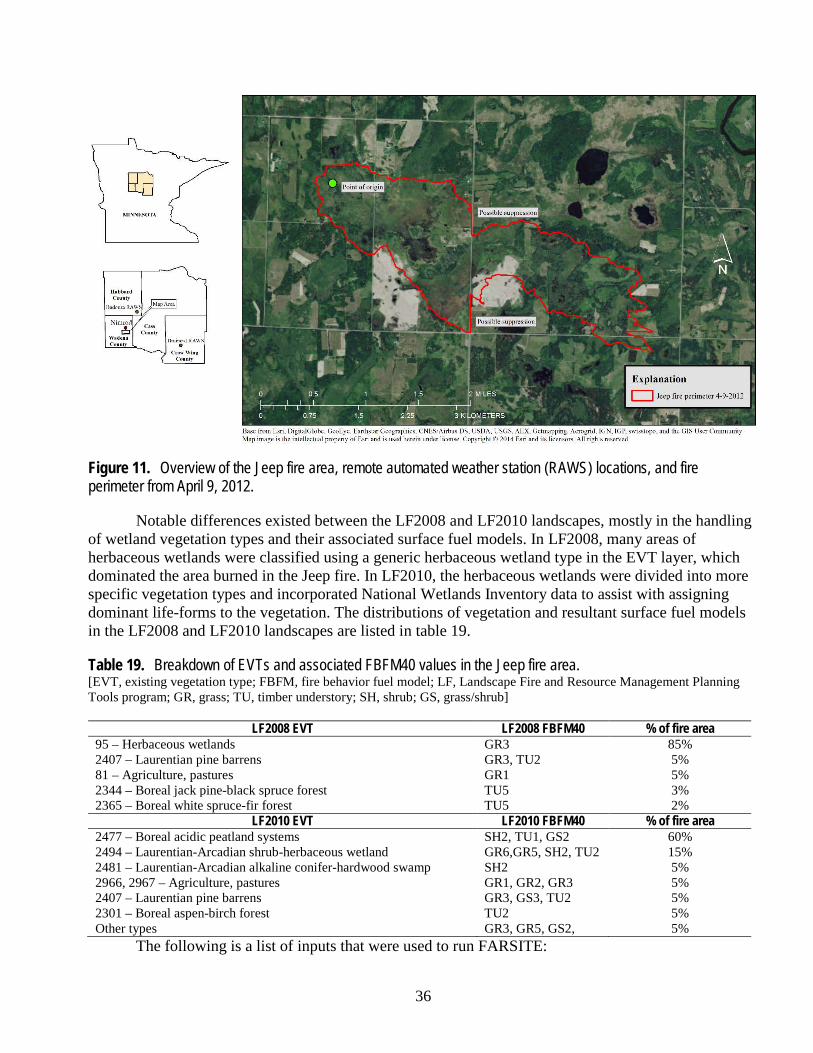
36
Figure 11. Overview of the Jeep fire area, remote automated weather station (RAWS) locations, and fire perimeter from April 9, 2012.
Notable differences existed between the LF2008 and LF2010 landscapes, mostly in the handling of wetland vegetation types and their associated surface fuel models. In LF2008, many areas of herbaceous wetlands were classified using a generic herbaceous wetland type in the EVT layer, which dominated the area burned in the Jeep fire. In LF2010, the herbaceous wetlands were divided into more specific vegetation types and incorporated National Wetlands Inventory data to assist with assigning dominant life-forms to the vegetation. The distributions of vegetation and resultant surface fuel models in the LF2008 and LF2010 landscapes are listed in table 19.
Table 19. Breakdown of EVTs and associated FBFM40 values in the Jeep fire area. [EVT, existing vegetation type; FBFM, fire behavior fuel model; LF, Landscape Fire and Resource Management Planning Tools program; GR, grass; TU, timber understory; SH, shrub; GS, grass/shrub]
LF2008 EVT LF2008 FBFM40 % of fire area 95 – Herbaceous wetlands GR3 85% 2407 – Laurentian pine barrens GR3, TU2 5% 81 – Agriculture, pastures GR1 5% 2344 – Boreal jack pine-black spruce forest TU5 3% 2365 – Boreal white spruce-fir forest TU5 2%
LF2010 EVT LF2010 FBFM40 % of fire area 2477 – Boreal acidic peatland systems SH2, TU1, GS2 60% 2494 – Laurentian-Arcadian shrub-herbaceous wetland GR6,GR5, SH2, TU2 15% 2481 – Laurentian-Arcadian alkaline conifer-hardwood swamp SH2 5% 2966, 2967 – Agriculture, pastures GR1, GR2, GR3 5% 2407 – Laurentian pine barrens GR3, GS3, TU2 5% 2301 – Boreal aspen-birch forest TU2 5% Other types GR3, GR5, GS2, 5%
The following is a list of inputs that were used to run FARSITE:

37
• LANDFIRE landscape files from LF2008 and LF2010, which were obtained from the LANDFIRE data distribution site.
• Initial fuel moisture values of 6, 7, and 8 percent for 1-hour, 10-hour, and 100-hour time-lag fuel classes, respectively; 10 percent live herbaceous; and 70 percent live woody moistures derived from the Badoura and Brainerd RAWS observations.
• Average hourly wind speeds ranging from 11 to 15 miles per hour and wind directions based on observations from the Badoura RAWS.
• Weather conditions and burn period developed from observations at the Badoura RAWS. • Model simulation options included crown fire spread using the Scott and Reinhardt method and
spotting using a 1-percent ignition probability based on several calibration runs. The simulated fire spread using the LF2008 landscape was aggressive considering the low
temperature, moderate humidity (41–59 percent), and the moderate wind speeds (fig. 12). The live herbaceous fuel moisture of 10 percent and the predominately grass surface fuel models in the landscape account for this type of modeled fire spread. Using the LF2010 landscape, which included more shrub and grass-shrub surface fuel models, the modeled fire spread was considerably less. The low live herbaceous fuel moisture had much less effect on fire spread through these fuel models. To better simulate the actual fire spread, modifications were made to the model parameters and a second simulation was run using the LF2010 landscape. The spotting ignition probability was increased to 1.5 percent to account for increased spotting potential from the shrub fuels, and the burn period was extended by 3 hours. The simulated fire spread using the modified parameters closely replicates the actual fire perimeter, though the modeled spread direction was farther to the south, indicating the wind direction from the RAWS did not exactly match the wind direction on the actual fire. Overall, the LF2010 landscape better characterized the diversity of the vegetation in this area, though the mix of surface fuel models assigned to those vegetation types resulted in different modeled fire behavior. The model results using the LF2008 landscape tended to over-predict fire spread, whereas using the LF2010 landscape tended to under-predict fire spread using the same model parameters. Adjusting the model parameters to match the changes in vegetation on the landscape enabled a more realistic simulation of fire spread.
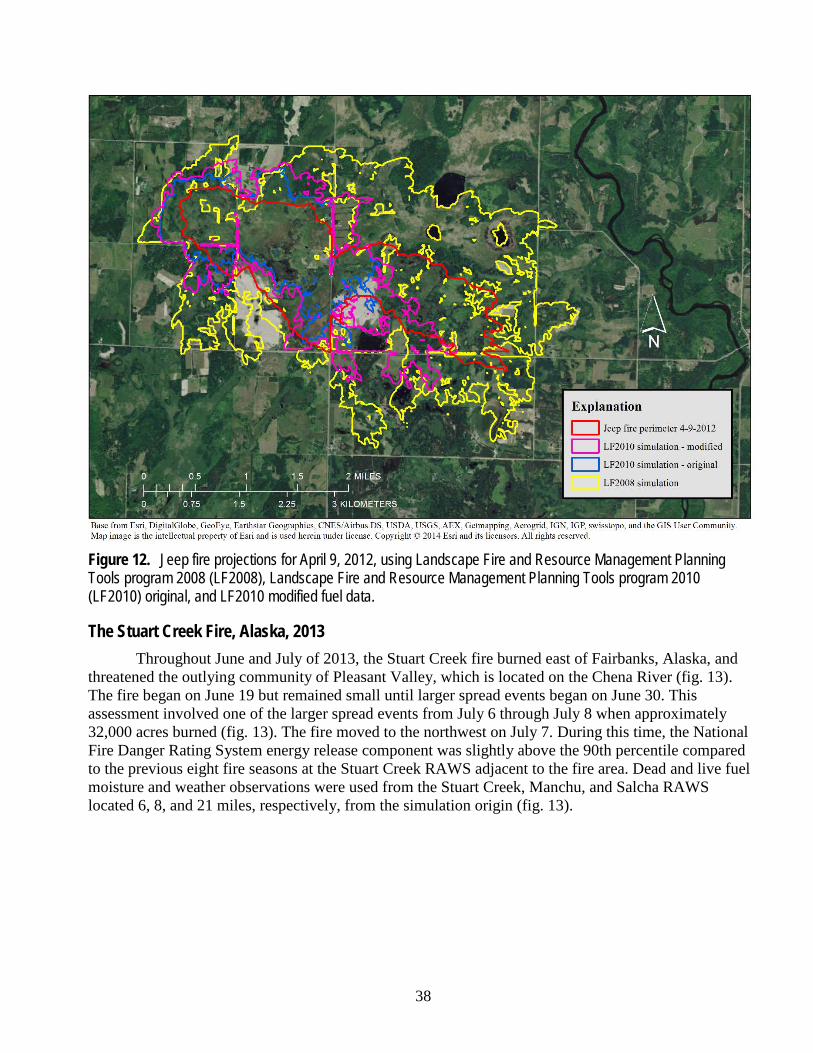
38
Figure 12. Jeep fire projections for April 9, 2012, using Landscape Fire and Resource Management Planning Tools program 2008 (LF2008), Landscape Fire and Resource Management Planning Tools program 2010 (LF2010) original, and LF2010 modified fuel data.
The Stuart Creek Fire, Alaska, 2013 Throughout June and July of 2013, the Stuart Creek fire burned east of Fairbanks, Alaska, and
threatened the outlying community of Pleasant Valley, which is located on the Chena River (fig. 13). The fire began on June 19 but remained small until larger spread events began on June 30. This assessment involved one of the larger spread events from July 6 through July 8 when approximately 32,000 acres burned (fig. 13). The fire moved to the northwest on July 7. During this time, the National Fire Danger Rating System energy release component was slightly above the 90th percentile compared to the previous eight fire seasons at the Stuart Creek RAWS adjacent to the fire area. Dead and live fuel moisture and weather observations were used from the Stuart Creek, Manchu, and Salcha RAWS located 6, 8, and 21 miles, respectively, from the simulation origin (fig. 13).
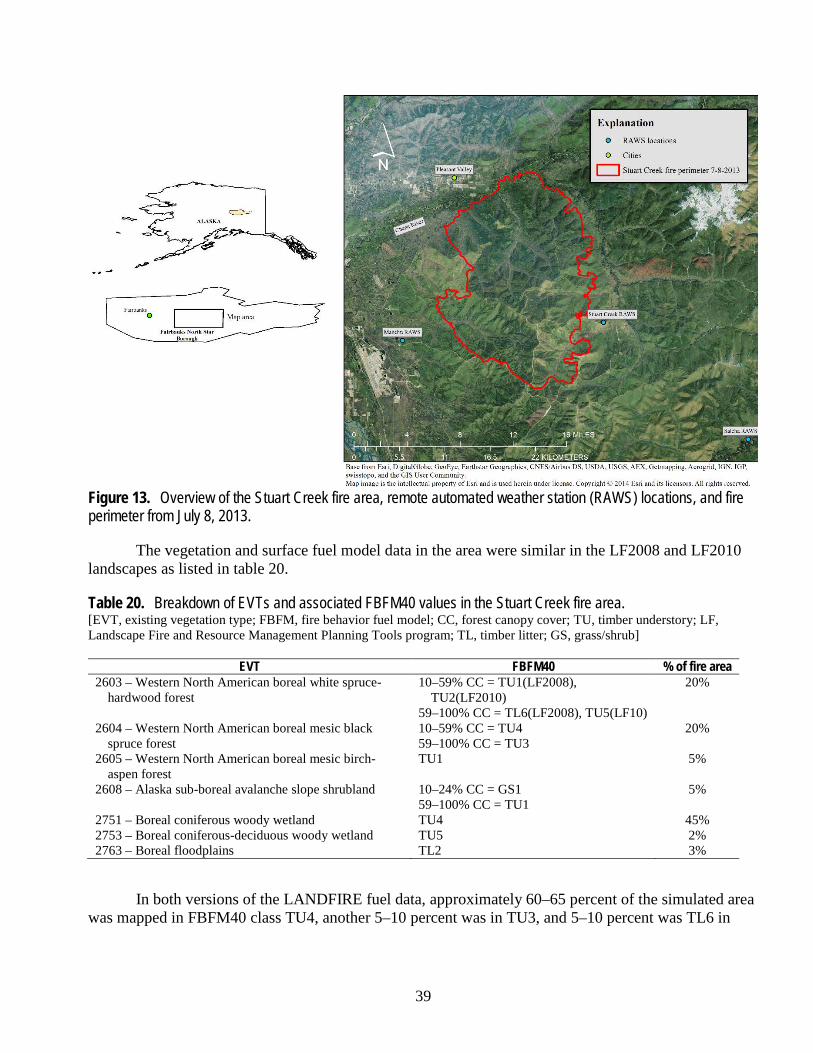
39
Figure 13. Overview of the Stuart Creek fire area, remote automated weather station (RAWS) locations, and fire perimeter from July 8, 2013.
The vegetation and surface fuel model data in the area were similar in the LF2008 and LF2010 landscapes as listed in table 20.
Table 20. Breakdown of EVTs and associated FBFM40 values in the Stuart Creek fire area. [EVT, existing vegetation type; FBFM, fire behavior fuel model; CC, forest canopy cover; TU, timber understory; LF, Landscape Fire and Resource Management Planning Tools program; TL, timber litter; GS, grass/shrub]
EVT FBFM40 % of fire area 2603 – Western North American boreal white spruce-
hardwood forest 10–59% CC = TU1(LF2008),
TU2(LF2010) 59–100% CC = TL6(LF2008), TU5(LF10)
20%
2604 – Western North American boreal mesic black spruce forest
10–59% CC = TU4 59–100% CC = TU3
20%
2605 – Western North American boreal mesic birch-aspen forest
TU1 5%
2608 – Alaska sub-boreal avalanche slope shrubland 10–24% CC = GS1 59–100% CC = TU1
5%
2751 – Boreal coniferous woody wetland TU4 45% 2753 – Boreal coniferous-deciduous woody wetland TU5 2% 2763 – Boreal floodplains TL2 3%
In both versions of the LANDFIRE fuel data, approximately 60–65 percent of the simulated area was mapped in FBFM40 class TU4, another 5–10 percent was in TU3, and 5–10 percent was TL6 in

40
LF2008, but TU5 in LF2010. Most of the remaining area was composed of TL2 and TU1, which burn with much slower spread rates comparatively.
The following is a list of inputs that were used to run FARSITE: • LANDFIRE landscape files from LF2008 and LF2010, which were obtained from the
LANDFIRE data distribution site. • Initial fuel moisture values of 5, 6, and 7 percent for 1-hour, 10-hour, and 100-hour time-lag fuel
classes, respectively; 45 percent live herbaceous; and 65 percent live woody moistures derived from the Stuart Creek, Manchu, and Salcha RAWS observations.
• Average hourly wind speeds ranging from 10 to 17 miles per hour and wind directions based on observations from the Stuart Creek RAWS.
• Weather conditions and burn period developed from observations at the Stuart Creek RAWS. • Model simulation options included crown fire spread using the Scott and Reinhardt method and
spotting using a 3-percent ignition probability. The simulated fire spread using the LF2008 landscape was a little too aggressive to the
northwest due to wind direction and fuel composition. Suppression activity may have taken place along the northwest side of the fire before or on July 7, 2013, but was not considered in the simulation (fig. 14). Near the center and on the east side of the fire, the simulation falls short of actual fire spread somewhat because of fuel composition and sheltering in these areas. The simulated fire spread using the LF2010 landscape shows vastly different results, despite the similar vegetation and surface fuel composition. In the LF2010 landscape, the fuel layers were modified to account for disturbance and succession. The surface fuel layers had minimal differences in this area, whereas the vegetation structure layers exhibited more changes. In areas where the CC layer was modified, fuel shading, wind reduction, and CBD calculations were affected. In addition, the forested component of EVH was remapped in Alaska during LF2010, adding additional thematic resolution to the legend (from 2 to 5 classes). The remapped EVH in turn led to modifications in the CH and CBH layers that are used in the model to predict canopy fire initiation and torching. The differences in fire behavior were mostly attributed to a general increase in CBH, reducing the amount of passive crown fire and fire spread through spotting. A second simulation was completed using the LF2010 landscape and using wind speeds increased by 2 miles per hour in an attempt to more closely replicate the actual fire spread on July 7. The results indicated a much closer correspondence to the fire perimeter, but fire spread on the northern edge was still underrepresented.
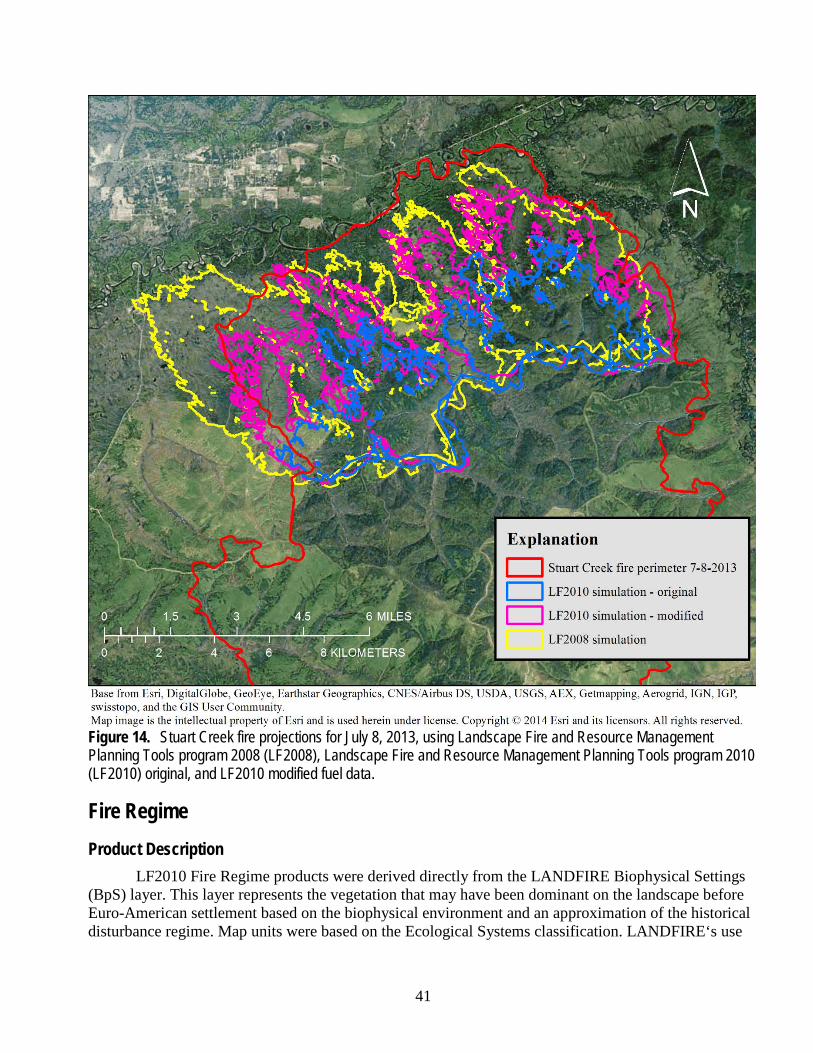
41
Figure 14. Stuart Creek fire projections for July 8, 2013, using Landscape Fire and Resource Management Planning Tools program 2008 (LF2008), Landscape Fire and Resource Management Planning Tools program 2010 (LF2010) original, and LF2010 modified fuel data.
Fire Regime Product Description
LF2010 Fire Regime products were derived directly from the LANDFIRE Biophysical Settings (BpS) layer. This layer represents the vegetation that may have been dominant on the landscape before Euro-American settlement based on the biophysical environment and an approximation of the historical disturbance regime. Map units were based on the Ecological Systems classification. LANDFIRE‘s use
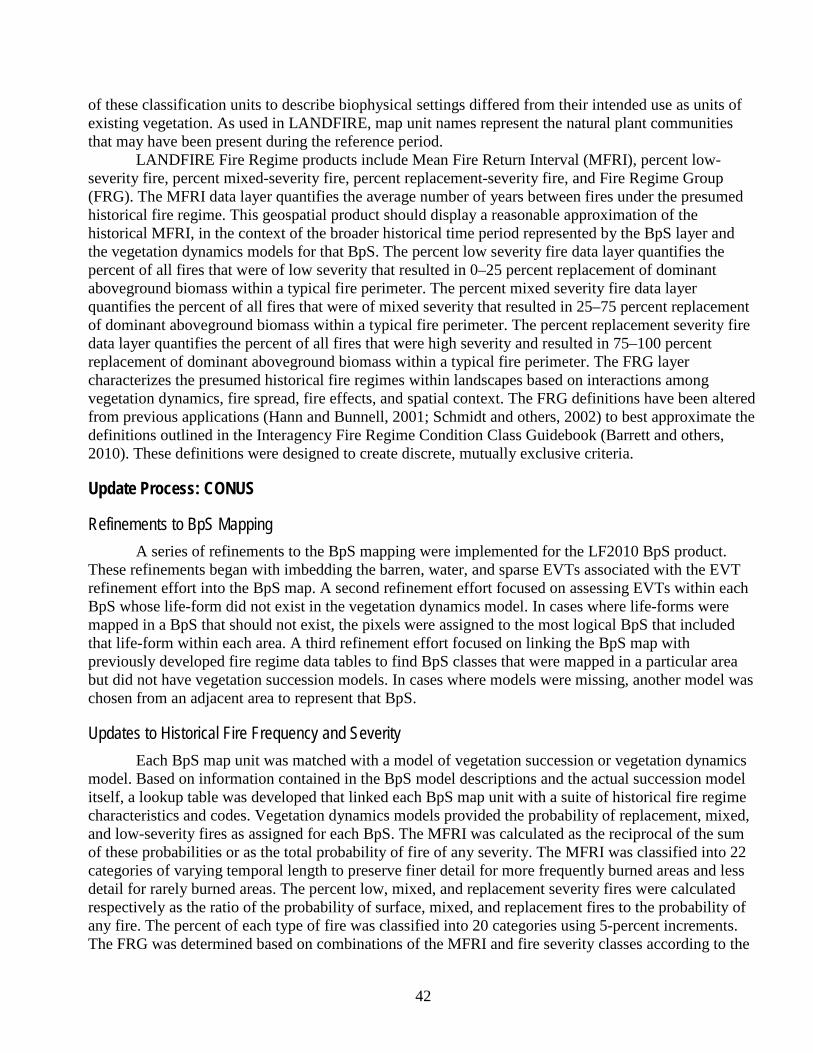
42
of these classification units to describe biophysical settings differed from their intended use as units of existing vegetation. As used in LANDFIRE, map unit names represent the natural plant communities that may have been present during the reference period.
LANDFIRE Fire Regime products include Mean Fire Return Interval (MFRI), percent low-severity fire, percent mixed-severity fire, percent replacement-severity fire, and Fire Regime Group (FRG). The MFRI data layer quantifies the average number of years between fires under the presumed historical fire regime. This geospatial product should display a reasonable approximation of the historical MFRI, in the context of the broader historical time period represented by the BpS layer and the vegetation dynamics models for that BpS. The percent low severity fire data layer quantifies the percent of all fires that were of low severity that resulted in 0–25 percent replacement of dominant aboveground biomass within a typical fire perimeter. The percent mixed severity fire data layer quantifies the percent of all fires that were of mixed severity that resulted in 25–75 percent replacement of dominant aboveground biomass within a typical fire perimeter. The percent replacement severity fire data layer quantifies the percent of all fires that were high severity and resulted in 75–100 percent replacement of dominant aboveground biomass within a typical fire perimeter. The FRG layer characterizes the presumed historical fire regimes within landscapes based on interactions among vegetation dynamics, fire spread, fire effects, and spatial context. The FRG definitions have been altered from previous applications (Hann and Bunnell, 2001; Schmidt and others, 2002) to best approximate the definitions outlined in the Interagency Fire Regime Condition Class Guidebook (Barrett and others, 2010). These definitions were designed to create discrete, mutually exclusive criteria.
Update Process: CONUS
Refinements to BpS Mapping A series of refinements to the BpS mapping were implemented for the LF2010 BpS product.
These refinements began with imbedding the barren, water, and sparse EVTs associated with the EVT refinement effort into the BpS map. A second refinement effort focused on assessing EVTs within each BpS whose life-form did not exist in the vegetation dynamics model. In cases where life-forms were mapped in a BpS that should not exist, the pixels were assigned to the most logical BpS that included that life-form within each area. A third refinement effort focused on linking the BpS map with previously developed fire regime data tables to find BpS classes that were mapped in a particular area but did not have vegetation succession models. In cases where models were missing, another model was chosen from an adjacent area to represent that BpS.
Updates to Historical Fire Frequency and Severity Each BpS map unit was matched with a model of vegetation succession or vegetation dynamics
model. Based on information contained in the BpS model descriptions and the actual succession model itself, a lookup table was developed that linked each BpS map unit with a suite of historical fire regime characteristics and codes. Vegetation dynamics models provided the probability of replacement, mixed, and low-severity fires as assigned for each BpS. The MFRI was calculated as the reciprocal of the sum of these probabilities or as the total probability of fire of any severity. The MFRI was classified into 22 categories of varying temporal length to preserve finer detail for more frequently burned areas and less detail for rarely burned areas. The percent low, mixed, and replacement severity fires were calculated respectively as the ratio of the probability of surface, mixed, and replacement fires to the probability of any fire. The percent of each type of fire was classified into 20 categories using 5-percent increments. The FRG was determined based on combinations of the MFRI and fire severity classes according to the
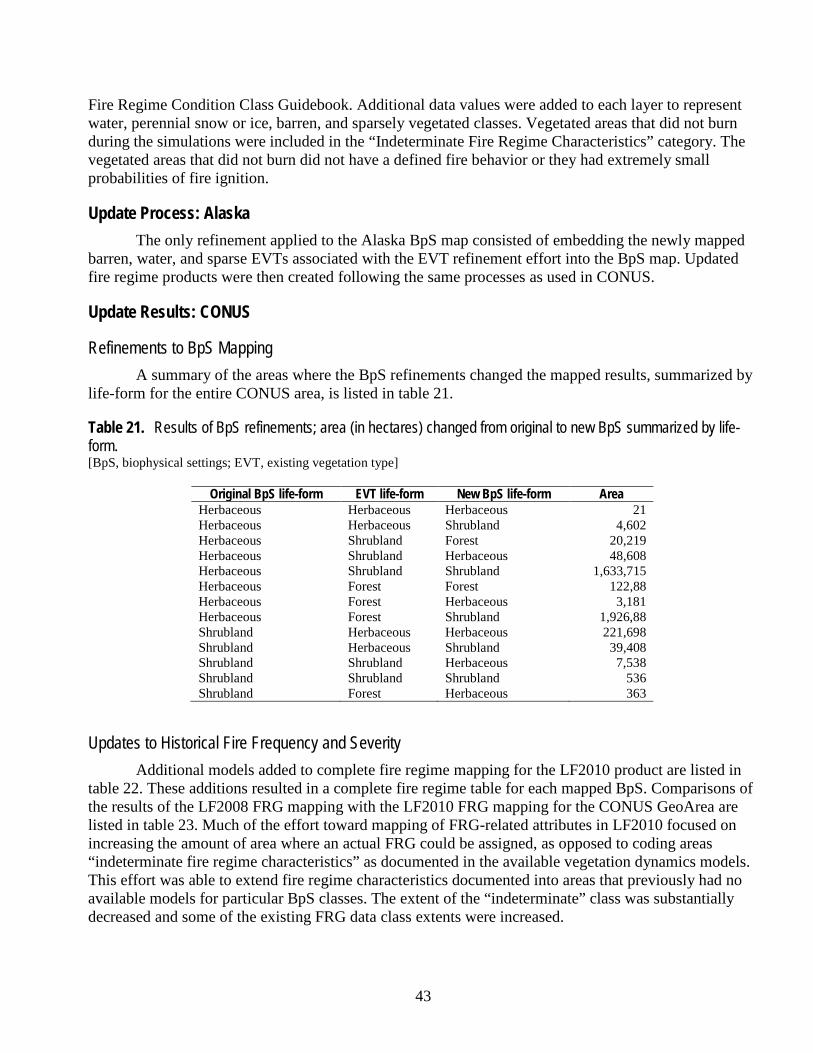
43
Fire Regime Condition Class Guidebook. Additional data values were added to each layer to represent water, perennial snow or ice, barren, and sparsely vegetated classes. Vegetated areas that did not burn during the simulations were included in the “Indeterminate Fire Regime Characteristics” category. The vegetated areas that did not burn did not have a defined fire behavior or they had extremely small probabilities of fire ignition.
Update Process: Alaska The only refinement applied to the Alaska BpS map consisted of embedding the newly mapped
barren, water, and sparse EVTs associated with the EVT refinement effort into the BpS map. Updated fire regime products were then created following the same processes as used in CONUS.
Update Results: CONUS
Refinements to BpS Mapping A summary of the areas where the BpS refinements changed the mapped results, summarized by
life-form for the entire CONUS area, is listed in table 21.
Table 21. Results of BpS refinements; area (in hectares) changed from original to new BpS summarized by life-form. [BpS, biophysical settings; EVT, existing vegetation type]
Original BpS life-form EVT life-form New BpS life-form Area Herbaceous Herbaceous Herbaceous 21 Herbaceous Herbaceous Shrubland 4,602 Herbaceous Shrubland Forest 20,219 Herbaceous Shrubland Herbaceous 48,608 Herbaceous Shrubland Shrubland 1,633,715 Herbaceous Forest Forest 122,88 Herbaceous Forest Herbaceous 3,181 Herbaceous Forest Shrubland 1,926,88 Shrubland Herbaceous Herbaceous 221,698 Shrubland Herbaceous Shrubland 39,408 Shrubland Shrubland Herbaceous 7,538 Shrubland Shrubland Shrubland 536 Shrubland Forest Herbaceous 363
Updates to Historical Fire Frequency and Severity Additional models added to complete fire regime mapping for the LF2010 product are listed in
table 22. These additions resulted in a complete fire regime table for each mapped BpS. Comparisons of the results of the LF2008 FRG mapping with the LF2010 FRG mapping for the CONUS GeoArea are listed in table 23. Much of the effort toward mapping of FRG-related attributes in LF2010 focused on increasing the amount of area where an actual FRG could be assigned, as opposed to coding areas “indeterminate fire regime characteristics” as documented in the available vegetation dynamics models. This effort was able to extend fire regime characteristics documented into areas that previously had no available models for particular BpS classes. The extent of the “indeterminate” class was substantially decreased and some of the existing FRG data class extents were increased.
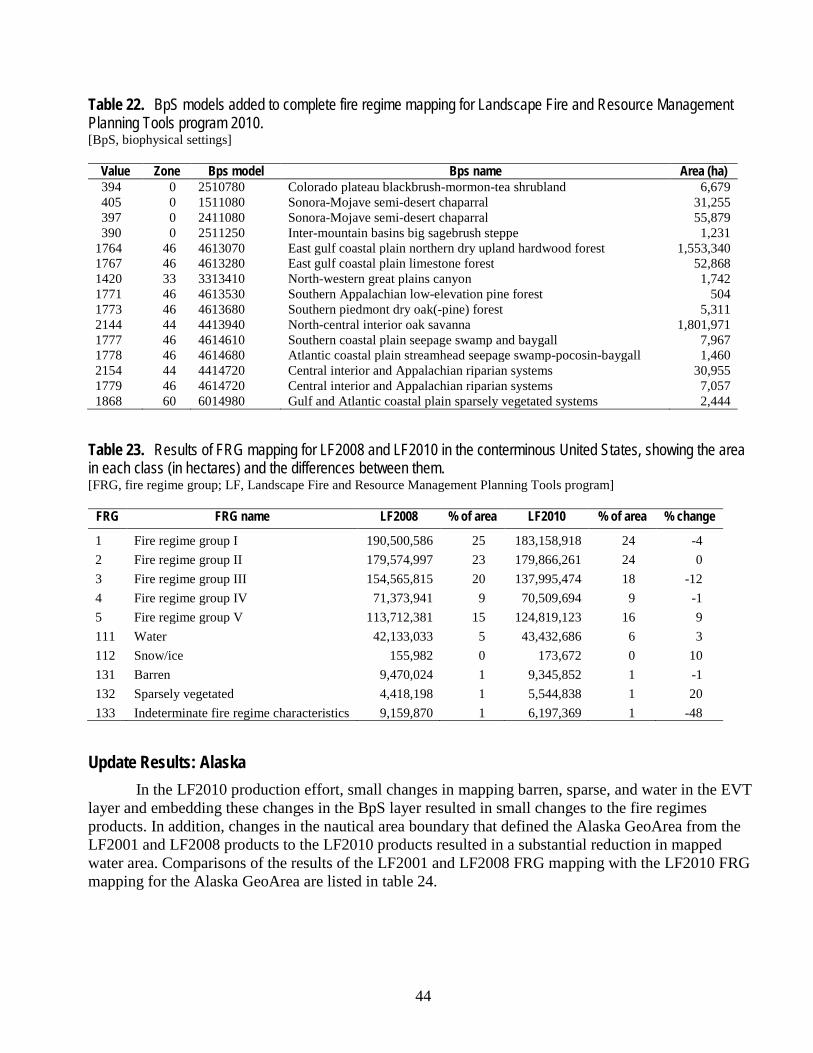
44
Table 22. BpS models added to complete fire regime mapping for Landscape Fire and Resource Management Planning Tools program 2010. [BpS, biophysical settings]
Value Zone Bps model Bps name Area (ha) 394 0 2510780 Colorado plateau blackbrush-mormon-tea shrubland 6,679 405 0 1511080 Sonora-Mojave semi-desert chaparral 31,255 397 0 2411080 Sonora-Mojave semi-desert chaparral 55,879 390 0 2511250 Inter-mountain basins big sagebrush steppe 1,231
1764 46 4613070 East gulf coastal plain northern dry upland hardwood forest 1,553,340 1767 46 4613280 East gulf coastal plain limestone forest 52,868 1420 33 3313410 North-western great plains canyon 1,742 1771 46 4613530 Southern Appalachian low-elevation pine forest 504 1773 46 4613680 Southern piedmont dry oak(-pine) forest 5,311 2144 44 4413940 North-central interior oak savanna 1,801,971 1777 46 4614610 Southern coastal plain seepage swamp and baygall 7,967 1778 46 4614680 Atlantic coastal plain streamhead seepage swamp-pocosin-baygall 1,460 2154 44 4414720 Central interior and Appalachian riparian systems 30,955 1779 46 4614720 Central interior and Appalachian riparian systems 7,057 1868 60 6014980 Gulf and Atlantic coastal plain sparsely vegetated systems 2,444
Table 23. Results of FRG mapping for LF2008 and LF2010 in the conterminous United States, showing the area in each class (in hectares) and the differences between them. [FRG, fire regime group; LF, Landscape Fire and Resource Management Planning Tools program]
FRG FRG name LF2008 % of area LF2010 % of area % change
1 Fire regime group I 190,500,586 25 183,158,918 24 -4 2 Fire regime group II 179,574,997 23 179,866,261 24 0 3 Fire regime group III 154,565,815 20 137,995,474 18 -12 4 Fire regime group IV 71,373,941 9 70,509,694 9 -1 5 Fire regime group V 113,712,381 15 124,819,123 16 9 111 Water 42,133,033 5 43,432,686 6 3 112 Snow/ice 155,982 0 173,672 0 10 131 Barren 9,470,024 1 9,345,852 1 -1 132 Sparsely vegetated 4,418,198 1 5,544,838 1 20 133 Indeterminate fire regime characteristics 9,159,870 1 6,197,369 1 -48
Update Results: Alaska In the LF2010 production effort, small changes in mapping barren, sparse, and water in the EVT
layer and embedding these changes in the BpS layer resulted in small changes to the fire regimes products. In addition, changes in the nautical area boundary that defined the Alaska GeoArea from the LF2001 and LF2008 products to the LF2010 products resulted in a substantial reduction in mapped water area. Comparisons of the results of the LF2001 and LF2008 FRG mapping with the LF2010 FRG mapping for the Alaska GeoArea are listed in table 24.
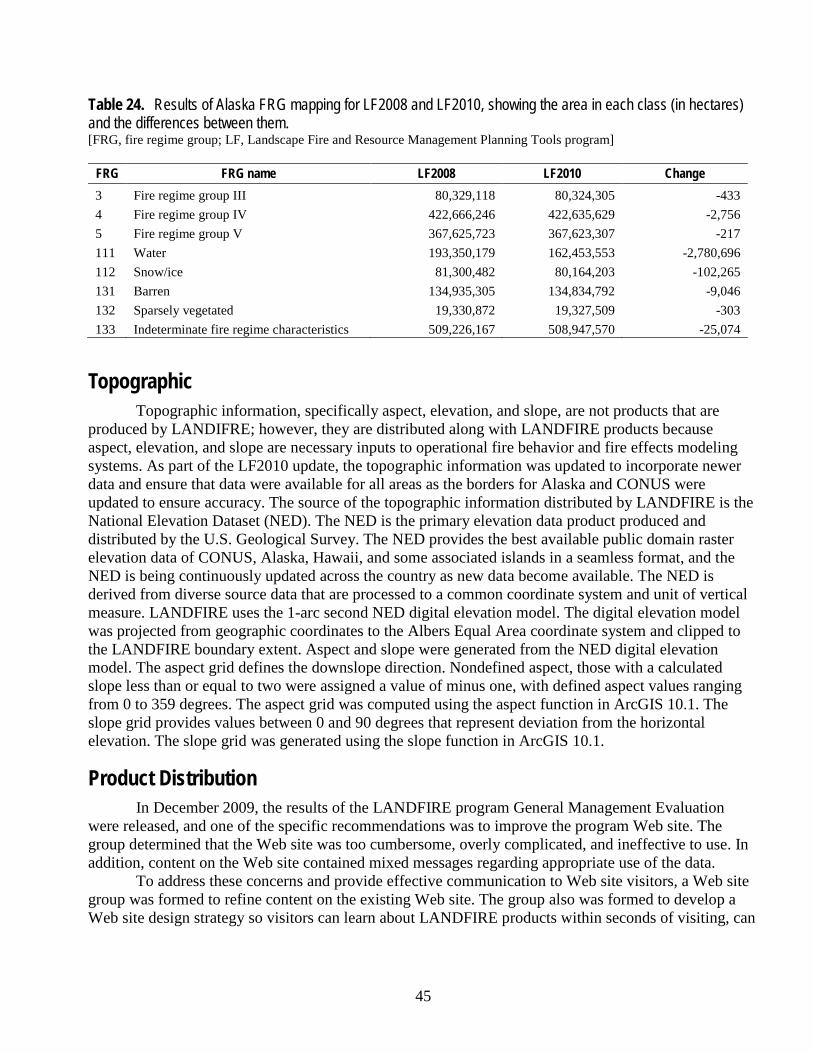
45
Table 24. Results of Alaska FRG mapping for LF2008 and LF2010, showing the area in each class (in hectares) and the differences between them. [FRG, fire regime group; LF, Landscape Fire and Resource Management Planning Tools program]
FRG FRG name LF2008 LF2010 Change 3 Fire regime group III 80,329,118 80,324,305 -433 4 Fire regime group IV 422,666,246 422,635,629 -2,756 5 Fire regime group V 367,625,723 367,623,307 -217 111 Water 193,350,179 162,453,553 -2,780,696 112 Snow/ice 81,300,482 80,164,203 -102,265 131 Barren 134,935,305 134,834,792 -9,046 132 Sparsely vegetated 19,330,872 19,327,509 -303 133 Indeterminate fire regime characteristics 509,226,167 508,947,570 -25,074
Topographic Topographic information, specifically aspect, elevation, and slope, are not products that are
produced by LANDIFRE; however, they are distributed along with LANDFIRE products because aspect, elevation, and slope are necessary inputs to operational fire behavior and fire effects modeling systems. As part of the LF2010 update, the topographic information was updated to incorporate newer data and ensure that data were available for all areas as the borders for Alaska and CONUS were updated to ensure accuracy. The source of the topographic information distributed by LANDFIRE is the National Elevation Dataset (NED). The NED is the primary elevation data product produced and distributed by the U.S. Geological Survey. The NED provides the best available public domain raster elevation data of CONUS, Alaska, Hawaii, and some associated islands in a seamless format, and the NED is being continuously updated across the country as new data become available. The NED is derived from diverse source data that are processed to a common coordinate system and unit of vertical measure. LANDFIRE uses the 1-arc second NED digital elevation model. The digital elevation model was projected from geographic coordinates to the Albers Equal Area coordinate system and clipped to the LANDFIRE boundary extent. Aspect and slope were generated from the NED digital elevation model. The aspect grid defines the downslope direction. Nondefined aspect, those with a calculated slope less than or equal to two were assigned a value of minus one, with defined aspect values ranging from 0 to 359 degrees. The aspect grid was computed using the aspect function in ArcGIS 10.1. The slope grid provides values between 0 and 90 degrees that represent deviation from the horizontal elevation. The slope grid was generated using the slope function in ArcGIS 10.1.
Product Distribution In December 2009, the results of the LANDFIRE program General Management Evaluation
were released, and one of the specific recommendations was to improve the program Web site. The group determined that the Web site was too cumbersome, overly complicated, and ineffective to use. In addition, content on the Web site contained mixed messages regarding appropriate use of the data.
To address these concerns and provide effective communication to Web site visitors, a Web site group was formed to refine content on the existing Web site. The group also was formed to develop a Web site design strategy so visitors can learn about LANDFIRE products within seconds of visiting, can
46
rapidly locate and download products, can quickly access additional information, can return to the Web site for needed products or information, and can follow consistent and predictable navigation.
The resulting design strategy focused on what LANDFIRE data are available, how data are intended to and can be used, how to access the data, and how to collaborate with LANDFIRE. Content on the new site is organized in a hierarchical fashion where the user is greeted with general information about LANDFIRE and its products, whereas specific and detailed information for general and expert users are accessible from clearly identified menus.
To ensure content on the LANDFIRE program Web site remains consistent and organized, content filters were identified. These content filters ensure new content is located and language is consistent with the design strategy. Also, the Web site content is regularly evaluated to ensure that the content is relevant and timely.
Summary and Conclusions The LF2010 update has resulted in refined and more current products available to the many
programs, partners, and local users of LANDFIRE data. New technologies, datasets, algorithms, and processing capabilities were used to complete this effort. The processes defined for the LF2010 update will serve as a base for building future updating efforts, requiring less effort to define methodologies and increasing the efficiency and timeliness of future updates.
The reference data products included more than 3,300 point records added to the LFRDB and more than 200,000 events perimeters processed, with nearly 125,000 unique records added to the events geodatabase. The updated disturbance process simplified creation of the annual and composite disturbance layers and resulted in a more efficient methodology that yielded improved results. Furthermore, by adapting algorithms used by NLCD, a program partner, LANDFIRE has laid a foundation for closer collaboration between the two programs in future efforts.
The vegetation update process successfully implemented an updated legend to account for urban, agricultural, and ruderal vegetation types. Multiple life-form and leaf-form classes were split into single life-form and leaf-form variants. An updated numbering scheme and approach for mapping barren and sparse vegetation were also adopted. The result was a more detailed EVT layer with better definition in many class types to address known problems with the previous data. Similarly, the EVC and EVH layers were refined to include more consistent values for each life-form across the entire United States. The improved vegetation layers were then used with the vegetation transition process to provide updated products capturing resultant vegetation changes from disturbance and succession.
The surface and canopy fuel data were updated based on the updated vegetation data. Fuel ruleset refinements were made as a result of the EVT legend changes that were implemented. An evaluation process was developed and implemented using the NEXUS fire behavior modeling system to characterize the effect of fuel data changes on fire behavior using percentile weather conditions for each representative area. Additionally, several case studies were presented from actual wildfire incidents demonstrating the changes in fire behavior modeling outputs as a result of changes to the fuel data.
Refinements to the BpS maps were completed and used to update fire regime layers. Newly available topographic data from NED were also acquired and included in the updated LF2010 product suite. Finally, the LANDFIRE Web site was completely redesigned and provides an easier to use and friendlier interface to the LANDFIRE program and data.

47
References Cited Anderson, H.E., 1982, Aids to determining fuel models for estimating fire behavior: U.S. Department of
Agriculture, Forest Service, Intermountain Forest and Range Experiment Station General Technical Report INT–122, 22 p.
Barrett, S., Havlina, D., Jones, J., Hann, W., Frame, C., Hamilton, D., Schon, K., Demeo, T., Hutter, L., and Manakis, J., 2010, Interagency fire regime condition class guidebook—Version 3.0, U.S. Department of Agriculture, Forest Service, U.S. Department of the Interior, and The Nature Conservancy, 126 p.
Boryan, C., Yang, Z., Mueller, R., and Craig, M., 2011, Monitoring U.S. agriculture—The U.S. Department of Agriculture, National Agricultural Statistics Service, Cropland Data Layer Program: Geocarto International, v. 26, no. 5, p. 341–358.
Comer, P., Faber-Langendoen, D., Evans, R., Gawler, S., Josse, C., Kittel, G., Menard, S., Pyne, M., Reid, M., Schulz, K., Snow, K., and Teague, J., 2003, Ecological systems of the United States—A working classification of U.S. terrestrial systems: Arlington, Va., NatureServe, 83 p.
Dixon, G.E., 2002, Essential FVS—A user's guide to the Forest Vegetation Simulator: U.S. Department of Agriculture Forest Service, Forest Management Service Center Internal Report, 240 p.
Eidenshink, J., Schwind, B., Brewer, K., Zhu, Z.L., Quayle, B., and Howard, S., 2007, A project for monitoring trends in burn severity: Fire Ecology, v. 3, no. 1, p. 3–21.
Finney, M.A., 2004, FARSITE—Fire area simulator— Model development and evaluation: U.S. Department of Agriculture, Forest Service, Rocky Mountain Research Station Research Paper RMRS–RP–4, 47 p.
Finney, M.A., 2006, An overview of FlamMap fire modeling capabilities, in Fuels Management—How to measure success, Portland, Oreg., Mar. 28–30, 2006, Proceedings: Fort Collins, Colo., U.S. Department of Agriculture, Forest Service, Rocky Mountain Research Station, p. 213–220.
Fry, J.A., Xian, G., Jin, S., Dewitz, J.A., Homer, C.G., Yang, L., Barnes, C.A., Herold, N.D., and Wickham, J.D., 2011, Completion of the 2006 national land cover database for the conterminous United States: Photogrammetric Engineering and Remote Sensing, v. 77, no. 9, p. 858–864.
Hann, W.J., and Bunnell, D.L., 2001, Fire and land management planning and implementation across multiple scales: International Journal of Wildland Fire, v. 10, no. 4, p. 389–403.
Harding, D.J., and Carabajal, C.C., 2005, ICESat waveform measurements of within-footprint topographic relief and vegetation vertical structure: Geophysical Research Letters, v. 32, no. 21, p. L21S10.
Huang, C., Goward, S.N., Masek, J.G., Thomas, N., Zhu, Z., and Vogelmann, J.E., 2010, An automated approach for reconstructing recent forest disturbance history using dense Landsat time series stacks: Remote Sensing of Environment, v. 114, no. 1, p. 183–198.
Jin, S., Yang, L., Danielson, P., Homer, C., Fry, J., and Xian, G., 2013, A comprehensive change detection method for updating the national land cover database to circa 2011: Remote Sensing of Environment, v. 132, no. 1, p. 159–175.
Masek, J.G., Vermote, E.F., Saleous, N.E., Wolfe, R., Hall, F.G., Huemmrich, K.F., Gao, F., Kutler, J., and Lim, T.K., 2006, A landsat surface reflectance dataset for North America, 1990–2000: IEEE Geoscience and Remote Sensing Letters, v. 3, no. 1, p. 68–72.
Maxwell, S.K., Schmidt, G.L., and Storey, J.C., 2007, A multi‐scale segmentation approach to filling gaps in Landsat ETM+ SLC‐off images: International Journal of Remote Sensing, v. 28, no. 23, p. 5339–5356.
Nelson, K.J., Connot, J., Peterson, B., and Martin, C., 2013a, The LANDFIRE refresh strategy: updating the national dataset: Fire Ecology, v. 9, no. 2, p. 80–101.

48
Nelson, K.J., Connot, J., Peterson, B., and Picotte, J.J., 2013b, LANDFIRE 2010—Updated data to support wildfire and ecological management: Earthzine, http://www.earthzine.org/2013/09/15/landfire-2010-updated-data-to-support-wildfire-and-ecological-management, accessed December 21, 2015.
Peterson, B., and Nelson, K.J., 2014, Mapping forest height in Alaska using GLAS, landsat composites, and airborne lidar: Remote Sensing, v. 6, no. 12, p. 12409–12426.
Reeves, M.C., Ryan, K.C., Rollins, M.G., and Thompson, T.G., 2009, Spatial fuel data products of the LANDFIRE project: International Journal of Wildland Fire, v. 18, no. 3, p. 250–267.
Reinhardt, E., and Crookston, N.L., 2003, The fire and fuels extension to the Forest Vegetation Simulator: U.S. Department of Agriculture, Forest Service, Rocky Mountain Research Station General Technical Report RMRS–GTR–116, 209 p.
Rollins, M.G., 2009, LANDFIRE—A nationally consistent vegetation, wildland fire, and fuel assessment: International Journal of Wildland Fire, v. 18, no. 3, p. 235–249.
Roy, D.P., Ju, J., Kline, K., Scaramuzza, P.L., Kovalskyy, V., Hansen, M., Loveland, T.R., Vermote, E., and Zhang, C., 2010, Web-enabled Landsat Data (WELD)—Landsat ETM+ composited mosaics of the conterminous United States: Remote Sensing of Environment, v. 114, no. 1, p. 35–49.
Schmidt, K.M., Menakis, J.P., Hardy, C.C., Hann, W.J., and Bunnell, D.L., 2002, Development of coarse-scale spatial data for wildland fire and fuel management: U.S. Department of Agriculture, Forest Service, Rocky Mountain Research Station General Technical Report RMRS–GTR–87, 41 p.
Scott, J., 2003, NEXUS 2.0—Not just a spreadsheet anymore, in 2nd International Wildland Fire Ecology and Fire Management Congress and the 5th Symposium on Fire and Forest Meteorology, Orlando, Fla., Nov. 16 – 20, 2003: American Meteorological Society, p. J3E.3.
Scott, J.H., and Burgan, R.E., 2005, Standard fire behavior fuel models—A Comprehensive set for use with Rothermel's surface fire spread model: U.S. Department of Agriculture, Forest Service, Rocky Mountain Research Station General Technical Report RMRS–GTR–153, 72 p.
Stocks, B.J., Lynham, T.J., Lawson, B.D., Alexander, M.E., Wagner, C.E.V., McAlpine, R.S., and Dubé, D.E., 1989, Canadian forest fire danger rating system—An Overview: The Forestry Chronicle, v. 65, no. 4, p. 258–265.
United States National Vegetation Classification, 2015, U.S. National Vegetation Classification Web page, accessed December 21, 2015, at http://usnvc.org.
Vogelmann, J.E., Kost, J.R., Tolk, B., Howard, S., Short, K., Chen, X., Huang, C., Pabst, K., and Rollins, M.G., 2011, Monitoring landscape change for LANDFIRE using multi-temporal satellite imagery and ancillary data: IEEE Journal of Selected Topics in Applied Earth Observations and Remote Sensing, v. 4, no. 2, p. 252–264.

ISSN 2331-1258 (online) http://dx.doi.org/10.3133/ofr20161010