Embed Size (px)
Citation preview

LandDevelopment
TransportInvestment
AccessibiAccessibilitylity
The Role of Transportation Investments inThe Role of Transportation Investments inShaping Land DevelopmentShaping Land Development
Robert CerveroRobert CerveroUC BerkeleyUC Berkeley
Five Points (“Truths”?)Five Points (“Truths”?)
1) Regionally, impacts are mainly Redistributive.
Highways:Highways: California County Investments (Boarnet) Beltway Studies
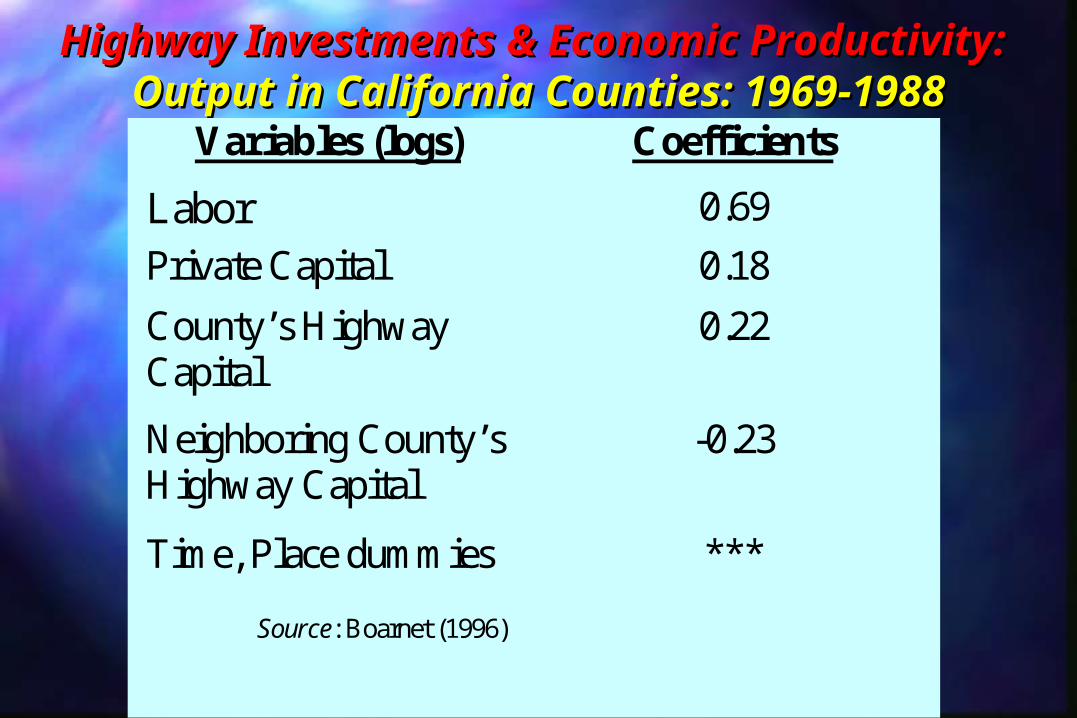
Highway Investments & Economic Highway Investments & Economic Productivity: Productivity:
Output in California Counties: 1969-1988Output in California Counties: 1969-1988Variables (logs) Coefficients
Labor 0.69
Private Capital 0.18
County’s Highway Capital
0.22
Neighboring County’s Highway Capital
-0.23
Time, Place dummies ***
Source: Boarnet (1996)
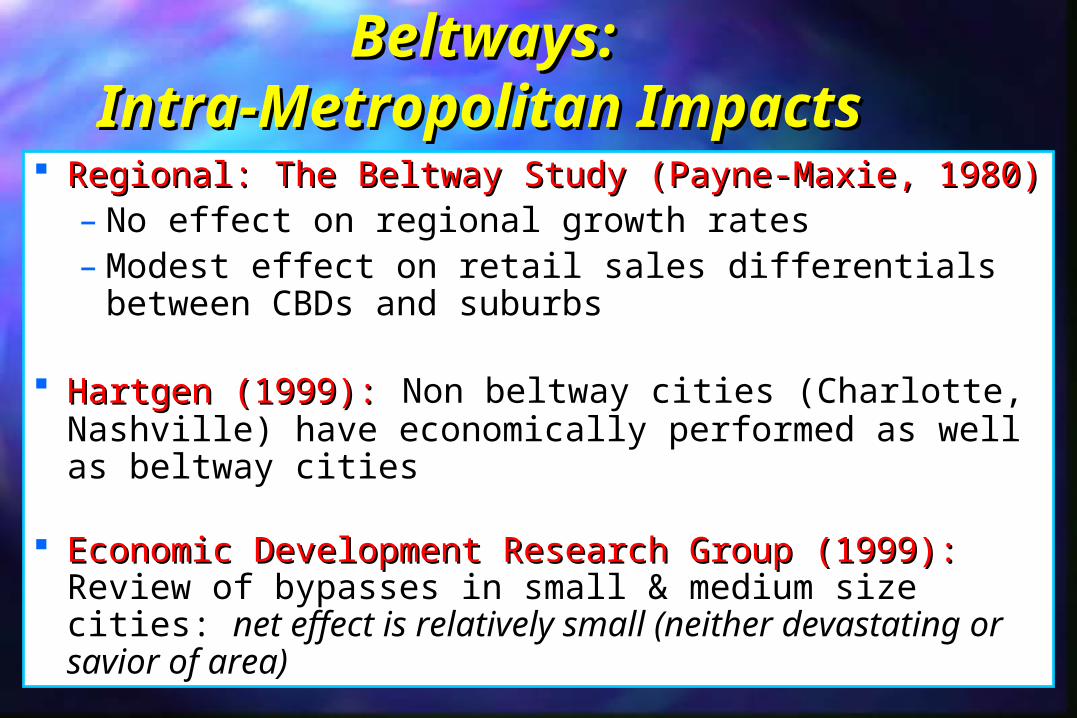
Beltways: Beltways: Intra-Metropolitan ImpactsIntra-Metropolitan Impacts
Regional: The Beltway Study (Payne-Maxie, 1980)Regional: The Beltway Study (Payne-Maxie, 1980)– No effect on regional growth rates – Modest effect on retail sales differentials between
CBDs and suburbs
Hartgen (1999):Hartgen (1999): Non beltway cities (Charlotte, Nashville) have economically performed as well as beltway cities
Economic Development Research Group (1999): Economic Development Research Group (1999): Review of bypasses in small & medium size cities: net effect is relatively small (neither devastating or savior of area)
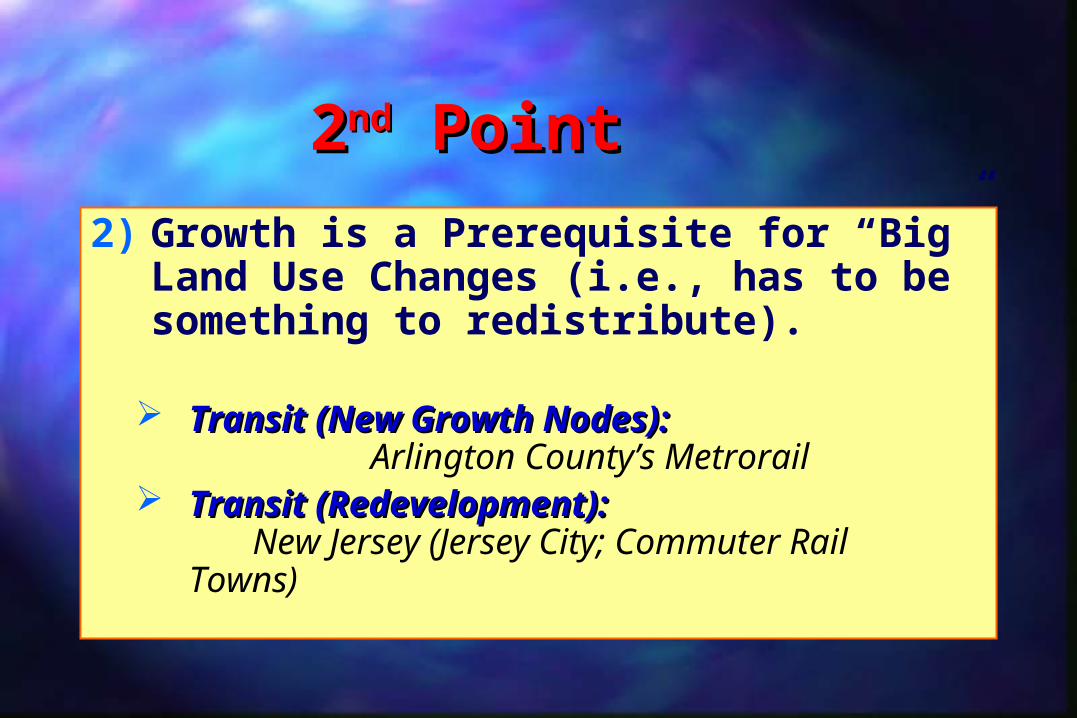
22ndnd Point Point
2) Growth is a Prerequisite for “Big” Land Use Changes (i.e., has to be something to redistribute).
Transit (New Growth Nodes):Transit (New Growth Nodes): Arlington County’s Metrorail
Transit (Redevelopment):Transit (Redevelopment): New Jersey (Jersey City; Commuter Rail Towns)
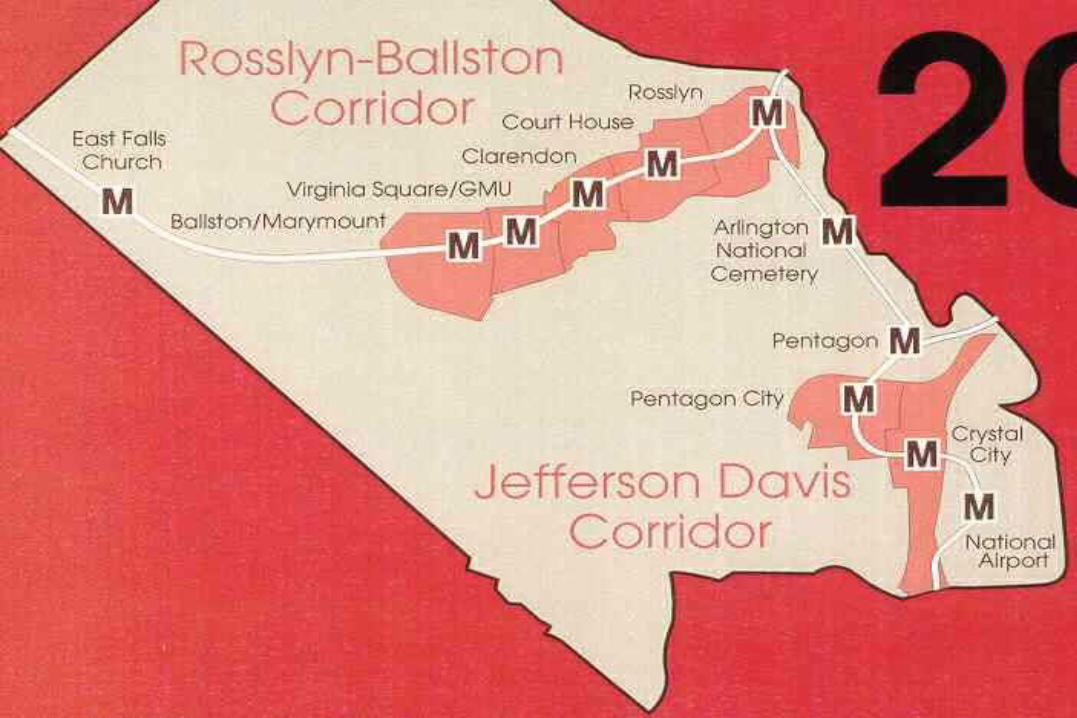
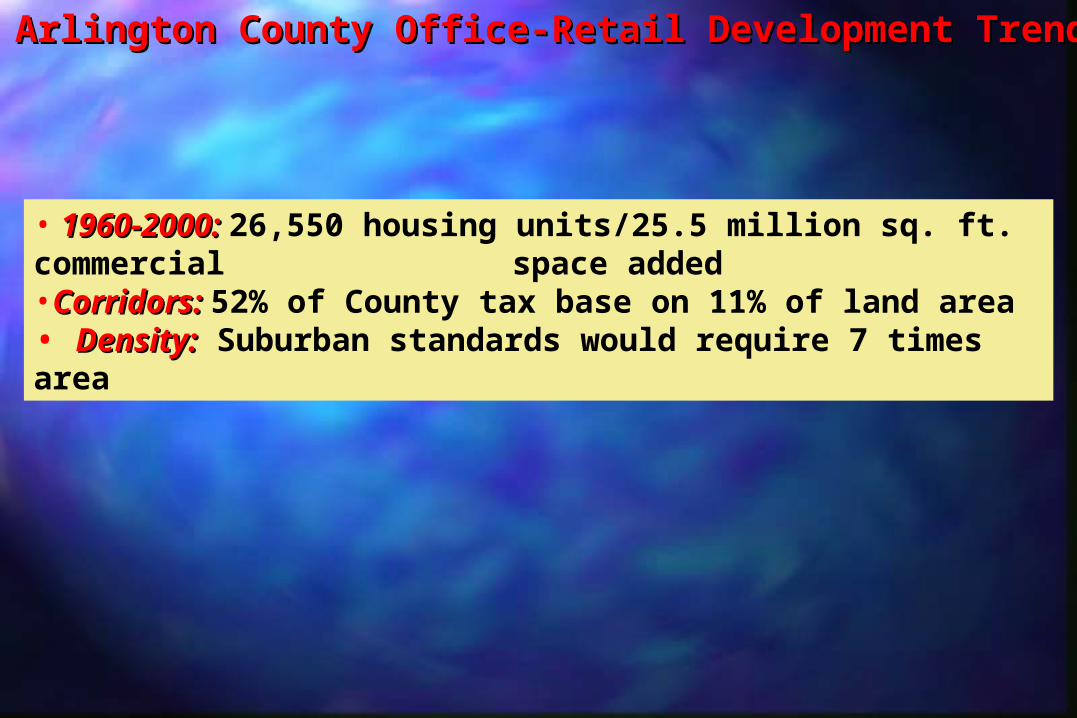
Arlington County Office-Retail Development TrendsArlington County Office-Retail Development Trends
• 1960-2000:1960-2000: 26,550 housing units/25.5 million sq. ft. commercial space added •Corridors:Corridors: 52% of County tax base on 11% of land area• Density:Density: Suburban standards would require 7 times area
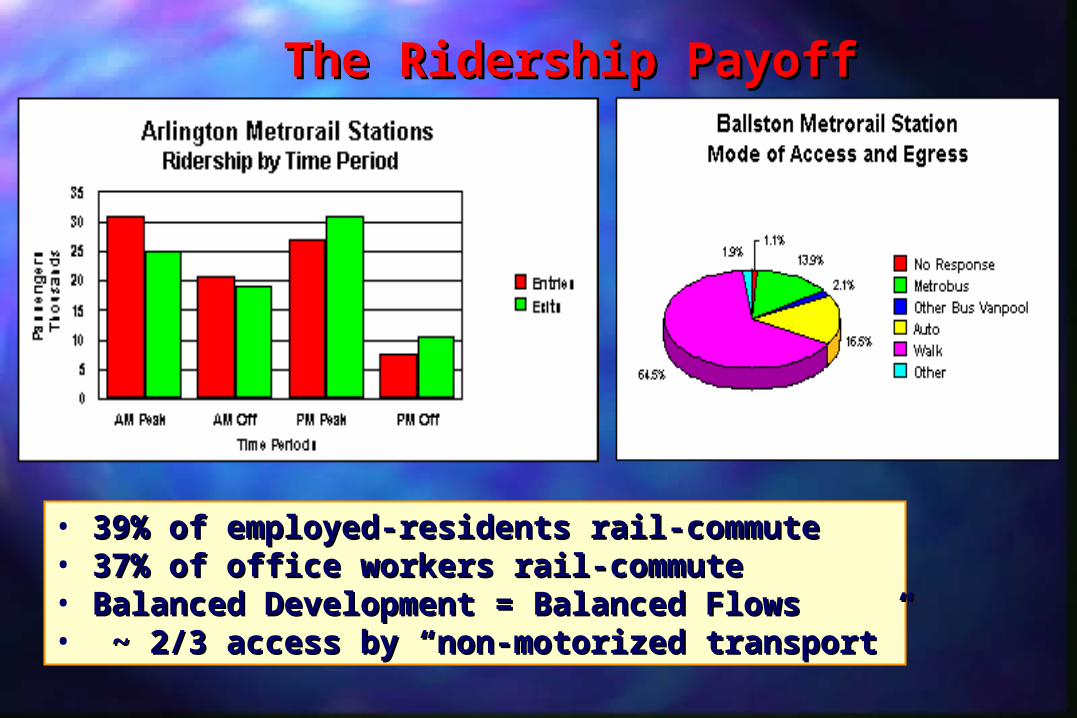
The Ridership Payoff The Ridership Payoff
• 39% of employed-residents rail-commute 39% of employed-residents rail-commute • 37% of office workers rail-commute37% of office workers rail-commute• Balanced Development = Balanced FlowsBalanced Development = Balanced Flows• ~ 2/3 access by “non-motorized transport”~ 2/3 access by “non-motorized transport”
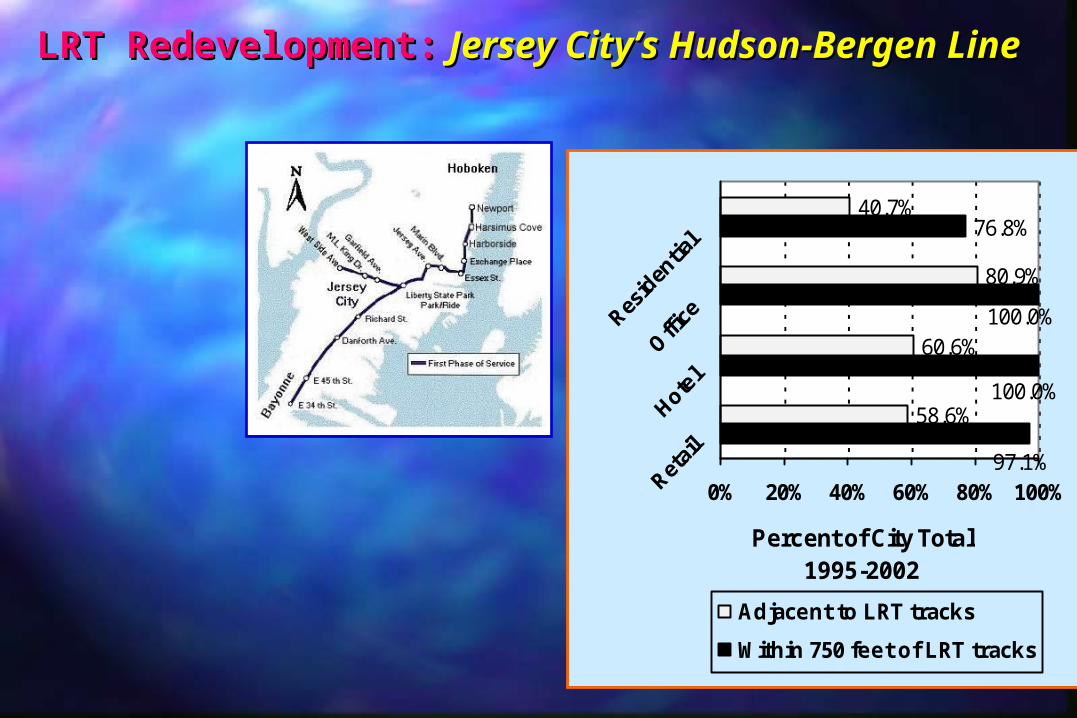
76.8%
58.6%
60.6%
80.9%
40.7%
97.1%
100.0%
100.0%
0% 20% 40% 60% 80% 100%
Percent of City Total1995-2002
Adjacent to LRT tracks
Within 750 feet of LRT tracks
LRT Redevelopment:LRT Redevelopment: Jersey City’s Hudson-Bergen Line Jersey City’s Hudson-Bergen Line
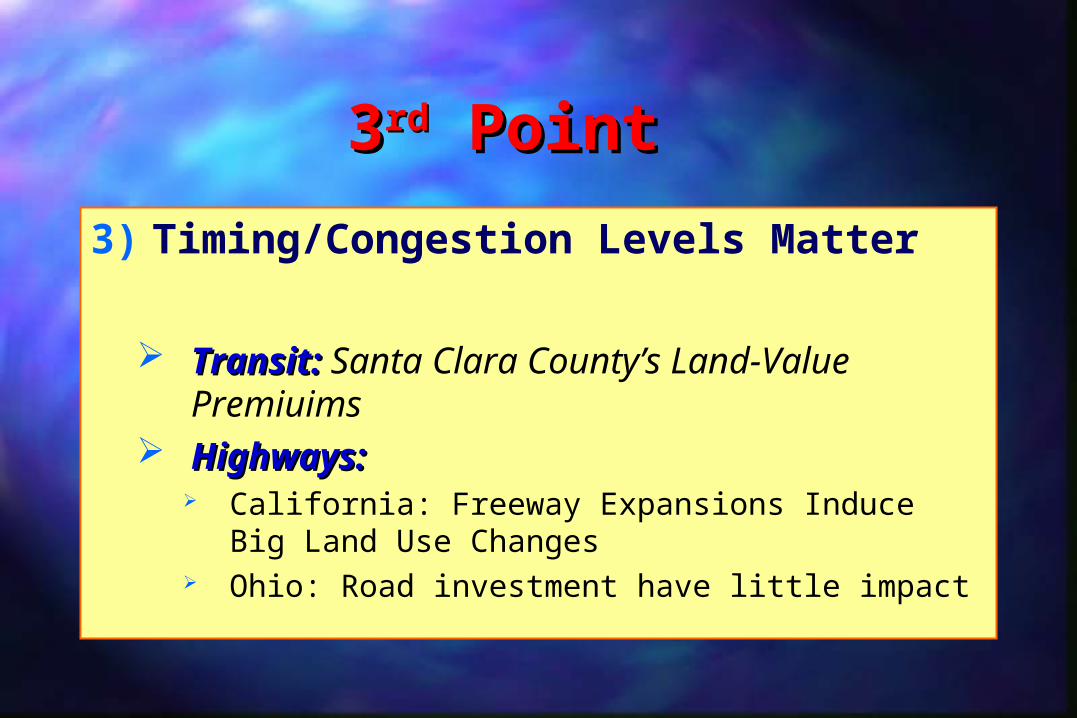
33rdrd Point Point
3) Timing/Congestion Levels Matter
Transit:Transit: Santa Clara County’s Land-Value Premiuims
Highways: Highways: California: Freeway Expansions Induce Big
Land Use Changes Ohio: Road investment have little impact
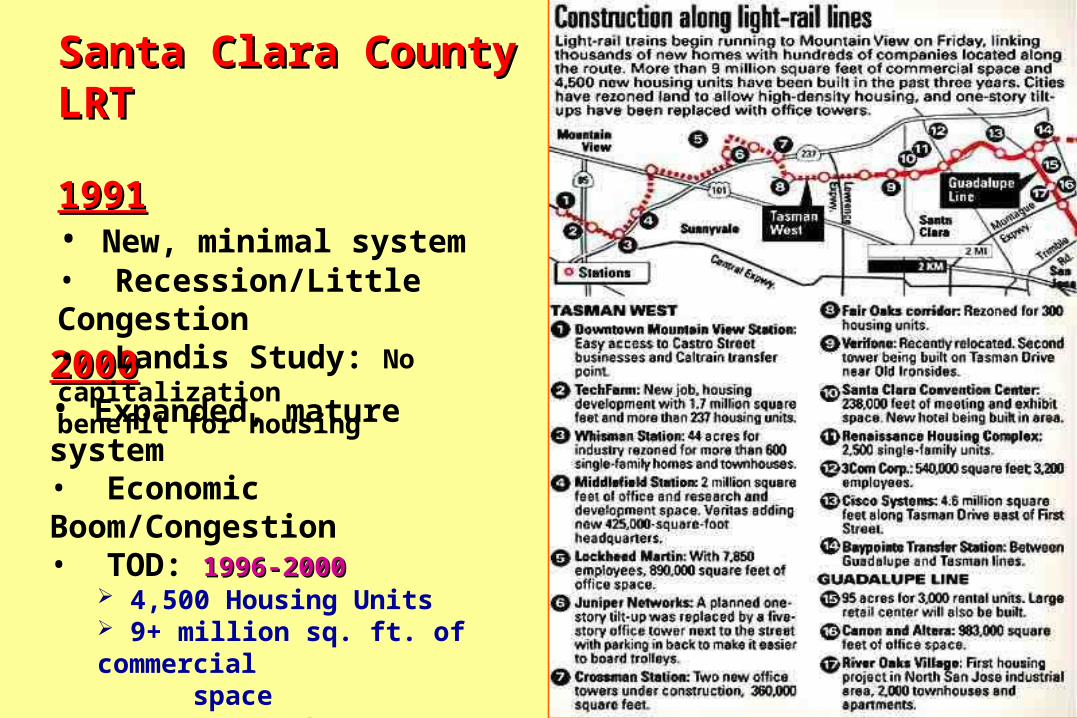
20002000• Expanded, mature system• Economic Boom/Congestion• TOD: 1996-20001996-2000
4,500 Housing Units 9+ million sq. ft. of commercial space
• Cervero Study: AppreciableCapitalization benefits
Santa Clara Santa Clara County LRTCounty LRT
19911991• New, minimal system• Recession/Little Congestion• Landis Study: No capitalization benefit for housing
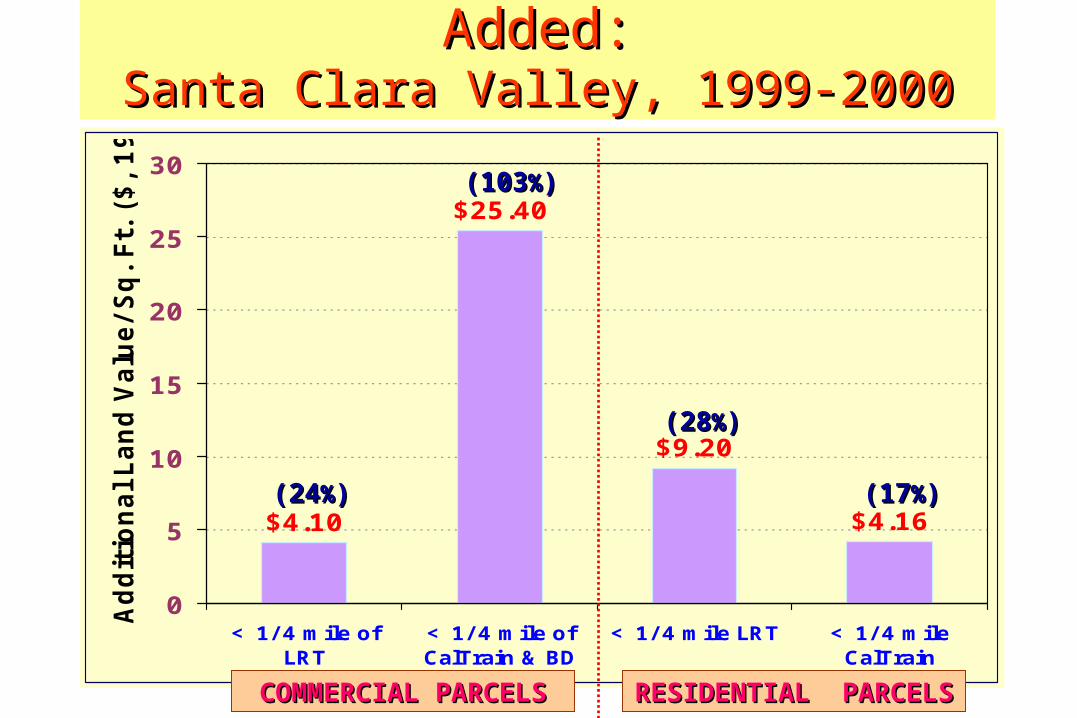
Transit Proximity & Value-Added:Transit Proximity & Value-Added:Santa Clara Valley, 1999-2000Santa Clara Valley, 1999-2000
$4.10
$25.40
$9.20
$4.16
0
5
10
15
20
25
30
< 1/ 4 mile ofLRT
< 1/ 4 mile ofCalTrain & BD
< 1/ 4 mile LRT < 1/ 4 mileCalTrain
Addit
ional Land V
alu
e/Sq. Ft.
($, 1999)
(24(24%%))
(103(103%%))
(28(28%%))
(17(17%%))
COMMERCIAL COMMERCIAL PARCELSPARCELS
RESIDENTIAL RESIDENTIAL PARCELSPARCELS
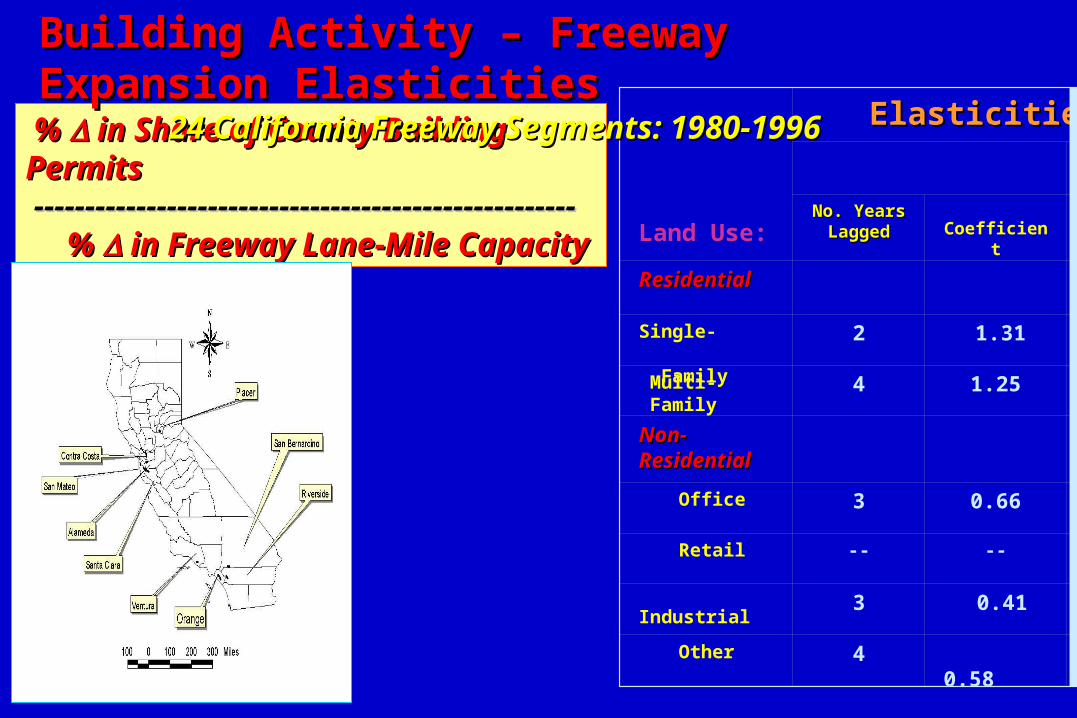
Land Use:
Elasticities Elasticities
No. YearsNo. YearsLaggedLagged
Coefficient
ResidentialResidential
Single- Family
2 1.31
Multi- Family
4 1.25
Non-Non-ResidentialResidential
Office 3 0.66
Retail -- --
Industrial 3 0.41
Other 4 0.58
% % in Share of County in Share of County Building Permits Building Permits ---------------------------------------------------------------------------------------------------------- % % in Freeway Lane-Mile in Freeway Lane-Mile CapacityCapacity
Building Activity – Freeway Expansion Building Activity – Freeway Expansion ElasticitiesElasticities
24 California Freeway Segments: 1980-199624 California Freeway Segments: 1980-1996
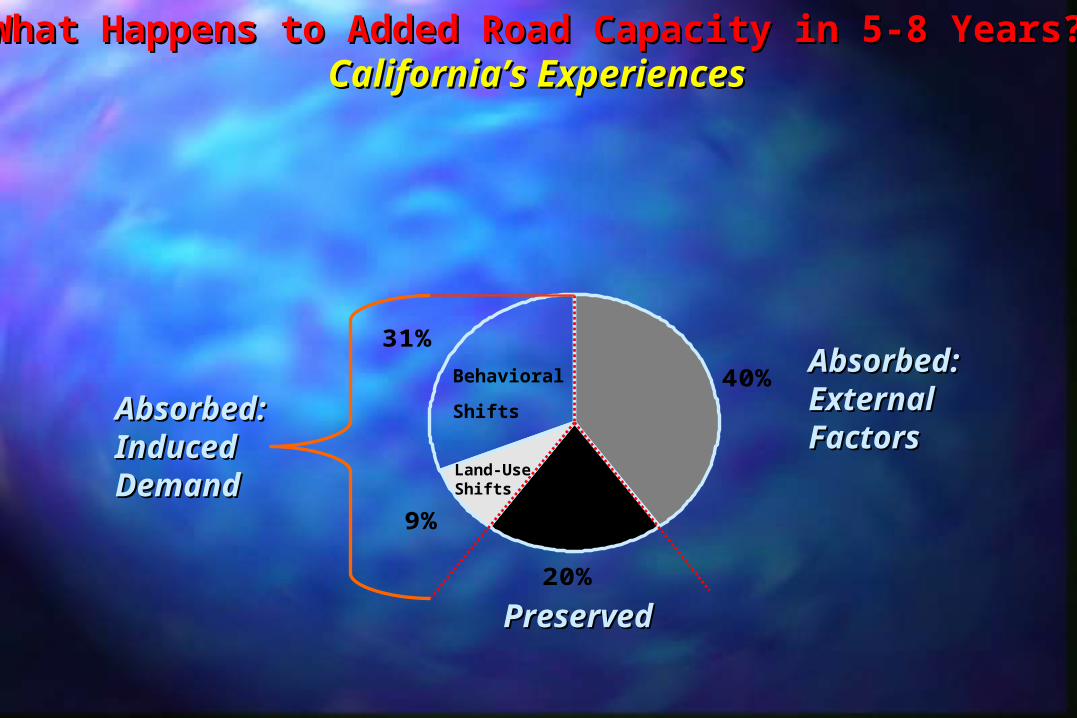
40%
20%
9%
31%
Land-UseShifts
Behavioral
Shifts Absorbed:Absorbed:Induced Induced DemandDemand
PreservePreservedd
AbsorbeAbsorbed:d:ExternalExternalFactors Factors
What Happens to Added Road Capacity in 5-8 Years?What Happens to Added Road Capacity in 5-8 Years?California’s ExperiencesCalifornia’s Experiences
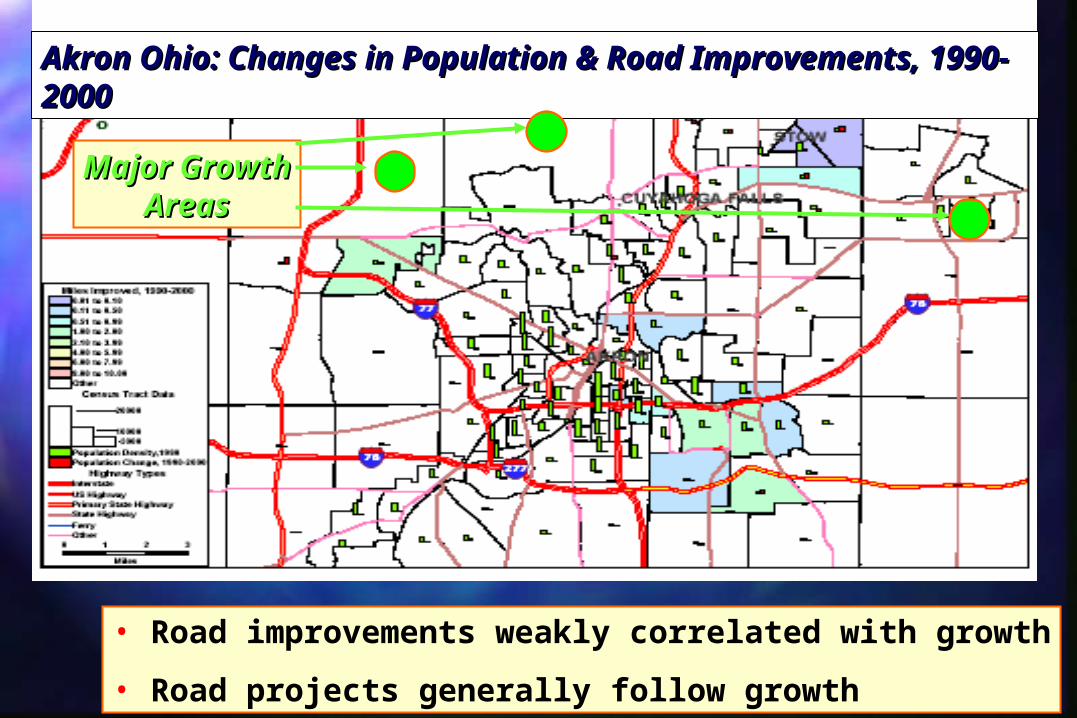
• Road improvements weakly correlated with growth
• Road projects generally follow growth
Akron Ohio: Changes in Population & Road Akron Ohio: Changes in Population & Road Improvements, 1990-2000Improvements, 1990-2000
Major GrowthMajor GrowthAreasAreas
44thth Point Point
4) Given Growth, Proactive Planning is Key to Leveraging “Smart Growth” Outcomes
Transit: San DiegoTransit: San Diego “Tiajuana Corridor”: No Growth, Little
Planning, No Impacts Mission Valley Corridor: Substantial Growth,
Proactivism, Big Impacts
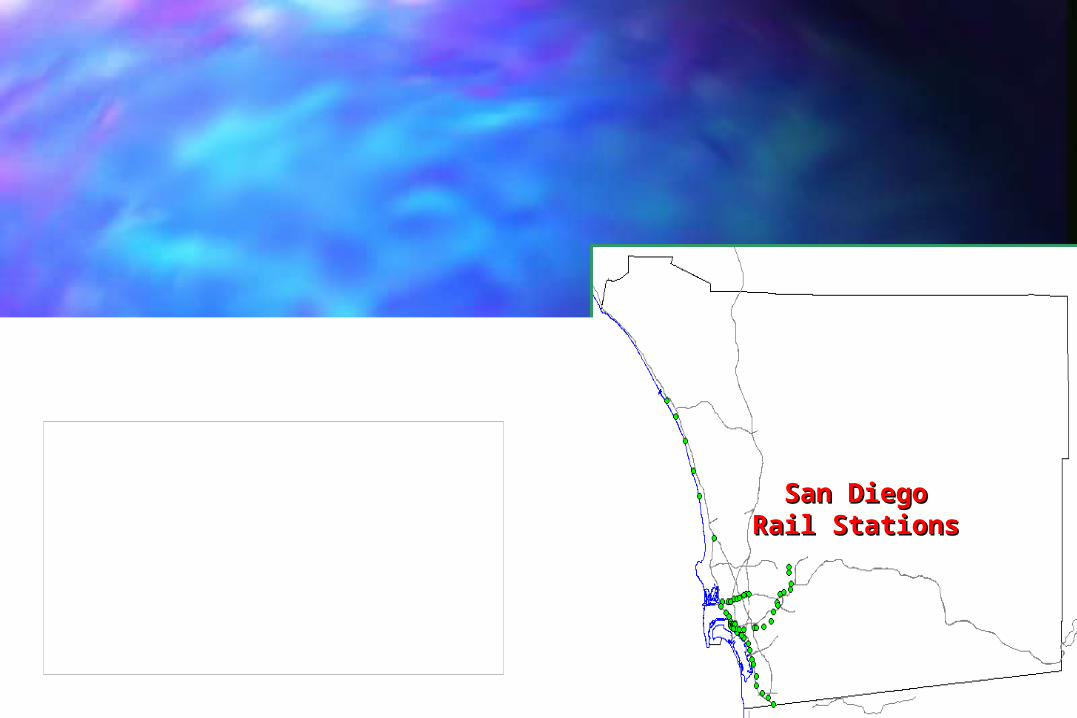
San DiegoSan DiegoRail StationsRail Stations
4 6 .1 %
2 .2 %
3 .0 %
6 .4 %
3 .5 %
0 % 5 % 1 0 % 1 5 % 2 0 % 2 5 % 3 0 % 3 5 % 4 0 % 4 5 % 5 0 %
La nd V a lue P re m ium /Dis c ount, P e rc e nt
T ro lle y : S o u th L in e
T ro lle y : E a s t L in e
T ro lle y : N o rth L in e
T ro lle y : D o w n to w n
C o a s te r
MF HousingMF Housing
38.5%
-4.2%
1.9%
30.4%
-0.5%
-3.9%
-10% -5% 0% 5% 10% 15% 20% 25% 30% 35% 40% 45%
La nd V a lue P re m ium /Discount, P e rce nt
Tro lley: South L ine
Tro lley: East L ine
Tro lley: N orth L ine
Tro lley: D ow ntow n
C oaster
C oaster: D ow ntow n
CommercialCommercial
SAN DIEGOSAN DIEGOTROLLEY & COASTER’s VALUE-ADDEDTROLLEY & COASTER’s VALUE-ADDED

55thth Point Point
5) Finance Connection: Value Capture – Makes Sense in Theory, Hard in Practice
Happens: Happens: Indirectly: Property Tax Intake More directly: Joint Development Most directly: Benefit Assessment

-1 .6%
-6 .0%
3 .4%
1.2%
0.5%
-3 .4%
3 .7%
-3 .5%
6 .1%
-8% -6% -4% -2% 0% 2% 4% 6% 8%
Land Value P re mium/D iscount, P e rce nt
M etro R ed S ubw ay L ine
M etro link Antelope V a lley L ine
M etro link R iverside L ine
M etro link S an B ernard ino L ine
M etro link V entura L in e
M etro LR T B lue L ine
M etro LR T G reen L in e
M etro R ap id V entura B R T L ine
M etro R ap id W ilsh ire -W hittier B R T L ine
Los Angeles: Mixed ExperiencesLos Angeles: Mixed ExperiencesMulti-Family Housing Premium/Discount
Benefit Benefit AssessmentAssessment
9% of funds to retire Red Line Capital
Bonds
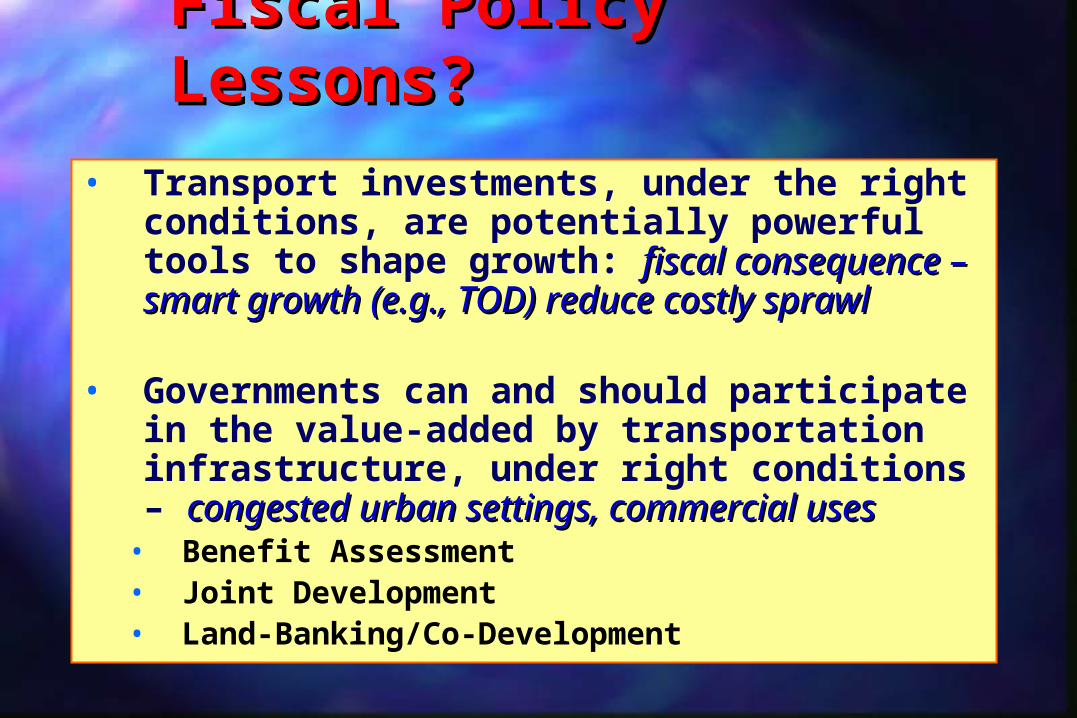
Fiscal Policy Lessons? Fiscal Policy Lessons?
• Transport investments, under the right conditions, are potentially powerful tools to shape growth: fiscal consequence – fiscal consequence – smart growth (e.g., TOD) reduce costly sprawlsmart growth (e.g., TOD) reduce costly sprawl
• Governments can and should participate in the value-added by transportation infrastructure, under right conditions – congested urban settings, commercial usescongested urban settings, commercial uses
• Benefit Assessment• Joint Development• Land-Banking/Co-Development


![robert c.PPT [Read-Only] - · PDF fileRobert Cervero University of California, ... Sears Warehouse ... Pleasant Hill BART 2nd Generation TODGeneration TOD b](https://img.pdfslide.us/doc/110x75/5ab2020f7f8b9a7e1d8d141e/robert-cppt-read-only-cervero-university-of-california-sears-warehouse.jpg)