Embed Size (px)
Citation preview
Prepared by
WAHLSTROM & ASSOCIATES
August 2015
Lacey Community Market Study
FINAL REPORT
Prepared by
WAHLSTROM & ASSOCIATES
REPORT CONTRIBUTORS
Stephen Wahlstrom, Project Manager (Wahlstrom & Associates)
Yve Susskind, Associate (Wahlstrom & Associates)
Libby Wood, Production (Wahlstrom & Associates)
CITY STAFF
George Smith, Economic Development Coordinator
Rick Walk, Community Development Director

Lacey Community Market Study 2 Final Report August, 2015
TABLE OF CONTENTS
1. SUMMARY OF FINDINGS AND REPORT ORGANIZATION 3!
ORGANIZATION OF REPORT 6!
2. COMMUNITY AND REGIONAL DEMOGRAPHIC TRENDS 7!
3. LACEY’S ECONOMIC SETTING 10!
3.1 Business Inventory 10
3.2 Inventory of Built Commercial Space 12
3.3 Employment by Industry in Lacey and the Region 15
3.4 Employment Growth Trends 17
4. EMPLOYMENT AND LAND DEMAND PROJECTIONS 21!
4.1 Employment by Industry Projections 21
4.2 Land Demand Projections 23
5. RETAIL LEAKAGE ANALYSIS 25!
5.1 Inventory of Occupied Retail Space 25
5.2 Retail Sales Earnings 25
5.3 Spending Leakages 26
6. ECONOMIC DEVELOPMENT OPPORTUNITIES 31!
6.1 Opportunities and Barriers to Lease and Start a New Business in Lacey 32
6.2 Feasible Commercial Uses for the Existing Building Stock 32
6.3 Business Recruitment Strategies 34
APPENDIX A: Report Table !
Lacey Community Market Study 3 Final Report August, 2015
1. SUMMARY OF FINDINGS AND REPORT ORGANIZATION
Key findings and results to this report are summarized below. The Appendix includes data tables that describe Lacey’s demographic characteristics, economic trends, and the projected demand for land and business space.
Demographics
! Lacey’s demographic characteristics are similar to Thurston County and the State of Washington in terms of growth trends, age distribution, level of educational attainment, cultural diversity, and other socioeconomic characteristics;
! Lacey residents are moderate income with slightly more middle-income households and fewer high-income earners than the State;
! Household incomes experienced severe decline during the great recession with incomes dropping by $12,000 per household after adjusting for inflation. Incomes have recovered during the past five years and climbed back up to the same level as 2000. It is important to note that Thurston County and the State experienced similar patterns of income losses during the recession, followed by a recovery of household income since 2010.
! Lacey has a somewhat higher unemployment rate (7.5 percent) and lower labor force participation rate than the State and County;
! Lacey’s population is growing slightly faster than both the region and state, due to its less severe decline during the great recession.
Business Inventory
! 1,013 business establishments are located within Lacey’s City Limits. Arts, entertainment, accommodations, and food services account for 28 percent of the establishments, with national and regional chain stores comprising about half of the food and personal service establishments;
! The body of the report describes the number of firms in each sector, and a list of every establishment doing business in the City is included in Appendix B.
Built Space Inventory
! The City of Lacey has 3.6 million square feet of built commercial space with nearly 2.2 million square feet occupied by retail establishments;
! The remainder of Lacey’s built commercial space includes:
o 222,000 square feet of full-service restaurants, pizza, take-out, and fast food establishments;
o 220,000 square feet of lodging facilities;
o 178,000 square feet of self-storage;
Lacey Community Market Study 4 Final Report August, 2015
o 128,000 square feet occupied by arcades, cinemas, fitness clubs, and a small casino;
o 125,000 square feet of professional service establishments.
! The inventory also includes 240,000 square feet of vacant space that could be occupied by retail establishments.
Employment by Industry Characteristics
! Lacey’s private and public sector employers generate 16,900 jobs;
! The City has a weak manufacturing job base that is primarily comprised of food, beverage, and furniture manufacturing;
! The wholesale trade sector is very strong capturing nearly 30 percent of Thurston County’s jobs;
! Retail trade is a significantly larger share of Lacey’s economy (17 percent of all jobs) than it is in Thurston County or the entire State;
! Approximately 36 percent of Thurston County’s finance jobs are located in Lacey.
Employment Growth Trends
! Lacey’s economy has consistently out-performed the regional and State economy since 2000;
! Employment growth was faster in Lacey than the surrounding region during time periods of strong growth—2001 to 2007, and since 2010;
! Lacey’s loss of jobs was less severe during the great recession than was the loss of jobs in the region and the state.
Employment and Land Demand Projections
! Lacey can anticipate that 13,700 new jobs will be added to the City’s economy by 2035. On average, Lacey’s economy should expand by 620 jobs per year;
! The projected new jobs will generate a demand for 2.8 million square feet of new ground floor commercial space by 2035;
! An additional 850,000 square feet of new office and business park space will be needed along with 1.5 million square feet of industrial and flex space and 270,000 square feet of warehouse and storage space.
Retail Sales Leakages
! Lacey’s 140 retail establishments anchored by 10 big-box establishments earn nearly $870 million of sales;
! Lacey’s big-box anchor stores have become a regional shopping destination with sales earned greatly exceeding the market area residents spending of $370 million at commercial stores;
! $62.5 million of spending leakages on new and used automobiles may be plugged.
Lacey Community Market Study 5 Final Report August, 2015
Economic Development Opportunities
! Lacey’s economic development opportunities are primarily constrained by the lack of manufacturing establishments throughout Thurston County, which are driven by technological innovation that generate strong economic and employment multipliers through value added activities.
! Health care and government are Lacey’s two relatively weak economic sectors, compared to Thurston County.
! Lacey’s barriers to growth are subtle, complex and directly related to the absence of a downtown or a central gathering place for people and civic activities.
! Lacey has 240,000 square feet of vacant commercial space that could be occupied by retail and other commercial establishments. The larger vacant spaces that range in size between 11,000 square feet and 42,000 square feet are too poorly located to successfully attract regional serving retail, which makes attracting new retailers to the vacant spaces very difficult given the absence of spending leakages.
! The City should consider allowing some of the larger vacant sites to be redeveloped for housing or a mix of uses; a vacant site in the Martin Village shopping center could be subdivided and reused for more arcades, a fun center or a food court; The City should encourage new investors to acquire and redevelop the South Sound Shopping Center for a mix of uses with less land used for parking and more intensive floor area ratios. Other large sites along the Lacey Blvd. and Pacific Avenue corridor could be reused for general commercial space.
! Smaller vacant commercial spaces that average only 1,800 square feet in size could be promoted through a local tour that can generate some interest from home based businesses or individuals local looking for new commercial or live-work space.
! The City should encourage a new commercial real estate product to be developed in the Gateway area that is designed as a walkable Lifestyle or Factory Outlet Center. If planned and designed properly, a new lifestyle factory outlet center at the Gateway could attract additional regional customers.
! The City of Lacey should consider alternatives to “old school” economic development approaches that offer incentives to reduce the costs of doing business thereby entering into a race to the bottom with neighboring communities. Alternative approaches to consider include establishing a business expansion and retention program; encouraging a mix of smart growth uses in a single location that includes transit hubs, housing and commercial services, and; creating a website that will match business prospects with Lacey’s available business sites.
! The City should also consider allowing fulfillment centers that distribute on-line retail sales, which require at least 1 million square feet of space. Lacey’s excellent I-5 access can offer corporations an ideal location for new fulfillment centers serving the Puget Sound region.
Lacey Community Market Study 6 Final Report August, 2015
ORGANIZATION OF REPORT
This report documents nearly six months of work. Below is a brief explanation of each section of the report.
Section 1 Summarizes the findings and organization of this report.
Section 2 Describes the community and regional demographic trends, including population, and household and income characteristics of Lacey and the surrounding market area.
Section 3 Describes Lacey’s economic setting, including an inventory of existing business establishments, an inventory of built commercial space within each commercial area of the City, a description of employment by industry within the City limits and the surrounding region, and an analysis of past employment growth trends.
Section 4 Projects the growth of employment and the demand for new business space and land in Lacey through 2035.
Section 5 Describes the capture of retail sales, consumer spending, and leakages that may be captured.
Section 6 Summarizes Lacey’s economic development opportunities and provides suggestions on taking advantage of the City’s location to capture a larger share of the market opportunities.
Lacey Community Market Study 7 Final Report August, 2015
2. COMMUNITY AND REGIONAL DEMOGRAPHIC TRENDS
Lacey’s demographic characteristics share similarities with Thurston County and the State of Washington. However, Lacey is growing slightly faster than both the three-county I-5 corridor region and State, due to its less severe decline during the great recession.
The local and regional demographic characteristics are described below with detailed tables contained in Appendix A. The demographic information is purchased from Claritas, which uses the U.S. Census American Community Survey as the data source.
Population Growth Trends
Lacey’s 2.8 percent annual population growth rates between 2000 and 2010 far exceeded growth rates in Thurston County, the region,1 and the State of Washington. Though they have slowed, Lacey’s growth rates continue to exceed the County, region, and State since 2010.
Nearly 20,000 housing units have been developed in the City of Lacey, which amounts to about 17 percent of Thurston County’s housing units. The number of Lacey’s housing units expanded at a 3.1 percent annual rate between 2000 and 2010. Since 2010, annual population growth rates have slowed to 2.1 percent, but the growth of housing units continues to exceed the County, region, and State of Washington.2
Age Characteristics
The age characteristics of Lacey’s residents are very similar to Thurston County, the region, and the State of Washington. Lacey residents are slightly younger than the average Thurston County resident: about 38 years compared to about 40 years. However, the difference is minimal, and the region and State both have average ages of about 38. Approximately 26 percent of Lacey residents are 55 years or older, compared to 29 percent of Thurston County residents and 27 percent in the region and State.3
Educational Attainment
Lacey and Thurston County residents are similar to the State as a whole in attainment of bachelor’s or advanced college degrees (29 percent, 31 percent and 32 percent, respectively). The region has a slightly lower rate of higher education degrees (25 percent). Conversely, 7 percent of Lacey adults, and 6 percent in the County, did not finish high school, a lower rate than the State as a whole and than the region (with 10 and 9 percent respectively).4
1 Region includes the three contiguous I-5 counties of Thurston, Pierce, and Lewis.
2 Appendix Table A-1 describes the population and housing unit growth trends between 2000 and 2015.
3 Appendix Table A-2 describes the age characteristics among the residents of Lacey, Thurston County, and the surrounding region, 2015.
4 Appendix Table A-3 describes the formal education completed among the adult (25 and older) residents of Lacey, Thurston County, and the surrounding region.
Lacey Community Market Study 8 Final Report August, 2015
Language Spoken at Home
Sixteen percent of Lacey residents do not speak English at home with 8 percent speaking an Asian language, 4 percent Spanish and 3 percent other languages. Eleven percent of Thurston County residents do not speak English at home as do 14 percent in the three-county I-5 corridor region. The State has a higher rate of language diversity with 19 percent of residents that do not speak English at home.5
Labor Force Participation
A review of the current unemployment and labor force participation data shows some characteristics that distinguish Lacey from Thurston County and the region. Lacey’s 7.5 percent estimated unemployment is nearly a percentage higher than Thurston County’s 6.6 percent unemployment rate (2014 annual average).6 It is significant to note that 60 percent of Lacey residents (16 years of age and older) participate in the labor force compared to 64 percent in Thurston County. The reasons for a lower labor force participation rate are likely due to a combination of factors that includes the establishment two retirement communities along with a higher percentage of young U.S. military retirees that have been attracted to the community and the relatively large number of service members stationed at JBLM who have larger families and children living at home who choose to reside in Lacey.7
Travel Time to Work
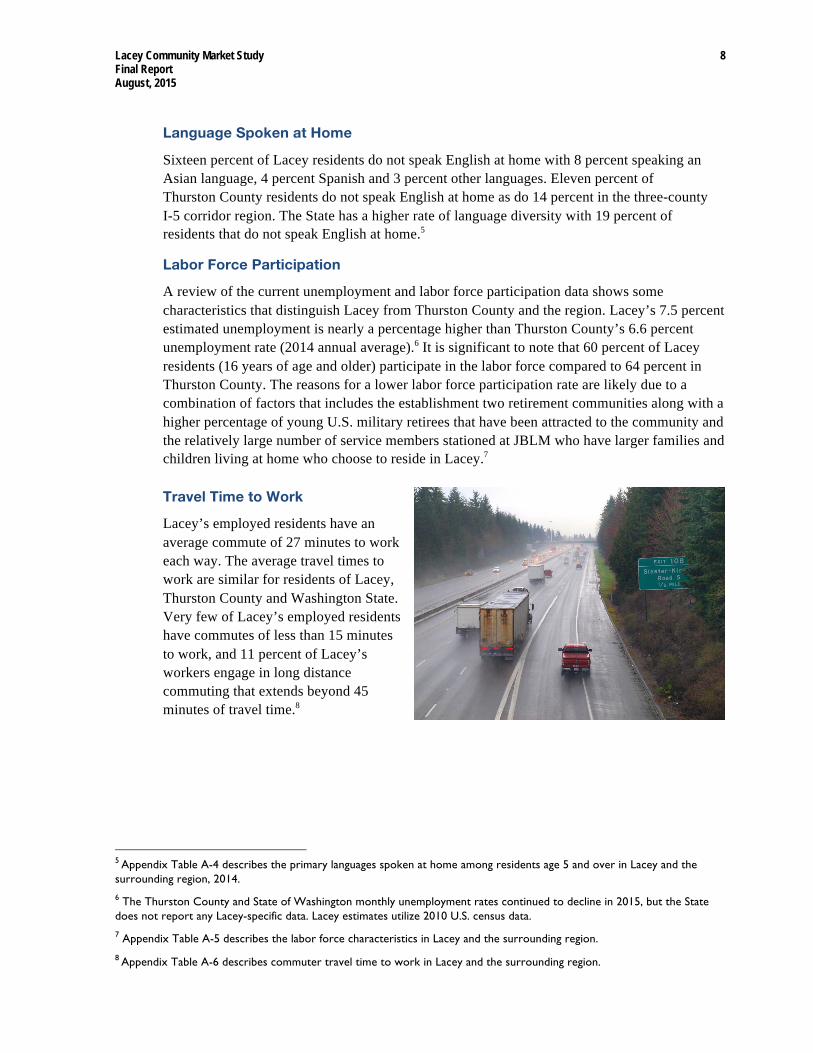
Lacey’s employed residents have an average commute of 27 minutes to work each way. The average travel times to work are similar for residents of Lacey, Thurston County and Washington State. Very few of Lacey’s employed residents have commutes of less than 15 minutes to work, and 11 percent of Lacey’s workers engage in long distance commuting that extends beyond 45 minutes of travel time.8
5 Appendix Table A-4 describes the primary languages spoken at home among residents age 5 and over in Lacey and the surrounding region, 2014.
6 The Thurston County and State of Washington monthly unemployment rates continued to decline in 2015, but the State does not report any Lacey-specific data. Lacey estimates utilize 2010 U.S. census data.
7 Appendix Table A-5 describes the labor force characteristics in Lacey and the surrounding region.
8 Appendix Table A-6 describes commuter travel time to work in Lacey and the surrounding region.
Lacey Community Market Study 9 Final Report August, 2015
Income Trends and Distribution
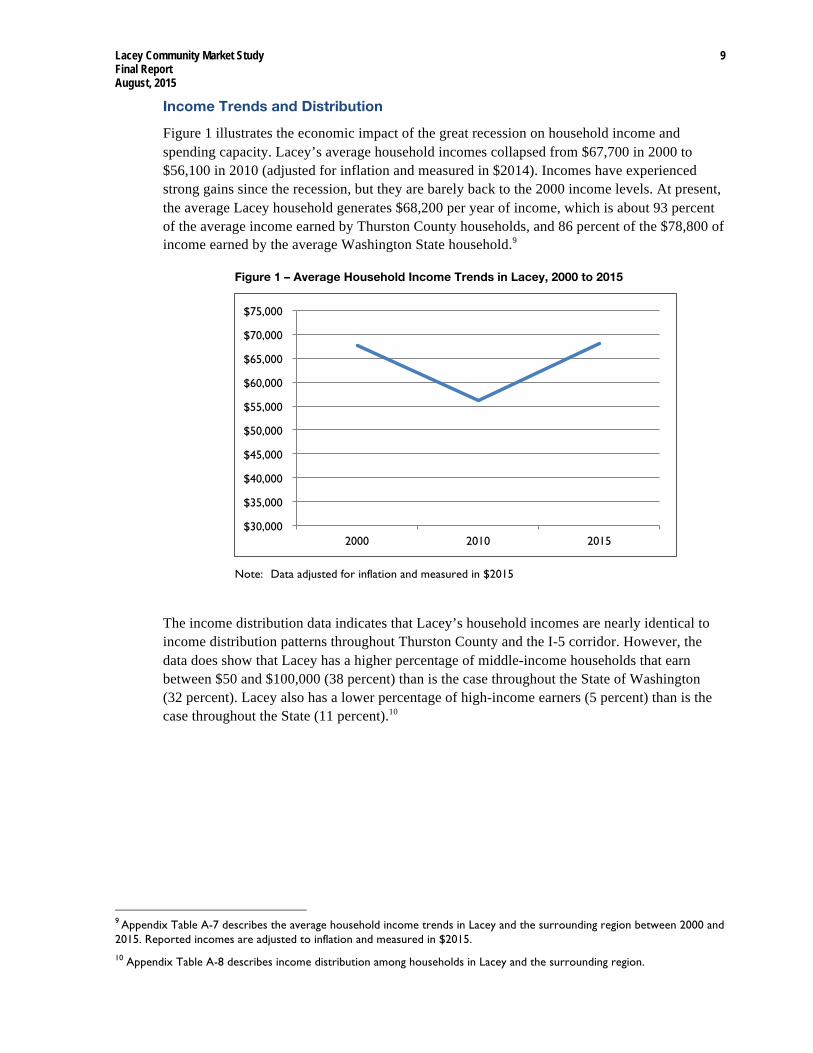
Figure 1 illustrates the economic impact of the great recession on household income and spending capacity. Lacey’s average household incomes collapsed from $67,700 in 2000 to $56,100 in 2010 (adjusted for inflation and measured in $2014). Incomes have experienced strong gains since the recession, but they are barely back to the 2000 income levels. At present, the average Lacey household generates $68,200 per year of income, which is about 93 percent of the average income earned by Thurston County households, and 86 percent of the $78,800 of income earned by the average Washington State household.9
Figure 1 – Average Household Income Trends in Lacey, 2000 to 2015
Note: Data adjusted for inflation and measured in $2015
The income distribution data indicates that Lacey’s household incomes are nearly identical to income distribution patterns throughout Thurston County and the I-5 corridor. However, the data does show that Lacey has a higher percentage of middle-income households that earn between $50 and $100,000 (38 percent) than is the case throughout the State of Washington (32 percent). Lacey also has a lower percentage of high-income earners (5 percent) than is the case throughout the State (11 percent).10
9 Appendix Table A-7 describes the average household income trends in Lacey and the surrounding region between 2000 and 2015. Reported incomes are adjusted to inflation and measured in $2015.
10 Appendix Table A-8 describes income distribution among households in Lacey and the surrounding region.
$30,000
$35,000
$40,000
$45,000
$50,000
$55,000
$60,000
$65,000
$70,000
$75,000
2000 2010 2015
Lacey Community Market Study 10 Final Report August, 2015
3. LACEY’S ECONOMIC SETTING
This section of the report provides an analysis of the current economic base and historical trends. It includes an inventory of private sector business establishments, an inventory of built commercial space, a description of the local and regional economic base, and an analysis of past job growth trends that will influence Lacey’s future economic growth.
The establishment information within this section of the report is purchased from InfoUSA with Wahlstrom & Associates checking for the accuracy of the location and NAICS code of each establishment. The data rely on lenders’ requirements for individual establishments to report employment, sales, and other business information to Dun & Bradstreet or directly to private lenders.
3.1 Business Inventory
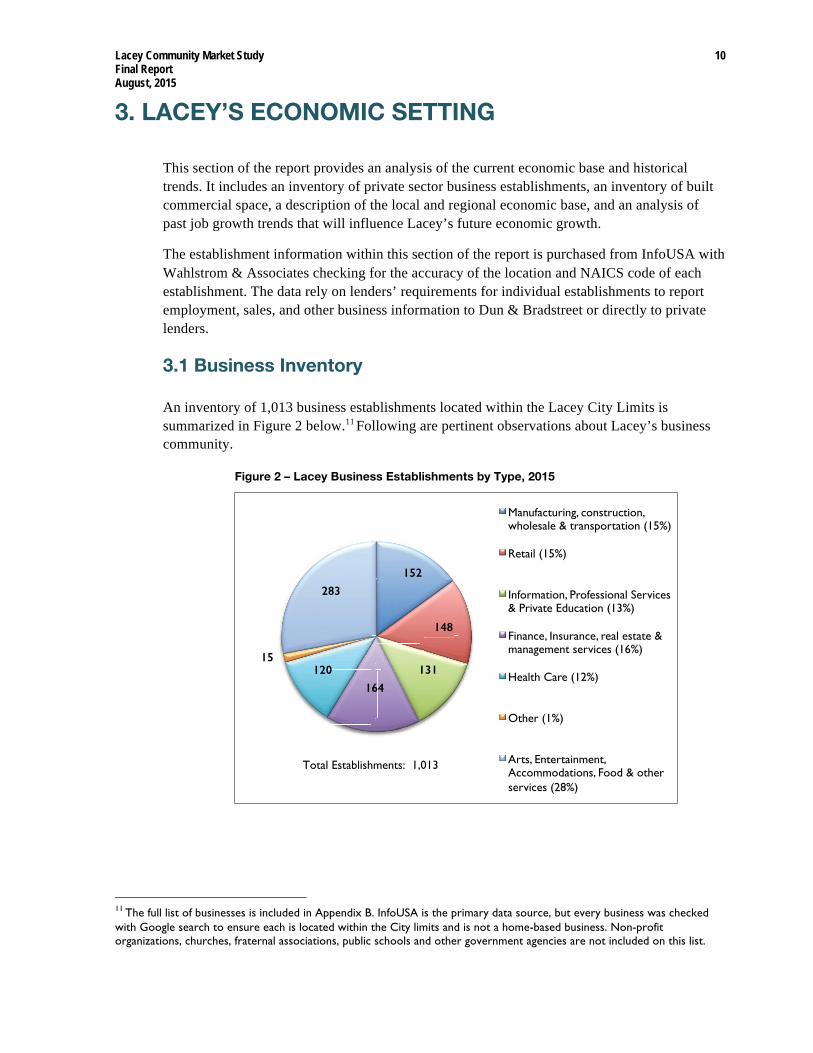
An inventory of 1,013 business establishments located within the Lacey City Limits is summarized in Figure 2 below.11 Following are pertinent observations about Lacey’s business community.
Figure 2 – Lacey Business Establishments by Type, 2015
11 The full list of businesses is included in Appendix B. InfoUSA is the primary data source, but every business was checked with Google search to ensure each is located within the City limits and is not a home-based business. Non-profit organizations, churches, fraternal associations, public schools and other government agencies are not included on this list.
152!
148!
131!
164!
120!15!
283!
Manufacturing, construction, wholesale & transportation (15%)
Retail (15%)
Information, Professional Services & Private Education (13%)
Finance, Insurance, real estate & management services (16%)
Health Care (12%)
Other (1%)
Arts, Entertainment, Accommodations, Food & other services (28%)
Total Establishments: 1,013
Lacey Community Market Study 11 Final Report August, 2015
Food and Personal Service Establishments
Food or personal service establishments comprise 28 percent of Lacey’s business inventory. National and regional chain stores make up about half of the 283 food and personal service establishments that employ more than 50 workers each. Establishments that employ 50 or more workers include Hawks Prairie Casino, Ram Restaurant & Brewery, Red Robin Burgers, McDonald’s, Applebee’s, and the Golf Club At Hawks Prairie. In general, each small, independent food and personal service establishments employ fewer than five workers.
Finance, Insurance, and Real Estate
Lacey’s economy includes 164 establishments in the business of finance and other related fields. The inventory includes well-known national corporations that employ a small number of workers at each branch office. Financial establishments that employ 50 or more workers each include: Anchor Bank, Access Information Management, First Citizens Bank, Twinstar Credit Union, and America’s Credit Union.
Construction, Wholesale Trade, Manufacturing, and Transportation Establishments
Fifty-nine construction companies are located in Lacey, among many other home-based construction businesses. One large firm (Sunset Air) employs approximately 200 workers but all other construction establishments employ 35 or fewer workers each.
Forty-three business establishments located in Lacey engage in the wholesale trade of a wide range of products including food, pharmaceuticals, electrical equipment, and other materials. Wholesale establishments employing more than 50 workers each include the Alarm Center, International Paper, Trader Joe’s, Shipwreck Beads, and Summit Fence Company. Eight of Lacey’s wholesale establishments earn more than $50 million of sales per year. In addition to the jobs these large revenue-producing firms provide directly, they also generate strong economic multipliers through the local and regional economy.
Thirty-three manufacturing establishments are located in Lacey, including 10 that are engaged in producing food and beverages. The largest manufacturer is IP Callison & Sons, a producer of mint oils and flavors that employs nearly 100 workers. The remaining manufacturers employ fewer than 40 workers per establishment. In addition, two of Lacey’s manufacturing establishments earn more than $10 million of sales per year, and the remaining thirty or so establishments are not high-revenue producing businesses.
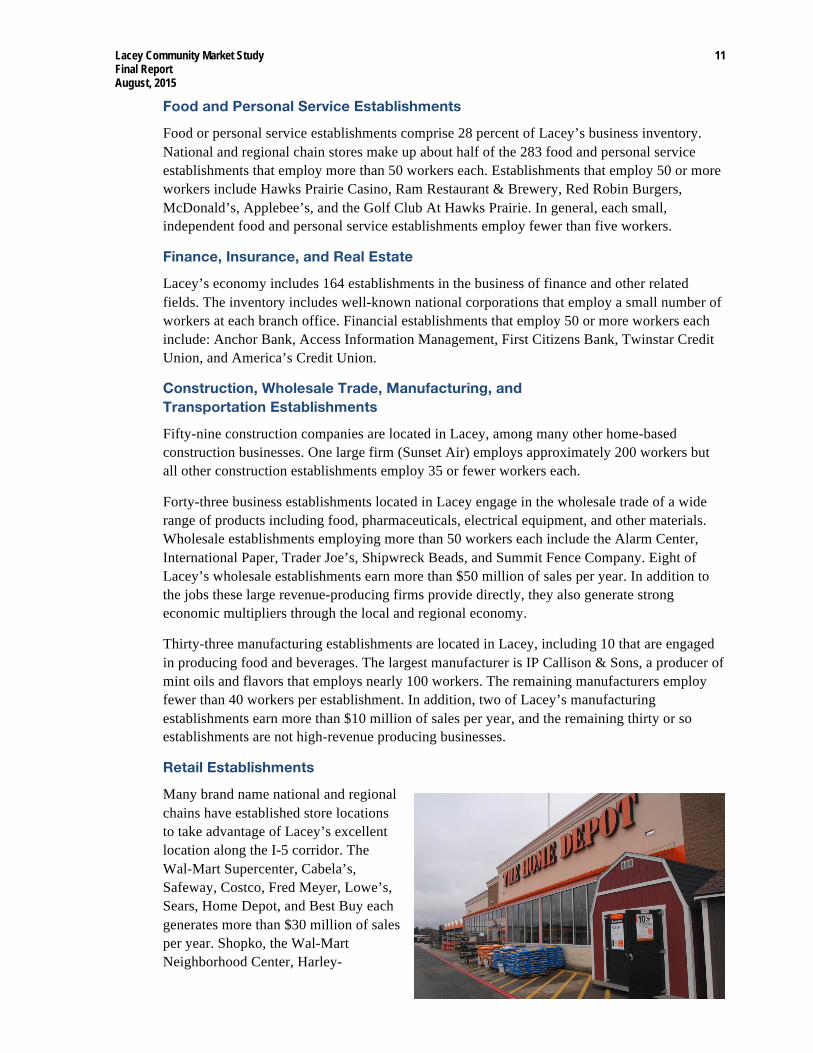
Retail Establishments
Many brand name national and regional chains have established store locations to take advantage of Lacey’s excellent location along the I-5 corridor. The Wal-Mart Supercenter, Cabela’s, Safeway, Costco, Fred Meyer, Lowe’s, Sears, Home Depot, and Best Buy each generates more than $30 million of sales per year. Shopko, the Wal-Mart Neighborhood Center, Harley-
Lacey Community Market Study 12 Final Report August, 2015
Davidson, Burlington Coat Factory, QFC, PetSmart, Kohl’s, Marshalls, and Walgreens each generates between $8 million and $30 million of sales. This leaves Lacey with 65 retail establishments that generate between $1 million and $8 million of sales with between 5 and 35 employees each. The remaining 64 smaller retail establishments, most of which are locally-owned, each generates less than $1 million per year of sales revenue.
While national and regional chain stores bring badly needed tax dollars, studies have shown they take their revenue out of the communities where stores are located leaving a small percentage to be re-circulated through the local economy. In contrast, locally-owned stores have difficulty competing against the national chains but their sales are re-circulated through the economy, and they generate strong economic multipliers.
Information, Professional Services, and Private Education
Lacey has 16 establishments engaged in broadcasting, telecommunications, or data processing. Xerox, which operates a call center in Lacey, is the sole large information industry establishment that employs 1,000 workers.
A diverse mix of 88 professional service establishments located in Lacey includes architects, attorneys, accountants, photographers, computer design and related services, engineers, management consultants, veterinarians, and a mix of other professional establishments. Transaction Networks Services, a global supplier of data communications, is Lacey’s largest professional service firm and employs nearly 200 people.
More than 20 private education providers that do business in Lacey include fine arts schools, parochial schools, pre-K education centers, private colleges, and sports education centers such as a martial arts school. Saint Martin’s University is the largest private education employer with approximately 290 workers. No other education establishment employs more than 30 workers.
Health Care
Lacey has a mix of 120 health care establishments including emergency centers, child care facilities, chiropractors, dentists, home health, optometrists, physicians and physical and occupational therapists. The Providence Regional Cancer Center is the single large employer creating approximately 100 jobs.
3.2 Inventory of Built Commercial Space
The City of Lacey has an estimated inventory of 3.6 million square feet of built commercial space with nearly 2.2 million square feet occupied by retail establishments plus 240,000 square feet of vacant commercial space. The remainder of Lacey’s built commercial space is summarized below. Wahlstrom & Associates collected the estimates of built commercial space by walking and driving every commercial area of the City.
! 222,000 square feet occupied by full-service restaurants, pizza, take-out, and fast food establishments;
! 220,000 square feet occupied by visitor lodging facilities;
! 178,000 square feet occupied by self-storage;
! 128,000 square feet occupied by arcades, cinemas, fitness clubs, and a small casino;
Lacey Community Market Study 13 Final Report August, 2015
! 125,000 square feet occupied by business and professional service establishments that offer storefront services such as tax preparation and investment assistance.
There are 240,000 square feet of vacant space that could be occupied by retail establishments. The 8.2 percent vacancy rate includes a former Albertson’s supermarket and five other large spaces that collectively account for 135,000 square feet of Lacey’s commercial vacancies. Another 58 commercial vacancies average 1,800 square feet in size.
The built space data are displayed in Appendix Table A-9, and are organized and sorted into five subareas as described below.
Hawks Prairie District
The Hawks Prairie District extends across I-5 to include Cabela’s and the new business space being developed in that area. But the majority of the 1.24 million square feet of commercial space have been developed along the Marvin Road corridor that extends from I-5 to Martin Way.
The corridor functions as Lacey’s primary commercial area anchored by Home Depot, Costco, the Wal-Mart Supercenter and Best Buy. These large retailers are well positioned to capture the spending among regional customers, although there are competitive stores elsewhere in Lacey, Tumwater and Olympia. The corridor also attracts local residents who shop at Safeway, use the L.A. Fitness Center or patronize the local, small local casino. The Harley-Davidson dealer has a lock on the local motorcycle sales market given that the nearest competition is in Fife. Other significant uses along the Marvin Road corridor include:
! The Best Western and Days Inn, which bring visitors to the area;
! Between 15 and 20 restaurants and fast food establishments;
! Nearly 15 commercial banks and check cashing establishments;
! Three schools and child care facilities.
The Hawks Prairie District has 22,000 square feet of vacant commercial space, accounting for a 2.2 percent vacancy rate. The area includes seven vacant commercial spaces with an average size of 3,000 square feet are available for new tenants. The largest vacant space in the corridor is 5,400 square feet.
Martin Way Corridor
The Martin Way corridor that extends between Carpenter Road and the College Street intersection where the Lacey City limits are contiguous with Olympia’s City limits is bifurcated by I-5 with on-ramps, off-ramps and a Park & Ride lot located along Martin Way. The corridor includes 192,000 square feet of occupied retail space that is anchored by the Regal IMAX theatre, the Burlington Coat Factory and Shopko, all of which are located within the Martin Village Shopping Center. Vacancies include one large 27,000-square-foot space within the Martin Village Shopping Center, and three other vacant spaces scattered along the corridor that average size of less than 3,000 square feet in size. The Martin Way corridor has a 12.9 percent vacancy rate.
Lacey Community Market Study 14 Final Report August, 2015
A cluster of visitor lodging facilities is the corridor’s other significant feature. The Comfort Inn, La Quinta, Quality Inn, and Super 8 have all established facilities that accommodate overnight visitors and help retain visitor spending within the area.
Woodland District
The Woodland District is a large, square-shaped area that is bounded on the north by Interstate 5, on the east by the Olympia City Limits, on the south by Pacific Avenue and Lacey Boulevard, and by College Street on the west. The area includes 872,000 square feet of built business space plus additional pure office space located between College and Golf Club Road.
Nearly 70 percent of the 573,100 square feet Woodland District’s occupied commercial retail space is located within the South Sound Shopping Center, which is anchored by Kohl’s, Marshalls, Sears, Target, and Michaels Crafts. Other Woodland District retail stores that occupy more than 10,000 square feet of space include Fred Meyer, PETSMART, Rite Aide, Tuesday Morning and Office Depot. Forty-nine smaller retailers that occupy and average of 2,300 square feet per store that absorbs the remaining 114,000 square feet of the Woodland District’s commercial retail space.
The Woodland District has also attracted 38 full-service restaurants, fast food, and food take-out establishments that occupy nearly 50,000 square feet of space. Tax preparers, accountants, investment advisors, and other professional establishments that serve the general public occupy 39,000 square feet. Commercial banks and other lending establishments occupy 37,000 square feet, and visitor lodging occupies 32,000 square feet.
Twenty-five commercial vacancies comprise 71,000 square feet that could be occupied by retail establishments. The vacant space includes a large 24,000-square-foot vacancy in the South Sound shopping center, an 11,000-square-foot former supermarket, and a scattering of 23 smaller vacancies that average less than 1,300 square feet. The Woodland District has a 9.5 percent vacancy rate. Property owners and realtors often have a challenging time finding tenants to occupy the small spaces.
The Woodland District also includes a large inventory of pure office space, much of which was occupied by State government agencies. The State relocated many offices during the past few years leaving the Woodland District with 240,000 square feet of vacant office space.12 The data enclosed in this report does not estimate the supply of built office space, nor does it update the supply of vacant office space in the Woodland District or elsewhere in the City.
Pacific Avenue Corridor (Between College and Carpenter)
The Pacific Avenue corridor (west of College Street) is a mixed-use area with 578,000 square feet of built commercial space and 106,000 square feet of space occupied by retail establishments. A 42,000-square-foot Safeway supermarket located at the intersection of Pacific Avenue and Carpenter Road is the area’s sole large retail establishment.
Other significant uses that have located along the Pacific Avenue corridor include 125,000 square feet of self-storage; nearly 66,000 square feet of business and professional
12 Data collected from the Woodland District Strategic Plan. 2014
Lacey Community Market Study 15 Final Report August, 2015
service establishments; 39,000 square feet of fitness clubs and exercise studios; and 35,000 square feet of restaurants, fast food, and take-out food establishments.
Approximately 100,000 square feet of commercial space along the Pacific Avenue corridor are vacant, which translates into a 27.5 percent vacancy rate. The vacant space includes a 42,000-square-foot former supermarket that has been boarded up for a number of years, which conveys an appearance of blight and deterioration that discourages successful retail attraction efforts. An additional sixteen vacant spaces averaging 3,500 square feet account for the remaining 58,000 square feet of vacant space.
College and Yelm Highway Intersection
The College Street and Yelm Highway intersection is comprised of three shopping centers, one at each of three corners of the intersection, with the Capitol City Golf Club located at the fourth corner. Approximately 439,000 square feet of commercial space have been developed in this area, including 324,000 square feet of retail shopping space. The area also includes 32,000 square feet of restaurant, fast food, and food take-out places. In addition:
! A new mixed-use development anchored by a 140,000-square-foot Lowe’s Home Improvement Store is located at the northwest corner of the intersection;
! A Safeway-anchored shopping center is located at the northeast corner of the intersection, and a new Wal-Mart Neighborhood Store-anchored shopping center is being developed along Yelm Highway immediately east of the Safeway center;
! An established shopping center anchored by QFC and Rite Aide is located on the southwest corner of the intersection.
The area includes nine vacant spaces that average less than 1,500 square feet. The 13,200 square feet of vacant space translates into a very low 3.2 percent vacancy rate.
3.3 Employment by Industry in Lacey and the Region
Appendix Table A-10 displays detailed employment by industry data for the City of Lacey, the Lacey market area and Thurston County.13 The information describes jobs that are located within each jurisdiction piecing by together a variety of data sources, including InfoUSA, the Thurston Regional Planning Council, the Washington Employment Security Department, and the City of Lacey. Below are some observations about the detailed employment by industry data.
! Lacey’s private and public sector employers generate 16,900 jobs;
! Lacey captures 12 percent of Thurston County’s manufacturing employment, which is less than Lacey’s 19 percent share of total County employment. Also noteworthy is that manufacturing employment is very low in both Lacey and Thurston County (2 percent) while manufacturing accounts for 10 percent of the State’s total job base;
! Food, beverage, and furniture manufacturing account for 220 of Lacey’s 330 manufacturing jobs;
13 Lacey market area includes zip codes 98503, 98513 and 98516.
Lacey Community Market Study 16 Final Report August, 2015
! Lacey captured 29 percent of Thurston County’s wholesale trade employment and 25 percent of the County’s retail employment. Retail trade is a significantly larger share of Lacey’s economy (17 percent of all jobs) than it is in Thurston County or the entire State;
! Lacey captured 38 percent of Thurston County’s information sector employment, which includes broadcasting, telecommunications, and data processing;
! Approximately 36 percent of Thurston County’s finance jobs are located in Lacey;
! Health care employment comprises 5 percent of Lacey’s job base compared to 13 percent of Thurston County’s job base. Lacey’s under-representation of health care services may be caused by the lack of hospitals and residential care facilities in the City;
! Lacey has captured 25 percent of Thurston County’s food services employment and 31 percent of personal and repair services employment;
! Lacey’s economy is heavily weighted by government employment that accounts for 30 percent of all jobs, to be expected given the City’s proximity to the State Capital.
Lacey Community Market Study 17 Final Report August, 2015
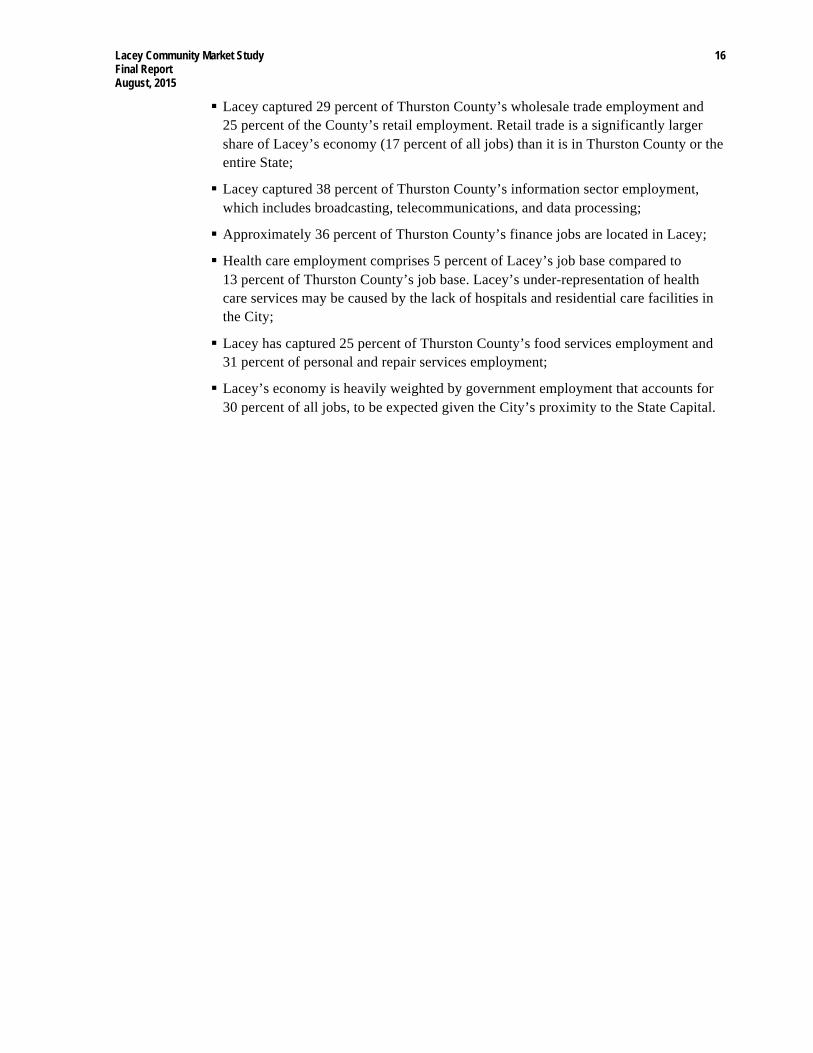
Figure 3 below shows employment by industry in Lacey compared to Thurston County and the State of Washington in 2013. The baseline information combines the InfoUSA data of private businesses located within the City Limits with the government employment data published by the Thurston Regional Planning Council.
Figure 3 – Employment by Industry in Lacey, Thurston County, Region, and Washington State, 2013
Industry Sector Lacey % Total Thurston % Total Washington % Total
Construction 600 3% 3,280 3% 128,170 5%
Manufacturing 330 2% 2,680 3% 279,570 10%
Wholesale trade 640 4% 2,220 2% 121,890 4%
Retail trade 2,900 17% 11,710 12% 313,260 11%
Transportation & warehousing
170 1% 1,400 1% 81,820 3%
Information 1,140 7% 2,070 2% 103,890 4%
Finance & insurance 800 5% 2,520 3% 89,210 3%
Real estate & rental & leasing 210 1% 1,030 1% 43,290 2%
Professional, scientific & technical services
740 4% 4,980 5% 169,840 6%
Management of companies & enterprises
4 0% 230 0% 38,460 1%
Admin, support, waste mgt, remediation services
370 2% 2,330 2% 135,970 5%
Educational services 570 3% 1,610 2% 37,940 1%
Health care and social assistance
920 5% 13,090 13% 331,330 12%
Arts, entertainment & recreation
350 2% 2,550 3% 43,420 2%
Accommodation & food services
1,840 11% 7,940 8% 224,340 8%
Other Private services 170 1% 3,960 4% 129,570 5%
Government 5,150 30% 36,480 36% 518,950 19%
Totals 16,900 100,080 2,790,920
Data Sources: U.S. County Business Patterns; InfoUSA; Thurston Regional Planning Council; Washington State Employment Security Department and the City of Lacey Analysis: Wahlstrom & Associates
3.4 Employment Growth Trends
A review and analysis of past employment trends is a common method used to anticipate future growth and economic development opportunities.14 However, the national economy has been on a boom and bust roller coaster since the turn of the century, which means that an analysis of the long-term growth trends will yield limited information about future economic development opportunities. Instead, the growth trends data are segmented into three time blocks, consistent
14 Appendix Tables A-11 to A-15 summarize the employment growth trends in the State, region, County, and the Lacey market area between 2001 and 2013.
Lacey Community Market Study 18 Final Report August, 2015
with the state and national economic boom and bust cycles as described below. U.S. County Business Patterns is the data source for the information below.
Post Dot-Com Bust (2001 – 2007)
The dot-com bubble, also referred to as the information technology bubble, was an historic financial event that occurred between 1997–2000 and climaxed with the NASDAQ closing at 5,049, a value that did not recover until this year (2015). The Internet boom that collapsed by early 2001 left the national and State economies with a loss of wealth, and halted steady income gains that households experienced during the 1990s, reflected in Figure 4 below.
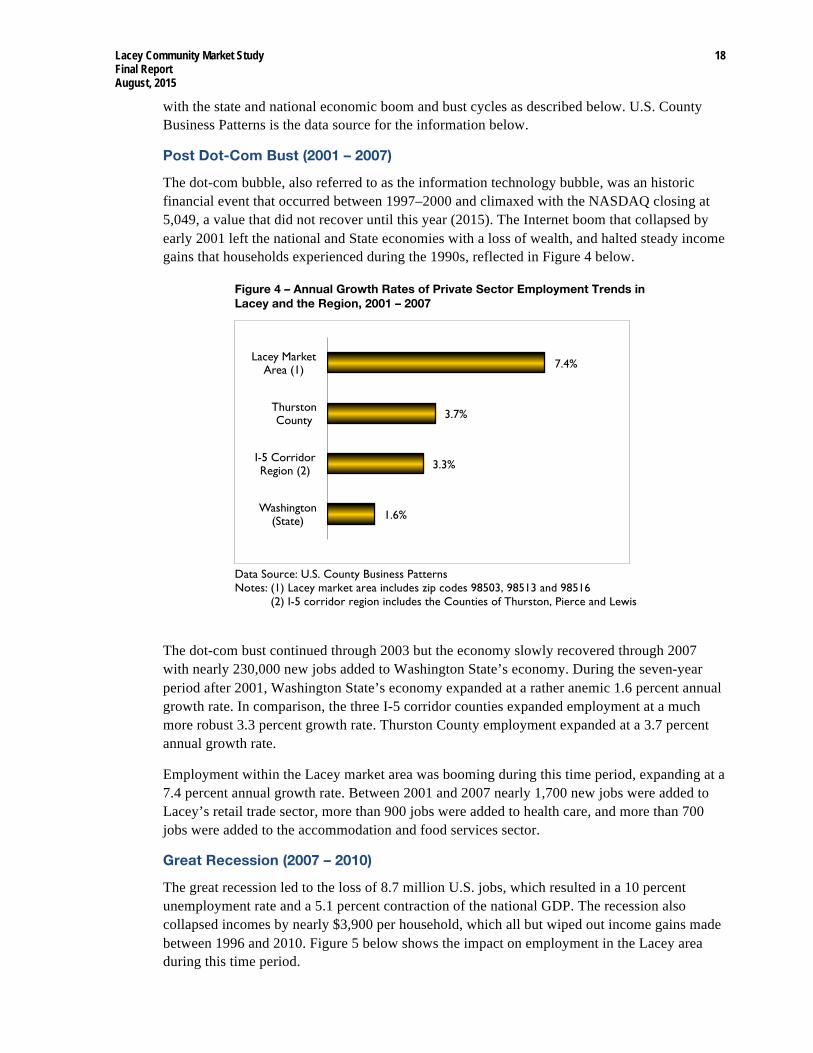
Figure 4 – Annual Growth Rates of Private Sector Employment Trends in Lacey and the Region, 2001 – 2007
Data Source: U.S. County Business Patterns Notes: (1) Lacey market area includes zip codes 98503, 98513 and 98516 (2) I-5 corridor region includes the Counties of Thurston, Pierce and Lewis
The dot-com bust continued through 2003 but the economy slowly recovered through 2007 with nearly 230,000 new jobs added to Washington State’s economy. During the seven-year period after 2001, Washington State’s economy expanded at a rather anemic 1.6 percent annual growth rate. In comparison, the three I-5 corridor counties expanded employment at a much more robust 3.3 percent growth rate. Thurston County employment expanded at a 3.7 percent annual growth rate.
Employment within the Lacey market area was booming during this time period, expanding at a 7.4 percent annual growth rate. Between 2001 and 2007 nearly 1,700 new jobs were added to Lacey’s retail trade sector, more than 900 jobs were added to health care, and more than 700 jobs were added to the accommodation and food services sector.
Great Recession (2007 – 2010)
The great recession led to the loss of 8.7 million U.S. jobs, which resulted in a 10 percent unemployment rate and a 5.1 percent contraction of the national GDP. The recession also collapsed incomes by nearly $3,900 per household, which all but wiped out income gains made between 1996 and 2010. Figure 5 below shows the impact on employment in the Lacey area during this time period.
1.6%
3.3%
3.7%
7.4%
Washington (State)
I-5 Corridor Region (2)
Thurston County
Lacey Market Area (1)
Lacey Community Market Study 19 Final Report August, 2015
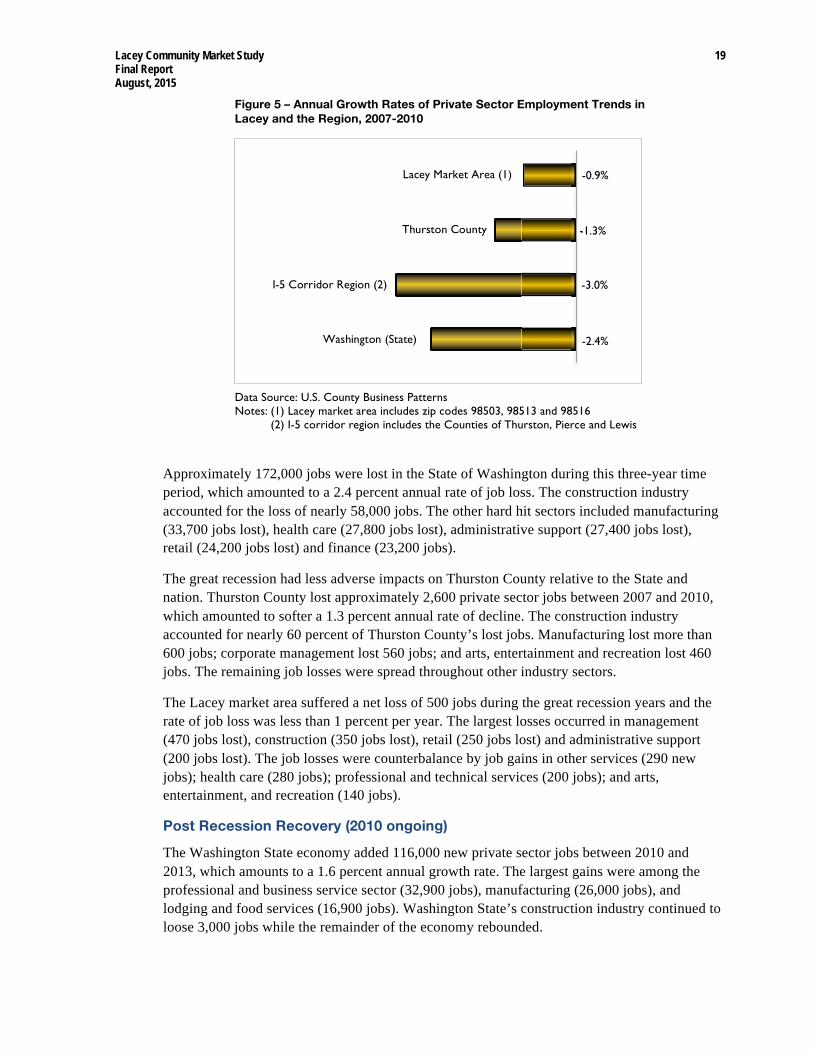
Figure 5 – Annual Growth Rates of Private Sector Employment Trends in Lacey and the Region, 2007-2010
Data Source: U.S. County Business Patterns Notes: (1) Lacey market area includes zip codes 98503, 98513 and 98516 (2) I-5 corridor region includes the Counties of Thurston, Pierce and Lewis
Approximately 172,000 jobs were lost in the State of Washington during this three-year time period, which amounted to a 2.4 percent annual rate of job loss. The construction industry accounted for the loss of nearly 58,000 jobs. The other hard hit sectors included manufacturing (33,700 jobs lost), health care (27,800 jobs lost), administrative support (27,400 jobs lost), retail (24,200 jobs lost) and finance (23,200 jobs).
The great recession had less adverse impacts on Thurston County relative to the State and nation. Thurston County lost approximately 2,600 private sector jobs between 2007 and 2010, which amounted to softer a 1.3 percent annual rate of decline. The construction industry accounted for nearly 60 percent of Thurston County’s lost jobs. Manufacturing lost more than 600 jobs; corporate management lost 560 jobs; and arts, entertainment and recreation lost 460 jobs. The remaining job losses were spread throughout other industry sectors.
The Lacey market area suffered a net loss of 500 jobs during the great recession years and the rate of job loss was less than 1 percent per year. The largest losses occurred in management (470 jobs lost), construction (350 jobs lost), retail (250 jobs lost) and administrative support (200 jobs lost). The job losses were counterbalance by job gains in other services (290 new jobs); health care (280 jobs); professional and technical services (200 jobs); and arts, entertainment, and recreation (140 jobs).
Post Recession Recovery (2010 ongoing)
The Washington State economy added 116,000 new private sector jobs between 2010 and 2013, which amounts to a 1.6 percent annual growth rate. The largest gains were among the professional and business service sector (32,900 jobs), manufacturing (26,000 jobs), and lodging and food services (16,900 jobs). Washington State’s construction industry continued to loose 3,000 jobs while the remainder of the economy rebounded.
-2.4%
-3.0%
-1.3%
-0.9%Lacey Market Area (1)
Thurston County
I-5 Corridor Region (2)
Washington (State)
-1.3%
Lacey Community Market Study 20 Final Report August, 2015
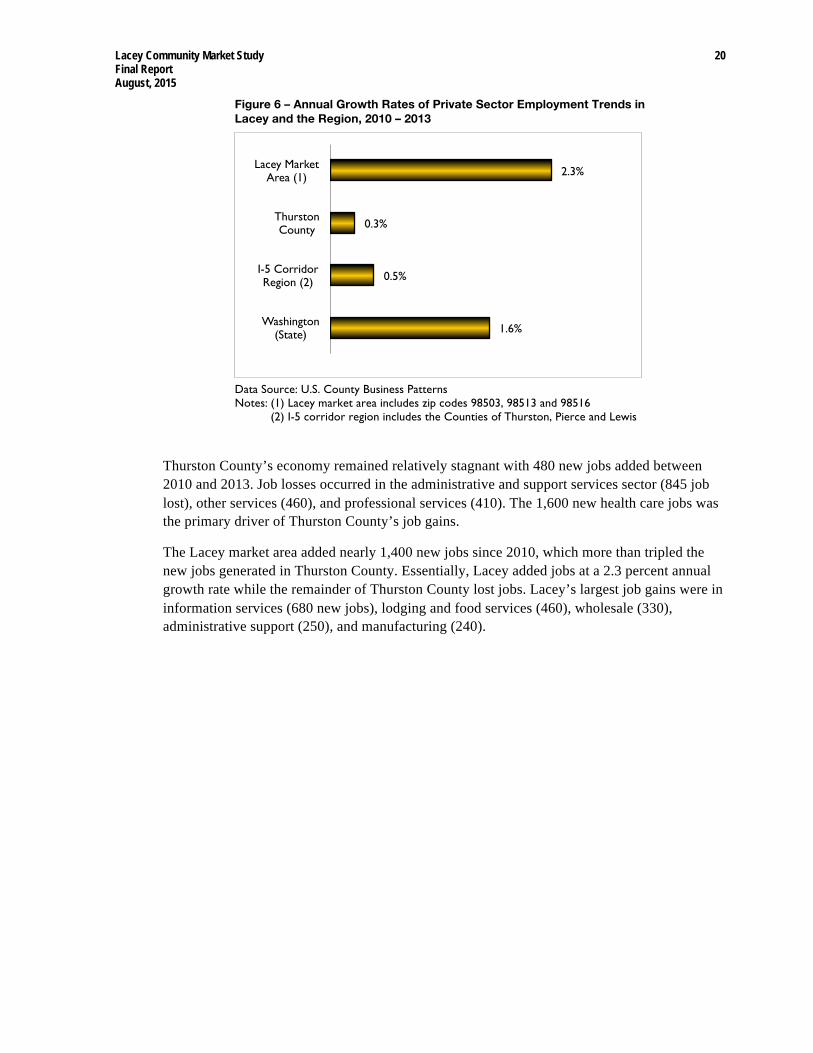
Figure 6 – Annual Growth Rates of Private Sector Employment Trends in Lacey and the Region, 2010 – 2013
Data Source: U.S. County Business Patterns Notes: (1) Lacey market area includes zip codes 98503, 98513 and 98516 (2) I-5 corridor region includes the Counties of Thurston, Pierce and Lewis
Thurston County’s economy remained relatively stagnant with 480 new jobs added between 2010 and 2013. Job losses occurred in the administrative and support services sector (845 job lost), other services (460), and professional services (410). The 1,600 new health care jobs was the primary driver of Thurston County’s job gains.
The Lacey market area added nearly 1,400 new jobs since 2010, which more than tripled the new jobs generated in Thurston County. Essentially, Lacey added jobs at a 2.3 percent annual growth rate while the remainder of Thurston County lost jobs. Lacey’s largest job gains were in information services (680 new jobs), lodging and food services (460), wholesale (330), administrative support (250), and manufacturing (240).
1.6%
0.5%
0.3%
2.3%
Washington (State)
I-5 Corridor Region (2)
Thurston County
Lacey Market Area (1)
Lacey Community Market Study 21 Final Report August, 2015
4. EMPLOYMENT AND LAND DEMAND PROJECTIONS
The employment and land demand projections in this report build upon the projections published by the State of Washington, and have been adjusted to account for Lacey and Thurston County’s strong growth trends relative to the State.15 Lacey’s private and public sector employers employed 16,900 workers in 2013, which is a healthy number of jobs for 17,900 households established within the City limits.16 Essentially, Lacey attracts more commuting workers into the City versus Lacey residents that counter-commute to work outside of city limits. Below are some additional observations about Lacey’s economic base.
! Lacey’s economy is reliant on public sector employment that generates 30 percent of the jobs in the City. The high percentage of public sector employment is to be expected given the City’s proximity to the State capital;
! Retail trade is a larger share of Lacey’s economy (17 percent of all jobs) than it is in Thurston County or the entire State (12 and 11 percent respectively);
! Health care employment is under-represented, accounting for 5 percent of Lacey’s employment compared to 13 percent of Thurston County’s job base;
! In Lacey and Thurston County, the manufacturing sector accounts for 2 percent of all jobs, while manufacturing accounts for 10 percent of the State’s total job base.
4.1 Employment by Industry Projections
Based on the employment projections displayed in Figure 7, Lacey can anticipate that 13,700 new jobs will be added to the City’s economy by 2035.This means that on average, Lacey’s economy should expand by 620 jobs per year, although future growth will include time periods of strong economic growth and other time periods where growth is stagnant or in decline.
The projections methodology is based on assumptions that the Washington State Employment Security Department projections are accurate; that Lacey’s economy will continue to expand more rapidly than the State; and that retail employment will expand consistent with the Thurston Regional Planning Council’s population growth rates for the Lacey UGA. Projections after 2023 do not account for external events such as unanticipated wars, natural disasters, financial upheavals, or significant technological changes.
The industry sectors that are anticipated to generate the largest number of new jobs in Lacey are described below.
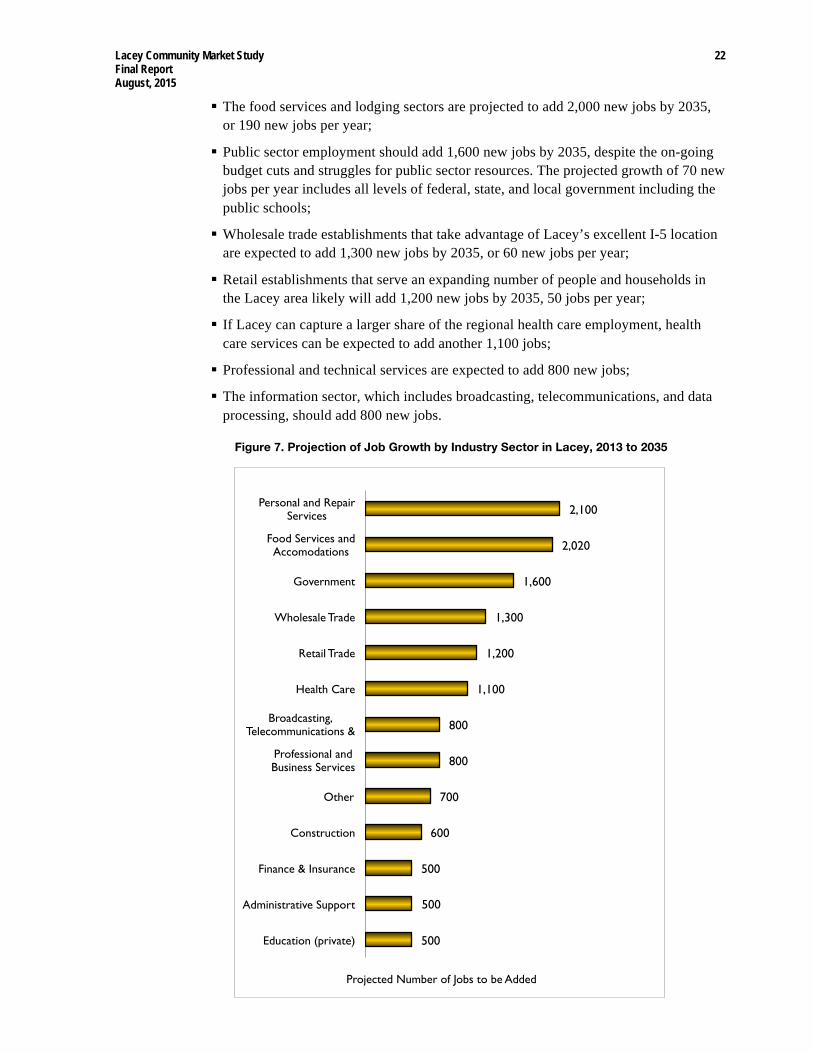
! Approximately 2,100 new low-wage paying personal and repair service jobs likely will be added to Lacey’s economy by 2035, which amounts to 100 new jobs per year;
15 See 2014 Employment Projections published by the Washington State Employment Security Department.
16 Appendix Table A-16 provides employment projections for the City of Lacey from 2013 to 2035.
Lacey Community Market Study 22 Final Report August, 2015
! The food services and lodging sectors are projected to add 2,000 new jobs by 2035, or 190 new jobs per year;
! Public sector employment should add 1,600 new jobs by 2035, despite the on-going budget cuts and struggles for public sector resources. The projected growth of 70 new jobs per year includes all levels of federal, state, and local government including the public schools;
! Wholesale trade establishments that take advantage of Lacey’s excellent I-5 location are expected to add 1,300 new jobs by 2035, or 60 new jobs per year;
! Retail establishments that serve an expanding number of people and households in the Lacey area likely will add 1,200 new jobs by 2035, 50 jobs per year;
! If Lacey can capture a larger share of the regional health care employment, health care services can be expected to add another 1,100 jobs;
! Professional and technical services are expected to add 800 new jobs;
! The information sector, which includes broadcasting, telecommunications, and data processing, should add 800 new jobs.
Figure 7. Projection of Job Growth by Industry Sector in Lacey, 2013 to 2035
500
500
500
600
700
800
800
1,100
1,200
1,300
1,600
2,020
2,100
Education (private)
Administrative Support
Finance & Insurance
Construction
Other
Professional and Business Services
Broadcasting, Telecommunications &
Health Care
Retail Trade
Wholesale Trade
Government
Food Services and Accomodations
Personal and Repair Services
Projected Number of Jobs to be Added
Lacey Community Market Study 23 Final Report August, 2015
4.2 Land Demand Projections
Estimates of the demand for new business space, including the amount of land that Lacey should reserve for future business use, flow directly from the employment by industry projections. The resulting land demand projections use information published by the Urban Land Institute to sort and convert employment by industry data into employment by land-use categories. Employment density data published by the National Association of Office and Industrial Parks estimate the projected land demand consistent with land use descriptions below.
! Retail establishments, personal service providers and other establishments that need ground floor commercial space for walk in customers;
! Office and business park space, which may be single- or multi-story buildings;
! Research and development flex space, which most attractive to technology and start-up businesses;
! Manufacturing and industrial space that can vary in quality and the amount of space dedicated to outdoor storage;
! Warehouse and storage space with large open areas and possible outdoor uses;
! Institutions that include City Hall, hospital complexes, and similar facilities.
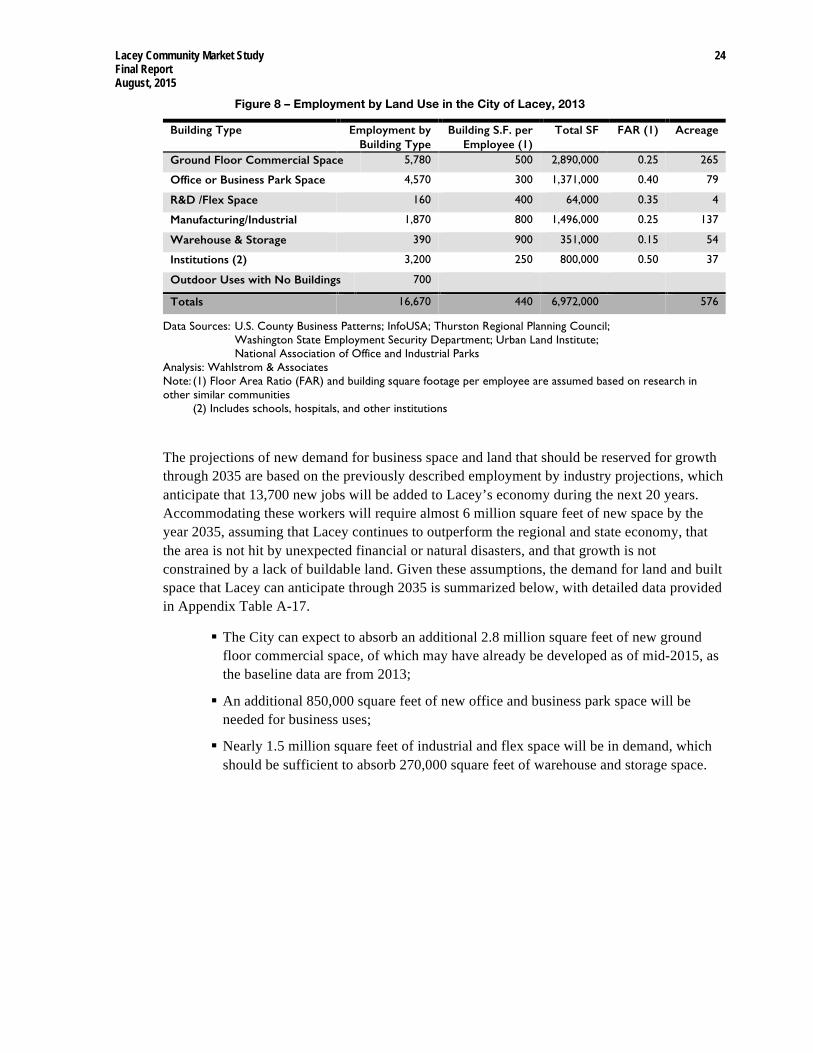
Figure 8 below converts the data on Lacey’s 16,670 employees into land-use categories that occupy 6.97 million square feet of space. The allocation of employment by land use is summarized below.
! Nearly 5,800 employees occupy 2.89 million square feet of ground floor commercial space;
! About 4,600 employees occupy 1.37 million square feet of formal office or business park space, much of which is located in the Woodland District;
! Approximately 2,400 workers occupy 1.9 million square feet of warehouse, industrial, and flex space, most of which is located in the Hawks Prairie area;
! About 3,200 employees work in 800,000 square feet of institutional space, which includes land uses such as City Hall, St. Martin’s University, public schools and hospital complexes;
! 700 jobs are located in open space areas that include golf courses, outdoor recreational establishments, landscaping and garden establishments, and other business establishments with small buildings and with a large percentage of their sites used for outdoor storage.
Lacey Community Market Study 24 Final Report August, 2015
Figure 8 – Employment by Land Use in the City of Lacey, 2013
Building Type Employment by Building Type
Building S.F. per Employee (1)
Total SF FAR (1) Acreage
Ground Floor Commercial Space 5,780 500 2,890,000 0.25 265
Office or Business Park Space 4,570 300 1,371,000 0.40 79
R&D /Flex Space 160 400 64,000 0.35 4
Manufacturing/Industrial! 1,870 800 1,496,000 0.25 137
Warehouse & Storage 390 900 351,000 0.15 54
Institutions (2) 3,200 250 800,000 0.50 37
Outdoor Uses with No Buildings 700
Totals 16,670 440 6,972,000 576
Data Sources: U.S. County Business Patterns; InfoUSA; Thurston Regional Planning Council; Washington State Employment Security Department; Urban Land Institute; National Association of Office and Industrial Parks Analysis: Wahlstrom & Associates Note: (1) Floor Area Ratio (FAR) and building square footage per employee are assumed based on research in other similar communities (2) Includes schools, hospitals, and other institutions
The projections of new demand for business space and land that should be reserved for growth through 2035 are based on the previously described employment by industry projections, which anticipate that 13,700 new jobs will be added to Lacey’s economy during the next 20 years. Accommodating these workers will require almost 6 million square feet of new space by the year 2035, assuming that Lacey continues to outperform the regional and state economy, that the area is not hit by unexpected financial or natural disasters, and that growth is not constrained by a lack of buildable land. Given these assumptions, the demand for land and built space that Lacey can anticipate through 2035 is summarized below, with detailed data provided in Appendix Table A-17.
! The City can expect to absorb an additional 2.8 million square feet of new ground floor commercial space, of which may have already be developed as of mid-2015, as the baseline data are from 2013;
! An additional 850,000 square feet of new office and business park space will be needed for business uses;
! Nearly 1.5 million square feet of industrial and flex space will be in demand, which should be sufficient to absorb 270,000 square feet of warehouse and storage space.
Lacey Community Market Study 25 Final Report August, 2015
5. RETAIL LEAKAGE ANALYSIS
The City of Lacey’s fiscal resources are highly dependent on sales tax revenues, and Lacey is working hard to attract new stores, encourage new shopping center investment, and transform underperforming sites into more desirable destinations for people. The retail leakage analysis will inform City staff, community leaders, and stakeholders about Lacey’s market potential to attract new commercial businesses. The analysis will also provide the Comprehensive Plan update with important information about the opportunities to attract and expand commercial services.
5.1 Inventory of Occupied Retail Space
Retail establishments occupy approximately 2.2 million square feet of built commercial space. The most significant retail sectors are summarized below with detailed information found in Table A-18 of Appendix A.17 Data were collected by Wahlstrom & Associates by walking and driving each commercial area in the City.
! Costco, Target, the Wal-Mart Supercenter, Shopko, and Sears occupy nearly 700,000 square feet, accounting for one-third of Lacey’s occupied retail space;
! Home Depot, Lowes, and other building material stores have absorbed 274,000 square feet of space;
! Food and beverage stores anchored by Safeway, QFC, and the Wal-Mart Neighborhood Center absorb 270,000 square feet. This does not include Costco where food products account for 54 percent of sales, nor does it include the Wal-Mart Supercenter where food products account for 56 percent of all sales;18
! Sporting goods, hobby, and toys and game stores anchored by Cabela’s and Michaels Crafts absorb nearly 245,000 square feet of space;
! Burlington Coat Factory, Kohl’s, Marshalls, and a few small independent apparel retailers occupy 145,000 square feet of space.
5.2 Retail Sales Earnings
Nearly every brand name national and regional chain has established a Lacey store location. The Wal-Mart Supercenter, Cabela’s, Wal-Mart, Safeway (Yelm Highway), Costco, Fred Meyer, Lowe’s, Sears, Home Depot and Best Buy all generate more than $30 million of sales per year. Shopko, the Wal-Mart Neighborhood Center, Harley-Davidson, Burlington Coat Factory, QFC, PETSMART, Kohl’s, Marshalls and Walgreens generate between $8 million and $30 million of sales. This leaves Lacey with 65 retail establishments that generate between $1 million and $8 million of sales with between 5 and 35 employees each. The remaining 64 smaller retail establishments, most of which are locally owned generate less than $1 million per
17 Appendix Table A-18 provides an inventory of occupied retail space in Lacey by commercial district.
18 See Wal-Mart and Costco 2014 10K reports submitted to the Security and Exchange Commission.
Lacey Community Market Study 26 Final Report August, 2015
year of sales revenue.19 In total, Lacey’s retail establishments earn $874 million of sales, not including sales from restaurants, bars, fast food, or wholesale establishments engaged in business-to-business transactions.
Ninety percent of the sales information was collected from InfoUSA. In cases where Info USA withholds data for reasons of confidentiality, Wahlstrom & Associates estimated sales earnings using 10K reports that public corporations are required to submit to the Securities and Exchange Commission. Below is a summary of the sales performance among Lacey’s key retail sectors.
! Food store sales account for $301.7 million or nearly one-third of the City’s total retail. This figure includes the sales earned by three Safeway stores, a QFC, a Fred Meyer, the Wal-Mart Neighborhood Center, and eleven other small grocery and convenience stores. Estimated sales also accounts for food sales from Costco and the Wal-Mart Supercenter;
! Home Depot, Lowe’s, and other building materials stores earn approximately $133 million of sales;
! General merchandise stores that generate $131 million of sales include Target, Big Lots, and Dollar Tree. The Wal-Mart Supercenter and Costco also earn between 40 and 50 percent of their sales from general merchandise items;
! Cabela’s and 14 other sporting goods, hobby, toy, and game stores earn $89 million of sales;
! The Burlington Coat Factory, Kohl’s, Marshalls, and smaller stores earn $51 million of sales.
5.3 Net Spending Leakages
Lacey’s 148 retail establishments anchored by anchored by a wide variety of national and regional chain stores earn approximately $885 million of sales from customers that reside throughout Thurston County and from the neighboring I-5 corridor communities in Pierce and Lewis County. Essentially, Lacey’s retail establishments earn far more sales than can be supported by the residents of Lacey. With the exception of Safeway and Lowe’s, the anchor stores are located near the Marvin Road interchange, the Martin Way interchange or the Sleater-Kinney interchange with easy access to Interstate 5.
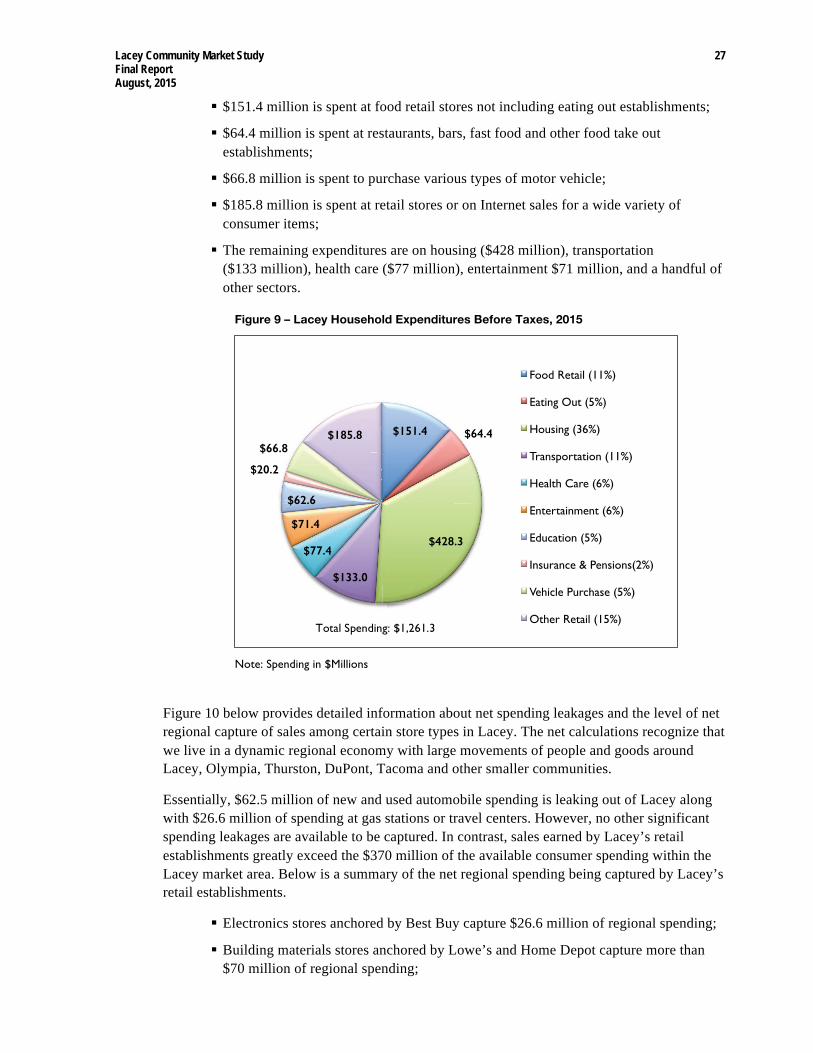
The Lacey market area that extends into unincorporated Thurston County includes 21,100 households.20 The City of Lacey has 18,500 households that earn an average income of $68,200, which translates into a total earned income of $1.26 billion. Household spending estimates are based on the 21,100 households in the market area. They are derived from consumer spending surveys published by the U.S. Bureau of Labor Statistics combined with the 2013 Census of Retail Trade data to convert spending on products into spending by specific types of retail stores. Figure 9 below shows how Lacey’s household income is allocated.
19 Source: InfoUSA and corporate 10K reports.
20 The market area includes the City of Lacey and the surrounding unincorporated areas of Thurston County defined as census tracts: 112, 113, 114. 115. 116 and 123.
Lacey Community Market Study 27 Final Report August, 2015
! $151.4 million is spent at food retail stores not including eating out establishments;
! $64.4 million is spent at restaurants, bars, fast food and other food take out establishments;
! $66.8 million is spent to purchase various types of motor vehicle;
! $185.8 million is spent at retail stores or on Internet sales for a wide variety of consumer items;
! The remaining expenditures are on housing ($428 million), transportation ($133 million), health care ($77 million), entertainment $71 million, and a handful of other sectors.
Figure 9 – Lacey Household Expenditures Before Taxes, 2015
Note: Spending in $Millions
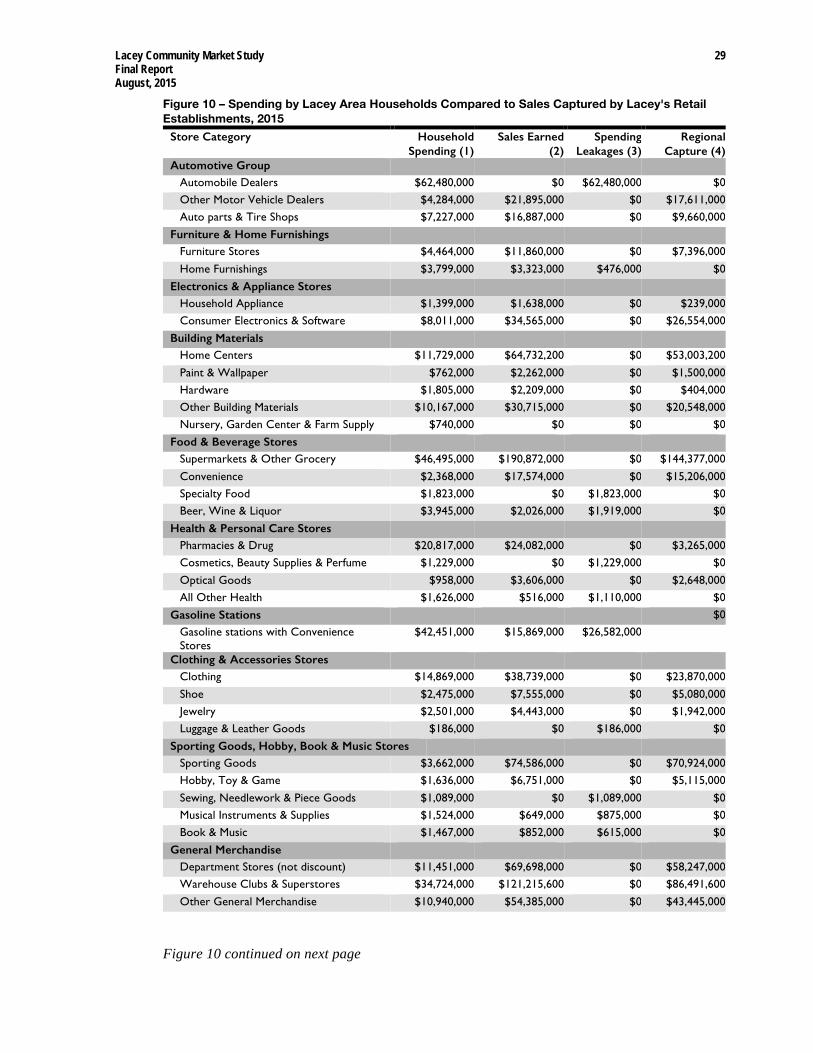
Figure 10 below provides detailed information about net spending leakages and the level of net regional capture of sales among certain store types in Lacey. The net calculations recognize that we live in a dynamic regional economy with large movements of people and goods around Lacey, Olympia, Thurston, DuPont, Tacoma and other smaller communities.
Essentially, $62.5 million of new and used automobile spending is leaking out of Lacey along with $26.6 million of spending at gas stations or travel centers. However, no other significant spending leakages are available to be captured. In contrast, sales earned by Lacey’s retail establishments greatly exceed the $370 million of the available consumer spending within the Lacey market area. Below is a summary of the net regional spending being captured by Lacey’s retail establishments.
! Electronics stores anchored by Best Buy capture $26.6 million of regional spending;
! Building materials stores anchored by Lowe’s and Home Depot capture more than $70 million of regional spending;
$151.4! $64.4!
$428.3!
$133.0!
$77.4!
$71.4!
$62.6!
$20.2!
$66.8!$185.8!
Food Retail (11%)
Eating Out (5%)
Housing (36%)
Transportation (11%)
Health Care (6%)
Entertainment (6%)
Education (5%)
Insurance & Pensions(2%)
Vehicle Purchase (5%)
Other Retail (15%)Total Spending: $1,261.3
Lacey Community Market Study 28 Final Report August, 2015
! Seven supermarkets capture $144 million of regional spending;
! Sixteen clothing stores anchored by Kohl’s, Marshalls, and Burlington Coat Factory capture $23.9 million of regional sales;
! Sporting goods stores anchored by Cabela’s capture $70.9 million of regional spending;
! General merchandise stores anchored by Costco and Wal-Mart capture nearly $190 million of regional sales.
Lacey Community Market Study 29 Final Report August, 2015
Figure 10 – Spending by Lacey Area Households Compared to Sales Captured by Lacey's Retail Establishments, 2015
Store Category Household Spending (1)
Sales Earned (2)
Spending Leakages (3)
Regional Capture (4)
Automotive Group
Automobile Dealers $62,480,000 $0 $62,480,000 $0
Other Motor Vehicle Dealers $4,284,000 $21,895,000 $0 $17,611,000
Auto parts & Tire Shops $7,227,000 $16,887,000 $0 $9,660,000
Furniture & Home Furnishings
Furniture Stores $4,464,000 $11,860,000 $0 $7,396,000
Home Furnishings $3,799,000 $3,323,000 $476,000 $0
Electronics & Appliance Stores
Household Appliance $1,399,000 $1,638,000 $0 $239,000
Consumer Electronics & Software $8,011,000 $34,565,000 $0 $26,554,000
Building Materials
Home Centers $11,729,000 $64,732,200 $0 $53,003,200
Paint & Wallpaper $762,000 $2,262,000 $0 $1,500,000
Hardware $1,805,000 $2,209,000 $0 $404,000
Other Building Materials $10,167,000 $30,715,000 $0 $20,548,000
Nursery, Garden Center & Farm Supply $740,000 $0 $0 $0
Food & Beverage Stores
Supermarkets & Other Grocery $46,495,000 $190,872,000 $0 $144,377,000
Convenience $2,368,000 $17,574,000 $0 $15,206,000
Specialty Food $1,823,000 $0 $1,823,000 $0
Beer, Wine & Liquor $3,945,000 $2,026,000 $1,919,000 $0
Health & Personal Care Stores
Pharmacies & Drug $20,817,000 $24,082,000 $0 $3,265,000
Cosmetics, Beauty Supplies & Perfume $1,229,000 $0 $1,229,000 $0
Optical Goods $958,000 $3,606,000 $0 $2,648,000
All Other Health $1,626,000 $516,000 $1,110,000 $0
Gasoline Stations $0
Gasoline stations with Convenience Stores
$42,451,000 $15,869,000 $26,582,000
Clothing & Accessories Stores
Clothing $14,869,000 $38,739,000 $0 $23,870,000
Shoe $2,475,000 $7,555,000 $0 $5,080,000
Jewelry $2,501,000 $4,443,000 $0 $1,942,000
Luggage & Leather Goods $186,000 $0 $186,000 $0
Sporting Goods, Hobby, Book & Music Stores Sporting Goods $3,662,000 $74,586,000 $0 $70,924,000
Hobby, Toy & Game $1,636,000 $6,751,000 $0 $5,115,000
Sewing, Needlework & Piece Goods $1,089,000 $0 $1,089,000 $0
Musical Instruments & Supplies $1,524,000 $649,000 $875,000 $0
Book & Music $1,467,000 $852,000 $615,000 $0
General Merchandise
Department Stores (not discount) $11,451,000 $69,698,000 $0 $58,247,000
Warehouse Clubs & Superstores $34,724,000 $121,215,600 $0 $86,491,600
Other General Merchandise $10,940,000 $54,385,000 $0 $43,445,000
Figure 10 continued on next page
Lacey Community Market Study 30 Final Report August, 2015
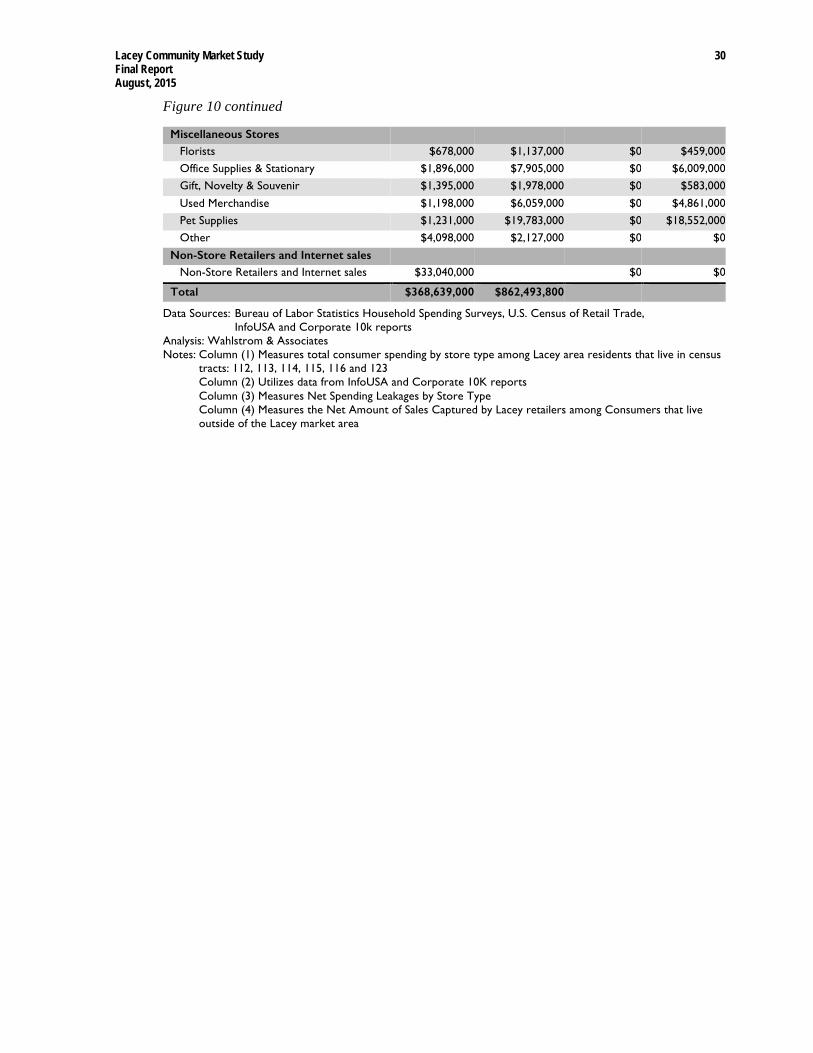
Figure 10 continued
Miscellaneous Stores
Florists $678,000 $1,137,000 $0 $459,000
Office Supplies & Stationary $1,896,000 $7,905,000 $0 $6,009,000
Gift, Novelty & Souvenir $1,395,000 $1,978,000 $0 $583,000
Used Merchandise $1,198,000 $6,059,000 $0 $4,861,000
Pet Supplies $1,231,000 $19,783,000 $0 $18,552,000
Other $4,098,000 $2,127,000 $0 $0
Non-Store Retailers and Internet sales
Non-Store Retailers and Internet sales $33,040,000 $0 $0
Total $368,639,000 $862,493,800
Data Sources: Bureau of Labor Statistics Household Spending Surveys, U.S. Census of Retail Trade, InfoUSA and Corporate 10k reports Analysis: Wahlstrom & Associates Notes: Column (1) Measures total consumer spending by store type among Lacey area residents that live in census tracts: 112, 113, 114, 115, 116 and 123 Column (2) Utilizes data from InfoUSA and Corporate 10K reports Column (3) Measures Net Spending Leakages by Store Type Column (4) Measures the Net Amount of Sales Captured by Lacey retailers among Consumers that live outside of the Lacey market area
Lacey Community Market Study 31 Final Report August, 2015
6. ECONOMIC DEVELOPMENT OPPORTUNITIES
Lacey’s economic development opportunities are primarily constrained by the lack of manufacturing establishments throughout Thurston County. Manufacturing activities, many of which are driven by technological innovation, attract investors and entrepreneurs who generate strong economic and employment multipliers through value-added activities. Instead, Thurston County’s economy is heavily skewed toward government employment, which is to be expected given the State Capitol’s location in Olympia. The remaining sectors of Thurston County’s economy look very similar to the State of Washington with the barriers to growth directly related to the performance of the national and state economy.
Lacey’s balanced economy has captured exactly 17.2 percent of Thurston County’s jobs and housing units within the City limits, which means that the City has a perfect one to one jobs/housing ratio with no net commute to employment centers elsewhere. Unfortunately, the strong components of Lacey’s economy that are listed below generate a high percentage of low-wage jobs.
• Fifty-five percent of Thurston County’s information sector jobs are located in Lacey. This sector is anchored by a single call center that employs approximately 1,000 workers.21
• Lacey has captured 28 percent of Thurston County’s wholesale trade jobs, which take advantage of the community’s excellent I-5 access.
• Lacey has become a regional shopping destination that has captured 25 percent of the County’s retail jobs.
• Chain store restaurants combined with independent ethnic restaurants have become regional destinations that allow Lacey to capture 23 percent of Thurston County’s food service and accommodations jobs.
Health care and government are two relatively weak economic sectors that pay relatively good wages but capture employment shares that are significantly below the 17.2 percent of total Thurston County jobs captured in Lacey. Only 7 percent of the County’s health care jobs, and only 14 percent of government jobs are located in Lacey. A smaller share of total government employment makes sense given that Olympia is the State capital and the principal location for State government jobs.
21 The information sector includes establishments engaged in producing, distributing, transmitting, or processing data.
Information establishments include traditional publishing and publishing exclusively on the Internet; the motion picture and sound recording industries; the broadcasting industries; telecommunications industries; web search portals, data processing industries, and the information services industries.
Lacey Community Market Study 32 Final Report August, 2015
6.1 Opportunities and Barriers to Lease and Start a New Business in Lacey
The City of Lacey has earned a reputation of being easy to work with and supportive of more business activity. Landowners, businesses, and developers that were interviewed consistently complimented the business climate and friendly regulatory environment created by City Staff and elected officials.
Instead of regulatory constraints, Lacey’s barriers to growth are subtle, complex, and directly related to the absence of a downtown or a central gathering place for people and civic activities. The demographic shifts of recent years have created a large pool of young people who are seeking more walkable urban environments with less dependence on driving. Within that context, the City is working to transform the Woodland District into a smart growth location with a higher density of housing, jobs, and local services that will also attract more residents and commerce. Unfortunately, it may take years to accomplish a successful retrofit of the Woodland District.
One land-use regulation that the City may consider is a change in the 500,000 square foot building size limitation for new development. Fulfillment centers that distribute on-line retail sales—a relatively new real estate product—require a minimum of 1 million square feet of space. Amazon has located a fulfillment center in nearby DuPont and all major corporations are establishing new fulfillment centers to manage on-line sales. Lacey’s excellent I-5 access can offer corporations an ideal location for new fulfillment centers serving the Puget Sound region.
6.2 Feasible Commercial Uses for the Existing Building Stock
Lacey has 240,000 square feet of vacant commercial space that could be occupied by retail and other commercial establishments. Six vacancies range in size from 11,000 square feet to 42,000 square feet. In general, the larger vacant spaces are too poorly located to successfully attract region-serving retail, which makes attracting new retailers to the vacant spaces very difficult given the absence of spending leakages. Potential reuses of the larger sites are described below.
The Woodland District has one 11,200 square foot vacancy that was built to be a grocery store but was converted into State offices before becoming vacant. The site has become an obsolete retail space that lacks good access and visibility. The City should consider allowing the site to be redeveloped for housing or a mix of uses that would attract residents to the live within walking distance to other commercial services. The Woodland District has a significant inventory of additional vacant office space that was formerly occupied by the State, but lacks the private sector demand to reuse in the short-term. The supply of vacant office space within the Woodland District is unknown and not included in this market study.
Lacey Community Market Study 33 Final Report August, 2015
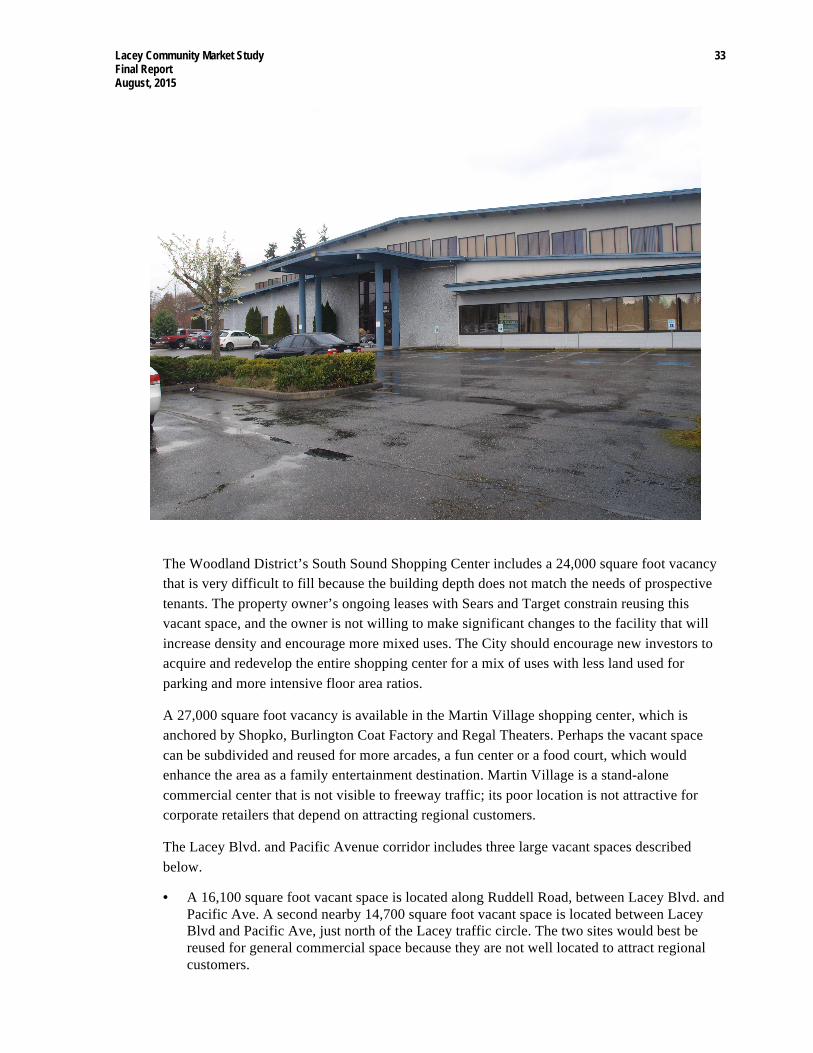
The Woodland District’s South Sound Shopping Center includes a 24,000 square foot vacancy that is very difficult to fill because the building depth does not match the needs of prospective tenants. The property owner’s ongoing leases with Sears and Target constrain reusing this vacant space, and the owner is not willing to make significant changes to the facility that will increase density and encourage more mixed uses. The City should encourage new investors to acquire and redevelop the entire shopping center for a mix of uses with less land used for parking and more intensive floor area ratios.
A 27,000 square foot vacancy is available in the Martin Village shopping center, which is anchored by Shopko, Burlington Coat Factory and Regal Theaters. Perhaps the vacant space can be subdivided and reused for more arcades, a fun center or a food court, which would enhance the area as a family entertainment destination. Martin Village is a stand-alone commercial center that is not visible to freeway traffic; its poor location is not attractive for corporate retailers that depend on attracting regional customers.
The Lacey Blvd. and Pacific Avenue corridor includes three large vacant spaces described below.
• A 16,100 square foot vacant space is located along Ruddell Road, between Lacey Blvd. and Pacific Ave. A second nearby 14,700 square foot vacant space is located between Lacey Blvd and Pacific Ave, just north of the Lacey traffic circle. The two sites would best be reused for general commercial space because they are not well located to attract regional customers.
Lacey Community Market Study 34 Final Report August, 2015
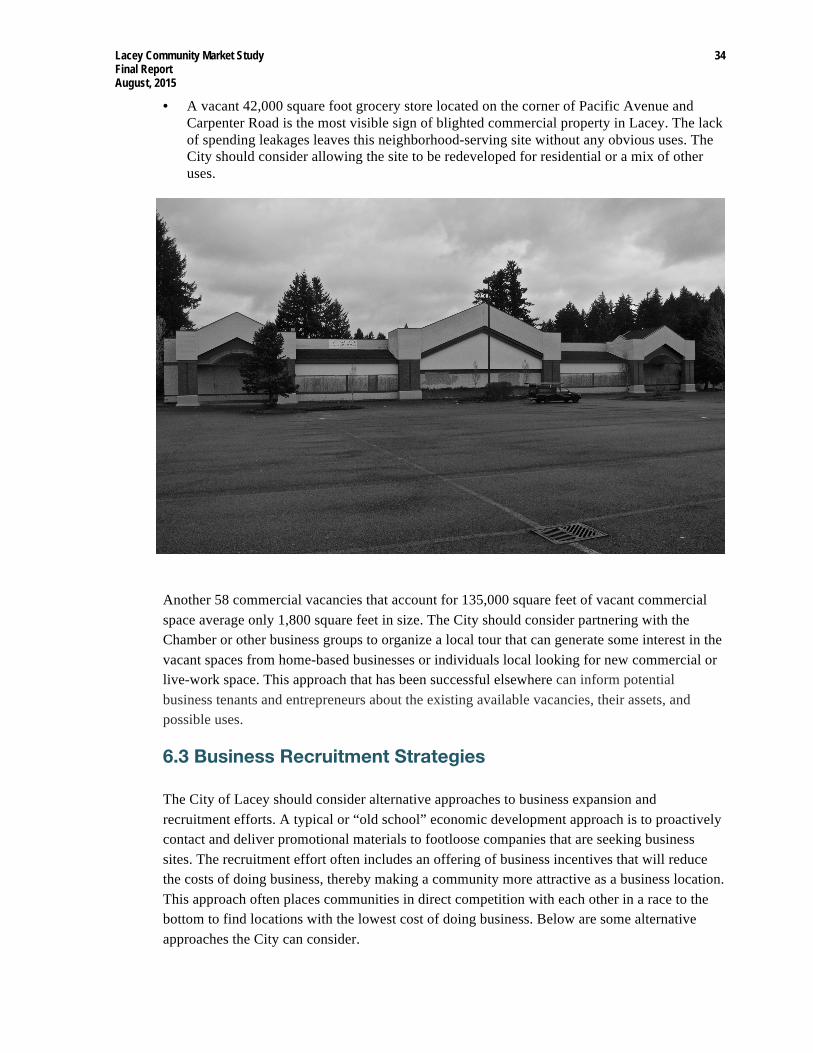
• A vacant 42,000 square foot grocery store located on the corner of Pacific Avenue and Carpenter Road is the most visible sign of blighted commercial property in Lacey. The lack of spending leakages leaves this neighborhood-serving site without any obvious uses. The City should consider allowing the site to be redeveloped for residential or a mix of other uses.
Another 58 commercial vacancies that account for 135,000 square feet of vacant commercial space average only 1,800 square feet in size. The City should consider partnering with the Chamber or other business groups to organize a local tour that can generate some interest in the vacant spaces from home-based businesses or individuals local looking for new commercial or live-work space. This approach that has been successful elsewhere can inform potential business tenants and entrepreneurs about the existing available vacancies, their assets, and possible uses.
6.3 Business Recruitment Strategies
The City of Lacey should consider alternative approaches to business expansion and recruitment efforts. A typical or “old school” economic development approach is to proactively contact and deliver promotional materials to footloose companies that are seeking business sites. The recruitment effort often includes an offering of business incentives that will reduce the costs of doing business, thereby making a community more attractive as a business location. This approach often places communities in direct competition with each other in a race to the bottom to find locations with the lowest cost of doing business. Below are some alternative approaches the City can consider.
Lacey Community Market Study 35 Final Report August, 2015
Establish a Business Retention and Expansion Program
The City could focus on assisting locally owned businesses to expand and thrive in the regional economy. Existing research shows that local companies generate much higher economic multipliers than do national chain stores, which quickly transfer their value-added revenue out of the community. A survey and/or site visit could identify specific business expansion barriers that individual establishments must overcome. Potential barriers include lack of business management expertise, marketing and branding deficiencies, lack of access to capital, improved workforce training or other similar barriers. Expanded revenues and the creation of new jobs could be accomplished through a partnership between the City, the Thurston EDC, other non-profits and the business community.
Continue New Smart Growth Initiatives in the Woodland District
The City should continue its efforts to create a more dense and walkable environment that transforms the Woodland District into a desirable place to work, live, and be entertained. A continued focus on new smart growth initiatives may take a long period of time, but has a high likelihood of making Lacey more attractive for the young, creative class.
Create a Website of Available Business Sites
The City’s existing website provides no information about sites that may be available for new commercial and industrial business space. Companies seeking sites want as much information as possible in advance of any visit to the area. They want to know about vacant land, zoning, access to infrastructure services, and an inventory of vacant buildings on the market for new business tenants. The City should consider using scarce economic development funding to add this capacity through the City’s existing website, or a new economic development website that includes information about sites. This link provides some ideas about what such a service can look like: http://www.gisplanning.com/Products/zoomprospector.html.
Encourage the Creation of a New Commercial Real Estate Area at the Gateway
The City should encourage the Gateway to be developed for commercial retail and other mixed uses. However, successful development will require developing a new real estate product that departs from the big box retail format that was developed along Marvin Road. The City should consider allowing the property owners to develop either a lifestyle center or a factory outlet center within the Gateway District. A lifestyle center mixes retail, entertainment, food and perhaps housing into a walkable commercial area. A factory outlet center could be modeled after the Woodburn Premium Outlets located just south of Portland. A factory outlet center primarily consists of retail stores that offer a product mix and format that is distinctly different from Lacey’s established retail stores. If planned and designed properly a new lifestyle of factory outlet center at the Gateway could attract additional regional customers.

Lacey Community Market Study 36 Final Report August, 2015
APPENDIX A: REPORT TABLES
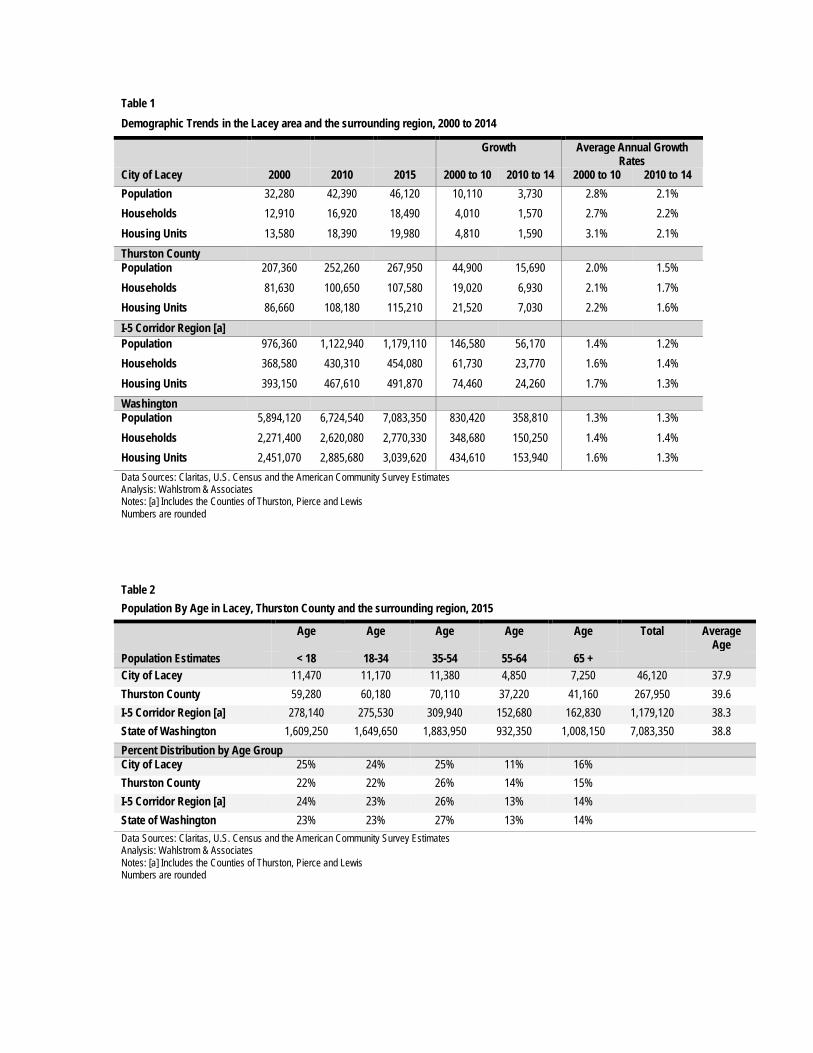
Table 1
Demographic Trends in the Lacey area and the surrounding region, 2000 to 2014
Growth Average Annual Growth Rates
City of Lacey 2000 2010 2015 2000 to 10 2010 to 14 2000 to 10 2010 to 14
Population 32,280 42,390 46,120 10,110 3,730 2.8% 2.1%
Households 12,910 16,920 18,490 4,010 1,570 2.7% 2.2%
Housing Units 13,580 18,390 19,980 4,810 1,590 3.1% 2.1%
Thurston County Population 207,360 252,260 267,950 44,900 15,690 2.0% 1.5%
Households 81,630 100,650 107,580 19,020 6,930 2.1% 1.7%
Housing Units 86,660 108,180 115,210 21,520 7,030 2.2% 1.6%
I-5 Corridor Region [a] Population 976,360 1,122,940 1,179,110 146,580 56,170 1.4% 1.2%
Households 368,580 430,310 454,080 61,730 23,770 1.6% 1.4%
Housing Units 393,150 467,610 491,870 74,460 24,260 1.7% 1.3%
Washington Population 5,894,120 6,724,540 7,083,350 830,420 358,810 1.3% 1.3%
Households 2,271,400 2,620,080 2,770,330 348,680 150,250 1.4% 1.4%
Housing Units 2,451,070 2,885,680 3,039,620 434,610 153,940 1.6% 1.3%
Data Sources: Claritas, U.S. Census and the American Community Survey Estimates Analysis: Wahlstrom & Associates Notes: [a] Includes the Counties of Thurston, Pierce and Lewis Numbers are rounded
Table 2
Population By Age in Lacey, Thurston County and the surrounding region, 2015
Age Age Age Age Age Total Average Age
Population Estimates < 18 18-34 35-54 55-64 65 +
City of Lacey 11,470 11,170 11,380 4,850 7,250 46,120 37.9
Thurston County 59,280 60,180 70,110 37,220 41,160 267,950 39.6
I-5 Corridor Region [a] 278,140 275,530 309,940 152,680 162,830 1,179,120 38.3
State of Washington 1,609,250 1,649,650 1,883,950 932,350 1,008,150 7,083,350 38.8
Percent Distribution by Age Group City of Lacey 25% 24% 25% 11% 16%
Thurston County 22% 22% 26% 14% 15%
I-5 Corridor Region [a] 24% 23% 26% 13% 14%
State of Washington 23% 23% 27% 13% 14%
Data Sources: Claritas, U.S. Census and the American Community Survey Estimates Analysis: Wahlstrom & Associates Notes: [a] Includes the Counties of Thurston, Pierce and Lewis Numbers are rounded
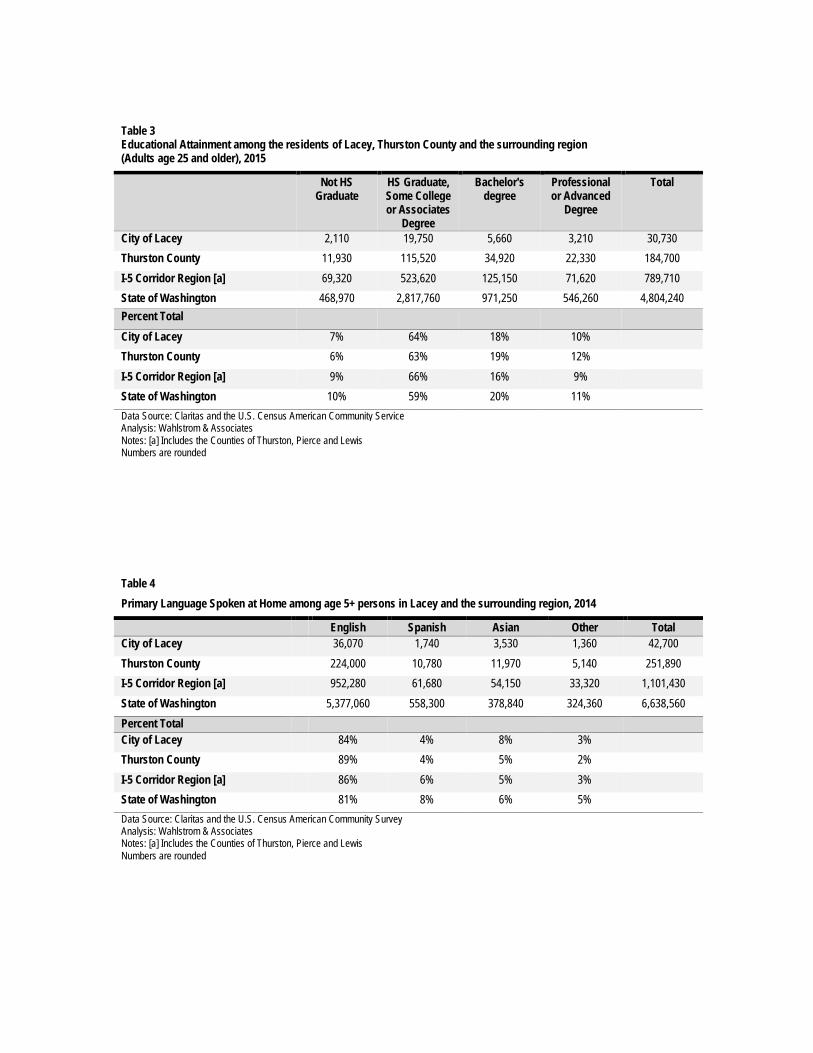
Table 3
Educational Attainment among the residents of Lacey, Thurston County and the surrounding region (Adults age 25 and older), 2015
Not HS Graduate
HS Graduate, Some College or Associates
Degree
Bachelor's degree
Professional or Advanced
Degree
Total
City of Lacey 2,110 19,750 5,660 3,210 30,730
Thurston County 11,930 115,520 34,920 22,330 184,700
I-5 Corridor Region [a] 69,320 523,620 125,150 71,620 789,710
State of Washington 468,970 2,817,760 971,250 546,260 4,804,240
Percent Total
City of Lacey 7% 64% 18% 10%
Thurston County 6% 63% 19% 12%
I-5 Corridor Region [a] 9% 66% 16% 9%
State of Washington 10% 59% 20% 11%
Data Source: Claritas and the U.S. Census American Community Service Analysis: Wahlstrom & Associates Notes: [a] Includes the Counties of Thurston, Pierce and Lewis Numbers are rounded
Table 4
Primary Language Spoken at Home among age 5+ persons in Lacey and the surrounding region, 2014
English Spanish Asian Other Total City of Lacey 36,070 1,740 3,530 1,360 42,700
Thurston County 224,000 10,780 11,970 5,140 251,890
I-5 Corridor Region [a] 952,280 61,680 54,150 33,320 1,101,430
State of Washington 5,377,060 558,300 378,840 324,360 6,638,560
Percent Total City of Lacey 84% 4% 8% 3%
Thurston County 89% 4% 5% 2%
I-5 Corridor Region [a] 86% 6% 5% 3%
State of Washington 81% 8% 6% 5%
Data Source: Claritas and the U.S. Census American Community Survey Analysis: Wahlstrom & Associates Notes: [a] Includes the Counties of Thurston, Pierce and Lewis Numbers are rounded
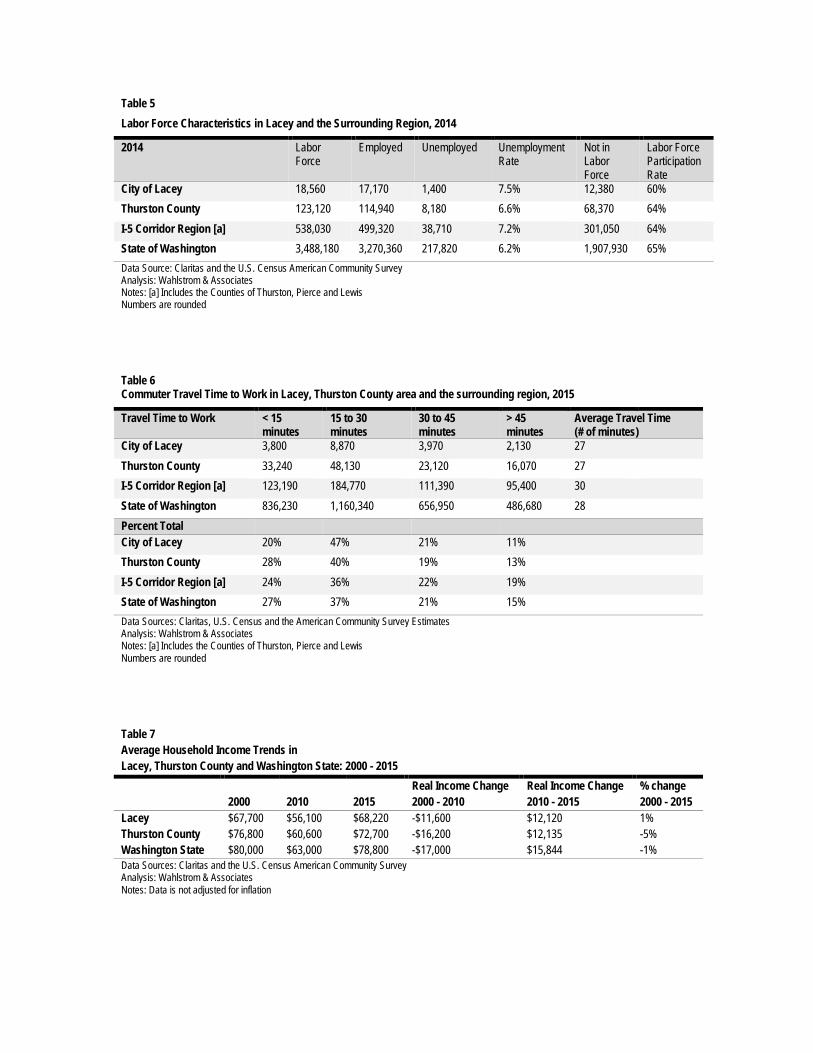
Table 5
Labor Force Characteristics in Lacey and the Surrounding Region, 2014
2014 Labor Force
Employed Unemployed Unemployment Rate
Not in Labor Force
Labor Force Participation Rate
City of Lacey 18,560 17,170 1,400 7.5% 12,380 60%
Thurston County 123,120 114,940 8,180 6.6% 68,370 64%
I-5 Corridor Region [a] 538,030 499,320 38,710 7.2% 301,050 64%
State of Washington 3,488,180 3,270,360 217,820 6.2% 1,907,930 65%
Data Source: Claritas and the U.S. Census American Community Survey Analysis: Wahlstrom & Associates Notes: [a] Includes the Counties of Thurston, Pierce and Lewis Numbers are rounded
Table 6
Commuter Travel Time to Work in Lacey, Thurston County area and the surrounding region, 2015
Travel Time to Work < 15 minutes
15 to 30 minutes
30 to 45 minutes
> 45 minutes
Average Travel Time (# of minutes)
City of Lacey 3,800 8,870 3,970 2,130 27
Thurston County 33,240 48,130 23,120 16,070 27
I-5 Corridor Region [a] 123,190 184,770 111,390 95,400 30
State of Washington 836,230 1,160,340 656,950 486,680 28
Percent Total City of Lacey 20% 47% 21% 11%
Thurston County 28% 40% 19% 13%
I-5 Corridor Region [a] 24% 36% 22% 19%
State of Washington 27% 37% 21% 15%
Data Sources: Claritas, U.S. Census and the American Community Survey Estimates Analysis: Wahlstrom & Associates Notes: [a] Includes the Counties of Thurston, Pierce and Lewis Numbers are rounded
Table 7 Average Household Income Trends in Lacey, Thurston County and Washington State: 2000 - 2015
Real Income Change Real Income Change % change 2000 2010 2015 2000 - 2010 2010 - 2015 2000 - 2015 Lacey $67,700 $56,100 $68,220 -$11,600 $12,120 1% Thurston County $76,800 $60,600 $72,700 -$16,200 $12,135 -5% Washington State $80,000 $63,000 $78,800 -$17,000 $15,844 -1% Data Sources: Claritas and the U.S. Census American Community Survey Analysis: Wahlstrom & Associates Notes: Data is not adjusted for inflation
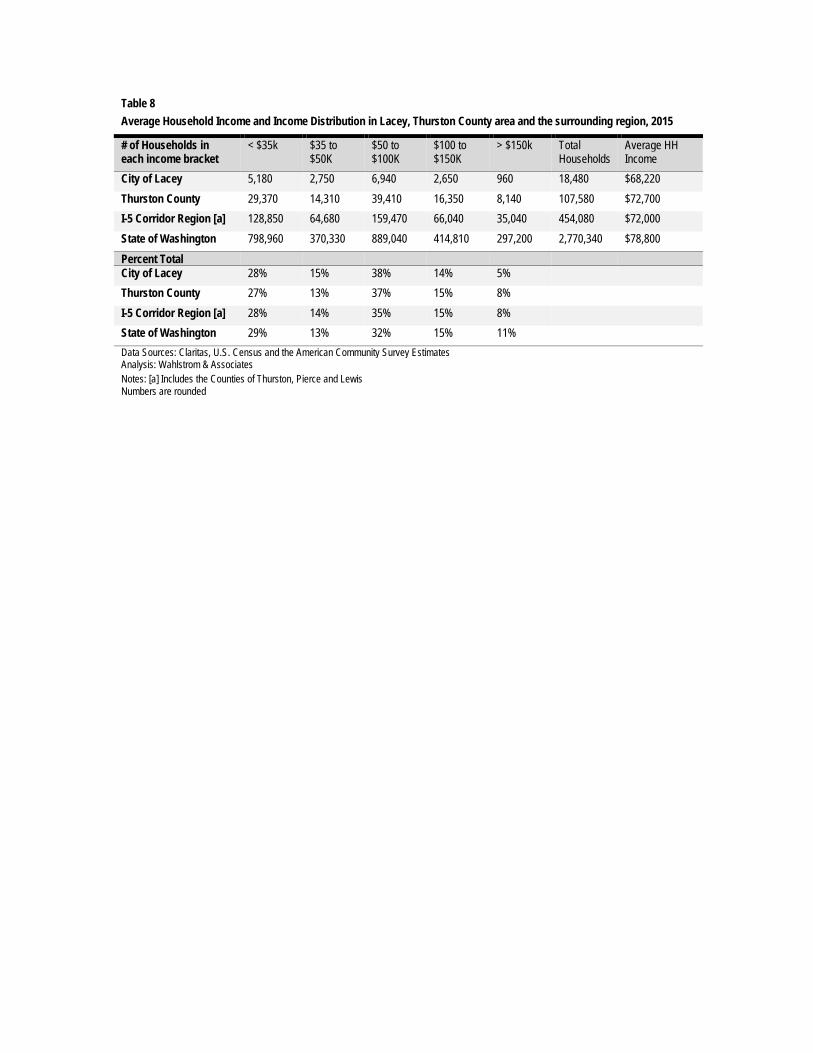
Table 8
Average Household Income and Income Distribution in Lacey, Thurston County area and the surrounding region, 2015
# of Households in each income bracket
< $35k $35 to $50K
$50 to $100K
$100 to $150K
> $150k Total Households
Average HH Income
City of Lacey 5,180 2,750 6,940 2,650 960 18,480 $68,220
Thurston County 29,370 14,310 39,410 16,350 8,140 107,580 $72,700
I-5 Corridor Region [a] 128,850 64,680 159,470 66,040 35,040 454,080 $72,000
State of Washington 798,960 370,330 889,040 414,810 297,200 2,770,340 $78,800
Percent Total City of Lacey 28% 15% 38% 14% 5%
Thurston County 27% 13% 37% 15% 8%
I-5 Corridor Region [a] 28% 14% 35% 15% 8%
State of Washington 29% 13% 32% 15% 11%
Data Sources: Claritas, U.S. Census and the American Community Survey Estimates Analysis: Wahlstrom & Associates Notes: [a] Includes the Counties of Thurston, Pierce and Lewis Numbers are rounded
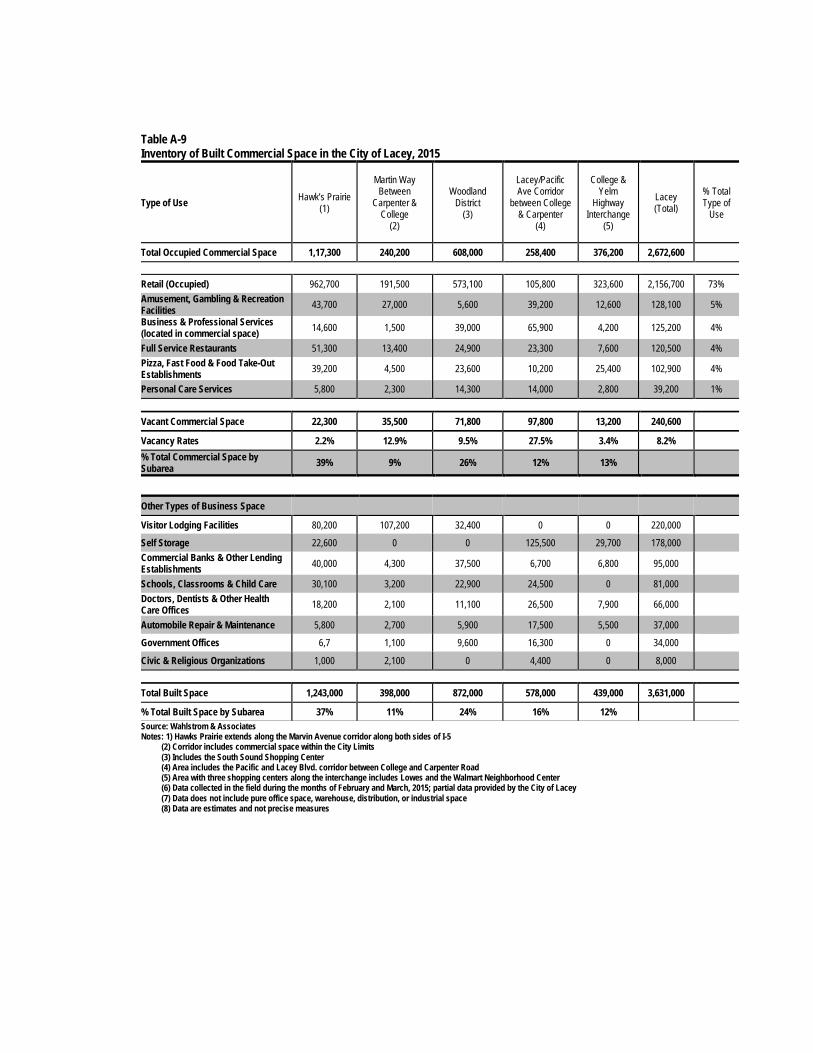
Table A-9 Inventory of Built Commercial Space in the City of Lacey, 2015!
Type of Use Hawk’s Prairie
(1)
Martin Way Between
Carpenter & College
(2)
Woodland District
(3)
Lacey/Pacific Ave Corridor
between College & Carpenter
(4)
College & Yelm
Highway Interchange
(5)
Lacey (Total)
% Total Type of
Use
Total Occupied Commercial Space 1,17,300 240,200 608,000 258,400 376,200 2,672,600
Retail (Occupied) 962,700 191,500 573,100 105,800 323,600 2,156,700 73%
Amusement, Gambling & Recreation Facilities
43,700 27,000 5,600 39,200 12,600 128,100 5%
Business & Professional Services (located in commercial space)
14,600 1,500 39,000 65,900 4,200 125,200 4%
Full Service Restaurants 51,300 13,400 24,900 23,300 7,600 120,500 4%
Pizza, Fast Food & Food Take-Out Establishments
39,200 4,500 23,600 10,200 25,400 102,900 4%
Personal Care Services 5,800 2,300 14,300 14,000 2,800 39,200 1%
Vacant Commercial Space 22,300 35,500 71,800 97,800 13,200 240,600 Vacancy Rates 2.2% 12.9% 9.5% 27.5% 3.4% 8.2%
% Total Commercial Space by Subarea
39% 9% 26% 12% 13%
Other Types of Business Space
Visitor Lodging Facilities 80,200 107,200 32,400 0 0 220,000
Self Storage 22,600 0 0 125,500 29,700 178,000
Commercial Banks & Other Lending Establishments 40,000 4,300 37,500 6,700 6,800 95,000
Schools, Classrooms & Child Care 30,100 3,200 22,900 24,500 0 81,000
Doctors, Dentists & Other Health Care Offices
18,200 2,100 11,100 26,500 7,900 66,000
Automobile Repair & Maintenance 5,800 2,700 5,900 17,500 5,500 37,000
Government Offices 6,7 1,100 9,600 16,300 0 34,000
Civic & Religious Organizations 1,000 2,100 0 4,400 0 8,000
Total Built Space 1,243,000 398,000 872,000 578,000 439,000 3,631,000
% Total Built Space by Subarea 37% 11% 24% 16% 12%
Source: Wahlstrom & Associates Notes: 1) Hawks Prairie extends along the Marvin Avenue corridor along both sides of I-5 (2) Corridor includes commercial space within the City Limits (3) Includes the South Sound Shopping Center (4) Area includes the Pacific and Lacey Blvd. corridor between College and Carpenter Road (5) Area with three shopping centers along the interchange includes Lowes and the Walmart Neighborhood Center (6) Data collected in the field during the months of February and March, 2015; partial data provided by the City of Lacey (7) Data does not include pure office space, warehouse, distribution, or industrial space (8) Data are estimates and not precise measures
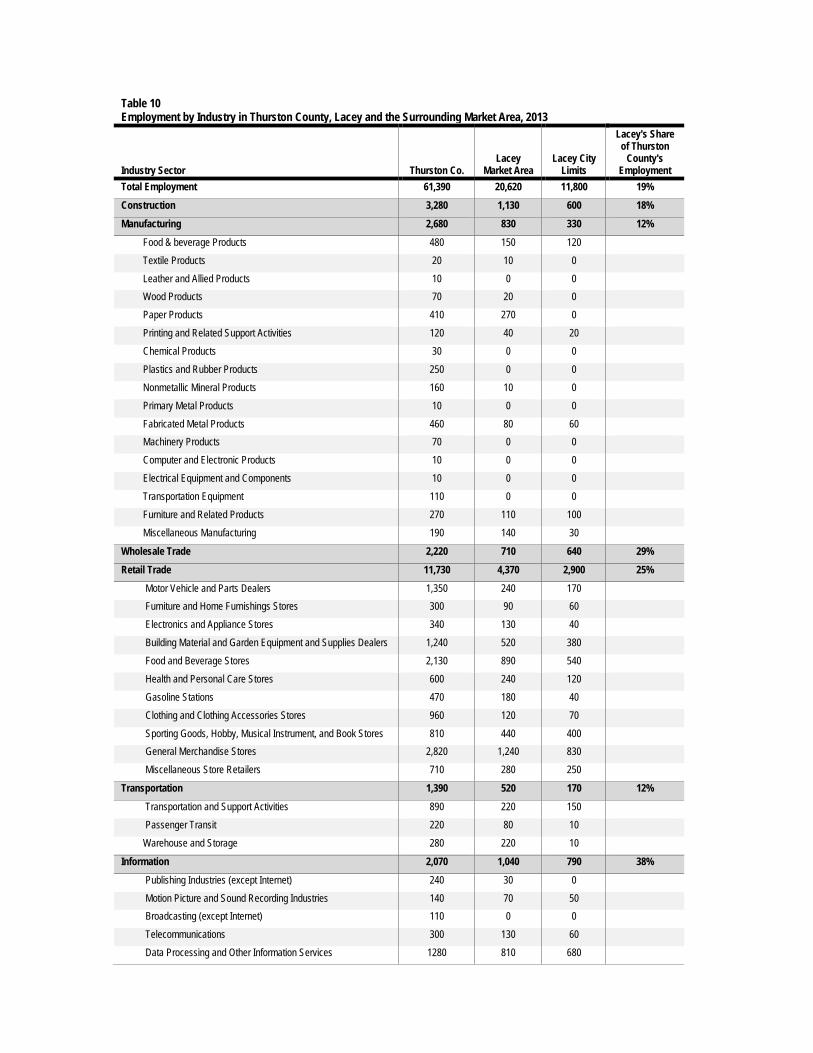
Table 10
Employment by Industry in Thurston County, Lacey and the Surrounding Market Area, 2013
Industry Sector
Thurston Co.
Lacey Market Area
Lacey City Limits
Lacey's Share of Thurston
County's Employment
Total Employment 61,390 20,620 11,800 19%
Construction 3,280 1,130 600 18%
Manufacturing 2,680 830 330 12%
Food & beverage Products 480 150 120
Textile Products 20 10 0
Leather and Allied Products 10 0 0
Wood Products 70 20 0
Paper Products 410 270 0
Printing and Related Support Activities 120 40 20
Chemical Products 30 0 0
Plastics and Rubber Products 250 0 0
Nonmetallic Mineral Products 160 10 0
Primary Metal Products 10 0 0
Fabricated Metal Products 460 80 60
Machinery Products 70 0 0
Computer and Electronic Products 10 0 0
Electrical Equipment and Components 10 0 0
Transportation Equipment 110 0 0
Furniture and Related Products 270 110 100
Miscellaneous Manufacturing 190 140 30
Wholesale Trade 2,220 710 640 29%
Retail Trade 11,730 4,370 2,900 25%
Motor Vehicle and Parts Dealers 1,350 240 170
Furniture and Home Furnishings Stores 300 90 60
Electronics and Appliance Stores 340 130 40
Building Material and Garden Equipment and Supplies Dealers 1,240 520 380
Food and Beverage Stores 2,130 890 540
Health and Personal Care Stores 600 240 120
Gasoline Stations 470 180 40
Clothing and Clothing Accessories Stores 960 120 70
Sporting Goods, Hobby, Musical Instrument, and Book Stores 810 440 400
General Merchandise Stores 2,820 1,240 830
Miscellaneous Store Retailers 710 280 250
Transportation 1,390 520 170 12%
Transportation and Support Activities 890 220 150
Passenger Transit 220 80 10
Warehouse and Storage 280 220 10
Information 2,070 1,040 790 38%
Publishing Industries (except Internet) 240 30 0
Motion Picture and Sound Recording Industries 140 70 50
Broadcasting (except Internet) 110 0 0
Telecommunications 300 130 60
Data Processing and Other Information Services 1280 810 680
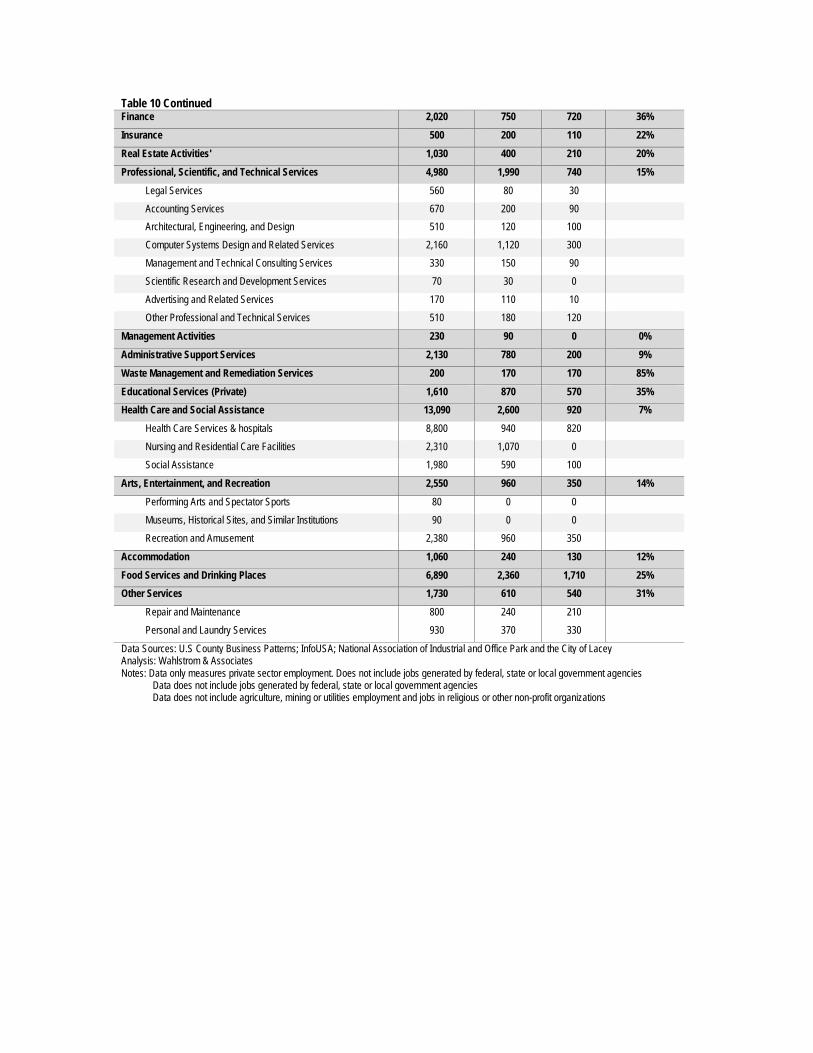
Table 10 Continued Finance 2,020 750 720 36%
Insurance 500 200 110 22%
Real Estate Activities' 1,030 400 210 20%
Professional, Scientific, and Technical Services 4,980 1,990 740 15%
Legal Services 560 80 30
Accounting Services 670 200 90
Architectural, Engineering, and Design 510 120 100
Computer Systems Design and Related Services 2,160 1,120 300
Management and Technical Consulting Services 330 150 90
Scientific Research and Development Services 70 30 0
Advertising and Related Services 170 110 10
Other Professional and Technical Services 510 180 120
Management Activities 230 90 0 0%
Administrative Support Services 2,130 780 200 9%
Waste Management and Remediation Services 200 170 170 85%
Educational Services (Private) 1,610 870 570 35%
Health Care and Social Assistance 13,090 2,600 920 7%
Health Care Services & hospitals 8,800 940 820
Nursing and Residential Care Facilities 2,310 1,070 0
Social Assistance 1,980 590 100
Arts, Entertainment, and Recreation 2,550 960 350 14%
Performing Arts and Spectator Sports 80 0 0
Museums, Historical Sites, and Similar Institutions 90 0 0
Recreation and Amusement 2,380 960 350
Accommodation 1,060 240 130 12%
Food Services and Drinking Places 6,890 2,360 1,710 25%
Other Services 1,730 610 540 31%
Repair and Maintenance 800 240 210
Personal and Laundry Services 930 370 330
Data Sources: U.S County Business Patterns; InfoUSA; National Association of Industrial and Office Park and the City of Lacey Analysis: Wahlstrom & Associates Notes: Data only measures private sector employment. Does not include jobs generated by federal, state or local government agencies Data does not include jobs generated by federal, state or local government agencies Data does not include agriculture, mining or utilities employment and jobs in religious or other non-profit organizations
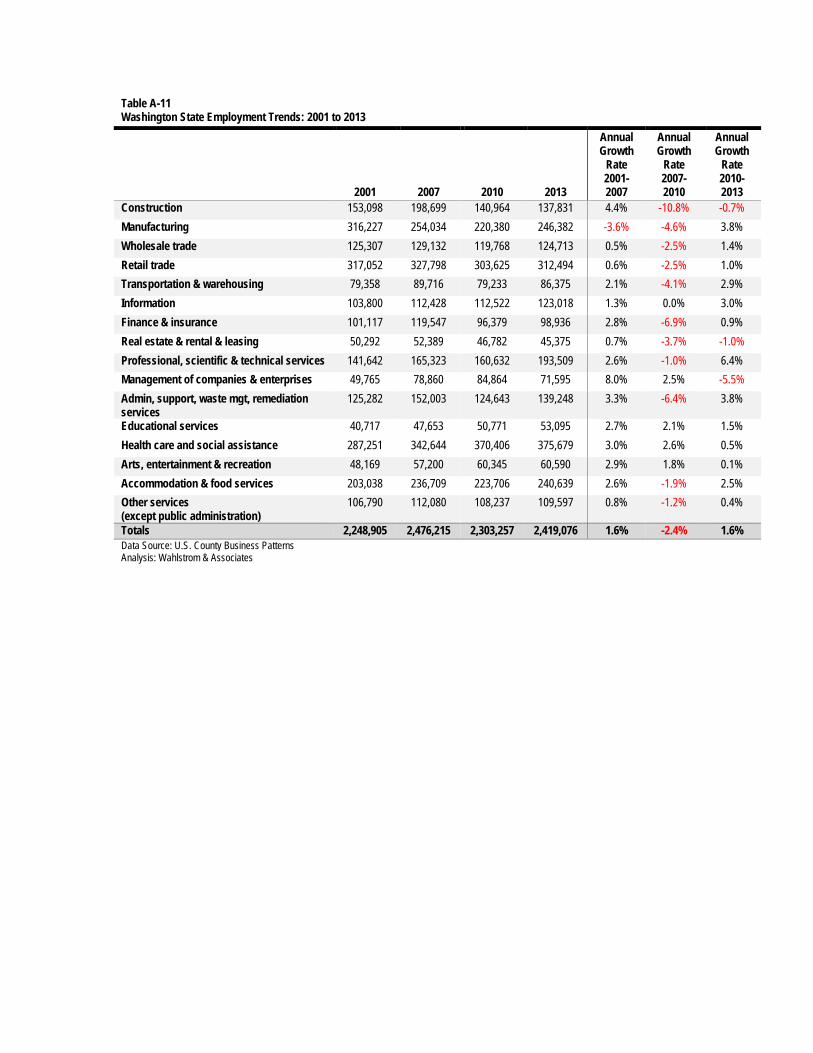
Table A-11 Washington State Employment Trends: 2001 to 2013
2001
2007
2010
2013
Annual Growth
Rate 2001-2007
Annual Growth
Rate 2007-2010
Annual Growth
Rate 2010-2013
Construction 153,098 198,699 140,964 137,831 4.4% -10.8% -0.7%
Manufacturing 316,227 254,034 220,380 246,382 -3.6% -4.6% 3.8%
Wholesale trade 125,307 129,132 119,768 124,713 0.5% -2.5% 1.4%
Retail trade 317,052 327,798 303,625 312,494 0.6% -2.5% 1.0%
Transportation & warehousing 79,358 89,716 79,233 86,375 2.1% -4.1% 2.9%
Information 103,800 112,428 112,522 123,018 1.3% 0.0% 3.0%
Finance & insurance 101,117 119,547 96,379 98,936 2.8% -6.9% 0.9%
Real estate & rental & leasing 50,292 52,389 46,782 45,375 0.7% -3.7% -1.0%
Professional, scientific & technical services 141,642 165,323 160,632 193,509 2.6% -1.0% 6.4%
Management of companies & enterprises 49,765 78,860 84,864 71,595 8.0% 2.5% -5.5%
Admin, support, waste mgt, remediation services
125,282 152,003 124,643 139,248 3.3% -6.4% 3.8%
Educational services 40,717 47,653 50,771 53,095 2.7% 2.1% 1.5%
Health care and social assistance 287,251 342,644 370,406 375,679 3.0% 2.6% 0.5%
Arts, entertainment & recreation 48,169 57,200 60,345 60,590 2.9% 1.8% 0.1%
Accommodation & food services 203,038 236,709 223,706 240,639 2.6% -1.9% 2.5%
Other services (except public administration)
106,790 112,080 108,237 109,597 0.8% -1.2% 0.4%
Totals 2,248,905 2,476,215 2,303,257 2,419,076 1.6% -2.4% 1.6% Data Source: U.S. County Business Patterns Analysis: Wahlstrom & Associates
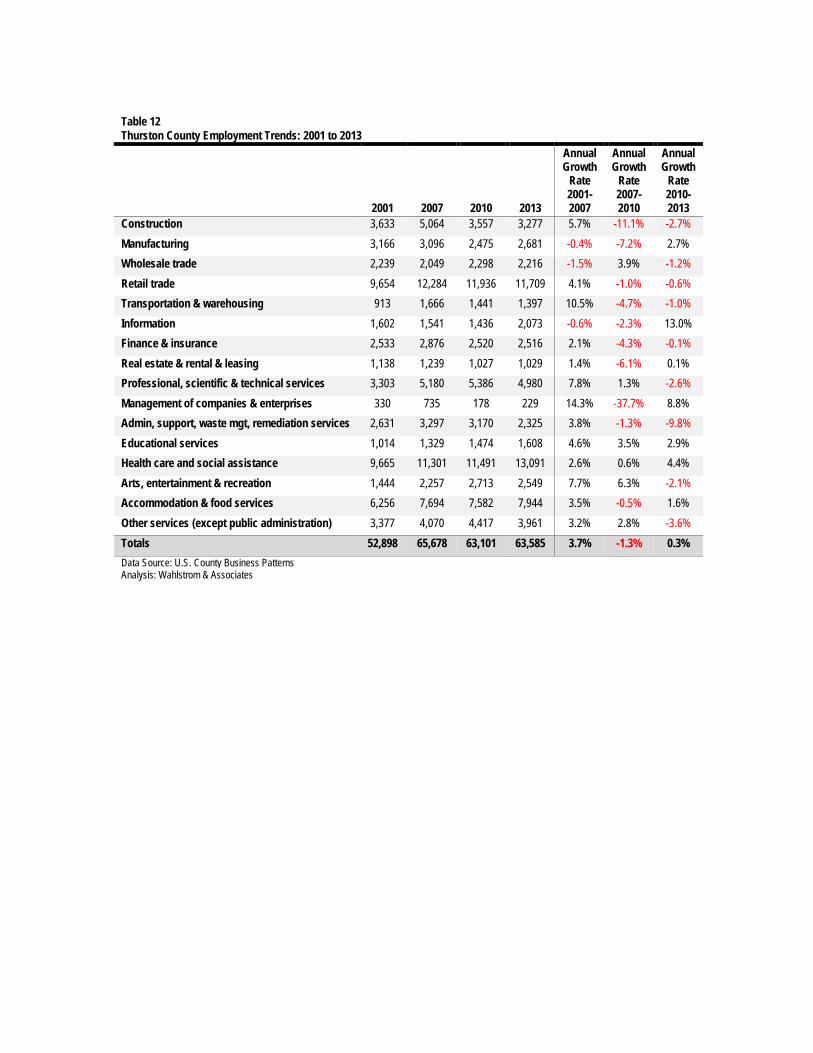
Table 12 Thurston County Employment Trends: 2001 to 2013
2001
2007
2010
2013
Annual Growth
Rate 2001-2007
Annual Growth
Rate 2007-2010
Annual Growth
Rate 2010-2013
Construction 3,633 5,064 3,557 3,277 5.7% -11.1% -2.7%
Manufacturing 3,166 3,096 2,475 2,681 -0.4% -7.2% 2.7%
Wholesale trade 2,239 2,049 2,298 2,216 -1.5% 3.9% -1.2%
Retail trade 9,654 12,284 11,936 11,709 4.1% -1.0% -0.6%
Transportation & warehousing 913 1,666 1,441 1,397 10.5% -4.7% -1.0%
Information 1,602 1,541 1,436 2,073 -0.6% -2.3% 13.0%
Finance & insurance 2,533 2,876 2,520 2,516 2.1% -4.3% -0.1%
Real estate & rental & leasing 1,138 1,239 1,027 1,029 1.4% -6.1% 0.1%
Professional, scientific & technical services 3,303 5,180 5,386 4,980 7.8% 1.3% -2.6%
Management of companies & enterprises 330 735 178 229 14.3% -37.7% 8.8%
Admin, support, waste mgt, remediation services 2,631 3,297 3,170 2,325 3.8% -1.3% -9.8%
Educational services 1,014 1,329 1,474 1,608 4.6% 3.5% 2.9%
Health care and social assistance 9,665 11,301 11,491 13,091 2.6% 0.6% 4.4%
Arts, entertainment & recreation 1,444 2,257 2,713 2,549 7.7% 6.3% -2.1%
Accommodation & food services 6,256 7,694 7,582 7,944 3.5% -0.5% 1.6%
Other services (except public administration) 3,377 4,070 4,417 3,961 3.2% 2.8% -3.6%
Totals 52,898 65,678 63,101 63,585 3.7% -1.3% 0.3%
Data Source: U.S. County Business Patterns Analysis: Wahlstrom & Associates
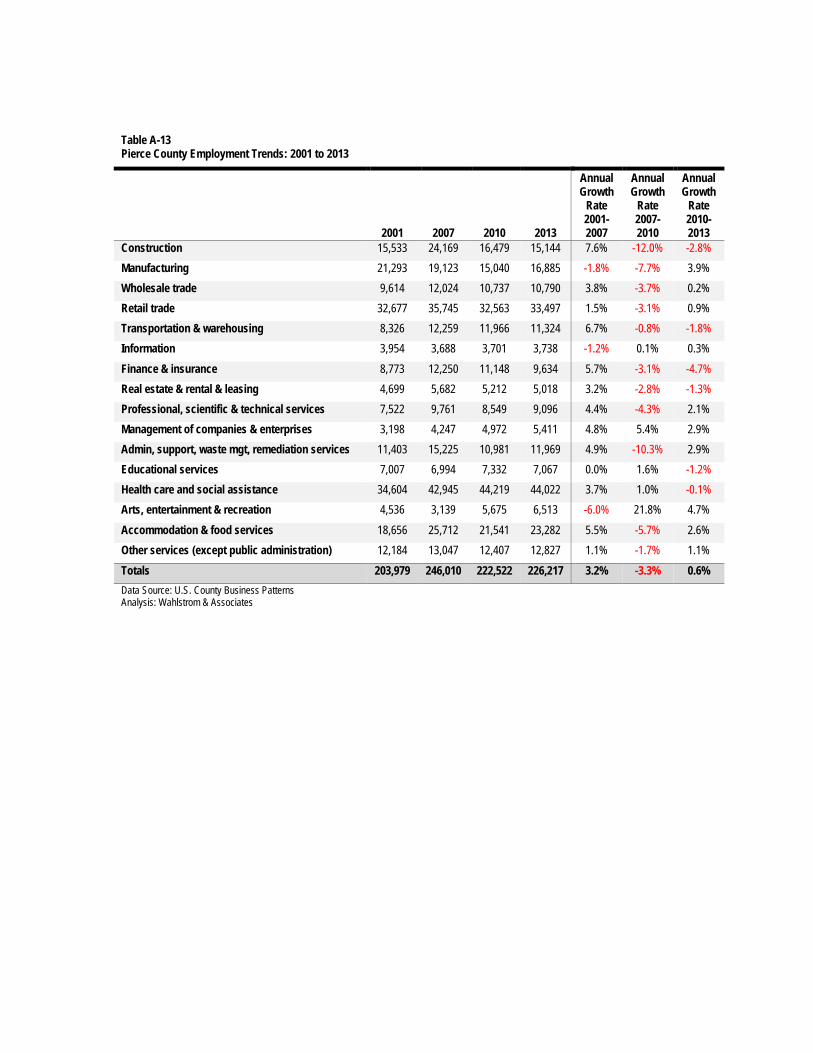
Table A-13 Pierce County Employment Trends: 2001 to 2013
2001
2007
2010
2013
Annual Growth
Rate 2001-2007
Annual Growth
Rate 2007-2010
Annual Growth
Rate 2010-2013
Construction 15,533 24,169 16,479 15,144 7.6% -12.0% -2.8%
Manufacturing 21,293 19,123 15,040 16,885 -1.8% -7.7% 3.9%
Wholesale trade 9,614 12,024 10,737 10,790 3.8% -3.7% 0.2%
Retail trade 32,677 35,745 32,563 33,497 1.5% -3.1% 0.9%
Transportation & warehousing 8,326 12,259 11,966 11,324 6.7% -0.8% -1.8%
Information 3,954 3,688 3,701 3,738 -1.2% 0.1% 0.3%
Finance & insurance 8,773 12,250 11,148 9,634 5.7% -3.1% -4.7%
Real estate & rental & leasing 4,699 5,682 5,212 5,018 3.2% -2.8% -1.3%
Professional, scientific & technical services 7,522 9,761 8,549 9,096 4.4% -4.3% 2.1%
Management of companies & enterprises 3,198 4,247 4,972 5,411 4.8% 5.4% 2.9%
Admin, support, waste mgt, remediation services 11,403 15,225 10,981 11,969 4.9% -10.3% 2.9%
Educational services 7,007 6,994 7,332 7,067 0.0% 1.6% -1.2%
Health care and social assistance 34,604 42,945 44,219 44,022 3.7% 1.0% -0.1%
Arts, entertainment & recreation 4,536 3,139 5,675 6,513 -6.0% 21.8% 4.7%
Accommodation & food services 18,656 25,712 21,541 23,282 5.5% -5.7% 2.6%
Other services (except public administration) 12,184 13,047 12,407 12,827 1.1% -1.7% 1.1%
Totals 203,979 246,010 222,522 226,217 3.2% -3.3% 0.6%
Data Source: U.S. County Business Patterns Analysis: Wahlstrom & Associates
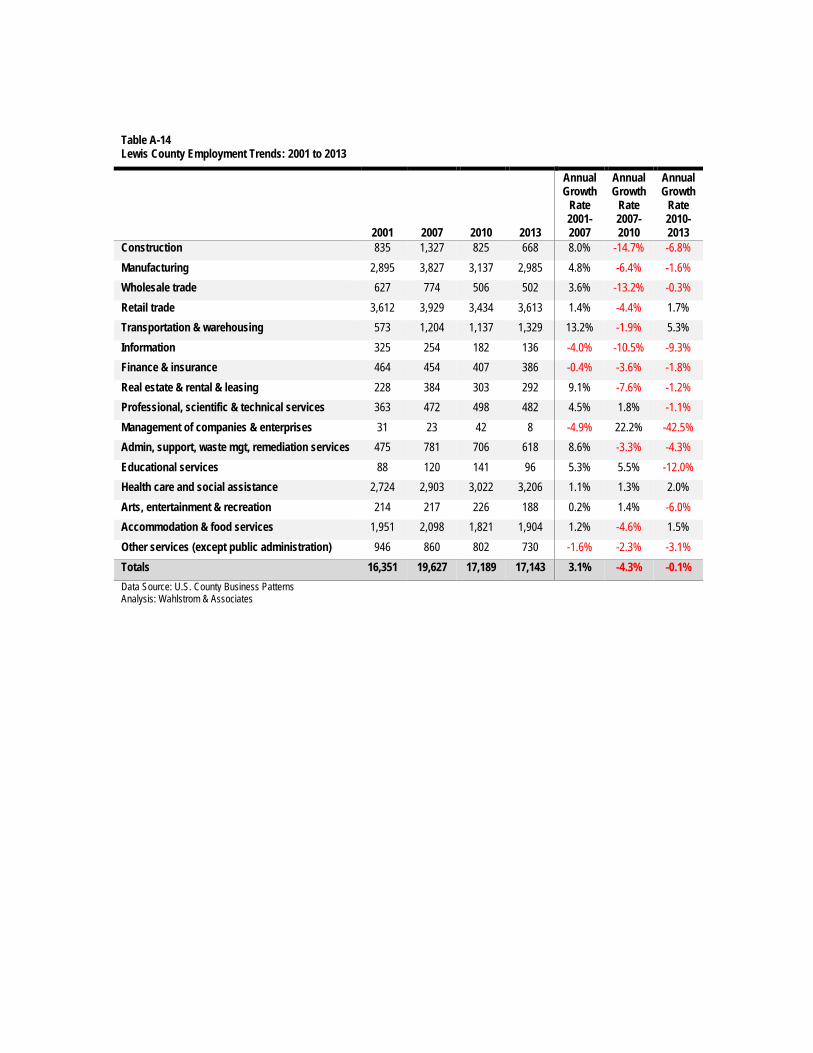
Table A-14 Lewis County Employment Trends: 2001 to 2013
2001
2007
2010
2013
Annual Growth
Rate 2001-2007
Annual Growth
Rate 2007-2010
Annual Growth
Rate 2010-2013
Construction 835 1,327 825 668 8.0% -14.7% -6.8%
Manufacturing 2,895 3,827 3,137 2,985 4.8% -6.4% -1.6%
Wholesale trade 627 774 506 502 3.6% -13.2% -0.3%
Retail trade 3,612 3,929 3,434 3,613 1.4% -4.4% 1.7%
Transportation & warehousing 573 1,204 1,137 1,329 13.2% -1.9% 5.3%
Information 325 254 182 136 -4.0% -10.5% -9.3%
Finance & insurance 464 454 407 386 -0.4% -3.6% -1.8%
Real estate & rental & leasing 228 384 303 292 9.1% -7.6% -1.2%
Professional, scientific & technical services 363 472 498 482 4.5% 1.8% -1.1%
Management of companies & enterprises 31 23 42 8 -4.9% 22.2% -42.5%
Admin, support, waste mgt, remediation services 475 781 706 618 8.6% -3.3% -4.3%
Educational services 88 120 141 96 5.3% 5.5% -12.0%
Health care and social assistance 2,724 2,903 3,022 3,206 1.1% 1.3% 2.0%
Arts, entertainment & recreation 214 217 226 188 0.2% 1.4% -6.0%
Accommodation & food services 1,951 2,098 1,821 1,904 1.2% -4.6% 1.5%
Other services (except public administration) 946 860 802 730 -1.6% -2.3% -3.1%
Totals 16,351 19,627 17,189 17,143 3.1% -4.3% -0.1%
Data Source: U.S. County Business Patterns Analysis: Wahlstrom & Associates
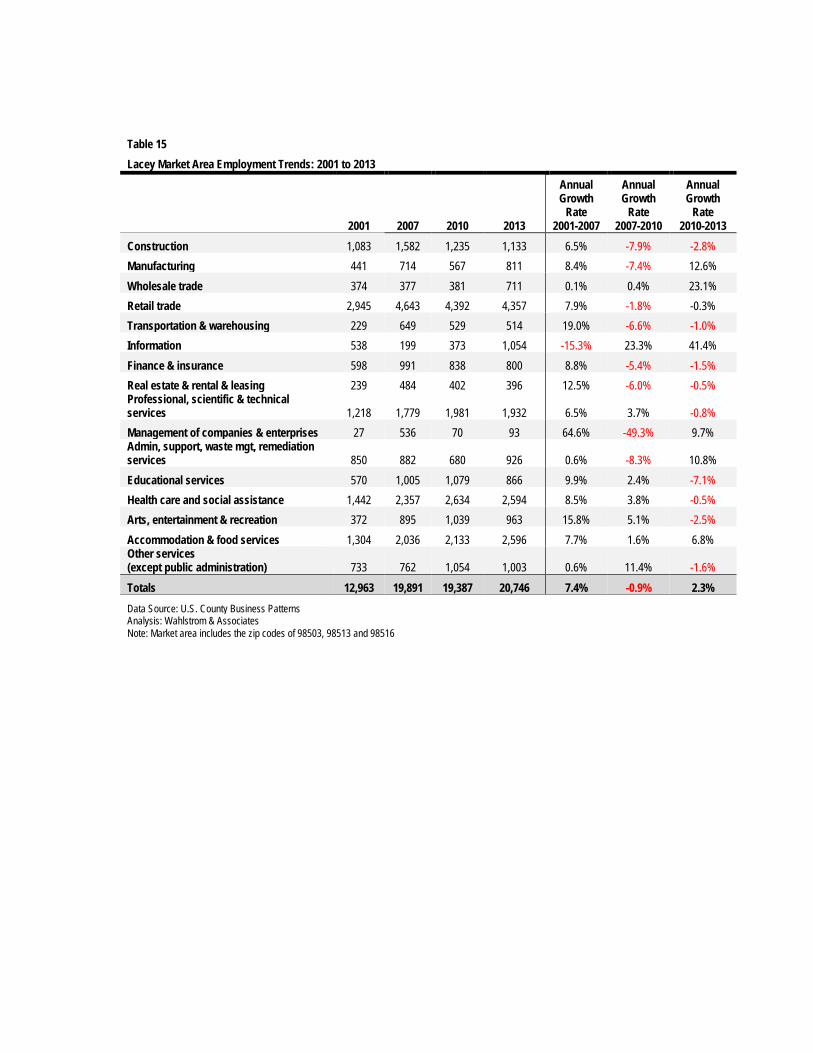
Table 15 Lacey Market Area Employment Trends: 2001 to 2013
2001 2007 2010 2013
Annual Growth
Rate 2001-2007
Annual Growth
Rate 2007-2010
Annual Growth
Rate 2010-2013
Construction 1,083 1,582 1,235 1,133 6.5% -7.9% -2.8%
Manufacturing 441 714 567 811 8.4% -7.4% 12.6%
Wholesale trade 374 377 381 711 0.1% 0.4% 23.1%
Retail trade 2,945 4,643 4,392 4,357 7.9% -1.8% -0.3%
Transportation & warehousing 229 649 529 514 19.0% -6.6% -1.0%
Information 538 199 373 1,054 -15.3% 23.3% 41.4%
Finance & insurance 598 991 838 800 8.8% -5.4% -1.5%
Real estate & rental & leasing 239 484 402 396 12.5% -6.0% -0.5% Professional, scientific & technical services 1,218 1,779 1,981 1,932 6.5% 3.7% -0.8%
Management of companies & enterprises 27 536 70 93 64.6% -49.3% 9.7% Admin, support, waste mgt, remediation services 850 882 680 926 0.6% -8.3% 10.8%
Educational services 570 1,005 1,079 866 9.9% 2.4% -7.1%
Health care and social assistance 1,442 2,357 2,634 2,594 8.5% 3.8% -0.5%
Arts, entertainment & recreation 372 895 1,039 963 15.8% 5.1% -2.5%
Accommodation & food services 1,304 2,036 2,133 2,596 7.7% 1.6% 6.8% Other services (except public administration) 733 762 1,054 1,003 0.6% 11.4% -1.6%
Totals 12,963 19,891 19,387 20,746 7.4% -0.9% 2.3%
Data Source: U.S. County Business Patterns Analysis: Wahlstrom & Associates
Note: Market area includes the zip codes of 98503, 98513 and 98516
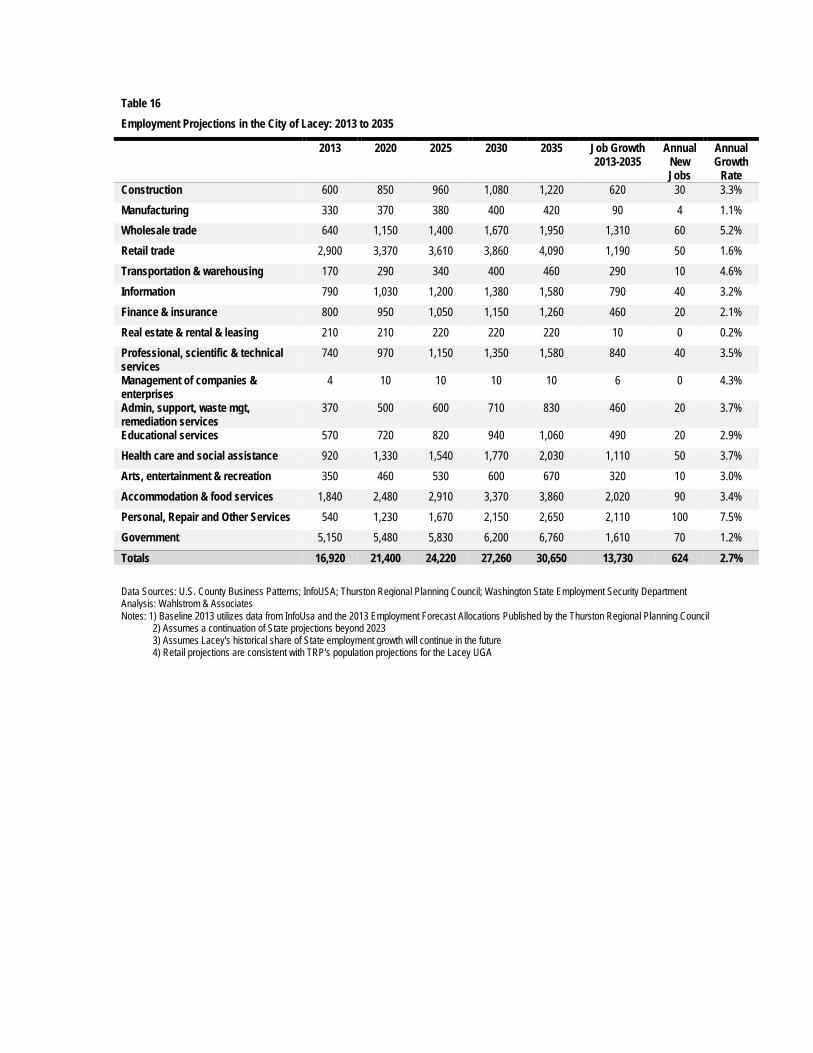
Table 16
Employment Projections in the City of Lacey: 2013 to 2035
2013 2020 2025 2030 2035 Job Growth 2013-2035
Annual New Jobs
Annual Growth
Rate Construction 600 850 960 1,080 1,220 620 30 3.3%
Manufacturing 330 370 380 400 420 90 4 1.1%
Wholesale trade 640 1,150 1,400 1,670 1,950 1,310 60 5.2%
Retail trade 2,900 3,370 3,610 3,860 4,090 1,190 50 1.6%
Transportation & warehousing 170 290 340 400 460 290 10 4.6%
Information 790 1,030 1,200 1,380 1,580 790 40 3.2%
Finance & insurance 800 950 1,050 1,150 1,260 460 20 2.1%
Real estate & rental & leasing 210 210 220 220 220 10 0 0.2%
Professional, scientific & technical services
740 970 1,150 1,350 1,580 840 40 3.5%
Management of companies & enterprises
4 10 10 10 10 6 0 4.3%
Admin, support, waste mgt, remediation services
370 500 600 710 830 460 20 3.7%
Educational services 570 720 820 940 1,060 490 20 2.9%
Health care and social assistance 920 1,330 1,540 1,770 2,030 1,110 50 3.7%
Arts, entertainment & recreation 350 460 530 600 670 320 10 3.0%
Accommodation & food services 1,840 2,480 2,910 3,370 3,860 2,020 90 3.4%
Personal, Repair and Other Services 540 1,230 1,670 2,150 2,650 2,110 100 7.5%
Government 5,150 5,480 5,830 6,200 6,760 1,610 70 1.2%
Totals 16,920 21,400 24,220 27,260 30,650 13,730 624 2.7%
Data Sources: U.S. County Business Patterns; InfoUSA; Thurston Regional Planning Council; Washington State Employment Security Department Analysis: Wahlstrom & Associates Notes: 1) Baseline 2013 utilizes data from InfoUsa and the 2013 Employment Forecast Allocations Published by the Thurston Regional Planning Council 2) Assumes a continuation of State projections beyond 2023 3) Assumes Lacey's historical share of State employment growth will continue in the future 4) Retail projections are consistent with TRP's population projections for the Lacey UGA

Table 17
Land Demand Projections in the City of Lacey: 2013 to 2035
2013 Baseline Data
Projected Demand 2013 - 2020
Projected Demand 2020 - 2025
Projected Demand 2025 - 2030
Projected Demand 2030 - 2035
Total Demand 2013-2035
Building Space
Acreage New Building Space
New Acreage
Absorbed
New Building Space
New Acreage
Absorbed
New Building Space
New Acreage
Absorbed
New Building Space
New Acreage
Absorbed
New Building Space
New Acreage
Absorbed
Ground Floor Commercial Space
2,890,000 265 885,000 81 580,000 53 625,000 57 625,000 57 2,715,000 249
Office or Business Park Space
1,371,000 79 261,000 15 189,000 11 201,000 12 201,000 12 852,000 49
R&D /flex space 64,000 4 24,000 2 16,000 1 16,000 1 16,000 1 72,000 5
Mfg/Industrial 1,496,000 137 512,000 47 280,000 26 304,000 28 304,000 28 1,400,000 129
Warehouse & storage 351,000 54 108,000 17 54,000 8 54,000 8 54,000 8 270,000 41
Institutions [a] 800,000 37 150,000 7 100,000 5 100,000 5 100,000 5 450,000 21
Total 6,972,000 576 1,940,000 168 1,219,000 104 1,300,000 111 1,300,000 111 5,759,000 493 Data Sources: U.S. County Business Patterns; InfoUSA; Thurston Regional Planning Council; Washington State Employment Security Department; Urban Land Institute; National Association of Office and Industrial Parks Analysis: Wahlstrom & Associates Notes: Floor Area Ratio (FAR) and Employment Densities are assumed based on research in other similar communities
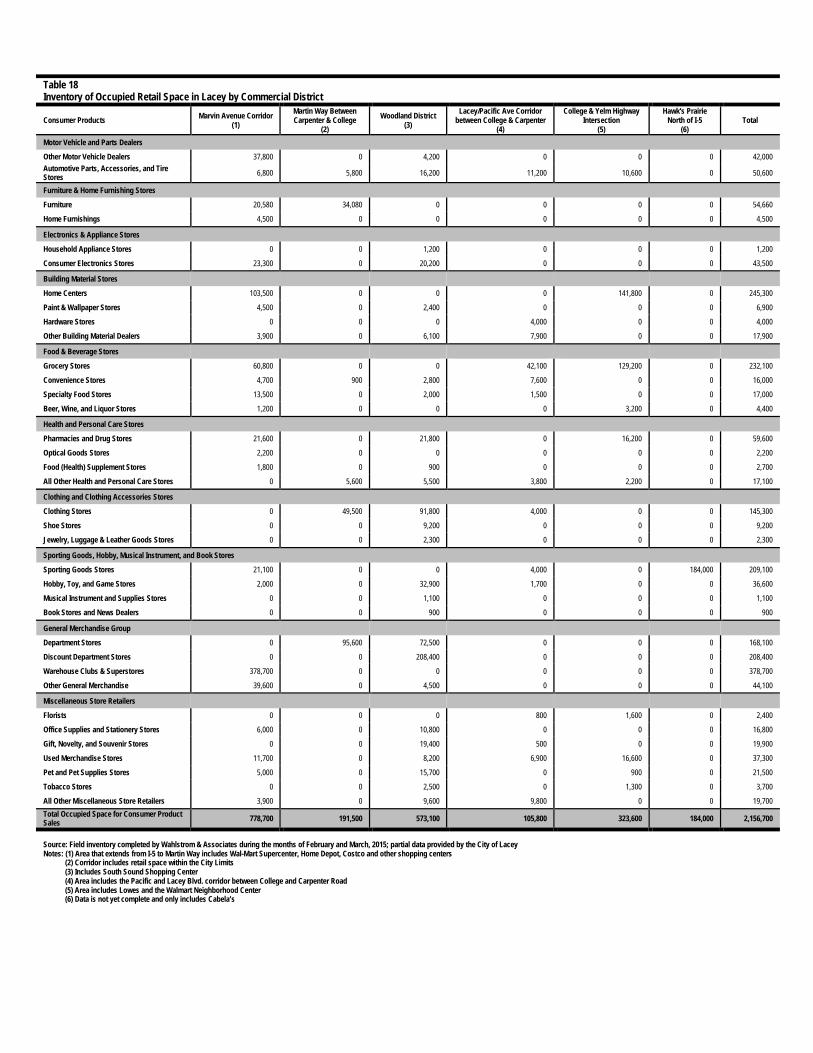
Table 18 Inventory of Occupied Retail Space in Lacey by Commercial District
Consumer Products Marvin Avenue Corridor (1)
Martin Way Between Carpenter & College
(2)
Woodland District (3)
Lacey/Pacific Ave Corridor between College & Carpenter
(4)
College & Yelm Highway Intersection
(5)
Hawk's Prairie North of I-5
(6) Total
Motor Vehicle and Parts Dealers
Other Motor Vehicle Dealers 37,800 0 4,200 0 0 0 42,000
Automotive Parts, Accessories, and Tire Stores 6,800 5,800 16,200 11,200 10,600 0 50,600
Furniture & Home Furnishing Stores
Furniture 20,580 34,080 0 0 0 0 54,660
Home Furnishings 4,500 0 0 0 0 0 4,500
Electronics & Appliance Stores
Household Appliance Stores 0 0 1,200 0 0 0 1,200
Consumer Electronics Stores 23,300 0 20,200 0 0 0 43,500
Building Material Stores Home Centers 103,500 0 0 0 141,800 0 245,300
Paint & Wallpaper Stores 4,500 0 2,400 0 0 0 6,900
Hardware Stores 0 0 0 4,000 0 0 4,000
Other Building Material Dealers 3,900 0 6,100 7,900 0 0 17,900
Food & Beverage Stores Grocery Stores 60,800 0 0 42,100 129,200 0 232,100
Convenience Stores 4,700 900 2,800 7,600 0 0 16,000
Specialty Food Stores 13,500 0 2,000 1,500 0 0 17,000
Beer, Wine, and Liquor Stores 1,200 0 0 0 3,200 0 4,400
Health and Personal Care Stores
Pharmacies and Drug Stores 21,600 0 21,800 0 16,200 0 59,600
Optical Goods Stores 2,200 0 0 0 0 0 2,200
Food (Health) Supplement Stores 1,800 0 900 0 0 0 2,700
All Other Health and Personal Care Stores 0 5,600 5,500 3,800 2,200 0 17,100
Clothing and Clothing Accessories Stores
Clothing Stores 0 49,500 91,800 4,000 0 0 145,300
Shoe Stores 0 0 9,200 0 0 0 9,200
Jewelry, Luggage & Leather Goods Stores 0 0 2,300 0 0 0 2,300
Sporting Goods, Hobby, Musical Instrument, and Book Stores
Sporting Goods Stores 21,100 0 0 4,000 0 184,000 209,100
Hobby, Toy, and Game Stores 2,000 0 32,900 1,700 0 0 36,600
Musical Instrument and Supplies Stores 0 0 1,100 0 0 0 1,100
Book Stores and News Dealers 0 0 900 0 0 0 900
General Merchandise Group Department Stores 0 95,600 72,500 0 0 0 168,100
Discount Department Stores 0 0 208,400 0 0 0 208,400
Warehouse Clubs & Superstores 378,700 0 0 0 0 0 378,700
Other General Merchandise 39,600 0 4,500 0 0 0 44,100
Miscellaneous Store Retailers Florists 0 0 0 800 1,600 0 2,400
Office Supplies and Stationery Stores 6,000 0 10,800 0 0 0 16,800
Gift, Novelty, and Souvenir Stores 0 0 19,400 500 0 0 19,900
Used Merchandise Stores 11,700 0 8,200 6,900 16,600 0 37,300
Pet and Pet Supplies Stores 5,000 0 15,700 0 900 0 21,500
Tobacco Stores 0 0 2,500 0 1,300 0 3,700
All Other Miscellaneous Store Retailers 3,900 0 9,600 9,800 0 0 19,700
Total Occupied Space for Consumer Product Sales 778,700 191,500 573,100 105,800 323,600 184,000 2,156,700
Source: Field inventory completed by Wahlstrom & Associates during the months of February and March, 2015; partial data provided by the City of Lacey Notes: (1) Area that extends from I-5 to Martin Way includes Wal-Mart Supercenter, Home Depot, Costco and other shopping centers (2) Corridor includes retail space within the City Limits (3) Includes South Sound Shopping Center (4) Area includes the Pacific and Lacey Blvd. corridor between College and Carpenter Road (5) Area includes Lowes and the Walmart Neighborhood Center (6) Data is not yet complete and only includes Cabela’s