Embed Size (px)
Citation preview
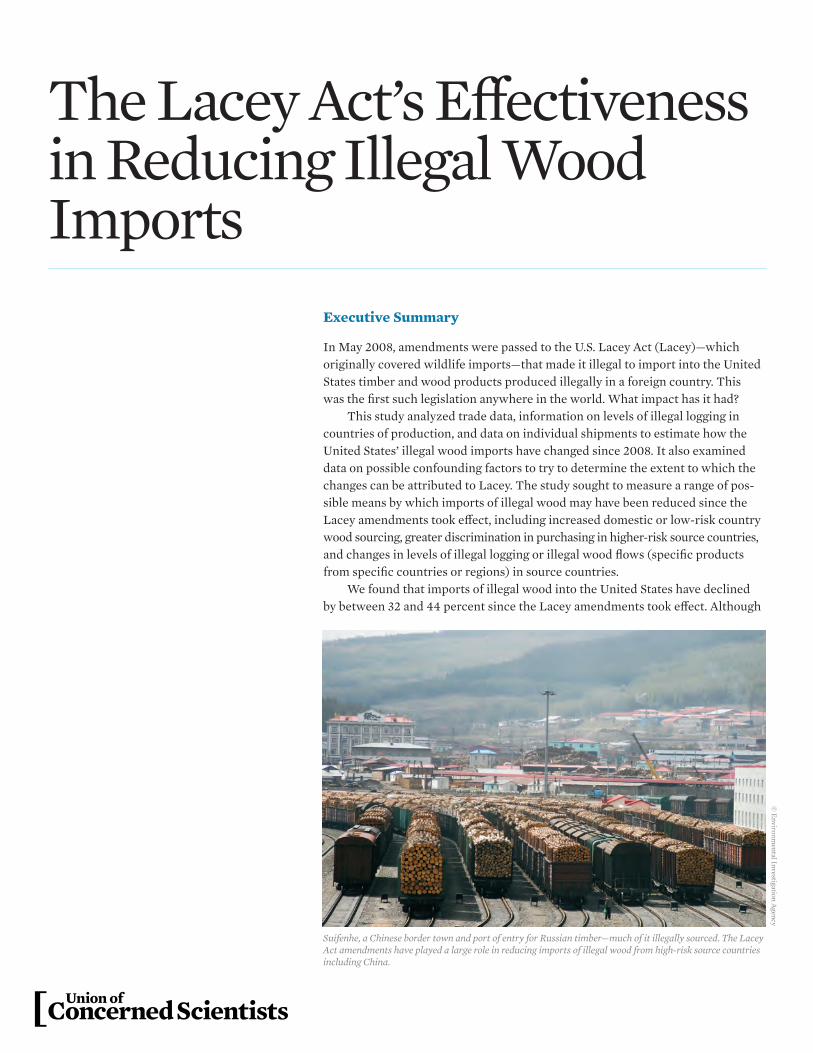
The Lacey Act’s Effectiveness in Reducing Illegal Wood Imports
Executive Summary
In May 2008, amendments were passed to the U.S. Lacey Act (Lacey)—which originally covered wildlife imports—that made it illegal to import into the United States timber and wood products produced illegally in a foreign country. This was the first such legislation anywhere in the world. What impact has it had?
This study analyzed trade data, information on levels of illegal logging in countries of production, and data on individual shipments to estimate how the United States’ illegal wood imports have changed since 2008. It also examined data on possible confounding factors to try to determine the extent to which the changes can be attributed to Lacey. The study sought to measure a range of pos-sible means by which imports of illegal wood may have been reduced since the Lacey amendments took effect, including increased domestic or low-risk country wood sourcing, greater discrimination in purchasing in higher-risk source countries, and changes in levels of illegal logging or illegal wood flows (specific products from specific countries or regions) in source countries.
We found that imports of illegal wood into the United States have declined by between 32 and 44 percent since the Lacey amendments took effect. Although
Suifenhe, a Chinese border town and port of entry for Russian timber—much of it illegally sourced. The Lacey Act amendments have played a large role in reducing imports of illegal wood from high-risk source countries including China.
© Environm
ental Investigation Agency
2 union of concerned scientists
other factors have been important, Lacey has clearly contrib-uted to this reduction. China is a major source of illegally sourced wood products imported into the United States, and China accounts for around two-thirds of the reduction esti-mated to have occurred since 2007. (Most of this reduction is due to changes in the locations where China is sourcing its timber.) However, Lacey has not prevented all imports of illegally sourced wood products. In 2013 these were estimated to have been worth $2.8 billion.
The study also found an overall decline since 2007 in the proportion of U.S. consumption of major wood products supplied by imports (with Lacey likely a contributing factor only for hardwood plywood). However, the proportion of U.S. wood imports originating in countries at high risk of illegal logging has actually increased, from 19 to 27 percent, because imports from low-risk countries were more greatly affected by the contraction in housing construction.
U.S. imports of illegal wood products. Further progress can be made by strengthening enforcement of the Lacey Act, focusing on countries and products for which substantial illegality remains.
The 2008 Lacey Act Amendments
In many timber-producing countries around the world, much of the logging that takes place is illegal. This deforestation has devastating impacts on the environment and on people who depend on forests for their livelihoods. It also robs cash-strapped governments of valuable revenues, fosters corruption, and in some cases helps fuel violent conflict. By driving deforestation and forest degradation, illegal logging is also a major contrib-utor to climate change. Undiscerning overseas demand for cheap timber helps drive this illegal logging. In 2008 the United States became the first country in the world to pass legislation to prohibit the import and sale of timber that was illegally sourced in the country of origin (Lawson and MacFaul 2010).
The U.S. Lacey Act, which previously applied only to wildlife imports, was amended on May 22, 2008, to include imports of plants. These amendments made it illegal to im-port, export, transport, sell, receive, acquire, or purchase in interstate or foreign commerce any plant (with some limited exceptions) taken or traded in violation of the laws of the United States or a U.S. state, or a relevant foreign law. The amendments also included a requirement for certain types of wood product imports to be accompanied by a declaration form giving the scientific name of the species and the country where the plant was harvested. This declaration requirement is being phased in by product over time, according to the harmonized tariff (HT) schedule product code, but the underlying prohibition has applied to all covered products since May 2008.
Under Lacey, timber is considered illegal if it was taken, possessed, transported, or sold in violation of laws that protect certain trees, relate to timber theft, or regulate the harvesting of timber in licensed areas or protected areas, including in contravention of the terms of authorized harvesting. Exam-ples of timber theft might include cutting in protected areas or stealing wood from forests owned by others. Contraven-tions of the terms of authorized harvesting include such things as cutting more trees than permitted, cutting juvenile trees, cutting in protected zones such as riverbanks, and cut-ting protected tree species. Lacey also considers timber illegal if it was exported in contravention of timber-specific export regulations and if it was harvested, possessed, transported, or sold without the payment of relevant royalties, taxes, or fees. Therefore, even if timber was legally harvested, it may be considered illegal to import into the United States if it was
Since China was estimated (prior to Lacey) to supply around two-thirds of U.S. imports of illegally sourced wood products, this study focused significant attention on that country. We found that the proportion of China’s imports of logs and sawn wood originating in high-risk countries declined dramatically—from 80 percent in 2007 to 45 percent in 2013—constituting a major factor behind the substantial decline in the amount of illegal wood in Chinese exports to the United States. Shifts in U.S. purchasing, likely due in part to Lacey, have also served to reduce estimated illegal imports from China. U.S. imports of tropical plywood from China, for instance, have fallen by 90 percent.
Additional evidence that Lacey has made a difference was found in our detailed examination of specific high-risk products from specific countries. For example, most imports of paper from Indonesia now have legality verification and come from plantations and not natural forests.
In sum, the trade data analyzed in this study indicate that the Lacey Act amendments have contributed to reducing
The proportion of China’s imports of logs and sawn wood originating in high-risk countries declined dramatically—from 80 percent in 2007 to 45 percent in 2013.
3The Lacey Act’s Effectiveness in Reducing Illegal Wood Imports
exported illegally, such as in contravention of a regulation that prohibited the export of timber as raw logs.
This report examines the extent to which this legislation has been effective in reducing imports of illegally sourced wood into the United States. We first present the results of our analysis of general trends and then summarize the results of an analysis of a sample of specific high-risk trade flows. We next give quantitative estimates of U.S. imports of illegally sourced wood and how these have changed. We end with the overall conclusions of the study.
The online appendix provides additional methodological background, analysis, and data used to inform the quantita-tive estimates and the overall conclusions. This includes a discussion of the various means by which the legislation may have served to reduce imports of illegally sourced wood and how the study measures them, an examination of possible confounding factors, and discussion of the extent to which any changes in the relevant indicators might be attributed to Lacey.
Previous studies
A study published in 2014 found a substantial reduction in U.S. imports of tropical lumber and hardwood plywood from a number of high-risk countries since Lacey took effect, and found that the prices of these products had dramatically increased (Prestemon 2014). These changes were greater
than could be explained by other possible variables (such as U.S. residential construction or relevant regulatory changes in source countries), and the quantities and prices of equivalent products from the main low-risk source country (Canada) had not similarly declined. The study concluded that there was good evidence to suggest that Lacey had been successful in reducing the amount of illegally sourced wood entering the United States.
However, although it provides a valuable starting point, the 2014 study takes a broad-brush approach that brings with it some potential pitfalls, many of which were recognized by the author. There are additional possible explanatory variables (such as changes in wood technology) that the study did not consider, and it is questionable to what extent Canadian temperate hardwood imports can be truly characterized as “equivalent” to tropical hardwood products in terms of how they are used. The study also did not attempt to estimate the extent to which changes may have occurred within high-risk wood flows, whereby the proportion of each such flow that is of illegal origin may change. This study seeks to address some of these problems.
Potential imPacts of the lacey act amendments on imPorts of illegally sourced Wood
There are a number of ways in which the Lacey Act amend-ments of 2008 may have reduced the amount of illegally
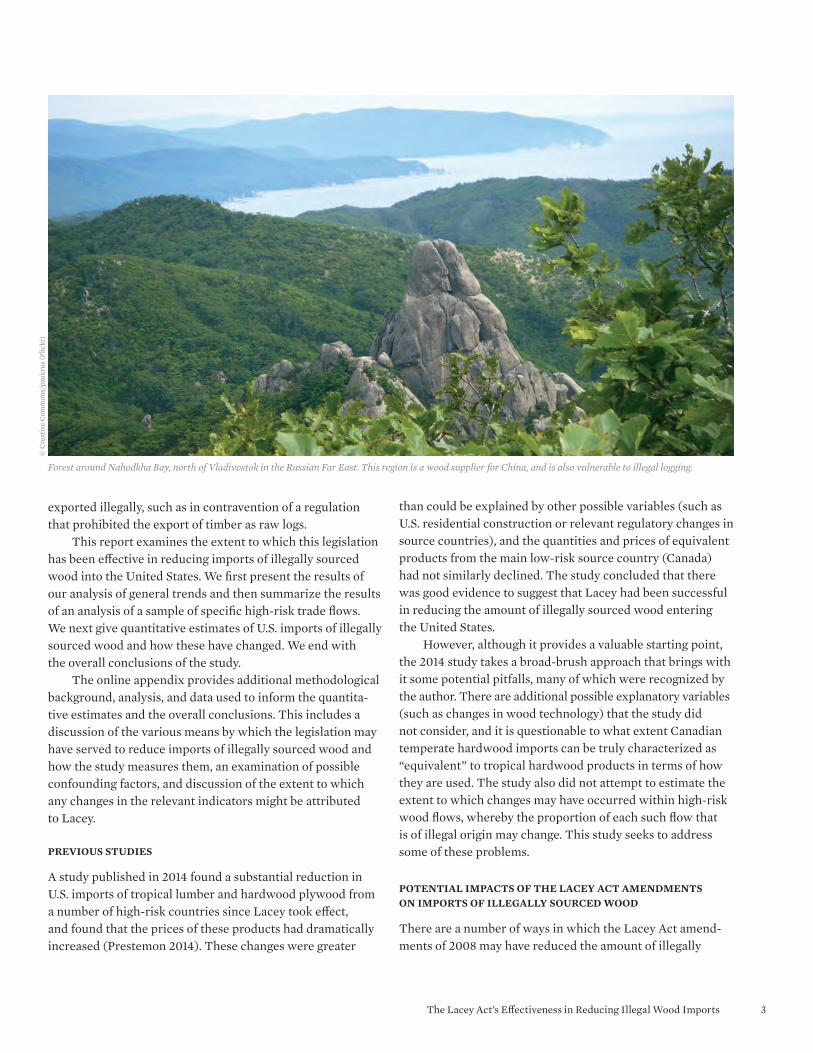
Forest around Nahodkha Bay, north of Vladivostok in the Russian Far East. This region is a wood supplier for China, and is also vulnerable to illegal logging.
© C
reat
ive
Com
mon
s/pa
ukru
s (Fl
ickr
)
4 union of concerned scientists
sourced timber that the United States imports. Given the low risk of illegality associated with domestic wood production, the first possible market response would be an overall reduc-tion in imports as a proportion of total wood consumption. A second simple response would be for imports to shift from high-risk countries to low-risk countries. Both of these pos-sible responses are easy to measure, though it is hard to deter-mine with much certainty how much any changes seen are due to Lacey as opposed to other factors.
Much harder to measure are changes within individual high-risk supply chains. There are a number of ways in which the quantity of illegally sourced wood could be reduced in a particular high-risk flow without the overall scale of the trade being reduced. Firstly, it is possible that an importer may switch to using a lower-risk wood species for a specific product imported from a given high-risk country; most often this would involve the use of a plantation-grown or imported species in place of a naturally occurring species grown locally. Secondly, even if a U.S. importer does not switch species, it is possible that it may make additional efforts to trace its supply chain and ensure that only the legal proportion of production of that species in a high-risk source is used in its products. It might do this either by shifting suppliers (to one with its own verified legal timber source, for example) or by working with the supplier to exclude the chance of illegal wood being used (perhaps making use of a third-party monitoring and verifi-cation scheme). A third possibility is that Lacey may lead (or at least contribute) to a reduction in overall levels of illegality within a specific source country. For example, a government in an affected source country may take action to reduce illegal logging partly in response to an actual or potential reduction in exports to the United States.
Product
Proportion of Consumption Supplied by Imports
2007 2011Lumber (all types) 29% 23%
Plywood (all types) 26% 23%
Plywood (hardwood only) 69% 62%
Paper 15% 12%
Table 1. Proportion of U.S. Consumption of Major Wood Products Supplied by Imports, 2007 and 2011
Source: calculaTed from conSumpTion and imporT daTa (in cubic feeT) in HowardS and weSTby 2013.
This study has attempted to measure each of these possible impacts. Further information on how it did this, and an assessment of possible confounding factors, is included in the online appendix.
General Analysis
shift to domestic Wood sourcing
The U.S. Department of Agriculture produces data on U.S. timber production, trade, and consumption. The most recent year for which data are available is 2011. For this study, the raw data for the years 2003 to 2011 for lumber, plywood, and paper have been extracted and analyzed to ascertain key trends of relevance.
For all three products, the proportion of total consump-tion being supplied by imports has declined since the Lacey amendments took effect (Table 1). In other words, domestic producers now supply a larger percentage of the market than before the Lacey amendments. The proportion of total paper supply coming from imports fell by one-quarter, while the proportion of hardwood plywood supply coming from imports fell by one-tenth.
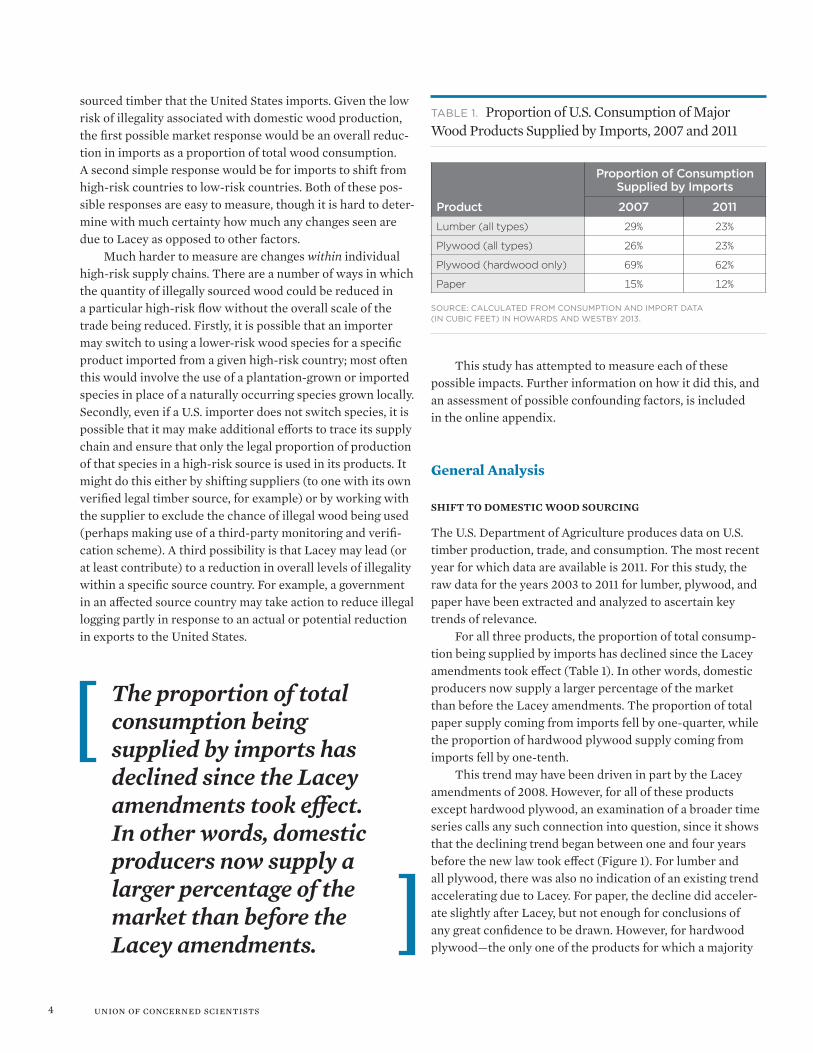
This trend may have been driven in part by the Lacey amendments of 2008. However, for all of these products except hardwood plywood, an examination of a broader time series calls any such connection into question, since it shows that the declining trend began between one and four years before the new law took effect (Figure 1). For lumber and all plywood, there was also no indication of an existing trend accelerating due to Lacey. For paper, the decline did acceler-ate slightly after Lacey, but not enough for conclusions of any great confidence to be drawn. However, for hardwood plywood—the only one of the products for which a majority
The proportion of total consumption being supplied by imports has declined since the Lacey amendments took effect. In other words, domestic producers now supply a larger percentage of the market than before the Lacey amendments.
5The Lacey Act’s Effectiveness in Reducing Illegal Wood Imports
Note: The y-axis varies and does not begin at zero.
Source: calculaTed from conSumpTion and imporT daTa (in cubic feeT) in HowardS and weSTby 2013.
figure 1. Proportion of U.S. Consumption of Specific Wood Products Being Supplied by Imports, 2003–2011
36%34%32%30%28%26%24%22%20%
75%
70%
65%
60%
55%
50%
All Lumber
Hardwood Plywood
All Plywood
Paper
2003 2004 2005 2006 2007 2008 2009 2010 20112003 2004 2005 2006 2007 2008 2009 2010 2011
2003 2004 2005 2006 2007 2008 2009 2010 2011 2003 2004 2005 2006 2007 2008 2009 2010 2011
36%34%32%30%28%26%24%22%20%
75%
70%
65%
60%
55%
50%
32%
30%
28%
26%
24%
22%
20%
18%17%16%15%14%13%12%11%10%
of consumption comes from imports—a substantial new decline did coincide with the Lacey amendments.
shift to loWer-risk source countries
This study analyzed U.S. imports of wood products from 35 countries judged to be high-risk in terms of illegally sourced wood and compared these with imports from low-risk countries. Higher-risk countries include those from tropical regions of Africa, Latin America, and Southeast Asia; and China and Russia. The analysis covers all wood products, including timber, furniture, and pulp and paper; all figures are converted to roundwood equivalent volume (RWE), a unit of measure-ment that makes the different products comparable in terms of trees cut to produce them.
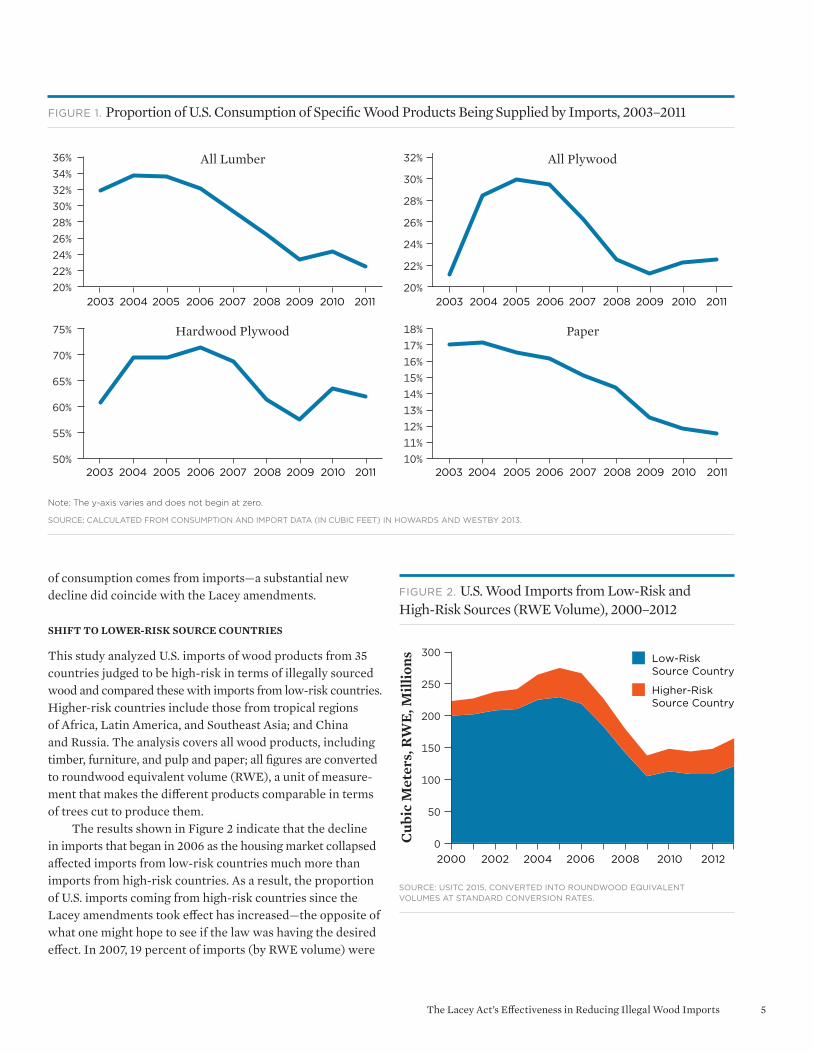
The results shown in Figure 2 indicate that the decline in imports that began in 2006 as the housing market collapsed affected imports from low-risk countries much more than imports from high-risk countries. As a result, the proportion of U.S. imports coming from high-risk countries since the Lacey amendments took effect has increased—the opposite of what one might hope to see if the law was having the desired effect. In 2007, 19 percent of imports (by RWE volume) were
figure 2. U.S. Wood Imports from Low-Risk and High-Risk Sources (RWE Volume), 2000–2012
Source: uSiTc 2015, converTed inTo roundwood equivalenT volumeS aT STandard converSion raTeS.
2000 2002 2004 2006 2008 2010 2012
Low-RiskSource Country
Higher-RiskSource Country
Cub
ic M
eter
s, R
WE
, Mill
ions
300
250
200
150
100
50
0
6 union of concerned scientists
Note: Includes all timber products (customs code 44), pulp products (47), paper and paper products (48), and wood furniture.
Source: uSiTc 2015, converTed inTo rwe volumeS aT STandard converSion raTeS.
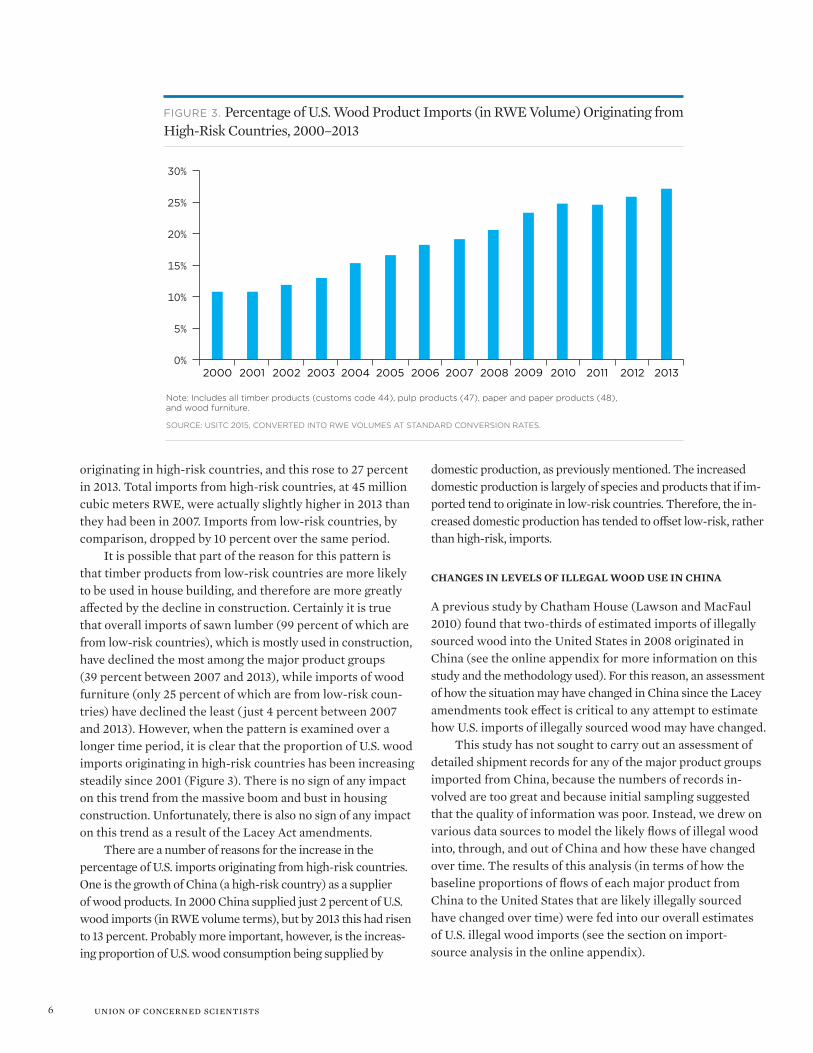
figure 3. Percentage of U.S. Wood Product Imports (in RWE Volume) Originating from High-Risk Countries, 2000–2013
2000 2001 2002 2003 2004 2005 2006 2007 2008 2009 2010 2011 2012 2013
30%
25%
20%
15%
10%
5%
0%
30%
25%
20%
15%
10%
5%
0%
originating in high-risk countries, and this rose to 27 percent in 2013. Total imports from high-risk countries, at 45 million cubic meters RWE, were actually slightly higher in 2013 than they had been in 2007. Imports from low-risk countries, by comparison, dropped by 10 percent over the same period.
It is possible that part of the reason for this pattern is that timber products from low-risk countries are more likely to be used in house building, and therefore are more greatly affected by the decline in construction. Certainly it is true that overall imports of sawn lumber (99 percent of which are from low-risk countries), which is mostly used in construction, have declined the most among the major product groups (39 percent between 2007 and 2013), while imports of wood furniture (only 25 percent of which are from low-risk coun-tries) have declined the least ( just 4 percent between 2007 and 2013). However, when the pattern is examined over a longer time period, it is clear that the proportion of U.S. wood imports originating in high-risk countries has been increasing steadily since 2001 (Figure 3). There is no sign of any impact on this trend from the massive boom and bust in housing construction. Unfortunately, there is also no sign of any impact on this trend as a result of the Lacey Act amendments.
There are a number of reasons for the increase in the percentage of U.S. imports originating from high-risk countries. One is the growth of China (a high-risk country) as a supplier of wood products. In 2000 China supplied just 2 percent of U.S. wood imports (in RWE volume terms), but by 2013 this had risen to 13 percent. Probably more important, however, is the increas-ing proportion of U.S. wood consumption being supplied by
domestic production, as previously mentioned. The increased domestic production is largely of species and products that if im-ported tend to originate in low-risk countries. Therefore, the in-creased domestic production has tended to offset low-risk, rather than high-risk, imports.
changes in levels of illegal Wood use in china
A previous study by Chatham House (Lawson and MacFaul 2010) found that two-thirds of estimated imports of illegally sourced wood into the United States in 2008 originated in China (see the online appendix for more information on this study and the methodology used). For this reason, an assessment of how the situation may have changed in China since the Lacey amendments took effect is critical to any attempt to estimate how U.S. imports of illegally sourced wood may have changed.
This study has not sought to carry out an assessment of detailed shipment records for any of the major product groups imported from China, because the numbers of records in-volved are too great and because initial sampling suggested that the quality of information was poor. Instead, we drew on various data sources to model the likely flows of illegal wood into, through, and out of China and how these have changed over time. The results of this analysis (in terms of how the baseline proportions of flows of each major product from China to the United States that are likely illegally sourced have changed over time) were fed into our overall estimates of U.S. illegal wood imports (see the section on import- source analysis in the online appendix).
7The Lacey Act’s Effectiveness in Reducing Illegal Wood Imports
Growth in Chinese imports of Low-risk timber
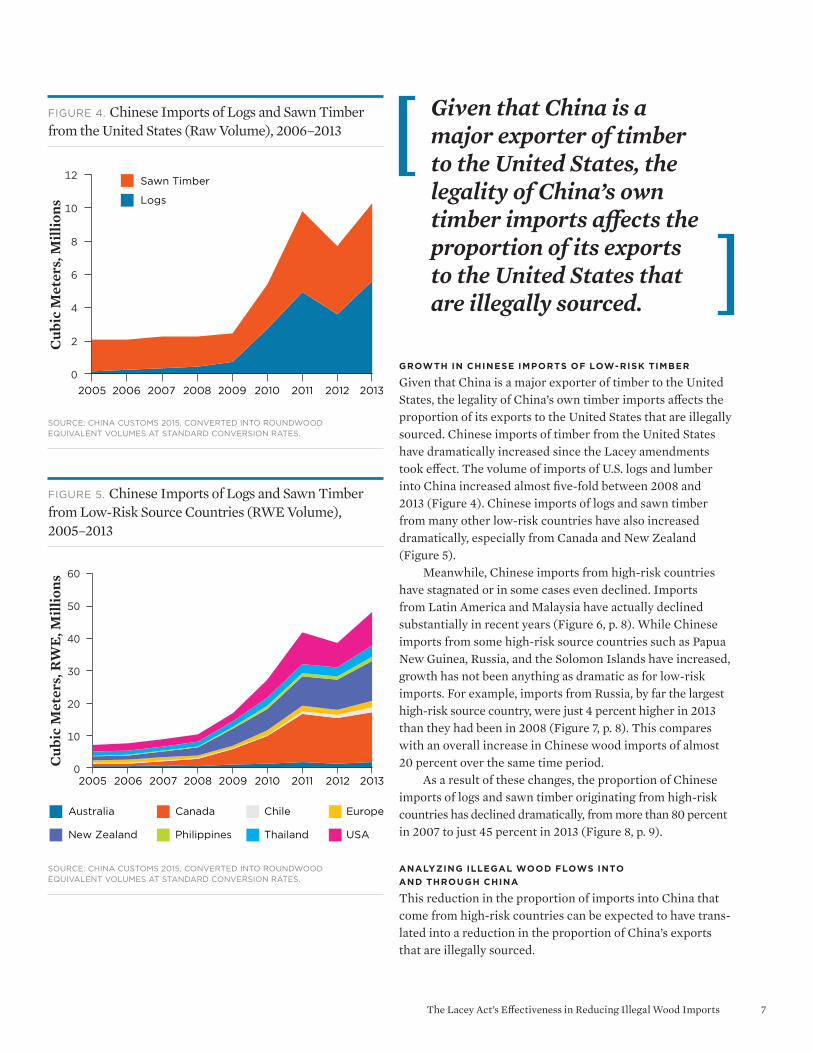
Given that China is a major exporter of timber to the United States, the legality of China’s own timber imports affects the proportion of its exports to the United States that are illegally sourced. Chinese imports of timber from the United States have dramatically increased since the Lacey amendments took effect. The volume of imports of U.S. logs and lumber into China increased almost five-fold between 2008 and 2013 (Figure 4). Chinese imports of logs and sawn timber from many other low-risk countries have also increased dramatically, especially from Canada and New Zealand (Figure 5).
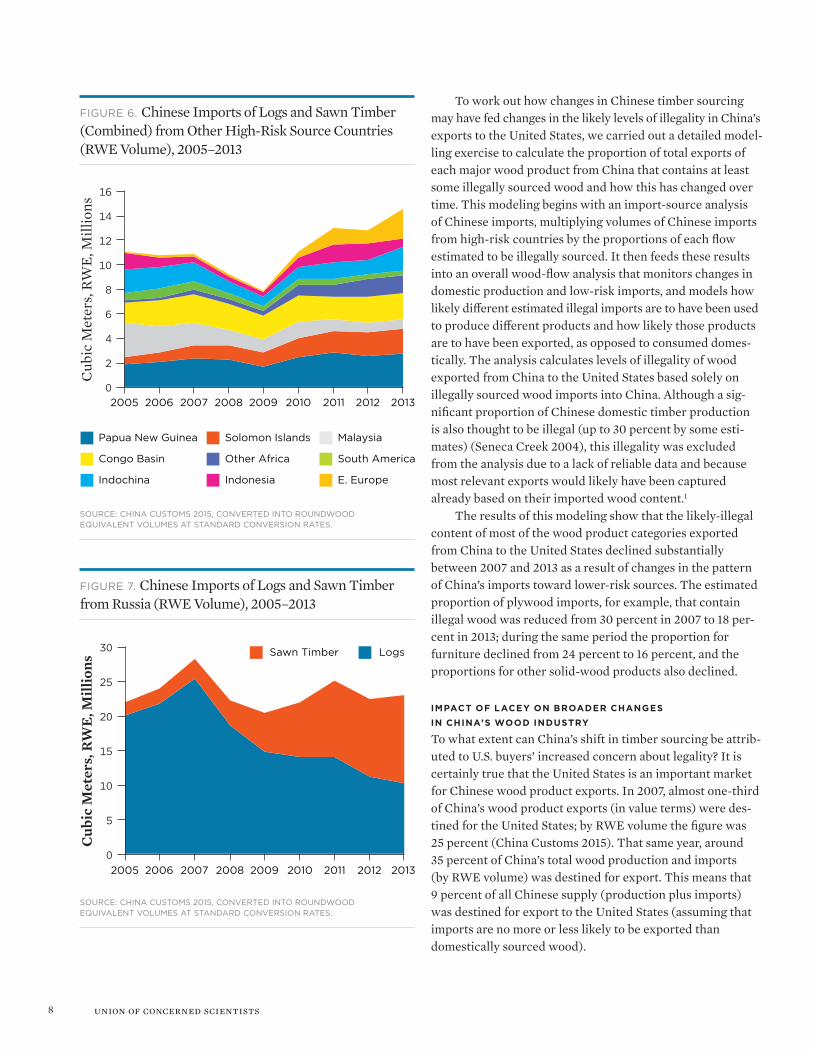
Meanwhile, Chinese imports from high-risk countries have stagnated or in some cases even declined. Imports from Latin America and Malaysia have actually declined substantially in recent years (Figure 6, p. 8). While Chinese imports from some high-risk source countries such as Papua New Guinea, Russia, and the Solomon Islands have increased, growth has not been anything as dramatic as for low-risk imports. For example, imports from Russia, by far the largest high-risk source country, were just 4 percent higher in 2013 than they had been in 2008 (Figure 7, p. 8). This compares with an overall increase in Chinese wood imports of almost 20 percent over the same time period.
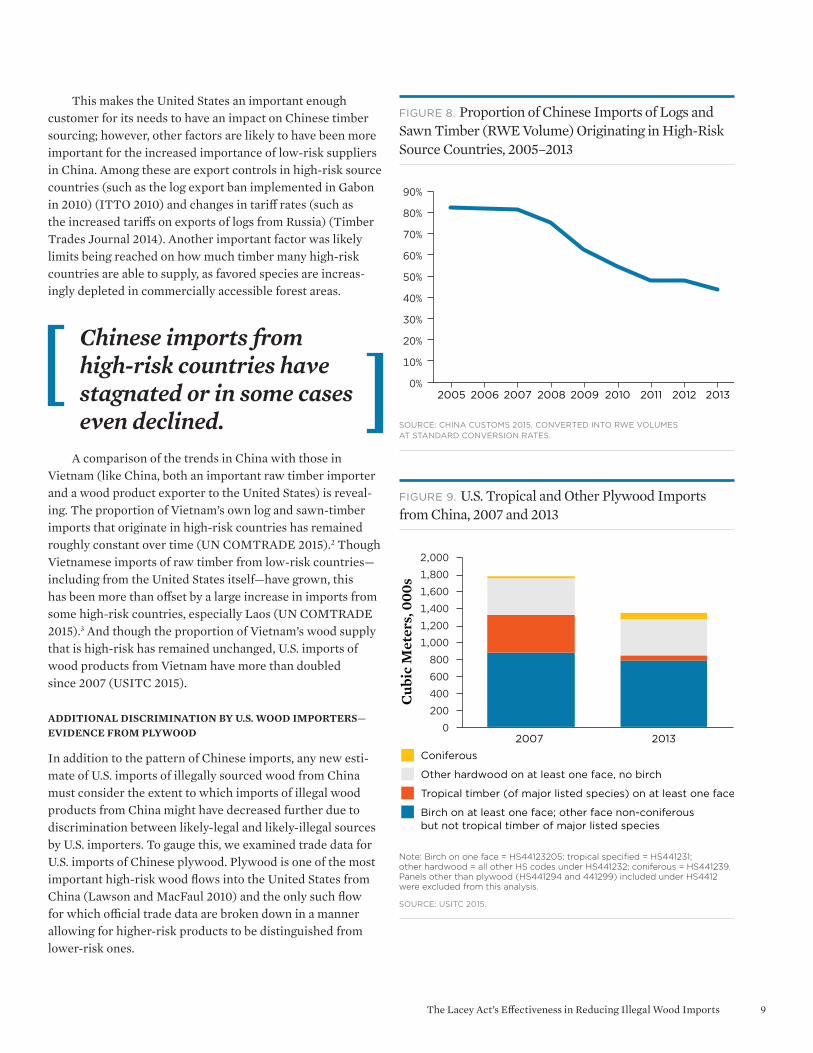
As a result of these changes, the proportion of Chinese imports of logs and sawn timber originating from high-risk countries has declined dramatically, from more than 80 percent in 2007 to just 45 percent in 2013 (Figure 8, p. 9).
AnALyzinG iLLeGAL wood fLows into And throuGh ChinA
This reduction in the proportion of imports into China that come from high-risk countries can be expected to have trans-lated into a reduction in the proportion of China’s exports that are illegally sourced.
figure 4. Chinese Imports of Logs and Sawn Timber from the United States (Raw Volume), 2006–2013
Source: cHina cuSTomS 2015, converTed inTo roundwood equivalenT volumeS aT STandard converSion raTeS.
12
10
8
6
4
2
02005 2006 2007 2008 2009 2010 2011 2012 2013
Cub
ic M
eter
s, M
illio
ns
Sawn Timber
Logs
figure 5. Chinese Imports of Logs and Sawn Timber from Low-Risk Source Countries (RWE Volume), 2005–2013
Source: cHina cuSTomS 2015, converTed inTo roundwood equivalenT volumeS aT STandard converSion raTeS.
60
50
40
30
20
10
0
Australia Canada Chile Europe
New Zealand Philippines Thailand USA
Cub
ic M
eter
s, R
WE
, Mill
ions
2005 2006 2007 2008 2009 2010 2011 2012 2013
Given that China is a major exporter of timber to the United States, the legality of China’s own timber imports affects the proportion of its exports to the United States that are illegally sourced.
8 union of concerned scientists
figure 6. Chinese Imports of Logs and Sawn Timber (Combined) from Other High-Risk Source Countries (RWE Volume), 2005–2013
Cub
ic M
eter
s, R
WE
, Mill
ions
16
14
12
10
8
6
4
2
02005 2006 2007 2008 2009 2010 2011 2012 2013
Solomon Islands Malaysia
Other Africa South America
Indonesia E. Europe
Papua New Guinea
Congo Basin
Indochina
16
14
12
10
8
6
4
2
0
Source: cHina cuSTomS 2015, converTed inTo roundwood equivalenT volumeS aT STandard converSion raTeS.
Cub
ic M
eter
s, R
WE
, Mill
ions
30
25
20
15
10
5
02005 2006 2007 2008 2009 2010 2011 2012 2013
Sawn Timber Logs30
25
20
15
10
5
0
figure 7. Chinese Imports of Logs and Sawn Timber from Russia (RWE Volume), 2005–2013
Source: cHina cuSTomS 2015, converTed inTo roundwood equivalenT volumeS aT STandard converSion raTeS.
To work out how changes in Chinese timber sourcing may have fed changes in the likely levels of illegality in China’s exports to the United States, we carried out a detailed model-ling exercise to calculate the proportion of total exports of each major wood product from China that contains at least some illegally sourced wood and how this has changed over time. This modeling begins with an import-source analysis of Chinese imports, multiplying volumes of Chinese imports from high-risk countries by the proportions of each flow estimated to be illegally sourced. It then feeds these results into an overall wood-flow analysis that monitors changes in domestic production and low-risk imports, and models how likely different estimated illegal imports are to have been used to produce different products and how likely those products are to have been exported, as opposed to consumed domes- tically. The analysis calculates levels of illegality of wood exported from China to the United States based solely on illegally sourced wood imports into China. Although a sig-nificant proportion of Chinese domestic timber production is also thought to be illegal (up to 30 percent by some esti-mates) (Seneca Creek 2004), this illegality was excluded from the analysis due to a lack of reliable data and because most relevant exports would likely have been captured already based on their imported wood content.1
The results of this modeling show that the likely-illegal content of most of the wood product categories exported from China to the United States declined substantially between 2007 and 2013 as a result of changes in the pattern of China’s imports toward lower-risk sources. The estimated proportion of plywood imports, for example, that contain illegal wood was reduced from 30 percent in 2007 to 18 per-cent in 2013; during the same period the proportion for furniture declined from 24 percent to 16 percent, and the proportions for other solid-wood products also declined.
impACt of LACey on broAder ChAnGes in ChinA’s wood industry
To what extent can China’s shift in timber sourcing be attrib-uted to U.S. buyers’ increased concern about legality? It is certainly true that the United States is an important market for Chinese wood product exports. In 2007, almost one-third of China’s wood product exports (in value terms) were des-tined for the United States; by RWE volume the figure was 25 percent (China Customs 2015). That same year, around 35 percent of China’s total wood production and imports (by RWE volume) was destined for export. This means that 9 percent of all Chinese supply (production plus imports) was destined for export to the United States (assuming that imports are no more or less likely to be exported than domestically sourced wood).
9The Lacey Act’s Effectiveness in Reducing Illegal Wood Imports
This makes the United States an important enough customer for its needs to have an impact on Chinese timber sourcing; however, other factors are likely to have been more important for the increased importance of low-risk suppliers in China. Among these are export controls in high-risk source countries (such as the log export ban implemented in Gabon in 2010) (ITTO 2010) and changes in tariff rates (such as the increased tariffs on exports of logs from Russia) (Timber Trades Journal 2014). Another important factor was likely limits being reached on how much timber many high-risk countries are able to supply, as favored species are increas-ingly depleted in commercially accessible forest areas.
figure 9. U.S. Tropical and Other Plywood Imports from China, 2007 and 2013
2,000
1,800
1,600
1,400
1,200
1,000
800
600
400
200
02007 2013
Cub
ic M
eter
s, 0
00s
Coniferous
Other hardwood on at least one face, no birch
Tropical timber (of major listed species) on at least one face
Birch on at least one face; other face non-coniferous but not tropical timber of major listed species
2,000
1,800
1,600
1,400
1,200
1,000
800
600
400
200
0
Note: Birch on one face = HS44123205; tropical specified = HS441231; other hardwood = all other HS codes under HS441232; coniferous = HS441239. Panels other than plywood (HS441294 and 441299) included under HS4412 were excluded from this analysis.
Source: uSiTc 2015.
figure 8. Proportion of Chinese Imports of Logs and Sawn Timber (RWE Volume) Originating in High-Risk Source Countries, 2005–2013
2005 2006 2007 2008 2009 2010 2011 2012 2013
90%
80%
70%
60%
50%
40%
30%
20%
10%
0%
90%
80%
70%
60%
50%
40%
30%
20%
10%
0%
Source: cHina cuSTomS 2015, converTed inTo rwe volumeS aT STandard converSion raTeS.
Chinese imports from high-risk countries have stagnated or in some cases even declined.
A comparison of the trends in China with those in Vietnam (like China, both an important raw timber importer and a wood product exporter to the United States) is reveal-ing. The proportion of Vietnam’s own log and sawn-timber imports that originate in high-risk countries has remained roughly constant over time (UN COMTRADE 2015).2 Though Vietnamese imports of raw timber from low-risk countries—including from the United States itself—have grown, this has been more than offset by a large increase in imports from some high-risk countries, especially Laos (UN COMTRADE 2015).3 And though the proportion of Vietnam’s wood supply that is high-risk has remained unchanged, U.S. imports of wood products from Vietnam have more than doubled since 2007 (USITC 2015).
additional discrimination by u.s. Wood imPorters—evidence from PlyWood
In addition to the pattern of Chinese imports, any new esti-mate of U.S. imports of illegally sourced wood from China must consider the extent to which imports of illegal wood products from China might have decreased further due to discrimination between likely-legal and likely-illegal sources by U.S. importers. To gauge this, we examined trade data for U.S. imports of Chinese plywood. Plywood is one of the most important high-risk wood flows into the United States from China (Lawson and MacFaul 2010) and the only such flow for which official trade data are broken down in a manner allowing for higher-risk products to be distinguished from lower-risk ones.
10 union of concerned scientists
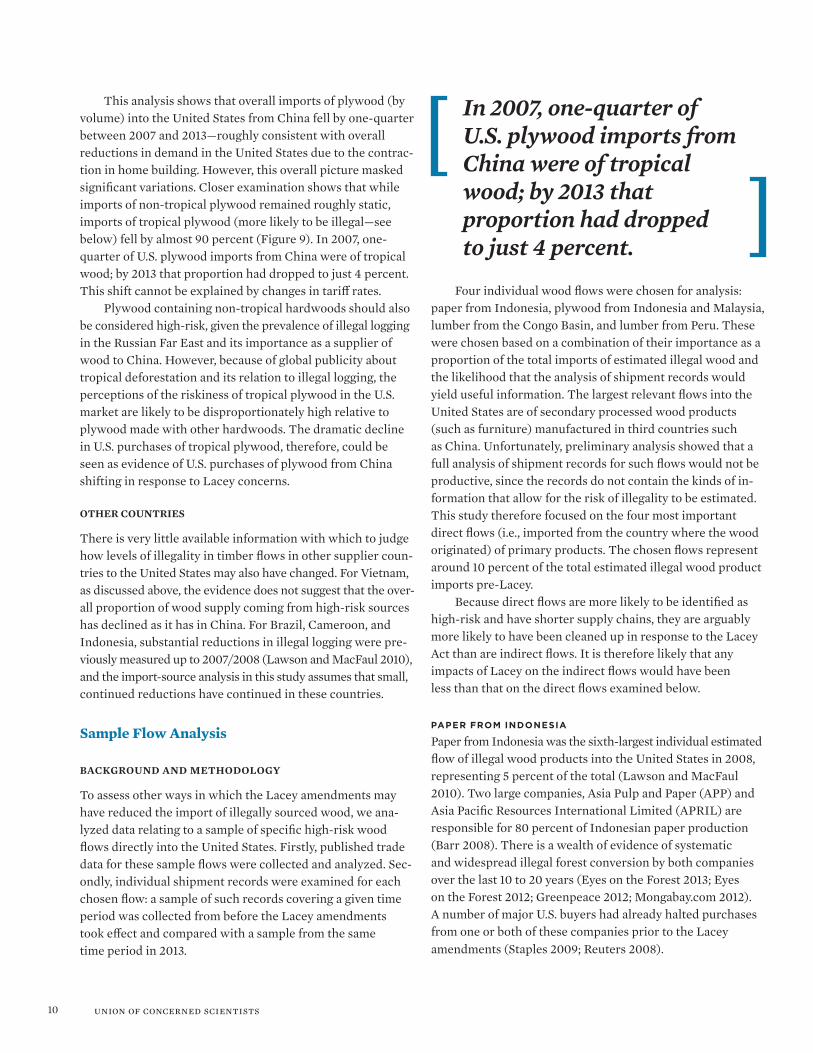
This analysis shows that overall imports of plywood (by volume) into the United States from China fell by one-quarter between 2007 and 2013—roughly consistent with overall reductions in demand in the United States due to the contrac-tion in home building. However, this overall picture masked significant variations. Closer examination shows that while imports of non-tropical plywood remained roughly static, imports of tropical plywood (more likely to be illegal—see below) fell by almost 90 percent (Figure 9). In 2007, one-quarter of U.S. plywood imports from China were of tropical wood; by 2013 that proportion had dropped to just 4 percent. This shift cannot be explained by changes in tariff rates.
Plywood containing non-tropical hardwoods should also be considered high-risk, given the prevalence of illegal logging in the Russian Far East and its importance as a supplier of wood to China. However, because of global publicity about tropical deforestation and its relation to illegal logging, the perceptions of the riskiness of tropical plywood in the U.S. market are likely to be disproportionately high relative to plywood made with other hardwoods. The dramatic decline in U.S. purchases of tropical plywood, therefore, could be seen as evidence of U.S. purchases of plywood from China shifting in response to Lacey concerns.
other countries
There is very little available information with which to judge how levels of illegality in timber flows in other supplier coun-tries to the United States may also have changed. For Vietnam, as discussed above, the evidence does not suggest that the over-all proportion of wood supply coming from high-risk sources has declined as it has in China. For Brazil, Cameroon, and Indonesia, substantial reductions in illegal logging were pre-viously measured up to 2007/2008 (Lawson and MacFaul 2010), and the import-source analysis in this study assumes that small, continued reductions have continued in these countries.
Sample Flow Analysis
background and methodology
To assess other ways in which the Lacey amendments may have reduced the import of illegally sourced wood, we ana-lyzed data relating to a sample of specific high-risk wood flows directly into the United States. Firstly, published trade data for these sample flows were collected and analyzed. Sec-ondly, individual shipment records were examined for each chosen flow: a sample of such records covering a given time period was collected from before the Lacey amendments took effect and compared with a sample from the same time period in 2013.
Four individual wood flows were chosen for analysis: paper from Indonesia, plywood from Indonesia and Malaysia, lumber from the Congo Basin, and lumber from Peru. These were chosen based on a combination of their importance as a proportion of the total imports of estimated illegal wood and the likelihood that the analysis of shipment records would yield useful information. The largest relevant flows into the United States are of secondary processed wood products (such as furniture) manufactured in third countries such as China. Unfortunately, preliminary analysis showed that a full analysis of shipment records for such flows would not be productive, since the records do not contain the kinds of in-formation that allow for the risk of illegality to be estimated. This study therefore focused on the four most important direct flows (i.e., imported from the country where the wood originated) of primary products. The chosen flows represent around 10 percent of the total estimated illegal wood product imports pre-Lacey.
Because direct flows are more likely to be identified as high-risk and have shorter supply chains, they are arguably more likely to have been cleaned up in response to the Lacey Act than are indirect flows. It is therefore likely that any impacts of Lacey on the indirect flows would have been less than that on the direct flows examined below.
pAper from indonesiA
Paper from Indonesia was the sixth-largest individual estimated flow of illegal wood products into the United States in 2008, representing 5 percent of the total (Lawson and MacFaul 2010). Two large companies, Asia Pulp and Paper (APP) and Asia Pacific Resources International Limited (APRIL) are responsible for 80 percent of Indonesian paper production (Barr 2008). There is a wealth of evidence of systematic and widespread illegal forest conversion by both companies over the last 10 to 20 years (Eyes on the Forest 2013; Eyes on the Forest 2012; Greenpeace 2012; Mongabay.com 2012). A number of major U.S. buyers had already halted purchases from one or both of these companies prior to the Lacey amendments (Staples 2009; Reuters 2008).
In 2007, one-quarter of U.S. plywood imports from China were of tropical wood; by 2013 that proportion had dropped to just 4 percent.
11The Lacey Act’s Effectiveness in Reducing Illegal Wood Imports
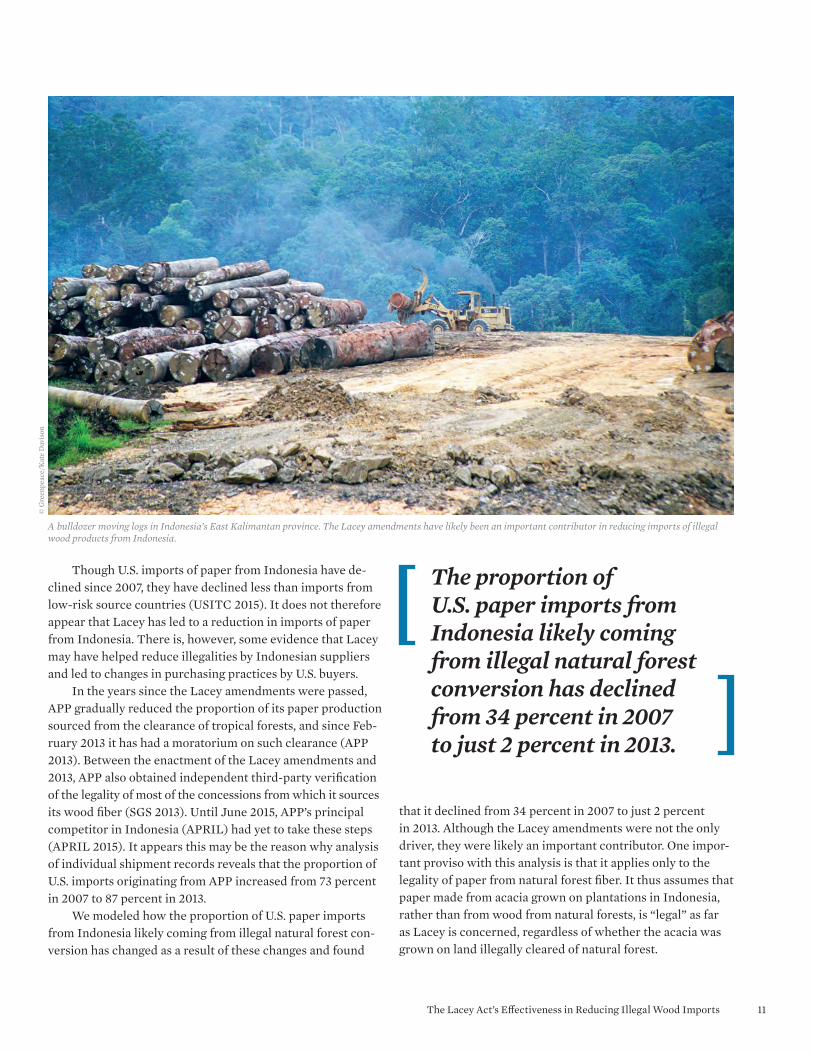
Though U.S. imports of paper from Indonesia have de-clined since 2007, they have declined less than imports from low-risk source countries (USITC 2015). It does not therefore appear that Lacey has led to a reduction in imports of paper from Indonesia. There is, however, some evidence that Lacey may have helped reduce illegalities by Indonesian suppliers and led to changes in purchasing practices by U.S. buyers.
In the years since the Lacey amendments were passed, APP gradually reduced the proportion of its paper production sourced from the clearance of tropical forests, and since Feb-ruary 2013 it has had a moratorium on such clearance (APP 2013). Between the enactment of the Lacey amendments and 2013, APP also obtained independent third-party verification of the legality of most of the concessions from which it sources its wood fiber (SGS 2013). Until June 2015, APP’s principal competitor in Indonesia (APRIL) had yet to take these steps (APRIL 2015). It appears this may be the reason why analysis of individual shipment records reveals that the proportion of U.S. imports originating from APP increased from 73 percent in 2007 to 87 percent in 2013.
We modeled how the proportion of U.S. paper imports from Indonesia likely coming from illegal natural forest con-version has changed as a result of these changes and found
that it declined from 34 percent in 2007 to just 2 percent in 2013. Although the Lacey amendments were not the only driver, they were likely an important contributor. One impor-tant proviso with this analysis is that it applies only to the legality of paper from natural forest fiber. It thus assumes that paper made from acacia grown on plantations in Indonesia, rather than from wood from natural forests, is “legal” as far as Lacey is concerned, regardless of whether the acacia was grown on land illegally cleared of natural forest.
The proportion of U.S. paper imports from Indonesia likely coming from illegal natural forest conversion has declined from 34 percent in 2007 to just 2 percent in 2013.
© G
reen
peac
e/K
ate
Dav
ison
A bulldozer moving logs in Indonesia’s East Kalimantan province. The Lacey amendments have likely been an important contributor in reducing imports of illegal wood products from Indonesia.
12 union of concerned scientists
pLywood from indonesiA And mALAysiA
A Chatham House report in 2010 estimated that 40 to 61 percent of all logging in Indonesia and 14 to 25 percent of all logging in Malaysia was illegal (Lawson and MacFaul 2010). The same report found that illegal logging had declined dramatically in Indonesia in the early 2000s; it did not find any evidence of a decline in Malaysia. Though no new national measurements of the problem in either country have been made in recent years, case studies demonstrate that illegal logging remains a serious problem. The Chatham House estimate of U.S. imports of illegally sourced wood published in 2010 found that around 4 percent of all illegally sourced wood imports in 2008 was plywood from Indonesia and Malaysia, making it the tenth-largest flow of estimated illegal wood products into the United States.
Combined imports from the two countries have declined in a manner consistent with reductions in overall demand in the United States. Given continuing evidence of widespread illegality and governance issues in both countries, the fact that overall imports have not declined any more than might be explained by other factors suggests that Lacey has had a limited impact in this area. Other evidence of a limited impact
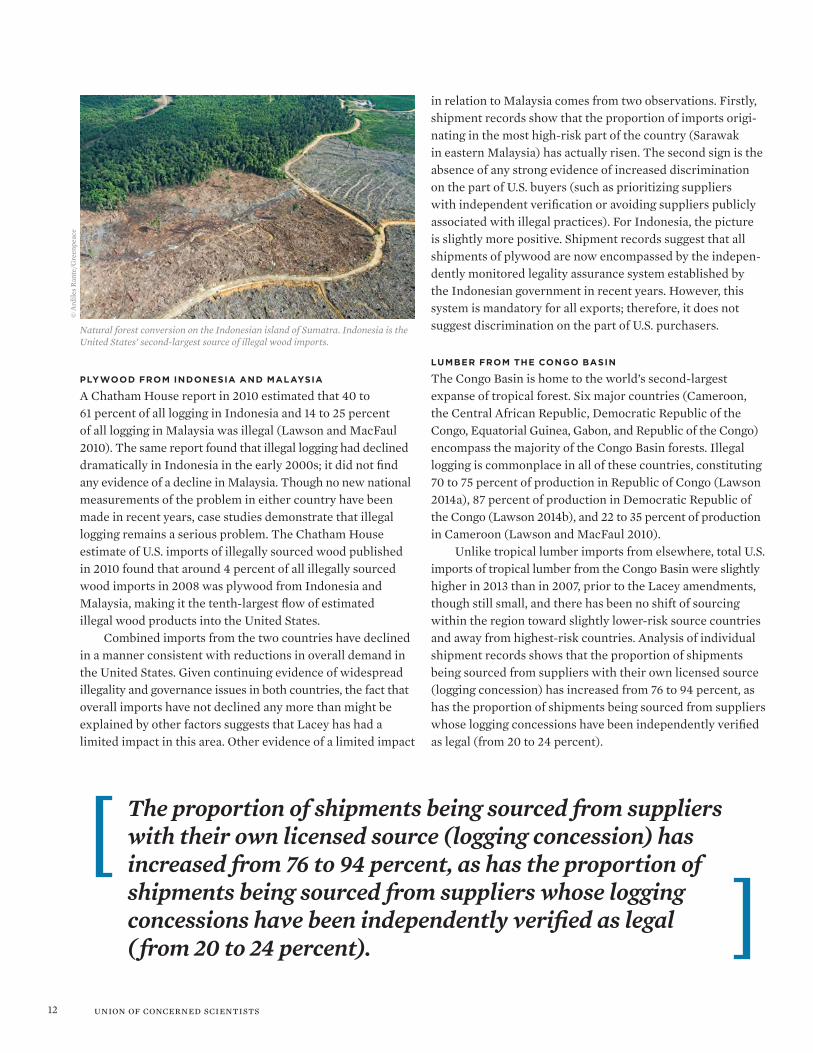
in relation to Malaysia comes from two observations. Firstly, shipment records show that the proportion of imports origi-nating in the most high-risk part of the country (Sarawak in eastern Malaysia) has actually risen. The second sign is the absence of any strong evidence of increased discrimination on the part of U.S. buyers (such as prioritizing suppliers with independent verification or avoiding suppliers publicly associated with illegal practices). For Indonesia, the picture is slightly more positive. Shipment records suggest that all shipments of plywood are now encompassed by the indepen-dently monitored legality assurance system established by the Indonesian government in recent years. However, this system is mandatory for all exports; therefore, it does not suggest discrimination on the part of U.S. purchasers.
Lumber from the ConGo bAsin
The Congo Basin is home to the world’s second-largest expanse of tropical forest. Six major countries (Cameroon, the Central African Republic, Democratic Republic of the Congo, Equatorial Guinea, Gabon, and Republic of the Congo) encompass the majority of the Congo Basin forests. Illegal logging is commonplace in all of these countries, constituting 70 to 75 percent of production in Republic of Congo (Lawson 2014a), 87 percent of production in Democratic Republic of the Congo (Lawson 2014b), and 22 to 35 percent of production in Cameroon (Lawson and MacFaul 2010).
Unlike tropical lumber imports from elsewhere, total U.S. imports of tropical lumber from the Congo Basin were slightly higher in 2013 than in 2007, prior to the Lacey amendments, though still small, and there has been no shift of sourcing within the region toward slightly lower-risk source countries and away from highest-risk countries. Analysis of individual shipment records shows that the proportion of shipments being sourced from suppliers with their own licensed source (logging concession) has increased from 76 to 94 percent, as has the proportion of shipments being sourced from suppliers whose logging concessions have been independently verified as legal (from 20 to 24 percent).
The proportion of shipments being sourced from suppliers with their own licensed source (logging concession) has increased from 76 to 94 percent, as has the proportion of shipments being sourced from suppliers whose logging concessions have been independently verified as legal ( from 20 to 24 percent).
Natural forest conversion on the Indonesian island of Sumatra. Indonesia is the United States’ second-largest source of illegal wood imports.
© A
rdile
s Ran
te/G
reen
peac
e
13The Lacey Act’s Effectiveness in Reducing Illegal Wood Imports
While a small increase in the proportion of shipments coming from independently verified suppliers suggests at first glance a positive impact from Lacey, a broader examination of relevant data contradicts this. In fact, the proportion of U.S. imports of Congo Basin lumber that are from verified suppliers has increased less rapidly than the proportion of total harvest area within the region that is verified. This suggests that U.S. buyers are on average less likely to buy verified wood than buyers from elsewhere.
In summary, the evidence of a significant effect of Lacey on imports of illegally sourced sawn tropical timber from the Congo Basin is limited.
Lumber from peru
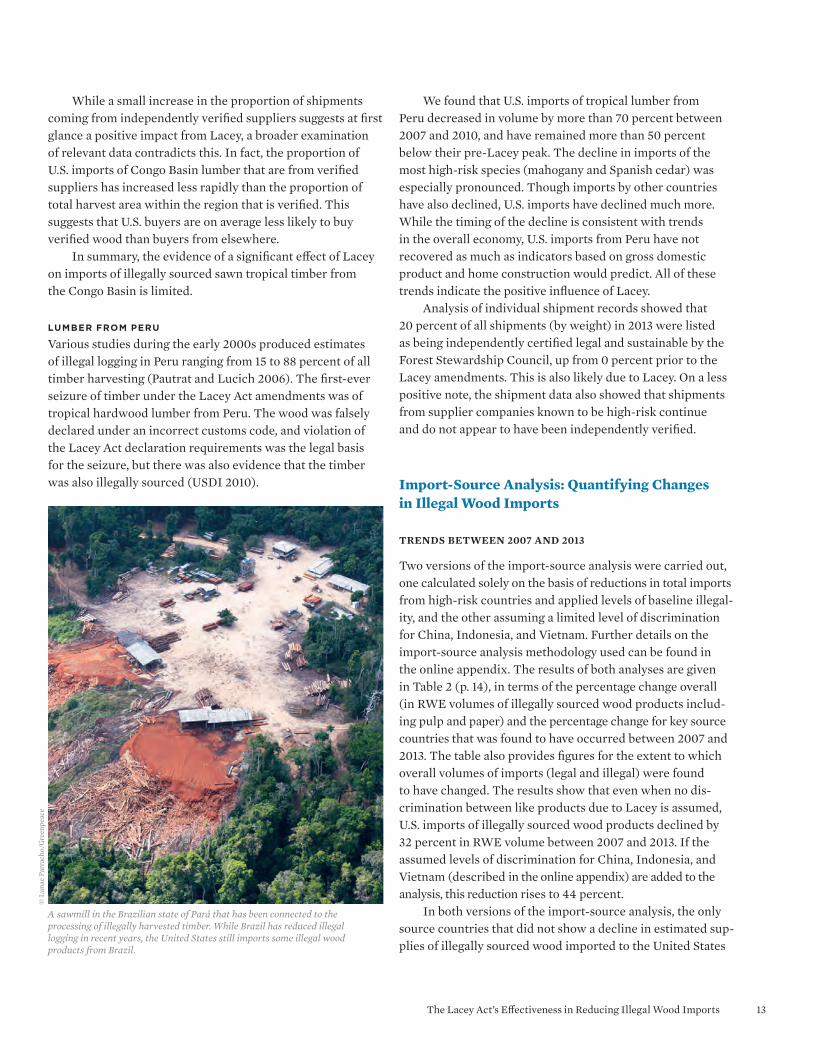
Various studies during the early 2000s produced estimates of illegal logging in Peru ranging from 15 to 88 percent of all timber harvesting (Pautrat and Lucich 2006). The first-ever seizure of timber under the Lacey Act amendments was of tropical hardwood lumber from Peru. The wood was falsely declared under an incorrect customs code, and violation of the Lacey Act declaration requirements was the legal basis for the seizure, but there was also evidence that the timber was also illegally sourced (USDI 2010).
We found that U.S. imports of tropical lumber from Peru decreased in volume by more than 70 percent between 2007 and 2010, and have remained more than 50 percent below their pre-Lacey peak. The decline in imports of the most high-risk species (mahogany and Spanish cedar) was especially pronounced. Though imports by other countries have also declined, U.S. imports have declined much more. While the timing of the decline is consistent with trends in the overall economy, U.S. imports from Peru have not recovered as much as indicators based on gross domestic product and home construction would predict. All of these trends indicate the positive influence of Lacey.
Analysis of individual shipment records showed that 20 percent of all shipments (by weight) in 2013 were listed as being independently certified legal and sustainable by the Forest Stewardship Council, up from 0 percent prior to the Lacey amendments. This is also likely due to Lacey. On a less positive note, the shipment data also showed that shipments from supplier companies known to be high-risk continue and do not appear to have been independently verified.
Import-Source Analysis: Quantifying Changes in Illegal Wood Imports
trends betWeen 2007 and 2013
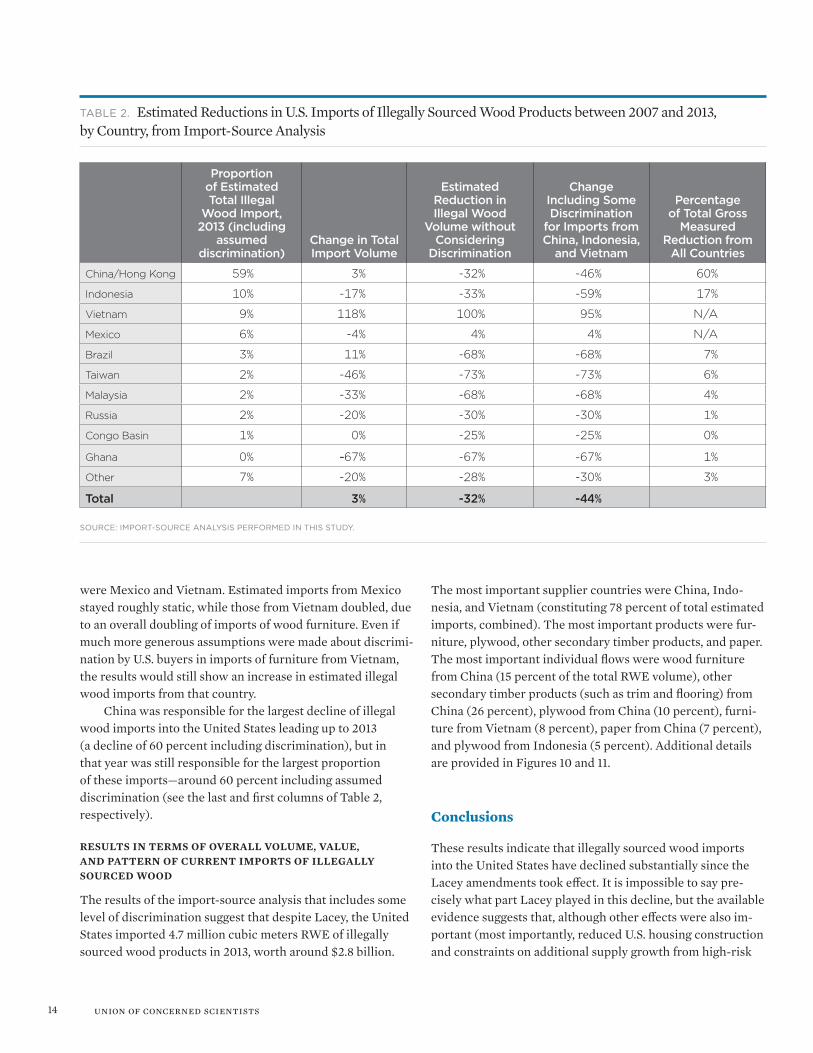
Two versions of the import-source analysis were carried out, one calculated solely on the basis of reductions in total imports from high-risk countries and applied levels of baseline illegal-ity, and the other assuming a limited level of discrimination for China, Indonesia, and Vietnam. Further details on the import-source analysis methodology used can be found in the online appendix. The results of both analyses are given in Table 2 (p. 14), in terms of the percentage change overall (in RWE volumes of illegally sourced wood products includ-ing pulp and paper) and the percentage change for key source countries that was found to have occurred between 2007 and 2013. The table also provides figures for the extent to which overall volumes of imports (legal and illegal) were found to have changed. The results show that even when no dis-crimination between like products due to Lacey is assumed, U.S. imports of illegally sourced wood products declined by 32 percent in RWE volume between 2007 and 2013. If the assumed levels of discrimination for China, Indonesia, and Vietnam (described in the online appendix) are added to the analysis, this reduction rises to 44 percent.
In both versions of the import-source analysis, the only source countries that did not show a decline in estimated sup-plies of illegally sourced wood imported to the United States
A sawmill in the Brazilian state of Pará that has been connected to the processing of illegally harvested timber. While Brazil has reduced illegal logging in recent years, the United States still imports some illegal wood products from Brazil.
© L
unae
Par
rach
o/G
reen
peac
e
14 union of concerned scientists
were Mexico and Vietnam. Estimated imports from Mexico stayed roughly static, while those from Vietnam doubled, due to an overall doubling of imports of wood furniture. Even if much more generous assumptions were made about discrimi-nation by U.S. buyers in imports of furniture from Vietnam, the results would still show an increase in estimated illegal wood imports from that country.
China was responsible for the largest decline of illegal wood imports into the United States leading up to 2013 (a decline of 60 percent including discrimination), but in that year was still responsible for the largest proportion of these imports—around 60 percent including assumed discrimination (see the last and first columns of Table 2, respectively).
results in terms of overall volume, value, and Pattern of current imPorts of illegally sourced Wood
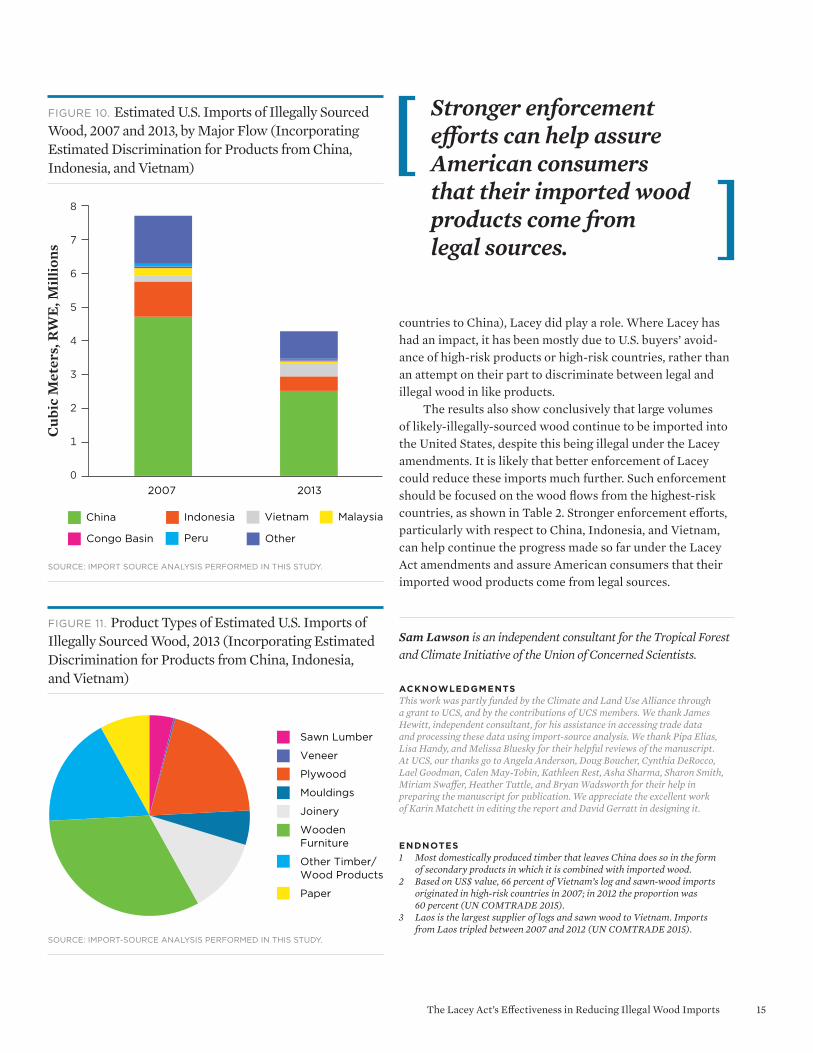
The results of the import-source analysis that includes some level of discrimination suggest that despite Lacey, the United States imported 4.7 million cubic meters RWE of illegally sourced wood products in 2013, worth around $2.8 billion.
Proportion of Estimated Total Illegal
Wood Import, 2013 (including
assumed discrimination)
Change in Total Import Volume
Estimated Reduction in Illegal Wood
Volume without Considering
Discrimination
Change Including Some Discrimination
for Imports from China, Indonesia,
and Vietnam
Percentage of Total Gross
Measured Reduction from
All Countries
China/Hong Kong 59% 3% -32% -46% 60%
Indonesia 10% -17% -33% -59% 17%
Vietnam 9% 118% 100% 95% N/A
Mexico 6% -4% 4% 4% N/A
Brazil 3% 11% -68% -68% 7%
Taiwan 2% -46% -73% -73% 6%
Malaysia 2% -33% -68% -68% 4%
Russia 2% -20% -30% -30% 1%
Congo Basin 1% 0% -25% -25% 0%
Ghana 0% -67% -67% -67% 1%
Other 7% -20% -28% -30% 3%
Total 3% -32% -44%
Table 2. Estimated Reductions in U.S. Imports of Illegally Sourced Wood Products between 2007 and 2013, by Country, from Import-Source Analysis
Source: imporT-Source analySiS performed in THiS STudy.
The most important supplier countries were China, Indo-nesia, and Vietnam (constituting 78 percent of total estimated imports, combined). The most important products were fur-niture, plywood, other secondary timber products, and paper. The most important individual flows were wood furniture from China (15 percent of the total RWE volume), other secondary timber products (such as trim and flooring) from China (26 percent), plywood from China (10 percent), furni-ture from Vietnam (8 percent), paper from China (7 percent), and plywood from Indonesia (5 percent). Additional details are provided in Figures 10 and 11.
Conclusions
These results indicate that illegally sourced wood imports into the United States have declined substantially since the Lacey amendments took effect. It is impossible to say pre-cisely what part Lacey played in this decline, but the available evidence suggests that, although other effects were also im-portant (most importantly, reduced U.S. housing construction and constraints on additional supply growth from high-risk
15The Lacey Act’s Effectiveness in Reducing Illegal Wood Imports
countries to China), Lacey did play a role. Where Lacey has had an impact, it has been mostly due to U.S. buyers’ avoid-ance of high-risk products or high-risk countries, rather than an attempt on their part to discriminate between legal and illegal wood in like products.
The results also show conclusively that large volumes of likely-illegally-sourced wood continue to be imported into the United States, despite this being illegal under the Lacey amendments. It is likely that better enforcement of Lacey could reduce these imports much further. Such enforcement should be focused on the wood flows from the highest-risk countries, as shown in Table 2. Stronger enforcement efforts, particularly with respect to China, Indonesia, and Vietnam, can help continue the progress made so far under the Lacey Act amendments and assure American consumers that their imported wood products come from legal sources.
Sam Lawson is an independent consultant for the Tropical Forest and Climate Initiative of the Union of Concerned Scientists.
ACknowLedGmentsThis work was partly funded by the Climate and Land Use Alliance through a grant to UCS, and by the contributions of UCS members. We thank James Hewitt, independent consultant, for his assistance in accessing trade data and processing these data using import-source analysis. We thank Pipa Elias, Lisa Handy, and Melissa Bluesky for their helpful reviews of the manuscript. At UCS, our thanks go to Angela Anderson, Doug Boucher, Cynthia DeRocco, Lael Goodman, Calen May-Tobin, Kathleen Rest, Asha Sharma, Sharon Smith, Miriam Swaffer, Heather Tuttle, and Bryan Wadsworth for their help in preparing the manuscript for publication. We appreciate the excellent work of Karin Matchett in editing the report and David Gerratt in designing it.
endnotes1 Most domestically produced timber that leaves China does so in the form
of secondary products in which it is combined with imported wood.2 Based on US$ value, 66 percent of Vietnam’s log and sawn-wood imports
originated in high-risk countries in 2007; in 2012 the proportion was 60 percent (UN COMTRADE 2015).
3 Laos is the largest supplier of logs and sawn wood to Vietnam. Imports from Laos tripled between 2007 and 2012 (UN COMTRADE 2015).
Peru
Indonesia
Cub
ic M
eter
s, R
WE
, Mill
ions
8
7
6
5
4
3
2
1
02007 2013
Malaysia
Other Congo Basin
China Vietnam
8
7
6
5
4
3
2
1
0
figure 10. Estimated U.S. Imports of Illegally Sourced Wood, 2007 and 2013, by Major Flow (Incorporating Estimated Discrimination for Products from China, Indonesia, and Vietnam)
Source: imporT Source analySiS performed in THiS STudy.
figure 11. Product Types of Estimated U.S. Imports of Illegally Sourced Wood, 2013 (Incorporating Estimated Discrimination for Products from China, Indonesia, and Vietnam)
Sawn Lumber
Veneer
Plywood
Mouldings
Joinery
Wooden Furniture
Other Timber/Wood Products
Paper
Source: imporT-Source analySiS performed in THiS STudy.
Stronger enforcement efforts can help assure American consumers that their imported wood products come from legal sources.
web: www.ucsusa.org printed on recycled paper using vegetable-based inks © oCTobER 2015 union of concerned scientists
nAtionAL heAdquArters Two Brattle SquareCambridge, MA 02138-3780Phone: (617) 547-5552Fax: (617) 864-9405
wAshinGton, dC, offiCe1825 K St. NW, Suite 800Washington, DC 20006-1232Phone: (202) 223-6133Fax: (202) 223-6162
west CoAst offiCe500 12th St., Suite 340Oakland, CA 94607-4087Phone: (510) 843-1872Fax: (510) 843-3785
midwest offiCeOne N. LaSalle St., Suite 1904Chicago, IL 60602-4064Phone: (312) 578-1750Fax: (312) 578-1751
The Union of Concerned Scientists puts rigorous, independent science to work to solve our planet’s most pressing problems. Joining with citizens across the country, we combine technical analysis and effective advocacy to create innovative, practical solutions for a healthy, safe, and sustainable future.
find this document and its appendix online: www.ucsusa.org/laceyact
referenCes
Asia Pacific Resources International Limited (APRIL). 2015. APRIL group’s sustainable forest management policy 2.0. Online at www.aprilasia.com/images/pdf_files/april-sfmp2-3-june-2015.pdf, accessed July 8, 2015.
Asia Pulp and Paper (APP). 2013. APP’s forest conservation policy. Jakarta. Online at www.asiapulppaper.com/sites/default/files/app_forest_conservation_policy_final_english.pdf, accessed July 8, 2015.
Barr, C. 2008. Indonesia’s pulp and paper industry: Overview and opportunities. Paper presented at the Roundtable on Indonesia’s Pulp and Paper Industry, New York, NY.
China Customs. 2015. China customs statistics from China Customs General Administration. Accessed via UN COMTRADE database. Online at http://comtrade.un.org, accessed August 26, 2015.
Eyes on the Forest. 2013. Where are the trees? SMG/APP’s new forest policy kicks in only after company has completed its planned deforestation in Riau, Sumatra. Online at www.eyesontheforest.or.id/attach/EoF%20(03Apr13)%20Where%20are%20the%20trees%20EN%20FINAL.pdf, accessed August 26, 2015.
Eyes on the Forest. 2012. Asia Pacific Resources International Limited (APRIL): Riau, Sumatra’s biggest forest pulper 2009 to 2012, ques-tionable legality, social conflicts and global warming. Online at www.eyesontheforest.or.id/attach/EoF%20(20Dec12)%20APRIL%20Riau%20Sumatras%20biggest%20forest%20pulper%202009%20to%202012.pdf, accessed August 26, 2015.
Greenpeace. 2012. The ramin paper trail. Online at www.greenpeace. org/international/Global/international/publications/forests/2012/Indonesia/RaminSummary.pdf, accessed July 8, 2015.
Howards, J.L., and R.M. Westby. 2013. U.S. timber production, trade, consumption and price statistics, 1965–2011. Washington, DC: U.S. Department of Agriculture.
International Tropical Timber Organization (ITTO). 2010. Clarification on Gabon log ban. Tropical timber market report 15(3):2. Online at www.itto.int/direct/topics/topics_pdf_download/topics_id=2284&no=0, accessed July 8, 2015.
Lawson, S. 2014a. Illegal logging in the Republic of Congo. London: Chatham House. Online at www.chathamhouse.org/sites/files/chathamhouse/home/chatham/public_html/sites/default/files/ 20140400LoggingCongoLawson.pdf, accessed July 8, 2015.
Lawson, S. 2014b. Illegal logging in the Democratic Republic of the Congo. London: Chatham House. Online at www.chathamhouse.org/sites/files/chathamhouse/field/field_document/201404DRC.pdf, accessed July 8, 2015.
Lawson, S., and L. MacFaul. 2010. Illegal logging and related trade: Indicators of the global response. London: Chatham House. Online at www.illegal-logging.info/sites/files/chlogging/uploads/CHillegalloggingpaperwebready1.pdf, accessed July 8, 2015.
Mongabay.com. 2012. Indonesia’s environment ministry to sue APP, APRIL in $225 billion illegal logging case. May 3. Online at http://news.mongabay.com/2012/0503-riau-logging-lawsuit.html, accessed July 8, 2015.
Pautrat, L., and I. Lucich. 2006. Análisis preliminar sobre gobernabi-lidad y cumplimiento de la legislación del sector forestal en el Peru. Paper prepared for the World Bank Group. La Sociedad Peruana de Ecodesarrollo. Online at www.spde.org/documentos/publicaciones/tala-ilegal/CAP-I-II-VERSION-RESUMIDA.pdf, accessed July 27, 2015.
Prestemon, J.P. 2014. The impacts of the Lacey Act Amendment of 2008 on U.S. hardwood lumber and hardwood plywood imports. Forest Policy and Economics 50:31–44. Online at http://dx.doi.org/10.1016/ j.forpol.2014.10.002, accessed July 8, 2015.
Reuters. 2008. Office Depot commemorates five years of environmental policy leadership with recognition by environmental organizations, June 3. Online at www.reuters.com/article/2008/06/03/idUS141262+03-Jun-2008+BW20080603, accessed July 8, 2015.
Seneca Creek Associates and Wood Resources International (Seneca Creek). 2004. “Illegal” logging and global wood markets: The competitive impacts on the U.S. wood products industry. American Forest and Paper Association. Online at www.unece.lsu.edu/responsible_ trade/documents/2003-2006/rt03_036.pdf, accessed August 6, 2015.
Société Générale de Surveillance (SGS). 2013. SGS TLTV statements, issued and currently valid. Online at www.sgs.com, accessed August 26, 2015.
Staples. 2009. Staples signs sourcing agreement with the Rainforest Alliance. News release, October 1. Online at www.rainforest-alliance.org/newsroom/press-releases/staples-sourcing, accessed July 8, 2015.
Timber Trades Journal. 2014. Russia’s lumber export growth not compensating for decline in log exports. March 17. Online at www.ttjonline.com/news/russias-lumber-export-growth-not-compensating-for-decline-in-log-exports-4197895, accessed August 6, 2015.
UN COMTRADE. 2015. United Nations Commodity Trade Statistics Database. Online at http://comtrade.un.org, accessed August 6, 2015.
U.S. Department of the Interior (USDI). 2010. USDI vs. three pallets of tropical hardwood. INV no. 2009403072. Decision in response to petition for remission, June.
U.S. International Trade Commission (USITC). 2015. Interactive Tariff and Trade DataWeb. Online at http://dataweb.usitc.gov, accessed July 8, 2015.