Embed Size (px)
Citation preview
Labour Market Trends in Ontario and Halton Region
Prepared for the Halton District School Board Pathways Program by Innovate Burlington
August 7, 2014
Executive Summary
The following report reflects research conducted by Innovate Burlington on behalf of the Halton District School Board Pathways initiative. The primary objective of this report is to identify trends regarding youth employment in the province of Ontario and the Regional Municipality of Halton. The secondary objective of this report is to identify skills gaps that exist in both of these markets and likely job opportunities for new entrants to the workforce. This report was in large part prompted by the discouraging reality of youth unemployment rates in Ontario, whereby Ontarians ages 15 to 24 continue to experience unemployment levels that are more than twice as high as provincial unemployment levels across all age groups, and higher than average unemployment rates amongst elsewhere in Canada. Research suggests that these high unemployment levels are not a direct consequence of the 2008-09 financial crisis, but rather a manifestation of a long-term, structural shift in Ontario’s economy and labor market. An important theme in the following report is the strength of Ontario’s service sector, and its increasing importance to Ontario’s economic welfare, relative to manufacturing and other goods-producing industries. The service sector was not as strongly affected by the 2008-09 financial crisis and has generated the majority of new jobs in Ontario in the last two years. Alternatively, the production value of goods-producing industries has demonstrated strong volatility since 2007, and job gains in Ontario’s construction industry have struggled to compensate layoffs in manufacturing. These patterns speak to a long-term shift in Ontario’s economic foundation from manufacturing and related operations to service provision. This shift is one of two contributing factors to the widening “Skills Gap” in Ontario’s labour market, referring to the seemingly contradictory pattern of province-wide employee shortages in certain sectors despite an absolute surplus in labour supply. The growth of Ontario’s service sector means the type of skills and knowledge required by the Canadian and provincial economies have advanced significantly. Ontario’s aging workforce is a further contributor to this Skills Gap. Altogether, Ontario employers appear unable to fill the positions left vacant by baby boomers because new entrants to the work force do not always have the skills and training that employers are looking for. Research suggests that occupational shortages are particularly acute in Health Care, Professional, Scientific, and Technical Services, Financial Professions, and Manufacturing sectors. Moving forward, education is the single most important tool available in addressing these shortages. Indeed, much of the Skills Gap can be explained by fact that changes in Ontario’s labour market are outpacing changes in education and skills training. To address the Skills Gap and encourage Ontario’s economic growth, the skills and qualifications of new members of the workforce must be aligned with clear economic opportunities and priorities. Based on the research contained in this report, Innovate Burlington recommends that the Halton District School board take the necessary steps to conduct further primary research, expand its personalized learning options strategically, and improve communication tools based on reported student concerns. Primary research, in the form of focus groups or surveys, for example, would help HDSB Pathways identify student needs that are not being met by current initiatives. Second, Innovate Burlington recommends that HDSB Pathways take the necessary steps to expand certain Specialist High School Major programs across each of Halton Region’s four municipalities. Third, as an established resource for students regarding education and career planning, the HDSB Pathways initiative is in a unique position to address a knowledge gaps with more effective communication tools.
Table of Contents
Introduction 1
Research Objectives 1
Research Methodology 2
Summary of Limitations 4
Key Findings 5
Ontario Economy 5
Ontario Economy: Labour Market Profile 8
Youth Unemployment in Ontario 13
Skills Gap 15
Skills Gap: Health Care 16
Skills Gap: Professional, Scientific, and Technical Services 16
Skills Gap: Financial Professions 17
Skills Gap: Manufacturing 17
Ontario: Education 20
Halton: Economy 28
Halton: Labour Market Profile 33
Halton Education 39
HDSB Pathways: Internal Data Analysis 42
Recommendations 45
Works Cited 46
Appendix A 49

1
INTRODUCTION The Halton District School Board Pathways initiative (HDSB Pathways) facilitates educational and career planning for students in Halton Region through personalized learning programs. HDSB Pathways is an integral part of the Guidance and Career Education program in Halton Region’s public schools, which plays a central role in helping students understand, develop and apply skills related to lifelong learning, interpersonal relationships, and goal setting. The Halton District School Board Pathways initiative engaged Innovate Burlington in January 2014 to help assess the alignment between current labour market realities and ongoing programming initiatives. To do so, HDSB Pathways expressed a need to better understand trends regarding youth employment in the Province of Ontario and Regional Municipality of Halton. The following report details the most conclusive findings supported by both primary and secondary research sources.
RESEARCH OBJECTIVES The primary objective of this report is to identify trends regarding youth employment in the Province of Ontario and the Regional Municipality of Halton. The secondary objective of this report is to identify skills gaps that exist in both of these markets and likely job opportunities for new entrants to the workforce. These objectives require thorough consideration of general economic trends, long-term changes in the labour market, and patterns in educational attainment specific to both Ontario and Halton Region. The purpose of this report is to support the Halton District School Board Pathways initiative in their efforts to better align programming initiatives and student opportunities with current labour market realities.
2
RESEARCH METHODOLOGY The contents of this report reflect research and analysis conducted in March, April, and May 2014. This report was compiled according to the following work plan:
1. Identify appropriate research sources Primary and secondary research sources were identified according to the relevance, timeliness, and detail of information provided. For the purposes of this report, important primary research sources include Statistics Canada, the Ontario Ministry of Finance, and Regional Municipality of Halton. The Halton District School Board Pathways program was also an important source of primary data regarding program enrollments in their Specialist High School Major (SHSM) programs. Identifying appropriate secondary research sources involved the exploration of published works by important stakeholders and commentators on the Ontario economy, industries of interest, and its workforce. For example, important stakeholders regarding youth educational attainment and employment include Colleges Ontario, the Higher Education Quality Council of Ontario, and the Ontario Ministry of Training, Colleges and Universities.
2. Extract appropriate information
From the aforementioned compiled list of appropriate research sources, available data was surveyed so as to identify the most important data tables from primary resource sources and the most pertinent reports from secondary research sources. For primary research sources such as the 2011 National Household Survey, this step involved identifying the most important variables for the purposes of this report. Extracting the appropriate information from primary and secondary research sources involved exporting relevant data files and taking note of key findings, respectively.
3. Manipulate relevant data
Extracting key findings from primary research data involved the manipulation of source data using data management tools in management software such as Microsoft Excel. For example, pivot tables allow the user to navigate employment data per age group and industry sector with considerable ease, relative to raw data tables. The manipulation of variables in such a straightforward manner allowed for more efficient analysis.
4. Compile Key Findings
Key findings extracted from primary and secondary research sources were compared so as to ascertain the strength of certain findings and assertions. Accumulated evidence from both primary and secondary research sources supported the integrity of certain findings and also shed light on key themes that contextualize these findings.

3
5. Analysis With a clear understanding of key findings and themes regarding employment patterns in Ontario and Halton Region, Innovate Burlington was able to apply these learnings to the HDSB Pathways initiative. Particular emphasis was placed on identifying current skills gaps and job opportunities for new entrants to the workforce, and how HDSB Pathways can adjust or expand its programming activities to help students pursue employment in these fields.

4
SUMMARY OF LIMITATIONS 1. Limited primary research sources
So as to ensure a measure of independent analysis, this research project required primary data to assess macroeconomic trends in Ontario, including patterns in the labour market and educational attainment. Meaningful analysis also required that data collection from primary research sources be well aligned with this project’s geographic areas of interest. Generally speaking, few companies and organizations are willing to incur the costs associated with surveys as detailed as that required by this project, and on such a broad geographic scale. Those that do invest in this kind of research would not absorb the cost of making their findings publicly available. As such, the primary research sources used in this project are exclusively public, at a regional, provincial, and national level. Without comparable data, the information provided by primary research sources cannot be independently verified.
2. Methodological limitations
While using few primary research sources offers the benefit of consistency, it also applies the inherent methodological weaknesses of the primary research source to the contents of this report. Information from regional, provincial, and national entities represent extensive surveying that inevitably leads to significant margins of error.
3. Lack of primary research While this report draws on information from primary and secondary research sources, it did not involve any unique primary research, that is, research conducted by Innovate Burlington exclusively for the Halton District School Board. As such, the findings presented in the following report are general trends and cannot inform the kind of customized recommendations and detail that primary research offers. Moving forward, Innovate Burlington recommends that HDSB Pathways consider primary research surveys of students and teachers, which will provide more precise information on how students are currently planning their education and careers, and what HDSB Pathways can do to support and improve this process.
5
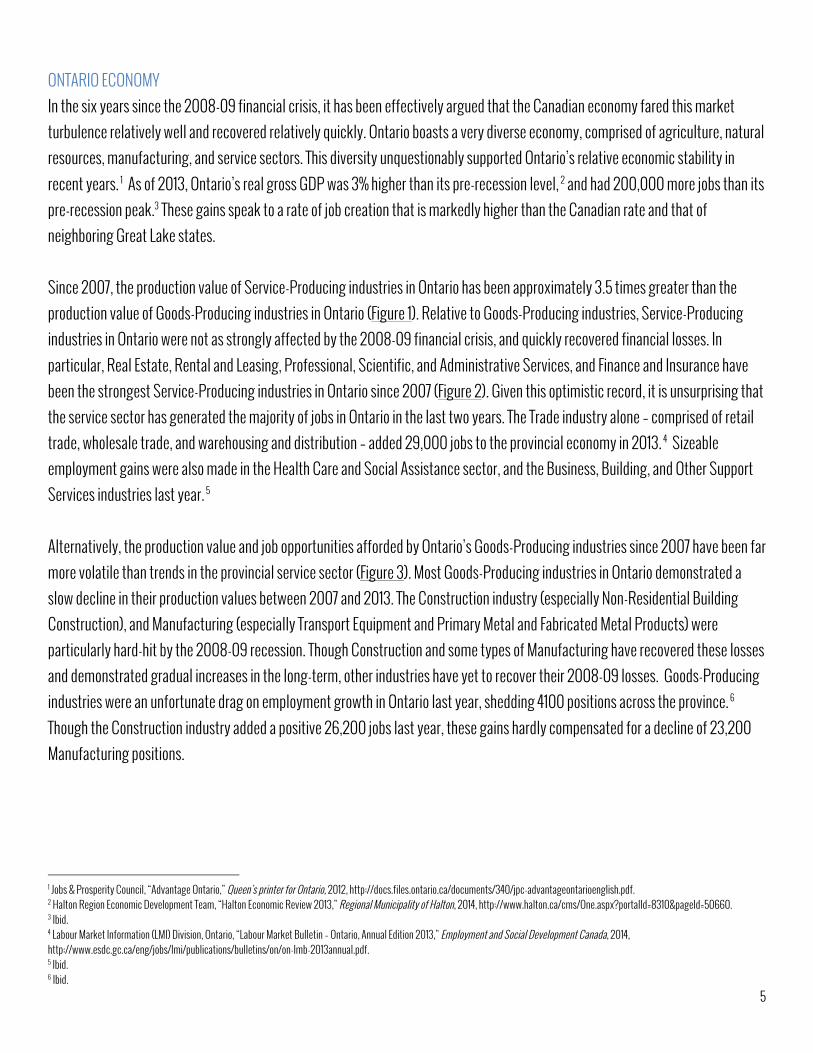
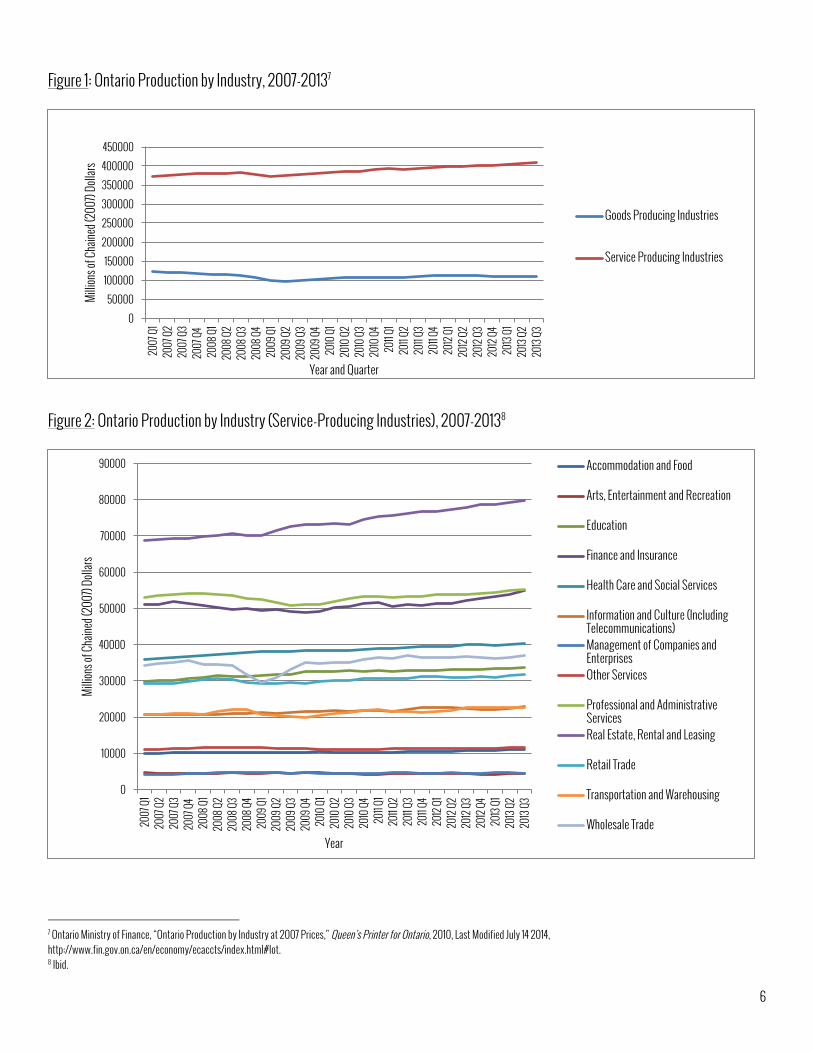
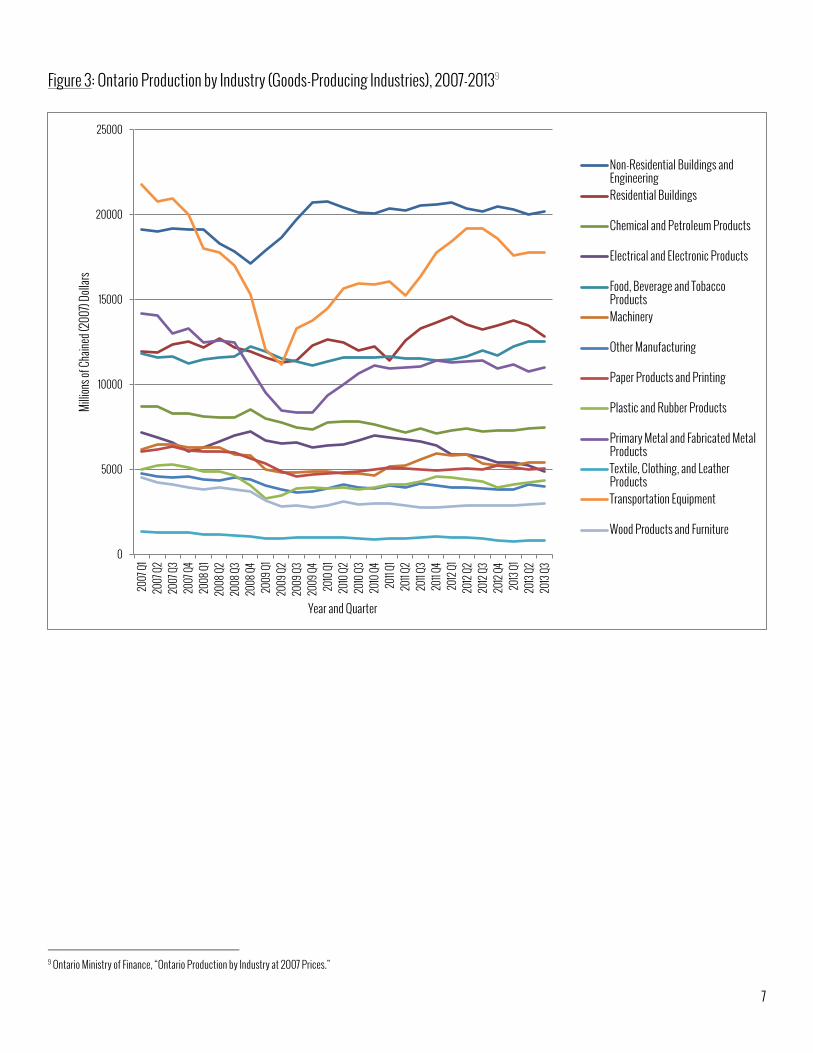
ONTARIO ECONOMY In the six years since the 2008-09 financial crisis, it has been effectively argued that the Canadian economy fared this market turbulence relatively well and recovered relatively quickly. Ontario boasts a very diverse economy, comprised of agriculture, natural resources, manufacturing, and service sectors. This diversity unquestionably supported Ontario’s relative economic stability in recent years. 1 As of 2013, Ontario’s real gross GDP was 3% higher than its pre-recession level, 2 and had 200,000 more jobs than its pre-recession peak.3 These gains speak to a rate of job creation that is markedly higher than the Canadian rate and that of neighboring Great Lake states. Since 2007, the production value of Service-Producing industries in Ontario has been approximately 3.5 times greater than the production value of Goods-Producing industries in Ontario (Figure 1). Relative to Goods-Producing industries, Service-Producing industries in Ontario were not as strongly affected by the 2008-09 financial crisis, and quickly recovered financial losses. In particular, Real Estate, Rental and Leasing, Professional, Scientific, and Administrative Services, and Finance and Insurance have been the strongest Service-Producing industries in Ontario since 2007 (Figure 2). Given this optimistic record, it is unsurprising that the service sector has generated the majority of jobs in Ontario in the last two years. The Trade industry alone – comprised of retail trade, wholesale trade, and warehousing and distribution – added 29,000 jobs to the provincial economy in 2013. 4 Sizeable employment gains were also made in the Health Care and Social Assistance sector, and the Business, Building, and Other Support Services industries last year. 5 Alternatively, the production value and job opportunities afforded by Ontario’s Goods-Producing industries since 2007 have been far more volatile than trends in the provincial service sector (Figure 3). Most Goods-Producing industries in Ontario demonstrated a slow decline in their production values between 2007 and 2013. The Construction industry (especially Non-Residential Building Construction), and Manufacturing (especially Transport Equipment and Primary Metal and Fabricated Metal Products) were particularly hard-hit by the 2008-09 recession. Though Construction and some types of Manufacturing have recovered these losses and demonstrated gradual increases in the long-term, other industries have yet to recover their 2008-09 losses. Goods-Producing industries were an unfortunate drag on employment growth in Ontario last year, shedding 4100 positions across the province. 6 Though the Construction industry added a positive 26,200 jobs last year, these gains hardly compensated for a decline of 23,200 Manufacturing positions.
1 Jobs & Prosperity Council, “Advantage Ontario,” Queen’s printer for Ontario, 2012, http://docs.files.ontario.ca/documents/340/jpc-advantageontarioenglish.pdf. 2 Halton Region Economic Development Team, “Halton Economic Review 2013,” Regional Municipality of Halton, 2014, http://www.halton.ca/cms/One.aspx?portalId=8310&pageId=50660. 3 Ibid. 4 Labour Market Information (LMI) Division, Ontario, “Labour Market Bulletin – Ontario, Annual Edition 2013,” Employment and Social Development Canada, 2014, http://www.esdc.gc.ca/eng/jobs/lmi/publications/bulletins/on/on-lmb-2013annual.pdf. 5 Ibid. 6 Ibid.
6
Figure 1: Ontario Production by Industry, 2007-20137
Figure 2: Ontario Production by Industry (Service-Producing Industries), 2007-20138
7 Ontario Ministry of Finance, “Ontario Production by Industry at 2007 Prices,” Queen’s Printer for Ontario, 2010, Last Modified July 14 2014, http://www.fin.gov.on.ca/en/economy/ecaccts/index.html#lot. 8 Ibid.
0
50000
100000
150000
200000
250000
300000
350000
400000
450000 20
07 Q
1 20
07 Q
2 20
07 Q
3 20
07 Q
4 20
08 Q
1 20
08 Q
2 20
08 Q
3 20
08 Q
4 20
09 Q
1 20
09 Q
2 20
09 Q
3 20
09 Q
4 20
10 Q
1 20
10 Q
2 20
10 Q
3 20
10 Q
4 20
11 Q1
2011 Q
2 20
11 Q3
2011 Q
4 20
12 Q
1 20
12 Q
2 20
12 Q
3 20
12 Q
4 20
13 Q
1 20
13 Q
2 20
13 Q
3
Millio
ns of
Chain
ed (2
007)
Dolla
rs
Year and Quarter
Goods Producing Industries
Service Producing Industries
0
10000
20000
30000
40000
50000
60000
70000
80000
90000
2007
Q1
2007
Q2
2007
Q3
2007
Q4
2008
Q1
2008
Q2
2008
Q3
2008
Q4
2009
Q1
2009
Q2
2009
Q3
2009
Q4
2010
Q1
2010
Q2
2010
Q3
2010
Q4
2011 Q
1 20
11 Q2
2011 Q
3 20
11 Q4
2012
Q1
2012
Q2
2012
Q3
2012
Q4
2013
Q1
2013
Q2
2013
Q3
Millio
ns of
Chain
ed (2
007)
Dolla
rs
Year
Accommodation and Food
Arts, Entertainment and Recreation
Education
Finance and Insurance
Health Care and Social Services
Information and Culture (Including Telecommunications) Management of Companies and Enterprises Other Services
Professional and Administrative Services Real Estate, Rental and Leasing
Retail Trade
Transportation and Warehousing
Wholesale Trade
7
Figure 3: Ontario Production by Industry (Goods-Producing Industries), 2007-20139
9 Ontario Ministry of Finance, “Ontario Production by Industry at 2007 Prices.”
0
5000
10000
15000
20000
25000 20
07 Q
1 20
07 Q
2 20
07 Q
3 20
07 Q
4 20
08 Q
1 20
08 Q
2 20
08 Q
3 20
08 Q
4 20
09 Q
1 20
09 Q
2 20
09 Q
3 20
09 Q
4 20
10 Q
1 20
10 Q
2 20
10 Q
3 20
10 Q
4 20
11 Q1
2011 Q
2 20
11 Q3
2011 Q
4 20
12 Q
1 20
12 Q
2 20
12 Q
3 20
12 Q
4 20
13 Q
1 20
13 Q
2 20
13 Q
3
Millio
ns of
Chain
ed (2
007)
Dolla
rs
Year and Quarter
Non-Residential Buildings and Engineering Residential Buildings
Chemical and Petroleum Products
Electrical and Electronic Products
Food, Beverage and Tobacco Products Machinery
Other Manufacturing
Paper Products and Printing
Plastic and Rubber Products
Primary Metal and Fabricated Metal Products Textile, Clothing, and Leather Products Transportation Equipment
Wood Products and Furniture
8
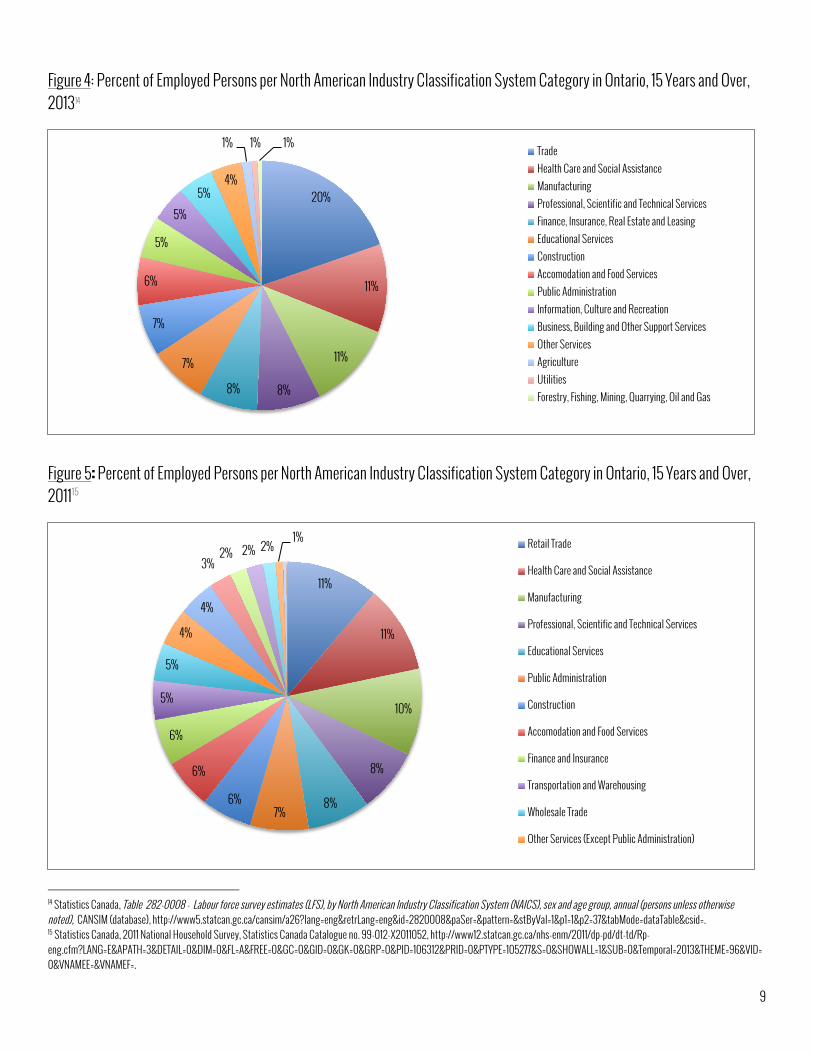
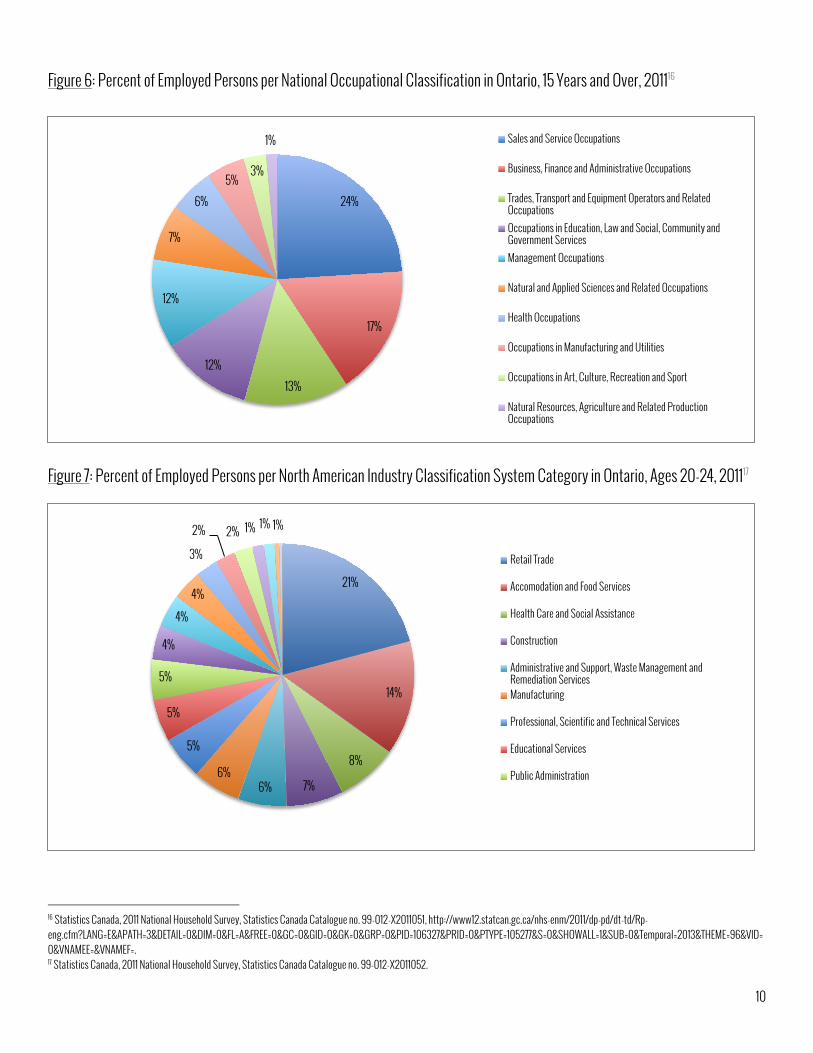
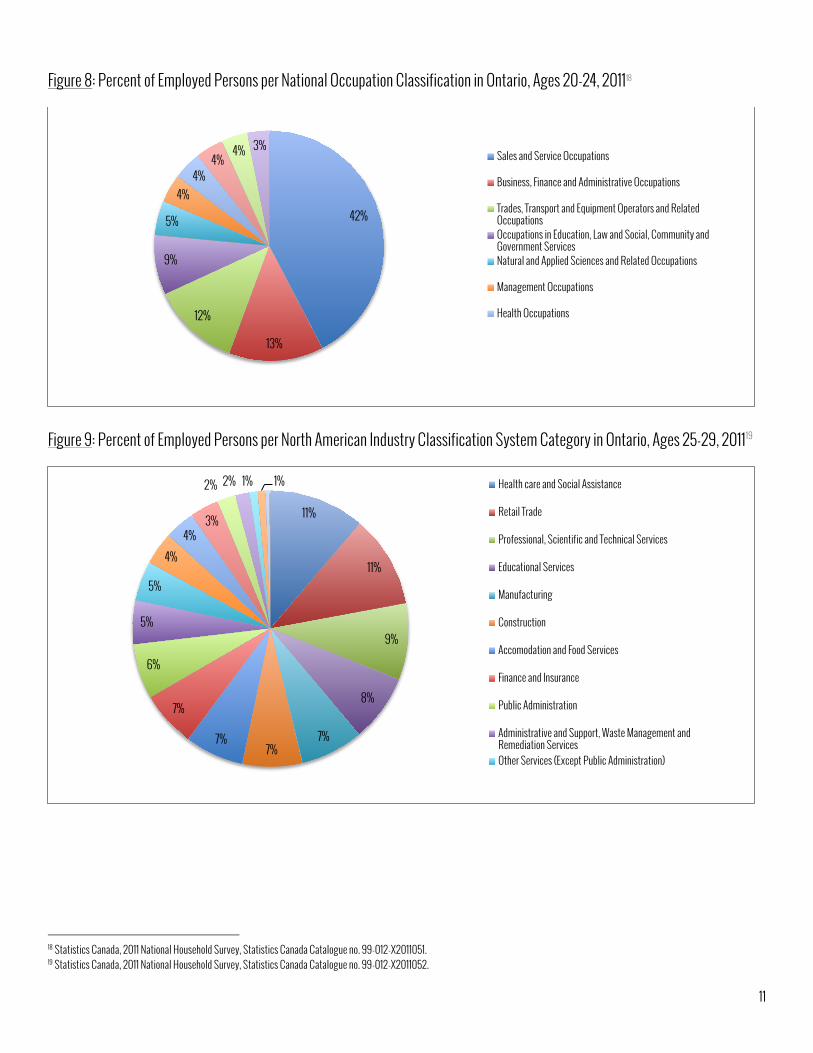
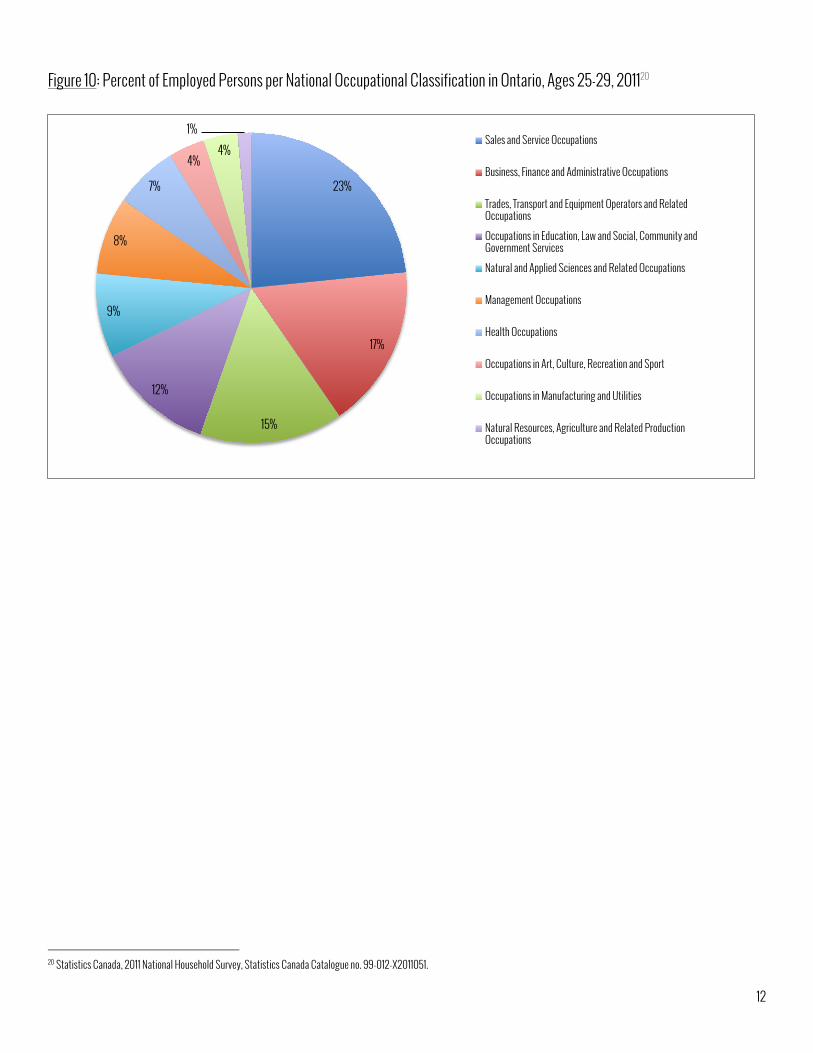
ONTARIO ECONOMY: LABOUR MARKET PROFILE According to Statistics Canada’s 2013 Labour Force Survey, Trade, Health Care and Social Assistance, and Manufacturing were the three largest industries in Ontario last year by number of employees (Figure 4), according to the 2007 North American Industry Classification System (NAICS).10 Professional, Scientific, and Technical Services, and Finance, Insurance, Real Estate and Leasing were also significant employers in Ontario last year, accounting for 8% of jobs each. The 2011 National Household Survey reveals that Retail Trade, Health Care and Social Assistance, and Manufacturing were Ontario’s three largest sectors in terms of number of employees in 2011, representing 11%, 11% and 10% of Ontario workers, respectively (Figure 5).11 According to the National Occupation Classification (NOC) system, 12 Sales and Service Occupations comprised 24% of Ontario workers in 2011 (Figure 6), followed by Business, Finance, and Administrative Occupations, and Trades, Transport and Equipment Operators, accounting for 17% and 13% of workers, respectively.13 The 2011 National Household Survey suggests that 21% of Ontario youth ages 20 to 24 worked in Retail Trade (Figure 7), followed by 14% in Accommodation and Food Services. Reflecting employment in these two industries, 42% of working 20 to 24-year-olds in Ontario had Sales and Service Occupations in 2011 (Figure 8). It is interesting to note that the number of youth ages 20 to 24 working in Construction and Manufacturing in 2011 reflected provincial averages, suggesting that adults working in these sectors may have entered their respective field at a young age. The 2011 National Household Survey also reveals that Ontario youth ages 25 to 29 reflect employment patterns similar to provincial averages (Figure 9). In particular, the number of 25 to 29-year-olds employed in Retail Trade and Accommodation and Food Services appears to decline drastically by the age of 25, countered by gains in Health Care and Social Assistance, for example, and Professional, Scientific and Technical Services. Sales and Service Occupations in this age group also decline by nearly 50%, relative to 20 to 24 year-olds (Figure 10).
10 North American Industry Classification System (NAICS) – Canada, 2007, See http://www.statcan.gc.ca/pub/12-501-x/12-501-x2007001-eng.pdf. 11 See Appendix A, “Ontario NAICS 2011” for complete data tables. 12 National Occupation Classification (NOC) – Canada, 2006, See http://www30.hrsdc.gc.ca/NOC/English/NOC/2006/pdf/Introduction.Pdf. 13 See Appendix A, “Ontario NOC 2011” for complete data tables.
NAICS at a glance: Trade Retail Trade, Wholesale Trade Health Care and Social Assistance Ambulatory Health Care Services, Hospitals, Nursing and Residential Care, Social Assistance Manufacturing Food and Beverage, Chemical, Plastics and Rubber, Machinery, Transportation Equipment Professional, Scientific, and Technical Services Legal, Accounting, Architecture, Engineering, Advertising Finance, Insurance, Real Estate and Leasing Monetary Authorities, Credit Intermediation, Insurance Carriers
NOC at a glance: Sales and Service Occupations Sales and Service Supervisors, Representatives, and Support Business, Finance, and Administrative Occupations Professional Occupations in Business and Finance, Office Support, Distribution and Tracking Trades, Transport and Equipment Operators Industrial, electrical, and construction trades, Maintenance and Equipment Operation Trades, Transport and Heavy Equipment Operators
9
Figure 4: Percent of Employed Persons per North American Industry Classification System Category in Ontario, 15 Years and Over, 201314
Figure 5: Percent of Employed Persons per North American Industry Classification System Category in Ontario, 15 Years and Over, 201115
14 Statistics Canada, Table 282-0008 - Labour force survey estimates (LFS), by North American Industry Classification System (NAICS), sex and age group, annual (persons unless otherwise noted), CANSIM (database), http://www5.statcan.gc.ca/cansim/a26?lang=eng&retrLang=eng&id=2820008&paSer=&pattern=&stByVal=1&p1=1&p2=37&tabMode=dataTable&csid=. 15 Statistics Canada, 2011 National Household Survey, Statistics Canada Catalogue no. 99-012-X2011052, http://www12.statcan.gc.ca/nhs-enm/2011/dp-pd/dt-td/Rp-eng.cfm?LANG=E&APATH=3&DETAIL=0&DIM=0&FL=A&FREE=0&GC=0&GID=0&GK=0&GRP=0&PID=106312&PRID=0&PTYPE=105277&S=0&SHOWALL=1&SUB=0&Temporal=2013&THEME=96&VID=0&VNAMEE=&VNAMEF=.
20%
11%
11%
8% 8%
7%
7%
6%
5%
5%
5% 4%
1% 1% 1% Trade Health Care and Social Assistance Manufacturing Professional, Scientific and Technical Services Finance, Insurance, Real Estate and Leasing Educational Services Construction Accomodation and Food Services Public Administration Information, Culture and Recreation Business, Building and Other Support Services Other Services Agriculture Utilities Forestry, Fishing, Mining, Quarrying, Oil and Gas
11%
11%
10%
8%
8% 7%
6%
6%
6%
5%
5%
4%
4%
3% 2% 2% 2%
1% Retail Trade
Health Care and Social Assistance
Manufacturing
Professional, Scientific and Technical Services
Educational Services
Public Administration
Construction
Accomodation and Food Services
Finance and Insurance
Transportation and Warehousing
Wholesale Trade
Other Services (Except Public Administration)
10
Figure 6: Percent of Employed Persons per National Occupational Classification in Ontario, 15 Years and Over, 201116
Figure 7: Percent of Employed Persons per North American Industry Classification System Category in Ontario, Ages 20-24, 201117
16 Statistics Canada, 2011 National Household Survey, Statistics Canada Catalogue no. 99-012-X2011051, http://www12.statcan.gc.ca/nhs-enm/2011/dp-pd/dt-td/Rp-eng.cfm?LANG=E&APATH=3&DETAIL=0&DIM=0&FL=A&FREE=0&GC=0&GID=0&GK=0&GRP=0&PID=106327&PRID=0&PTYPE=105277&S=0&SHOWALL=1&SUB=0&Temporal=2013&THEME=96&VID=0&VNAMEE=&VNAMEF=. 17 Statistics Canada, 2011 National Household Survey, Statistics Canada Catalogue no. 99-012-X2011052.
24%
17%
13%
12%
12%
7%
6%
5% 3%
1% Sales and Service Occupations
Business, Finance and Administrative Occupations
Trades, Transport and Equipment Operators and Related Occupations Occupations in Education, Law and Social, Community and Government Services Management Occupations
Natural and Applied Sciences and Related Occupations
Health Occupations
Occupations in Manufacturing and Utilities
Occupations in Art, Culture, Recreation and Sport
Natural Resources, Agriculture and Related Production Occupations
21%
14%
8%
7% 6% 6%
5%
5%
5%
4%
4%
4%
3%
2% 2% 1% 1% 1%
Retail Trade
Accomodation and Food Services
Health Care and Social Assistance
Construction
Administrative and Support, Waste Management and Remediation Services Manufacturing
Professional, Scientific and Technical Services
Educational Services
Public Administration
11
Figure 8: Percent of Employed Persons per National Occupation Classification in Ontario, Ages 20-24, 201118
Figure 9: Percent of Employed Persons per North American Industry Classification System Category in Ontario, Ages 25-29, 201119
18 Statistics Canada, 2011 National Household Survey, Statistics Canada Catalogue no. 99-012-X2011051. 19 Statistics Canada, 2011 National Household Survey, Statistics Canada Catalogue no. 99-012-X2011052.
42%
13%
12%
9%
5%
4% 4%
4% 4% 3%
Sales and Service Occupations
Business, Finance and Administrative Occupations
Trades, Transport and Equipment Operators and Related Occupations Occupations in Education, Law and Social, Community and Government Services Natural and Applied Sciences and Related Occupations
Management Occupations
Health Occupations
11%
11%
9%
8%
7% 7%
7%
7%
6%
5%
5%
4%
4% 3%
2% 2% 1% 1% Health care and Social Assistance
Retail Trade
Professional, Scientific and Technical Services
Educational Services
Manufacturing
Construction
Accomodation and Food Services
Finance and Insurance
Public Administration
Administrative and Support, Waste Management and Remediation Services Other Services (Except Public Administration)
12
Figure 10: Percent of Employed Persons per National Occupational Classification in Ontario, Ages 25-29, 201120
20 Statistics Canada, 2011 National Household Survey, Statistics Canada Catalogue no. 99-012-X2011051.
23%
17%
15%
12%
9%
8%
7%
4% 4%
1% Sales and Service Occupations
Business, Finance and Administrative Occupations
Trades, Transport and Equipment Operators and Related Occupations
Occupations in Education, Law and Social, Community and Government Services
Natural and Applied Sciences and Related Occupations
Management Occupations
Health Occupations
Occupations in Art, Culture, Recreation and Sport
Occupations in Manufacturing and Utilities
Natural Resources, Agriculture and Related Production Occupations
13
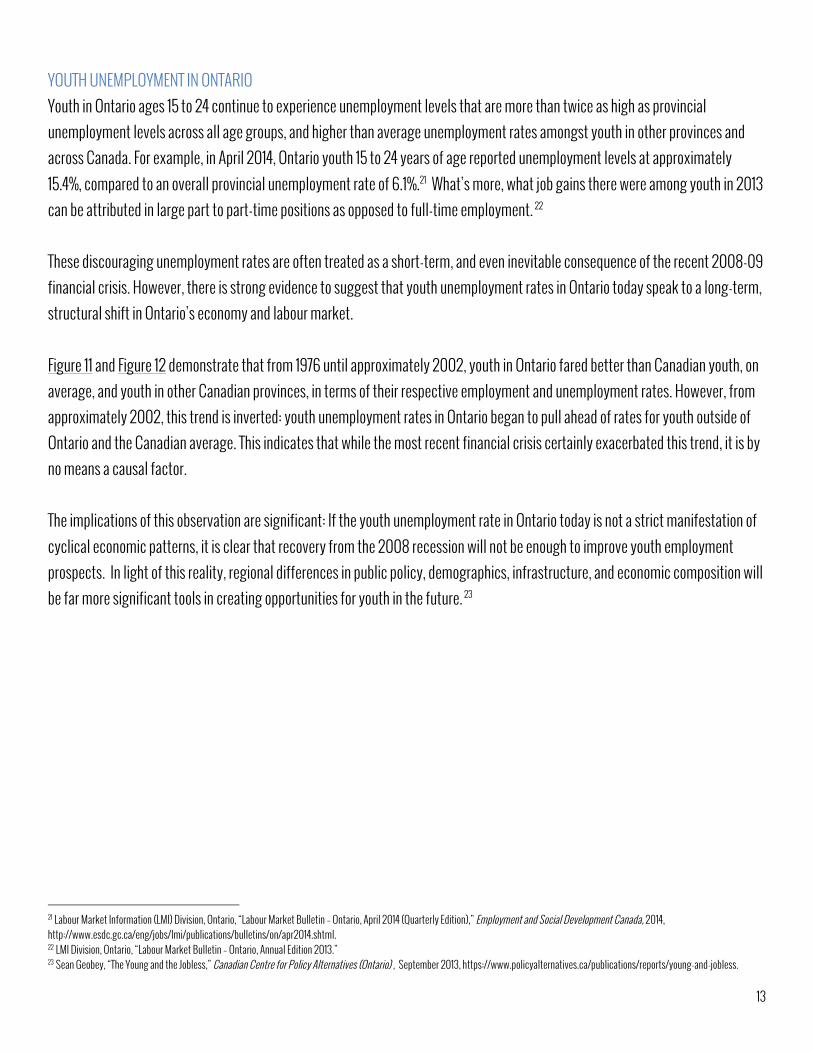
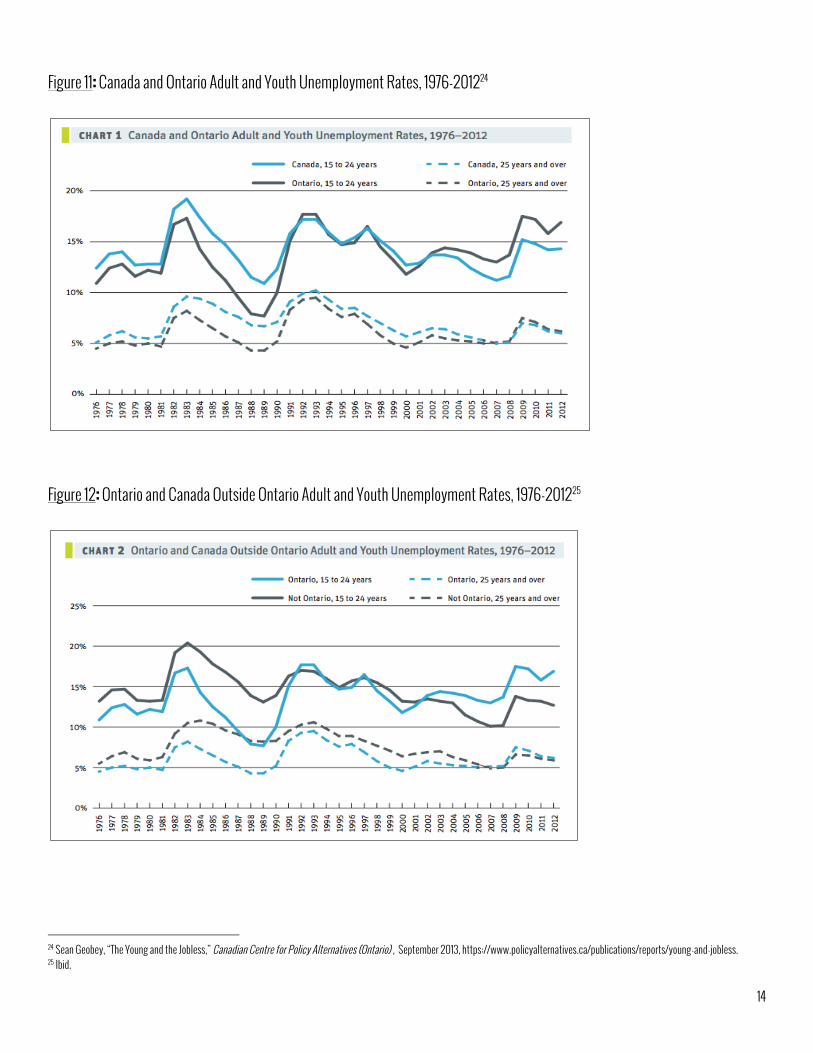
YOUTH UNEMPLOYMENT IN ONTARIO Youth in Ontario ages 15 to 24 continue to experience unemployment levels that are more than twice as high as provincial unemployment levels across all age groups, and higher than average unemployment rates amongst youth in other provinces and across Canada. For example, in April 2014, Ontario youth 15 to 24 years of age reported unemployment levels at approximately 15.4%, compared to an overall provincial unemployment rate of 6.1%.21 What’s more, what job gains there were among youth in 2013 can be attributed in large part to part-time positions as opposed to full-time employment. 22 These discouraging unemployment rates are often treated as a short-term, and even inevitable consequence of the recent 2008-09 financial crisis. However, there is strong evidence to suggest that youth unemployment rates in Ontario today speak to a long-term, structural shift in Ontario’s economy and labour market. Figure 11 and Figure 12 demonstrate that from 1976 until approximately 2002, youth in Ontario fared better than Canadian youth, on average, and youth in other Canadian provinces, in terms of their respective employment and unemployment rates. However, from approximately 2002, this trend is inverted: youth unemployment rates in Ontario began to pull ahead of rates for youth outside of Ontario and the Canadian average. This indicates that while the most recent financial crisis certainly exacerbated this trend, it is by no means a causal factor. The implications of this observation are significant: If the youth unemployment rate in Ontario today is not a strict manifestation of cyclical economic patterns, it is clear that recovery from the 2008 recession will not be enough to improve youth employment prospects. In light of this reality, regional differences in public policy, demographics, infrastructure, and economic composition will be far more significant tools in creating opportunities for youth in the future. 23
21 Labour Market Information (LMI) Division, Ontario, “Labour Market Bulletin – Ontario, April 2014 (Quarterly Edition),” Employment and Social Development Canada, 2014, http://www.esdc.gc.ca/eng/jobs/lmi/publications/bulletins/on/apr2014.shtml. 22 LMI Division, Ontario, “Labour Market Bulletin – Ontario, Annual Edition 2013.” 23 Sean Geobey, “The Young and the Jobless,” Canadian Centre for Policy Alternatives (Ontario) , September 2013, https://www.policyalternatives.ca/publications/reports/young-and-jobless.
14
Figure 11: Canada and Ontario Adult and Youth Unemployment Rates, 1976-201224
Figure 12: Ontario and Canada Outside Ontario Adult and Youth Unemployment Rates, 1976-201225
24 Sean Geobey, “The Young and the Jobless,” Canadian Centre for Policy Alternatives (Ontario) , September 2013, https://www.policyalternatives.ca/publications/reports/young-and-jobless. 25 Ibid.

15
SKILLS GAP In recent years, there has been growing consensus regarding a widening “Skills Gap” in Ontario’s labour market, referring to the seemingly contradictory pattern of province-wide employee shortages in certain sectors despite an absolute surplus in labour supply. Though the Skills Gap is far from simple, it can be simply understood as a consequence of two important trends in Ontario’s labour market: First, Ontario is in the midst of a long-term economic shift from manufacturing towards the service sector. As such, the type of skills and knowledge required by the Canadian and Ontario’s economy have advanced significantly. Second, Ontario’s current workforce is aging. With the retirement of Ontario’s baby boomers, the size of its work force will shrink. All together, Ontario employers appear unable to fill the positions left vacant by baby boomers as new entrants to the work force do not always have the skills and training that employers are looking for. This Skills Gap represents a very real and significant financial cost for Ontario’s economy. By current estimates, Ontario will face a shortage of 1.8 million workers by 2031.26 This will only worsen the current cost of the Skills Gap in Ontario, which the Conference Board of Canada estimates to be as high as $24.3 billion in foregone GDP and $3.7 billion in provincial tax revenues every year. 27 Given the importance of Ontario’s Skills Gap to the province’s economic health, it is important to clarify the concept. For indeed, simple reference to Ontario’s Skills Gap can refer to any number of shortages that the provincial labour market is currently reporting. Generally speaking, however, the provincial Skills Gap can be conceptualized as twofold: First, the provincial labour market has a Skills Gap insofar as not enough young Ontarians are obtaining post-secondary training of some kind. The current consensus formed by various stakeholder estimates suggests that by 2031, Ontario’s economy will require 77% - over three-quarters – of its workforce to have some kind of post-secondary certificate, diploma, or degree.28 At present, only 65% of Ontarians report this measure of training. 29 While demand for different kinds of postsecondary training will inevitably vary by sector and region, the overarching reality is that more Ontario high school students need to actively pursue and commit to post-secondary education planning. In addition to this general gap in secondary skills training, Ontario’s Skills Gap also refers to – and is often used to exclusively describe – employee shortages in specific industries. A popular misconception is that the Skills Gap refers only to shortages in the skilled trades: in construction, for example, or manufacturing. While shortages in these industries do exist, it is important to note that Ontario’s skills shortages extend to countless service sectors, as well. In fact, different skills gaps currently affect industries that represent almost 40% of employment. Shortages in manufacturing, health care, professional, scientific, and technical services, and financial professions are particularly extreme:
26 Rick Miner, “People Without Jobs, Jobs Without People,” Miner & Miner Management Consultants, February 2010, http://www.collegesontario.org/research/research_reports/people-without-jobs-jobs-without-people-final.pdf. 27 Ontario’s Workforce Shortage Coalition, “Employment-focused education for a world-leading economy,” 2013, http://www.workforcecoalition.ca/PDFs/Employment-Focused_Education_for_a_World-Leading_Economy.pdf. 28 Rick Miner, “People Without Jobs, Jobs Without People.” 29 Ibid.

16
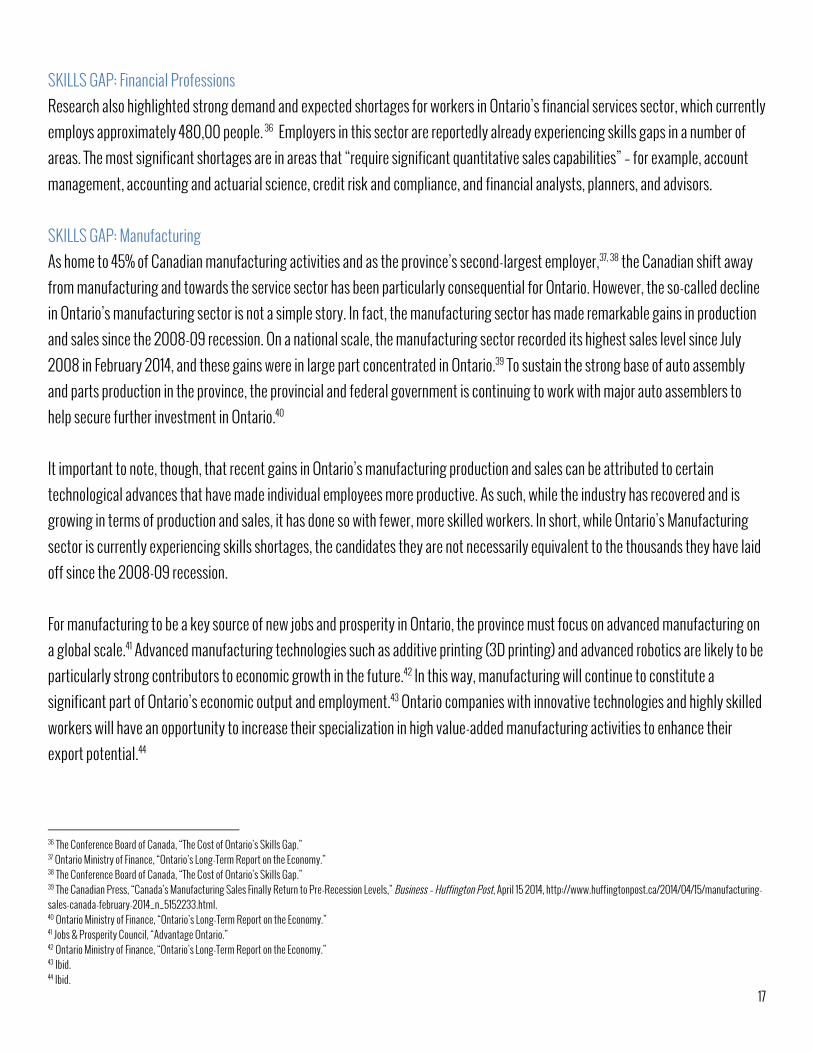
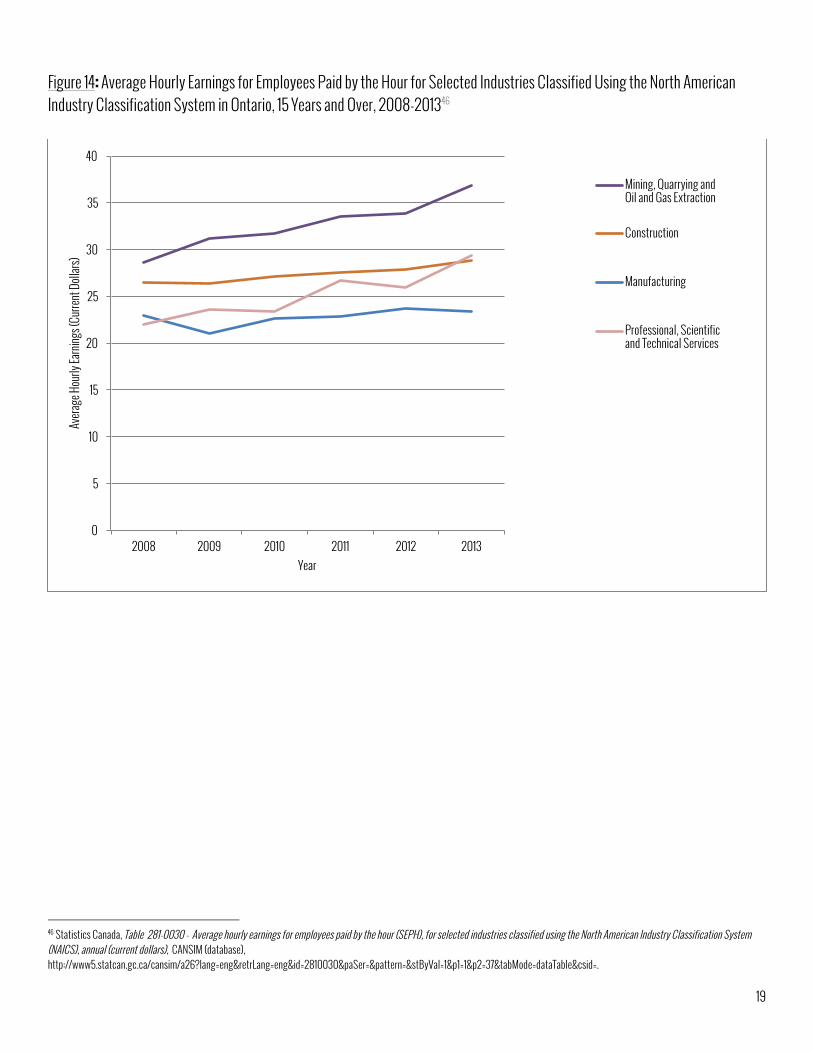
SKILLS GAP: Health Care As Ontario’s third-largest employer, skills shortages in Health Care and Social Assistance have substantial implications for not only the well-being of Ontario’s economy, but the health of its residents, as well. As baby boomers enter retirement and grow older, the number of health care workers will decrease while demand for health services will inevitably increase. In fact, this trend is already well underway: A 2012 report by the Ontario Ministry of Labour noted that health care employers “face recruitment and retention challenges, an aging workforce, a shortage of skilled professional staff, and an increase in casual and part-time work.” 30 Some estimate that there is already a significant shortfall of nurses in Ontario, particularly in rural or northern areas. Demand for health care professionals is also supported by very low unemployment-to-vacancy ratios. 31 It is important to note that shortages in Health Care and Social Assistance reflect a national trend, as well: Health-related occupations with national shortages include physicians, dentists, veterinarians, optometrists, chiropractors, pharmacists, dietitians, nutritionists, and medical technologists and technicians (Figure 13). SKILLS GAP: Professional, Scientific, and Technical Services The Professional, Scientific, and Technical Services sector encompasses industries whose production processes “are almost wholly dependent on worker skills” and that are primarily engaged in selling expertise.32 This sector employs 567,000 people offering legal services, architectural and engineering services, scientific and technical consulting, advertising services, and others. 33 Current skills shortages in this sector are in large part explained by the advanced skills and education required for these occupations. It is thus unsurprising that Professional, Scientific, and Technical Services have seen consistent wage growth since 2008 (Figure 14). Regarding more specific occupations in this broad array of industries, there is general consensus regarding the shortage of Engineers in Ontario. That said, engineering is also an incredibly far-reaching, diverse field, with different shortages in areas such as civil, mechanical, electrical, and chemical engineering, in addition to strong demand for engineers in aerospace, energy, and construction. In fact, engineering professions are the number one occupation that Ontario employers expect to have difficulty filling.34 There is also considerable demand for so-called “digital engineers”, such as computer technologists, programmers, and analysts that speaks to substantial job gains in Information and Communications Technology. Finally, the Skills Gap in Ontario’s Professional, Scientific, and Technical Services sector also comprises shortages in scientific professions, such as Chemistry, Physical and Life Sciences, and Scientific and Laboratory Services. 35
30 The Conference Board of Canada, “The Cost of Ontario’s Skills Gap,” June 2013, http://www.collegesontario.org/Need_to_Make_Skills_Work_Report_June_2013.pdf. 31 Ibid. 32 Ibid. 33 Ibid. 34 Ibid. 35 Ontario Ministry of Finance, “Ontario’s Long-Term Report on the Economy,” Queen’s Printer for Ontario, 2014, http://www.fin.gov.on.ca/en/economy/ltr/2014/ltr2014.pdf.
17
SKILLS GAP: Financial Professions Research also highlighted strong demand and expected shortages for workers in Ontario’s financial services sector, which currently employs approximately 480,00 people. 36 Employers in this sector are reportedly already experiencing skills gaps in a number of areas. The most significant shortages are in areas that “require significant quantitative sales capabilities” – for example, account management, accounting and actuarial science, credit risk and compliance, and financial analysts, planners, and advisors. SKILLS GAP: Manufacturing As home to 45% of Canadian manufacturing activities and as the province’s second-largest employer,37, 38 the Canadian shift away from manufacturing and towards the service sector has been particularly consequential for Ontario. However, the so-called decline in Ontario’s manufacturing sector is not a simple story. In fact, the manufacturing sector has made remarkable gains in production and sales since the 2008-09 recession. On a national scale, the manufacturing sector recorded its highest sales level since July 2008 in February 2014, and these gains were in large part concentrated in Ontario.39 To sustain the strong base of auto assembly and parts production in the province, the provincial and federal government is continuing to work with major auto assemblers to help secure further investment in Ontario.40 It important to note, though, that recent gains in Ontario’s manufacturing production and sales can be attributed to certain technological advances that have made individual employees more productive. As such, while the industry has recovered and is growing in terms of production and sales, it has done so with fewer, more skilled workers. In short, while Ontario’s Manufacturing sector is currently experiencing skills shortages, the candidates they are not necessarily equivalent to the thousands they have laid off since the 2008-09 recession. For manufacturing to be a key source of new jobs and prosperity in Ontario, the province must focus on advanced manufacturing on a global scale.41 Advanced manufacturing technologies such as additive printing (3D printing) and advanced robotics are likely to be particularly strong contributors to economic growth in the future.42 In this way, manufacturing will continue to constitute a significant part of Ontario’s economic output and employment.43 Ontario companies with innovative technologies and highly skilled workers will have an opportunity to increase their specialization in high value-added manufacturing activities to enhance their export potential.44 36 The Conference Board of Canada, “The Cost of Ontario’s Skills Gap.” 37 Ontario Ministry of Finance, “Ontario’s Long-Term Report on the Economy.” 38 The Conference Board of Canada, “The Cost of Ontario’s Skills Gap.” 39 The Canadian Press, “Canada’s Manufacturing Sales Finally Return to Pre-Recession Levels,” Business – Huffington Post, April 15 2014, http://www.huffingtonpost.ca/2014/04/15/manufacturing-sales-canada-february-2014_n_5152233.html. 40 Ontario Ministry of Finance, “Ontario’s Long-Term Report on the Economy.” 41 Jobs & Prosperity Council, “Advantage Ontario.” 42 Ontario Ministry of Finance, “Ontario’s Long-Term Report on the Economy.” 43 Ibid. 44 Ibid.
18
Figure 13: 25 Occupations Showing Signs of Skills Shortages in Canada, 201345
45 The Conference Board of Canada, “The Cost of Ontario’s Skills Gap.”
19
Figure 14: Average Hourly Earnings for Employees Paid by the Hour for Selected Industries Classified Using the North American Industry Classification System in Ontario, 15 Years and Over, 2008-201346
46 Statistics Canada, Table 281-0030 - Average hourly earnings for employees paid by the hour (SEPH), for selected industries classified using the North American Industry Classification System (NAICS), annual (current dollars), CANSIM (database), http://www5.statcan.gc.ca/cansim/a26?lang=eng&retrLang=eng&id=2810030&paSer=&pattern=&stByVal=1&p1=1&p2=37&tabMode=dataTable&csid=.
0
5
10
15
20
25
30
35
40
2008 2009 2010 2011 2012 2013
Avera
ge H
ourly
Earn
ings (
Curre
nt D
ollars
)
Year
Mining, Quarrying and Oil and Gas Extraction
Construction
Manufacturing
Professional, Scientific and Technical Services
20
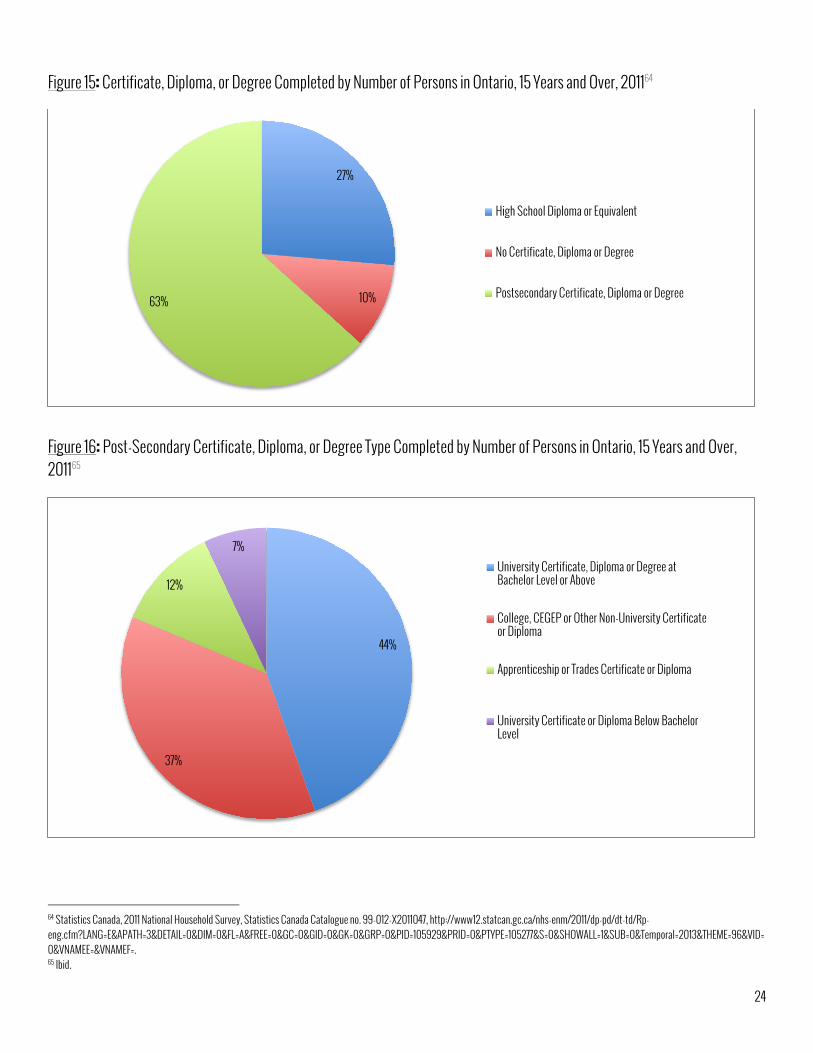
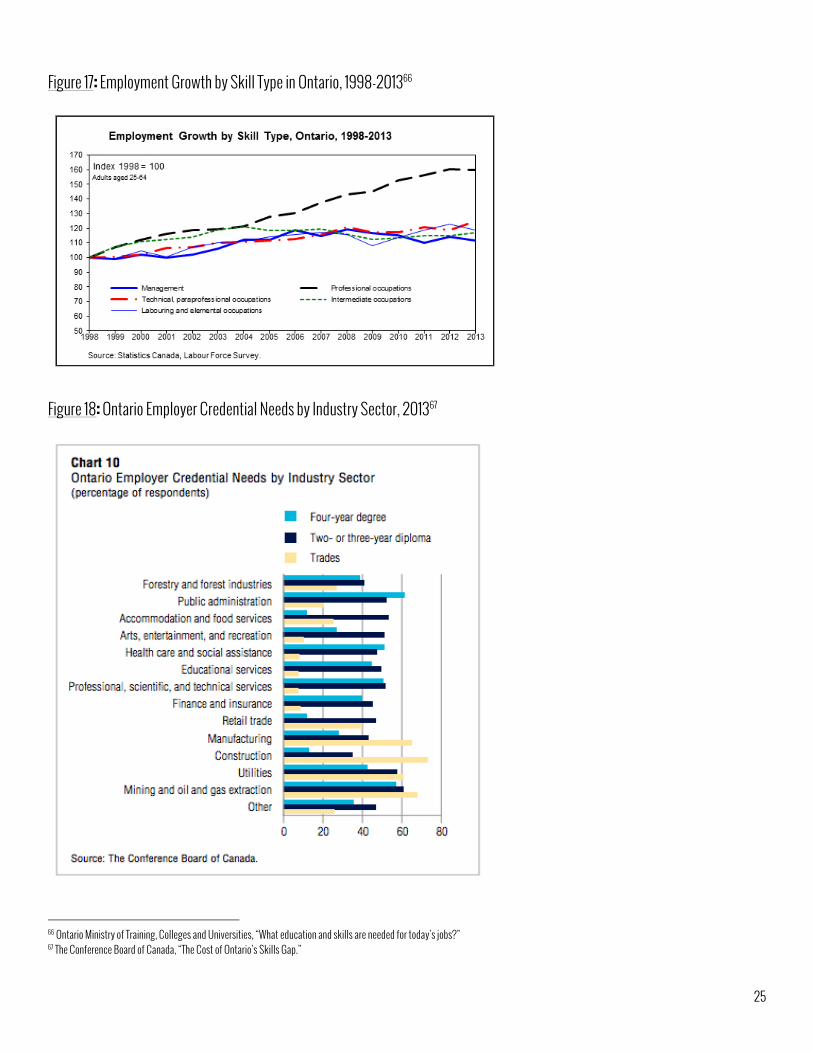
ONTARIO EDUCATION Education is the single most important tool available in addressing Ontario’s growing occupational shortages. Indeed, much of the Skills Gap can be explained by fact that changes in Ontario’s labour market are outpacing changes in education and skills training.47 To address the Skills Gap and encourage Ontario’s economic growth, the skills and qualifications of new members of the workforce must be aligned with clear economic opportunities and priorities.48 In light of the skills gaps that exist in the provincial labour market, it is often overlooked that Ontario has the highest post-secondary completion rate in Canada, and a higher level of post-secondary credential attainment than any other jurisdiction in the Organization of Economic Co-operation and Development (OECD). 49 In 2011, Approximately 63% of Ontarians had post-secondary training of some kind, relative to 27% of Ontarians that had a high school diploma and 10% without (Figure 15). A University Certificate, Diploma, or Degree at a Bachelor Level or Above was the most popular type of post-secondary education in Ontario at this time, representing 44% of Ontarians with post-secondary training and approximately 28% of Ontarians overall (Figure 16). Unfortunately, the reality of the pressing Skills Gap facing Ontario indicates that while Ontarians may be very well educated, they are not necessarily best educated in the most employable and productive fields and occupations. The pursuit of post-secondary credentials is as important as ever for youth in Halton Region and the Province of Ontario today. Recall that the Skills Gap is two-fold, the first aspect being a general shortage in post-secondary training across Ontario. Though youth unemployment rates in Ontario are startlingly high, they are higher still for Ontario youth without post-secondary training.50 This information supports the longstanding suggestion that education improves employment prospects in the long term. In fact, Ontarians with a high school education or some college or university training short of a diploma or degree are 10 percentage points less likely to be employed today than their similarly qualified peers twenty years ago.51 This evidence suggests that the education and skills required for most occupations in Ontario has increased over time.52 While there are still many low-skill, entry-level occupations available in Ontario, the basic skills required to enter those occupations has increased. Figure 17 demonstrates that the proportion of workers in Ontario employed in jobs that usually require post-secondary qualifications increased sharply between 1998 and 2013. Looking forward, it seems clear that an increasing proportion of the jobs that will exist will require a level of education or training beyond secondary school, be it an apprenticeship, a diploma, a degree, a certificate, and industry credential or professional qualification.
47 The Conference Board of Canada, “The Cost of Ontario’s Skills Gap.” 48 Jobs & Prosperity Council, “Advantage Ontario.” 49 The Conference Board of Canada, “The Cost of Ontario’s Skills Gap.” 50 Sean Geobey, “The Young and the Jobless.” 51 The Conference Board of Canada, “The Cost of Ontario’s Skills Gap.” 52 Ontario Ministry of Training, Colleges and Universities, “What education and skills are needed for today’s jobs?,” Government Of Ontario, Last Modified February 25 2014, http://www.tcu.gov.on.ca/eng/labourmarket/ojf/skillsNecessary.html.
21
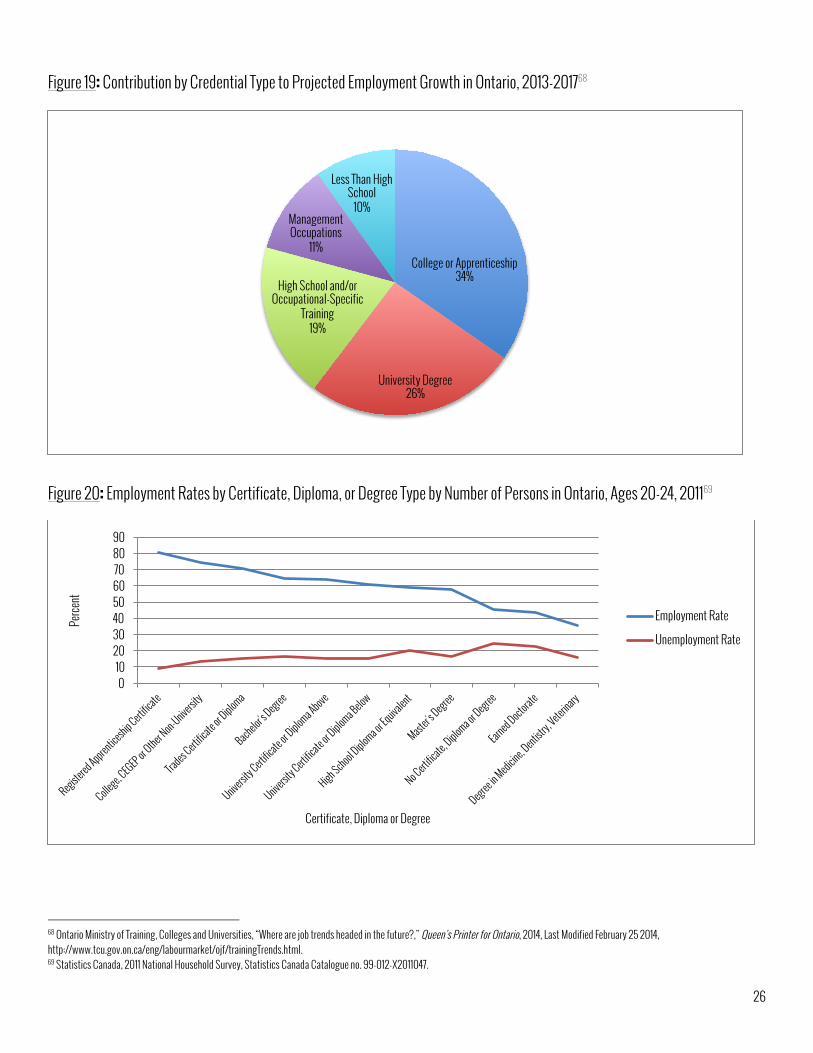
While encouraging students to pursue post-secondary education is certainly integral to tackling youth unemployment and the Skills Gap in Ontario, it is equally important to challenge the pervasive stigma that undervalues college and apprenticeship training relative to University degrees. Many Ontarians want their children to have so-called white-collar office positions, and not the kind of resource-based or industrial jobs for which there is still a strong demand. 53 Successfully challenging the Skills Gap in Ontario necessitates challenging this prejudice. Part of challenging this stigma requires that students in Ontario assess why they are motivated to go to University. Maclean’s Magazine suggests that if a student is attending University “to broaden their horizons, learn a skill useful to humanity, or steep themselves in knowledge, then the decision is a fine one. If the motive is money, students may be setting themselves up for serious disappointment. Not only is focusing on money the wrong basis on which to make a decision about attending university, it sheds light on a serious weakness in the rationale: the idea that the most worthwhile jobs require a university degree.”54 Admittedly, when undergraduate degrees and advanced graduate training were relatively rare, their so-called million-dollar promise appeared to secure a place in the Canadian middle class for each university graduate. The labour market’s demand for university graduates is not infinite, and as such, the expansion of university education in recent decades has diluted the earning power of graduates in Ontario overall.55 In fact, earnings premiums amongst University graduates are shrinking in Canada. Over the past decade, real weekly wages of high school and college graduates in Canada rose by 13%, compared to an approximate 8% growth rate among undergraduate degree holders, and more than double the rate seen among M.A. and PhD graduates.56 Compared to a relative decline in demand for university undergraduate training in Ontario, there is strong evidence of ongoing or growing demand for college diplomas and trades certifications from employers in Ontario. For example, a survey conducted by the Conference Board of Canada found that the greatest educational needs reported by Ontario employers are two- and three-year college diplomas, desired by 57% of employers, followed by four-year university degrees (44%), and trades certifications (41%).57 What’s more, when examining credential needs by Industry Sector (Figure 18), four-year university degrees were only preferable to two- or three-year diplomas in two sectors: Public Administration and Social Assistance. If demand for two- and three-year diplomas were combined with demand for trades certifications, university training would be least preferable in every sector observed. Further still, the Ontario Ministry of Training, Colleges and Universities expects college or apprenticeship training represent 34% of new jobs in Ontario by 2017, compared to an expected 26% of jobs created that will require university training (Figure 19).
53 Ken Coates and Bill Morrison, “The graduate’s million-dollar promise,” Maclean’s, January 16 2013, http://www.macleans.ca/society/life/the-million-dollar-promise/. 54 Ibid. 55 Brian Lee Crowley, “Evaluating the worth of a university degree,” The Globe and Mail, September 5 2013, http://www.theglobeandmail.com/report-on-business/economy/economy-lab/evaluating-the-worth-of-a-university-degree/article14115389/. 56 Benjamin Tal and Emanuella Enenajor, “Degrees of Success: The Payoff to Higher Education in Canada,” CIBC Economics, August 26, 2013, http://research.cibcwm.com/economic_public/download/if_2013-0826.pdf. 57 The Conference Board of Canada, “The Cost of Ontario’s Skills Gap.”
22
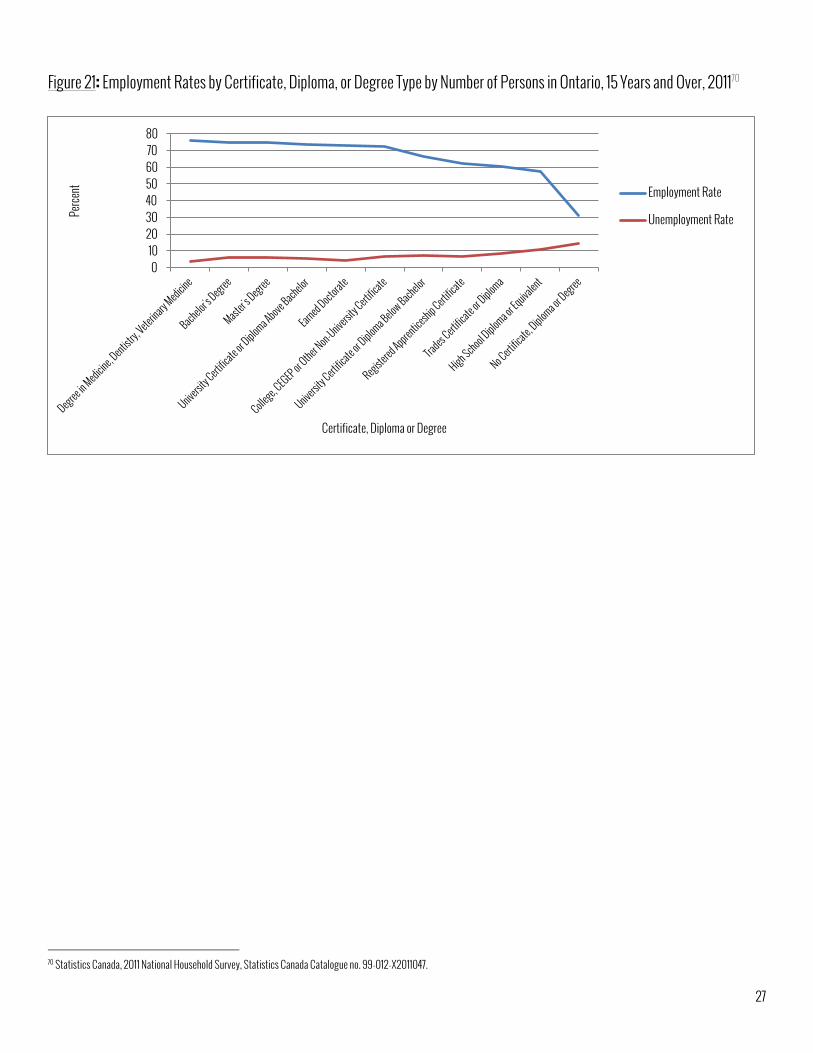
Further to this point, Canadian census data suggests that in 2011, employment rates for youth ages 20 to 24 in Halton Region and Ontario were highest among students who completed a Registered Apprenticeship Certificate, College, CEGEP or Other Non-University training, and Trades Certificates or Diplomas (Figure 20). Of course, these programs are, on average, shorter than other types of post-secondary training, and as such, students who were still in school at this time – for example, completing 4-year university degrees – tend to lower employment rates for their respective age bracket. That said, high employment rates for those students that have completed an apprenticeship, college, or trades certification speak to the strong demand that exists for recent graduates in these fields. It is equally important to note that while lifetime earnings for certain kinds of university training may surpass apprenticeship, college, or trades salaries, employment levels across all age brackets for apprenticeship, college, or trades training compare favorably to other Certificate, Diploma, and Degree Types (Figure 21). The highest employment rates in Ontario across all age groups in 2011 were for professional degrees such as Medicine, Dentistry, Optometry, and Law, followed by slightly lower employment rates for other college and university training. Employment rates for apprenticeship training and trades certificates were, overall, approximately 10% lower than university or college certifications, but still more than 30% higher than employment rates for those individuals with only high school diplomas or less. In addition to increasing the proportion of Ontarians with post-secondary training, addressing the Skills Gap will also require more informed decisions regarding field of study as Ontario students partake in educational and career planning. In fact, there is broad consensus that one’s field of study is often more indicative of earnings potential and employment prospects than that individual’s degree type or specific academic institution. Unfortunately, despite the overwhelming evidence that one’s field of study is the most important factor determining labour market outcomes, Ontario’s students have not gravitated to more financially advantageous fields in a way that reflects changing realities in the labour market:58 A study by the Conference Board of Canada last year revealed that among employers in Ontario seeking two- or three-year diplomas, most report the greatest need for diplomas in engineering and technology, except for smaller businesses, which prioritize business, finance, and administration.59 Results from the Ontario Employer Skills Survey concur that employers are in greatest need of post-secondary credentials in the subject areas of science, engineering and technology, business, and financial professions. 60 Among firms requiring four-year degree-holders, a majority of firms of all sizes anticipate demand for degrees in science and technology, followed by degrees in business. By contrast, graduates with liberal arts degrees are in demand by only a handful of those employers surveyed. Across subjects, the strongest financial return comes from specialized and professional fields such as medicine, law and engineering.61
58 Benjamin Tal and Emanuella Enenajor, “Degrees of Success.” 59 The Conference Board of Canada, “The Cost of Ontario’s Skills Gap.” 60 Ibid. 61 Benjamin Tal and Emanuella Enenajor, “Degrees of Success.”

23
While this information highlights stronger average outcomes in specialized technical and professional fields, a look at the dispersion of earnings across fields of study shows that there is a much greater risk of falling into a lower-income category for graduates of humanities and social sciences, with a limited risk for students of health, engineering, or business.62 These underperforming sectors comprise just under half of all recent graduates in Canada.63 With the exception of commerce, in the last ten years, Ontario has not seen a meaningful influx of students into fields of study with more advantageous outcomes. 62 Benjamin Tal and Emanuella Enenajor, “Degrees of Success.” 63 Ibid.
24
Figure 15: Certificate, Diploma, or Degree Completed by Number of Persons in Ontario, 15 Years and Over, 201164
Figure 16: Post-Secondary Certificate, Diploma, or Degree Type Completed by Number of Persons in Ontario, 15 Years and Over, 201165
64 Statistics Canada, 2011 National Household Survey, Statistics Canada Catalogue no. 99-012-X2011047, http://www12.statcan.gc.ca/nhs-enm/2011/dp-pd/dt-td/Rp-eng.cfm?LANG=E&APATH=3&DETAIL=0&DIM=0&FL=A&FREE=0&GC=0&GID=0&GK=0&GRP=0&PID=105929&PRID=0&PTYPE=105277&S=0&SHOWALL=1&SUB=0&Temporal=2013&THEME=96&VID=0&VNAMEE=&VNAMEF=. 65 Ibid.
27%
10% 63%
High School Diploma or Equivalent
No Certificate, Diploma or Degree
Postsecondary Certificate, Diploma or Degree
44%
37%
12%
7% University Certificate, Diploma or Degree at Bachelor Level or Above
College, CEGEP or Other Non-University Certificate or Diploma
Apprenticeship or Trades Certificate or Diploma
University Certificate or Diploma Below Bachelor Level
25
Figure 17: Employment Growth by Skill Type in Ontario, 1998-201366
Figure 18: Ontario Employer Credential Needs by Industry Sector, 201367
66 Ontario Ministry of Training, Colleges and Universities, “What education and skills are needed for today’s jobs?” 67 The Conference Board of Canada, “The Cost of Ontario’s Skills Gap.”
26
Figure 19: Contribution by Credential Type to Projected Employment Growth in Ontario, 2013-201768
Figure 20: Employment Rates by Certificate, Diploma, or Degree Type by Number of Persons in Ontario, Ages 20-24, 201169
68 Ontario Ministry of Training, Colleges and Universities, “Where are job trends headed in the future?,” Queen’s Printer for Ontario, 2014, Last Modified February 25 2014, http://www.tcu.gov.on.ca/eng/labourmarket/ojf/trainingTrends.html. 69 Statistics Canada, 2011 National Household Survey, Statistics Canada Catalogue no. 99-012-X2011047.
College or Apprenticeship 34%
University Degree 26%
High School and/or Occupational-Specific
Training 19%
Management Occupations
11%
Less Than High School
10%
0 10
20 30 40 50 60 70 80 90
Perce
nt
Certificate, Diploma or Degree
Employment Rate
Unemployment Rate
27
Figure 21: Employment Rates by Certificate, Diploma, or Degree Type by Number of Persons in Ontario, 15 Years and Over, 201170
70 Statistics Canada, 2011 National Household Survey, Statistics Canada Catalogue no. 99-012-X2011047.
0 10
20 30 40 50 60 70 80
Perce
nt
Certificate, Diploma or Degree
Employment Rate
Unemployment Rate
28
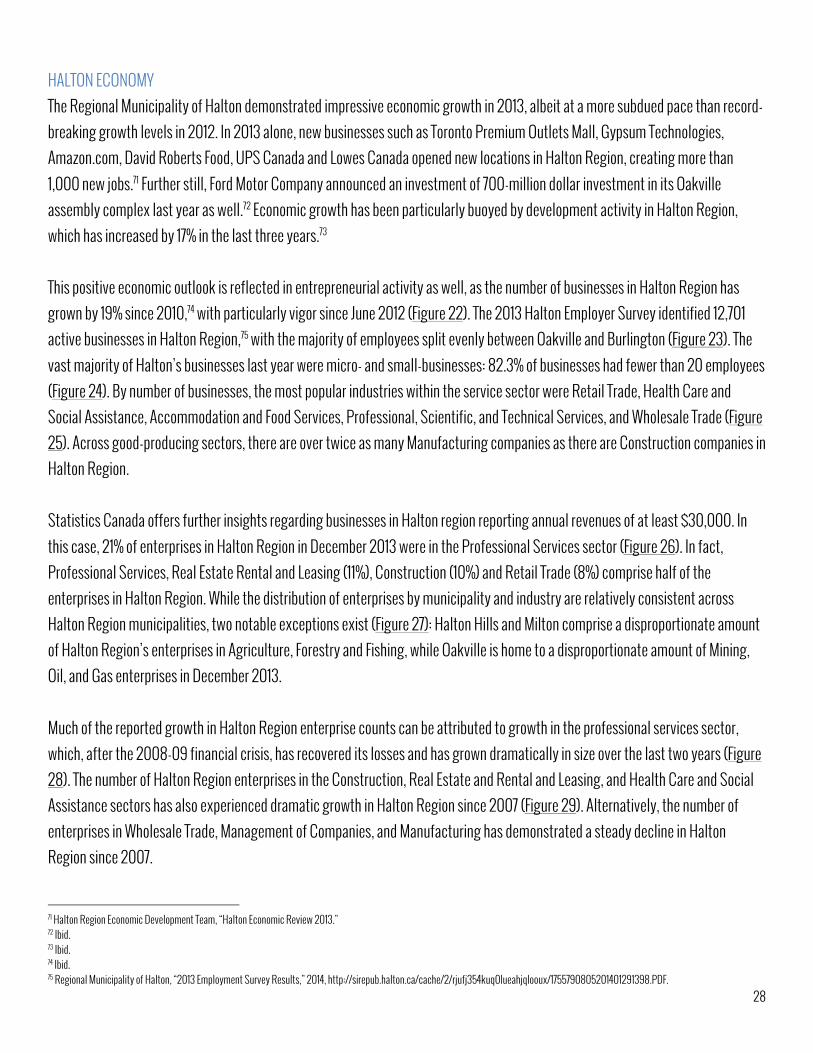
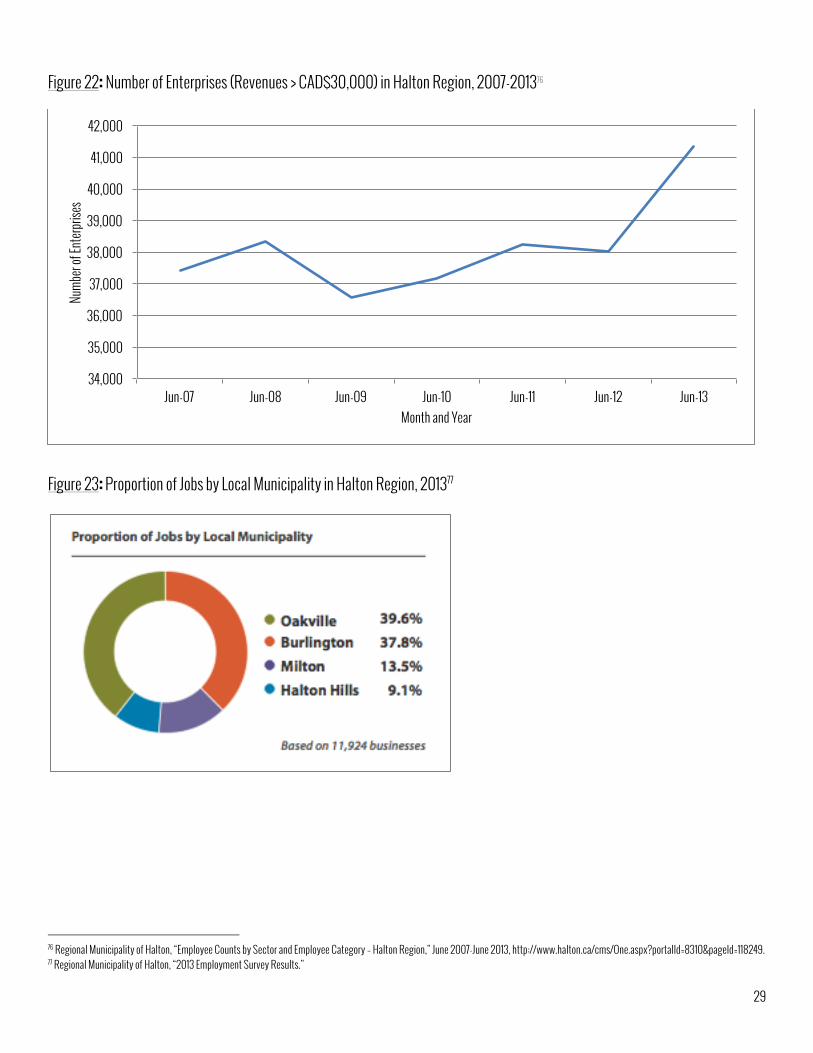
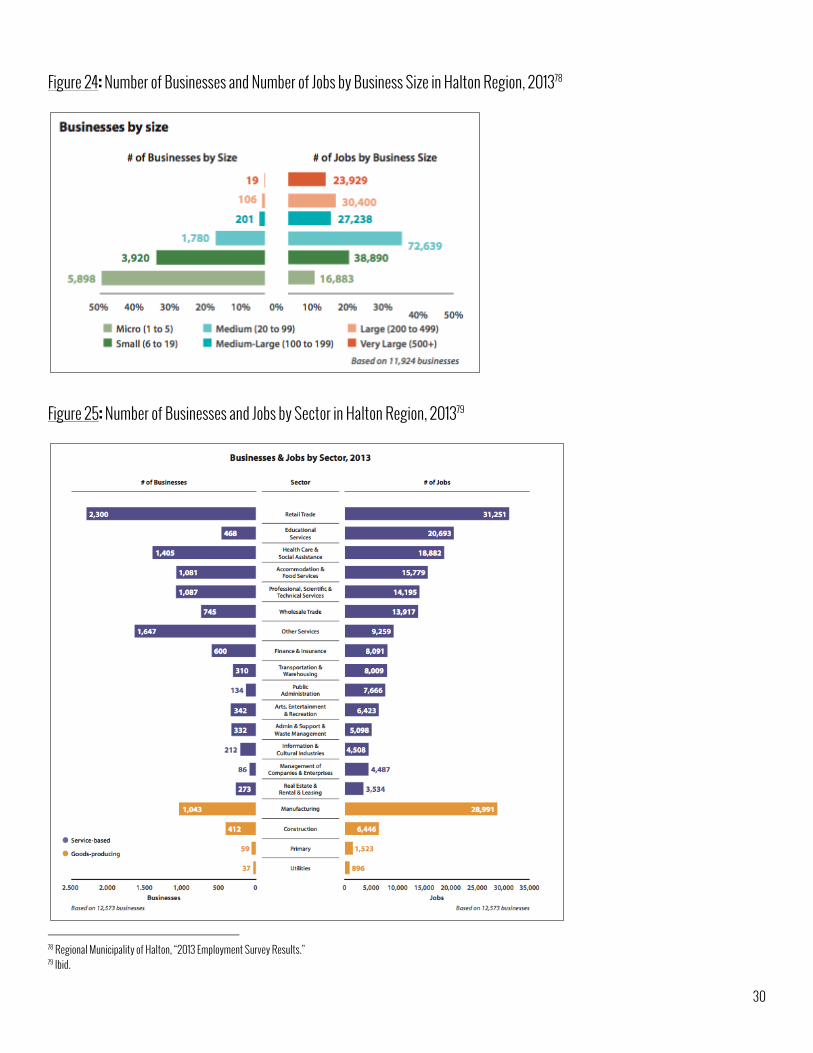
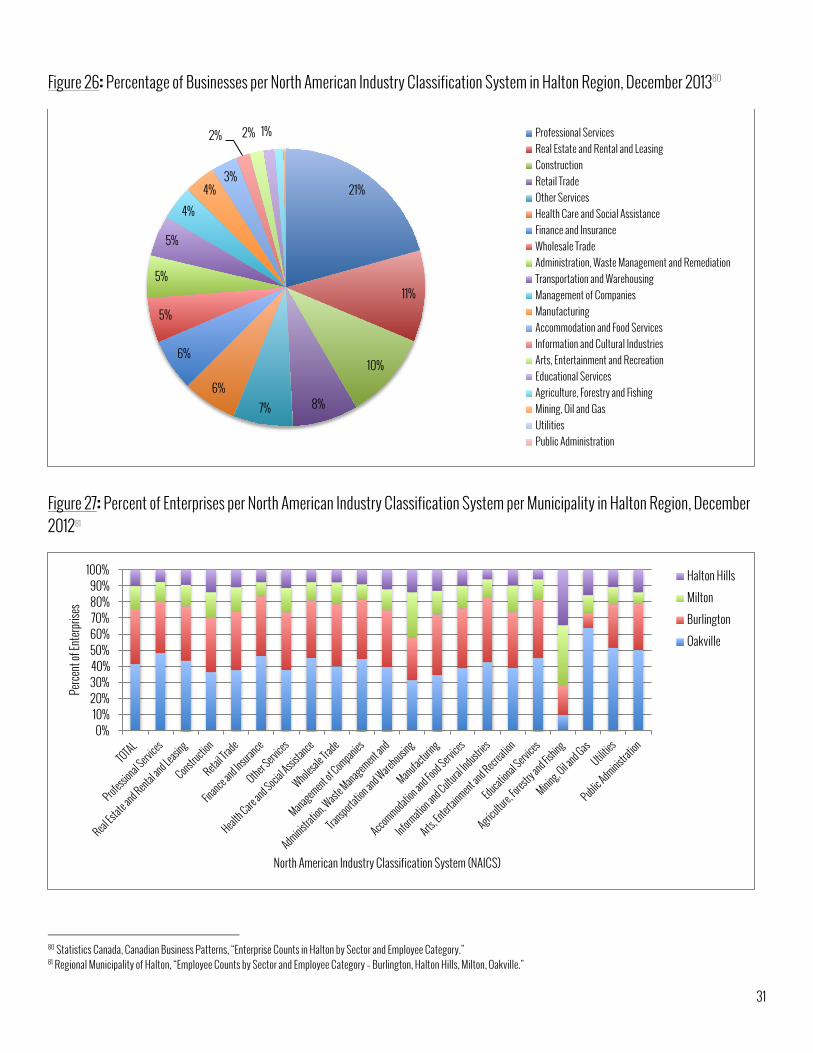
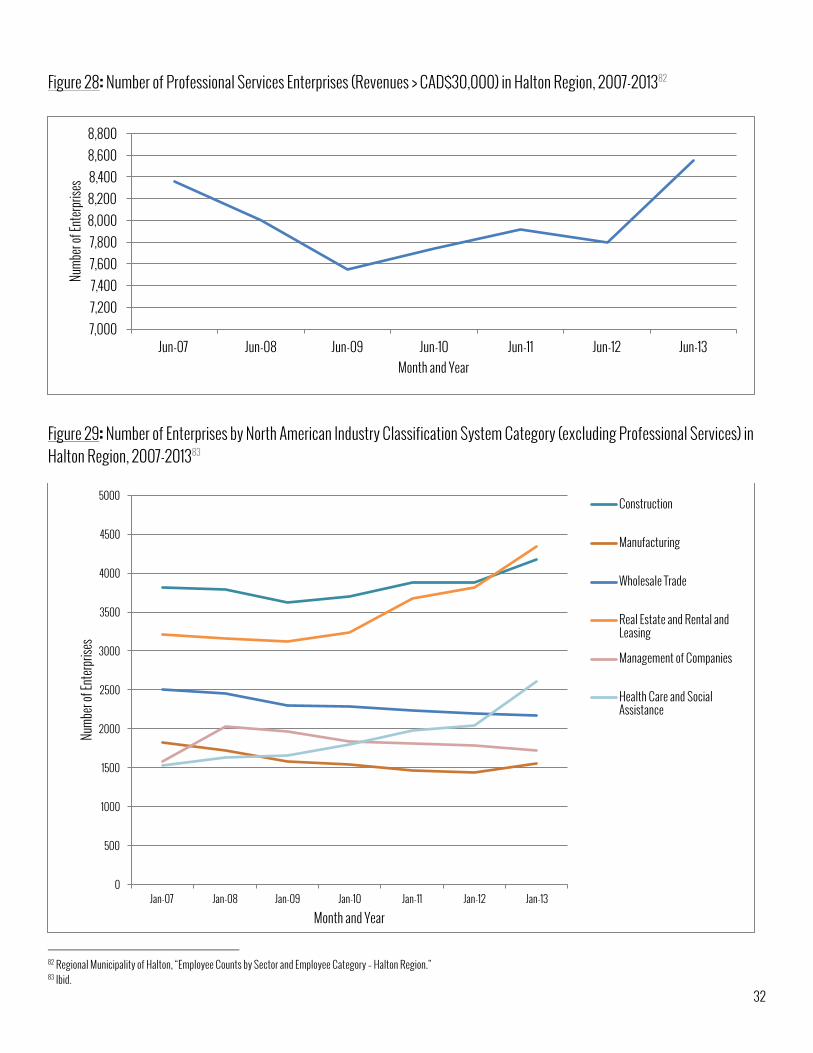
HALTON ECONOMY The Regional Municipality of Halton demonstrated impressive economic growth in 2013, albeit at a more subdued pace than record-breaking growth levels in 2012. In 2013 alone, new businesses such as Toronto Premium Outlets Mall, Gypsum Technologies, Amazon.com, David Roberts Food, UPS Canada and Lowes Canada opened new locations in Halton Region, creating more than 1,000 new jobs.71 Further still, Ford Motor Company announced an investment of 700-million dollar investment in its Oakville assembly complex last year as well.72 Economic growth has been particularly buoyed by development activity in Halton Region, which has increased by 17% in the last three years.73 This positive economic outlook is reflected in entrepreneurial activity as well, as the number of businesses in Halton Region has grown by 19% since 2010,74 with particularly vigor since June 2012 (Figure 22). The 2013 Halton Employer Survey identified 12,701 active businesses in Halton Region,75 with the majority of employees split evenly between Oakville and Burlington (Figure 23). The vast majority of Halton’s businesses last year were micro- and small-businesses: 82.3% of businesses had fewer than 20 employees (Figure 24). By number of businesses, the most popular industries within the service sector were Retail Trade, Health Care and Social Assistance, Accommodation and Food Services, Professional, Scientific, and Technical Services, and Wholesale Trade (Figure 25). Across good-producing sectors, there are over twice as many Manufacturing companies as there are Construction companies in Halton Region. Statistics Canada offers further insights regarding businesses in Halton region reporting annual revenues of at least $30,000. In this case, 21% of enterprises in Halton Region in December 2013 were in the Professional Services sector (Figure 26). In fact, Professional Services, Real Estate Rental and Leasing (11%), Construction (10%) and Retail Trade (8%) comprise half of the enterprises in Halton Region. While the distribution of enterprises by municipality and industry are relatively consistent across Halton Region municipalities, two notable exceptions exist (Figure 27): Halton Hills and Milton comprise a disproportionate amount of Halton Region’s enterprises in Agriculture, Forestry and Fishing, while Oakville is home to a disproportionate amount of Mining, Oil, and Gas enterprises in December 2013. Much of the reported growth in Halton Region enterprise counts can be attributed to growth in the professional services sector, which, after the 2008-09 financial crisis, has recovered its losses and has grown dramatically in size over the last two years (Figure 28). The number of Halton Region enterprises in the Construction, Real Estate and Rental and Leasing, and Health Care and Social Assistance sectors has also experienced dramatic growth in Halton Region since 2007 (Figure 29). Alternatively, the number of enterprises in Wholesale Trade, Management of Companies, and Manufacturing has demonstrated a steady decline in Halton Region since 2007.
71 Halton Region Economic Development Team, “Halton Economic Review 2013.” 72 Ibid. 73 Ibid. 74 Ibid. 75 Regional Municipality of Halton, “2013 Employment Survey Results,” 2014, http://sirepub.halton.ca/cache/2/rjufj354kuq0lueahjqlooux/1755790805201401291398.PDF.
29
Figure 22: Number of Enterprises (Revenues > CAD$30,000) in Halton Region, 2007-201376
Figure 23: Proportion of Jobs by Local Municipality in Halton Region, 201377
76 Regional Municipality of Halton, “Employee Counts by Sector and Employee Category – Halton Region,” June 2007-June 2013, http://www.halton.ca/cms/One.aspx?portalId=8310&pageId=118249. 77 Regional Municipality of Halton, “2013 Employment Survey Results.”
34,000
35,000
36,000
37,000
38,000
39,000
40,000
41,000
42,000
Jun-07 Jun-08 Jun-09 Jun-10 Jun-11 Jun-12 Jun-13
Numb
er of
Ente
rpris
es
Month and Year
30
Figure 24: Number of Businesses and Number of Jobs by Business Size in Halton Region, 201378
Figure 25: Number of Businesses and Jobs by Sector in Halton Region, 201379
78 Regional Municipality of Halton, “2013 Employment Survey Results.” 79 Ibid.
31
Figure 26: Percentage of Businesses per North American Industry Classification System in Halton Region, December 201380
Figure 27: Percent of Enterprises per North American Industry Classification System per Municipality in Halton Region, December 201281
80 Statistics Canada, Canadian Business Patterns, “Enterprise Counts in Halton by Sector and Employee Category.” 81 Regional Municipality of Halton, “Employee Counts by Sector and Employee Category – Burlington, Halton Hills, Milton, Oakville.”
21%
11%
10%
8% 7% 6%
6%
5%
5%
5%
4%
4% 3%
2% 2% 1% Professional Services Real Estate and Rental and Leasing Construction Retail Trade Other Services Health Care and Social Assistance Finance and Insurance Wholesale Trade Administration, Waste Management and Remediation Transportation and Warehousing Management of Companies Manufacturing Accommodation and Food Services Information and Cultural Industries Arts, Entertainment and Recreation Educational Services Agriculture, Forestry and Fishing Mining, Oil and Gas Utilities Public Administration
0% 10%
20% 30% 40% 50% 60% 70% 80% 90%
100%
Perce
nt of
Ente
rpris
es
North American Industry Classification System (NAICS)
Halton Hills
Milton
Burlington
Oakville
32
Figure 28: Number of Professional Services Enterprises (Revenues > CAD$30,000) in Halton Region, 2007-201382
Figure 29: Number of Enterprises by North American Industry Classification System Category (excluding Professional Services) in Halton Region, 2007-201383
82 Regional Municipality of Halton, “Employee Counts by Sector and Employee Category – Halton Region.” 83 Ibid.
7,000 7,200 7,400 7,600 7,800
8,000 8,200 8,400 8,600 8,800
Jun-07 Jun-08 Jun-09 Jun-10 Jun-11 Jun-12 Jun-13
Numb
er of
Ente
rpris
es
Month and Year
0
500
1000
1500
2000
2500
3000
3500
4000
4500
5000
Jan-07 Jan-08 Jan-09 Jan-10 Jan-11 Jan-12 Jan-13
Numb
er of
Ente
rpris
es
Month and Year
Construction
Manufacturing
Wholesale Trade
Real Estate and Rental and Leasing
Management of Companies
Health Care and Social Assistance
33
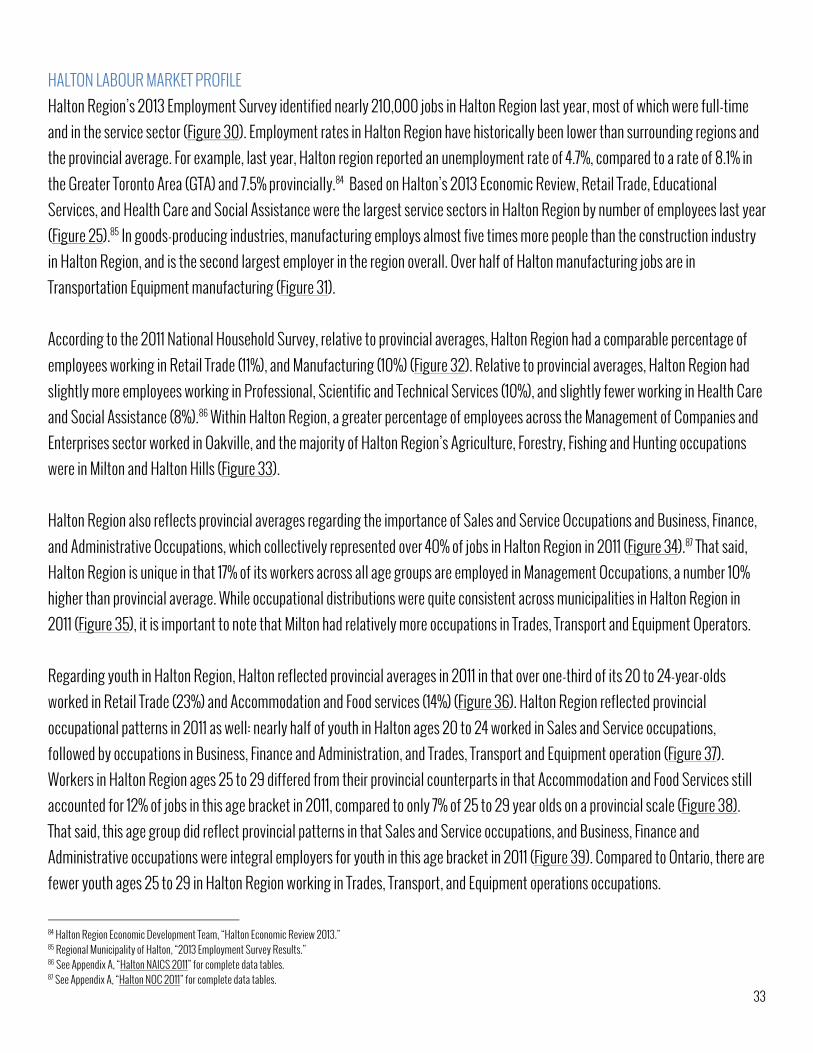
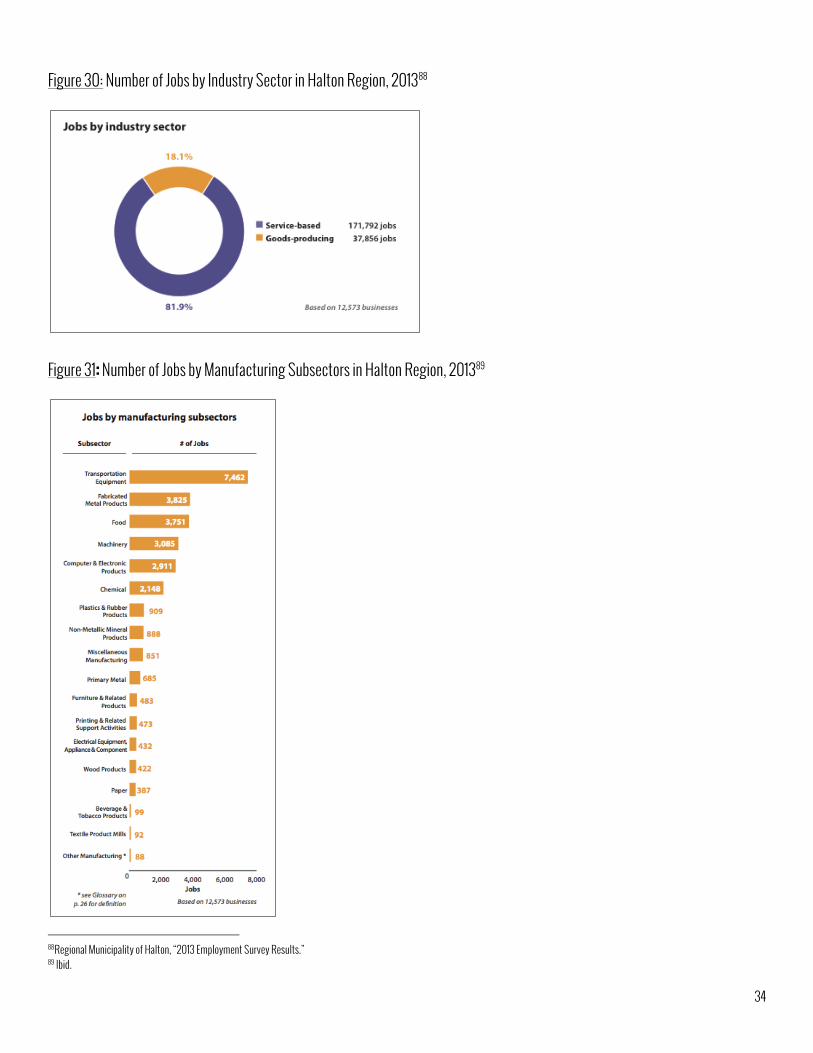
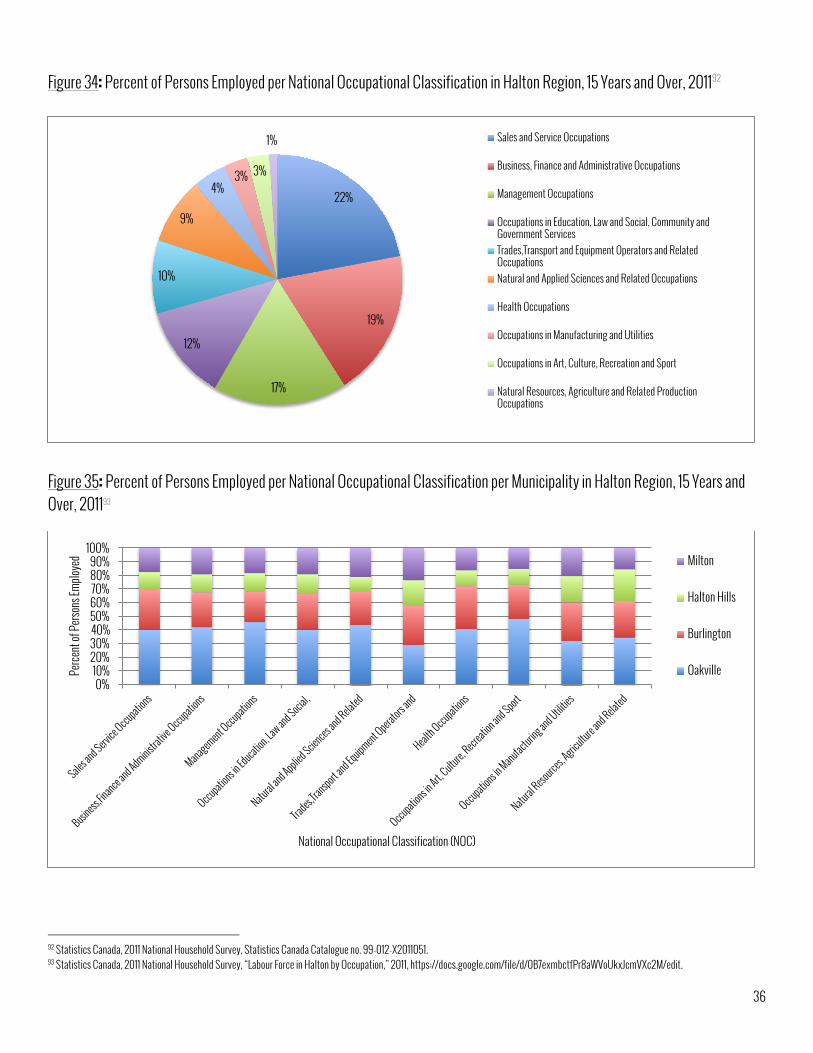
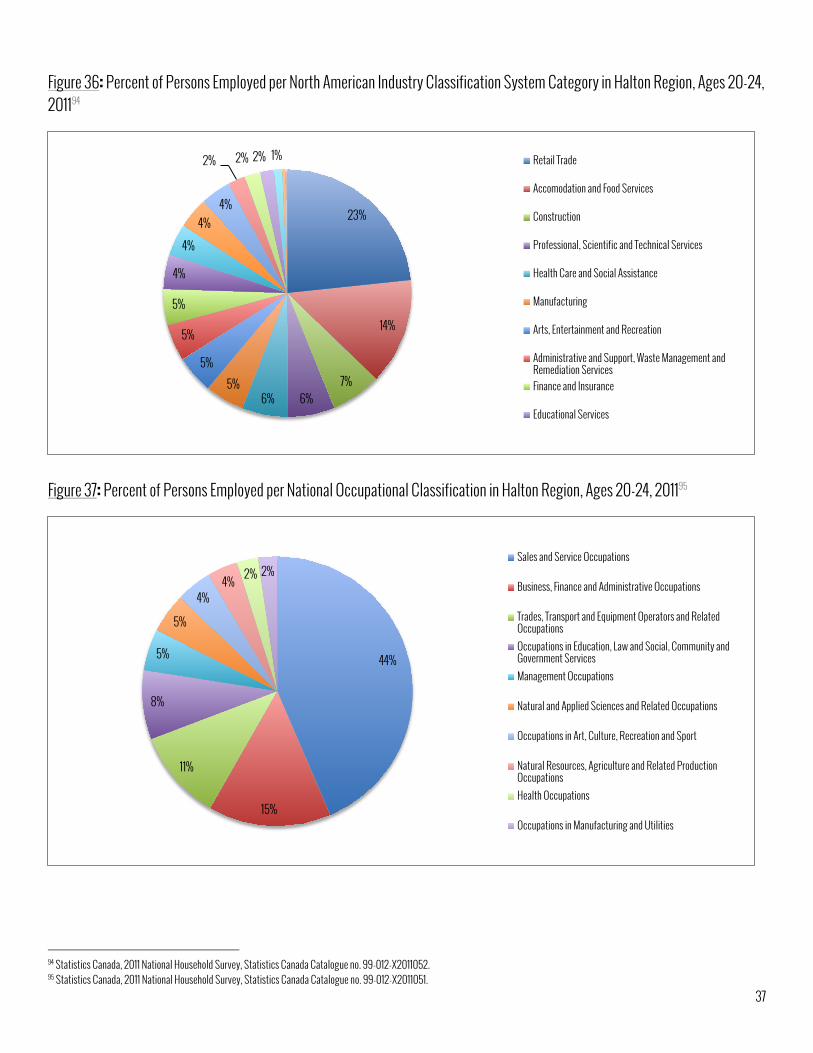
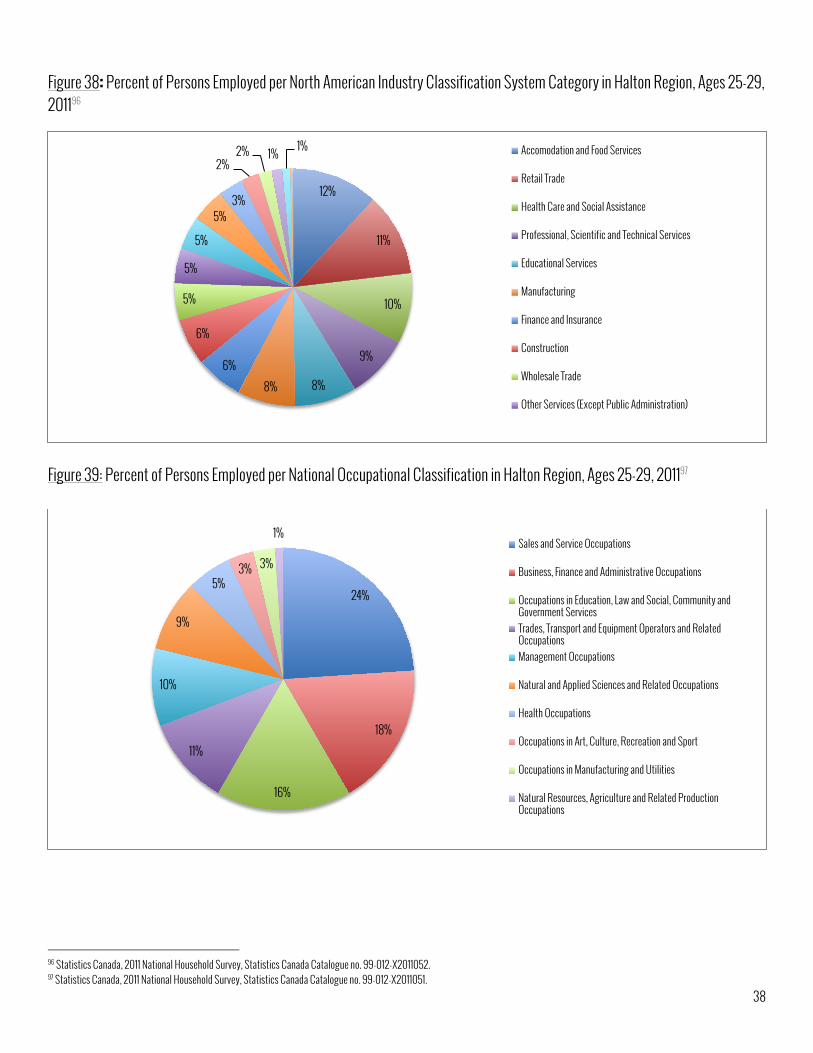
HALTON LABOUR MARKET PROFILE Halton Region’s 2013 Employment Survey identified nearly 210,000 jobs in Halton Region last year, most of which were full-time and in the service sector (Figure 30). Employment rates in Halton Region have historically been lower than surrounding regions and the provincial average. For example, last year, Halton region reported an unemployment rate of 4.7%, compared to a rate of 8.1% in the Greater Toronto Area (GTA) and 7.5% provincially.84 Based on Halton’s 2013 Economic Review, Retail Trade, Educational Services, and Health Care and Social Assistance were the largest service sectors in Halton Region by number of employees last year (Figure 25).85 In goods-producing industries, manufacturing employs almost five times more people than the construction industry in Halton Region, and is the second largest employer in the region overall. Over half of Halton manufacturing jobs are in Transportation Equipment manufacturing (Figure 31). According to the 2011 National Household Survey, relative to provincial averages, Halton Region had a comparable percentage of employees working in Retail Trade (11%), and Manufacturing (10%) (Figure 32). Relative to provincial averages, Halton Region had slightly more employees working in Professional, Scientific and Technical Services (10%), and slightly fewer working in Health Care and Social Assistance (8%).86 Within Halton Region, a greater percentage of employees across the Management of Companies and Enterprises sector worked in Oakville, and the majority of Halton Region’s Agriculture, Forestry, Fishing and Hunting occupations were in Milton and Halton Hills (Figure 33). Halton Region also reflects provincial averages regarding the importance of Sales and Service Occupations and Business, Finance, and Administrative Occupations, which collectively represented over 40% of jobs in Halton Region in 2011 (Figure 34).87 That said, Halton Region is unique in that 17% of its workers across all age groups are employed in Management Occupations, a number 10% higher than provincial average. While occupational distributions were quite consistent across municipalities in Halton Region in 2011 (Figure 35), it is important to note that Milton had relatively more occupations in Trades, Transport and Equipment Operators. Regarding youth in Halton Region, Halton reflected provincial averages in 2011 in that over one-third of its 20 to 24-year-olds worked in Retail Trade (23%) and Accommodation and Food services (14%) (Figure 36). Halton Region reflected provincial occupational patterns in 2011 as well: nearly half of youth in Halton ages 20 to 24 worked in Sales and Service occupations, followed by occupations in Business, Finance and Administration, and Trades, Transport and Equipment operation (Figure 37). Workers in Halton Region ages 25 to 29 differed from their provincial counterparts in that Accommodation and Food Services still accounted for 12% of jobs in this age bracket in 2011, compared to only 7% of 25 to 29 year olds on a provincial scale (Figure 38). That said, this age group did reflect provincial patterns in that Sales and Service occupations, and Business, Finance and Administrative occupations were integral employers for youth in this age bracket in 2011 (Figure 39). Compared to Ontario, there are fewer youth ages 25 to 29 in Halton Region working in Trades, Transport, and Equipment operations occupations.
84 Halton Region Economic Development Team, “Halton Economic Review 2013.” 85 Regional Municipality of Halton, “2013 Employment Survey Results.” 86 See Appendix A, “Halton NAICS 2011” for complete data tables. 87 See Appendix A, “Halton NOC 2011” for complete data tables.
34
Figure 30: Number of Jobs by Industry Sector in Halton Region, 201388
Figure 31: Number of Jobs by Manufacturing Subsectors in Halton Region, 201389
88Regional Municipality of Halton, “2013 Employment Survey Results.” 89 Ibid.
35
Figure 32: Percent of Persons Employed per North American Industry Classification System Category in Halton Region, 15 Years and Over, 201190
Figure 33: Percent of Persons Employed per North American Industry Classification System Category per Municipality in Halton Region, 15 Years and Over, 201191
90 Statistics Canada, 2011 National Household Survey, Statistics Canada Catalogue no. 99-012-X2011052. 91 Statistics Canada, 2011 National Household Survey, “Labour Force in Halton by Industry Sector,” 2011, https://docs.google.com/file/d/0B7exmbctfPr8c1hOaE5LcGVrTmM/edit.
11%
10%
10%
8%
8% 8%
7%
7%
5%
5%
5%
4% 4%
3%
2% 2% 1% 1% Retail Trade
Manufacturing
Professional, Scientific and Technical Services
Health Care and Social Assistance
Finance and Insurance
Educational Services
Wholesale Trade
Other Services (Except Public Administration)
Public Administration
0% 10%
20% 30% 40% 50% 60% 70% 80% 90%
100%
Perce
nt of
Perso
ns Em
ploye
d
North American Industry Classification System (NAICS)
Milton
Halton Hills
Burlington
Oakville
36
Figure 34: Percent of Persons Employed per National Occupational Classification in Halton Region, 15 Years and Over, 201192
Figure 35: Percent of Persons Employed per National Occupational Classification per Municipality in Halton Region, 15 Years and Over, 201193
92 Statistics Canada, 2011 National Household Survey, Statistics Canada Catalogue no. 99-012-X2011051. 93 Statistics Canada, 2011 National Household Survey, “Labour Force in Halton by Occupation,” 2011, https://docs.google.com/file/d/0B7exmbctfPr8aWVoUkxJcmVXc2M/edit.
22%
19%
17%
12%
10%
9%
4% 3% 3%
1% Sales and Service Occupations
Business, Finance and Administrative Occupations
Management Occupations
Occupations in Education, Law and Social, Community and Government Services Trades,Transport and Equipment Operators and Related Occupations Natural and Applied Sciences and Related Occupations
Health Occupations
Occupations in Manufacturing and Utilities
Occupations in Art, Culture, Recreation and Sport
Natural Resources, Agriculture and Related Production Occupations
0% 10%
20% 30% 40% 50% 60% 70% 80% 90%
100%
Perce
nt of
Perso
ns Em
ploye
d
National Occupational Classification (NOC)
Milton
Halton Hills
Burlington
Oakville
37
Figure 36: Percent of Persons Employed per North American Industry Classification System Category in Halton Region, Ages 20-24, 201194
Figure 37: Percent of Persons Employed per National Occupational Classification in Halton Region, Ages 20-24, 201195
94 Statistics Canada, 2011 National Household Survey, Statistics Canada Catalogue no. 99-012-X2011052. 95 Statistics Canada, 2011 National Household Survey, Statistics Canada Catalogue no. 99-012-X2011051.
23%
14%
7% 6% 6%
5%
5%
5%
5%
4%
4%
4% 4%
2% 2% 2% 1% Retail Trade
Accomodation and Food Services
Construction
Professional, Scientific and Technical Services
Health Care and Social Assistance
Manufacturing
Arts, Entertainment and Recreation
Administrative and Support, Waste Management and Remediation Services Finance and Insurance
Educational Services
44%
15%
11%
8%
5%
5%
4% 4% 2% 2%
Sales and Service Occupations
Business, Finance and Administrative Occupations
Trades, Transport and Equipment Operators and Related Occupations Occupations in Education, Law and Social, Community and Government Services Management Occupations
Natural and Applied Sciences and Related Occupations
Occupations in Art, Culture, Recreation and Sport
Natural Resources, Agriculture and Related Production Occupations Health Occupations
Occupations in Manufacturing and Utilities
38
Figure 38: Percent of Persons Employed per North American Industry Classification System Category in Halton Region, Ages 25-29, 201196
Figure 39: Percent of Persons Employed per National Occupational Classification in Halton Region, Ages 25-29, 201197
96 Statistics Canada, 2011 National Household Survey, Statistics Canada Catalogue no. 99-012-X2011052. 97 Statistics Canada, 2011 National Household Survey, Statistics Canada Catalogue no. 99-012-X2011051.
12%
11%
10%
9%
8% 8%
6%
6%
5%
5%
5%
5% 3%
2% 2% 1% 1% Accomodation and Food Services
Retail Trade
Health Care and Social Assistance
Professional, Scientific and Technical Services
Educational Services
Manufacturing
Finance and Insurance
Construction
Wholesale Trade
Other Services (Except Public Administration)
24%
18%
16%
11%
10%
9%
5% 3% 3%
1% Sales and Service Occupations
Business, Finance and Administrative Occupations
Occupations in Education, Law and Social, Community and Government Services Trades, Transport and Equipment Operators and Related Occupations Management Occupations
Natural and Applied Sciences and Related Occupations
Health Occupations
Occupations in Art, Culture, Recreation and Sport
Occupations in Manufacturing and Utilities
Natural Resources, Agriculture and Related Production Occupations
39
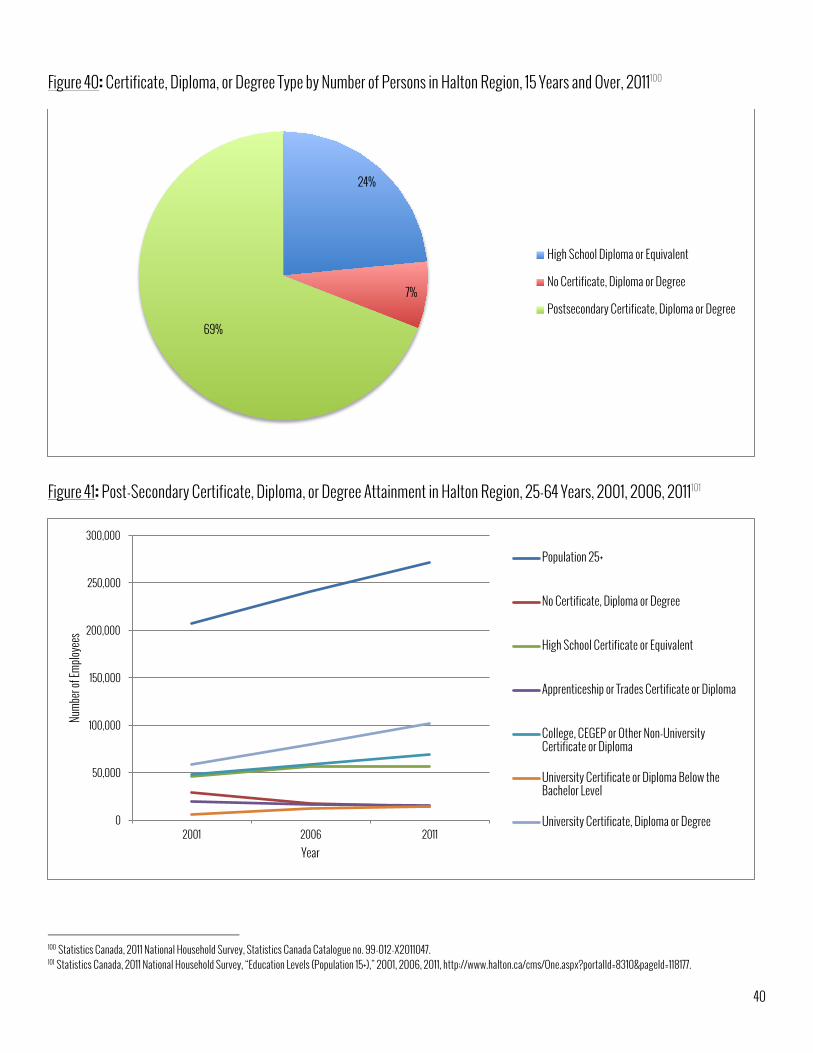
HALTON EDUCATION Halton is well above provincial averages regarding its rate of post-secondary completion. In 2011, 63% of Ontarians ages 15 years
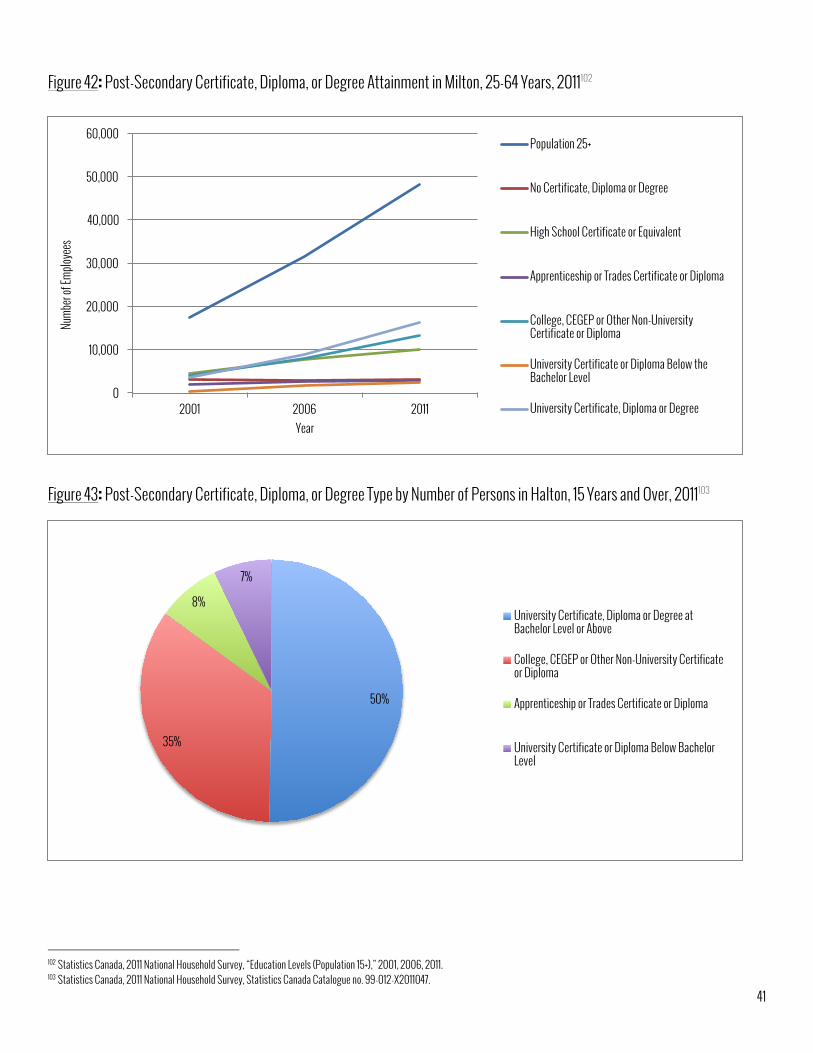
and over had post-secondary credentials, compared to approximately 69% of people in Halton Region (Figure 40). According to the Regional Municipality of Halton, 75% of residents in Halton over the age of 25 had post-secondary qualifications last year. 98 Post-secondary attainment in Halton Region amongst 25-64 year olds has risen consistently since 2001, according to 2001, 2006, and 2011 census data (Figure 41). However, despite dramatic population growth, the number of people with completed apprenticeship certifications and university training below the bachelor level appear to have stagnated or declined in the long term. The most dramatic growth in educational attainment across Halton Region amongst 25-64 year olds has been in the earning of university certificates, diplomas and degrees at the bachelor level. It is also noteworthy that much of the growth in these post-secondary figures can be attributed to increases in educational attainment in Milton since 2001 (Figure 42). There was an obvious preference in Halton Region for university certificates and diplomas in 2011 (Figure 43), relative to provincial patterns. In Ontario, 51% of people ages 15 and older had some kind of university certification in 2011, versus 57% of people in Halton Region. It is particularly important to note that in 2011, only 8% of people ages 15 and over in Halton Region had apprenticeship or trades training of some sort, compared to a rate of 12% across Ontario. Regarding current employer needs in Halton Region, the 2012 Halton Peel Employer Survey revealed that under 10% of employers in Halton and Peel Region actively seek candidates with bachelors degrees to fill entry-level positions, compared to 10% of employers that reportedly look for trades certifications and nearly 20% of employers looking for candidates with college diplomas.99 This survey also revealed that in 2012, the technical skills of job candidates was the top concern for employers in Halton and Peel Region, highlighting that a skills gap exists not only in Ontario and Canada, but Halton Region as well. Of course, these results vary based on the sector in question. For example, manufacturing employers had higher levels of concern regarding the technical skills of job candidates. What’s more, manufacturers in Halton and Peel Region expected the retirement of baby boomers to affect them substantially from 2012 to 2017. Finally, the 2012 Halton Peel Employer Survey also asked employers in Halton and Peel Region to rank the importance of various factors when evaluating candidates for various entry-level positions. It is important to note that demonstrable work ethic, strong interpersonal skills, communication skills, and personality – so-called “soft skills” – were evidently most important, indicating that while one’s education is certainly important in acquiring certain technical skills, that training is only one aspect of a candidate’s profile under evaluation.
98 Halton Region Economic Development Team, “Halton Economic Review 2013.” 99 Peel Halton Workforce Development Group, “Employer Survey 2012: Results and Analysis,” Employment Ontario, 2013, http://www.peelhaltonworkforce.com/sites/default/files/Survey_ResultsAnalysis_Report13%20final.pdf.
40
Figure 40: Certificate, Diploma, or Degree Type by Number of Persons in Halton Region, 15 Years and Over, 2011100
Figure 41: Post-Secondary Certificate, Diploma, or Degree Attainment in Halton Region, 25-64 Years, 2001, 2006, 2011101
100 Statistics Canada, 2011 National Household Survey, Statistics Canada Catalogue no. 99-012-X2011047. 101 Statistics Canada, 2011 National Household Survey, “Education Levels (Population 15+),” 2001, 2006, 2011, http://www.halton.ca/cms/One.aspx?portalId=8310&pageId=118177.
24%
7%
69%
High School Diploma or Equivalent
No Certificate, Diploma or Degree
Postsecondary Certificate, Diploma or Degree
0
50,000
100,000
150,000
200,000
250,000
300,000
2001 2006 2011
Numb
er of
Emplo
yees
Year
Population 25+
No Certificate, Diploma or Degree
High School Certificate or Equivalent
Apprenticeship or Trades Certificate or Diploma
College, CEGEP or Other Non-University Certificate or Diploma
University Certificate or Diploma Below the Bachelor Level
University Certificate, Diploma or Degree
41
Figure 42: Post-Secondary Certificate, Diploma, or Degree Attainment in Milton, 25-64 Years, 2011102
Figure 43: Post-Secondary Certificate, Diploma, or Degree Type by Number of Persons in Halton, 15 Years and Over, 2011103
102 Statistics Canada, 2011 National Household Survey, “Education Levels (Population 15+),” 2001, 2006, 2011. 103 Statistics Canada, 2011 National Household Survey, Statistics Canada Catalogue no. 99-012-X2011047.
0
10,000
20,000
30,000
40,000
50,000
60,000
2001 2006 2011
Numb
er of
Emplo
yees
Year
Population 25+
No Certificate, Diploma or Degree
High School Certificate or Equivalent
Apprenticeship or Trades Certificate or Diploma
College, CEGEP or Other Non-University Certificate or Diploma
University Certificate or Diploma Below the Bachelor Level
University Certificate, Diploma or Degree
50%
35%
8%
7%
University Certificate, Diploma or Degree at Bachelor Level or Above
College, CEGEP or Other Non-University Certificate or Diploma
Apprenticeship or Trades Certificate or Diploma
University Certificate or Diploma Below Bachelor Level

42
HDSB Pathways: Internal Data Analysis Enrollment figures for Specialist High School Major (SHSM) programs offered by the Halton District School Board provide important information regarding the popularity and availability of these specialized learning opportunities in Halton Region. In 2011, Arts and Culture (18%), Business (14%), Health and Wellness (13%), and Hospitality and Tourism (9%) were the most popular SHSM programs in Halton Region, collectively representing half of total students enrolled (Figure 44). Alternatively, the least popular SHSM programs were Horticulture and Landscaping, Energy, Justice, Community Safety and Emergency Services, and the Non Profit Sector. By municipality, Burlington had the greatest number of SHSM students, followed by Oakville, Milton, and Halton Hills (Figure 45). There was also impressive diversity in the number of students enrolled per program across municipalities. For example, students enrolled in the Health and Wellness SHSM were concentrated in Burlington and Oakville, students enrolled in the Manufacturing stream were disproportionately enrolled in Burlington, and the Business SHSM is disproportionately popular in Oakville. Regarding the availability of SHSM programs across Halton Region’s four municipalities, Oakville has the greatest number of different SHSM offerings, though fewer students are enrolled in SHSM programs overall (Figure 46). Transportation and Hospitality and Tourism are offered in all four municipalities (Figure 47). Health and Wellness, Horticulture and Landscaping, Non-Profit, Justice, Community Safety and Emergency Services are only available in two. Finally, Construction and Energy are only available in one municipality each.
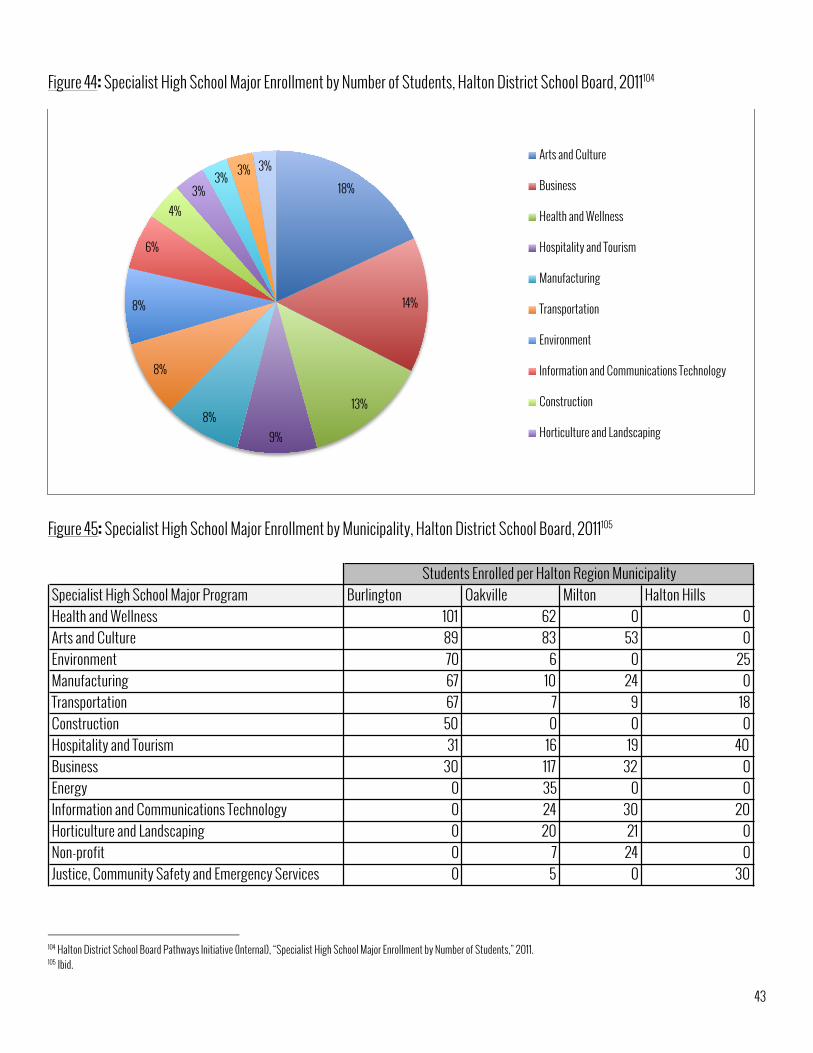
43
Figure 44: Specialist High School Major Enrollment by Number of Students, Halton District School Board, 2011104
Figure 45: Specialist High School Major Enrollment by Municipality, Halton District School Board, 2011105
104 Halton District School Board Pathways Initiative (Internal), “Specialist High School Major Enrollment by Number of Students,” 2011. 105 Ibid.
18%
14%
13%
9% 8%
8%
8%
6%
4% 3%
3% 3% 3% Arts and Culture
Business
Health and Wellness
Hospitality and Tourism
Manufacturing
Transportation
Environment
Information and Communications Technology
Construction
Horticulture and Landscaping
Specialist High School Major Program Burlington Oakville Milton Halton HillsHealth and Wellness 101 62 0 0Arts and Culture 89 83 53 0Environment 70 6 0 25Manufacturing 67 10 24 0Transportation 67 7 9 18Construction 50 0 0 0Hospitality and Tourism 31 16 19 40Business 30 117 32 0Energy 0 35 0 0Information and Communications Technology 0 24 30 20Horticulture and Landscaping 0 20 21 0Non-profit 0 7 24 0Justice, Community Safety and Emergency Services 0 5 0 30
Students Enrolled per Halton Region Municipality
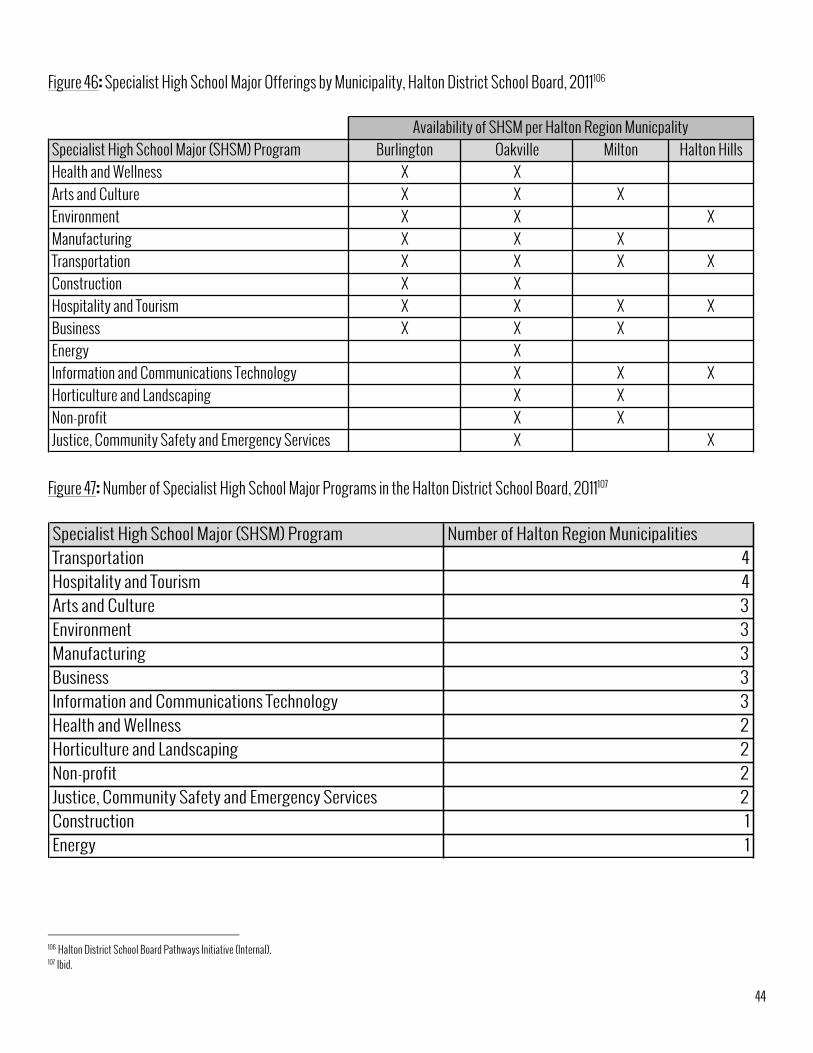
44
Figure 46: Specialist High School Major Offerings by Municipality, Halton District School Board, 2011106
Figure 47: Number of Specialist High School Major Programs in the Halton District School Board, 2011107
106 Halton District School Board Pathways Initiative (Internal). 107 Ibid.
Specialist High School Major (SHSM) Program Burlington Oakville Milton Halton HillsHealth and Wellness X XArts and Culture X X XEnvironment X X XManufacturing X X XTransportation X X X XConstruction X XHospitality and Tourism X X X XBusiness X X XEnergy XInformation and Communications Technology X X XHorticulture and Landscaping X XNon-profit X XJustice, Community Safety and Emergency Services X X
Availability of SHSM per Halton Region Municpality
Specialist High School Major (SHSM) Program Number of Halton Region MunicipalitiesTransportation 4Hospitality and Tourism 4Arts and Culture 3Environment 3Manufacturing 3Business 3Information and Communications Technology 3Health and Wellness 2Horticulture and Landscaping 2Non-profit 2Justice, Community Safety and Emergency Services 2Construction 1Energy 1
45
RECOMMENDATIONS 1. Conduct primary research
The best way to improve engagement with students in Halton Region is to connect with them personally and learn more about their current education and career planning practices. Primary research, in the form of focus groups or surveys, for example, would help HDSB Pathways identify student needs that are not being met by current initiatives. Parents, teachers, and guidance counselors are also important stakeholders in student decision-making, and would have particularly valuable insights regarding how HDSB Pathways can support students more effectively.
2. Expand program offerings strategically Based on key findings from this project, Innovate Burlington recommends that HDSB Pathways take the necessary steps to expand certain Specialist High School Major programs across each of Halton Region’s four municipalities. In particular, Health and Wellness, Construction, Manufacturing, Transportation, and Business each align with current skills gaps and local job opportunities. Given the analytical skills required by many of the occupations experiencing shortages today, Innovate Burlington also recommends that HDSB Pathways take steps to discourage students from self-selecting out of courses such as mathematics and science. 108 Finally, Innovate Burlington recommends that HDSB Pathways continue to prioritize experiential learning opportunities, as there is broad consensus that Ontario employers favour entry-level candidates with applied learning experiences and job-ready skills, attitudes, and behaviors. 109 For example, co-op and apprentice programs in construction, manufacturing, and other technology-related fields are particularly important to this effort.
3. Expand communication tools based on reported student concerns Research revealed important aspects of education and career planning where students in Ontario do not feel appropriately informed. For example, young people in Ontario often report difficulties in understanding personalized learning opportunities, particularly experiential learning options such as apprenticeship or co-op programs. There also appears to be a general lack of understanding of post-secondary options and entry requirements amongst students in Ontario, in addition to how to finance post-secondary education. 110 Ontario employers from a range of industries have expressed concern that youth are receiving inadequate information about career options, earnings potential, and the education and training paths that lead to these opportunities. 111 As an established resource for students regarding education and career planning, the HDSB Pathways initiative is in a unique position to address these knowledge gaps and concerns.
108 Virginia Galt, “The fastest-growing job market you’ve never heard of,” The Globe and Mail, March 28 2013, http://www.theglobeandmail.com/report-on-business/careers/career-advice/the-fastest-growing-job-market-youve-never-heard-of/article10505923/. 109 The Conference Board of Canada, “The Cost of Ontario’s Skills Gap.” 110 Colleges Ontario, “Who Doesn’t Go To Post-Secondary Education?,” Social Program Evaluation Group, Faculty of Education, Queen’s University, October 20, 2009, http://www.collegesontario.org/research/who-doesnt-go-to-pse.pdf. 111 The Conference Board of Canada, “The Cost of Ontario’s Skills Gap.”
46
Works Cited Coates, Ken and Bill Morrison. “The graduate’s million-dollar promise.” Maclean’s, January 16 2013.
http://www.macleans.ca/society/life/the-million-dollar-promise/. Colleges Ontario. “Who Doesn’t Go To Post-Secondary Education?.” Social Program Evaluation Group, Faculty of Education, Queen’s
University, October 20, 2009. http://www.collegesontario.org/research/who-doesnt-go-to-pse.pdf. Crowley, Brian Lee. “Evaluating the worth of a university degree.” The Globe and Mail, September 5 2013.
http://www.theglobeandmail.com/report-on-business/economy/economy-lab/evaluating-the-worth-of-a-university-degree/article14115389/.
Galt, Virginia. “The fastest-growing job market you’ve never heard of.” The Globe and Mail, March 28 2013.
http://www.theglobeandmail.com/report-on-business/careers/career-advice/the-fastest-growing-job-market-youve-never-heard-of/article10505923/.
Geobey, Sean. “The Young and the Jobless.” Canadian Centre for Policy Alternatives (Ontario), September 2013.
https://www.policyalternatives.ca/publications/reports/young-and-jobless. Halton District School Board Pathways Initiative (Internal). “Specialist High School Major Enrollment by Number of Students,” 2011. Halton Region Economic Development Team. “Halton Economic Review 2013.” Regional Municipality of Halton, 2014.
http://www.halton.ca/cms/One.aspx?portalId=8310&pageId=50660. Jobs & Prosperity Council. “Advantage Ontario.” Queen’s printer for Ontario, 2012. http://docs.files.ontario.ca/documents/340/jpc-
advantageontarioenglish.pdf. Labour Market Information (LMI) Division, Ontario. “Labour Market Bulletin – Ontario, Annual Edition 2013.” Employment and Social
Development Canada, 2014. http://www.esdc.gc.ca/eng/jobs/lmi/publications/bulletins/on/on-lmb-2013annual.pdf. Labour Market Information (LMI) Division, Ontario. “Labour Market Bulletin – Ontario, April 2014 (Quarterly Edition).” Employment
and Social Development Canada, 2014. http://www.esdc.gc.ca/eng/jobs/lmi/publications/bulletins/on/apr2014.shtml. Miner, Rick. “People Without Jobs, Jobs Without People.” Miner & Miner Management Consultants, February 2010.
http://www.collegesontario.org/research/research_reports/people-without-jobs-jobs-without-people-final.pdf. Ontario Ministry of Finance. “Ontario Production by Industry at 2007 Prices.” Queen’s Printer for Ontario, 2010, Last Modified July 14
2014. http://www.fin.gov.on.ca/en/economy/ecaccts/index.html#lot. Ontario Ministry of Finance. “Ontario’s Long-Term Report on the Economy.” Queen’s Printer for Ontario, 2014.
http://www.fin.gov.on.ca/en/economy/ltr/2014/ltr2014.pdf.

47
Ontario Ministry of Training, Colleges and Universities. “What education and skills are needed for today’s jobs?.” Government Of
Ontario, Last Modified February 25 2014. http://www.tcu.gov.on.ca/eng/labourmarket/ojf/skillsNecessary.html. Ontario Ministry of Training, Colleges and Universities. “Where are job trends headed in the future?.” Queen’s Printer for Ontario,
2014, Last Modified February 25 2014. http://www.tcu.gov.on.ca/eng/labourmarket/ojf/trainingTrends.html. Ontario’s Workforce Shortage Coalition. “Employment-focused education for a world-leading economy,” 2013.
http://www.workforcecoalition.ca/PDFs/Employment-Focused_Education_for_a_World-Leading_Economy.pdf. Peel Halton Workforce Development Group. “Employer Survey 2012: Results and Analysis.” Employment Ontario, 2013.
http://www.peelhaltonworkforce.com/sites/default/files/Survey_ResultsAnalysis_Report13%20final.pdf. Regional Municipality of Halton. “2013 Employment Survey Results.” 2014.
http://sirepub.halton.ca/cache/2/rjufj354kuq0lueahjqlooux/1755790805201401291398.PDF. Regional Municipality of Halton. “Employee Counts by Sector and Employee Category – Burlington, Halton Hills, Milton, Oakville.”
December 2012. http://www.halton.ca/cms/One.aspx?portalId=8310&pageId=118249. Regional Municipality of Halton. “Employee Counts by Sector and Employee Category – Halton Region,” June 2007-June 2013.
http://www.halton.ca/cms/One.aspx?portalId=8310&pageId=118249. Statistics Canada. Canadian Business Patterns. “Enterprise Counts in Halton by Sector and Employee Category,” December 2013.
https://docs.google.com/file/d/0B7exmbctfPr8Z29fSHpiVDlEeGs/edit. Statistics Canada. 2011 National Household Survey. “Education Levels (Population 15+),” 2001, 2006, 2011.
http://www.halton.ca/cms/One.aspx?portalId=8310&pageId=118177. Statistics Canada. 2011 National Household Survey. “Labour Force in Halton by Industry Sector,” 2011. https://docs.google.com/file/d/0B7exmbctfPr8c1hOaE5LcGVrTmM/edit. Statistics Canada. 2011 National Household Survey. “Labour Force in Halton by Occupation,” 2011.
https://docs.google.com/file/d/0B7exmbctfPr8aWVoUkxJcmVXc2M/edit. Statistics Canada. 2011 National Household Survey, Statistics Canada Catalogue no. 99-012-X2011047.
http://www12.statcan.gc.ca/nhs-enm/2011/dp-pd/dt-td/Rp-eng.cfm?LANG=E&APATH=3&DETAIL=0&DIM=0&FL=A&FREE=0&GC=0&GID=0&GK=0&GRP=0&PID=105929&PRID=0&PTYPE=105277&S=0&SHOWALL=1&SUB=0&Temporal=2013&THEME=96&VID=0&VNAMEE=&VNAMEF=.

48
Statistics Canada, 2011 National Household Survey, Statistics Canada Catalogue no. 99-012-X2011051, http://www12.statcan.gc.ca/nhs-enm/2011/dp-pd/dt-td/Rp-eng.cfm?LANG=E&APATH=3&DETAIL=0&DIM=0&FL=A&FREE=0&GC=0&GID=0&GK=0&GRP=0&PID=106327&PRID=0&PTYPE=105277&S=0&SHOWALL=1&SUB=0&Temporal=2013&THEME=96&VID=0&VNAMEE=&VNAMEF=.
Statistics Canada. 2011 National Household Survey, Statistics Canada Catalogue no. 99-012-X2011052.
http://www12.statcan.gc.ca/nhs-enm/2011/dp-pd/dt-td/Rp-eng.cfm?LANG=E&APATH=3&DETAIL=0&DIM=0&FL=A&FREE=0&GC=0&GID=0&GK=0&GRP=0&PID=106312&PRID=0&PTYPE=105277&S=0&SHOWALL=1&SUB=0&Temporal=2013&THEME=96&VID=0&VNAMEE=&VNAMEF=.
Statistics Canada. Table 281-0030 - Average hourly earnings for employees paid by the hour (SEPH), for selected industries
classified using the North American Industry Classification System (NAICS), annual (current dollars), CANSIM (database). http://www5.statcan.gc.ca/cansim/a26?lang=eng&retrLang=eng&id=2810030&paSer=&pattern=&stByVal=1&p1=1&p2=37&tabMode=dataTable&csid=.
Statistics Canada. Table 282-0008 - Labour force survey estimates (LFS), by North American Industry Classification System
(NAICS), sex and age group, annual (persons unless otherwise noted), CANSIM (database). http://www5.statcan.gc.ca/cansim/a26?lang=eng&retrLang=eng&id=2820008&paSer=&pattern=&stByVal=1&p1=1&p2=37&tabMode=dataTable&csid=.
Tal, Benjamin and Emanuella Enenajor. “Degrees of Success: The Payoff to Higher Education in Canada.” CIBC Economics, August
26, 2013. http://research.cibcwm.com/economic_public/download/if_2013-0826.pdf. The Canadian Press. “Canada’s Manufacturing Sales Finally Return to Pre-Recession Levels.” Business – Huffington Post, April 15
2014. http://www.huffingtonpost.ca/2014/04/15/manufacturing-sales-canada-february-2014_n_5152233.html. The Conference Board of Canada. “The Cost of Ontario’s Skills Gap,” June 2013.
http://www.collegesontario.org/Need_to_Make_Skills_Work_Report_June_2013.pdf.

49
Appendix A
See “Appendix A.zip”.