Embed Size (px)
Citation preview
Page 1
Labour Market Survey Exploring & Economic Opportunity through Vocational Skills Training, District Peshawar (Khyber Pakhtunkhwa) Institute of Rural Management (IRM)

2
Table of Contents
Executive Summary 3
Chapter 1: Introduction 6
1.1. General Background 6
1.2. Pakistan’s International Obligations 7
1.3. Institutional Framework 8
1.4. Objectives of the study 8
Chapter 2: Survey Design and Methodology 10
2.1. A brief introduction of Peshawar District 10
2.2. Survey design and methodology 13
Chapter 3: Analysis of the survey data 16
3.1. Socio-economic characteristics of the potential beneficiaries 16
3.2. Analysis of the Potential Employers 25
3.3. An analysis of the Training Institutes 26
Chapter 4: Major Findings and Recommendations 31
4.1. Target Beneficiaries 31
4.2. Potential Employers 31
4.3. Training Institutes 31
4.4. Trades/Skills to be covered by the Programme 32
Annexures 33

3
Executive Summary
Background
The Local Labour Market Survey Report is produced by the Institute of Rural Management
(IRM). The main objective of this study is to determine the needs of the workers (labourers) and
develop strategies that could enable IRM to achieve the objectives of creating employability and
decent economic opportunities through technical and vocational training.
Primary focus of this study is to determine the socio-economic characteristics of the workers in
order to assess their capabilities, aptitudes and potentials to join decent/non-hazardous
employment through skills development and training, to study the existing job market
requirements for decent jobs (self or employed) in the Peshawar district and to assess the quality
and relevance of the training programmes offered by the existing training institutes in the district.
Respondents
a. Target Beneficiaries
In total, 251 potential beneficiaries were interviewed from the Peshawar district. Majority (85%)
of the respondents are between 17-28 years of age. 95% of the respondents were unskilled out of
which 62% were unemployed. 20% of the respondents had middle level education, whereas 21%
were below middle and lack skills required to operate in the market or under skilled. Due to lack
of education, skills and guidance, 58% of the respondents had no awareness on how to earn their
per month desired income. The survey suggests that all the respondents were willing to acquire
more skills for their improved livelihoods.
b. Potential Employers
A total of 38 potential employers were interviewed. Most of them (89%) were in need of
workers, but none of them were willing to hire unskilled people. This research suggests that the
reason why they are unwilling to hire unskilled people is that the trainees of the technical and
vocational training institutions are unable to operate the new equipment which is now used in the
industries. They say that these institutions are using obsolete equipment to train people and thus

4
the employers cannot take the risk of unskilled people operating the expensive machineries.
Interviews with potential employers also helped to identify the major trades which are in demand
in the market.
Identified trades
The following table shows the major trades identified for men and women:
Major Trades
Men
Wood Work Wood
Carving
Shuttering
Carpenter
Carpet
weaving
Killim
Making
Electrical
appliances
repairing
Gems and
Jewelry
Mobile
repairing
Motor
winding Plumbing
Motor Cycle
Assembling
Printing
work
Industrial
mechanic
Industrial
electrician
A/C and
refrigerator
repairing
Heavy
machinery
operator
Marble
Mosaic
Work
UPS making
and repairing Welding
Power and
Hand
Looms
Information
technology
Women
Cross Stitch
Work
Patch work Beautician Swati
Embroidery
Tie and
Die
Shadow
Work
Dress
designing
Hand
embroidery
Domestic
tailoring
Glass
Painting
Leather Work Marble
Mosaic
Work
Food
Processing
Information
Technology
c. Technical and Vocational Training Institutes
13 technical and vocational training institutes were visited across the Peshawar district. The list
of these institutes can be found in annex 5. The research suggests that these institutes are facing a
number of issues in terms of the availability of resources and quality and relevance of their
offered courses. They have poor forward (with the potential employers) and backward (with the
community) linkages and are mostly working in isolation. The training imparted by these
institutes does not match the market demand. Trainees are unable to acquire adequate skills
which are needed to operate in the market. This creates problems for the trainees in seeking
employment. The report suggests that there is a gap between the courses/training offered by the
institutes and the local market demands.

5
Recommendations
To achieve its overall objectives, this report recommends:
Designing different types of training programmes in order to meet the needs of different
categories of workers (on the basis of age, gender, skill needed).
Creating linkages between the training institutes and the potential employers for up to
date information about current market demands.
Training institutes should be located in close proximity to the target areas for increased
participation, especially women.
Stipend should be provided as a compensation for trainees’ forgone income.
Introduction of short courses (3-6 months) and the time of these courses should be kept
flexible.
Training institutes should be sector specific depending on the industries/economic
activities in the area.
6
Chapter 1
Introduction
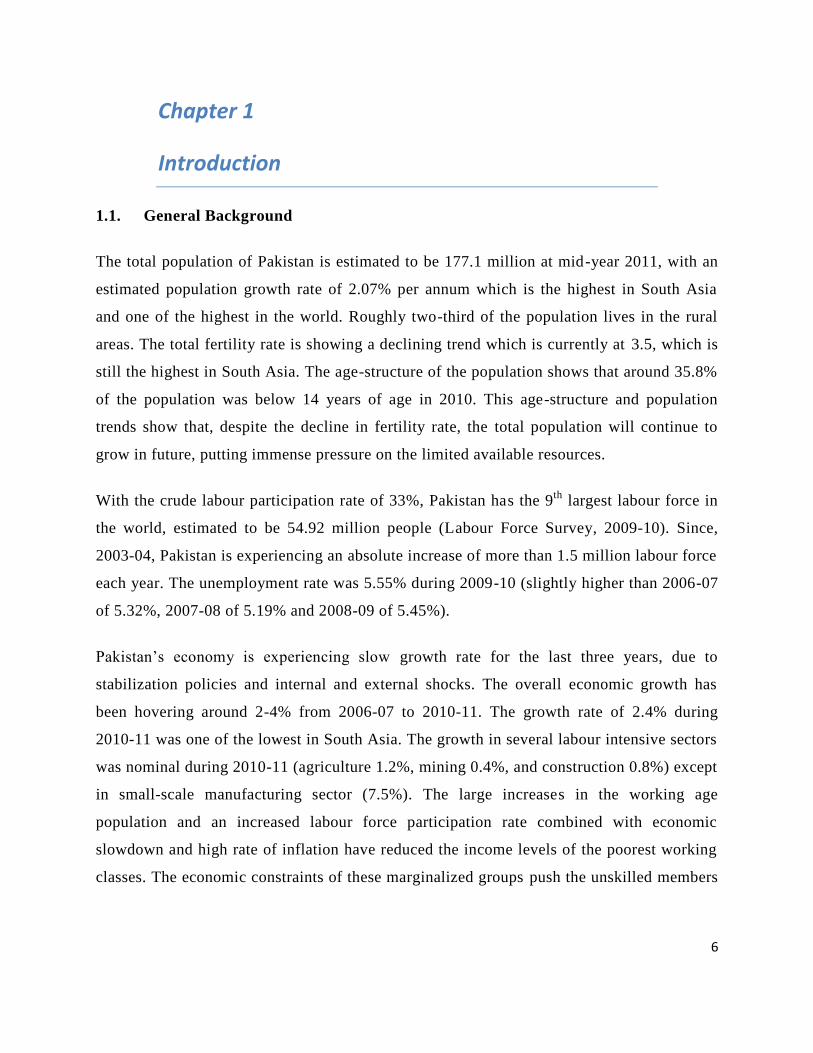
1.1. General Background
The total population of Pakistan is estimated to be 177.1 million at mid-year 2011, with an
estimated population growth rate of 2.07% per annum which is the highest in South Asia
and one of the highest in the world. Roughly two-third of the population lives in the rural
areas. The total fertility rate is showing a declining trend which is currently at 3.5, which is
still the highest in South Asia. The age-structure of the population shows that around 35.8%
of the population was below 14 years of age in 2010. This age-structure and population
trends show that, despite the decline in fertility rate, the total population will continue to
grow in future, putting immense pressure on the limited available resources.
With the crude labour participation rate of 33%, Pakistan has the 9th
largest labour force in
the world, estimated to be 54.92 million people (Labour Force Survey, 2009-10). Since,
2003-04, Pakistan is experiencing an absolute increase of more than 1.5 million labour force
each year. The unemployment rate was 5.55% during 2009-10 (slightly higher than 2006-07
of 5.32%, 2007-08 of 5.19% and 2008-09 of 5.45%).
Pakistan’s economy is experiencing slow growth rate for the last three years, due to
stabilization policies and internal and external shocks. The overall economic growth has
been hovering around 2-4% from 2006-07 to 2010-11. The growth rate of 2.4% during
2010-11 was one of the lowest in South Asia. The growth in several labour intensive sectors
was nominal during 2010-11 (agriculture 1.2%, mining 0.4%, and construction 0.8%) except
in small-scale manufacturing sector (7.5%). The large increases in the working age
population and an increased labour force participation rate combined with economic
slowdown and high rate of inflation have reduced the income levels of the poorest working
classes. The economic constraints of these marginalized groups push the unskilled members
7
of these families to join the labour force at a student age even at low wages and challenging
work environments.
1.2. Pakistan’s International Obligations
Labour is one of the most important parts of any economy. A country wide sampled survey
is conducted each year by Federal Bureau of Statistics (FBS) to study the employment and
unemployment trends, socio-economic status of labourers and other factors that affect them.
Pakistan has ratified eight core ILO labour conventions (International Trade Union
Confederation, 2008). In total, Pakistan has ratified 36 Labour conventions and among them
34 are in force (ILO, 2011). According to these conventions, it is obligatory for public
sector in Pakistan to maintain the minimum requirements for decent work and other labour
related issues.
Pakistan is also a member of the United Nations Millennium Development Goals (MDGs)
(UN, 2000). There are eight MDGs which are to be achieved by 2015, with poverty
alleviation being the first one. Poverty cannot be eradicated completely unless labour laws
are particularly emphasized to be followed at all levels. Due to high unemployment rates, a
large number of people are forced to work in conditions that are below the international
standards. In this particular situation, there is a need to learn about the existing labour
market dynamics so that appropriate interventions can be put in place. This will play a
crucial role in facilitating the labourers to get adequate training and raise awareness among
them about the livelihood opportunities around them.
In Pakistan, there are different dynamics for labour force. Labour force working in informal
sector might find itself in a different scenario than the labour force working in the formal
sector. There are also unpaid workers who are working on family farms or businesses. The
operational definition of being employed and unemployed is also unknown to individual
workers due to lack of knowledge.
8
In addition to the international commitments and ratification of different labour force
conventions, Pakistan has established labour laws to facilitate the employment process and
to protect the rights of both employers and employees.
1.3. Institutional Framework
Under the rules of business of the Government of Pakistan, all matters pertaining to labour are
dealt with by the Labour and Manpower Division of the Government of Pakistan. The
implementation of the conventions ratified by the Government of Pakistan with the UN and its
subsidiaries is also within the purview of the Labour and Manpower Division.
Before the passing of the 18th
and 19th
constitutional amendments, the subject of labour was in
the concurrent list, and the provincial governments could also legislate on this subject. However,
after the 18th
Amendment, w.e.f, April 19th
, 2011, all the subjects of the concurrent list have been
transferred to the provincial governments, including the labour welfare issues like pensions,
health insurance, labour and industrial disputes, labour exchanges, employment information
bureaus, and regulation of labour and safety in mines, factories and oil-fields. The transfer of the
subject of labour to the provincial governments has its own benefits and risks regarding the
labour force dynamics, and elimination of worst forms of labour like forced labour. The benefits
come from devolved decision making process at the provincial level, which can make decisions
keeping in view their specific conditions and circumstances. The risks lie in the lack of
institutional capacity of provincial labour departments to formulate appropriate policies and
address the issue of labour force market in the respective provinces and provide appropriate
implementation mechanism.
1.4. Objectives of the Study
1.4.1. Aims
i. Review relevance of the existing courses, offered in the technical and vocational training
centers in the Peshawar district, to the local labour market needs and recommend
improvements in the curriculum of these courses;

9
ii. Recommend introduction of new courses, keeping in view the requirements and educational
background of the target beneficiaries. In this regard, the study shall take the following into
consideration:
- Training requirements of the youth based on the demographics/social/gender sensitivity in
the target areas;
- Educational background and ability of the target group to grasp and acquire requisite skills of
proposed trades;
- Availability of jobs in the local market for the target group;
- Job creation opportunities/environment (economic and institutional) including the attitudes
and expectations of the trainees, Technical and Vocational Training providers, and
employers;
- Employers’ constraints in hiring the project target group (real and perceived);
Survey was conducted in Peshawar district in April, 2012 by IRM. This report relates to the
analysis of the survey data, major findings and recommendations for the Peshawar district.

10
Chapter 2
Survey Design and Methodology
2.1. A brief introduction of Peshawar District
2.1.1. History
Peshawar derives its name from a Sanskrit word ‘Pushpapura’, meaning the city of flowers.
Peshawar’s flowers were even mentioned in Mughal Emperor Babar’s memoirs. The Kushan
Kings of Gandhara founded Peshawar over 2,000 year’s age. The Mughal emperor Babar came
to Peshawar in 1530 A.D. His grandson Akbar formally gave the name Peshawar that means
‘The Plae of the Frontier’. In that period Peshawar saw significant improvements in its bazaars
and fortifications. During the region of Sher Shah Suri Peshawar’s witnessed another boom with
the construction of the Delhi to Kabul Shahi Road, which ran through the Khyber Pass. Over the
centuries Peshawar has been the entry point to invaders and conquerors such as Alexander the
great, the Mughal kings and Mehmood Ghanznavi all whom traveled through the famous Khyber
Pass that traverses the Afghan border. It is said that when Marco Polo visited Peshawar in 1275
A.D., where he found that ‘The people have a peculiar language; they worship idols and have an
evil disposition’
Peshawar is the provincial Capital of the Khyber Pakhtunkhwa and is also the largest city in the
Province. The city district has tremendous historical, military, economic and political
importance. The Federally Administered Tribal Areas (FATA) adjoining Peshawar, the Khyber
Agency which lies to its West, Mohmand Agency to its North, Frontier Region (Semi-Tribal
regions) Kohat to its South. The two settled districts of Charsadda and Nowshera are situated to
its North and North-East respectively, whereas the Afghan border is approximately 40 Km to the
West. Pushtu is the predominant language followed by Hindko and the national language Urdu.
2.1.2. Geography
Peshawar is situated near the eastern end of the Khyber Pass and sits mainly on the Iranian
plateau along with the rest of the Khyber Pakhtunkhwa. Peshawar is a frontier city of South

11
Central Asia and was historically part of the Silk Road. The Peshawar valley is covered with
consolidated deposits of silt, sands and gravel of recent geological times. The flood Plains/Zones
are the areas between Kabul River and Budni Nala. The meander flood plain extends from
Warsak in the Northwest towards Southeast in the upper Northern half of the district. The Kabul
river enters the district in the Northwest. On entering the Peshawar Plain, the Kabul River is
divided into several channels. Its two main channels are the Adizai River Eastward flows along
the boundary with Charsadda District. Another channel branching from the right bank of the
Naguman River is the Shah Alam, which again merges with Naguman River further in the East.
In general the sub-soil strata are composed of gravels, boulders, and sands overlain by silts and
clays.
Map of Peshawar District
12
2.1.3. Climate
Winter in Peshawar is starts from mid November to March; summer months are May to
September. The mean maximum temperature in summer is over 40°C and the mean minimum
temperature is 25°C. The mean minimum temperature during winter is 4°C and maximum is
18.35°C. The spring comes somewhere around the middle of March which is the most pleasant
period of the year.
Rainfall is received both in winter and in the summer. The winter rainfall due to western
disturbances shows a higher record during the months of February and April. The highest winter
rainfall has been recorded in March, while the highest summer rainfall in the month of August.
The average winter rainfall is higher is higher in winter than that of the summer. Based on a 30
year record, the average annual precipitation has been recorded as 400 millimeters.
Wind speeds vary during the year from 5 knots in December to 24 knots in June. The relative
humidity varies from 46% in June to 76% in August.
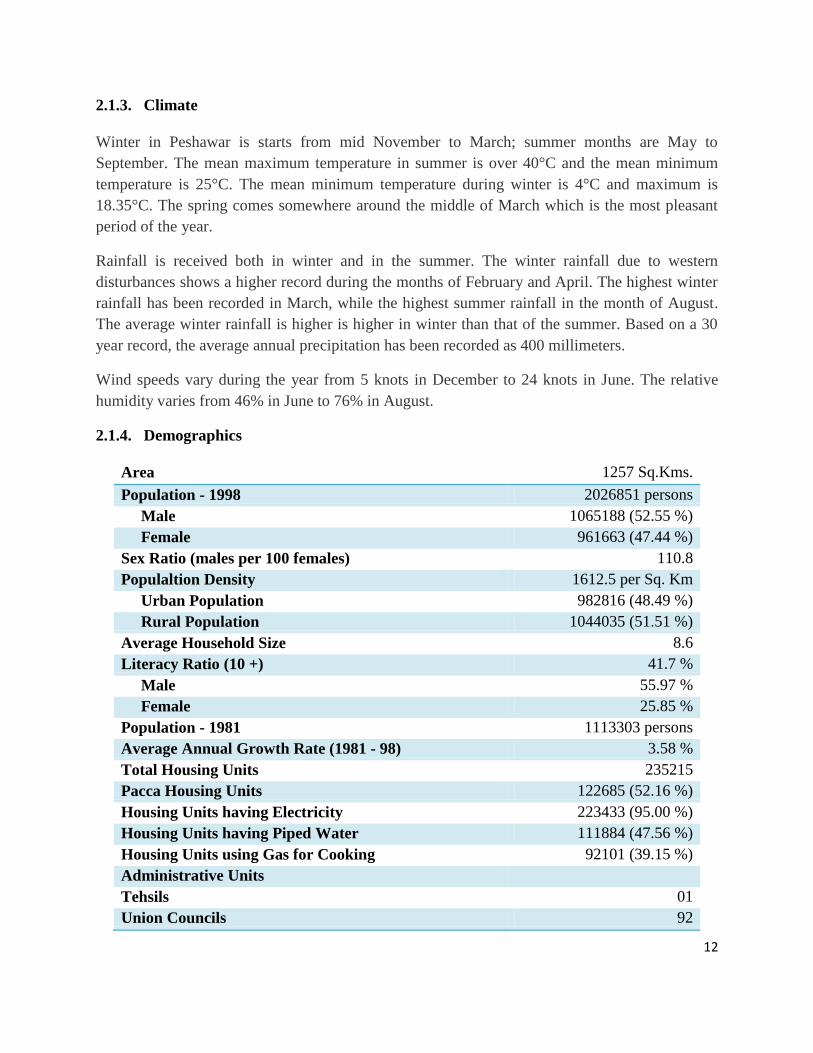
2.1.4. Demographics
Area 1257 Sq.Kms.
Population - 1998 2026851 persons
Male 1065188 (52.55 %)
Female 961663 (47.44 %)
Sex Ratio (males per 100 females) 110.8
Populaltion Density 1612.5 per Sq. Km
Urban Population 982816 (48.49 %)
Rural Population 1044035 (51.51 %)
Average Household Size 8.6
Literacy Ratio (10 +) 41.7 %
Male 55.97 %
Female 25.85 %
Population - 1981 1113303 persons
Average Annual Growth Rate (1981 - 98) 3.58 %
Total Housing Units 235215
Pacca Housing Units 122685 (52.16 %)
Housing Units having Electricity 223433 (95.00 %)
Housing Units having Piped Water 111884 (47.56 %)
Housing Units using Gas for Cooking 92101 (39.15 %)
Administrative Units
Tehsils 01
Union Councils 92
13
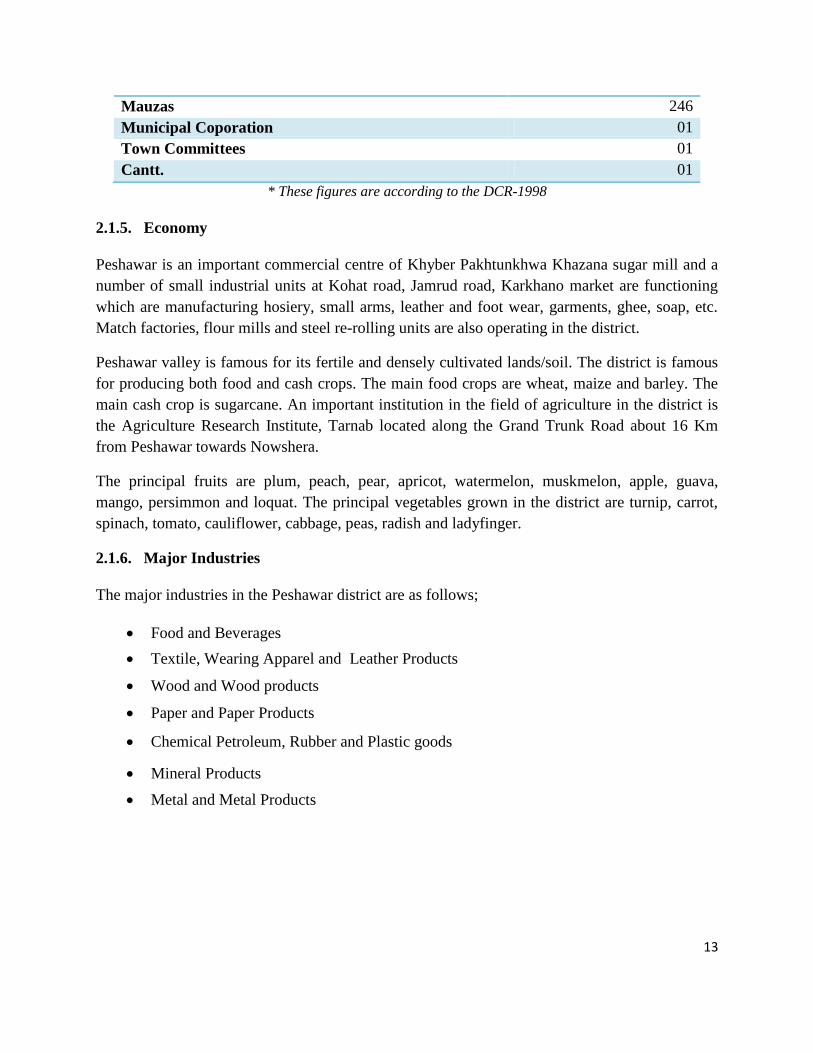
Mauzas 246
Municipal Coporation 01
Town Committees 01
Cantt. 01
* These figures are according to the DCR-1998
2.1.5. Economy
Peshawar is an important commercial centre of Khyber Pakhtunkhwa Khazana sugar mill and a
number of small industrial units at Kohat road, Jamrud road, Karkhano market are functioning
which are manufacturing hosiery, small arms, leather and foot wear, garments, ghee, soap, etc.
Match factories, flour mills and steel re-rolling units are also operating in the district.
Peshawar valley is famous for its fertile and densely cultivated lands/soil. The district is famous
for producing both food and cash crops. The main food crops are wheat, maize and barley. The
main cash crop is sugarcane. An important institution in the field of agriculture in the district is
the Agriculture Research Institute, Tarnab located along the Grand Trunk Road about 16 Km
from Peshawar towards Nowshera.
The principal fruits are plum, peach, pear, apricot, watermelon, muskmelon, apple, guava,
mango, persimmon and loquat. The principal vegetables grown in the district are turnip, carrot,
spinach, tomato, cauliflower, cabbage, peas, radish and ladyfinger.
2.1.6. Major Industries
The major industries in the Peshawar district are as follows;
Food and Beverages
Textile, Wearing Apparel and Leather Products
Wood and Wood products
Paper and Paper Products
Chemical Petroleum, Rubber and Plastic goods
Mineral Products
Metal and Metal Products

14
2.2. Survey design and methodology
The survey was conducted by the IRM team in all the four tehsils of Peshawar district. It was
divided into two parts. Part one consisted of field study and the second part dealt with data
cleansing, analysis and final report. The field team collected the verifiable information from
three different stakeholders; (a) the target beneficiaries (b) the key employers in the area, (c)
Technical and Vocational Training Institutions.
The rational for the data collection from these three groups is as under:
Target beneficiaries: To get reliable and verifiable data about the socio-economic conditions of
the target beneficiaries. A total of 251 potential target beneficiary workers were interviewed in
Peshawar District.
Potential employers: In the target areas of Peshawar, the key employers were interviewed in
order to assess the demand of different trades and skills in the existing market, and to evaluate
the skills gap among the potential beneficiaries and the job market. Interviews were conducted
with 37 potential employers.
Technical and vocational training institutions: Information was collected from 13 various
technical and vocational training institutes (Public/Private) in the district to examine the
contents, quality and relevance of the training programmes offered.
2.2.1. Selection of Respondents
a. Target beneficiaries
The target areas (union councils) were selected using Probability Proportional to Size sampling
technique. Within the selected areas, households were selected using random sampling. This
provided with a sample where each member of the population had an equal probability to be
included in the sample. This technique enabled the survey team to eliminate any biases while
selecting the respondents (target beneficiaries) for interviews.
b. Potential employers
In the areas identified, listing of employers was done. From the listed employers, the potential
employers were selected on the following criteria: a). the firms employing 5 or more workers as
full time employees, b). the firms which are in need of workers.
c. Technical and vocational training institutions
From technical/vocational institutes located in the selected areas, 21 technical/vocational training
institutes were selected randomly and data was collected from them. The list of the Technical

15
Training Institutes, the trades offered by them, the duration of courses and the existing enrolled
participants is given at Annex 5.
2.2.2. Themes and Survey Instruments
The data collected includes both the qualitative and quantitative information from the potential
beneficiaries, employers and the training institutes. The information gathered gives us a complete
picture of the local labour markets in Peshawar, different trades and skills in the market, skills
gap between potential beneficiaries and the job market and the strengths and weaknesses of the
existing training programmes offered in the areas.
A structured questionnaire was developed for each group. The questionnaire was designed in
such a way that the respondent could easily comprehend the questions, and then answer from one
of the choices available for each question. Each questionnaire was discussed with key informed
persons and local knowledgeable persons.
The following Questionnaires were used:
a. Questionnaire for the target beneficiary (Annex- 1 )
b. Questionnaire for the technical and vocational training institutes (Annex-2 )
c. Questionnaire for the potential employer (Annex-3 )
2.2.3. Key Informant Interviews
The detailed interviews with the key informed citizens greatly contributed in the selection of
sampling areas, developing a comprehensive understanding of the labour market conditions and
the employability constraints faced by target groups. Key informants included officials from
various governmental and non-governmental organizations such as Peshawar Chamber of
Commerce and Industry, SMEDA and NICS etc.
2.2.4. Survey Team
The survey team comprised of qualified and experienced members, having diverse backgrounds.
The team leader and the enumerators were carefully selected and trained to seek relevant,
reliable and accurate information from the participants.
2.2.5. Data Processing:
The data entry was undertaken by the trained staff of IRM. The data was cleaned and re-checked
to generate Excel and Statistical databases.

16
Chapter 3
Analysis of the Survey Data
This chapter is primarily focused on the analysis of survey data. It is divided into three sections.
3.1. Socio-economic characteristics of the potential beneficiaries.
3.2. Feedback from the major employers of the target areas.
3.3. Quality and relevance of the vocational training programmes in the existing training
institutes.
3.1. Socio-economic characteristics of the potential beneficiaries.
i. Distribution of respondents by age
Out of a total of 251 target beneficiaries across the Peshawar district, 16% (39) respondents fall
into the age category (17-20), while 41% fall into the age category of (21-24), 32% fall in to the
age category of (25-28) and 11 % fall into the age category of 29 and above. Majority of the
respondents belong to the age group of 21-24 years.

17
ii. Distribution of respondents by gender
Out of a total of 251 respondents, 55% were men and 45% were women.
iii. Distribution of respondents by marital status
The above chart shows the distribution of respondents by their marital status. Out of a total of
251 respondents, 66% were single, 28% were married and 5% were separated/divorced or
widowed.

18
iv. Distribution of respondents by level of education
The above chart shows that 29% of the respondents have studied till primary level. Respondents
with middle and secondary level education add up to 21%. 19% respondents have higher
secondary education, whereas 14% are at the level of higher secondary and only 2% are
graduates.
Only 3% of the respondents have got some sort of vocational training that also includes formal
and informal training.
v. Distribution of respondents by their current status

19
The table shows that 14% of the respondents are currently working, while majority of the
respondents (55%) are looking for jobs. 31% are helping their parents. As majority of the
respondents are looking for jobs, it indicates that people are willing to work, they want to be
skilled in some skill so that they may get engage in any sort of economic activity.
vi. Distribution of respondents by their family source of income
Majority of the respondents’ (26%) family source of income is self employment, the earning
source waged employment and local remirtance are same 17%, 16% earn their livelihood
through agriculture, 10% run some kind of business, 3% depend on pension and 9% are earning
through other sources and 17% are earning their bread and butter through local remitance while
2% rely on foreign remitances.
vii. Distribution of respondents by their average monthly income (family)

20
The above chart shows the average monthly income of the respondents’ families. Majority of the
respondents’ families earn between 4000- 6000 per month which is 45% of the total respondents.
29% of the families earn between Rs. 6000 and 8000 and 7% earn Rs.10, 000 or above.
viii-a. Percentage of economic opportunities around the respondents
The results of the survey show that only 36% of the respondents are aware of employment
opportunities around them but they are not skilled to obtain those opportunities, whereas 25%
denied for any economic opportunity around them and 39% do not know or have no information
about employment opportunities in their area.
viii-b. Percentage of available economic opportunities
Respondents who knew about the economic opportunities around them were asked to identify the
different industries/factories in their surrounding areas. The following chart shows the different
industries/types of employment opportunities in the district identified by the respondents.

21
Most of the respondents identified services sector (17%) and then agriculture (15%) in their
surrounding areas. The third largest sector identified by the respondents is textile and daily wage
labour. 13% of the respondents replied with self employment and 12% were of the view of
industry services. Similarly government employment and mining were at the end with 4%
responses.
ix-a. Economic opportunities available for men
Majority of the men in the surveyed areas are
involved in agriculture (25%) and 16% are of
waged labour. 15% responded the men
around them are engaged in facotories. 12%
have small businesses and 9% with govt.
employee and similarly 9% of wuto
mechanic. 4% reponded to transport driver.
This shows that the difference between the identified trades and the trades in which people are
engaged in their surroundings. The indutries identified like textile industry, but there is no
linkage between the local labourer.
ix-b. Economic opportunities for women
The most common economic activities for
women in the areas surveyed are Beautician
(27%) and textile work (19%). +Similary
19% responded that the women around
them do nothing and are sitting at home. 10
% responded that the women around them
are engaged as teachres while 16% told that
women are working as LHW. 3% responded that women are engaged in domestic wage labour
and same frequency of response were observed for small business holder women.
22
x. Desired skills to learn
There were 36 different trades identified by the respondents which they desire to learn. The
following chart shows the most desired trades identified.
AC Repairing Glass Printing Industrial Mechanic
Aluminum Works Generator Repairing Patch Work
Auto Electrician UPS Repairing Mobile Repairing
Auto Mechanic Heavy Machinery Operator Cross Stitch Work
Basic Computer Machine Embroidery Food Processing
Beautician Web Designing Motor Cycle Repairing
Carpenter Computer Networking R&M of Electrical Appliances
Shuttering Carpenter Computer Hardware Wood Carving
CNG Kit Installation Marble Mosaic Work Plumbing/Welding
Kilim Making hospitality Steel Fixer
Hospitality Jobs Glass Work Tailoring/Stitching
Carpet Weaving Hand Embroidery Urdu Composing
In response to the question the desired skill for better earning the responses identified 36
different trades in which the men and women of the area want to be skilled. The survey suggests
that most desired trades for men are air conditioning and refrigerator repairing, auto mechanic,
carpenter, carpet weaving, computer hardware, diesel engine machine, driving, electric
appliances repairing, generator repairing, mechanic, mobile repairing, motor winding,
motorcycle repairing, plumbing, machinery, screen printing, UPS making and repairing, welding
and wood work etc. Women, on the other hand, want to get trainings on trades tailoring/stitching,
hand embroidery, machine embroidery, and decoration, cross stitch work, beautician and Kilim
Making. It is important to note that none of the interviewed respondents possess any skills and
the table above shows only the desired skills of beneficiaries.
3.2. Analysis of the Potential Employers
A total of 37 potential employers were interviewed. These were selected randomly from within
the target areas. 91% of the employers interviewed were in need of workers but they were only
willing to hire skilled personnel. The employers were asked about the relevance of technical and
vocational training to the job market and the quality of courses which the institutes offer. They
were also asked to identify the trades/skills which are required in the market.

23
3.2.1. Trades/skills required in the market
The potential employers identified 60 different trades/skills which are required in the market and
also their demand and shortages. The following table shows the trades/skills identified by the
respondents.
Sl. # Trades A. Demand B. Skill Shortage
Diminishing Stable Emerging None Shortage Critical
1 Wood Work 2 2
2 Marble Cutting and Polishing
2 2
3 Marble Mosaic Work 3 1 2
4 Shuttering Carpenter 2 2
5 Wood Carving 2 2
6 Carpet Weaving 2 2
7 Kilim Making 2 2
8 Auto Mechanic 2 2
9 Stitch Craft 2 2
10 Hands Machine Knitting 2 2
11 Food Processing 2 2
12 Computer Skills 2 2
13 Glass Printing 2 2
14 Yarn Making 3 1 2
15 Industrial Electrician 2 2
16 Computer Hardware 2 2
17 Computer Software 2 2
18 Computer Networking 2 2
19 Composing 2 2
20 In page/ Corel Draw 2 2
21 Auto Cad 2 2
22 Hospitality 2 2
23 Glass Work 2 2
24 Motor Cysle Mechanic 2 2
25 Electricain 2 2
26 Industrial Mechanic 2 2
27 Heavy Machinery Operator 2 2
28 Textile Wearing 2 3 1 2
29 Leather Products 2 2
30 Arms and Ammunition 2 3
31 Hand Embroidery 2 2
32 Advance Tailoring 2 2
33 Adda Work 2 2

24
34 Cross Stitch Work 2 2
35 Swati Embroidery 2 2
36 Bridal Makeup 2 2
37 Printing Press 2 2
38 Urdu Composing 2 2
39 English Composing 2 2
40 Auto Electrician 2 2
41 Home Electric Appliances 2 2
42 Steel Fixer 2 2
43 Plumber 2 2
44 Mobile Repairing 2 2
45 Marble Cutting and Polishing
2 2
46 Gems and Jewelry 2 2
47 CNG Kit Installation 2 2
48 Plastic products 2 3 1
49 Heavy Equipment Operator 3 1 2
50 Packaging 3 1
The table shows that the demand for 48 trades is likely to remain constant over the next five
years, whereas the demand for the remaining 2 trades is likely to diminish. It is surprising to see
that none of the trades identified by the respondents has a diminishing demand.
The potential employers also identified the skill shortages in the market. Although there are 48
(80%) trades where there is a shortage of skills, the shortage is not critical. Six skills have
emerged newly which means it has an adverse impact on the work. It is important to note that 3
of the 6 trades with severe shortage of people are emerging.
Potential employers who were interviewed feel that the training courses which the technical and
vocational institutes offer are not very helpful in the market. All the employers said that the
equipment used to train people is obsolete and the trainees are unable to operate the
technologically advanced machinery which is now used in the industries. This is one of the main
reasons why employers are not willing to hire people trained in these institutes.
3.3. An analysis of the Training Institutes
In total, 13 vocational/technical training institutes were visited to review the current courses
offered by these institutes and to determine the criteria of introduction of new courses. The
25
institutes were selected from all the 4 tehsils of Peshawar. Responses of the management of the
institutes were sought on various structured questions to examine the quality and relevance of
existing courses to the labour market and to understand how and why these institutes offer new
courses. The list of training institutes, their courses/trades, duration of each course/trade and the
number of existing enrolled participants in each course/trade is given at Annex 5. The institutes
visited were both run in the public and the private sector.
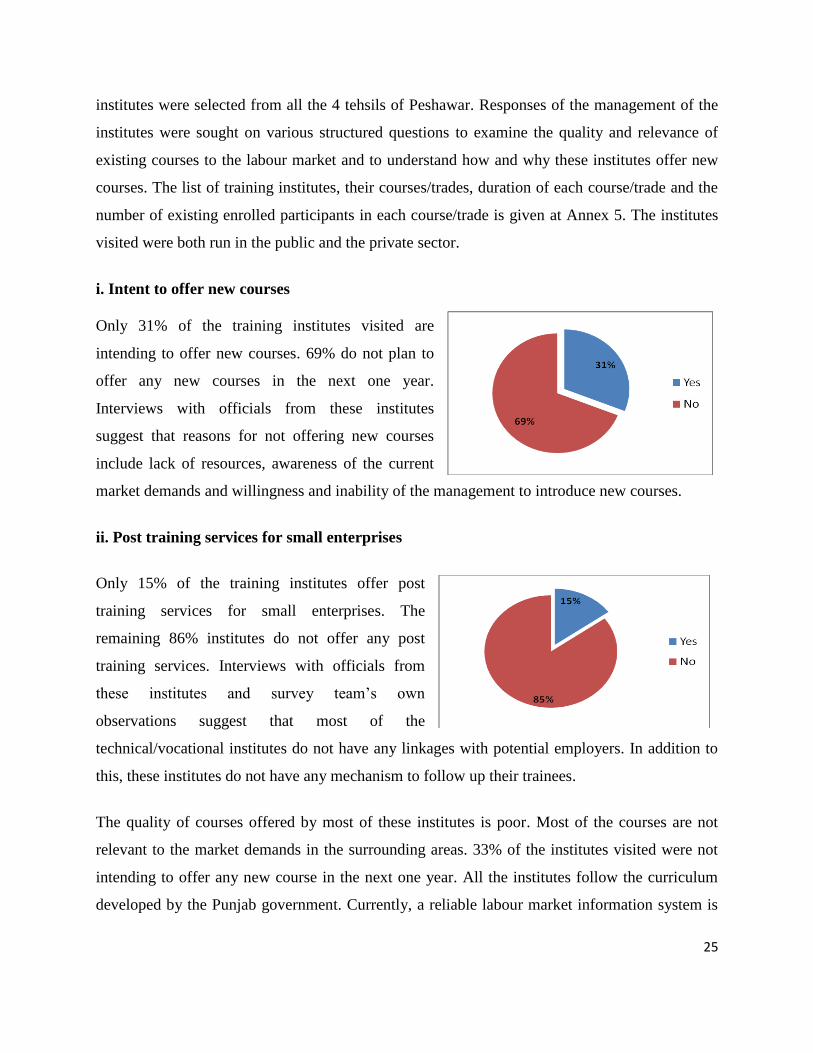
i. Intent to offer new courses
Only 31% of the training institutes visited are
intending to offer new courses. 69% do not plan to
offer any new courses in the next one year.
Interviews with officials from these institutes
suggest that reasons for not offering new courses
include lack of resources, awareness of the current
market demands and willingness and inability of the management to introduce new courses.
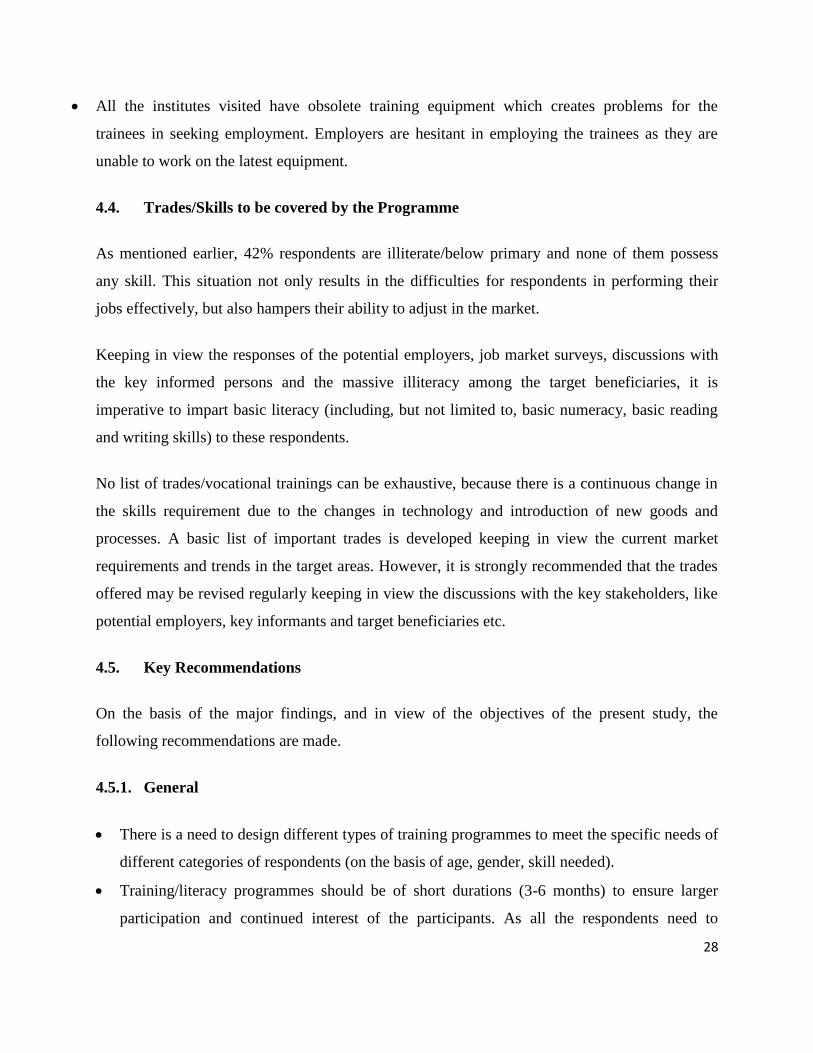
ii. Post training services for small enterprises
Only 15% of the training institutes offer post
training services for small enterprises. The
remaining 86% institutes do not offer any post
training services. Interviews with officials from
these institutes and survey team’s own
observations suggest that most of the
technical/vocational institutes do not have any linkages with potential employers. In addition to
this, these institutes do not have any mechanism to follow up their trainees.
The quality of courses offered by most of these institutes is poor. Most of the courses are not
relevant to the market demands in the surrounding areas. 33% of the institutes visited were not
intending to offer any new course in the next one year. All the institutes follow the curriculum
developed by the Punjab government. Currently, a reliable labour market information system is

26
not available due to which the technical and vocational curriculum is not very relevant to the
local labour market demands. Few teachers cover topics which they think are relevant to the
local market and are not included in the curriculum based on their own interests and experiences.
In addition to this, the equipment used in these institutes is outdated. People trained on these
equipments are unable to operate the new machinery used in the industries/factories. This makes
it difficult for the trainees in securing employment as employers hesitate in hiring people who
are unable to operate the machines.
Interviews with the potential employers and staff from the technical and vocation training
institutes show that there is a skill gap between the training/courses offered by the institutes and
the labour market.

27
Chapter 4
Major Findings and Recommendations
4.1. Target Beneficiaries
An overwhelming majority of the respondents are below/equivalent middle;
Majority of the interviewed respondents are unskilled (97.0%) and want to get training in
different trades as specified in chapter 3;
74% of the respondents earn between Rs. 4000-8000 per month, and 26% of the respondents
earn more than Rs. 8000 per month;
64% of the respondents have no information about the economic opportunities available
in/around their community;
Most of the people living in/around the respondents’ communities are involved in waged labour;
36 trades are identified by the respondents for future economic opportunities.
4.2. Potential Employers
All the potential employers interviewed in the target areas need workers. Majority of the
respondents do not meet job market requirements, and therefore are not eligible to get these jobs;
Analysis show that there are 50 trades identified by 37 employers, of which demand for 48 trades
is likely to remain constant over the next five years. However demand for 6 trades is likely to
increase in the next five years.
4.3. Training Institutes
About 31% of the total observed institutes are planning to update/introduce the courses based on
the market needs. 69% institutions don’t have such plan;
These institutes are running completely in isolation of the socio-economic environment in which
they are operating. There are no forward and backward linkages with the potential employers and
the communities. 85% of the institutes visited have poor linkages with potential employers.
28
All the institutes visited have obsolete training equipment which creates problems for the
trainees in seeking employment. Employers are hesitant in employing the trainees as they are
unable to work on the latest equipment.
4.4. Trades/Skills to be covered by the Programme
As mentioned earlier, 42% respondents are illiterate/below primary and none of them possess
any skill. This situation not only results in the difficulties for respondents in performing their
jobs effectively, but also hampers their ability to adjust in the market.
Keeping in view the responses of the potential employers, job market surveys, discussions with
the key informed persons and the massive illiteracy among the target beneficiaries, it is
imperative to impart basic literacy (including, but not limited to, basic numeracy, basic reading
and writing skills) to these respondents.
No list of trades/vocational trainings can be exhaustive, because there is a continuous change in
the skills requirement due to the changes in technology and introduction of new goods and
processes. A basic list of important trades is developed keeping in view the current market
requirements and trends in the target areas. However, it is strongly recommended that the trades
offered may be revised regularly keeping in view the discussions with the key stakeholders, like
potential employers, key informants and target beneficiaries etc.
4.5. Key Recommendations
On the basis of the major findings, and in view of the objectives of the present study, the
following recommendations are made.
4.5.1. General
There is a need to design different types of training programmes to meet the specific needs of
different categories of respondents (on the basis of age, gender, skill needed).
Training/literacy programmes should be of short durations (3-6 months) to ensure larger
participation and continued interest of the participants. As all the respondents need to

29
necessarily participate in the basic literacy course, the course timings should be kept flexible
(could be offered in the morning as well as in the evening).
A mechanism needs to be developed to ensure continued linkages of the programme with the
potential employers. These linkages will have several benefits for the successful
implementation of the programme; the potential employers can provide up-to-date
information about the job availability and skill requirements. This will help the course
coordinators and instructors to update their courses continuously. Moreover, this will also
facilitate the graduates of the vocational training courses in seeking employment.
Training must be imparted at places close to the workplaces/homes of the target
beneficiaries. This will minimize the travelling time and cost for the participants and will
reduce the risk of losing jobs.
Field training camps and mobile training workshops must be introduced to ensure larger and
continued participation, especially for women. Due to socio-cultural and economic barriers,
mobility of women in our society is restricted. Training programmes in the field will play a
crucial role in overcoming these restrictions.
4.5.2. Existing Training Institutes
For a successful implementation of the programme, IRM may provide support to the existing
training institutes in the target areas for the improvement of their courses, training materials
like equipments, and streamlining the courses with the market demands. The overall
performance of the existing training institutions is far from satisfactory. They lack
appropriate facilities and experience to organize large scale training programmes. Their
course designs and teaching methodologies need to be linked with the market demands. It is
recommended that IRM provides constant support to these institutes for the implementation
of various technical and vocational training programmes.
Generally, most public sector technical and vocational institutes tend not to specialise in
training for a particular economic sector, but offer a range of generic courses, which do not
always correspond to the diversity of actual economic activity. To promote and facilitate the
establishment of sector specific training institutes, it is recommended that these institutes be
located in proximity to relevant industry in order for them to benefit from new technologies,

30
and to facilitate industry placement of trainees and trainers and information flows between
the training institute and industry.
As employers are not willing to hire unskilled workers, there is a need to train people on the
latest equipment. This can be done in two ways. Firstly, the training equipment in the
technical/vocational institutes should be up-to-date. An alternative to this is to provide on the
job training or placements to the trainees.
4.5.3. Financial Assistance
Withdrawing the respondents from their work for full-time training might lead to a substantial
decline in their already meager incomes. In this case, many respondents might not be willing to
participate in the training programmes. To ensure maximum participation of the respondents in
the programme, the possible financial needs of the respondents should be kept in mind. It is
recommended that trainees be provided with a stipend in order to compensate for their forgone
income, to meet their travel cost and to serve as an incentive wherever needed. IRM may also
consider introducing part-time (2-4 hours per day) training programmes. For post-training
business start-up, micro-credit organisations working in the area should be taken on board to
provide financial assistance to participants who are willing to start their own businesses.

31
Annexures

32
Annex 1
Institute of Rural Management
Labour Market Survey (Peshawar)
(June-2012)
Part –Two: Target Beneficiary (Having interest in getting Vocational/Technical Training)
I. Personal Characteristics
1- Name of the Respondent
2- Age
3- Sex 1- Male 2- Female
4- Marital Status 1- Never Married 2- Married 3- Separated/Divorced 4- Widow
5- What is the highest level of schooling you have completed? 1- Never been to school/TVET 2- Vocational & Technical Education 3- Below Primary 4- Primary 5- Middle 6- Secondary 7- Higher Secondary 8- Graduation 9- Others (Specify)_______________________
II. Family Characteristics
1- What is/are the main source/s of income of your family 1- Agriculture/Farming 2- Business 3- Self Employment 4- Waged Employment 5- Regular Salary 6- Local Remittance 7- Foreign Remittance 8- Pension 9- Others (Specify)_______________________
2- What is the average monthly income of your family? PKR: _________________________________
III. Available/self desired Employment opportunities
Sl. #
33
1- What type of training/vocational opportunities are available around you
1- Public (for) a- Men b- Women c- Both
2- Private (for) a- Men b- Women c- Both
3- Any other (Specify)_____________________
2- Are there any factories/home industries around you? (If No, go to Q#4)
1- Yes 2- No 3- No Information
3- What type of factories/ home industries is available in your area?
1- Textiles 2- Food & beverages 3- Electrical Appliances 4- Sport Products 5- Construction material 6- Pharmaceutical 7- Others (specify)________________________
(multiple responses are permitted)
4- What types of work/economic opportunities are available for men around you?
1- None 2- Agriculture Work 3- Industry Service 4- Private Service 5- Business/Self Employment 6- Daily wage labor 7- Piece rate work 8- Food Processing 9- Others (Specify)________________________
(multiple responses are permitted)
5- What types of work/economic opportunities are available for women around you?
1- None 2- Agriculture Work 3- Industry Service 4- Private Service 5- Business/Self Employment 6- Daily wage labor 7- Piece rate work 8- Textile 9- Others (Specify)________________________
(multiple responses are permitted)
6- What type of economic activities the men of your community are engaged in?
1- Crop Production 2- Shop keeping 3- Selling Dairy products 4- Transport Driver 5- Govt. Employee 6- Factory Worker 7- Small Business 8- Waged labor 9- Tailor 10- Construction 11- Domestic maid/Worker 12- Auto Mechanic 13- Dealing with dairy products

34
14- Others (Specify)________________________ (multiple responses are permitted)
7- What type of economic activities the women Of your community are engaged in?
1- Crop Production 2- Shop keeping 3- Selling Dairy products 4- Handicrafts 5- Govt. Employee 6- Factory Worker 7- Small Business 8- Waged labor 9- Teacher 10- LHW/LHV 11- Domestic maid/Worker 12- Beautician 13- Dealing with dairy products 14- Textile 15- Others (Specify)________________________
(multiple responses are permitted)
8- What are you presently doing? 1- Working 2- Not doing any thing
a- Helping Parents b- Looking for a Job
3- Others (Specify)________________________
9- In which trade, you want to be skilled Specify ____________________________________
10- Why you want to learn this skill? 1- Leads to self employment 2- Leads to wage employment 3- Locally Demanded 4- Having job opportunity 5- Demand outside country 6- Others (specify)________________________
11- Any other Observation/Comment:
_____________________________________________________________________________________
_____________________________________________________________________________________
_____________________________________________________________________________________

35
Annex 2 Institute of Rural Management
Labour Market Survey (Peshawar)
(June-2012)
Part-One: Existing Vocational and Technical (Public/Private) Institutes
1- Name of the Institution
2- Location
3- Date of Establishment
4- Institutes’ specification
1. Public 2. Private
1. Men 2. Women 3. Both
5. Vocational and Technical Courses being offered by the Institutes.
Sl. # Name of the Course Minimum
Qualification
Duration of
Course
Enrolled # of Trainees’
(2011-2012)
1.
2.
3.
4.
5.
6.
7.
Sl. #

36
8.
6. Has the institute introduced any new course/upgraded existing course in last two years? (If No, go to Q#9)
1. Upgraded 2. Introduced new Course 3. None 4. Don’
7. What is the criterion for introduction of new courses/ up gradation of the existing courses?
Answer:
8. Before designing any new training course/up gradation of existing courses, what is considered more important?
1. Demand and Supply (Chamber of Commerce) 2. Demand (By the trainees’) 3. International Market 4. Any Other__________________________
9. Does the Institute provide any post training services for small and medium enterprise Development?
1. Micro Finance 2. Career Counseling 3. Any other__________________________
10. Is the institute plannig to introduce any new course in next one year. (If yes then Q # 11)
1. No 2. Yes 3. I don’t know
11. What are the courses being introduced by the institute?
1. __________________________________
2. __________________________________
3. __________________________________
Name of the Respondent:
Designation:
Contact Information:
Cell #

37
12. Any other Observations: 13.
_____________________________________________________________________________________
_____________________________________________________________________________________

38
Annex 3 Institute of Rural Management
Labour Market Survey (Peshawar)
(June-2012)
Part – Three: Formal and informal Market Employers/Industry Sector
1- Name of the Respondent:
2- Designation:
3- Organization/Shop/Industry Name:
4- Postal Address:
5- Contact Information (Cell/Email):
6- List the trades/jobs in your sector indicate their position in terms of skills Demand and availability by coding the corresponding column.
Trade/Job/Skills A- Demand B- Skills Shortage
Diminishing Stable Emerging None Shortage Critical
1 2 3 1 2 3
1 2 3 1 2 3
1 2 3 1 2 3
1 2 3 1 2 3
A- Demand (Description of types of demand)
1- Diminishing demand Demand for this job/skill is likely to decrease over the next five years.
2- Stable demand Demand for this job/skill is likely to remain constant over the next five years.
3- Emerging Demand Demand for this job/skill is likely to increase after five years.
B- Skills Shortage (Description of skills shortage)
1- No Shortage People with these skills are quite easily available
2- Skills Shortage There is a shortage of people with these skills, but this shortage is not seriously affecting work.
3- Critical skill Shortage There is a severe shortage of people with these skills, and its having an adverse impact on work.
Sl. #

39
Annex 4
Employers and Potential Industries
Sl. # Name
SITE-Kotri
1 Khazana Sugar Mills (Pvt) Ltd: Charsadda Road,Peshawar.
2 Bilour Industries (Pvt) LTd: IE. Jamrud Road, Peshawar.
3 Sohail Vegetable Ghee(Pvt)Ltd: IE. Jamrud Road, Peshawar
4 Abasin Flour & Gen:Mills (Pvt) Ltd , Dalazak Road, Peshawar.
5 Aima Food, IE, Jamrud Road, Peshawar.
6 Hashmat Food Ind: SIE, Jamrud Road, Peshawar.
7 Pearl Food Ind: (Pvt) Ltd: IE, Jamrud Road, Peshawar.
8 Euro Food Industry, IE, Jamrud Road, Peshawar. (Meat Processing)
9 Khyber Fruit Product, SIE, Kohat Road, Peshawar.
10 M.E Industries, IE. Jamrud Road, Peshawar. (Food Processing and Canning)
11 Enum Multi Textile(Pvt) Ltd: IE, Jamrud Road, Peshawar. (Yarn Fibre)
12 Wadood Woollen Mills (Pvt) Ltd:IE, Jamrud Road, Peshawar.
13 Nomi International (Pvt) Ltd: IE, Jamrud Road, Peshawar. (Carpet/Carpet yarn)
14 Prime Carpet(Pvt) Ltd: IE, Jamrud Road, Peshawar.
15 Muhammad Brothers Garment, SIE Jamrud Road, Peshawar.
16 Police Welfare Enterprises, SIE, Kohat Road, Peshawar.
17 Paizar Pvt Ltd, SIE ,Jamrud Road, Peshawar.
18 Frontier Particle Board, IE.Jamrud Road, Peshawar.
19 Khyber Wood Processing, IE. Jamrud Road, Peshawar.
20 Ciel Particle Board,IE.Jamrud Road, Peshawar. (Wood Work)
21 Combine Wood Industry, IE.Jamrud Road, Peshawar.
22 Hayat & Brothers, IE.Jamrud Road, Peshawar.
23 Pir Printing Press, IE.JamrudRoad, Peshawar.
24 Prime Ploy tex (Pvt) Ltd: IE Jamrud Road Peshawar.
25 Asim Match (Pvt) Ltd: IE. Jamrud Road, Peshawar.
26 Al-Hafeez Crystoplastic (Pvt)Ltd; IE. Jamrud Road, Peshawar.
27 Frontier Ceramics,(Pvt) Ltd, IE., Jamrud Road, Peshawar.
28 Omar Glass Industry,(Pvt) Ltd, IE. Jamrud Road, Peshawar
29 Aamir MarbleIndustry,IE.Jamrud Road, Peshawar.
30 Golden Marble Industry, I.E,Jamrud Road, Peshawar.
31 A.G.E.,Industries, (Pvt) Ltd: IE, Jamrud Road,Peshawar. (Electronc Goods and Appliances)
Source: The Peshawar Chamber of Commerce and Industries

40
Annex 5
List of Vocational and Technical Training Institutes
Sl.# Name of the Institute
Public/ Private
Address
1 Government Vocational and Technical
Education Center (Women) Public Gullbahar Road, Peshawar
2 Government College of Technology (Men) Public Kohat Road, Peshawar
3 Government Vocational and Technical
Center (Men) Public Gullbahar Road, Peshawar
4 Government poly Technic Institute Public Arbab Road, Tehkal Bala
5 Pak German Wood Working Centre Public SI E, Kohat Road Peshawar
6 Readymade Garments Centre for female Public SI E, Kohat Road Peshawar
7 Carpet Training Centre Peshawar Cantt Private Peshawar Cantt.
8 Automotive Training Centre, Public SI E, Kohat Road Peshawar
9 Army Vocational Training Institute of
Khyber Public
Artillary-11 Corps, Peshawar
cantt
10 Aims Vocational Training Center peshawar Private Canal Road, Pawka Road,
University Town Peshawar
11 Dosti Pakistan Vocational Center (Female)
Private Ring Road Sarhi Muhammad,
Usmania Town Peshawar City
12 Leads Training Center
Private O/P Sunhri Masjid Peshawar
Cantt.
13 Iqra College of Mobile Engineering
Private
Office # 7-8-9 Basement Al-
imran hotel Hasten nagri GT
Road Peshawar.


![British Columbia Labour Market Outlook 2010 - 2020 · Labour Market OutlookLabour Market Outlook British Columbia Labour Market Outlook: 2010-2020 [2] B.C. Labour Market Outlook,](https://img.pdfslide.us/doc/110x75/5e167e8e481eae63a43f8127/british-columbia-labour-market-outlook-2010-2020-labour-market-outlooklabour-market.jpg)