Embed Size (px)
Citation preview
The Danish Labour Market
Social security
Active labour market policies
Life long learning
Dynamic labour market
Social partners
Public authorities
The labour market
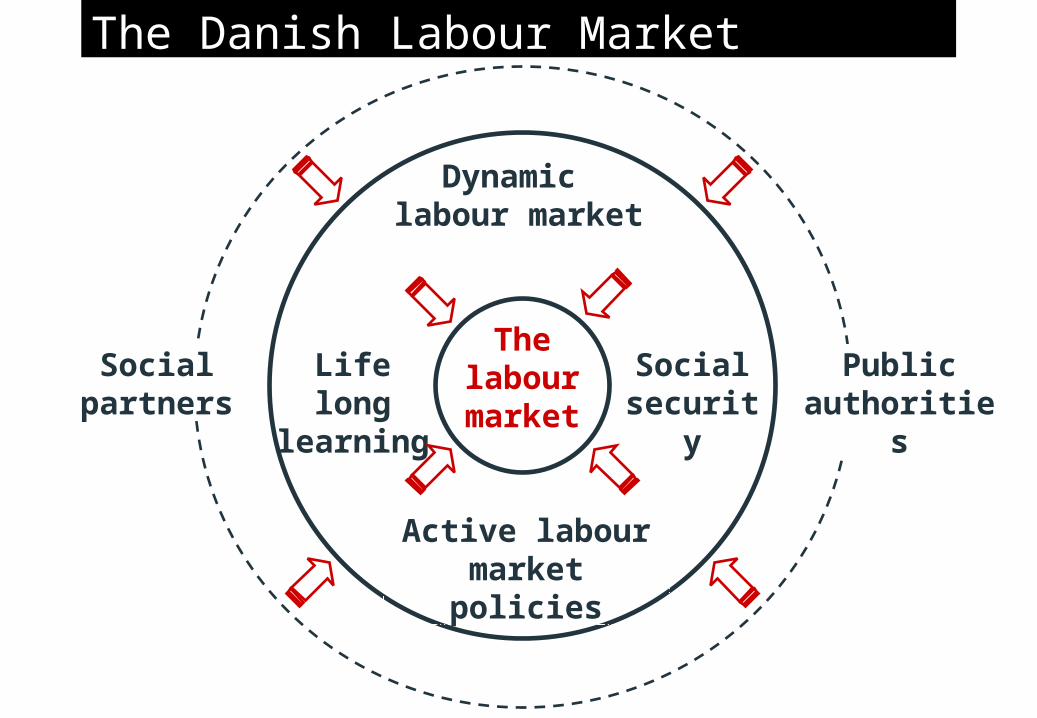
Employment SecurityScale from 1-10 – the higher the number the more secure, 2001
0
1
2
3
4
5
6
7
8
9
10
DK AT NL SE DE FI BE IE UK IT FR ES PT GR0
1
2
3
4
5
6
7
8
9
10
(3,9) (4,8)(3,9) (7,0)(8,4) (7,7) (8,2) (4,4)
(5,3) (6,8) (9,4) (8,6)(7,7)
(8,9)
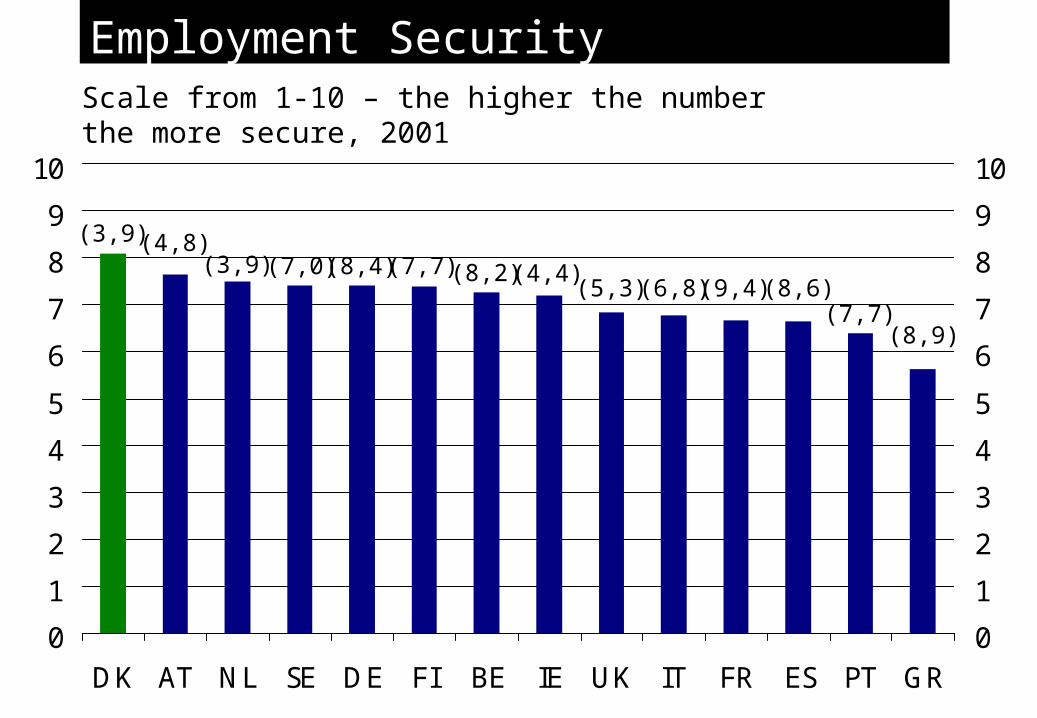
Job Satisfaction
Per cent of employment, 2006
50
60
70
80
90
100
DK NO UK CH AT BE DE NL IE LU SE PT FI FR ES IT EL50
60
70
80
90
100
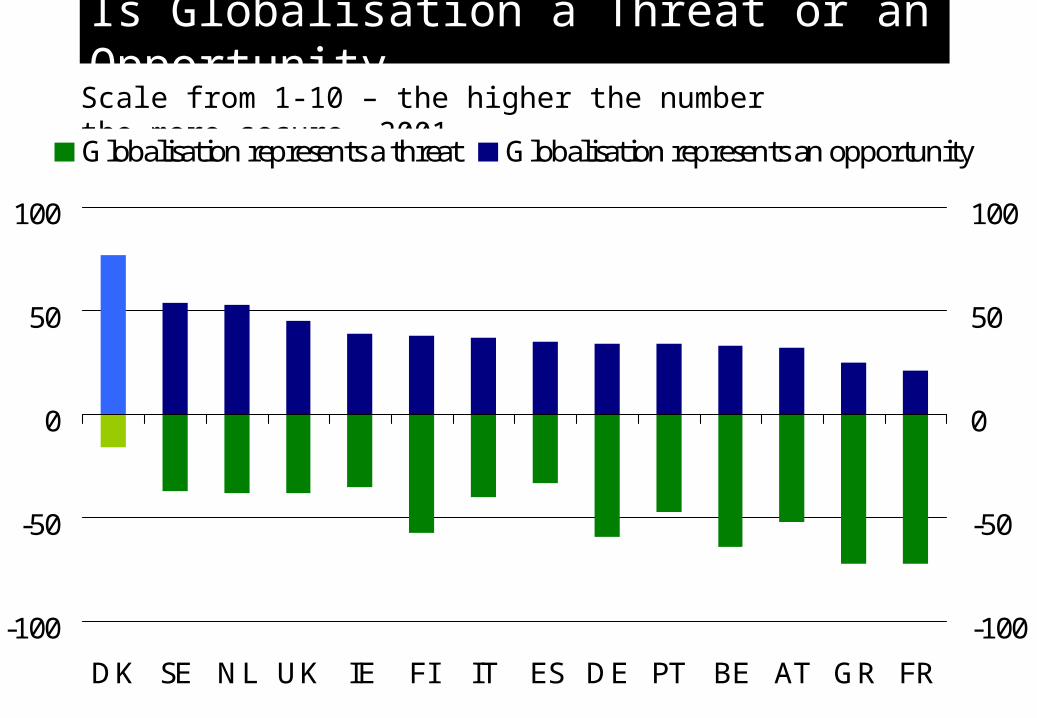
Is Globalisation a Threat or an OpportunityScale from 1-10 – the higher the number the more secure, 2001
-100
-50
0
50
100
DK SE NL UK IE FI IT ES DE PT BE AT GR FR
-100
-50
0
50
100
Globalisation represents a threat Globalisation represents an opportunity
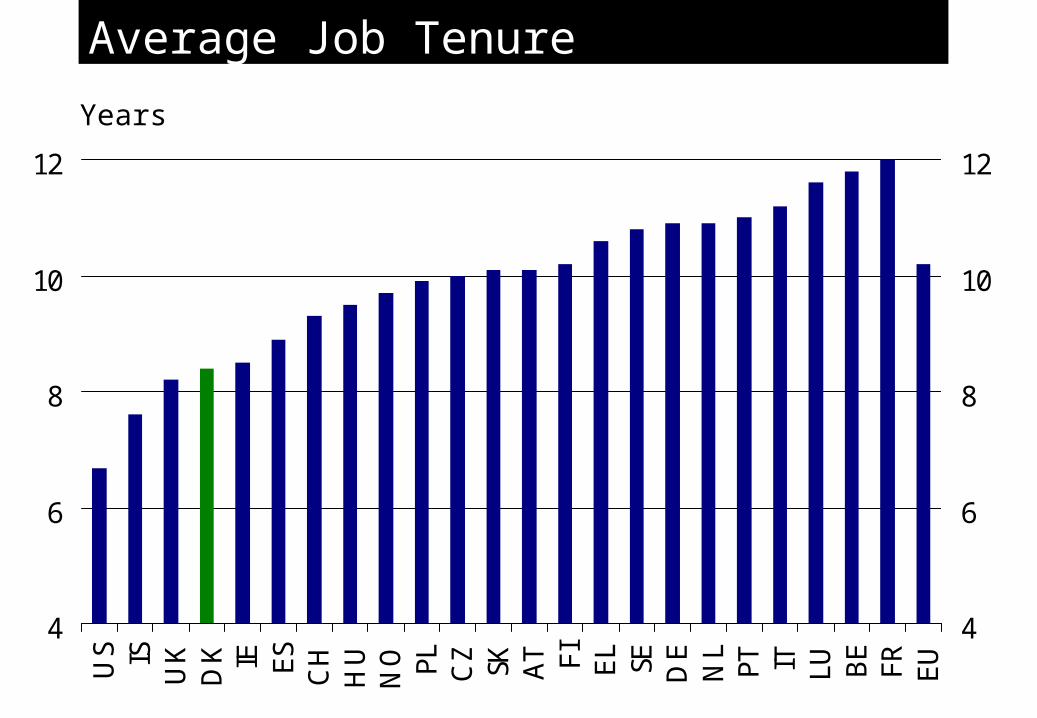
Average Job Tenure
Years
4
6
8
10
12
US IS
UK
DK IE ES CH
HU
NO PL CZ SK AT FI EL SE DE
NL
PT IT LU BE
FR EU
4
6
8
10
12
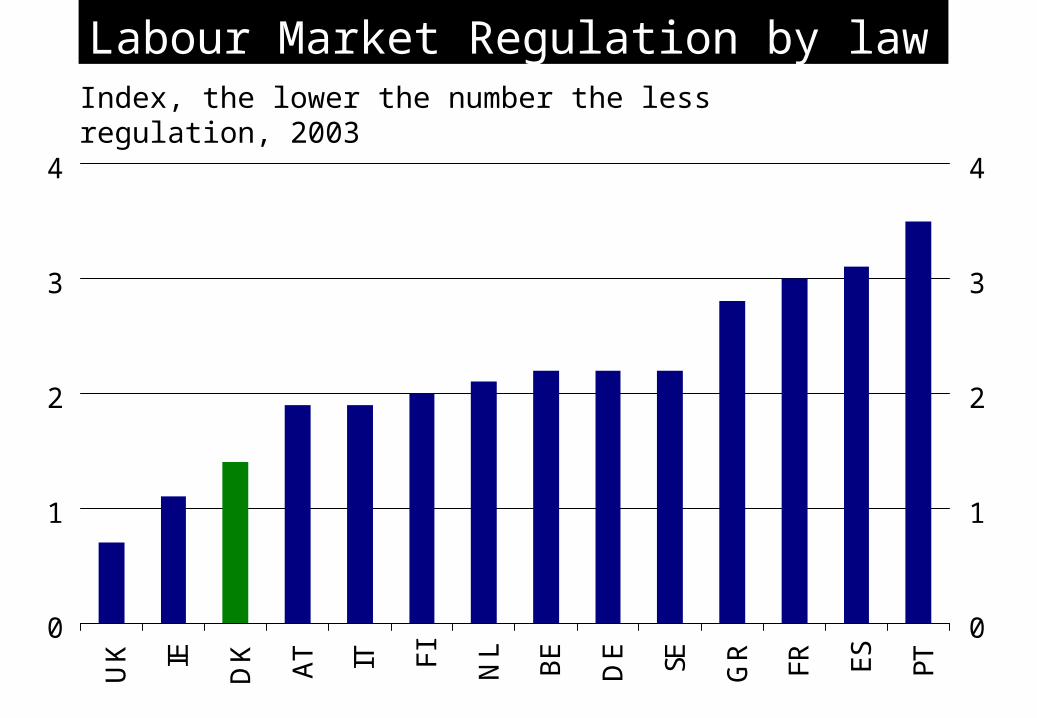
Labour Market Regulation by lawIndex, the lower the number the less regulation, 2003
0
1
2
3
4
UK IE DK AT IT FI NL
BE
DE SE GR FR ES PT
0
1
2
3
4
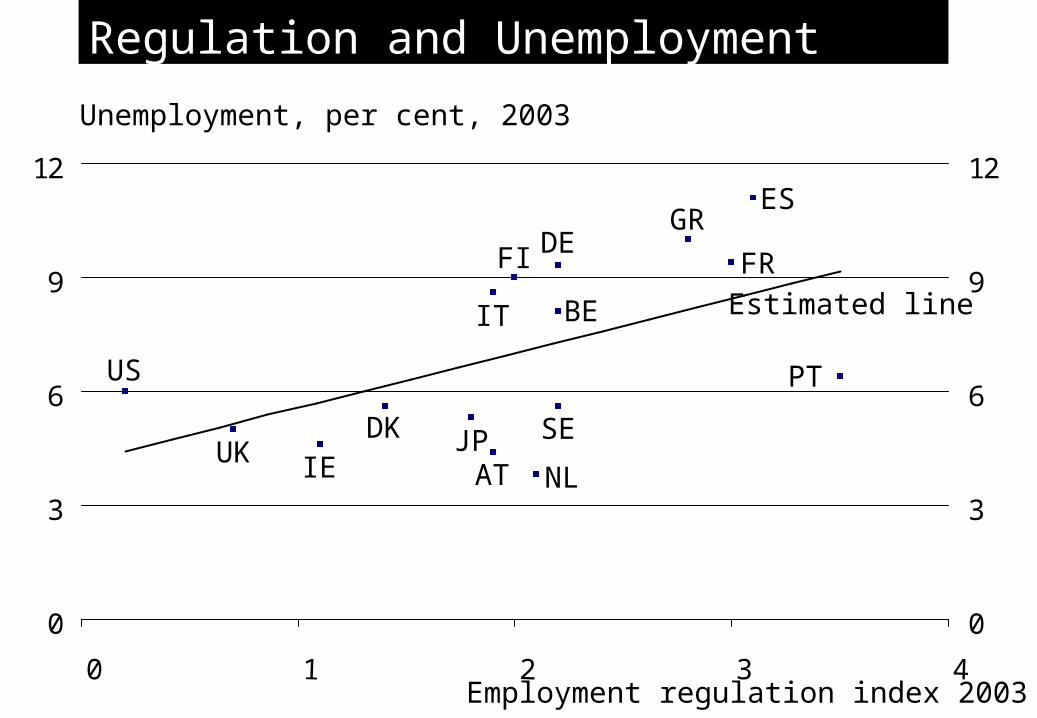
Regulation and Unemployment
Unemployment, per cent, 2003
0
3
6
9
12
0 1 2 3 4
0
3
6
9
12
Employment regulation index 2003
UK IEDK
AT
IT
FI
NL
BE
DE
SE
GR
FR
ES
PTUS
JP
Estimated line
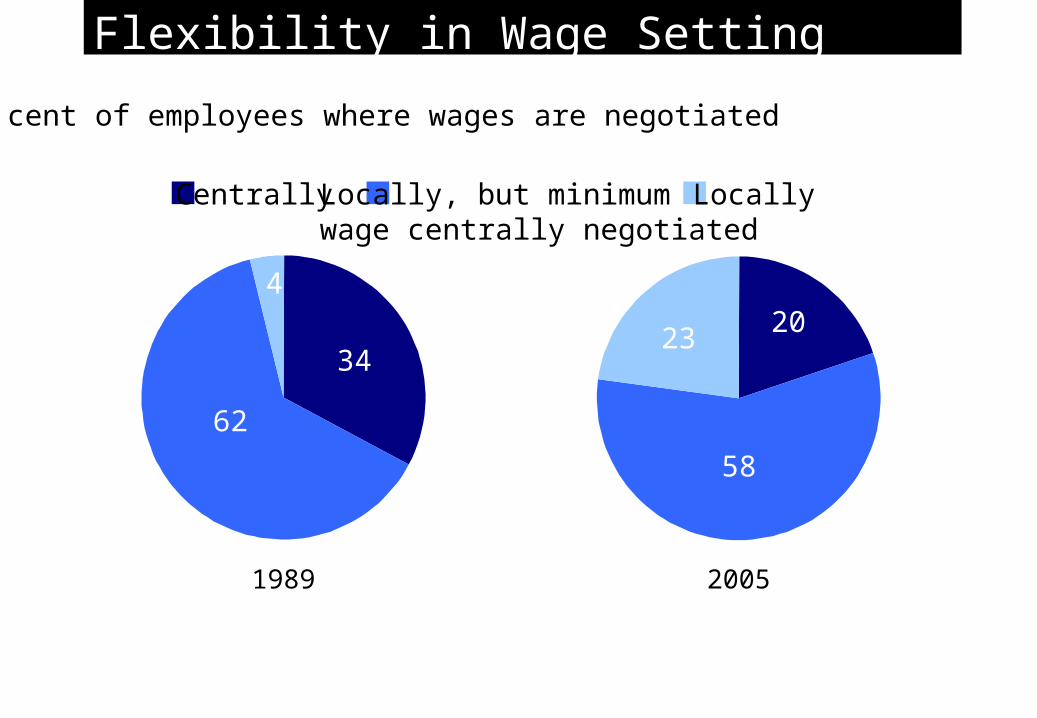
Flexibility in Wage Setting
Per cent of employees where wages are negotiated
1989 2005
34
62
20
58
23
4
Centrally Locally, but minimumwage centrally negotiated
Locally
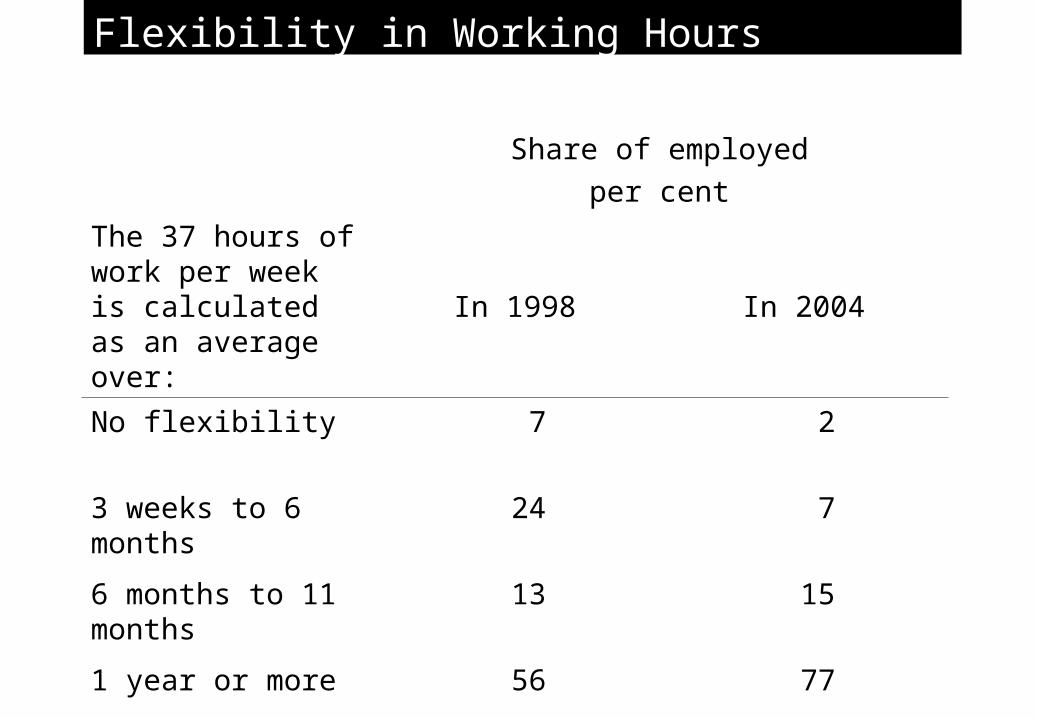
Flexibility in Working Hours
The 37 hours of work per week is calculated as an average over:
Share of employedper cent
In 1998 In 2004
No flexibility 7 2
3 weeks to 6 months
24 7
6 months to 11 months
13 15
1 year or more 56 77
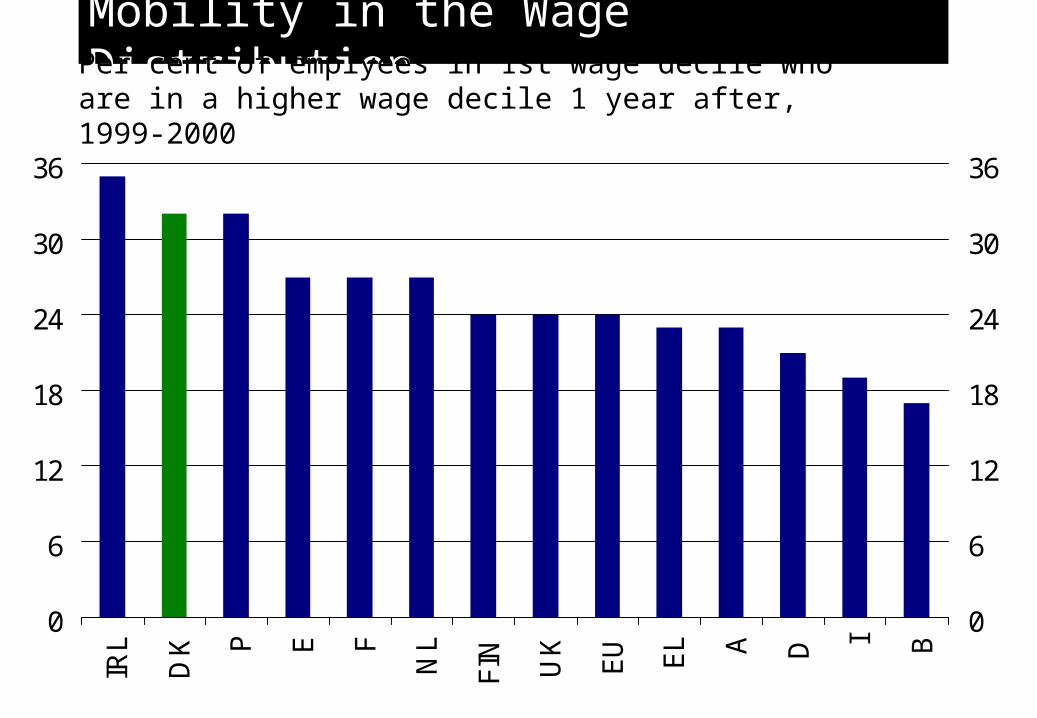
Mobility in the Wage DistributionPer cent of emplyees in 1st wage decile who are in a higher wage decile 1 year after, 1999-2000
0
6
12
18
24
30
36
IRL
DK P E F
NL
FIN
UK
EU EL A D I B
0
6
12
18
24
30
36
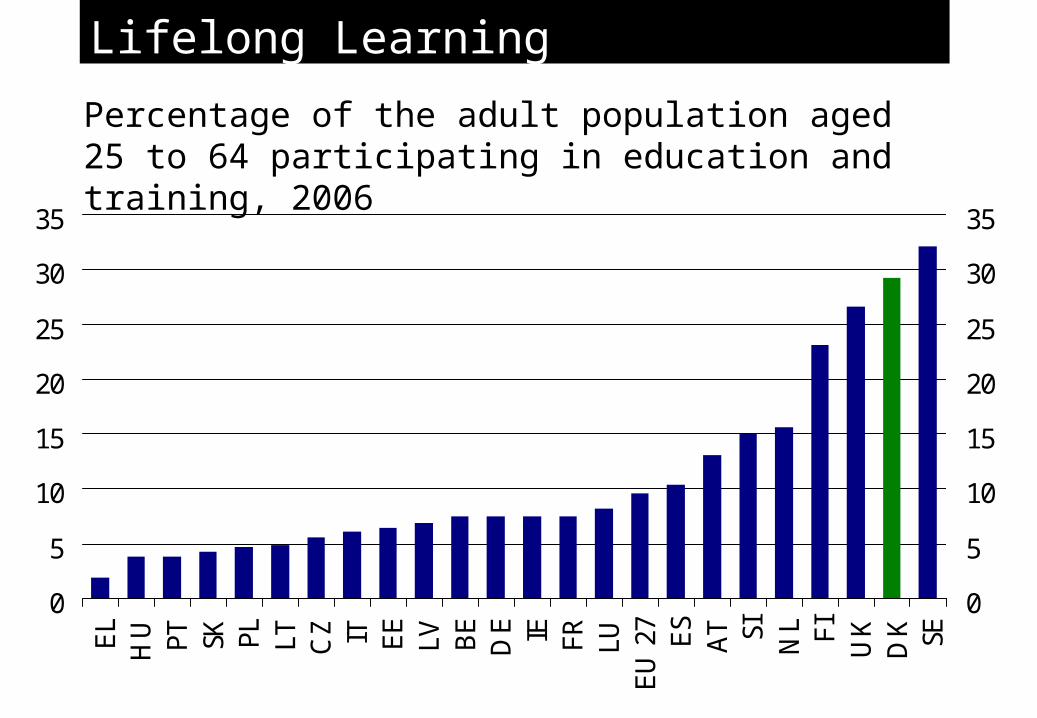
Lifelong Learning
0
5
10
15
20
25
30
35
EL
HU PT SK PL LT CZ IT EE
LV BE
DE IE FR LU
EU
27 ES
AT SI NL FI UK
DK SE
0
5
10
15
20
25
30
35
Percentage of the adult population aged 25 to 64 participating in education and training, 2006
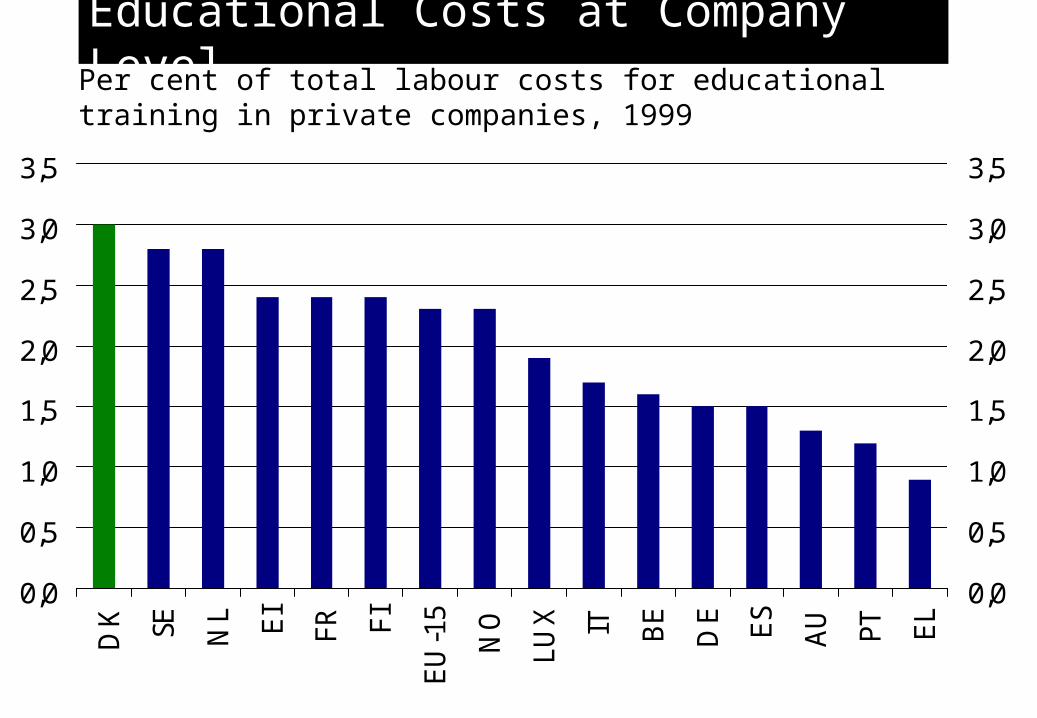
Educational Costs at Company LevelPer cent of total labour costs for educational training in private companies, 1999
0,0
0,5
1,0
1,5
2,0
2,5
3,0
3,5
DK SE NL EI
FR FI
EU
-15
NO
LUX IT BE
DE ES
AU PT EL
0,0
0,5
1,0
1,5
2,0
2,5
3,0
3,5
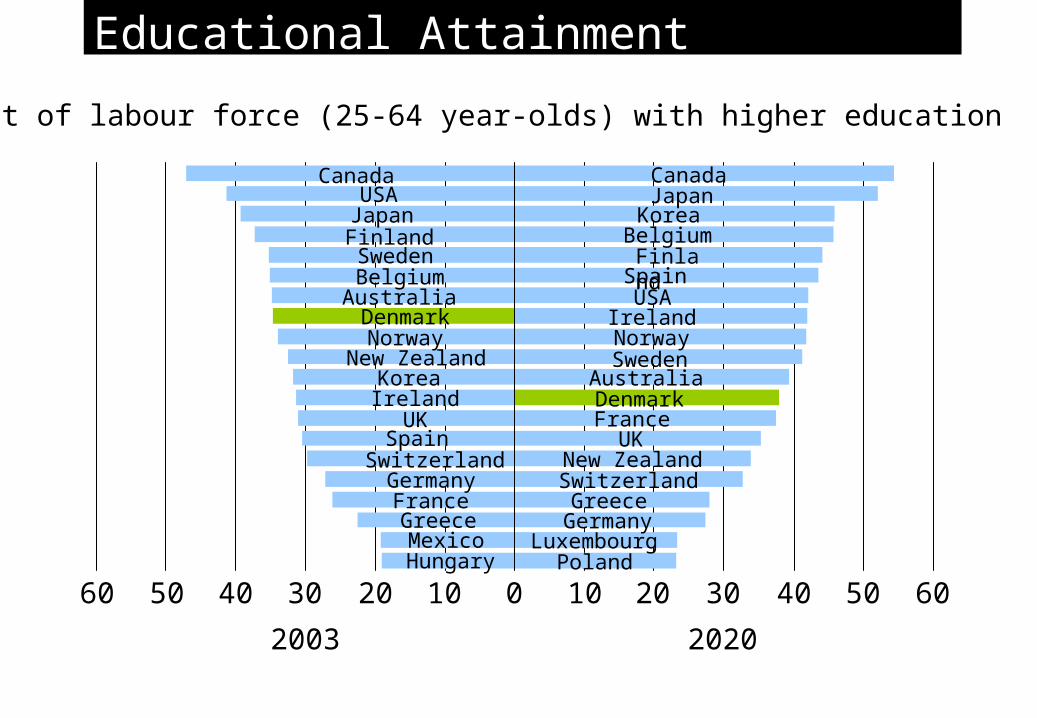
Educational Attainment
Per cent of labour force (25-64 year-olds) with higher education
CanadaUSAJapanFinlandSwedenBelgiumAustraliaDenmarkNorway
New ZealandKoreaIreland
UKSpain
SwitzerlandGermanyFranceGreece
HungaryMexico
Canada
Spain
JapanKorea
BelgiumFinlandUSA
IrelandNorwaySweden
AustraliaDenmark
UKNew ZealandSwitzerlandGreece
GermanyLuxembourg
Poland
France
60 50 40 30 20 10 10 200 30 40 50 60
20202003
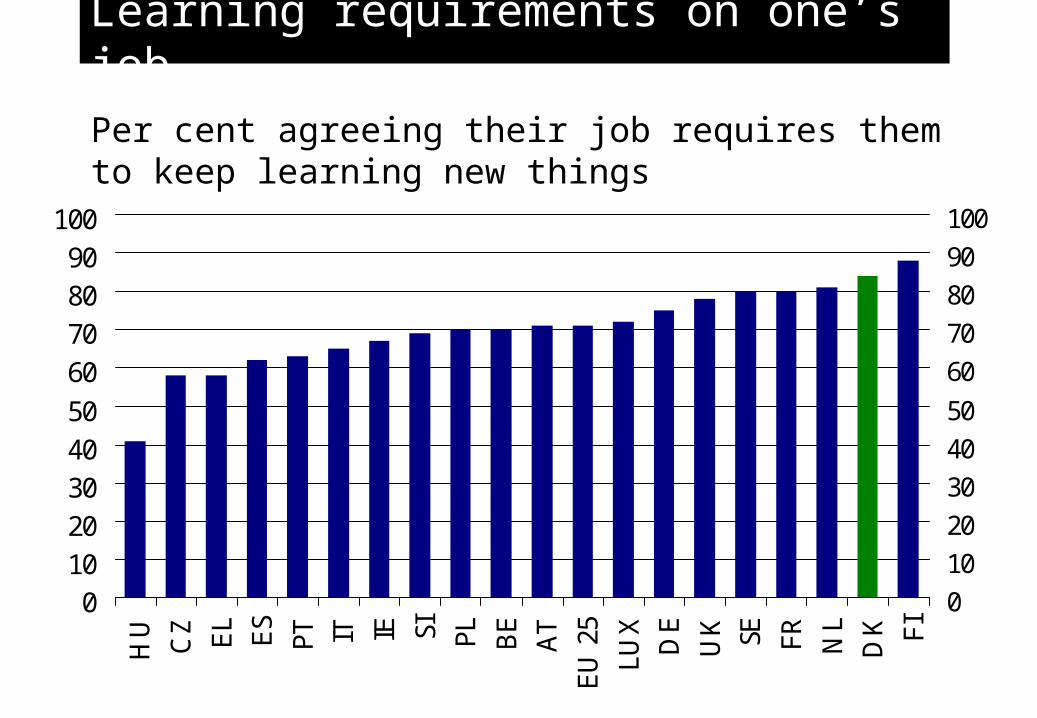
Learning requirements on one’s job
0102030405060708090
100
HU
CZ EL ES
PT IT IE SI PL BE
AT
EU
25
LUX
DE
UK SE FR NL
DK FI
01020304050
60708090100
Per cent agreeing their job requires them to keep learning new things
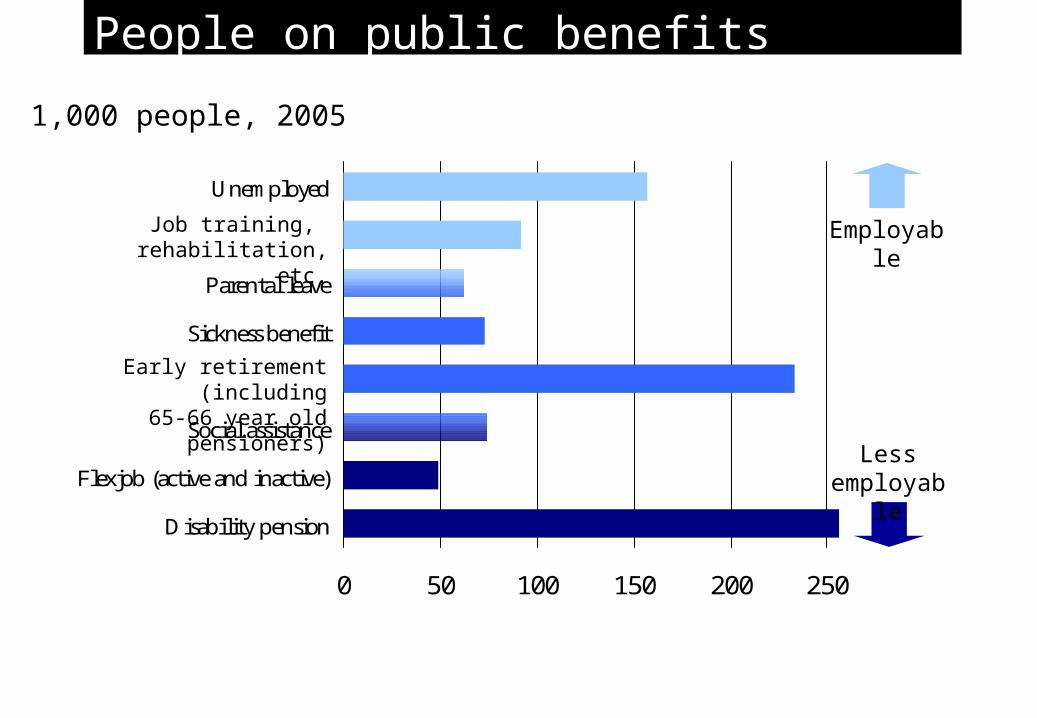
People on public benefits
1,000 people, 2005
0 50 100 150 200 250
Disability pension
Flexjob (active and inactive)
Social assistance
Sickness benefit
Parental leave
Unemployed
Employable
Less employa
ble
Job training, rehabilitation, etc.
Early retirement (including
65-66 year old pensioners)
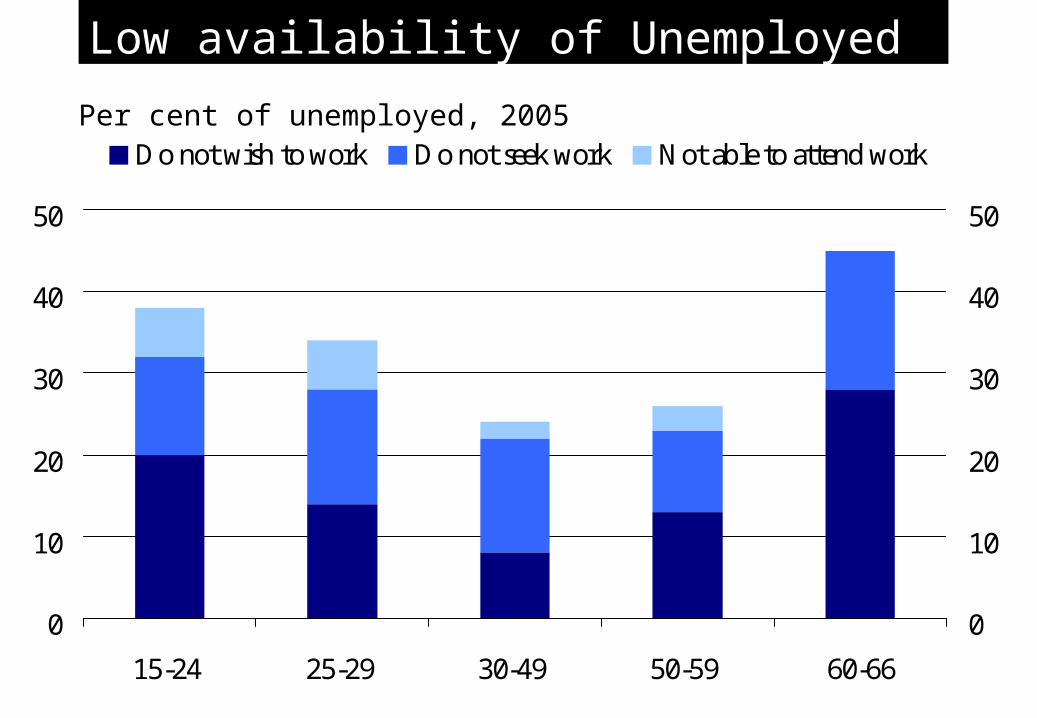
Low availability of Unemployed
Per cent of unemployed, 2005
0
10
20
30
40
50
15-24 25-29 30-49 50-59 60-66
0
10
20
30
40
50
Do not wish to work Do not seek work Not able to attend work
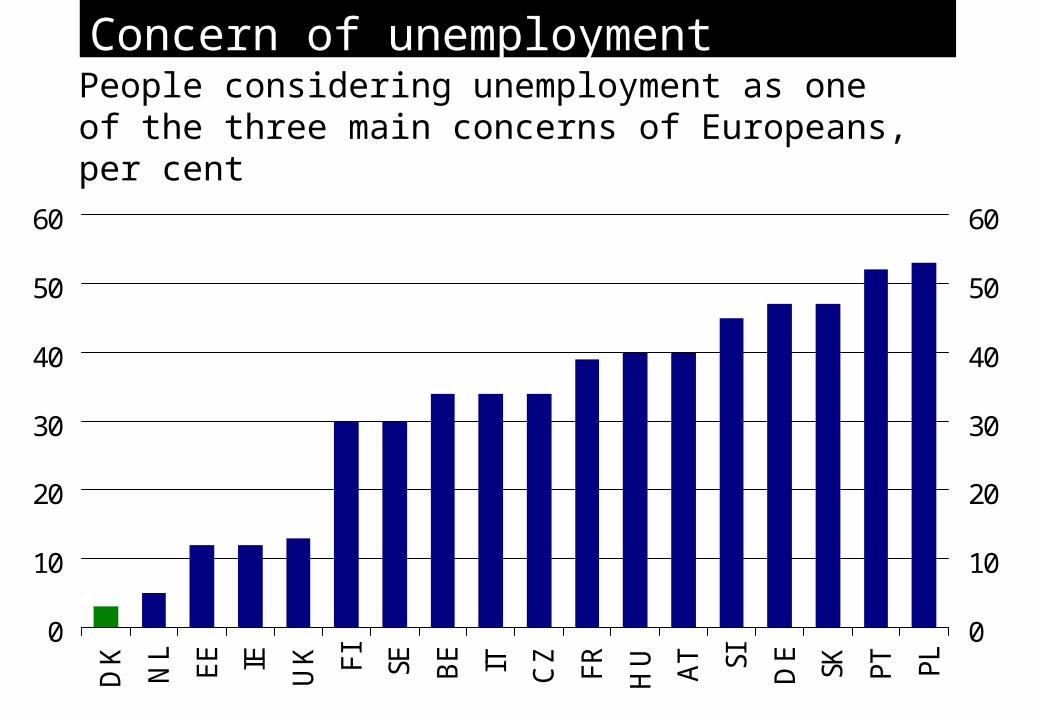
Concern of unemployment
People considering unemployment as one of the three main concerns of Europeans, per cent
0
10
20
30
40
50
60
DK
NL
EE IE UK FI SE BE IT CZ FR HU AT SI DE
SK PT PL
0
10
20
30
40
50
60
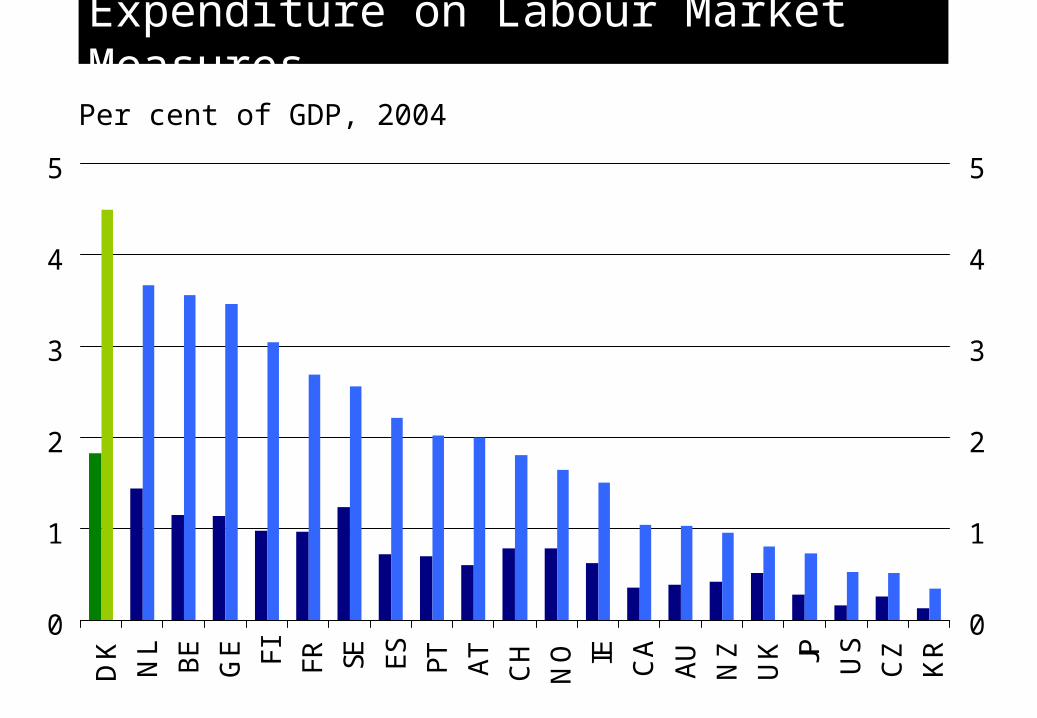
Expenditure on Labour Market Measures
Per cent of GDP, 2004
0
1
2
3
4
5
DK
NL
BE
GE FI FR SE ES PT AT
CH
NO IE CA
AU
NZ
UK JP US
CZ
KR
0
1
2
3
4
5
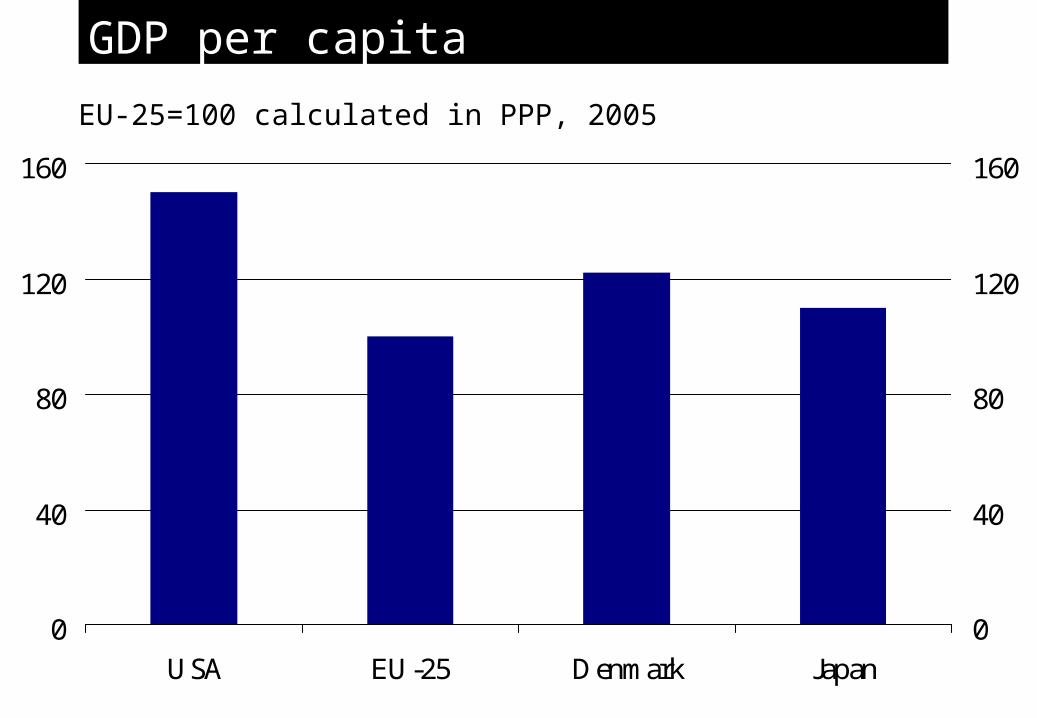
GDP per capita
EU-25=100 calculated in PPP, 2005
0
40
80
120
160
USA EU-25 Denmark Japan0
40
80
120
160
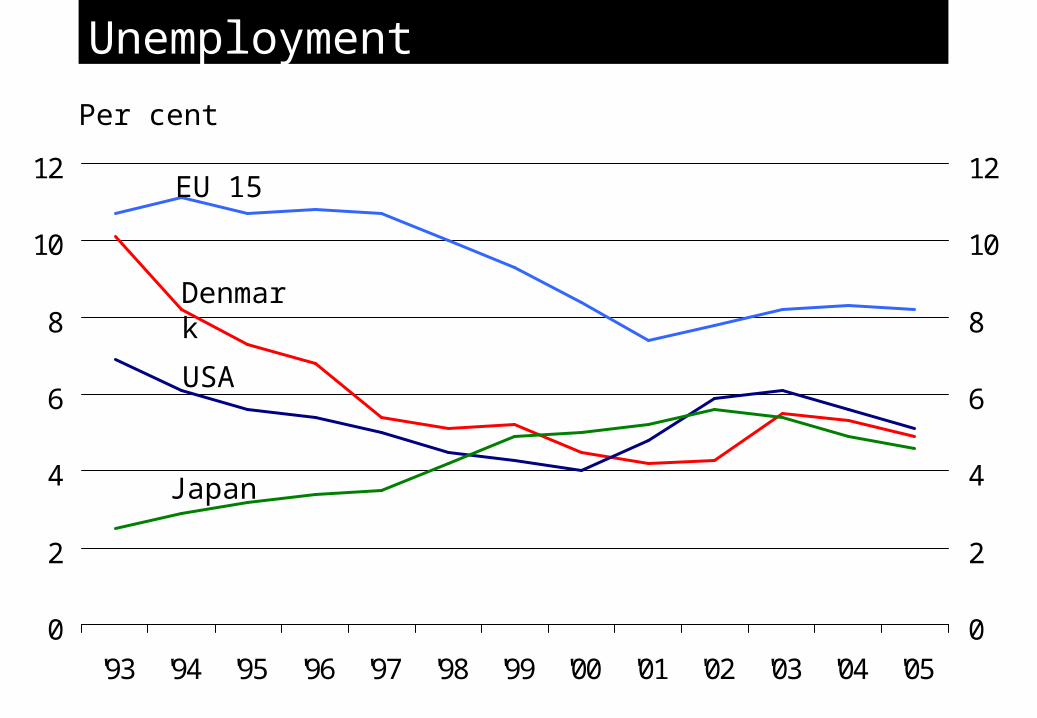
Unemployment
Per cent
0
2
4
6
8
10
12
'93 '94 '95 '96 '97 '98 '99 '00 '01 '02 '03 '04 '050
2
4
6
8
10
12EU 15
Denmark
USA
Japan
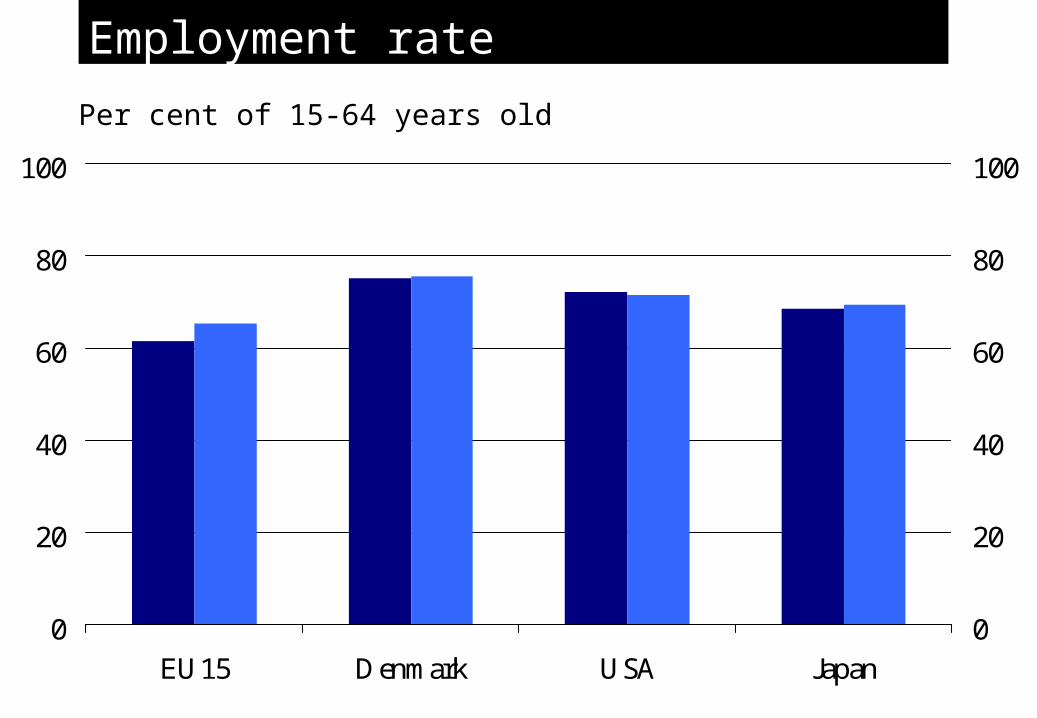
Employment rate
Per cent of 15-64 years old
0
20
40
60
80
100
EU15 Denmark USA Japan0
20
40
60
80
100
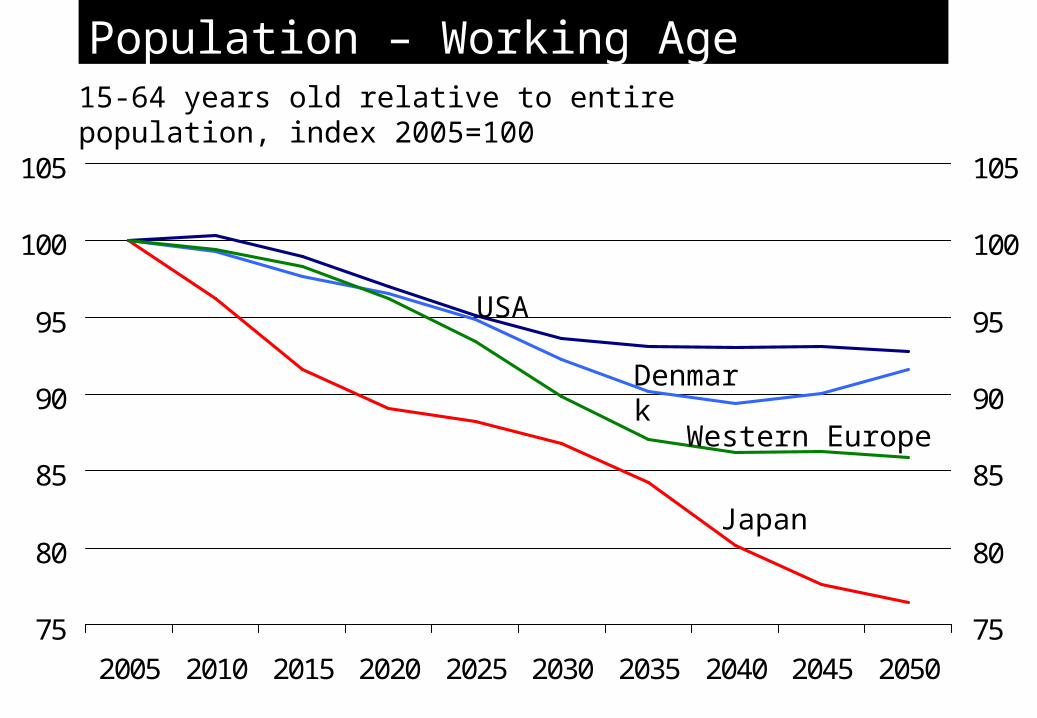
Population – Working Age15-64 years old relative to entire population, index 2005=100
75
80
85
90
95
100
105
2005 2010 2015 2020 2025 2030 2035 2040 2045 205075
80
85
90
95
100
105
Western Europe
Denmark
USA
Japan
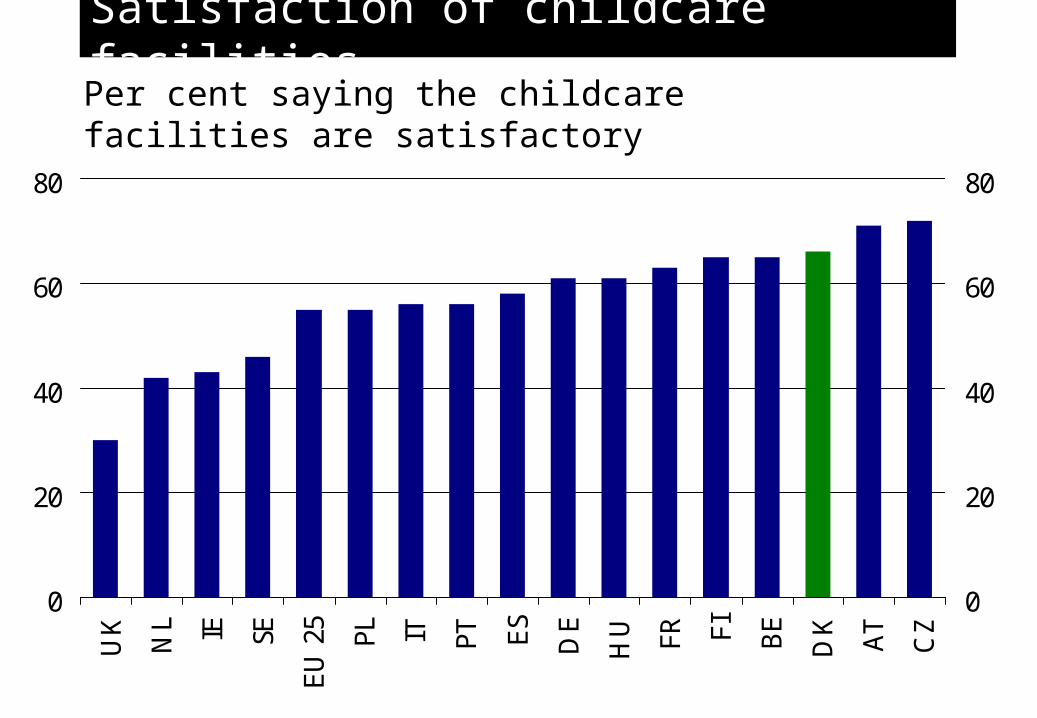
Satisfaction of childcare facilitiesPer cent saying the childcare facilities are satisfactory
0
20
40
60
80
UK
NL IE SE
EU
25
PL IT PT ES
DE
HU FR FI BE
DK
AT
CZ
0
20
40
60
80
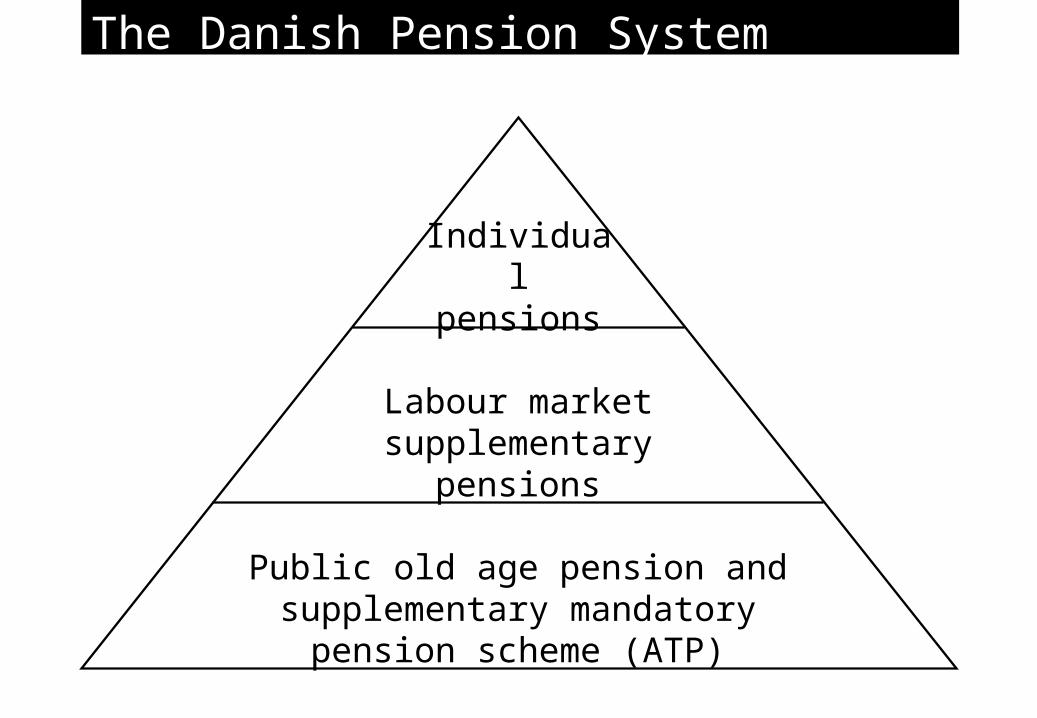
The Danish Pension System
Public old age pension and supplementary mandatory
pension scheme (ATP)
Labour market supplementary
pensions
Individual pensions
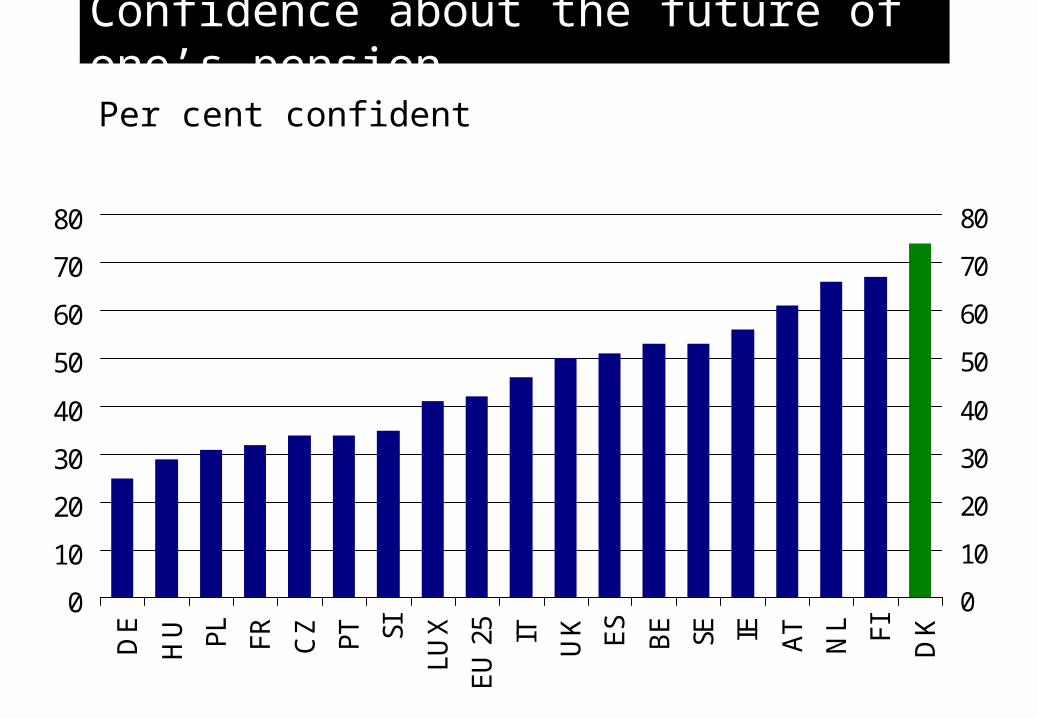
Confidence about the future of one’s pensionPer cent confident
0
10
20
30
40
50
60
70
80
DE
HU PL FR CZ PT SI
LUX
EU
25 IT UK ES
BE SE IE AT
NL FI
DK
0
10
20
30
40
50
60
70
80