Embed Size (px)
Citation preview

LABOUR MARKET PROFILE
2016 MALAWI
LO/FTF Council’s Analytical Unit
Copenhagen, Denmark

Danish Trade Council for International Development and Cooperation
Labour Market Profile 2016
Malawi 2016 Page ii
PREFACE The LO/FTF Council is the Danish trade union council for
international development co-operation. It was
established, under a slightly different name, in 1987 by
the two largest Danish confederations, the Danish
Federation of Trade Unions (LO) and the Danish
Confederation of Salaried Employees and Civil Servants
(FTF). The organization activities are related to: i) to
support democratic development of the trade union
movements in Africa, Middle East, Asia and Latin America;
and ii) to contribute to democratic development in the
societies in which the unions operate.
The LO/FTF Council presents this Labor Market Profile as
a yearly updated report that provides an overview of the
labor market's situation.
This country profile presents the recent main developments
and is not an in-depth analysis. Nevertheless, it shows a
wide range of data in a reader-friendly style. Certain
key findings of this report can be found on the Executive
Summary.
The report is divided in 11 thematic sections, which
includes trade unions, employers’ organizations, tripartite
structures, national labor legislation, violations of trade
union rights, working conditions, situation of the workforce
(with subsections such as unemployment, sectoral
employment, migration, informal economy, child labor,
gender, and youth), education (with subsection vocational
training), social protection, general economic
performance, and trade. Additionally, the reader finds an
Appendix with a list of the ratified ILO Conventions and
an updated status of trade unions in Malawi in terms of
members and Collective Bargaining Agreements (CBAs).
As indicated, the report is driven by statistical data
selection from international databanks, surveys and
reports (e.g. the International Labour Organization (ILO),
the International Trade Union Confederation (ITUC), the
World Bank, the U.S. Department of State’s Annual
Country Reports on Human Rights Practices,
WageIndicator Foundation, etc.) as well as national
statistical institutions and ministries, and others. Moreover,
narrative inputs are collected from international news
sources (e.g. The Economist, the British Broadcasting
Corporation (BBC), LabourStart, The Guardian, etc.)
together with local sources such as trade unions centers,
NGOs, national news, the LO/FTF Council’s Sub-Regional
Office, among others.
This report also collects references from several indexes,
e.g. the Global Rights Index, the Doing Business Index, the
Governance Indicators, and the Human Development
Index. The indexes’ methodologies and the data quality
can be followed by the sources websites.
Most statistical data of trade union membership is
gathered through collaboration with trade union centers
and research.
ACKNOWLEDGMENT This Labour Market Profile is prepared by the LO/FTF
Council’s Analytical Unit in Copenhagen with support from
our Sub-Region Office in Tanzania as well as the Malawi
Congress of Trade Unions (MCTU) in terms of data
collection of trade union membership.
All other labour market profiles of the countries where
LO/FTF Council operates are available at our website:
http://www.ulandssekretariatet.dk/content/landeanalyse
r
Should you have questions about the profiles you can
contact Kasper Andersen ([email protected]), Manager of the
Analytical Unit.
Cover Photo: Carsten Snejbjerg
Design and layout: Adriana Romero

Danish Trade Council for International Development and Cooperation
Labour Market Profile 2016
Malawi 2016 Page iii
EXECUTIVE SUMMARY
he evolution of the labour market in Malawi has
demonstrated very limited improvements. As an
illustration, many countries in Africa are experiencing
rising middle-classes, but this is not happening the same
way in Malawi: Nine out of ten (88 percent) of workers
have been stalled as working poor.
There has basically not been approved any new labour
market related legislations in recent years in Malawi.
Although the freedom of association and the right to
collective bargaining is respected, the International Trade
Union Confederation (ITUC) has registered flaws with
reference to the legal framework. On the positive side,
sources have not registered any cases of violations of
trade union rights in recent years.
The agricultural sector is employing 64 percent of the
total employment which is dominated slightly by women.
This sector is confronting very vulnerable and uncertain
working conditions. The industry sector is very narrow and
it is losing its stance in the economic growth which is
moving towards the service sector. This has been related
to an internal migration from rural to urban areas where
workers are looking for better job opportunities. The non-
farm enterprises are to a large degree (87 percent)
covered by sole proprietors. This gives a glimpse of the
very low labour productivity in Malawi.
It is important to note that the labour market is
fragmented in a minor formal sector and a vast
dominating informal economy. Workers and
entrepreneurs are confronting a lack of knowledge of the
labour market regulations and doing business. Also labour
inspection is rare. This report registered that the coverage
of social protection is likewise very restricted and with a
basically diminutive active contributors to pension
schemes.
The nominal minimum wages have been on an increase. It
remains lower than the neighboring countries, though. Not
to mention, the minimum wage in Malawi is far below the
cost of a basic life. The value of the real minimum wage
has been eroded by the high inflation in consumer prices
which has created panicking among the population. What
is furthermore relevant to mention is that the minimum
wage is only covering the formal sector; thus, a large
majority of labour force are not covered by the minimum
wage in practice.
The standard estimation of the unemployment in Malawi
was relatively low in comparison with the Southern Africa
average. On a more ‘broader’ measurement the
unemployment is actually much higher with gender,
education and region gaps, especially among youth.
The labour market in Malawi has persistent discrimination
against women. A majority (90 percent) of all employed
women are in the rural informal economy. In the formal
sector women are stereotypically low-paying jobs just as
with limited access to financial credits.
The education system has shown impressive high net
primary school enrolment. The quality of the education
has been acute, though. To improve the education system,
around 10,000 new teachers were trained, but their
recruitment has been delayed. On a positive side, the
secondary school enrolment is on a rise. The tertiary
school enrolment remains extremely low. The narrow
formal sector provides a limited vocational training
coverage and a majority of students choose informal
apprenticeship. This is worrisome that at least four out of
five (83 percent) of the youth in Malawi are confronting
very high qualifications mismatch on the labour market.
The trade union movement in Malawi has been on a rise.
It remains with a low trade union density on both the
waged workers (13 percent) and the total labour force
(2.0 percent). Trade union members have been dominated
by men. This has been related to that trade union have
mainly been operating in the formal sector. It is changing
now due to opening up for members from affiliated trade
union organizations from the informal economy. The trade
unions are confronting the avoidance of union fees; and
lack of knowledge on the existence of trade union in the
informal economy.
T

Danish Trade Council for International Development and Cooperation
Labour Market Profile 2016
Malawi 2016 Page iv
COUNTRY MAP
Source: The CIA World Factbook

Danish Trade Council for International Development and Cooperation
Labour Market Profile 2016
Malawi 2016 Page v
TABLE OF CONTENTS
PREFACE ............................................................................................................................................................................. I
ACKNOWLEDGMENT ......................................................................................................................................................... II
EXECUTIVE SUMMARY ..................................................................................................................................................... III
COUNTRY MAP ............................................................................................................................................................... IV
TRADE UNIONS ................................................................................................................................................................. 1
EMPLOYERS’ ORGANISATION .......................................................................................................................................... 3
COLLECTIVE BARGAINING ................................................................................................................................................ 3
CENTRAL TRIPARTITE STRUCTURES .................................................................................................................................. 4
NATIONAL LABOUR LEGISLATION ................................................................................................................................... 4
Observations on the labour legislation ..................................................................................................................................................... 5
Ratified ILO Conventions in Malawi .......................................................................................................................................................... 5
TRADE UNION RIGHTS VIOLATIONS................................................................................................................................. 6
WORKING CONDITIONS ................................................................................................................................................... 6
WORKFORCE ..................................................................................................................................................................... 7
Unemployment and Underemployment ........................................................................................................................................................ 8
Sectoral Employment ........................................................................................................................................................................................ 9
Migration .......................................................................................................................................................................................................... 11
Informal Economy ........................................................................................................................................................................................... 11
Child Labour .................................................................................................................................................................................................... 12
Gender ............................................................................................................................................................................................................. 12
Youth.................................................................................................................................................................................................................. 13
EDUCATION .................................................................................................................................................................... 14
Vocational training ......................................................................................................................................................................................... 15
SOCIAL PROTECTION ...................................................................................................................................................... 16
GENERAL ECONOMIC PERFORMANCE ........................................................................................................................... 18
TRADE ............................................................................................................................................................................. 21
Trade Agreements .......................................................................................................................................................................................... 22
Export Processing Zone (EPZs) ..................................................................................................................................................................... 22
APPENDIX: ADDITIONAL DATA ...................................................................................................................................... 23
Ratified ILO Conventions in Malawi ........................................................................................................................................................... 23
Status of trade unions in Malawi ................................................................................................................................................................ 24
REFERENCES .................................................................................................................................................................... 25

Danish Trade Council for International Development and Cooperation
Labour Market Profile 2016
Malawi 2016 Page vi
TABLES Table 1: Status of trade unions in Malawi, 2016 ............................................................................................................................................................................ 1
Table 2: Trade Union Centres, 2016 ................................................................................................................................................................................................ 2 Table 3: Status of Collective Bargaining, 2016 .............................................................................................................................................................................. 3
Table 4: Status of the national labour, social security and human rights related legislations in Malawi ............................................................................... 5
Table 5: Global Rights Index, Malawi ranking, 2014-2016 ........................................................................................................................................................ 6 Table 6: ILO Complaints Procedure in Malawi ................................................................................................................................................................................ 6
Table 7: Monthly Wages in Malawi.................................................................................................................................................................................................. 6
Table 8: Working Conditions in Malawi ........................................................................................................................................................................................... 7 Table 9: Employment-to-population ratio, 2016, Age and Sex distribution, % ......................................................................................................................... 7
Table 10: Inactivity rate in Malawi, 2016, % ................................................................................................................................................................................. 8
Table 11: Skills mismatches between job requirements and qualifications in Malawi by sexes and age group 15-29 years old, 2013, % .................. 8
Table 12: Unemployment and youth unemployment, 2016 ........................................................................................................................................................... 9 Table 13: Employed persons and GDP share per sector in Malawi, 2013, % .......................................................................................................................... 9
Table 14: Employed persons by status in employment in Malawi, 2013 .................................................................................................................................. 10
Table 15: Migration Facts ................................................................................................................................................................................................................. 11 Table 16: Informal employment in Malawi, 2013 ........................................................................................................................................................................ 11
Table 17: Working children Proportion of all children in age group ........................................................................................................................................ 12
Table 18: Youth unemployment rate (broad definition), 2013 ................................................................................................................................................... 13 Table 19: Highest level attained and years of schooling in the population, 2010 ................................................................................................................. 14
Table 20: TEVETA Vocational Training Programs ......................................................................................................................................................................... 15
Table 21: Public spending on social protection schemes .............................................................................................................................................................. 16
Table 22: Pension Schemes: Benefits, Coverage and Contributions in Malawi, 2010, % ....................................................................................................... 17 Table 23: General Economic Performance Key Facts ................................................................................................................................................................... 18
Table 24: Malawi’s Ease of Doing Business ................................................................................................................................................................................... 20
Table 25: Malawi’s Governance Indicators, 2009-2014 ............................................................................................................................................................ 21 Table 26: Trade and Foreign Direct Investment (FDI) in Malawi, 2015 .................................................................................................................................... 21
Table 27: Ratified ILO Conventions in Malawi .............................................................................................................................................................................. 23
Table 28: Status of trade unions in Malawi ................................................................................................................................................................................... 24
FIGURES Figure 1: Percentage of trade union membership by occupation, 2013 ..................................................................................................................................... 1 Figure 2: Growth in MCTU membership, 2014-2016 .................................................................................................................................................................... 2
Figure 3: Wages and earnings, monthly average, median and legal minimum wage, current Kwacha, 2000-2016 ......................................................... 7
Figure 4: Participation rates in Malawi, 1995-2015, % ............................................................................................................................................................... 8 Figure 5: Labour productivity, 2007-2016 ...................................................................................................................................................................................... 8
Figure 6: Unemployment and youth unemployment rate, 2007-2016 ........................................................................................................................................ 9
Figure 7: Employment by aggregate sector in Malawi, 2013 .................................................................................................................................................... 10 Figure 8: GDP per sector in Malawi, 2010-2013 ........................................................................................................................................................................ 10
Figure 9 : Sector share, % of GDP .................................................................................................................................................................................................. 10
Figure 10: Net migration trend in Malawi, 2008-2012 .............................................................................................................................................................. 11
Figure 11: Women in Management and Ownership in Firms 2014, Women participation, % .............................................................................................. 13 Figure 12: Qualifications mismatch of youth in Malawi, % of employment .............................................................................................................................. 14
Figure 13: School Enrolment, 2005-2013, % ................................................................................................................................................................................ 15
Figure 14: Total health-care expenditure not financed by private household’s out-of-pocket payments, 1995-2011, % .............................................. 17 Figure 15: GDP growth per capita, 2005-2014 .......................................................................................................................................................................... 18
Figure 16: GDP per capita (PPP) growth and Gini Index ........................................................................................................................................................... 18
Figure 17: Working poor, 1998-2010, % ..................................................................................................................................................................................... 19 Figure 18: Middle-class trends, 1998-2010, % ............................................................................................................................................................................ 19
Figure 19: Inflation trend, 2005-2015, % ..................................................................................................................................................................................... 19
Figure 20: Gross Fixed Capital Formation, 2006-2015, % of GDP ......................................................................................................................................... 20
Figure 21: Trade and Foreign Direct Investment (FDI) trends, 2006-2015 ............................................................................................................................... 21 Figure 22: Main products share of exports, 2014 ........................................................................................................................................................................ 21
Figure 23: Main export markets, 2015 .......................................................................................................................................................................................... 22

Danish Trade Council for International Development and Cooperation
Labour Market Profile 2016
Malawi 2016 Page 1
TRADE UNIONS
The trade union movement in Malawi was initiated in the
end of the Second World War. It has undergone a
process of growth, decline and growth again over the
past seven decades. The political context has been an
influential factor in the way trade unionism has developed
and the trade unions have a weighty challenge today. As
an example, the government has set up committees to
comment on social and economic issues of national interest
and advise the executive, but trade union members are
not included in programs.
Generally, the Labour Law allows workers to form and
join trade unions of their choice without previous
authorization or excessive requirements. Military
personnel and police are an exception, though. The
legislation also provides unions to conduct their activities
without government interference. Members of a
registered union are allowed to strike or go through a
formal mediation process supervised by the Ministry of
Labour. Members of a registered trade union in essential
services have only a limited right to strike. It is worth
mentioning that there were no strikes declared illegal
during 2015 (no data available from 2016). Sources
argue that freedom of association and the right to
collective bargaining have been respected for those in
the formal sector.1
In practice, a large majority of the workforce is not
covered by the trade union regulations since they operate
in the informal economy (see also the section: Informal
Economy). The trade union movement in Malawi is
improving the possibilities of affiliating organized
workers from the informal economy in the trade unions.
The so-called ‘taxi-moto’ sector provides a good example
of what union organizing can achieve for informal work-
ers in Malawi.2
According to the Industrial Relations Court there are
around 200,000 unionized workers. According to the
available data, the trade union density has been
estimated at 2.5 percent of the total labour force and 13
percent of the wage and salaried workers (Table 1 &
Appendix Table 28). This relatively low trade union
density has been related to trade unions is confronting the
avoidance of union fees, financial constraints and the
alliances some union leaders form.3
Table 1: Status of trade unions in Malawi, 2016
Number of trade unions 22
Dues (standard) 1 %
Members of trade unions (est.) 200,000
Trade union members share to total labour force
2.5 %
Trade union members share to waged workers
13 %
Women member share of trade unions 32 %
Members of affiliated trade unions from the informal economy
43,000 *
* All members from MUFIS, TOAWUM and QMIWU. This underestimates
the real total number of informal members.
Note: The trade union density of the total labour force covers all members
while the waged workers with only members paying dues.
Source: MCTU & National Statistical Office, Labour Force Survey 2013,
2014
According to the Labour Force Survey 2013, the most
prevalent reason for not joining trade unions or
employees associations were lack of knowledge on the
existence of the trade union or employee association (52
percent) and not aware of any union to join in my work
place (22 percent). Women have an estimated share at
32 percent of trade union membership (see also Table 1
& Table 28).
A majority of trade union membership in terms of
occupation is concentrated among managers,
professionals or clerical support workers (66 percent),
which are dominated by men (Figure 1).
Figure 1: Percentage of trade union membership by occupation, 2013
Source: National Statistical Office, Malawi Labour Force Survey 2013,
Key Findings Report, April 2014
The trade union movement covers 22 trade unions and
two congresses (see also Table 2 & Appendix’s Table 28).
Manager; 20%
Professionals ; 23%
Technicians & professionals;
3%
Clerical support
workers; 23%
Service and sales
workers; 8%
Skilled agriculture workers;
0,4%
Craft and trade
workers; 7%
Plant and machine
operators; 10%
Elementary occupations;
2%

Danish Trade Council for International Development and Cooperation
Labour Market Profile 2016
Malawi 2016 Page 2
Table 2: Trade Union Centres, 2016
Trade Union Centre Total
Members
MCTU Malawi Congress of Trade Unions 149,526
COMATU Congress of Malawi Trade Unions 7,000 *
* Data from COMATU is from 2009. Note: This table does not including many affiliated trade union members from the informal economy; thus, it diverges from the total number of trade union members in Table 1. Source: MCTU’s research department’s data collection and LO/FTF Council.
Malawi Congress of Trade Unions (MCTU)
The Malawi Congress of Trade Unions (MCTU) was re-
established in 1995 after having been banned during the
years when Malawi had a one party state under Hastings
Banda. The MCTU currently has around 150,000
contributing members from all economic sectors
represented in 22 affiliated unions (Table 2 & Table 28).
MCTU is affiliated to the International Trade Union
Confederation (ITUC). The membership has been on an
increase by 11 percent in the period from 2014 to 2016
(August) (Figure 2). Organized workers from the informal
economy have contributed much to this increase. Coupled
with an internal policy has helped MCTU to collect more
subscription fees and enhanced the organization’s
financial sustainability.
Figure 2: Growth in MCTU membership, 2014-2016
Note: The number of membership in 2016 was registered per August.
Source: MCTU and LO/FTF Council.
Women leadership representation is two out of five (40
percent) key positions (Deputy Secretary General and
Treasurer General). MCTU has reserved seat for Deputy
Secretary General to be contested by women alone.
The Chemicals, Energy Mining and Allied Workers Union
(CEMAWU) had conducted their congress and one woman
was elected into a Vice Secretary-General which
represents 20 percent.
Communication Workers union of Malawi (COWUMA)
held it congress in May 2015 where the Youth Committee
chairperson retained his position. COWUMA also merged
with Electronic Media Workers Union (EMWU). Only one
women representative was elected as Deputy Secretary
General, i.e. 20 percent women representation.
Congress of Malawi Trade Unions (COMATU)
COMATU is a breakaway union from MCTU. It used to be
affiliated with the World Congress of Labour, but is no
longer affiliated with the successor organization ITUC.
COMATU has two affiliated unions representing about
7,000 members (Table 2 & Table 28).4
Affiliated unions from the informal economy
Affiliated to MCTU is the Malawi Union for the Informal
Sector (MUFIS) that was established in 2000. This
organization organizes, promotes, protects, and
negotiates issues dealing with the rights of informal
economy workers and business training.5 MUFIS is open
for all informal workers, who can become members in the
local departments of MUFIS. The organization has
approximately 14,550 members. According to
information from MCTU, membership of MUFIS is 2,500
contributing members in 2016. The dues are 200 kwacha
(US$0.5) per year paid to the national headquarters and
50 kwacha (US$0.12) per month paid to the local
department. Around 60 percent of the members are
women while 40 percent are men. The members work in
the different sectors: home-based workers, street vendors,
waste pickers, construction workers, domestic workers and
small-scale tea farmers. In June 2015 MUFIS held its
congress and two women were elected as vice president
and vice general secretary that represents 40 percent.
MCTU and MUFIS work to formalize those working in the
informal economy by advocating for the provision of
decent benefits. Not to mention, informal economy
employees from MUFIS are still unable to obtain the same
standard of protection as formal sector workers. This has
been related to a Ministry of Labour decision that the
MUFIS did not have sufficient standing to bargain
collectively.6 However, it has been observed that a
110000
115000
120000
125000
130000
135000
140000
145000
150000
155000
2014 2015 2016

Danish Trade Council for International Development and Cooperation
Labour Market Profile 2016
Malawi 2016 Page 3
memorandum of understanding (MoU) between MUFIS,
the Unkhondo Toilet Association and Lilongwe Market
Vendors Committee was agreed and it has made it
possible to recruit approximately 100 members per
month in Lilongwe City market alone. This explains – to
some degree – the previously mentioned increase in trade
union membership.
Three other trade unions organize workers in the informal
economy. This includes the Tobacco and Allied Workers
Union of Malawi (TOAWUM) with a total 27,510
members (including not paying dues) and the Commercial
Industrial and Allied Workers Union (CIAWU) with a total
9,200 members (including not paying dues), which
includes workers in the domestic sector and has a special
organizer to deal with domestic workers. Both are
affiliated to MCTU. The Quarries Mines and Informal
Workers Union (QMIWU) has 1,300 members and
affiliated to COMATU.7 Malawi has around nine other
unions from the informal economy that are not affiliated
to trade union federation.8
EMPLOYERS’ ORGANISATION Employers’ Consultative Association of Malawi (ECAM)
ECAM was established in 1963, shortly before Malawi’s
independence. The institution has around 221 employers
registered as members and seven sectoral trade
associations. The main role of ECAM is to protect the
interests of employers on social and labour policy.9
ECAM’s challenges include members’ inadequate technical
competence on labour issues, institutional, logistical and
financial constraints, and the need for new forms of
collaboration with other bodies providing similar services.
ECAM addresses the areas:10
Gender
Occupational health and safety
Collective bargaining agreements and recognition
agreements
Social security
Freedom of association and the right to organise
HIV/AIDS in the work place
Terms and conditions of service
Child labour and youth development
Small & Medium Enterprises Development
Since funds have been misappropriated along with
fraudulent activities in government departments and
private sector, ECAM launched training in internal controls
and risk management, strategic planning and fraud
prevention in June 2016 to company managers and
officers.11 The organization also promoted awareness
activities in August 2016 which were related to discussion
on some planned amendment of the Employment Act (see
also the section: National Labour Legislation). In addition,
ECAM opened up for an offer to Malawian companies an
opportunity to use a web based competition and
recruitment platform (SQORE), an instrument that uses a
skills-based approach to graduate recruitment.
Institute of People Management Malawi (IPPM)
IPPM is professional body whose main objective is to
promote the Human Resource Management in Malawi.
IPMM was the guiding force behind the introduction of in-
country training facilities for Malawi. IPMM was also
instrumental in putting in place the Human Resources Act
(see also the section: National Labour Legislation).
COLLECTIVE BARGAINING Collective bargaining is regulated by at least 20 percent
of employees (excluding senior managerial staff) must
belong to a union before it can engage in collective
bargaining at the enterprise (factory) level, and at least
15 percent of employees must be union members for
collective bargaining at the sector (industry) level. The
legislation also provides for the establishment of industrial
councils in the absence of collective agreements for
sector-level bargaining.12
MCTU has registered 85 Collective Bargaining
Agreements (CBAs). The Communications Workers Union
of Malawi signed two new CBAs in 2016. Based on the
latest Labour Force Survey from 2013, 18 percent of
paid employed workers are covered by CBAs (Table 3).
According to sources, the right to collective bargaining
generally has been respected.13
Table 3: Status of Collective Bargaining, 2016
Number of CBAs (MCTU) 85
Workers covered by CBAs in terms of paid employed persons
120,000
Share of workers covered by CBA 18 %
Note: The calculation of the share of CBAs is based on data of the waged & salaried workers in 2011. Source: National Statistical Office, Labour Force Survey 2013, 2014

Danish Trade Council for International Development and Cooperation
Labour Market Profile 2016
Malawi 2016 Page 4
CENTRAL TRIPARTITE STRUCTURES
Mediation and Arbitration
Industrial disputes are regulated under the Labour
Relations Act. A dispute which cannot reach settlement can
be referred to the Industrial Court. The Industrial Relations
Court is composed of a Chief Justice and five members
each from employees and employers. This Act requires the
Ministry of Labour to apply to the Industrial Relations
Court to determine whether a particular strike involves an
“essential service,” the interruption of which would
endanger the life, health, or personal safety of part of
the population. The Act does not provide a specific list of
essential services, though.
Arbitration rulings have legally been enforceable.
Notwithstanding, due to lack of funding and a heavy case
backlog, the Industrial Relations Court could not monitor
cases or adequately enforce the laws. In addition, a
shortfall of this system is also that many stakeholders on
the labour market lack sufficient knowledge of roles in
labour relations and disputes.14
National Construction Industry Council of Malawi
(NCIC)
It is mandatory for all contractors, consultants and
construction material manufactures/suppliers, both local
and foreign, to register with NCIC before undertaking or
completing any construction work in Malawi.
All applications for registration or upgrading shall pass
through Registration Committee for assessment and
recommendations before final decision is made by the
NCIC Board.15
Currently close to 97 percent of construction work to
foreign companies are awarded in Malawi while only 3
percent is given to locals. NCIC is attempting to getting
the local contractors in Malawi a larger share in the
construction industry and implementing a sustainable level
of work, services, skills and technological transfer.16
Tripartite Labour Advisory Board
The board is composed of 16 members, four each from
the government, trade unions and employers’
organizations. It gives advice to the government on labour
and employment, including the promotion of collective
bargaining, the labour market, human resources
development and the review of the operation and
enforcement of the Employment Act and any other acts
relating to employment.
Other bi/tripartite organs17
Minimum wage advisory committee
Ministry of Labour Directorate of OSH
Social Dialogue Commission
National Pension Administrator (to be set)
Technical Education, Vocational and Entrepreneur-
ship Training Authority (TEVETA)
Ministry of education and Labour
Gender
Chamber of commerce
Thematic working group on trade and development
Tripartite plus
Local assemblies and community groups
NATIONAL LABOUR LEGISLATION
Constitution18 The constitution from 1994 recognises the right to work
and guarantees the freedom of association, fair and safe
labour practices, fair and equal remuneration, right to
form and join unions and protection of children from
economic exploitation. The state shall also provide a
healthy working environment and access to employment.
Employment Act The Employment Act of 1999 concerns forced labour,
anti-discrimination, equal pay, remedies for infringement
of fundamental rights, the labour commissioner, labour
officers, employment of young persons, labour contracts,
hours of work, weekly rest and leave, wages, discipline
and dismissal. This Act received amendments in 2010.
Labour Relations Act
The Labour Relations Act of 1996 regulates trade unions,
collective bargaining, strikes, lockouts and industrial
disputes. It established the Tripartite Labour Advisory
Board and the Industrial Relations Court. Equally
important, the law does not apply to or benefit the vast
majority of workers who operate in the informal economy.
Occupational Safety, Health and Welfare Act19
The Act from 1997 sets standards and the scope for
Occupational Safety and Health, for labour inspection
and investigations of accidents and working environments.

Danish Trade Council for International Development and Cooperation
Labour Market Profile 2016
Malawi 2016 Page 5
Pension Act
The Pension Act of 2011 makes provision for mandatory
pension, and for matters relating to the supervision and
regulation of pension funds and umbrella funds.
Previously, there was no legislation governing the private
pension schemes.
Worker's Compensation Act
The Worker's Compensation Act of 2000 makes provision
for compensation for injuries suffered or diseases
contracted by workers in the course of their employment
or for death resulting from such injuries or diseases.
Child Care, Protection and Justice Act
The Child Care, Protection and Justice Act of 2010
consolidates the law relating to children by making
provision for child care and protection and for child
justice; and for matters of social development of the child
and for connected matters. The prohibition of child labour
does not apply to work done in homes, vocational
technical schools, or other training institutions, though. The
law prohibits child trafficking, including labor exploitation
and the forced labour of children for the income of a
parent or guardian.20
Employment Order 2012
Although the Constitution states that children under age
16 are entitled to protection from hazardous work, the
Employment Act sets the minimum age for hazardous
labour at 18. A list of hazardous occupations -
Employment Order, 2011 (“Prohibition of Hazardous
Work for Children”) - was published in the Gazette.
Other labour market legislations
Several other legislations exist that regulate and set
standards and restrictions for the labour market in
Malawi.21 ILO has registered a total 103 national labour,
social security and related human rights legislation in the
country. Only one new piece of legislation was registered
in the period from 2014 to 2016 (see also
Table 4):
Elimination of forced labour: Trafficking in Persons
Act, 2015 (No. 3 of 2015)
Table 4: Status of the national labour, social security and human rights related legislations in Malawi
2014 2015 2016
Number of new legislations 0 1 0 Source: ILO, NATLEX, Malawi
Observations on the labour legislation
The International Trade Union Confederation (ITUC) has
registered some observations of the legislations:22
Categories of workers prohibited or limited from
forming or joining a union, e.g. armed forces and
“other categories”.
Excessive requirements in respect to trade unions’
representativity or minimum number of members
required to bargaining collectively.
A union must have 20 percent membership among the
workplace/s or categories of employees it aims to
represent in bargaining.
There is a fairly extensive list of requirements that must
be included in a union's rules as a prerequisite to
registration, but while the list is long, the requirements
seem largely good practice and reasonable.
Limitations on collective bargaining in the armed
force, the police and “other categories”.
In terms of the right to strike, there is a seven-day
notice period, which, combined with the 21-day
conciliation process, may be viewed as excessively
long as a minimum period.
Discretionary determination or excessively long list of
“essential services” in which the right to strike is
prohibited or severely restricted
Ratified ILO Conventions in Malawi
With reference to Malawi’s ratification of international
labour standards, a total 29 ILO Conventions are ratified
(see also Appendix Table 27):23
Fundamental Conventions: 8 of 8.
Governance Conventions (Priority): 3 of 4
Technical Conventions: 18 of 177.
Out of 29 Conventions ratified by Malawi, of which
29 are in force, no Convention has been denounced;
none have been ratified in the past 12 months.
The latest ratified Conventions were from 1999: the
Worst Forms of Child Labour Convention (No. 182), the
Minimum Age Convention (No. 138) from 1999, and the
Labour Administration Convention (No. 150).
With reference to the Article 22 of the ILO Constitution
(i.e. annual reports on ratified Conventions), there were
several observations and direct requests by the Comments

Danish Trade Council for International Development and Cooperation
Labour Market Profile 2016
Malawi 2016 Page 6
of the Committee of Experts (CEACR) on 13 conventions in
2015.24
TRADE UNION RIGHTS VIOLATIONS
ITUC ranked Malawi 2 out of 5+ in the Global Rights
Index in 2015. This ranking has been interpreted as
‘repeated violation of rights’ (Table 5). Countries with a
ranking 2 have slightly weaker collective labour rights
than those with the ranking 1. Certain rights have come
under repeated attacks by governments and/or
companies and undermining better working conditions.
Table 5: Global Rights Index, Malawi ranking, 2014-2016
2014 2015 2016
Ranking on the Global Rights Index
2 2 N/a
Note: Five clusters in total with ratings from 1 to 5. A country is assigned the rating 5+ by default, if the rule of law has completely broken down. Source: ITUC, Global Rights Index
ITUC has not registered any violation of trade union rights
cases in the period 2014-2016.25 Likewise the U.S.
Department of State’s Annual Country Reports on Human
Rights Practices did not record any similar rights cases.
There have been anecdotal evidence that union
organizers have been dismissed or had their rights
violated in order to deter unionization.
The ‘tenancy system’ and bond labour can involve entire
families. For example, the tobacco plantation tenants had
exclusive arrangements, often unwritten, with estate
owners to sell their crop and to buy inputs such as
fertilizer, seed, and often food. These costs, in addition to
rent charges, could be greater than the amount of money
received from tobacco sales, leading to a situation of
debt bondage to repay the inputs and other costs.26
Malawi has one closed Freedom of Association case
related to the ILO’s Complaints Procedure; and none
active or follow-up cases (Table 6).
Table 6: ILO Complaints Procedure in Malawi
Freedom of Association cases
Active 0
Follow-up 0
Closed 1
Source: ILO, NORMLEX, International Labour Standards country profile,
Malawi
WORKING CONDITIONS
The Tripartite Wage Advisory Board covers debates on
minimum wages among representatives of labour, private
sector and the government. The minimum wage was raised
from 551 kwacha (US$0.75) per day in 2014/15 to 688
kwacha (US$0.94) for both urban and rural regions; in
function per October 1, 2015 (Table 7). There was no
exception to the requirement of paying the minimum
wage for foreign or migrant workers.
Table 7: Monthly Wages in Malawi
Current Malawi Kwacha
Current US$
Median wages (2013)
13,600 37
Mean wages (2013)
41,643 113
Minimum wage (2015-2016)
18,000 24.7
Growth of minimum nominal wage (2013-2016)
117 %
Growth of real average wage (2000-2009)
614 %
Note: The real growth of wages is based on estimations of deflated wages by consumer price inflation: Year 2000 = Index 100 – Percent (see also Figure 3). Sources: National Statistical Office, Malawi Labour Force Survey 2013: Key Findings Report, April 2014; Official Malawi Government Online, September 9, 2015; and ILO, Global Wage Database 2012/13
Since a family of five needs a minimum of kwacha
71,000 (US$146) per month in 2015 to cover the costs of
a basic life, the minimum wage level continues to be far
below these needs (see also the section: General Economic
Performance).
Estimations suggest that the growth of real minimum wage
has increased by 117 percent in periods 2013 to 2016.
There has been registered a growing gap between the
nominal and the real minimum wage and mean wages
due to the rising inflation in consumer prices in recent
years (Figure 3). This is related to the currency was
devaluated by about 50 percent in 2012, which
undermined imported goods (see also the sections:
General Economic Performance and Trade).27

Danish Trade Council for International Development and Cooperation
Labour Market Profile 2016
Malawi 2016 Page 7
Figure 3: Wages and earnings, monthly average, median and legal minimum wage, current Kwacha, 2000-2016
Source: ILO, Global Wage Database 2012/13; and WageIndicator.org,
Minimum wage in Malawi
A key issue is that the Ministry of Labour lacks the
capacity to enforce the minimum wage effectively in
practice. The official minimum wages apply only to the
formal sector not the informal economy. Since a large
majority of workers operate in the latter informal
economy, the minimum wage thus turns out somewhat
irrelevant. In like manner, wage earners often
supplemented their incomes through farming activities.
Sources have outlined that there were a weak
coordination of labour inspections between headquarters
and field offices in the labour administration system. It
was noted that labour inspectors look for other sources of
income in the form of a second employment, either self-
employment or with the private sector.28
The maximum legal workweek is 48 hours, with a
mandatory weekly 24-hour rest period. The law requires
payment for overtime work and prohibits compulsory
overtime (Table 8). Nevertheless, the workweek standards
are not effectively enforced; and employers frequently
violated statutory time restrictions. The Ministry of
Labour’s enforcement of the health and safety standards
has also been poor.29 Workers - particularly in industrial
jobs - often work without basic safety clothing and
equipment.
Table 8: Working Conditions in Malawi
Normal weekly hours limit 48 hours
Overtime limit Unidentified
Maximum weekly hours limit 48 hours
Minimum mandatory overtime premium/time off in lieu of overtime wages
Hourly rate of not less than one and one-half his
wage for one hour
Minimum annual leave 15 days
Duration of Maternity Leave 8 weeks (every 3 years)
Amount of maternity leave benefits
100 %
Source of maternity leave benefits
Employer
Source: ILO, Working Conditions Law Report 2012.
WORKFORCE
Malawi’s total population has been estimated 18 million
in 2015. The labour force was assessed to 7.9 million
workers. The population is largely rural-based with as low
as 15 percent residing in the urban areas. The population
is fast growing and very young.
There are only quite marginalized gender gaps on the
overall employment distribution, except women tend to
have a slightly higher distribution by youth (15-24 years),
which is diverted marginally when they become older. The
employment-to-population ratio is higher than the sub-
Saharan Africa average on all levels (Table 9).
Table 9: Employment-to-population ratio, 2016, Age and Sex distribution, %
Sex Age Malawi Sub-Saharan
Africa
Men & women
Total 15+ 76 % 65 %
Youth 15-24 54 % 48 %
Adult 25+ 89 % 74 %
Men
Total 15+ 76 % 71 %
Youth 15-24 52 % 51 %
Adult 25+ 90 % 82 %
Women
Total 15+ 75 % 59 %
Youth 15-24 55 % 45 %
Adult 25+ 87 % 66 %
Sources: ILO, Key Indicators of the Labour Market (KILM), 9th Edition.
Malawi’s total labour participation rate has basically
been on a flat growth during the last two decades. The
youth participation rate was rising fast in the beginning of
the 2000s, but it was curbed and fell back at around 60
0
5000
10000
15000
20000
25000
30000
Minimum wage Real minimu wage
Mean wage Real mean wage

Danish Trade Council for International Development and Cooperation
Labour Market Profile 2016
Malawi 2016 Page 8
percent since 2010. This change for the youth
participation rate was related to a fast enrolment in
secondary education (see also the section: Education). The
country’s labour market participation rates are placed
high above the Southern Africa average. The latter sub-
region has worrying low labour participation rates (Figure
4).
Figure 4: Participation rates in Malawi, 1995-2015, %
Sources: ILO, Key Indicators of the Labour Market (KILM), 9th Edition.
The inactivity rate has been estimated at around 19
percent of the working age population (WAP, 15+) and
two out of five (41 percent) of the youth population (15-
24 years old) in 2016. There is a small gender gap
between men and women at 43 percent and 39 percent,
respectively (Table 10).
Table 10: Inactivity rate in Malawi, 2016, %
Total Men Women
Inactivity rate 19 % 19 % 19 %
Inactivity rate, youth 41 % 43 % 39 %
Note: The inactivity is related to working-age population that is not
engaged actively in the labour market, either by working or looking for
work.
Sources: ILO, Key Indicators of the Labour Market (KILM), 9th Edition.
Among the age group 15-29 years old, around 83
percent operate with ‘skill mismatch’; a little more than
eight out of ten (83 percent) cannot support the labour
markets demand with necessary skills. Women have a
slightly higher incidence (85 percent) than men (80
percent). Over-education is not a critical issue in Malawi
(Table 11).
Table 11: Skills mismatches between job requirements and qualifications in Malawi by sexes and age group 15-29 years old, 2013, %30
Total Men Women
Incidence of over-education
1.6 % 1.6 % 1.6 %
Incidence of under-education
83 % 80 % 85 %
Sources: ILO, Key Indicators of the Labour Market (KILM), 8th Edition.
The labour productivity is very low in Malawi and
positioned far below the Southern Africa average. This
has been related to that the Gross Domestic Product
(GDP) per capita growth has simply not been able to
grow as much as the employment rate. It has been
observed, though, the since 2012 the labour productivity
is growing again, but only slowly (Figure 5).
Figure 5: Labour productivity, 2007-2016
Note: Labour productivity is defined as output per worker (i.e. GDP
constant 2011 international US$ in Purchasing Power Parity (PPP)); and
indexed year 2000 (=100).
Source: ILO, Key Indicators of the Labour Market (KILM), 9th Edition.
Unemployment and Underemployment
According to the ILO’s estimations, the unemployment rate
has been very stable the last two decades at around 7
percent. There are only marginalized gender gaps in
unemployment in Malawi. The youth unemployment is also
relatively low at 9.0 percent in 2016; and has also been
stable the last decades. It is interesting to observe that the
Southern Africa average unemployment rates are
extremely high (Table 12 & Figure 6).
0
20
40
60
80
100
1995 2000 2005 2010 2015
Total - Malawi Youth - Malawi
Total - Southern Africa Youth - Southern Africa
0
50
100
150
0
10000
20000
30000
40000
50000
2007 2008 2009 2010 2011 2012 2013 2014 2015 2016Malawi Southern Africa
World Malawi - Index year 2000 (=100)

Danish Trade Council for International Development and Cooperation
Labour Market Profile 2016
Malawi 2016 Page 9
Table 12: Unemployment and youth unemployment, 2016
Unemployment Youth
unemployment
Under-employment
(2013)
Total 6.8 % 9.0 % 27 %
Men 6.4 % 9.4 % 26 %
Women 7.2 % 8.6 % 28 %
Southern Africa
25 % 47 % N/a
Source: ILO, Key Indicators of the Labour Market (KILM), 9th Edition &
National Statistical Office, Malawi Labour Force Survey 2013, Key
Findings Report, April 2014.
Figure 6: Unemployment and youth unemployment rate,
2007-2016
Source: ILO, Key Indicators of the Labour Market (KILM), 9th Edition.
The Malawi Labour Force Survey 2013 assessments of the
‘strict’ unemployment rate (i.e. a person takes active steps
to look for work or to start some form of self-employment)
are relatively close to ILO’s estimations. But based on a
more ‘broader’ unemployment interpretation - i.e. those
that want to work but are not actively searching for a job,
wanted to work but there are no jobs in the area or were
unable to find work that required their skills - was
estimated at 20 percent with a significant gender gap
between men (14 percent) and women (26 percent).31
Equally important Malawi has both a high share of the
population living in rural areas and has a high
urbanisation growth, which increase demand for urban
jobs and is a cause for the relatively high youth
unemployment (see also Table 18).32
Sectoral Employment
The formal sector is narrow in Malawi and it was
estimated at 7.2 percent of the labour force in 2008 -
about 2.5 percent for private businesses, 1.1 percent
work on estates; and 3.6 percent from the public sector.33
The agricultural sector is the largest employer of workers
in Malawi. Based on the data availability, around 59
percent of men workers are operating in the agricultural
sector while 70 percent among women. This sector
contributes with 28 percent of GDP. The second largest is
the trade sector that locates 16 percent and 18 percent,
respectively; and with a relatively high GDP share at 21
percent. It is curious to observe that the finance, real
estate and business sector has basically no employment,
but create up to 17 percent of the GDP share. Table 13
gives a fast overview of the employment sectors.
Table 13: Employed persons and GDP share per sector in Malawi, 2013, %
Sector Men Women GDP share
Agriculture 59 % 70 % 28 %
Mining & quarrying 0.2 % 0.3 % 1.1 %
Manufacturing 4.5 % 3.6 % 9.1 %
Electricity, gas & water
0.7 % 0.1 % 1.3 %
Construction 4.2 % 1.0 % 4.9 %
Trade, restaurants & hotels
16 % 18 % 21 %
Transport, storage & communication
3.8 % 0.2 % 6.4 %
Finance, real estate & business services
0.0 % 0.0% 17 %
Public administration, education and health
8.8 % 4.0 % 2.1 %
Other services 3.4 % 2.7 % 10 %
Source: ILO, Key Indicators of the Labour Market (KILM), 9th Edition &
African Economic Outlook, Malawi 2016
Around 87 percent of household non-farm enterprises are
owned by a sole proprietor and 13 percent are
partnerships. Most of trading enterprises (98 percent) in
women headed households are owned by single
proprietors compared to 81 percent in men headed
households.34 The Integrated Household Survey also
showed that approximately 20 percent of households in
Malawi operate as non-farm enterprises. The proportion
of households engaged in the small economic activities in
urban areas (36 percent) is more than double the rural
0
10
20
30
40
50
60
2007 2008 2009 2010 2011 2012 2013 2014 2015 2016
Total - Malawi Youth - Malawi
Total - Southern Africa Youth - Southern Africa

Danish Trade Council for International Development and Cooperation
Labour Market Profile 2016
Malawi 2016 Page 10
proportion (17 percent), reflecting the wide intra-country
disparities in the distribution of non-agricultural
enterprises.35 Other approximations of the employment
by aggregated sectors show that women are more
present in the agricultural sector than men, while this is
diverted in the industry and service sectors (Figure 7).
Figure 7: Employment by aggregate sector in Malawi, 2013
Source: ILO, Key Indicators of the Labour Market (KILM), 9th Edition
Based on the GDP per sector it is noteworthy to mention
that the finance, transport, trade and construction sectors
have experienced increases while the manufacturing and
agricultural sectors have declined in the period from
2010 to 2013 (Figure 8).
Figure 8: GDP per sector in Malawi, 2010-2013
Source: African Economic Outlook, Malawi 2016
In terms of the more broad sectors’ share of GDP
contribution to GDP during the last decade, there has
been a sectoral shift away from the industry sector to the
service sector. Since the industry sector is the most
regulated, it could to some extent indicate that the
economy is becoming more informalized.
Figure 9 : Sector share, % of GDP
Source: World Bank, World Development Indicators
Based on the Malawi Labour Force Survey 2013 (MLFS
2013), the country has a relatively high rate of paid
employees at 38 percent of the labour force, which is
slightly dominated by men (Table 14) (see also the sub-
section: Gender). Own-account workers create the largest
employment at 54 percent not forgetting the contributing
family workers at 7.2 percent. In these two latter aspects,
women are more present than men.
Table 14: Employed persons by status in employment in Malawi, 2013
Total Men Women
Paid employees 38 % 44 % 32 %
Employers 1.1 % 1.5 % 0.8 %
Own-account workers 54 % 49 % 59 %
Contributing family workers
7.2 % 6.0 % 8.4 %
Source: National Statistical Office, Malawi Labour Force Survey 2013,
Key Findings Report, April 2014
When growth in paid employment in an economy does
not match the increase in the labour force, self-
employment is an alternative to a majority of job seekers
as a source of livelihood. Stated differently, people in
self-employment are those who are either employers or
own-account workers. Based on the mentioned MLFS
2013, self-employment contributes to 55 percent of the
total employment. Women are more likely than men to be
involved in self-employment. There are variations in the
level of self-employment by residence, region and
educational level.
0%
20%
40%
60%
80%
Agriculture Industry Service
Men Women
0%
5%
10%
15%
20%
25%
30%
35%
2010 2013
0
10
20
30
40
50
60
2006 2007 2008 2009 2010 2011 2012 2013 2014 2015
Agriculture Industry Services
Danish Trade Council for International Development and Cooperation
Labour Market Profile 2016
Malawi 2016 Page 11
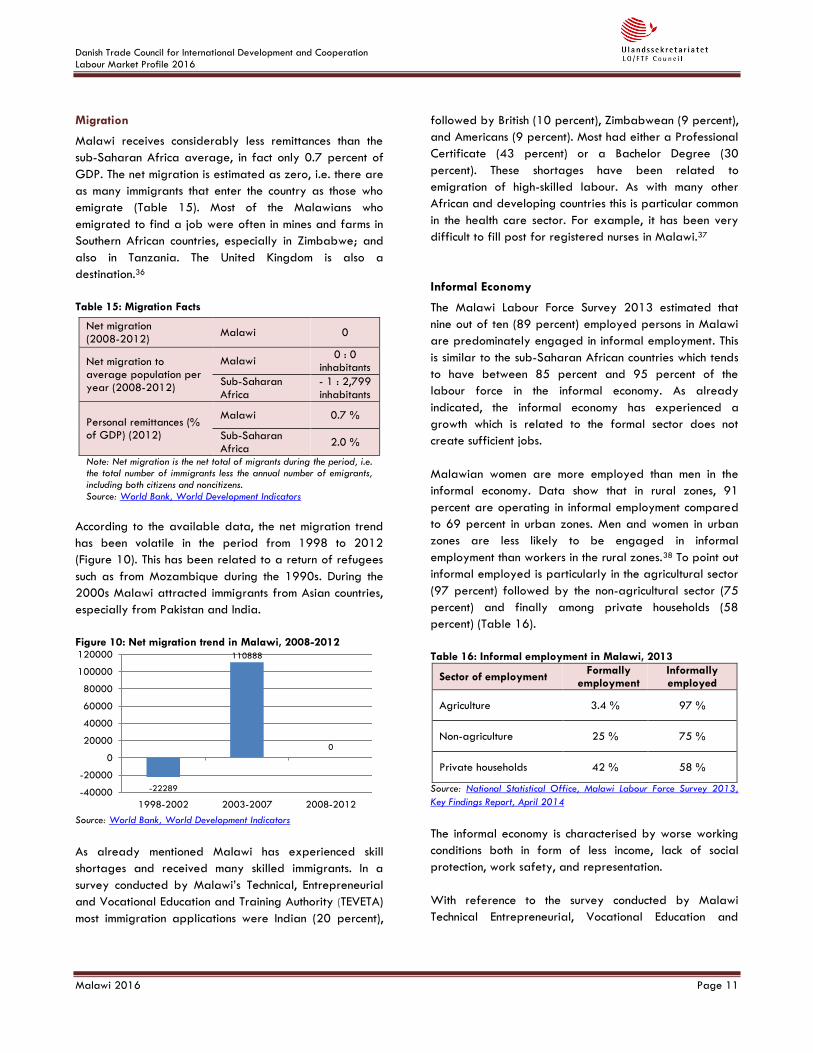
Migration
Malawi receives considerably less remittances than the
sub-Saharan Africa average, in fact only 0.7 percent of
GDP. The net migration is estimated as zero, i.e. there are
as many immigrants that enter the country as those who
emigrate (Table 15). Most of the Malawians who
emigrated to find a job were often in mines and farms in
Southern African countries, especially in Zimbabwe; and
also in Tanzania. The United Kingdom is also a
destination.36
Table 15: Migration Facts
Net migration (2008-2012)
Malawi 0
Net migration to average population per year (2008-2012)
Malawi 0 : 0
inhabitants
Sub-Saharan Africa
- 1 : 2,799 inhabitants
Personal remittances (% of GDP) (2012)
Malawi 0.7 %
Sub-Saharan Africa
2.0 %
Note: Net migration is the net total of migrants during the period, i.e. the total number of immigrants less the annual number of emigrants, including both citizens and noncitizens. Source: World Bank, World Development Indicators
According to the available data, the net migration trend
has been volatile in the period from 1998 to 2012
(Figure 10). This has been related to a return of refugees
such as from Mozambique during the 1990s. During the
2000s Malawi attracted immigrants from Asian countries,
especially from Pakistan and India.
Figure 10: Net migration trend in Malawi, 2008-2012
Source: World Bank, World Development Indicators
As already mentioned Malawi has experienced skill
shortages and received many skilled immigrants. In a
survey conducted by Malawi’s Technical, Entrepreneurial
and Vocational Education and Training Authority (TEVETA)
most immigration applications were Indian (20 percent),
followed by British (10 percent), Zimbabwean (9 percent),
and Americans (9 percent). Most had either a Professional
Certificate (43 percent) or a Bachelor Degree (30
percent). These shortages have been related to
emigration of high-skilled labour. As with many other
African and developing countries this is particular common
in the health care sector. For example, it has been very
difficult to fill post for registered nurses in Malawi.37
Informal Economy
The Malawi Labour Force Survey 2013 estimated that
nine out of ten (89 percent) employed persons in Malawi
are predominately engaged in informal employment. This
is similar to the sub-Saharan African countries which tends
to have between 85 percent and 95 percent of the
labour force in the informal economy. As already
indicated, the informal economy has experienced a
growth which is related to the formal sector does not
create sufficient jobs.
Malawian women are more employed than men in the
informal economy. Data show that in rural zones, 91
percent are operating in informal employment compared
to 69 percent in urban zones. Men and women in urban
zones are less likely to be engaged in informal
employment than workers in the rural zones.38 To point out
informal employed is particularly in the agricultural sector
(97 percent) followed by the non-agricultural sector (75
percent) and finally among private households (58
percent) (Table 16).
Table 16: Informal employment in Malawi, 2013
Sector of employment Formally
employment Informally employed
Agriculture 3.4 % 97 %
Non-agriculture 25 % 75 %
Private households 42 % 58 %
Source: National Statistical Office, Malawi Labour Force Survey 2013,
Key Findings Report, April 2014
The informal economy is characterised by worse working
conditions both in form of less income, lack of social
protection, work safety, and representation.
With reference to the survey conducted by Malawi
Technical Entrepreneurial, Vocational Education and
-22289
110888
0
-40000
-20000
0
20000
40000
60000
80000
100000
120000
1998-2002 2003-2007 2008-2012

Danish Trade Council for International Development and Cooperation
Labour Market Profile 2016
Malawi 2016 Page 12
Training Authority (TEVETA) on the informal economy,39
revealed that most employees (60 percent) had been
employed for less than three years. Only 11 percent of
the surveyed informal enterprises had no employees, 40
percent had two to four working in them and 49 percent
more than five. The most common type of informal
enterprise was in carpentry (41 percent), welding (22
percent) and mechanics (19 percent). Few in the survey
were in retail or service, where there are usually many
informal jobs in the form of self-employment with no
employees, such as street vendors, bike taxis, among
others.
Child Labour
By law the minimum age for employment is set at 14
years old. Children between the ages 14 and 18 may not
work in hazardous jobs or jobs that interfere with their
education. In practice, the law is not effectively enforced
due to lack of resources and staffing. In addition,
penalties and enforcement were insufficient to deter
offenders.40
Child labour remains a serious and widespread problem
in Malawi. Around 26 percent are working children, which
is in line with the sub-Saharan Africa average (Table 17).
Child labour is twice as high in rural areas (28 percent)
compared to the urban areas (14 percent). There is
barely any difference between sexes. Child labour is
predominantly common in tobacco farms, subsistence
farms, fishing, and in domestic service.
Table 17: Working children Proportion of all children in age group
Region Year Type Proportion
Malawi (age 5-14)
2006 Child labourers 26 %
Sub-Saharan Africa (age 5-17)
2008
Children in employment 28 %
Child labourers 25 %
Hazardous work 13 %
Note: Children in employment include all children who conduct some kind of work, whereas child labourers are a narrower term without mild forms of work. Hazardous work is the worst from of child labour as defined in ILO C182. Source: UNICEF, Malawi Multiple Indicator Cluster Survey 2006 & ILO, Accelerating action against child labour, International Labour Conference, 99th Session 2010
Trade Unions’ role in eliminating child labour has been
strengthened. Among others, MCTU contributed to
building alliances and institutional analysis on the fighting
against child labor as well as helping develop and
implementation of national policies on child labor.41
Albeit the Ministry of Labour has carried out some
inspections, mainly among agricultural estates, the
enforcement by police and ministry inspectors of child
labour laws was minimal, according to sources. It was also
augued that the government made only a little progress
to implement its National Action Plan on Child Labor
(2010-16).42
Gender
With reference to cultural and ethnic aspects of Malawi,
there are four main tribes, two of which, the Chewa and
Lomwe tribes, are women-dominated.
The labour market in Malawi still has persistent
discrimination against women that is a cause for concern.
For example, according to the Gender Based Violence
Baseline Survey from 2012, 40 percent of women had
experienced sexual violence and 30 percent experienced
other physical violence.
Nearly 90 percent of all employed women worked in the
rural informal economy, particular in subsistence farming.
It has been noted that equal pay for equal work has not
been enforced just as women are over-represented in
low-paid jobs. Despite the fact that the informal economy
is heavily patronized by women, their earnings still lag
behind those of men: women earn nearly 50 percent of
what their men counterparts involved in similar ventures in
informal enterprise earn.43 Maternity protection is
insufficient (see also Table 8).
Based on the mentioned Malawi Labour Force Survey
2013, women’s unemployment nearly doubled than men’s
unemployment rate, and was at 28-38 percent highest in
the two largest cities. In addition, unemployment was high
among those with completed secondary and higher
education, again especially among women.44
Despite efforts to alleviate poverty through social cash
transfers, women have limited access to financial
assistance and credits. On the other hand, the Customary
Land Bill was approved by the Parliament in July 2016
which now allows Malawians owning a piece of land

Danish Trade Council for International Development and Cooperation
Labour Market Profile 2016
Malawi 2016 Page 13
binding documents that would give them ownership unlike
before.
In the formal sector women tend to work in more
stereotypically low-paying jobs. This has been registered
by surveys that show that a less numbers of women were
qualified within many organizations to occupy the
managerial positions. This disparity is to a large extent
due to discriminatory tactics employed by employers who
are mainly men. Similarly, there are more men than
women occupying positions in professional syndicates such
as engineers, architects and medical associations and
others mainly due to these occupations are to a large
extent considered to be men domains. Also according to
the recent Malawi Enterprise Survey from 2014, 14
percent of firms have top women management, which
remains in line with the sub-Saharan Africa average. One
out of four (27 percent) of firms have women
participation in ownership, which is lower than the region
average (Figure 11).
Figure 11: Women in Management and Ownership in Firms 2014, Women participation, %
Source: World Bank, Malawi Enterprise Survey, 2014
Youth
Malawi has a relatively large young population: There
are around 3.6 million persons in the 15-24 years old
segment out of which 2 million are workers. This is also
one of the countries with the highest proportions of youth
without education among low-income countries in Africa.
Around 130,000 young people are entering the labour
market each year. But the formal sector only produces
around 30,000 jobs. Instead a majority are entering
vulnerable work in the informal economy or as
unemployed. Based on a strict definition of youth
unemployed was estimated at 9 percent in 2016. On the
other hand, based on the MLFS 2013, a broader youth
unemployment rate was assessed at 28 percent with a
gender gap between men (24 percent) and women (31
percent). With this in mind urban youth unemployment is
significantly high at 47 percent while rural youth
unemployment is lower at 25 percent. The youth
unemployment rate also rises along the level of education
and from regions (Table 18).
Table 18: Youth unemployment rate (broad definition), 2013
Total Urban Rural
Total 28 % 47 % 25 %
Education
None 24 % 41 % 23 %
Primary 30 % 49 % 27 %
Secondary 40 % 55 % 34 %
Tertiary 44 % 52 % 37 %
Region
Northern 17 % 31 % 16 %
Central 22 % 45 % 19 %
Southern 36 % 53 % 34 %
Note: The definition of broad unemployment includes discouraged job-
seekers: those who want to work but are not actively searching for a job as
they have lost hope, wanted to work but there are no jobs in the area or
were unable to find work that required their skills.
Source: National Statistical Office, Malawi Labour Force Survey 2013,
Key Findings Report, April 2014
Based on the NEET rate - i.e. the proportion of youth not
in employment, education or training - was estimated at
18 percent in 2012, while women’s rate is much higher at
26 percent than men’s 9 percent. Because the NEET group
is neither improving their future employability through
investment in skills nor gaining experience through
employment, it is particularly at risk of exclusion of both
the labour market and social protection.45
Other data reveals that the labour market has a high
qualification mismatch: While over-education affects 1.6
percent of young workers, there are 83 percent with
under-education (Figure 12). Traditionally the public
sector has a role of absorbing educated youth, but since it
is a very limited sector in this country, it explains parts of
the huge mismatch.
0%
5%
10%
15%
20%
25%
30%
35%
40%
% of firms with women topmanagement
% of firms with womenparticipation in ownership
Malawi Sub-Saharan Africa Low income

Danish Trade Council for International Development and Cooperation
Labour Market Profile 2016
Malawi 2016 Page 14
Figure 12: Qualifications mismatch of youth in Malawi, % of employment
Source: ILO, Is education the solution to decent work for youth in developing economies? Identifying qualifications mismatch from 28 school-to-work surveys, Work4Youth Publication Series No. 23, December 2014
As indicated, the youth population is primarily engaged in
part-time, casual labour, mostly in the informal economy.
Close to nine out of ten (88 percent) of this youth segment
are employed in the agricultural sector. Young Malawians
have few choices other than entering and work in this
primary sector, which, unlike other forms of business, has
fewer barriers to entry for survival.
Based on a Youth NGOs Monitoring Report, there is an
urgent need to raise awareness about youth’s work
deficiencies In Malawi. It has even been noted that most
NGOs are operating with youth do not strategize on how
best to create a form of employment from their
members.46
The government launched a revised National Youth Policy
in 2013 which aims to empower the youth to face the
social, cultural, economic and political challenges facing
the country. The policy has previously been lying idle for
a long period.47
EDUCATION
Most Malawians can be said to have some sort of
education. Most have begun primary school enrolment,
yet fewer have progressed into higher education. This
leaves the average year of schooling per capita at
around 4.3 years. Extremely few have same sort of
university education, especially compared to the
otherwise higher number of people in Malawi with some
education (Table 19).
Table 19: Highest level attained and years of schooling in the population, 2010 Population 25+, Male & Female, % of population aged 15 and over
Highest Level Attained Male Female
No Schooling 20 % 39 %
Primary Begun 58 % 50 %
Completed 16 % 9.2 %
Secondary Begun 21 % 11 %
Completed 12 % 5.6 %
Tertiary Begun 0.5 % 0.2 %
Completed 0.4 % 0.2 %
Average year of total schooling 5.2 years 3.4 years
Note: Primary, secondary and tertiary is the internationally defined distinction of education. In Denmark these corresponds to grundskole, gymnasium & university. Source: Barro, Robert and Jong-Wha Lee, April 2010, "A New Data Set of Educational Attainment in the World, 1950-2010." NBER Working Paper No. 15902
Based on the available data, Malawi has demonstrated a
very high net primary school enrolment at 97 percent
while the sub-Saharan Africa average was 77 percent. A
gender gap shows that slightly more girls are enrolled
than boys in Malawi.
The secondary school enrolment has been on a fast
upsurge during the last decade. On this level, Malawi’s
females are currently in par with the region average
while males’ stay lower.
As mentioned, the tertiary school enrolment growth has
basically stayed flat. The country remains one of the
lowest enrolments into tertiary education in the world. You
can see more on Figure 13.
Overeducated; 1,6%
Undereducated ;
83%
Well-matched;
16%

Danish Trade Council for International Development and Cooperation
Labour Market Profile 2016
Malawi 2016 Page 15
Figure 13: School Enrolment, 2005-2013, % Male and Female, Malawi and the sub-Sahara Africa (SSA)
Source: World Bank, Education Statistics
Overall, gender difference tends to be relatively small in
Malawi’s school enrolment. The rising education enrolment
level in the secondary education is a positive trend. A
previous study even concluded that education is like a
‘passport’ to formal employment and leads to higher
hourly earnings. Within regular wage employment,
secondary education is associated with a 123 percent
wage premium, and university education with a 234
percent wage premium (relative to illiteracy) in Malawi.48
However, as shown above, relatively few complete their
education and instead end up in (broad) unemployment or
entering the informal economy.
Albeit the government trained 10,000 teachers through
open and distance primary teacher education program.
However, these teachers have, so fat, not been recruited.
This has been related to administrative challenges
incorporating the previous graduates into the education
system, especially adding them on the pay roll. The
teachers union of Malawi expressed its concern that the
government not yet has recruited the new trained
teachers taking into consideration the high pupil enrolment
ratio in schools was already alarming. Not to mention the
teachers are suffering in primary schools because of harsh
working conditions emanating from unrealistic teacher
pupil ratio as well as bitter for being turned into
freeloaders.
Vocational training
Malawi’s technical and vocational education system is
diverse. Among others it has a multitude of private and
public providers offering, but the service costs are
unaffordable to the large majority. This is also a main
reason why many young people choose informal
apprenticeship since it seems a greater likelihood of
securing a job afterward in comparison with formal
training.49
The government established in 1999 the Technical,
Entrepreneurial and Vocational Education and Training
Authority (TEVETA). This system is covering both the formal
sector and the informal economy. The institution operates
with eleven programs (Table 20).
Table 20: TEVETA Vocational Training Programs
Programs Year
commenced No. of trained
students/trainers
Apprenticeship skills training programs
2007 2,262
Skills Development Initiative
2000 3,500
Small Enterprise Development
2003 3,030
On the Job Training 2009 330
Enhancing TEVETA Outcomes (ETO)
2003 100
50
55
60
65
70
75
80
85
90
95
100
Net primary school enrolment
Malawi -Total
Malawi -Males
Malawi -Females
SSA - Males
SSA -Females
20
22
24
26
28
30
32
34
36
38
Net secondary school enrolment
Malawi -Males
Malawi -Females
SSA -Males
SSA -Females
0
2
4
6
8
10
12Gross tertiary school enrolment
Malawi -Males
Malawi -Females
SSA -Males
SSA -Females

Danish Trade Council for International Development and Cooperation
Labour Market Profile 2016
Malawi 2016 Page 16
Project50
TEVETA/MACOHA/NAD Project
2003 260
Apprenticeship Program N/a N/a
Public and Private Sector Training Program
2007 433
Integrated Strategic Skills Development Programmes
1999 N/a
Skills Development Initiative
1999 N/a
About Quality Assurance Programme
N/a N/a
Note: There is no information of when the programs end. Source: TEVETA, TEVETA History
A revised TEVET policy was launched in October 2014 to
be implemented over the next five years to incorporate a
number of developments that have taken place in the
country.
According to the percentage of private firms offering
formal training to their permanent and full-time staff,
Malawi seems to perform notably better than its three
neighboring countries. The most recent available data for
Malawi was 48 percent in 2009.51 However, private
registered enterprises offering training is a very narrow
group since the vast majority operate in the informal
economy. And many enterprises fail to implement in-house
training mainly due to production pressure as well as a
lack of training materials and qualified trainers.
The assessment of the Enabling Environment for
Sustainable Enterprises (EESE) Survey in Malawi from
2013 provided information on whether workers are
perceived to have the skills demanded by businesses.
Slightly over one out of three of interviewees (36 percent)
believed that there are minor skills deficits among
workers. Large companies share this opinion more than
other types of firms grouped by size. On the other hand,
about 31 percent of all respondents feel that there are
‘significant’ skills deficits. This is related to that many well-
educated and skilled Malawians go abroad and are
employed out of the country.52 The private sector reports
skills shortages.53
Indeed the Malawi post-primary education system lacks
the ability to absorb enough and produce the skills
needed. Only 1 percent of applicants to technical and
vocational institutes are admitted and Malawi has one of
the lowest numbers of vocational graduates in the sub-
Saharan Africa.
TEVETA conducted also a study of the labour market for
vocational training graduates in 2009:54 Most graduates
were men (80 percent), and almost all had attained
secondary school education (97 percent). Close to one out
of ten (8.9 percent) were unemployed, 85 percent of
graduates were in waged employment, whereas 57
percent preferred self-employment. Of the graduates in
waged employment 63 percent earned 1,000-10,000
kwacha per month (US$7-70), 26 percent earned
10,000-30,000 kwacha (US$70-210) and 10 percent
earner more than 30,000 kwacha.
It has been identified that an effective way to boost
entrepreneurial culture needs to change the education
training curriculum, including entrepreneurial skills in
schools starting from primary education. Among others,
the Government has promoted the Community Technical
College concept during 2016, which is directed towards
to scale up the opportunities for young to
acquire vocational skills to create own employment.
SOCIAL PROTECTION
Social protection is a pillar in the Malawi Growth and
Development Strategy, and the Social Protection Policy
from 2009 has largely been a donor-driven process.55
Poverty and vulnerability are widespread in Malawi.
Unfortunately there is little data and information on the
coverage of benefits, coverage and contributions to
pension schemes. Estimations suggest there has been a
positive growth trend at 13 percent per year on
government expenditure in health (Table 21). It was also
been assessed that the public social protection
expenditure is very low at US$3.7 per person.
Table 21: Public spending on social protection schemes
Indicator Measure %
Total social protection expenditure
% of GDP N/a
Public Health care expenditure
% of GDP N/a
Health social protection coverage
% of total population
N/a
Trends in government expenditure in health
% change per year (2007-2011)
13 %
Source: ILO, Social Protection, Statistics and indicators
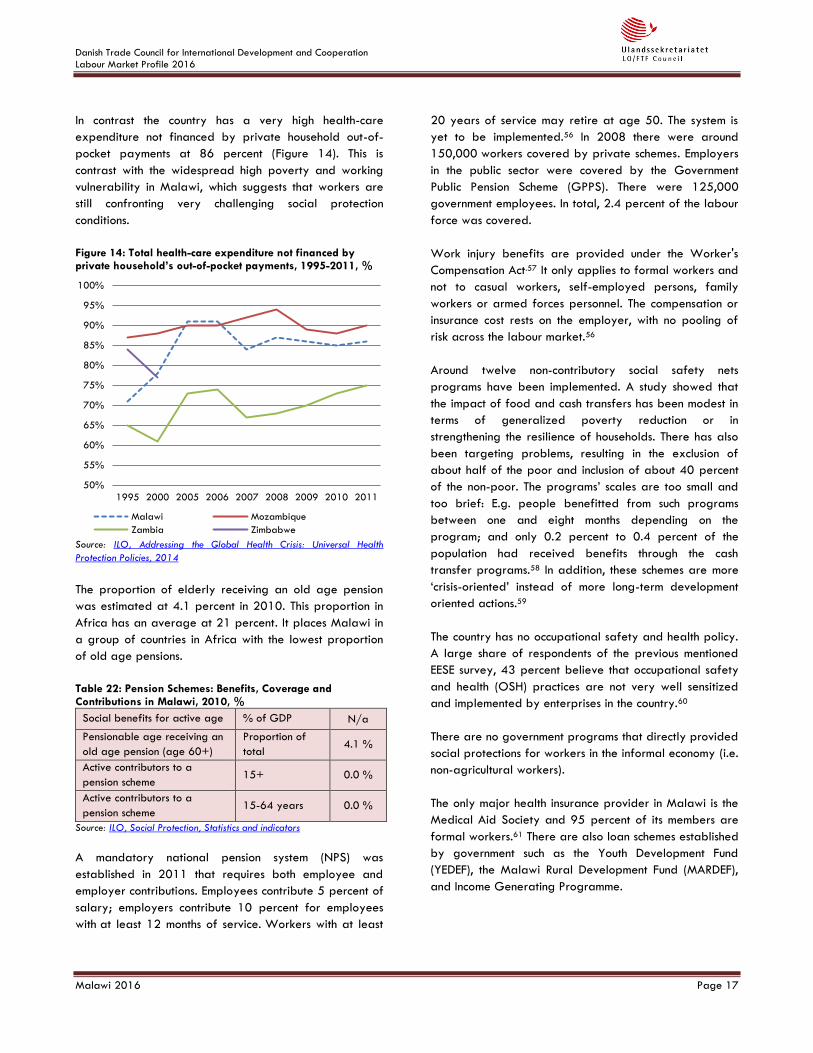
Danish Trade Council for International Development and Cooperation
Labour Market Profile 2016
Malawi 2016 Page 17
In contrast the country has a very high health-care
expenditure not financed by private household out-of-
pocket payments at 86 percent (Figure 14). This is
contrast with the widespread high poverty and working
vulnerability in Malawi, which suggests that workers are
still confronting very challenging social protection
conditions.
Figure 14: Total health-care expenditure not financed by private household’s out-of-pocket payments, 1995-2011, %
Source: ILO, Addressing the Global Health Crisis: Universal Health
Protection Policies, 2014
The proportion of elderly receiving an old age pension
was estimated at 4.1 percent in 2010. This proportion in
Africa has an average at 21 percent. It places Malawi in
a group of countries in Africa with the lowest proportion
of old age pensions.
Table 22: Pension Schemes: Benefits, Coverage and Contributions in Malawi, 2010, %
Social benefits for active age % of GDP N/a
Pensionable age receiving an
old age pension (age 60+)
Proportion of
total 4.1 %
Active contributors to a
pension scheme 15+ 0.0 %
Active contributors to a
pension scheme 15-64 years 0.0 %
Source: ILO, Social Protection, Statistics and indicators
A mandatory national pension system (NPS) was
established in 2011 that requires both employee and
employer contributions. Employees contribute 5 percent of
salary; employers contribute 10 percent for employees
with at least 12 months of service. Workers with at least
20 years of service may retire at age 50. The system is
yet to be implemented.56 In 2008 there were around
150,000 workers covered by private schemes. Employers
in the public sector were covered by the Government
Public Pension Scheme (GPPS). There were 125,000
government employees. In total, 2.4 percent of the labour
force was covered.
Work injury benefits are provided under the Worker's
Compensation Act.57 It only applies to formal workers and
not to casual workers, self-employed persons, family
workers or armed forces personnel. The compensation or
insurance cost rests on the employer, with no pooling of
risk across the labour market.56
Around twelve non-contributory social safety nets
programs have been implemented. A study showed that
the impact of food and cash transfers has been modest in
terms of generalized poverty reduction or in
strengthening the resilience of households. There has also
been targeting problems, resulting in the exclusion of
about half of the poor and inclusion of about 40 percent
of the non-poor. The programs’ scales are too small and
too brief: E.g. people benefitted from such programs
between one and eight months depending on the
program; and only 0.2 percent to 0.4 percent of the
population had received benefits through the cash
transfer programs.58 In addition, these schemes are more
‘crisis-oriented’ instead of more long-term development
oriented actions.59
The country has no occupational safety and health policy.
A large share of respondents of the previous mentioned
EESE survey, 43 percent believe that occupational safety
and health (OSH) practices are not very well sensitized
and implemented by enterprises in the country.60
There are no government programs that directly provided
social protections for workers in the informal economy (i.e.
non-agricultural workers).
The only major health insurance provider in Malawi is the
Medical Aid Society and 95 percent of its members are
formal workers.61 There are also loan schemes established
by government such as the Youth Development Fund
(YEDEF), the Malawi Rural Development Fund (MARDEF),
and Income Generating Programme.
50%
55%
60%
65%
70%
75%
80%
85%
90%
95%
100%
1995 2000 2005 2006 2007 2008 2009 2010 2011
Malawi Mozambique
Zambia Zimbabwe

Danish Trade Council for International Development and Cooperation
Labour Market Profile 2016
Malawi 2016 Page 18
Despite the challenges there has been noteworthy
progress in reducing the spread of HIV/AIDS: HIV
prevalence has decreased from 12 percent to 10.6
percent, and mortality as a share of overall deaths
declined from 11 percent to 3 percent, according to the
2010 Malawi Demographic and Health Survey. However,
there are rapidly growing problems of HIV/AIDS, e.g. the
many vulnerable members of the Malawian society,
young people who have lost one or both parents are
among the most challenged groups.
GENERAL ECONOMIC PERFORMANCE
Malawi remains a low income country and dependent on
substantial inflows of foreign aid assistance. The economy
was affected by a large-scale theft of public funds
uncovered in 2013, which is known as the “cash-gate”.
Donors suspended all budget support and the government
started to print money to cover the deficit. This was
together with the harvest season 2014/15 that was hit by
floods and drought, and affected crop production.
The country has experienced a volatile economic growth
during the last decade. The growth was estimated at 5.7
percent in 2015 (Table 23). As previously demonstrated,
the economic is mainly driven by the agricultural sector
and the wholesale & retail trade sectors.
Table 23: General Economic Performance Key Facts
GDP GDP real
growth
Doing Business 2016*
Human Development
Index**
Gini Index*** (2010)
4.3 billion US$
5.7 % 141 of 189
countries 173 of 188
countries
46.1
69 of 145 countries
* A high ranking on the Ease of Doing Business Index means the
regulatory environment is more conducive to the start-up and
operation of a local firm.62
** The Human Development Index (HDI) measures the average of a
long and healthy life, access to knowledge, and a decent standard of
living.
*** A Gini coefficient of 1 (or 100 percent) expresses maximal
inequality among values. This Gini Index ranks the first country with
the highest inequality while the number 145 has the highest equality.
Source: CIA, The World Factbook, Nepal, World Bank, World Development Indicators; World Bank & IFC, Ease of Doing Business 2015/2016 in Malawi; and UNDP, Human Development Index trends
Malawi’s economy continued on the path to recovery in
the aftermath of a deep contraction in 2012. The real
GDP growth per capita even plummeted to -1.2 percent.
This was related to a general shortage of foreign
exchange, which affected the ability to pay for imports,
and fuel shortages that hinder transportation and
productivity. The growth returned positive in 2013 and
stays higher than the sub-Saharan Africa average since
ten (Figure 15).
Figure 15: GDP growth per capita, 2005-2014
Source: World Bank, World Development Indicators
The country is still far behind the sub-Saharan Africa
average GDP per capita in terms of the Purchasing
Power Parity (PPP) (Figure 16). Other estimations suggest
that Malawi is placed rock bottom, i.e. ranking as 223 out
of 229 countries in terms of the GDP per capita (PPP).63
Equally important the evolution of the Gini Index signals
that the inequality in terms of the distribution of income
has increased significantly in Malawi.
Figure 16: GDP per capita (PPP) growth and Gini Index
Source: World Bank, World Development Indicators
-2
-1
0
1
2
3
4
5
6
7
2005 2006 2007 2008 2009 2010 2011 2012 2013 2014
Malawi Sub-Saharan Africa
39,9
46,1
36
37
38
39
40
41
42
43
44
45
46
47
0
500
1000
1500
2000
2500
3000
3500
4000
20
00
20
01
20
02
20
03
20
04
20
05
20
06
20
07
20
08
20
09
20
10
20
11
20
12
20
13
20
14
Gini Index - Malawi Malawi
Sub-Saharan Africa

Danish Trade Council for International Development and Cooperation
Labour Market Profile 2016
Malawi 2016 Page 19
Data also shown that working poor remains very high and
has basically stayed flat during the 2000s: The evolution
of the extreme working poor (>US$1.9 per day) has
stayed at around 70 percent while the moderate working
poor (US$1.9-3.1 per day) also stayed with no changes
at around 19 percent. There were some gender gaps:
More women (72 percent) than men (65 percent) are
extreme working poor, but these changes among the
moderate working poor where less among women (18
percent) than men (20 percent). Not to mention the
country’s working poor rates are much higher than the
sub-Saharan Africa averages (Figure 17).
Figure 17: Working poor, 1998-2010, %
Note: ‘Working poor’ is the proportion of persons living with their
families below the poverty line in line with the full distribution of
employment across economic classes.
Source: ILO, Key Indicators of the Labour Market (KILM), 9th Edition
Consistent with the high presence of working poor,
Malawi has a very limited middle-class. This group has
not experienced an evolution. Estimations point towards a
lower middle-class (US$3.1-5 per day) at 8 percent and
a higher middle-class (US$5-13 per day) at 3 percent.
This remains far below the sub-Saharan Africa averages
(Figure 18).
Figure 18: Middle-class trends, 1998-2010, %
Source: ILO, Key Indicators of the Labour Market (KILM), 9th Edition
The inflation in consuming prices has continued to be quite
high in Malawi in recent years (Figure 19). The Basic
Needs Survey Report from August 2016 showed that in
urban areas the cost of living has gone up as compared
to a decline of nine percent in the same period last year.
As already outlined, many workers are receiving less than
44,000 kwacha per month (US$62), which is lower than
the basic food basket, which is at K71,277 (US$101) as
of October 2015. Depreciation of the kwacha has left
many households panicking and looking for ways to
source extra income so that they can maintain their
consumption patterns.
Figure 19: Inflation trend, 2005-2015, %
Source: World Bank, World Development Indicators
30%
40%
50%
60%
70%
80%
90%
100%
1998 2004 2010
Malawi - US$1.9 per day Malawi - US$3.1 per day
SSA- US$1.9 per day SSA - US$3.1 per day
0%
2%
4%
6%
8%
10%
12%
14%
16%
18%
1998 2004 2010
Middle-class US$3.1-US$5 (Malawi) Middle-class US$5-US$13 (Malawi)
Middle-class US$3.1-US$ (SSA) Middle-class US$5-US$13 (SSA)
0
5
10
15
20
25
30
2006 2007 2008 2009 2010 2011 2012 2013 2014 2015
Malawi Sub-Saharan Africa

Danish Trade Council for International Development and Cooperation
Labour Market Profile 2016
Malawi 2016 Page 20
The capital formation has increased to a higher rate than
the sub-Saharan Africa average in the period from 2006
to 2010, but afterwards the rate plummeted (Figure 20).
This is related to the mentioned economic downturn and
high inflation.
Figure 20: Gross Fixed Capital Formation, 2006-2015, % of GDP
Source: World Bank, World Development Indicators
The degree of entrepreneurial culture is quite challenging
in Malawi. As demonstrated, it is characterized by a
large majority of micro and small enterprises that operate
in the informal economy. This prevalent culture often does
not recognize the value of entrepreneurial activity. The
government has implemented reforms to improve the
business climate, but the pace has been slow. The delay in
enacting business laws has contributed to the deterioration
in the business entrepreneurial environment. The key
constraints to private sector development and
competitiveness include: red tape, poor infrastructure,
limited access to finance and a weak skills base.64
Recently the government reinvigorated regulatory
reforms.
The Doing Business ranked Malawi as 141 out of 189
countries in 2015/16 - an improving step-up of 3 levels
from the previous period 2014/15. This was mainly
related to some improvements of getting electricity. This
indicator’s ranking remains very low, though; i.e. 175 out
of 189 countries. Dealing with construction permits has the
highest ranking 65 followed by registering property at
93. In contrast, apart from getting electricity, Malawi
scores low on resolving insolvency at 164 and starting a
business at 161 (Table 24).
Table 24: Malawi’s Ease of Doing Business
Topics 2016 2015 Change
Starting a Business 161 158 -3
Dealing with Construction Permits 65 64 -1
Getting Electricity 175 185 10
Registering Property 93 92 -1
Getting Credit 152 150 -2
Protecting Miniority Investors 115 114 -1
Paying Taxes 102 100 -2
Trading Across Borders 123 123 No change
Enforcing Contracts 147 145 -2
Resolving Insolvency 164 165 1
Note: Doing Business 2016 indicators are ranking from 1 (top) to 189
(bottom) among other countries. The rankings tell much about the
business environment, but do not measure all aspects of the business
surroundings that matter to firms and investors that affect the
competitiveness of the economy. Still, a high ranking does mean that the
government has created a regulatory environment conducive to
operating a business.
Note: This Index has been controversial due to flawed data, especially in
terms of labour market flexibility and undervalued paying taxes.
However, the table can still be used as indicative measurement with
reservations.65
Source: World Bank & IFC, Ease of Doing Business 2015/2016 in Malawi
Overall the governance environment in Malawi has been
quite negative in recent years, especially in terms of
government effectiveness, regulatory quality, control of
corruption, and rule of law. The country has been
struggling with political stability, but there has been
registered some small improvements (Table 25).
The Public Order Management Act that was signed into
law in October 2013 has been criticized in the media as
seriously flawed with restrictions of freedoms of
expression and peaceful assembly; and further
deteriorates an already shrinking space for civil society
and human rights defenders in the country.
0
5
10
15
20
25
2006 2007 2008 2009 2010 2011 2012 2013 2014 2015
Malawi Sub-Saharan Africa
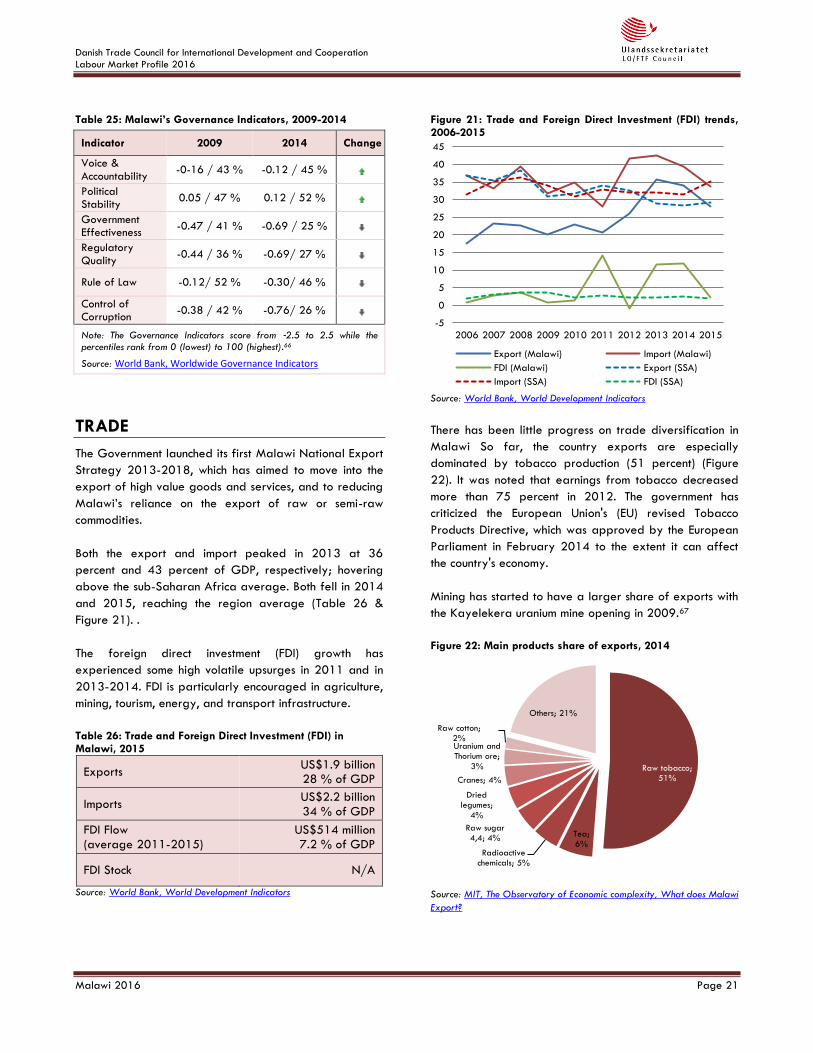
Danish Trade Council for International Development and Cooperation
Labour Market Profile 2016
Malawi 2016 Page 21
Table 25: Malawi’s Governance Indicators, 2009-2014
Indicator 2009 2014 Change
Voice & Accountability
-0-16 / 43 % -0.12 / 45 %
Political Stability
0.05 / 47 % 0.12 / 52 %
Government Effectiveness
-0.47 / 41 % -0.69 / 25 %
Regulatory Quality
-0.44 / 36 % -0.69/ 27 %
Rule of Law -0.12/ 52 % -0.30/ 46 %
Control of Corruption
-0.38 / 42 % -0.76/ 26 %
Note: The Governance Indicators score from ‐2.5 to 2.5 while the percentiles rank from 0 (lowest) to 100 (highest).66
Source: World Bank, Worldwide Governance Indicators
TRADE
The Government launched its first Malawi National Export
Strategy 2013-2018, which has aimed to move into the
export of high value goods and services, and to reducing
Malawi’s reliance on the export of raw or semi-raw
commodities.
Both the export and import peaked in 2013 at 36
percent and 43 percent of GDP, respectively; hovering
above the sub-Saharan Africa average. Both fell in 2014
and 2015, reaching the region average (Table 26 &
Figure 21). .
The foreign direct investment (FDI) growth has
experienced some high volatile upsurges in 2011 and in
2013-2014. FDI is particularly encouraged in agriculture,
mining, tourism, energy, and transport infrastructure.
Table 26: Trade and Foreign Direct Investment (FDI) in Malawi, 2015
Exports US$1.9 billion 28 % of GDP
Imports US$2.2 billion
34 % of GDP
FDI Flow (average 2011-2015)
US$514 million 7.2 % of GDP
FDI Stock N/A
Source: World Bank, World Development Indicators
Figure 21: Trade and Foreign Direct Investment (FDI) trends, 2006-2015
Source: World Bank, World Development Indicators
There has been little progress on trade diversification in
Malawi So far, the country exports are especially
dominated by tobacco production (51 percent) (Figure
22). It was noted that earnings from tobacco decreased
more than 75 percent in 2012. The government has
criticized the European Union's (EU) revised Tobacco
Products Directive, which was approved by the European
Parliament in February 2014 to the extent it can affect
the country's economy.
Mining has started to have a larger share of exports with
the Kayelekera uranium mine opening in 2009.67
Figure 22: Main products share of exports, 2014
Source: MIT, The Observatory of Economic complexity, What does Malawi
Export?
-5
0
5
10
15
20
25
30
35
40
45
2006 2007 2008 2009 2010 2011 2012 2013 2014 2015
Export (Malawi) Import (Malawi)
FDI (Malawi) Export (SSA)
Import (SSA) FDI (SSA)
Raw tobacco; 51%
Tea; 6%
Radioactive chemicals; 5%
Raw sugar 4,4; 4%
Dried legumes;
4%
Cranes; 4%
Uranium and Thorium ore;
3%
Raw cotton; 2%
Others; 21%

Danish Trade Council for International Development and Cooperation
Labour Market Profile 2016
Malawi 2016 Page 22
The European Union (EU 28), Zimbabwe and India are the
main export markets for Malawi (Figure 23).
Figure 23: Main export markets, 2015
Source: European Commission, DG TRADE, Bilateral Relations,
Statistics
Trade Agreements
Malawi is in the 2000 Cotonou Agreement on
development cooperation between EU and African,
Caribbean and Pacific (ACP) countries, which reaffirms
commitment to ILO’s Fundamental Conventions and
includes provisions on cooperation on various labour and
social issues.68
Since 2000, Malawi has benefitted from the United
States’ African Growth and Opportunity Act (AGOA),
which is a Generalised System of Preferences. It allows
duty and quota free access for some products. Malawi
can be removed from AGOA, if the United States deems
that Malawi among other human rights issues do not seek
to uphold the ILO Core Labour Standards and have
acceptable minimum wages, hours of work and
occupational safety and health.69
In a bid to increase market access for its products Malawi
has also signed bilateral trade agreements with South
Africa, Zimbabwe, Botswana, Mozambique, and China.70
Among others, there has been a higher recognizing of
informal trade. For example, Zimbabwe has signed a
Memorandum of Understanding with the government of
Malawi to facilitate informal trade, specifically between
small and medium-sized enterprises.
Export Processing Zone (EPZs)
All companies engaged exclusively in manufacture for
export may apply for EPZ status. As of December 2012,
16 companies were operating under the EPZ scheme.
Almost all these companies are foreign owned.
A Manufacturing under Bond (MUB) scheme offers slightly
less attractive incentives to companies that export some of
their products, but not all. Most investors prefer to
operate under EPZ arrangement.71
According to a 2007 study commissioned by the
government,72 the EPZ has created less FDI, employment
and diversification of exports than expected. Anti-union
harassment is common, and union organizers have little
access to workers in the EPZ.73
There are no special laws or exemptions from regular
labour laws in EPZs, but the Parliament passed the Export
Processing Zones Amendment Bill in June 2013 to
restructure the regulations of the EPZs. As a result,
investors in EPZs no longer enjoy a zero corporate tax
rate. As an impact the number of factories that were
designated as EPZs declined afterward from 30 to 10.74
This could diverge from the above mentioned 16 EPZ
companies due to accessed data, but still the trend can be
interpreted as a declining presence of EPZs in Malawi.
EU 28; 36%
Zimbabwe; 12% India; 7%
South Africa; 6%
USA; 6%
Russia; 6%
China; 3%
Others; 24%

Danish Trade Council for International Development and Cooperation
Labour Market Profile 2016
Malawi 2016 Page 23
APPENDIX: ADDITIONAL DATA
Table 27: Ratified ILO Conventions in Malawi
Subject and/or right Convention Ratification date
Fundamental Conventions
Freedom of association and collective bargaining
C087 - Freedom of Association and Protection of the Right to Organise, 1948 1999
C098 - Right to Organise and Collective Bargaining Convention, 1949 1965
Elimination of all forms of forced labour
C029 - Forced Labour Convention, 1930 1999
C105 - Abolition of Forced Labour Convention, 1957 1999
Effective abolition of child labour
C138 - Minimum Age Convention, 1973 1999
C182 - Worst Forms of Child Labour Convention, 1999 1999
Elimination of discrimination in employment
C100 - Equal Remuneration Convention, 1951 1965
C111 - Discrimination (Employment and Occupation) Convention, 1958 1965
Governance Conventions
Labour inspection C081 - Labour Inspection Convention, 1947 1965
C129 - Labour Inspection (Agriculture) Convention, 1969 1971
Employment policy C122 - Employment Policy Convention, 1964 Not ratified
Tripartism C144 - Tripartite Consultation (International Labour Standards) Convention, 1976
1986
Up-to-date Conventions
Migrant Workers C097 - Migration for Employment Convention (Revised), 1949 1965
Employment Policy C159 - Vocational Rehabilitation and Employment (Disabled Persons), 1983 1986
Specific categories of workers
C149 - Nursing Personnel Convention, 1977 1986
Fundamental Conventions are the eight most important ILO conventions that cover four fundamental principles and rights at work. Equivalent to basic human rights at work. Governance Conventions are four conventions that the ILO has designated as important to building national institutions and capacities that serve to promote employment. In other words, conventions that promotes a well-regulated and well-functioning labour market. In addition, there are 71 conventions, which ILO considers “up-to-date" and actively promotes. Source: ILO, NORMLEX, Country Profiles

Danish Trade Council for International Development and Cooperation
Labour Market Profile 2016
Malawi 2016 Page 24
Table 28: Status of trade unions in Malawi
Membership, women members, dues, Collective Bargaining Agreements (CBAs), and Occupational Safety and Health (OSH) committees
Trade Union
Affiliation To national trade union
centre
Total Members
Women members
Dues (share of salary)
No. of CBAs
No. of OSH committees
at workplaces
Building Construction Civil Engineering Allied Workers Union
MCTU 6,401 - 100
MK/month 2 2
Civil Servants Trade Union MCTU 15,000 - 1 % 4 -
Commercial Industrial Allied Workers Union
MCTU 9,212 1,960 0.03 % 3 5
Escom Staff Union MCTU 2,400 - 1 % 1 1
Hotels Food Catering Services Union MCTU 6,067 - 100
MK/month 12 7
Malawi Housing Corporation Workers Union
MCTU 350 - 1 % 1 1
Communications Workers Union of Malawi
MCTU 2,741 719 1 % 7 8
Plantations Agriculture Allied Workers Union
MCTU 3,148 4,476 1 % 2 10
Private Schools Employees Union of Malawi
MCTU 3,489 988 1 % 1 -
Railways Workers Union of Malawi MCTU 360 17 1 % 2 10
Sugar Plantation Allied Workers Union of Malawi
MCTU 8,598 450 1 % 1 5
Teachers Union of Malawi MCTU 43,000 15,000 100
MK/Month 2 -
Textiles Garments Leather Security Services Union
MCTU 8,284 623 1 % 22 2
Tobacco Tenants Allied Workers Union of Malawi
MCTU 5,993 2,856 300 MK/Year 1 9
Transport General Workers Union MCTU 5,100 322 100
MK/Month 18 7
University Workers Union MCTU 1,085 - 1,000
MK/Year 1 5
Water Employees Union of Malawi MCTU 2,700 470 1 % 4 6
National Organisation of Nurses and Midwives
MCTU 4,035 1,633 - 2 -
Malawi Union for Informal Sector (MUFIS) MCTU 2,514 - 500 MK /
year - -
Shipping Customs Clearing Allied Trade Union
MCTU 180 10 1 % - -
Malawi Municipal Workers Union MCTU 2,240 448 - - -
Quarries Mines and Informal Workers Union
COMATU 1,300 - - - -
Note: There lack information on affiliated trade unions to COMATU and not affiliated trade unions from the informal economy to the federations. Source: MCTU’s research department’s data collection 2016.

Danish Trade Council for International Development and Cooperation
Labour Market Profile 2016
Malawi 2016 Page 25
REFERENCES
1 U.S. Department of State, Annual Country Reports on Human Rights Practices, 2015 2 Equal Times, News at Work, Special Report: Informal Economy, Recommendation 204: Ending Informality, July 4, 2016 3 MyWage.com, Trade Unions, Malawi 4 ILO, Decent Work Country Programme, Malawi (2011-16) 5 MyWage.com, The informal sector 6 U.S. Department of State, Annual Country Reports on Human Rights Practices, 2014 7 MCTU, Decent Work Position Paper for MCTU, 2010 8 War on Want et al., Forces for Change: Informal economy organisations in Africa, 2007 9 MyWage.com, Trade Unions, Malawi 10 http://www.ecammw.com 11 Capital FM, Business Executives in Malawi To Be Trained On
Matters Of Fraud, June 1, 2016 12 U.S. Department of State, Annual Country Reports on Human Rights Practices, 2015 13 U.S. Department of State, Annual Country Reports on Human Rights Practices, 2015 14 U.S. Department of State, Annual Country Reports on Human Rights Practices, 2014 15 National Construction Industry Council, NCIC membership 16 CONSTRUCION REVIEW, National Construction Industry Council of Malawi (NCIC): greater share of jobs for locals. August 8, 2015 17 LO/FTF Council 18 Republic of Malawi (Constitution) Act, 1994 (No. 20 of 1994) 19 ILO, NATLEX, Occupational Safety, Health and Welfare Act, 1997 (No. 21 of 1997) 20 U.S. Department of State, Annual Country Reports on Human Rights Practices, 2013 21 ILO, NATLEX, Malawi 22 ITUC, Survey of violations of trade union rights, Malawi 23 ILO, NATLEX, Country Profile, Ratifications for Malawi 24 ILO, NORMLEX, Observations made by employers' and workers' organizations of Malawi 25 ITUC, Survey of violation of trade union rights, Malawi 26 U.S. Department of State, Annual Country Reports on Human Rights Practices, 2014 27 Equal Times, IMF Reforms Spark Malawi Consumer Backlash, 16 January 2013 28 ILO, Labour Administration and Labour Inspection, Malawi 29 U.S. Department of State, Annual Country Reports on Human Rights Practices, 2014 30 ILO, Key Indicators of the Labour Market Database 31 National Statistical Office, Labour Force Survey 2013, 2014 32 ILO, Decent Work Country Programme, Malawi (2011-16) 33 Ministry of Labour & ILO, Employment Diagnostic - Analysis on Malawi, June 2010 34 National Statistical Office of Malawi, The 2010 Malawi Demographic and Health Survey (2010 MDHS) 35 The Commissioner of Statistics, Integrated Household Survey, 2010-2011; Household Socio-Economic Characteristics Report, 2012 36 World Bank, Migration and Remittances Factbook 2011 37 ILO, INTEGRATION, Dejardin, “Gender (in)equality, globalization and governance”, Working Paper No. 92, 2009
38 National Statistical Office, Malawi Labour Force Survey 2013, Key Findings Report, April 2014 39 TEVETA, Malawi Labour Market Survey - 2009 40 U.S. Department of State, Annual Country Reports on Human Rights Practices, 2015 41 MCTU, The role of Trade Unions in Eliminating Child Labour in Agriculture , 2012 42 National Statistical Office, Malawi Labour Force Survey 2013, Key Findings Report, April 2014 43 Ministry of Gender, Children and Community Development and the National Statistical Office, Gender and Development Index 2011, June 2012 44 WageIndicator.org, An Overview of Women’s Work and Employment in Malawi, decisions for Life MDG3 Project, Country Report No. 6, 2009 45 ILO, Key Indicators of the Labour Market Database 46 The National Youth Council of Malawi, Youth NGOs Monitoring Report 2010 47 Ministry of Finance, 2014 Annual Economic Report 48 AfDB, Education and Employment in Malawi, Working Paper No. 110, 2010 49 ILO, Employment Sector: Employment Report No. 20, The enabling environment for sustainable enterprises in Malawi, 2013 50 Malawi Enhancing TEVET Outcomes (ETO) Project 51 World Bank, DataBank 52 ILO, Employment Sector: Employment Report No. 20, The enabling environment for sustainable enterprises in Malawi, 2013 53 AfDB, African Economic Outlook, Malawi Country Note, 2012 54 TEVTA, Malawi Labour Market Survey - 2009 55 ILO, Employment Sector: Employment Report No. 20, The enabling environment for sustainable enterprises in Malawi, 2013 56 ISSA, Social Security Country Profiles, Malawi 57 ILO, NATLEX, Worker's Compensation Act, 2000 (No. 7 of 2000) 58 National Statistical Office of Malawi, Integrated Household Survey 2010-11 (IHS3), Household Socioeconomic Characteristics Report, 2012 59 UNDP, Malawi Case Study: Social Protection Measures and Labour Markets, November 2012 60 ILO, The enabling environment for sustainable enterprises in
Malawi, Employment Report No. 20, 2013 61 ILO, Decent Work Country Programme, Malawi (2011-16) 62 World Bank & IFC, Doing Business, Methodology 63 CIA, The World Factbook, Malawi 64 AfDB, OECD & UNDP, African Economic Outlook, Malawi, 2014 65 ITUC, WORLD BANK’S DOING BUSINESS MAKES UNSUBSTANTIATED ASSERTIONS, REWARDS COUNTRIES THAT HAVE NOT RATIFIED ILO CONVENTIONS, SEPTEMBER 10, 2008 & ILO, DEREGULATION LABOUR MARKETS: HOW ROBUST IS THE ANALYSIS OF RECENT IMF WORKING PAPERS?, CONDITIONS OF WORK AND EMPLOYMENT SERIES NO. 47, 2014 66 World Bank, The Worldwide Governance Indicators, Methodology and Analytical Issues, Policy Research Working Paper 5430, 2010 67 The World Bank, Countries, Malawi Overview
Danish Trade Council for International Development and Cooperation
Labour Market Profile 2016
Malawi 2016 Page 26
68 Ebert & Posthuma, ILO, IILS, 2011, Labour provisions in trade agreements: current trends and provisions 69 http://www.agoa.gov 70 MITC, Export Guide, Bilateral 71 U.S. Department of State, 2013 Investment Climate Statement
- Malawi 72 Ministry of Industry, Trade and Private Sector Development, Nkhoma, “Export Processing Zones: Is it a Regime Worth the Sacrifice? – The Case of Malawi” 2007 73 ITUC, Internationally Recognised Core Labour Standards in Malawi, Report for the WTO General Council review of the trade policies of Malawi, 2010 74 TKN & IISD, Assessing Investment Incentives in Malawi, Policy Brief, 2012