Embed Size (px)
Citation preview
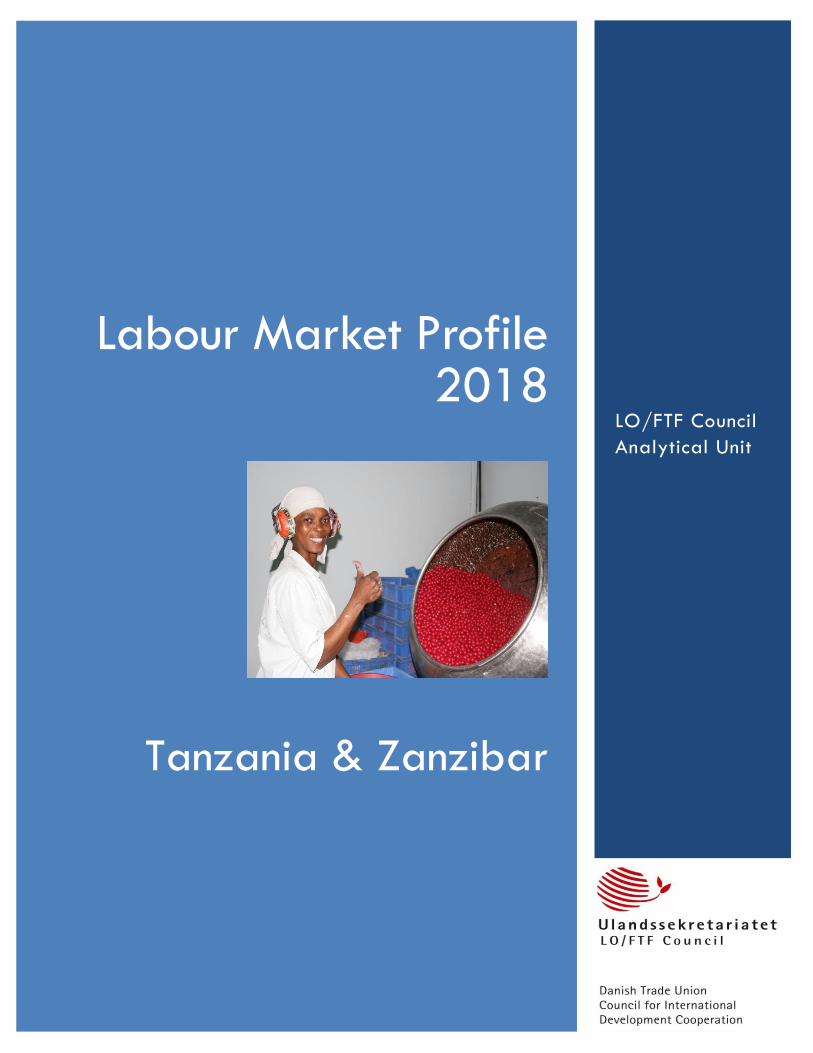
Labour Market Profile 2018
Tanzania & Zanzibar
LO/FTF Council
Analytical Unit
Danish Trade Union Council for International Development Cooperation Tanzania and Zanzibar Labour Market Profile 2018
Page i
PREFACE The LO/FTF Council is the Danish trade union council for
international development co-operation. It was
established by the two largest Danish confederations,
the Danish Federation of Trade Unions (Danish acronym:
LO) and the Danish Confederation of Professionals
(Danish acronym: FTF). The organisation’s activities are
related to support democracy and protect workers
rights via development programs of the trade union
movements in Africa, Asia, Latin Amerika, and the
Middle East.
Labour Market Profile (LMP) provides a comprehensive
overview of a country’s labour market situation. The aim
of publishing this report is to create awareness and
understanding of the labour market’s development,
challenges and structural evolution in the countries
where we implement development activities.
LMP is divided in several thematic sections: trade unions,
employers’ organizations, tripartite fora and institutions,
national labour legislation, violations of trade union
rights, wages and working conditions, status of the
workforce, education, social protection, and economy.
LMP’s format evolved from a presentation of statistical
data from 2013 to a more analytical instrument today.
Quality of data has been improved through a data-
collection tool which is implemented in collaboration
with the LO/FTF Council Sub-Regional Office and the
national partner. This has made this report unique in the
areas where unionism has a central role on the labour
market, which include information of the trade union
membership growth and trade union density trend,
development of social dialogue and collective
bargaining, status of central bi-/tri-partite mechanisms,
impact of policy and legislation labour market reforms
as well as the standing of the International Labour
Organization (ILO) standards of informal economy
workers.
Key sources of data-collection and information
gathering for the LMP are particularly:
As part of development program monitoring,
national partners provide a yearly narrative
report of the labour market’s challenges and in
collaborating with the LO/FTF Council Sub-
Regional Offices updating a data-collection tool.
National statistical institutions and international
databanks are used to general data-collection,
which include the ILOSTAT and NATLEX, World
Bank Open Data, ITUC Survey of violations of
Trade Union Rights, the U.S. Department of State
as well as other labour market related global
indexes.
Academia and media sources (e.g. LabourStart,
national news, etc.) are also used in the general
research on labour market issues.
This report was published in August 2018.
A wide range of labour market profiles are available
on our website:
http://www.ulandssekretariatet.dk/content/landeanaly
ser).
ACKNOWLEDGMENT This Labour Market Profile was prepared by the
LO/FTF Council Analytical Unit in Copenhagen. It could
not compile information and data collection on key
labour market indicators without the support from the
LO/FTF Council Sub-Region Office in Tanzania along
with the Trade Unions Congress of Tanzania (TUCTA)
and the Zanzibar Trade Union Congress (ZATUC).
The front page picture was from the Company 2000
Industries. It was photographed by Dorthe Friis
Pedersen.
Should you have questions about the profiles, you can
contact Mr. Kasper Andersen ([email protected]), Manager
of the Analytical Unit; and Mr. Kristian Lybæk,
International Advisor from the LO/FTF Council Sub-
Region Office in Tanzania ([email protected]).
Address:
Ulandssekretariatet
Islands Brygge 32D
DK-2300 Copenhagen S
Denmark
Telefon: +45 33 73 74 40
http://www.ulandssekretariatet.dk/
Danish Trade Union Council for International Development Cooperation Tanzania and Zanzibar Labour Market Profile 2018
Page ii
EXECUTIVE SUMMARY
he United Republic of Tanzania (Tanzania mainland
and the semi-autonomous Zanzibar) has
implemented a liberalized market economy transition
since the 2000s with support from a solid economic
growth. The country also benefitted from political and
social stability. Labour productivity is slightly
superseding the tempo than the Eastern Africa average.
This is driven by higher capital formation and foreign
direct investments.
There was some political downturn and an upsurge of
systematic violations of trade union rights in recent
years, though. The economy’s development is not
broad-based but driven by capital-intensive sectors
concentrated in the large urban areas. Although the
number of extremely working poor fell fast, yet 67% of
working poor are still living below US$3.1 per day;
and a middle-class is just slowly evolving. The inflation
in consumer prices gnarled the workers’ income
purchasing power.
Several legal reforms of the labour market were
approved with some improvements in recent years.
However, there are some flaws on the labour
legislations of the right to organize, right to collective
bargaining and right to strike in relation to the
international standards. It is still not easy of doing
business. A point often overlooked is that the labour
regulations are only reaching a relatively small formal
sector in practice, which includes the minimum wages. In
reality, a large majority (85%) of the total employment
is enclosed by a growing informal economy due to
insufficient job creation in the formal sector.
The extent of social dialogue on the labour market is
low with confrontational labour relations and
weaknesses of several tripartite institutions. On the
positive side, trade unions and the employers’
organization recently participated in some joint
activities and bipartite meetings. Coverage of collective
bargaining agreements among employees was on a
rise until a drop in recent years due to several structural
challenges among the trade union movement.
Some of the key shifts on the labour market in the last
decade were that the agricultural employment share
declined while it grew in the service sector. The industry
sector basically stayed on a flat growth. This is mirrored
by the narrow and stalled employees segment whereas
some changes in vulnerable employment, i.e. many own-
account workers (self-employment) move towards
unpaid contributing family workers. An internal rural-
urban migration is happening in the country with a
gradually swelling urbanization. This is interlinked to an
increasing enrolment in higher levels of schooling just as
a higher influx of job seekers in urban areas.
The education system in Tanzania is confronting a
pressure on all levels because of a fast growing young
population. The lower the level of education, the higher
the proportion of youth enters into vulnerable
employment in the informal economy. They often
confront an unstructured entrepreneur environment as
well as a lack of technical and managerial skill. Youth
unemployment is estimated at 9.4% and it is mainly in
urban areas. Insufficient formal job creating cause
restless, frustration and social insecurity among the
youth.
Child labour rate at 29% is displaying a
dysfunctionality of the education system and the labour
market. Gender inequality remains present in the
country accompanied by patriarchal social structures;
and imitated in deep earnings gender gaps.
Reforms were launched to improve the social protection
in the country. Although membership in social protection
schemes increased, the coverage remained low. The
narrow group of employees coupled with frail social
dialogue milieu keep the pension schemes on a very
slender coverage at 3.3% of the workforce.
Data from Tanzania mainland reveal that unionizing is
more prevalent in the public sector than in the private
sector; the latter with a large majority in micro, small
and some medium enterprises. The trade union
membership growth experienced a downturn in recent
years as a negative impact of a shrinking public sector
along with the trade union federation’s internal issues.
Not to mention, the trade union movement has not yet
prioritized an increase of members from affiliated
organized workers from the informal economy. In
Zanzibar, the number of trade union members also
dropped due to internal unionizing reforms and
cleaning up on the paying contributions register.
Tanzania mainland’s trade union density to employees
was estimated at 17% in 2017; it was higher in
Zanzibar at 28%.
T
Danish Trade Union Council for International Development Cooperation Tanzania and Zanzibar Labour Market Profile 2018
Page iii
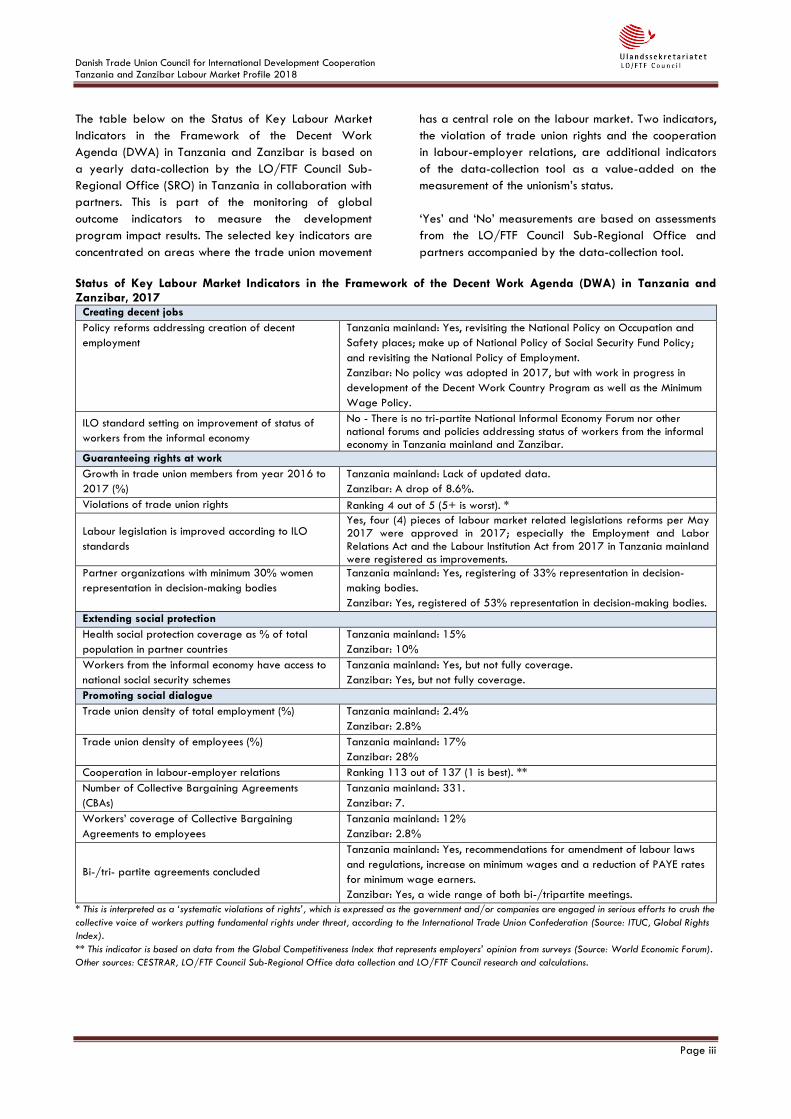
The table below on the Status of Key Labour Market
Indicators in the Framework of the Decent Work
Agenda (DWA) in Tanzania and Zanzibar is based on
a yearly data-collection by the LO/FTF Council Sub-
Regional Office (SRO) in Tanzania in collaboration with
partners. This is part of the monitoring of global
outcome indicators to measure the development
program impact results. The selected key indicators are
concentrated on areas where the trade union movement
has a central role on the labour market. Two indicators,
the violation of trade union rights and the cooperation
in labour-employer relations, are additional indicators
of the data-collection tool as a value-added on the
measurement of the unionism’s status.
‘Yes’ and ‘No’ measurements are based on assessments
from the LO/FTF Council Sub-Regional Office and
partners accompanied by the data-collection tool.
Status of Key Labour Market Indicators in the Framework of the Decent Work Agenda (DWA) in Tanzania and Zanzibar, 2017
Creating decent jobs
Policy reforms addressing creation of decent
employment
Tanzania mainland: Yes, revisiting the National Policy on Occupation and
Safety places; make up of National Policy of Social Security Fund Policy;
and revisiting the National Policy of Employment.
Zanzibar: No policy was adopted in 2017, but with work in progress in
development of the Decent Work Country Program as well as the Minimum
Wage Policy.
ILO standard setting on improvement of status of
workers from the informal economy
No - There is no tri-partite National Informal Economy Forum nor other national forums and policies addressing status of workers from the informal economy in Tanzania mainland and Zanzibar.
Guaranteeing rights at work
Growth in trade union members from year 2016 to
2017 (%)
Tanzania mainland: Lack of updated data.
Zanzibar: A drop of 8.6%.
Violations of trade union rights Ranking 4 out of 5 (5+ is worst). *
Labour legislation is improved according to ILO
standards
Yes, four (4) pieces of labour market related legislations reforms per May 2017 were approved in 2017; especially the Employment and Labor Relations Act and the Labour Institution Act from 2017 in Tanzania mainland were registered as improvements.
Partner organizations with minimum 30% women
representation in decision-making bodies
Tanzania mainland: Yes, registering of 33% representation in decision-
making bodies.
Zanzibar: Yes, registered of 53% representation in decision-making bodies.
Extending social protection
Health social protection coverage as % of total
population in partner countries
Tanzania mainland: 15%
Zanzibar: 10%
Workers from the informal economy have access to
national social security schemes
Tanzania mainland: Yes, but not fully coverage.
Zanzibar: Yes, but not fully coverage.
Promoting social dialogue
Trade union density of total employment (%) Tanzania mainland: 2.4%
Zanzibar: 2.8%
Trade union density of employees (%) Tanzania mainland: 17%
Zanzibar: 28%
Cooperation in labour-employer relations Ranking 113 out of 137 (1 is best). **
Number of Collective Bargaining Agreements
(CBAs)
Tanzania mainland: 331.
Zanzibar: 7.
Workers’ coverage of Collective Bargaining
Agreements to employees
Tanzania mainland: 12%
Zanzibar: 2.8%
Bi-/tri- partite agreements concluded
Tanzania mainland: Yes, recommendations for amendment of labour laws
and regulations, increase on minimum wages and a reduction of PAYE rates
for minimum wage earners.
Zanzibar: Yes, a wide range of both bi-/tripartite meetings.
* This is interpreted as a ‘systematic violations of rights’, which is expressed as the government and/or companies are engaged in serious efforts to crush the
collective voice of workers putting fundamental rights under threat, according to the International Trade Union Confederation (Source: ITUC, Global Rights
Index).
** This indicator is based on data from the Global Competitiveness Index that represents employers’ opinion from surveys (Source: World Economic Forum).
Other sources: CESTRAR, LO/FTF Council Sub-Regional Office data collection and LO/FTF Council research and calculations.

Danish Trade Union Council for International Development Cooperation Tanzania and Zanzibar Labour Market Profile 2018
Page iv
COUNTRY MAP
Source: Google
Danish Trade Union Council for International Development Cooperation Tanzania and Zanzibar Labour Market Profile 2018
Page v
TABLE OF CONTENTS
Preface......................................................................................................................................................................... i
Acknowledgment ........................................................................................................................................................ i
Executive Summary .................................................................................................................................................... ii
Status of Key Labour Market Indicators in the Framework of the Decent Work Agenda (DWA) in Tanzania and
Zanzibar, 2017 ......................................................................................................................................................................................... iii
Country Map .............................................................................................................................................................. iv
Trade Unions .............................................................................................................................................................. 1
Tanzania, mainland .................................................................................................................................................................................. 1
Zanzibar ...................................................................................................................................................................................................... 2
Employers’ Organisations .......................................................................................................................................... 3
Tanzania, mainland .................................................................................................................................................................................. 3
Zanzibar ...................................................................................................................................................................................................... 4
Central Tripartite Structures ......................................................................................................................................... 4
Tanzania, mainland .................................................................................................................................................................................. 4
Social dialogue in Tanzania mainland ................................................................................................................................................. 6
Zanzibar ...................................................................................................................................................................................................... 7
Social dialogue in Zanzibar ................................................................................................................................................................... 8
National Labour Legislation ........................................................................................................................................ 8
Tanzania, mainland .................................................................................................................................................................................. 8
Zanzibar ...................................................................................................................................................................................................... 9
Observations on the labour legislation ................................................................................................................................................ 9
Ratified ILO Conventions ......................................................................................................................................................................... 9
Trade Agreements ..................................................................................................................................................................................10
Trade Union Rights Violations .................................................................................................................................. 10
Working Conditions .................................................................................................................................................. 10
Workforce ................................................................................................................................................................. 11
Unemployment .........................................................................................................................................................................................13
Sectoral Employment ..............................................................................................................................................................................14
Migration ..................................................................................................................................................................................................15
Informal Economy ....................................................................................................................................................................................16
Child Labour .............................................................................................................................................................................................17
Gender ......................................................................................................................................................................................................18
Youth ..........................................................................................................................................................................................................18
Education .................................................................................................................................................................. 19
Vocational training .................................................................................................................................................................................20
Social Protection ....................................................................................................................................................... 21
Tanzania, mainland ................................................................................................................................................................................21
Danish Trade Union Council for International Development Cooperation Tanzania and Zanzibar Labour Market Profile 2018
Page vi
Zanzibar ....................................................................................................................................................................................................23
Economy ................................................................................................................................................................... 24
Export Processing Zones (EPZ) ..............................................................................................................................................................25
Appendix: Additional Data ....................................................................................................................................... 27
Table 25: Status of Trade Unions in Tanzania, 2016/2017 ........................................................................................................27
Table 26: Trade Union Centre and affiliated unions in Zanzibar, 2017 ...................................................................................28
Table 27: Labour market related national legislations approved in Tanzania and Zanzibar, 2014-2017 (May) .........28
Table 28: Status of Tanzania’s Ratified ILO Conventions, 2016 .................................................................................................29
Table 29: Ease of Doing Business in Tanzania, 2018 .....................................................................................................................30
Table 30: Governance Indicators in Tanzania, % and change percentage points, 2011-2016 .........................................30
References ................................................................................................................................................................ 31
Danish Trade Union Council for International Development Cooperation Tanzania and Zanzibar Labour Market Profile 2018
Page vii
Tables Table 1: Status of unionism in Tanzania mainland, 2017 ..................................................................................................................... 1 Table 2: Paid employees with membership in trade unions or employees association in Tanzania mainland, %, 2014 ....... 1 Table 3: Status of unionism in Zanzibar, 2017 ........................................................................................................................................ 3 Table 4: Employers’ view of the labour market efficiency in Tanzania, 2017-2018 .................................................................... 3 Table 5: Number of cases in the Commission for Meditation and Arbitration in Tanzania, 2013-2015 ................................... 5 Table 6: Status of Collective Bargaining Agreements (CBAs) in Tanzania mainland, 2017 ......................................................... 6 Table 7: Status of Collective Bargaining Agreements in Zanzibar, 2017 ........................................................................................ 8 Table 8: Number of approved labour market related legislations in Tanzania and Zanzibar, 2014-2017 (May) .............. 8 Table 9: Minimum wages in Tanzania mainland and Zanzibar, per month ....................................................................................11 Table 10: Status of Working Conditions in Tanzania ..........................................................................................................................11 Table 11: Estimations of employment-to-population ratio in Tanzania and the Eastern Africa, Age and Sex distribution,
2017 ...............................................................................................................................................................................................................12 Table 12: Unemployment in Tanzania and Eastern Africa average, 2017....................................................................................13 Table 13: Employed persons and GDP share per sector, 2014 .......................................................................................................14 Table 14: GDP share by sector and per worker in Tanzania, 2014 ...............................................................................................15 Table 15: Status of migration in Tanzania .............................................................................................................................................15 Table 16: Employment and economy in the informal economy in Tanzania ...................................................................................16 Table 17: Working children, Proportion of all children, age 5-17 years in Tanzania mainland and Zanzibar ....................17 Table 18: Key workforce indicators, Men and Women, 2014 ..........................................................................................................18 Table 19: Youth population in employment, unemployment and NEET in Tanzania mainland, % and gender gap, 2014 .19 Table 20: Status of Vocational Training in Tanzania and the sub-Saharan Africa (SSA), 2010-2013 ...................................20 Table 21: Status of public spending and coverage on social protection schemes in Tanzania and the sub-Saharan Africa
(SSA), % .........................................................................................................................................................................................................22 Table 22: Pension Benefits, Coverage and Contributions in Tanzania and the sub-Saharan Africa (SSA), 2010 ................23 Table 23: Key Economic data in Tanzania, 2017 ................................................................................................................................24 Table 24: Employment by economic class in Tanzania, 2000-2018 ................................................................................................25 Table 25: Status of Trade Unions in Tanzania, 2016/2017 .............................................................................................................27 Table 26: Trade Union Centre and affiliated unions in Zanzibar, 2017 ........................................................................................28 Table 27: Labour market related national legislations approved in Tanzania and Zanzibar, 2014-2017 (May) ..............28 Table 28: Status of Tanzania’s Ratified ILO Conventions, 2016.......................................................................................................29 Table 29: Ease of Doing Business in Tanzania, 2018 ..........................................................................................................................30 Table 30: Governance Indicators in Tanzania, % and change percentage points, 2011-2016 ...............................................30
Figures Figure 1: Number of members in TUCTA affiliated unions’ trend, 2008-2017 ............................................................................... 1 Figure 2: Number of workers covered by Collective Bargaining Agreements (CBA) trend in Tanzania mainland, 2008-
2017 ................................................................................................................................................................................................................. 7 Figure 3: Estimations and projections of status of employment in Tanzania, %, 2000-2020 .....................................................12 Figure 4: Employment by status in employment in Tanzania mainland, 2014 ...............................................................................12 Figure 5: Estimations and projections of labour productivity trend, 2000-2020 ..........................................................................13 Figure 6: Employment by aggregate sector in Tanzania, 2001-2014 ...........................................................................................14 Figure 7: Sector share in Tanzania, % of GDP, 2007-2016 .............................................................................................................15 Figure 8: Net migration trend in Tanzania, 1988-2012 .....................................................................................................................16 Figure 9: Employment in the informal economy .....................................................................................................................................17 Figure 10: Women in Management and Ownership, 2013 ...............................................................................................................18 Figure 11: School Enrolment in Tanzania and sub-Saharan Africa (SSA), male and female, %, 2005-2015 .......................20 Figure 12: Ratio of vocational student to all pupils in secondary education, Tanzania and the sub-Sahara Africa, %,
2010-2013 ...................................................................................................................................................................................................21 Figure 13: Out-of-pocket expenditure (% of current health expenditure), %, 2006-2015 .......................................................23 Figure 14: GDP per capita growth and inflation trend in Tanzania, %, 2008-2017 .................................................................24
Danish Trade Union Council for International Development Cooperation Tanzania and Zanzibar Labour Market Profile 2018
Page 1
TRADE UNIONS
Tanzania, mainland
The history of trade unions in Tanzania can be traced
back to the 1920s. Today, there were registered 23
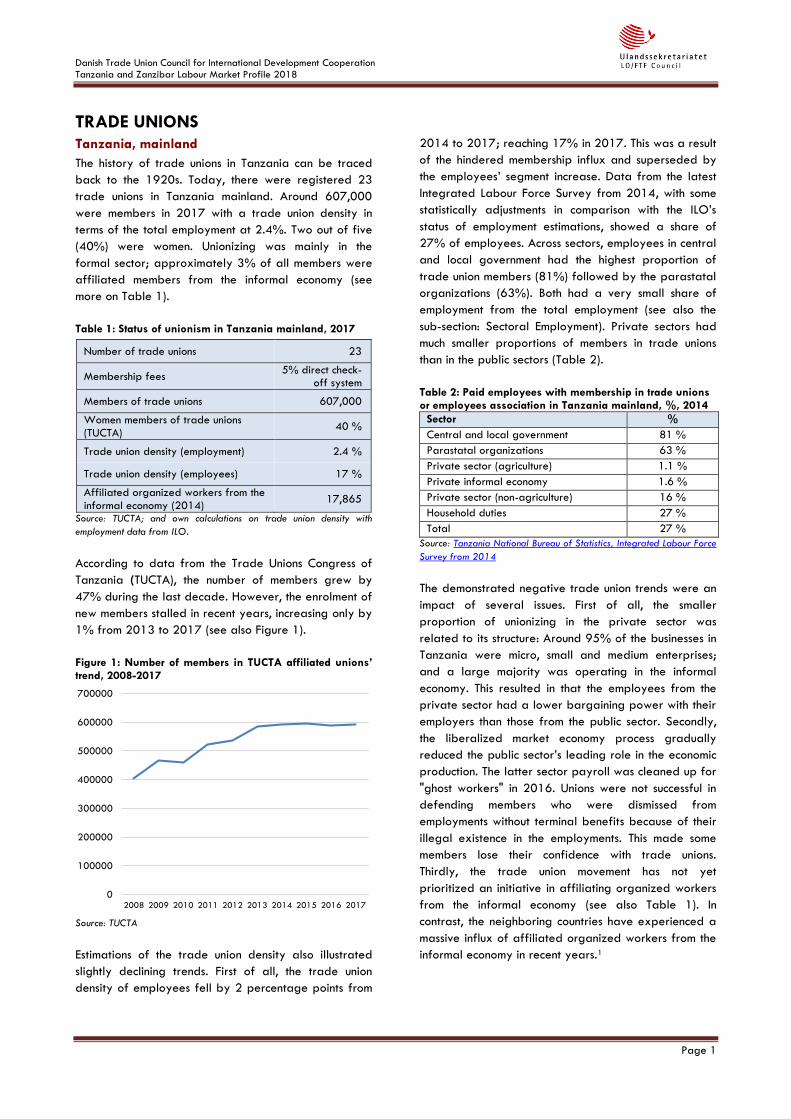
trade unions in Tanzania mainland. Around 607,000
were members in 2017 with a trade union density in
terms of the total employment at 2.4%. Two out of five
(40%) were women. Unionizing was mainly in the
formal sector; approximately 3% of all members were
affiliated members from the informal economy (see
more on Table 1).
Table 1: Status of unionism in Tanzania mainland, 2017
Number of trade unions 23
Membership fees 5% direct check-
off system
Members of trade unions 607,000
Women members of trade unions (TUCTA)
40 %
Trade union density (employment) 2.4 %
Trade union density (employees) 17 %
Affiliated organized workers from the informal economy (2014)
17,865
Source: TUCTA; and own calculations on trade union density with
employment data from ILO.
According to data from the Trade Unions Congress of
Tanzania (TUCTA), the number of members grew by
47% during the last decade. However, the enrolment of
new members stalled in recent years, increasing only by
1% from 2013 to 2017 (see also Figure 1).
Figure 1: Number of members in TUCTA affiliated unions’ trend, 2008-2017
Source: TUCTA
Estimations of the trade union density also illustrated
slightly declining trends. First of all, the trade union
density of employees fell by 2 percentage points from
2014 to 2017; reaching 17% in 2017. This was a result
of the hindered membership influx and superseded by
the employees’ segment increase. Data from the latest
Integrated Labour Force Survey from 2014, with some
statistically adjustments in comparison with the ILO’s
status of employment estimations, showed a share of
27% of employees. Across sectors, employees in central
and local government had the highest proportion of
trade union members (81%) followed by the parastatal
organizations (63%). Both had a very small share of
employment from the total employment (see also the
sub-section: Sectoral Employment). Private sectors had
much smaller proportions of members in trade unions
than in the public sectors (Table 2).
Table 2: Paid employees with membership in trade unions or employees association in Tanzania mainland, %, 2014
Sector %
Central and local government 81 %
Parastatal organizations 63 %
Private sector (agriculture) 1.1 %
Private informal economy 1.6 %
Private sector (non-agriculture) 16 %
Household duties 27 %
Total 27 %
Source: Tanzania National Bureau of Statistics, Integrated Labour Force
Survey from 2014
The demonstrated negative trade union trends were an
impact of several issues. First of all, the smaller
proportion of unionizing in the private sector was
related to its structure: Around 95% of the businesses in
Tanzania were micro, small and medium enterprises;
and a large majority was operating in the informal
economy. This resulted in that the employees from the
private sector had a lower bargaining power with their
employers than those from the public sector. Secondly,
the liberalized market economy process gradually
reduced the public sector’s leading role in the economic
production. The latter sector payroll was cleaned up for
"ghost workers" in 2016. Unions were not successful in
defending members who were dismissed from
employments without terminal benefits because of their
illegal existence in the employments. This made some
members lose their confidence with trade unions.
Thirdly, the trade union movement has not yet
prioritized an initiative in affiliating organized workers
from the informal economy (see also Table 1). In
contrast, the neighboring countries have experienced a
massive influx of affiliated organized workers from the
informal economy in recent years.1
0
100000
200000
300000
400000
500000
600000
700000
2008 2009 2010 2011 2012 2013 2014 2015 2016 2017
Danish Trade Union Council for International Development Cooperation Tanzania and Zanzibar Labour Market Profile 2018
Page 2
Trade Unions Congress of Tanzania (TUCTA)
TUCTA was established in 2001 under the Trade Unions
Act of 1998 and it is the sole national trade union
federation in Tanzania mainland. The organization is
recognized as an institutional player in the labour
market with ties to the government and regular
meetings with many other state institutions. TUCTA is
affiliated to the International Trade Union
Confederation (ITUC).
The organization went through an election process that
began in 2015. It was concluded in November 2016
with new leadership: chaired by Mr. Tumaini
Nyamhokya as President; and Dr. Yahya Msigwa as
Secretary General. The Congress covers 390 members,
the General Council with 190 members, the Executive
Committee with 47 members, the Executive Board with
15 members. Three out of nine in leadership positons
and decision-making bodies are women in TUCTA.
TUCTA represented 12 trade unions with around
592,000 workers in 2016/2017. The organization has
confronted a competition from new and fragmented
unions. There were registered 11 independent trade
unions with around 15,000 workers in 2017. Overall,
TUCTA represents 98% of all trade union members in
Tanzania mainland. Close to one out of two (45%) of
TUCTA’s total membership is organized by the Tanzania
Teacher Union (TTU) and it is one of the strongest trade
unions in the country. TTU, together with the trade union
for government workers (TUGHE) (11%) and local
government workers (TALGWU) (10%) represent 66%
of the total TUCTA membership.
Two more trade unions – the Tanzania Social Services
Industry Workers Union (TASIWU) and the Tanzania
Union of Private Security Employees (TUPSE) – are
underway to join TUCTA. Appendix Table 25 provides
more details of the affiliated trade unions’ membership,
number of Collective Bargaining Agreements (CBAs),
and number of Occupational Health and Safety
Committees at workplaces.
As indicated, TUCTA has relatively few affiliated
organized workers from the informal economy. TUCTA
has no strategy on how to engage in the informal
economy (see also the sub-section: Informal Economy).
TUCTA faces serious financial constraints due to a lack
of income from member fees from affiliated unions, real
estate, and losing external donor support, among
others. The organization is working on financial
recovery plans. Internal conflicts triggered due to some
affiliated unions opposed TUCTA’s constitutional right to
direct check-off from the source (5% of member fees
paid to unions). Not to mention, TUCTA hardly pay
salaries to the secretariat, and most activities have
been donor funded.
Zanzibar
Zanzibar’s own labour concerns were neglected in many
years. In 2001 it became constitutional matters. The
Zanzibar House of Representatives was compelled to
enact the Zanzibar Trade Union Act, which allowed
registration of trade unions in Zanzibar. Subsequently,
the national trade union centre was established in 2003
and branded as the Zanzibar Trade Union Congress
(ZATUC). This organization covers all trade unions in
Zanzibar.
Zanzibar Trade Union Congress (ZATUC)
ZATUC became gradually recognized with increased
influence in decision-making on the labour market. This
included to conducting negotiations and signing
collective agreements. The ITUC affiliates ZATUC.
Unionism in Zanzibar is under reforms. Internally, ZATUC
was merging resources together to make fewer and
stronger unions. So far a larger merger process of
trade unions in the public sector reduced the number of
affiliates from 11 to 9. Mergers in the private sector
are in progress; and if it succeeds then ZATUC affiliates
will further drop down to 7 unions. In addition, it was
decided that members of a union must pay contributions
obligatory. Those who were not paying at all were not
considered as members any longer. As a result of these
criteria, the membership dropped from 21,000 in 2015
to 18,000 in 2017, which equaled shrinkage of 13%. A
point often overlooked is, that the Labour Relations Act
requires a union with 50 or more members to be
registered and sets literacy standards for trade union
officers. This is particularly a challenge of increasing the
trade union membership rate in the private sector which
is mostly micro and small enterprises roofed by
informality.
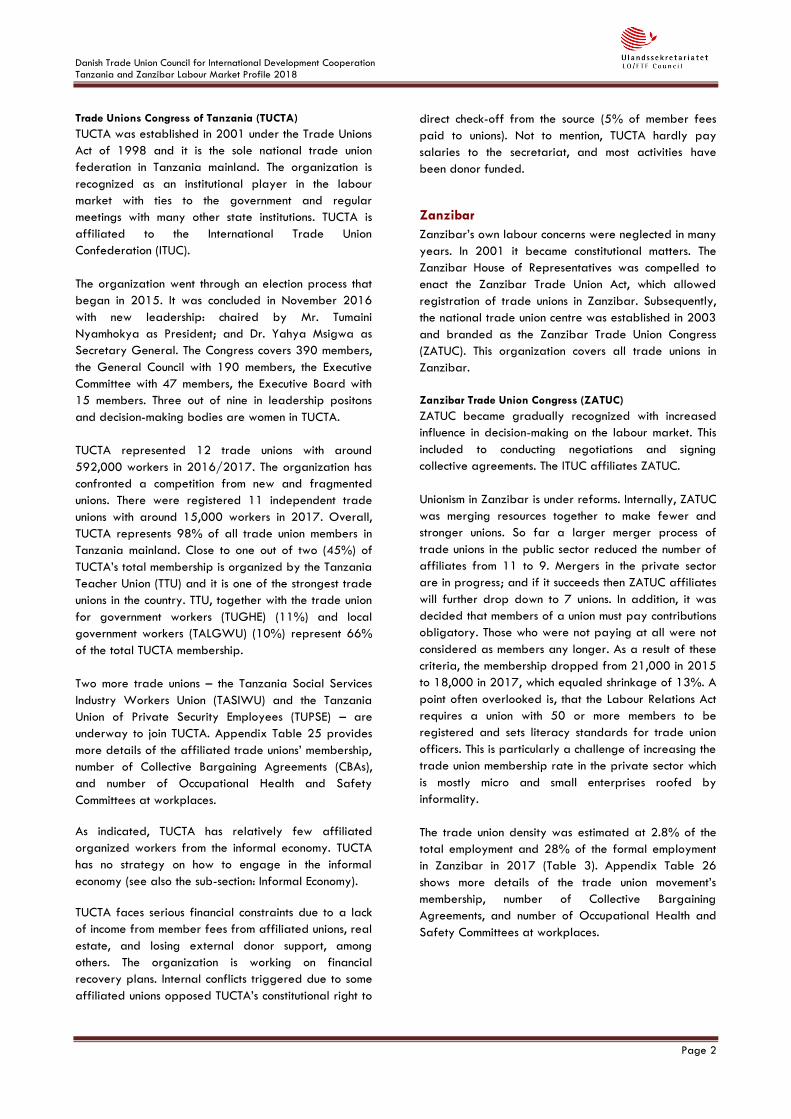
The trade union density was estimated at 2.8% of the
total employment and 28% of the formal employment
in Zanzibar in 2017 (Table 3). Appendix Table 26
shows more details of the trade union movement’s
membership, number of Collective Bargaining
Agreements, and number of Occupational Health and
Safety Committees at workplaces.
Danish Trade Union Council for International Development Cooperation Tanzania and Zanzibar Labour Market Profile 2018
Page 3
Table 3: Status of unionism in Zanzibar, 2017
Number of trade unions 9
Membership fees (median, per month) US$1.8
Members of trade unions 18,239
Women members of trade unions 7,397
Trade union density (total employment) 2.8 %
Trade union density (formal employed) 28 %
Members of affiliated trade unions from the informal economy
896
Source: ZATUC; and own calculations on trade union density.
To promote a higher influx of members, ZATUC
adopted a five-year strategic plan and a work plan
that aimed to engage with informal economy. A
national union committee was set up with an informal
economy desk in 2015 to organize the workers. As
mentioned, paying obligatory trade union contributions
for all, which included organized informal workers, was
a key issue for the trade unions. Some informal
economy workers were successfully organized in
associations, to which they pay a flat rate at around
500-1000 shillings (equivalent to US$0.2-0.4) per
month, and enjoy a proportional representation, by
trade unions. Yet only 5% of all members were
affiliated workers from the informal economy (Table 3).
The Constitution of ZATUC gives an equal gender
equality 50% participation in leadership and
empowers youth to join. However, it is not a compulsory
50% for women to be leaders. Collected data
revealed that 54% of leadership positions and
decision-making bodies were women and 15 young
people were leaders in various positions at affiliated
level in 2017. According to ZATUC register, 39% of
the total trade union memberships were women.
It is noteworthy to mention that around one out of two
public teachers were members of the teachers’ union,
ZATU, which is the largest affiliated union in ZATUC.
Regionally, ZATU is active in the federation for East
African Teachers’ Unions (FEATU) that recently gained
legal registration in Tanzania. The organization is in the
process of finalizing the establishment of a permanent
office in Arusha and receiving official observer status in
the East Africa Community (EAC) in line with the East
African Trade Union Confederation (EATUC) (only on
issues pertaining teachers’ rights and education
matters).
EMPLOYERS’ ORGANISATIONS Based on estimations from ILO, 2.8% of the total
employment in Tanzania consists of employers in 2017
(see more on Figure 3). The Global Competitiveness
Index provides the Tanzanian employers’ view on a
wide range of aspects, including labour market
efficiency. The latter is elaborated upon surveys among
employers and other statistical data. They considered
the labour market as effective on a medium level,
ranking 63 out of 137 countries (1st is the best).2
Out of the 10 labour market efficiency indicators, the
highest scorings were redundancy costs (i.e. cost in
weekly wages of advance notice requirements,
severance payments, and penalties due when
terminating a redundant worker), ranking 27 out of 137
countries; followed by women participation rate in the
labour force ranking 31. It is also worthwhile to mention
that cooperation in labour-employer relations had the
lowest ranking of 113 (see more on Table 4).
Table 4: Employers’ view of the labour market efficiency in Tanzania, 2017-2018
Indicator Rank
Total 63
Cooperation in labour-employer relations 113
Flexibility of wage determination 93
Hiring and firing practices 85
Redundancy costs (weeks of salary) 27
Effect of taxation on incentives to work 106
Pay and productivity 105
Reliance on professional management 89
Country capacity to retain talent 74
Country capacity to attract talent 62
Women participation in the labour force 31
Note: Rank from 1 to 137 (1 is highest). Source: The Global Competitiveness Report, 2017-2018, 7th pillar:
Labor market efficiency
Tanzania, mainland
The Association of Tanzania Employers (ATE) was
founded in 1960 and it was considered as the main
employers’ organization in Tanzania. Their main
objective is to enhance sustainable socio-economic
development in coordination with the government and
trade union movement. In practice the organization
provides advisory and represent services of industrial
relations, law, management, among others, to its
members. ATE is governed by an annual general
meeting and an executive council. It has representatives
in most important bi/tripartite organs.
ATE’s membership increased from 1,300 registered
direct members in 2015/16 to 1,400 in 2018 (May).
Danish Trade Union Council for International Development Cooperation Tanzania and Zanzibar Labour Market Profile 2018
Page 4
Furthermore, around 6,000 were indirect members from
private business firms, companies and some parastatal
organizations. A majority of members were based in
Dar es Salaam (70%) and the rest were in other parts
of the Tanzania mainland (30%).3 The members were
classified in 8 divisions: agriculture, commerce, industry,
mining, banking and finance, oil and gas, utilities and
services, and private security.
Subscription fees are charged on quota pro-rata basis.
An entrance fee costs TZS 100,000 (US$45) and annual
subscription fee varying depending on the number of
employees: lowest (1-10 employees) TZS 100,000
(US$45) and highest (51-100 employees) TZS 800,000
(US$357).4
ATE is an active member of the Tanzania Private Sector
Foundation (TPSF) and the East African Business Council
(EABC). The organization is also affiliated to the
International Organization of Employers (IOE) and it is
a founding member of the Business Africa formerly
known as Pan African Employers Confederation (PEC).
ATE participates in ILO’s annual conference of which
Tanzania is a member and has one vote as an apex
employers’ association in Tanzania. Finally, ATE is a
member of the East African Employers Organization
(EAEO).
Zanzibar
Employers’ organization is the Employers Association of
Zanzibar (ZANEMA). Main activities are to represent
the private sector in policy advocacy and to conduct
training workshops for members. ZANEMA maintains
good working relations with ZATUC. The organization
faces constraints in terms of manpower resources,
though. ZANEMA is a member of the East African
Employers Organization (EAEO).
CENTRAL TRIPARTITE STRUCTURES
Tanzania, mainland
Labour Court
Labour Institutions Act from 2004 established the
Labour Court in Tanzania mainland as a division of the
High Court. The former court is presided by a judge
and two assessors from the employers’ organizations
and trade unions. The institution is implementing
procedures of settling its referred labour disputes.
Labour inspectors are often hindered in their ability to
ensure labour law compliance in relation to sanctioning
an employer through the courts is cumbersome and it
appears to depend on the seldom-used delegation of
prosecutorial authority from the Director of Public
Prosecutions (see also the section: Working Conditions).5
The Labour Court has struggled with a lack of resources
and processing slightly less than half of the cases it
receives.6
Labour, Economic and Social Council (LESCO)
By law, LESCO advises the Minister of Labour and
Employment on the national labour market policy and
additionally any proposed labour law before it is
submitted to cabinet. It furthermore collects and
compiles information and statistics relating to the
administration of the labour laws. LESCO operates with
an independent chairperson and sixteen members, all
appointed by the mentioned minister, which represent
the interest of the government, employers and workers;
and four members appointed because of their
expertise.
In practice, tripartite meetings in LESCO were not held
often, but there were occasional consultations with trade
unions. Representatives on some issues prior to meetings
were effectuated although coordination mechanisms
were not well established. What affected the dialogue
was often related to their recommendations, which were
not acted by the government because of political
position. On the positive side, the institution has
recommended a ratification of the ILO Convention 189
on domestic workers.
Labour Commission for Mediation and Arbitration
(CMA)
Labour disputes are mainly regulated and resolved by
mediation or arbitrate through the CMA. This is an
independent department of the Ministry of Labour that
operated since 2007. CMA has 20 field offices with
two arbitrators/mediators per field office on average.
Mediate or arbitrate embrace any dispute within the
labour laws framework, which includes antiunion
discrimination. CMA is relatively well-functioning and an
important organ in the Tanzanian labour market.7
However, a wide range of other challenging aspects
have been observed such as a very limited common
understanding on how Workers’ Council contract should
be made and registered; failure to update the Workers
Council contract when it expires; and organizational
rights for employees are often denied in private
sectors.
The position of processing legal cases does still not
respect or recognize CMA jurisdiction in terms of labour
Danish Trade Union Council for International Development Cooperation Tanzania and Zanzibar Labour Market Profile 2018
Page 5
matters involving defamation.8 Not to mention, a labour
dispute case over termination of employment for
bribery allegations went all the way up to High Court in
2016, but it was faulted by the Court of Appeal who
ordered a fresh hearing after noting some inadequacy
in the employment laws. This was related to services
and notifications by CMA to the parties’ dispute and
enabled them to take appropriate measures in case of
any grievance, i.e. uncertainty is not conducive for the
timely adjudication of labour disputes.9
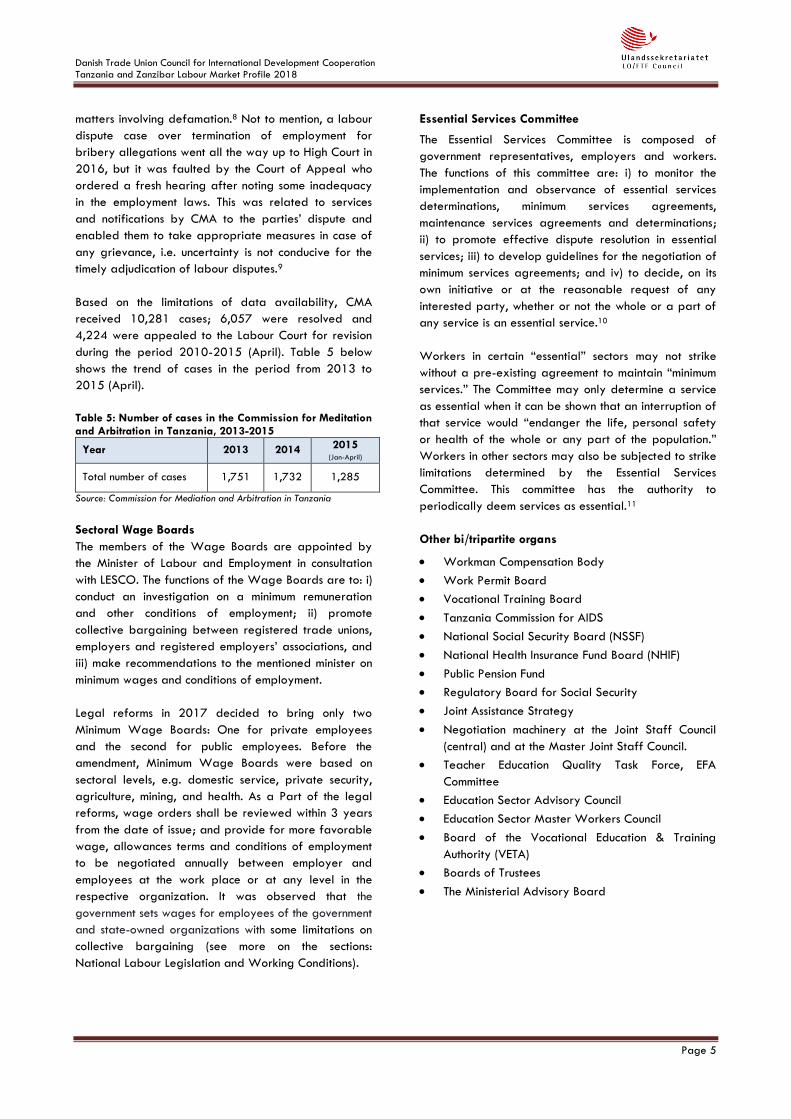
Based on the limitations of data availability, CMA
received 10,281 cases; 6,057 were resolved and
4,224 were appealed to the Labour Court for revision
during the period 2010-2015 (April). Table 5 below
shows the trend of cases in the period from 2013 to
2015 (April).
Table 5: Number of cases in the Commission for Meditation and Arbitration in Tanzania, 2013-2015
Year 2013 2014 2015 (Jan-April)
Total number of cases 1,751 1,732 1,285
Source: Commission for Mediation and Arbitration in Tanzania
Sectoral Wage Boards
The members of the Wage Boards are appointed by
the Minister of Labour and Employment in consultation
with LESCO. The functions of the Wage Boards are to: i)
conduct an investigation on a minimum remuneration
and other conditions of employment; ii) promote
collective bargaining between registered trade unions,
employers and registered employers’ associations, and
iii) make recommendations to the mentioned minister on
minimum wages and conditions of employment.
Legal reforms in 2017 decided to bring only two
Minimum Wage Boards: One for private employees
and the second for public employees. Before the
amendment, Minimum Wage Boards were based on
sectoral levels, e.g. domestic service, private security,
agriculture, mining, and health. As a Part of the legal
reforms, wage orders shall be reviewed within 3 years
from the date of issue; and provide for more favorable
wage, allowances terms and conditions of employment
to be negotiated annually between employer and
employees at the work place or at any level in the
respective organization. It was observed that the
government sets wages for employees of the government
and state-owned organizations with some limitations on
collective bargaining (see more on the sections:
National Labour Legislation and Working Conditions).
Essential Services Committee
The Essential Services Committee is composed of
government representatives, employers and workers.
The functions of this committee are: i) to monitor the
implementation and observance of essential services
determinations, minimum services agreements,
maintenance services agreements and determinations;
ii) to promote effective dispute resolution in essential
services; iii) to develop guidelines for the negotiation of
minimum services agreements; and iv) to decide, on its
own initiative or at the reasonable request of any
interested party, whether or not the whole or a part of
any service is an essential service.10
Workers in certain “essential” sectors may not strike
without a pre-existing agreement to maintain “minimum
services.” The Committee may only determine a service
as essential when it can be shown that an interruption of
that service would “endanger the life, personal safety
or health of the whole or any part of the population.”
Workers in other sectors may also be subjected to strike
limitations determined by the Essential Services
Committee. This committee has the authority to
periodically deem services as essential.11
Other bi/tripartite organs
Workman Compensation Body
Work Permit Board
Vocational Training Board
Tanzania Commission for AIDS
National Social Security Board (NSSF)
National Health Insurance Fund Board (NHIF)
Public Pension Fund
Regulatory Board for Social Security
Joint Assistance Strategy
Negotiation machinery at the Joint Staff Council
(central) and at the Master Joint Staff Council.
Teacher Education Quality Task Force, EFA
Committee
Education Sector Advisory Council
Education Sector Master Workers Council
Board of the Vocational Education & Training
Authority (VETA)
Boards of Trustees
The Ministerial Advisory Board
Danish Trade Union Council for International Development Cooperation Tanzania and Zanzibar Labour Market Profile 2018
Page 6
Social dialogue in Tanzania mainland
Social dialogue covers several aspects: Industrial
relations, freedom of association and the right to
organize, collective bargaining, consultation,
examination of grievances and settlement of industrial
disputes.
The country’s labour legislation provides for collective
bargaining in the private sector. Public-sector
employees have the right to bargain collectively
through the Trade Union of Government and Health
Workers (TUGHE). In practice, TUGHE conducts
negotiations with the government through workers’
councils, which are conducted regularly. They have
established workers’ councils with government
departments or institutions in about 98% of the
government work places. In this regard, workers’
councils discuss different agendas including issues of
salary increase, financial regulations, Human Resources
policies, etc. Whatever is agreed and signed in the
workers’ councils, they become the Collective
Bargaining Agreements and it becomes enforceable by
the law.
However, not all Public sector employees have the right
to bargaining collectively through TUGHE because it
depends on the Public Institutions, e.g. local government
employees have their own union – the Tanzania Local
Government Workers Union (TALGWU) – are
organized under TUICO.
Be that as it may, there are some legal flaws on the
rights to collective bargaining. As indicated, the legislation is
less prescriptive and provides minimum requirements
that widen the spectrum for employers and employees
to negotiate the terms and conditions of employment as
well as agree on work standards. ITUC has additionally
registered restrictions on the principle of free and
voluntary bargaining in Tanzania. This is related to
compulsory conciliation and binding arbitration
procedure in the event of disputes during collective
bargaining, other than in essential services, i.e. the
system of compulsory arbitration sets the conditions and
terms of employment of public service employees.12
Although the legal framework for tripartite social
dialogue in Tanzania mainland is set, the reality is that
social dialogue is still limited in practice and it is often
ineffective. This is due to weak enforcement mechanisms,
fragile and some dormant social dialogue institutions as
well as overloaded dispute resolution mechanisms. This
contributes to complicated and often confrontational
labour relations. According to a survey undertaken by
ATE, employers have not yet fully embraced the
possibilities that collective bargaining can provide,
which is likely to be the same for the employees. As
mentioned, this was reflected in the mentioned Global
Competitiveness Index’s low ranking in the cooperation
in labour-employer relations (see also Table 4).
On the positive side, social dialogue has some
improvements in Tanzania mainland. Trade unions and
the employers’ organization were undergoing joint
activities, which included four bipartite meetings in
2017; and several meetings with the Government on
how the reformed Social Security Fund scheme should
operate. Also a Memorandum of Understanding (MoU)
was signed by TUCTA and ATE in 2017 to establish a
joint Collective Bargaining Agreements (CBA)
framework. The two organizations are in a process of
designing the framework.
Research of comparative CBAs from development
countries showed that 16% of CBAs in Tanzania were
extended to employers who did not sign the agreement.
This was relatively higher than the ten other surveyed
countries (eight in Africa), which was estimated at 9%
on average. The country has a relatively low share of
21% in terms of agreements signed by one or more
employers’ association, which was in contrast to the total
average of 26%. A large majority of the share of CBAs
in Tanzania (95%) was covered by the private sector.13
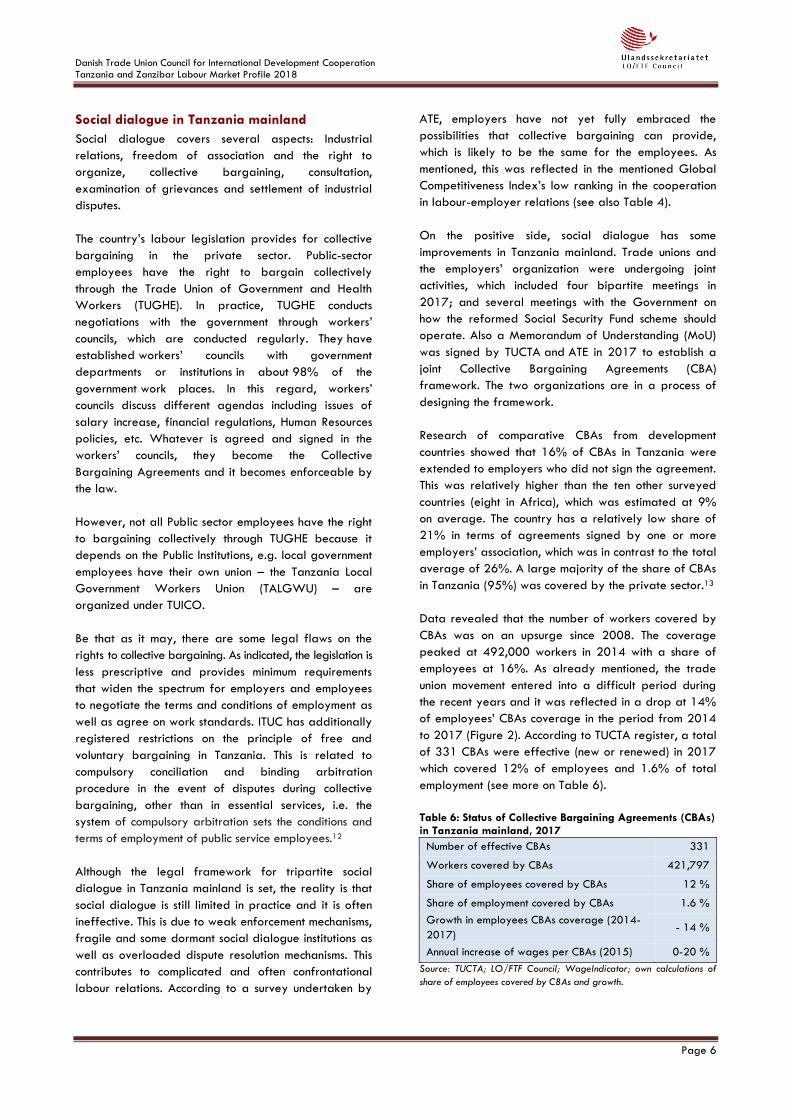
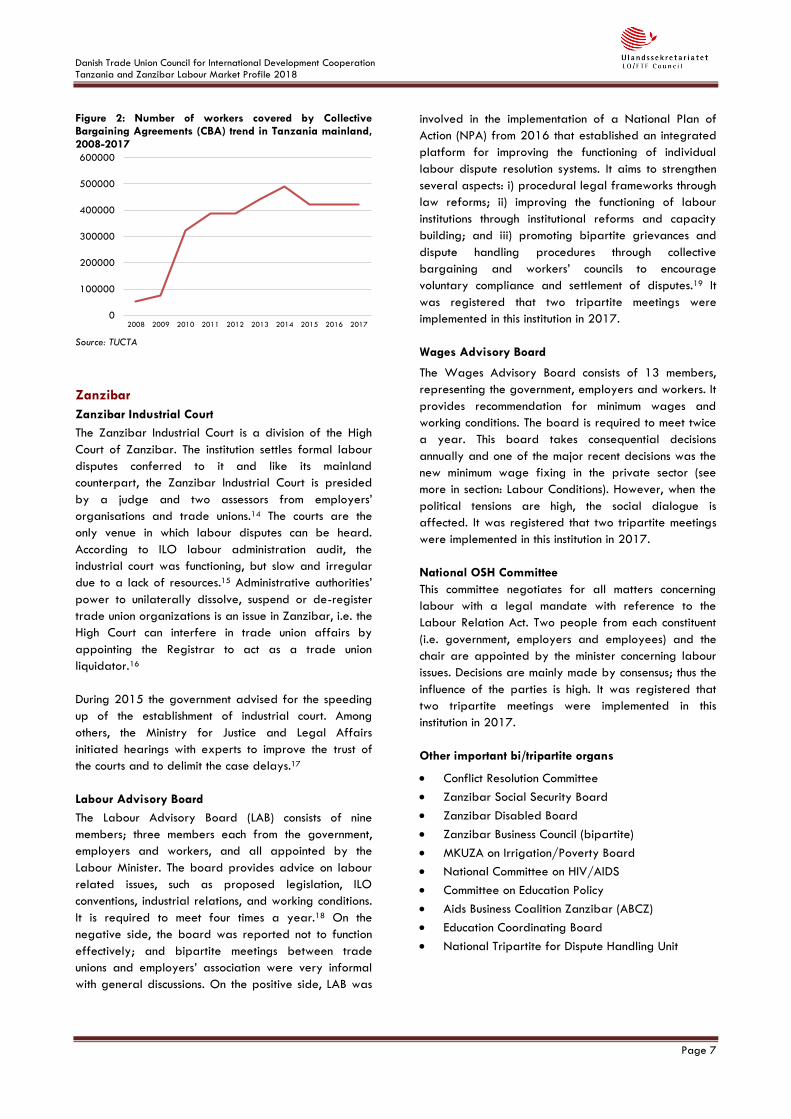
Data revealed that the number of workers covered by
CBAs was on an upsurge since 2008. The coverage
peaked at 492,000 workers in 2014 with a share of
employees at 16%. As already mentioned, the trade
union movement entered into a difficult period during
the recent years and it was reflected in a drop at 14%
of employees’ CBAs coverage in the period from 2014
to 2017 (Figure 2). According to TUCTA register, a total
of 331 CBAs were effective (new or renewed) in 2017
which covered 12% of employees and 1.6% of total
employment (see more on Table 6).
Table 6: Status of Collective Bargaining Agreements (CBAs) in Tanzania mainland, 2017
Number of effective CBAs 331
Workers covered by CBAs 421,797
Share of employees covered by CBAs 12 %
Share of employment covered by CBAs 1.6 %
Growth in employees CBAs coverage (2014-
2017) - 14 %
Annual increase of wages per CBAs (2015) 0-20 %
Source: TUCTA; LO/FTF Council; WageIndicator; own calculations of
share of employees covered by CBAs and growth.
Danish Trade Union Council for International Development Cooperation Tanzania and Zanzibar Labour Market Profile 2018
Page 7
Figure 2: Number of workers covered by Collective Bargaining Agreements (CBA) trend in Tanzania mainland, 2008-2017
Source: TUCTA
Zanzibar
Zanzibar Industrial Court
The Zanzibar Industrial Court is a division of the High
Court of Zanzibar. The institution settles formal labour
disputes conferred to it and like its mainland
counterpart, the Zanzibar Industrial Court is presided
by a judge and two assessors from employers’
organisations and trade unions.14 The courts are the
only venue in which labour disputes can be heard.
According to ILO labour administration audit, the
industrial court was functioning, but slow and irregular
due to a lack of resources.15 Administrative authorities’
power to unilaterally dissolve, suspend or de-register
trade union organizations is an issue in Zanzibar, i.e. the
High Court can interfere in trade union affairs by
appointing the Registrar to act as a trade union
liquidator.16
During 2015 the government advised for the speeding
up of the establishment of industrial court. Among
others, the Ministry for Justice and Legal Affairs
initiated hearings with experts to improve the trust of
the courts and to delimit the case delays.17
Labour Advisory Board
The Labour Advisory Board (LAB) consists of nine
members; three members each from the government,
employers and workers, and all appointed by the
Labour Minister. The board provides advice on labour
related issues, such as proposed legislation, ILO
conventions, industrial relations, and working conditions.
It is required to meet four times a year.18 On the
negative side, the board was reported not to function
effectively; and bipartite meetings between trade
unions and employers’ association were very informal
with general discussions. On the positive side, LAB was
involved in the implementation of a National Plan of
Action (NPA) from 2016 that established an integrated
platform for improving the functioning of individual
labour dispute resolution systems. It aims to strengthen
several aspects: i) procedural legal frameworks through
law reforms; ii) improving the functioning of labour
institutions through institutional reforms and capacity
building; and iii) promoting bipartite grievances and
dispute handling procedures through collective
bargaining and workers’ councils to encourage
voluntary compliance and settlement of disputes.19 It
was registered that two tripartite meetings were
implemented in this institution in 2017.
Wages Advisory Board
The Wages Advisory Board consists of 13 members,
representing the government, employers and workers. It
provides recommendation for minimum wages and
working conditions. The board is required to meet twice
a year. This board takes consequential decisions
annually and one of the major recent decisions was the
new minimum wage fixing in the private sector (see
more in section: Labour Conditions). However, when the
political tensions are high, the social dialogue is
affected. It was registered that two tripartite meetings
were implemented in this institution in 2017.
National OSH Committee
This committee negotiates for all matters concerning
labour with a legal mandate with reference to the
Labour Relation Act. Two people from each constituent
(i.e. government, employers and employees) and the
chair are appointed by the minister concerning labour
issues. Decisions are mainly made by consensus; thus the
influence of the parties is high. It was registered that
two tripartite meetings were implemented in this
institution in 2017.
Other important bi/tripartite organs
Conflict Resolution Committee
Zanzibar Social Security Board
Zanzibar Disabled Board
Zanzibar Business Council (bipartite)
MKUZA on Irrigation/Poverty Board
National Committee on HIV/AIDS
Committee on Education Policy
Aids Business Coalition Zanzibar (ABCZ)
Education Coordinating Board
National Tripartite for Dispute Handling Unit
0
100000
200000
300000
400000
500000
600000
2008 2009 2010 2011 2012 2013 2014 2015 2016 2017
Danish Trade Union Council for International Development Cooperation Tanzania and Zanzibar Labour Market Profile 2018
Page 8
Based on data collection, the participation in bi-partite
and tripartite fora has increased in Zanzibar in recent
years.20
Social dialogue in Zanzibar
Just as in Tanzania mainland, a legal framework for
tripartite social dialogue in Zanzibar is set. However,
dialogue is still limited in practice and with some
infectivity, e.g. managerial employees do not have the
right to bargain collectively with respect to salaries and
other conditions of employment in the semi-autonomous
region.21 On the positive side, steps were taken to
improve the social dialogue in 2017. This included
several bipartite meetings between ZUTAC and
ZANEMA, e.g. National Negotiation Stationary,
negotiation meetings with Ministry of Public Services,
negotiation meeting with Alsumeit University, and
meetings with the President of Zanzibar. In addition,
there was one tripartite meeting about the Conflict
Resolution Committee meetings and two with the
National Good Governance Strategic Committee.22
Three effective (new and renewed) CBAs were adopted
in 2017. According to the register, five out of 10 trade
unions affiliated to ZATUC had a total of 7 effective
CBAs. This was up from 2 CBAs in 2012. The coverage
of CBAs among employees remained low with an
estimated 2,000 workers; and a very small share of
employees at 2.8% (Table 7; and see more on
Appendix Table 26).
Table 7: Status of Collective Bargaining Agreements in Zanzibar, 2017
Number of CBAs 7
Workers covered by CBAs 2,000
Share of employees covered by CBAs 2.8 %
Source: ZATUC; own calculations on the share of employees
covered by CBAs.
NATIONAL LABOUR LEGISLATION
The latest registration of labour market legislations in
Tanzania mainland and Zanzibar counted 286 pieces in
May 2017.23 Table 8 below illustrates the number of
approved legislation reforms in the period from 2014
to 2017 (May). A more detailed list of legislations is
available in Appendix Table 27.
Two key legislation reforms in Tanzania mainland in
recent years were the Employment and Labor Relations
Act and the Labour Institution Act, both from 2017 (see
more below).
Table 8: Number of approved labour market related legislations in Tanzania and Zanzibar, 2014-2017 (May)
2014 2015 2016
2017
(May)
Number of
new/amended
legislations
2 8 15 4
Source: ILO, NATLEX, Tanzania
Constitution24
The Constitution applies to the United Republic of
Tanzania. The state is obliged to realize the right to
work and receive social welfare. The freedom of
association is guaranteed, though with several
restrictions. Equal opportunity and just remuneration is
enshrined in the constitution.
A Constitution Review process was initiated in 2013 and
it was finalized in 2015. The participating trade union
representatives ensured an inclusion of labour rights
clauses in the new draft constitution. The constitutional
referendum was planned to be held in April 2015.
However, heightening political tensions, delays to voter
registration and security sectarian postponed the
process. Issues with concerns were mainly related to the
division of Tanzania mainland and Zanzibar, ethnic
relations as well as ownership of oil and gas reserves.
Sources informed that the constitution review was still
not included in the proposed Ministry of Constitutional
Affairs 2017/2018 budget, which has raised a concern
that the constitution review was never a priority for the
current government.25
The Tanzania mainland and Zanzibar have separate
main labour laws:
Tanzania, mainland
Employment and Labour Relations Act26
The Employment and Labour Relations Act (ELRA) of
2004 sets fundamental rights at work and regulates
hours of work, remuneration, leave, termination of
employment, trade unions and employers’
organizations, organizational rights, collective
bargaining, strikes and lockouts, and sets dispute
resolution under the Commission for Mediation and
Arbitration. The labor laws cover all workers, including
foreign and migrant workers.
A reform of ELRA was approved in 2017. Some of the
main improvements were related to child labour
Danish Trade Union Council for International Development Cooperation Tanzania and Zanzibar Labour Market Profile 2018
Page 9
prohibition, employment standards, and trade union
matters. On the negative side, ELRA does not stipulate a
reasonable period for the processing of applications for
registration of trade unions.
Labour Institutions Act27
The Labour Institutions Act of 2004 applies to the
United Republic of Tanzania. It establishes the Labour,
Economic and Social Council, the Commission for
Mediation and Arbitration, the Essential Services
Committee, Sectoral Wage boards, the Labour
Administration and Inspection, and the Labour Court.
Reforms of this Act were approved in 2017. Some of
the improvements were related to appointment of
members to: i) the Labour, Economic and Social Council,
ii) the Commission for Mediation and Arbitration, and iii)
Wage Boards. The amended Act also changed Wage
Board consultation and Wage Order Review, e.g. the
order shall be reviewed within 3 years from the date of
issue.
Zanzibar
Labour Relations Act28
The Labour Relations Act of 2005 regulates
fundamental employees’ rights, establishes the
framework for registration of trade unions and
organizations, organizational rights, collective
bargaining and agreements, labour disputes / right to
strike, dispute prevention, and resolution and
establishes the Zanzibar Industrial Court.
The Act requires a union with 50 or more members to
be registered and sets literacy standards for trade
union officers. This provides considerable powers of the
registrar to restrict registration by setting forth criteria
for determining whether an organization’s constitution
contains suitable provisions to protect its members’
interests.29
The Employment Act
The Employment Act from 2005 regulates fundamental
rights and protection, employment procedures and
foreign employment, contracts of service and
employment standards and rights (hours at work,
wages, leave, vacation, penalties, termination of
employment, etc.). The law also establishes the Labour
Advisory Board, wage fixing machinery and wages
protection as well as the Labour Commission and labour
inspection.
Observations on the labour legislation
The International Trade Union Confederation (ITUC) has
registered several observations of the legislations with
reference to the international standards of right to
organize, right to collective bargaining and right to
strike. These are summarized below:30
The law prohibits anti-union discrimination, but does
not provide adequate means of protection against
it.
Power to refuse official registration on arbitrary,
unjustified or ambiguous grounds.
Excessive representativity or minimum number of
members required for the establishment of a union.
Sanctions imposed for organizing or joining an
organization not officially recognized.
Restrictions on trade unions’ right to establish
branches, federation and confederation or to
affiliate with national and international
organizations.
Restrictions on the right to elect representatives and
self-administer in full freedom.
Administrative authorities’ power to unilaterally
dissolve, suspend or de-register trade union
organizations.
Compulsory conciliation and/or binding arbitration
procedure in the event of disputes during collective
bargaining, other than in essential services.
Excessively long prior notice/cooling-off period.
Absence of specific protection for workers involved
in lawful strike actions (e.g. against dismissal).
Restrictions with respect to the objective of a strike
(e.g. industrial disputes, economic and social issues,
political, sympathy and solidarity reasons).
Ratified ILO Conventions
With reference to the United Republic of Tanzania
ratification of the international labour standards, a total
36 ILO Conventions are ratified (see also Appendix
Table 28):31
Ratifications for the ILO Conventions
Fundamental Conventions: 8 of 8.
Governance Conventions (Priority): 1 of 4
Technical Conventions: 27 of 177.
Out of 36 Conventions ratified by Tanzania, of
which 31 are in force, no Convention has been
denounced; 5 instruments arrogated; none have
been ratified in the past 12 months.
Danish Trade Union Council for International Development Cooperation Tanzania and Zanzibar Labour Market Profile 2018
Page 10
The latest ratified Convention is the Seafarers' Identity
Documents Convention (Revised) (No. 185) from 2017.
The convention entered into force in April 2018.
Trade Agreements
Tanzania is part of the East African Community (EAC).
The EAC free trade agreement from 1999 contains a
labour provision with cooperation on employment and
working conditions with an emphasis on gender equality
as well as discriminatory law and practices.
Furthermore, the labour provision of the Common
Market for Eastern and Southern Africa (COMESA)
agreement extends to cooperation on employment
conditions and labour law.32 Tanzania is also part of
the 2000 Cotonou Agreement between the European
Union (EU) and African, Caribbean and Pacific (ACP)
countries, which reaffirms commitment to ILO’s
Fundamental Conventions and includes a labour
provision on cooperation on various labour and social
issues.
In 2005 the EAC established a customs union and in
2010 the EAC agreed to establish a full common
market with free movement for workers, goods,
services, and capital.
Freedom of association and collective bargaining is
enshrined in the EAC common market in the sense that
an EAC migrant worker has the same rights as a
national.33 The free movement of labour within the EAC
opens up questions of how to achieve equal
opportunities and equal social and labour rights for
migrant workers, for example if workers can bring
pensions with them across borders. The free movement
of labour is also a source of concern in some of the EAC
countries, as the countries’ workforces have differences
in productivity and educational level. The actual
implementation of the economic integration has slowed
down the last few years especially with regards to
lifting barriers to trade and free movement of labour.
TRADE UNION RIGHTS VIOLATIONS
Tanzania has experienced some downturns in the trade
union rights violations. On the Global Rights Index, the
country had a stable ranking at 3 out of 5 (5 is worst) in
the period from 2014 to 2016, but it dropped one
place down the latter, ranking 4 out of 5 in 2017. This
was registered as ‘systematic violations of rights’. This is
interpreted as the government and/or companies are
engaged in serious efforts to crush the collective voice
of workers putting fundamental rights under threat.34
ITUC registered three cases of systematic violations of
rights in 2017: i) Tanzania Mines, Energy and
Construction Workers Union (TAMICO) member was shot
dead, ii) physical threats against TAMICO
representative, and iii) Kinondoni District Council raised
levies to be paid by bus operators without consulting
workers.
Other sources registered that private-sector employers
adopted antiunion policies or tactics, which were
against the law regulations in both the mainland and
Zanzibar. In 2017 TUCTA reported a story of
international mining interests engaging in antiunion
activities such as bribing officials from the Ministry of
Labour Inspectorate to ignore worker complaints or to
write favorable reports on working conditions. TUCTA
also stated that employers threatened or terminated
workers to prevent organizers from achieving the 50-
percent threshold to guarantee access to collective
bargaining.35
Both Tanzania mainland and Zanzibar have no active
complaint procedure in relation to Freedom of
Association cases with ILO.36
WORKING CONDITIONS
The latest published minimum wage standards in
Tanzania mainland was in 2015 and raised the
minimum wage to TZS 310,777 (US$152) per month.
These cover for employees in both the public and
private sectors. Back in 2013, other minimum wage
standards were divided into nine employment sectors.
The lowest minimum wage was TZS 40,000 (US$18) per
month for the lowest-paid category of domestic workers
residing in the household of the employer while the
highest was TZS 400,000 (US$179) per month for
workers in the telecommunications, mining, energy, and
financial sectors (Table 9). This points out that, the
lowest minimum wages were not enough to support
basic living conditions.
In Zanzibar the latest minimum wage adjustment was
approved in 2016 when civil servants’ wage increased
by 100% reaching TZS 300,000 (US$134) per month
(Table 9).
Only workers from the formal sector are covered by
the minimum wages; but a majority of Tanzanian
mainland and Zanzibar workers are operating in the
informal economy or subsistence farming where the
wage regulations are not applied (see also the sub-
section: Informal Economy).
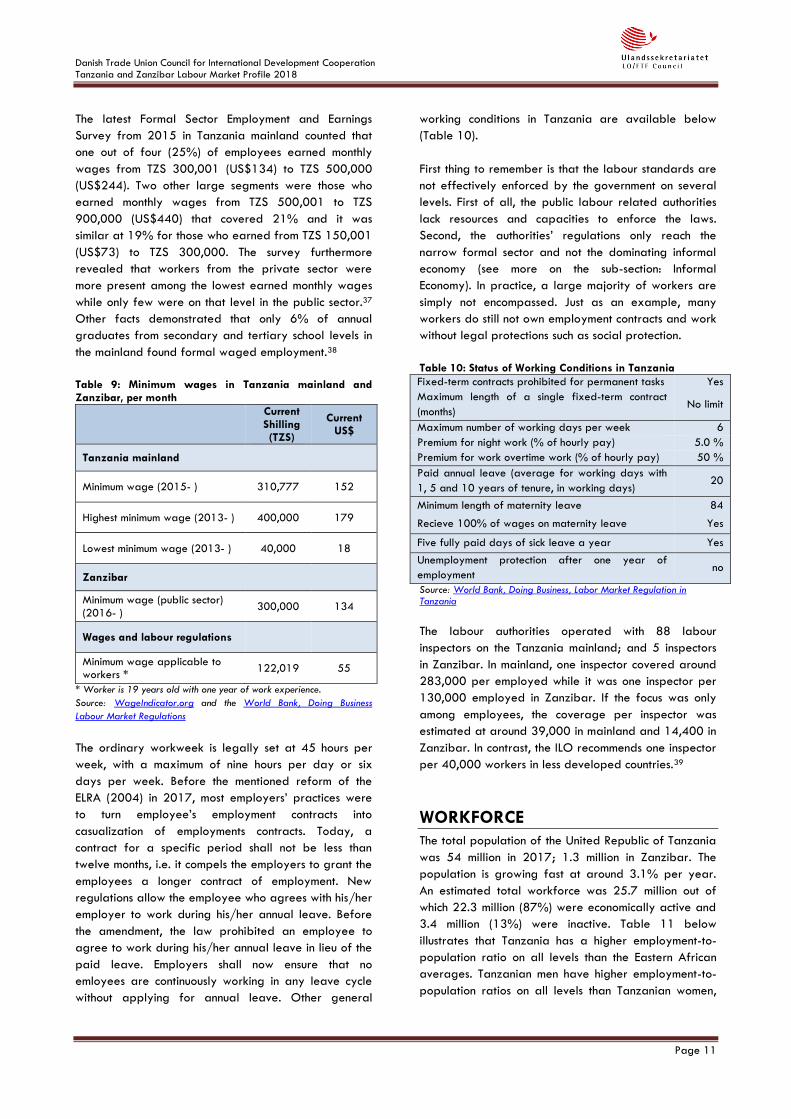
Danish Trade Union Council for International Development Cooperation Tanzania and Zanzibar Labour Market Profile 2018
Page 11
The latest Formal Sector Employment and Earnings
Survey from 2015 in Tanzania mainland counted that
one out of four (25%) of employees earned monthly
wages from TZS 300,001 (US$134) to TZS 500,000
(US$244). Two other large segments were those who
earned monthly wages from TZS 500,001 to TZS
900,000 (US$440) that covered 21% and it was
similar at 19% for those who earned from TZS 150,001
(US$73) to TZS 300,000. The survey furthermore
revealed that workers from the private sector were
more present among the lowest earned monthly wages
while only few were on that level in the public sector.37
Other facts demonstrated that only 6% of annual
graduates from secondary and tertiary school levels in
the mainland found formal waged employment.38
Table 9: Minimum wages in Tanzania mainland and Zanzibar, per month
Current Shilling (TZS)
Current US$
Tanzania mainland
Minimum wage (2015- ) 310,777 152
Highest minimum wage (2013- ) 400,000 179
Lowest minimum wage (2013- ) 40,000 18
Zanzibar
Minimum wage (public sector) (2016- )
300,000 134
Wages and labour regulations
Minimum wage applicable to workers *
122,019 55
* Worker is 19 years old with one year of work experience.
Source: WageIndicator.org and the World Bank, Doing Business
Labour Market Regulations
The ordinary workweek is legally set at 45 hours per
week, with a maximum of nine hours per day or six
days per week. Before the mentioned reform of the
ELRA (2004) in 2017, most employers’ practices were
to turn employee’s employment contracts into
casualization of employments contracts. Today, a
contract for a specific period shall not be less than
twelve months, i.e. it compels the employers to grant the
employees a longer contract of employment. New
regulations allow the employee who agrees with his/her
employer to work during his/her annual leave. Before
the amendment, the law prohibited an employee to
agree to work during his/her annual leave in lieu of the
paid leave. Employers shall now ensure that no
emloyees are continuously working in any leave cycle
without applying for annual leave. Other general
working conditions in Tanzania are available below
(Table 10).
First thing to remember is that the labour standards are
not effectively enforced by the government on several
levels. First of all, the public labour related authorities
lack resources and capacities to enforce the laws.
Second, the authorities’ regulations only reach the
narrow formal sector and not the dominating informal
economy (see more on the sub-section: Informal
Economy). In practice, a large majority of workers are
simply not encompassed. Just as an example, many
workers do still not own employment contracts and work
without legal protections such as social protection.
Table 10: Status of Working Conditions in Tanzania
Fixed-term contracts prohibited for permanent tasks Yes
Maximum length of a single fixed-term contract
(months) No limit
Maximum number of working days per week 6
Premium for night work (% of hourly pay) 5.0 %
Premium for work overtime work (% of hourly pay) 50 %
Paid annual leave (average for working days with
1, 5 and 10 years of tenure, in working days) 20
Minimum length of maternity leave 84
Recieve 100% of wages on maternity leave Yes
Five fully paid days of sick leave a year Yes
Unemployment protection after one year of
employment no
Source: World Bank, Doing Business, Labor Market Regulation in Tanzania
The labour authorities operated with 88 labour
inspectors on the Tanzania mainland; and 5 inspectors
in Zanzibar. In mainland, one inspector covered around
283,000 per employed while it was one inspector per
130,000 employed in Zanzibar. If the focus was only
among employees, the coverage per inspector was
estimated at around 39,000 in mainland and 14,400 in
Zanzibar. In contrast, the ILO recommends one inspector
per 40,000 workers in less developed countries.39
WORKFORCE
The total population of the United Republic of Tanzania
was 54 million in 2017; 1.3 million in Zanzibar. The
population is growing fast at around 3.1% per year.
An estimated total workforce was 25.7 million out of
which 22.3 million (87%) were economically active and
3.4 million (13%) were inactive. Table 11 below
illustrates that Tanzania has a higher employment-to-
population ratio on all levels than the Eastern African
averages. Tanzanian men have higher employment-to-
population ratios on all levels than Tanzanian women,
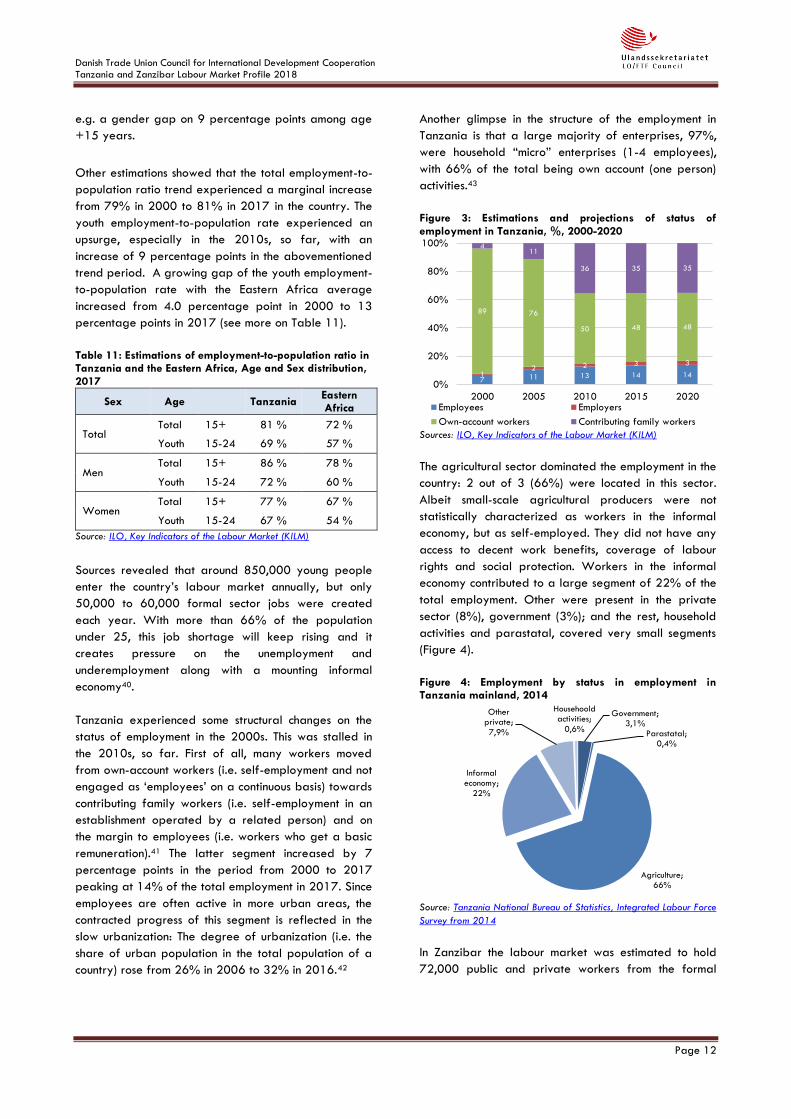
Danish Trade Union Council for International Development Cooperation Tanzania and Zanzibar Labour Market Profile 2018
Page 12
e.g. a gender gap on 9 percentage points among age
+15 years.
Other estimations showed that the total employment-to-
population ratio trend experienced a marginal increase
from 79% in 2000 to 81% in 2017 in the country. The
youth employment-to-population rate experienced an
upsurge, especially in the 2010s, so far, with an
increase of 9 percentage points in the abovementioned
trend period. A growing gap of the youth employment-
to-population rate with the Eastern Africa average
increased from 4.0 percentage point in 2000 to 13
percentage points in 2017 (see more on Table 11).
Table 11: Estimations of employment-to-population ratio in Tanzania and the Eastern Africa, Age and Sex distribution, 2017
Sex Age Tanzania Eastern Africa
Total Total 15+ 81 % 72 %
Youth 15-24 69 % 57 %
Men Total 15+ 86 % 78 %
Youth 15-24 72 % 60 %
Women Total 15+ 77 % 67 %
Youth 15-24 67 % 54 %
Source: ILO, Key Indicators of the Labour Market (KILM)
Sources revealed that around 850,000 young people
enter the country’s labour market annually, but only
50,000 to 60,000 formal sector jobs were created
each year. With more than 66% of the population
under 25, this job shortage will keep rising and it
creates pressure on the unemployment and
underemployment along with a mounting informal
economy40.
Tanzania experienced some structural changes on the
status of employment in the 2000s. This was stalled in
the 2010s, so far. First of all, many workers moved
from own-account workers (i.e. self-employment and not
engaged as ‘employees’ on a continuous basis) towards
contributing family workers (i.e. self-employment in an
establishment operated by a related person) and on
the margin to employees (i.e. workers who get a basic
remuneration).41 The latter segment increased by 7
percentage points in the period from 2000 to 2017
peaking at 14% of the total employment in 2017. Since
employees are often active in more urban areas, the
contracted progress of this segment is reflected in the
slow urbanization: The degree of urbanization (i.e. the
share of urban population in the total population of a
country) rose from 26% in 2006 to 32% in 2016.42
Another glimpse in the structure of the employment in
Tanzania is that a large majority of enterprises, 97%,
were household “micro” enterprises (1-4 employees),
with 66% of the total being own account (one person)
activities.43
Figure 3: Estimations and projections of status of employment in Tanzania, %, 2000-2020
Sources: ILO, Key Indicators of the Labour Market (KILM)
The agricultural sector dominated the employment in the
country: 2 out of 3 (66%) were located in this sector.
Albeit small-scale agricultural producers were not
statistically characterized as workers in the informal
economy, but as self-employed. They did not have any
access to decent work benefits, coverage of labour
rights and social protection. Workers in the informal
economy contributed to a large segment of 22% of the
total employment. Other were present in the private
sector (8%), government (3%); and the rest, household
activities and parastatal, covered very small segments
(Figure 4).
Figure 4: Employment by status in employment in Tanzania mainland, 2014
Source: Tanzania National Bureau of Statistics, Integrated Labour Force
Survey from 2014
In Zanzibar the labour market was estimated to hold
72,000 public and private workers from the formal
7 11 13 14 1412 2 3 3
89 76
50 48 48
411
36 35 35
0%
20%
40%
60%
80%
100%
2000 2005 2010 2015 2020Employees Employers
Own-account workers Contributing family workers
Government; 3,1%
Parastatal; 0,4%
Agriculture; 66%
Informal economy;
22%
Other private;
7,9%
Househoold activities;
0,6%
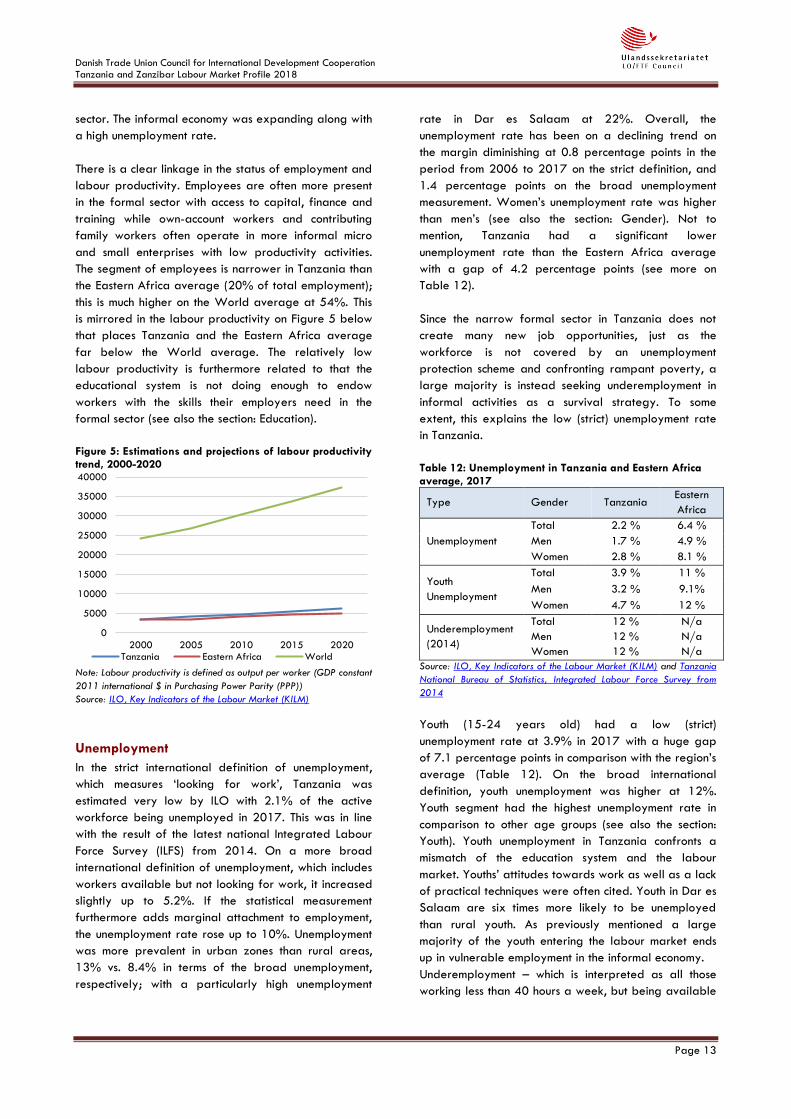
Danish Trade Union Council for International Development Cooperation Tanzania and Zanzibar Labour Market Profile 2018
Page 13
sector. The informal economy was expanding along with
a high unemployment rate.
There is a clear linkage in the status of employment and
labour productivity. Employees are often more present
in the formal sector with access to capital, finance and
training while own-account workers and contributing
family workers often operate in more informal micro
and small enterprises with low productivity activities.
The segment of employees is narrower in Tanzania than
the Eastern Africa average (20% of total employment);
this is much higher on the World average at 54%. This
is mirrored in the labour productivity on Figure 5 below
that places Tanzania and the Eastern Africa average
far below the World average. The relatively low
labour productivity is furthermore related to that the
educational system is not doing enough to endow
workers with the skills their employers need in the
formal sector (see also the section: Education).
Figure 5: Estimations and projections of labour productivity trend, 2000-2020
Note: Labour productivity is defined as output per worker (GDP constant
2011 international $ in Purchasing Power Parity (PPP))
Source: ILO, Key Indicators of the Labour Market (KILM)
Unemployment
In the strict international definition of unemployment,
which measures ‘looking for work’, Tanzania was
estimated very low by ILO with 2.1% of the active
workforce being unemployed in 2017. This was in line
with the result of the latest national Integrated Labour
Force Survey (ILFS) from 2014. On a more broad
international definition of unemployment, which includes
workers available but not looking for work, it increased
slightly up to 5.2%. If the statistical measurement
furthermore adds marginal attachment to employment,
the unemployment rate rose up to 10%. Unemployment
was more prevalent in urban zones than rural areas,
13% vs. 8.4% in terms of the broad unemployment,
respectively; with a particularly high unemployment
rate in Dar es Salaam at 22%. Overall, the
unemployment rate has been on a declining trend on
the margin diminishing at 0.8 percentage points in the
period from 2006 to 2017 on the strict definition, and
1.4 percentage points on the broad unemployment
measurement. Women’s unemployment rate was higher
than men’s (see also the section: Gender). Not to
mention, Tanzania had a significant lower
unemployment rate than the Eastern Africa average
with a gap of 4.2 percentage points (see more on
Table 12).
Since the narrow formal sector in Tanzania does not
create many new job opportunities, just as the
workforce is not covered by an unemployment
protection scheme and confronting rampant poverty, a
large majority is instead seeking underemployment in
informal activities as a survival strategy. To some
extent, this explains the low (strict) unemployment rate
in Tanzania.
Table 12: Unemployment in Tanzania and Eastern Africa average, 2017
Type Gender Tanzania Eastern
Africa
Unemployment
Total 2.2 % 6.4 %
Men 1.7 % 4.9 %
Women 2.8 % 8.1 %
Youth
Unemployment
Total 3.9 % 11 %
Men 3.2 % 9.1%
Women 4.7 % 12 %
Underemployment
(2014)
Total 12 % N/a
Men 12 % N/a
Women 12 % N/a
Source: ILO, Key Indicators of the Labour Market (KILM) and Tanzania
National Bureau of Statistics, Integrated Labour Force Survey from
2014
Youth (15-24 years old) had a low (strict)
unemployment rate at 3.9% in 2017 with a huge gap
of 7.1 percentage points in comparison with the region’s
average (Table 12). On the broad international
definition, youth unemployment was higher at 12%.
Youth segment had the highest unemployment rate in
comparison to other age groups (see also the section:
Youth). Youth unemployment in Tanzania confronts a
mismatch of the education system and the labour
market. Youths’ attitudes towards work as well as a lack
of practical techniques were often cited. Youth in Dar es
Salaam are six times more likely to be unemployed
than rural youth. As previously mentioned a large
majority of the youth entering the labour market ends
up in vulnerable employment in the informal economy.
Underemployment – which is interpreted as all those
working less than 40 hours a week, but being available
0
5000
10000
15000
20000
25000
30000
35000
40000
2000 2005 2010 2015 2020Tanzania Eastern Africa World
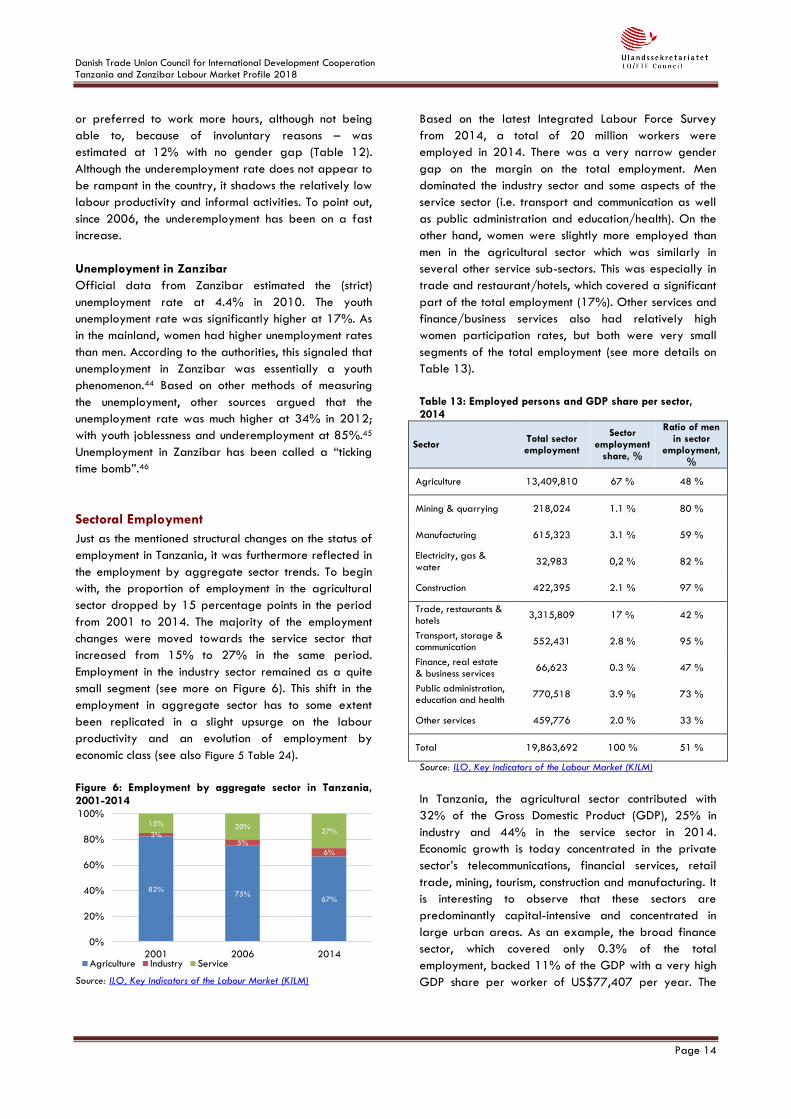
Danish Trade Union Council for International Development Cooperation Tanzania and Zanzibar Labour Market Profile 2018
Page 14
or preferred to work more hours, although not being
able to, because of involuntary reasons – was
estimated at 12% with no gender gap (Table 12).
Although the underemployment rate does not appear to
be rampant in the country, it shadows the relatively low
labour productivity and informal activities. To point out,
since 2006, the underemployment has been on a fast
increase.
Unemployment in Zanzibar
Official data from Zanzibar estimated the (strict)
unemployment rate at 4.4% in 2010. The youth
unemployment rate was significantly higher at 17%. As
in the mainland, women had higher unemployment rates
than men. According to the authorities, this signaled that
unemployment in Zanzibar was essentially a youth
phenomenon.44 Based on other methods of measuring
the unemployment, other sources argued that the
unemployment rate was much higher at 34% in 2012;
with youth joblessness and underemployment at 85%.45
Unemployment in Zanzibar has been called a “ticking
time bomb”.46
Sectoral Employment
Just as the mentioned structural changes on the status of
employment in Tanzania, it was furthermore reflected in
the employment by aggregate sector trends. To begin
with, the proportion of employment in the agricultural
sector dropped by 15 percentage points in the period
from 2001 to 2014. The majority of the employment
changes were moved towards the service sector that
increased from 15% to 27% in the same period.
Employment in the industry sector remained as a quite
small segment (see more on Figure 6). This shift in the
employment in aggregate sector has to some extent
been replicated in a slight upsurge on the labour
productivity and an evolution of employment by
economic class (see also Figure 5 Table 24).
Figure 6: Employment by aggregate sector in Tanzania, 2001-2014
Source: ILO, Key Indicators of the Labour Market (KILM)
Based on the latest Integrated Labour Force Survey
from 2014, a total of 20 million workers were
employed in 2014. There was a very narrow gender
gap on the margin on the total employment. Men
dominated the industry sector and some aspects of the
service sector (i.e. transport and communication as well
as public administration and education/health). On the
other hand, women were slightly more employed than
men in the agricultural sector which was similarly in
several other service sub-sectors. This was especially in
trade and restaurant/hotels, which covered a significant
part of the total employment (17%). Other services and
finance/business services also had relatively high
women participation rates, but both were very small
segments of the total employment (see more details on
Table 13).
Table 13: Employed persons and GDP share per sector, 2014
Sector Total sector employment
Sector employment
share, %
Ratio of men in sector
employment, %
Agriculture 13,409,810 67 % 48 %
Mining & quarrying 218,024 1.1 % 80 %
Manufacturing 615,323 3.1 % 59 %
Electricity, gas & water
32,983 0,2 % 82 %
Construction 422,395 2.1 % 97 %
Trade, restaurants & hotels
3,315,809 17 % 42 %
Transport, storage & communication
552,431 2.8 % 95 %
Finance, real estate & business services
66,623 0.3 % 47 %
Public administration, education and health
770,518 3.9 % 73 %
Other services 459,776 2.0 % 33 %
Total 19,863,692 100 % 51 %
Source: ILO, Key Indicators of the Labour Market (KILM)
In Tanzania, the agricultural sector contributed with
32% of the Gross Domestic Product (GDP), 25% in
industry and 44% in the service sector in 2014.
Economic growth is today concentrated in the private
sector’s telecommunications, financial services, retail
trade, mining, tourism, construction and manufacturing. It
is interesting to observe that these sectors are
predominantly capital-intensive and concentrated in
large urban areas. As an example, the broad finance
sector, which covered only 0.3% of the total
employment, backed 11% of the GDP with a very high
GDP share per worker of US$77,407 per year. The
82%75%
67%
3%5%
6%
15% 20%27%
0%
20%
40%
60%
80%
100%
2001 2006 2014Agriculture Industry Service
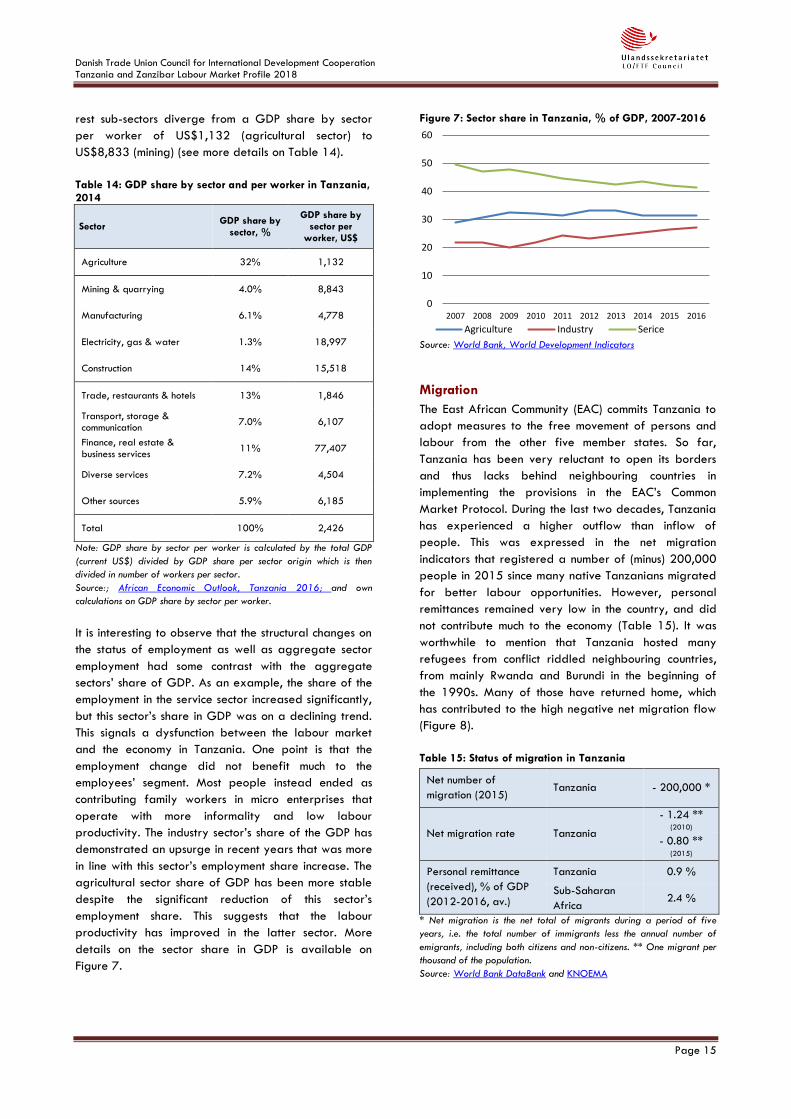
Danish Trade Union Council for International Development Cooperation Tanzania and Zanzibar Labour Market Profile 2018
Page 15
rest sub-sectors diverge from a GDP share by sector
per worker of US$1,132 (agricultural sector) to
US$8,833 (mining) (see more details on Table 14).
Table 14: GDP share by sector and per worker in Tanzania, 2014
Sector GDP share by
sector, %
GDP share by sector per
worker, US$
Agriculture 32% 1,132
Mining & quarrying 4.0% 8,843
Manufacturing 6.1% 4,778
Electricity, gas & water 1.3% 18,997
Construction 14% 15,518
Trade, restaurants & hotels 13% 1,846
Transport, storage & communication
7.0% 6,107
Finance, real estate & business services
11% 77,407
Diverse services 7.2% 4,504
Other sources 5.9% 6,185
Total 100% 2,426
Note: GDP share by sector per worker is calculated by the total GDP
(current US$) divided by GDP share per sector origin which is then
divided in number of workers per sector.
Source:; African Economic Outlook, Tanzania 2016; and own
calculations on GDP share by sector per worker.
It is interesting to observe that the structural changes on
the status of employment as well as aggregate sector
employment had some contrast with the aggregate
sectors’ share of GDP. As an example, the share of the
employment in the service sector increased significantly,
but this sector’s share in GDP was on a declining trend.
This signals a dysfunction between the labour market
and the economy in Tanzania. One point is that the
employment change did not benefit much to the
employees’ segment. Most people instead ended as
contributing family workers in micro enterprises that
operate with more informality and low labour
productivity. The industry sector’s share of the GDP has
demonstrated an upsurge in recent years that was more
in line with this sector’s employment share increase. The
agricultural sector share of GDP has been more stable
despite the significant reduction of this sector’s
employment share. This suggests that the labour
productivity has improved in the latter sector. More
details on the sector share in GDP is available on
Figure 7.
Figure 7: Sector share in Tanzania, % of GDP, 2007-2016
Source: World Bank, World Development Indicators
Migration
The East African Community (EAC) commits Tanzania to
adopt measures to the free movement of persons and
labour from the other five member states. So far,
Tanzania has been very reluctant to open its borders
and thus lacks behind neighbouring countries in
implementing the provisions in the EAC’s Common
Market Protocol. During the last two decades, Tanzania
has experienced a higher outflow than inflow of
people. This was expressed in the net migration
indicators that registered a number of (minus) 200,000
people in 2015 since many native Tanzanians migrated
for better labour opportunities. However, personal
remittances remained very low in the country, and did
not contribute much to the economy (Table 15). It was
worthwhile to mention that Tanzania hosted many
refugees from conflict riddled neighbouring countries,
from mainly Rwanda and Burundi in the beginning of
the 1990s. Many of those have returned home, which
has contributed to the high negative net migration flow
(Figure 8).
Table 15: Status of migration in Tanzania
Net number of
migration (2015) Tanzania - 200,000 *
Net migration rate Tanzania
- 1.24 ** (2010)
- 0.80 ** (2015)
Personal remittance
(received), % of GDP
(2012-2016, av.)
Tanzania 0.9 %
Sub-Saharan
Africa 2.4 %
* Net migration is the net total of migrants during a period of five
years, i.e. the total number of immigrants less the annual number of
emigrants, including both citizens and non-citizens. ** One migrant per
thousand of the population.
Source: World Bank DataBank and KNOEMA
0
10
20
30
40
50
60
2007 2008 2009 2010 2011 2012 2013 2014 2015 2016
Agriculture Industry Serice
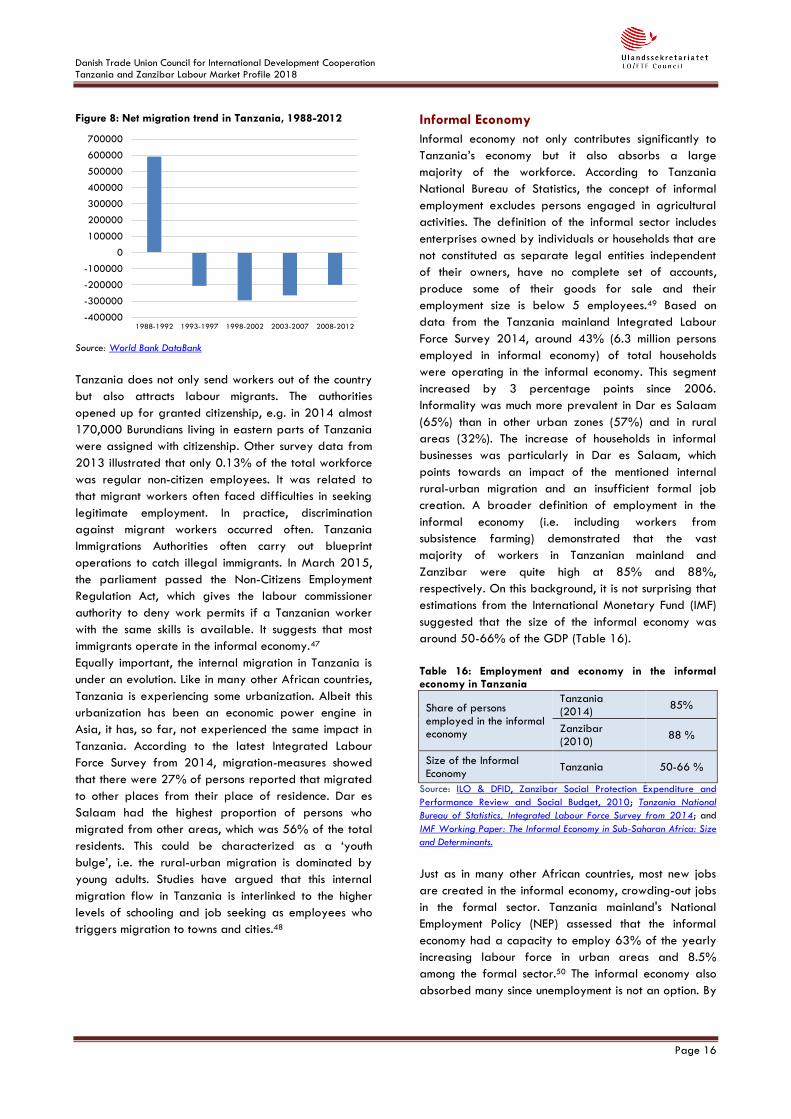
Danish Trade Union Council for International Development Cooperation Tanzania and Zanzibar Labour Market Profile 2018
Page 16
Figure 8: Net migration trend in Tanzania, 1988-2012
Source: World Bank DataBank
Tanzania does not only send workers out of the country
but also attracts labour migrants. The authorities
opened up for granted citizenship, e.g. in 2014 almost
170,000 Burundians living in eastern parts of Tanzania
were assigned with citizenship. Other survey data from
2013 illustrated that only 0.13% of the total workforce
was regular non-citizen employees. It was related to
that migrant workers often faced difficulties in seeking
legitimate employment. In practice, discrimination
against migrant workers occurred often. Tanzania
Immigrations Authorities often carry out blueprint
operations to catch illegal immigrants. In March 2015,
the parliament passed the Non-Citizens Employment
Regulation Act, which gives the labour commissioner
authority to deny work permits if a Tanzanian worker
with the same skills is available. It suggests that most
immigrants operate in the informal economy.47
Equally important, the internal migration in Tanzania is
under an evolution. Like in many other African countries,
Tanzania is experiencing some urbanization. Albeit this
urbanization has been an economic power engine in
Asia, it has, so far, not experienced the same impact in
Tanzania. According to the latest Integrated Labour
Force Survey from 2014, migration-measures showed
that there were 27% of persons reported that migrated
to other places from their place of residence. Dar es
Salaam had the highest proportion of persons who
migrated from other areas, which was 56% of the total
residents. This could be characterized as a ‘youth
bulge’, i.e. the rural-urban migration is dominated by
young adults. Studies have argued that this internal
migration flow in Tanzania is interlinked to the higher
levels of schooling and job seeking as employees who
triggers migration to towns and cities.48
Informal Economy
Informal economy not only contributes significantly to
Tanzania’s economy but it also absorbs a large
majority of the workforce. According to Tanzania
National Bureau of Statistics, the concept of informal
employment excludes persons engaged in agricultural
activities. The definition of the informal sector includes
enterprises owned by individuals or households that are
not constituted as separate legal entities independent
of their owners, have no complete set of accounts,
produce some of their goods for sale and their
employment size is below 5 employees.49 Based on
data from the Tanzania mainland Integrated Labour
Force Survey 2014, around 43% (6.3 million persons
employed in informal economy) of total households
were operating in the informal economy. This segment
increased by 3 percentage points since 2006.
Informality was much more prevalent in Dar es Salaam
(65%) than in other urban zones (57%) and in rural
areas (32%). The increase of households in informal
businesses was particularly in Dar es Salaam, which
points towards an impact of the mentioned internal
rural-urban migration and an insufficient formal job
creation. A broader definition of employment in the
informal economy (i.e. including workers from
subsistence farming) demonstrated that the vast
majority of workers in Tanzanian mainland and
Zanzibar were quite high at 85% and 88%,
respectively. On this background, it is not surprising that
estimations from the International Monetary Fund (IMF)
suggested that the size of the informal economy was
around 50-66% of the GDP (Table 16).
Table 16: Employment and economy in the informal economy in Tanzania
Share of persons employed in the informal economy
Tanzania (2014)
85%
Zanzibar (2010)
88 %
Size of the Informal Economy
Tanzania 50-66 %
Source: ILO & DFID, Zanzibar Social Protection Expenditure and
Performance Review and Social Budget, 2010; Tanzania National
Bureau of Statistics, Integrated Labour Force Survey from 2014; and
IMF Working Paper: The Informal Economy in Sub-Saharan Africa: Size
and Determinants.
Just as in many other African countries, most new jobs
are created in the informal economy, crowding-out jobs
in the formal sector. Tanzania mainland's National
Employment Policy (NEP) assessed that the informal
economy had a capacity to employ 63% of the yearly
increasing labour force in urban areas and 8.5%
among the formal sector.50 The informal economy also
absorbed many since unemployment is not an option. By
-400000
-300000
-200000
-100000
0
100000
200000
300000
400000
500000
600000
700000
1988-1992 1993-1997 1998-2002 2003-2007 2008-2012
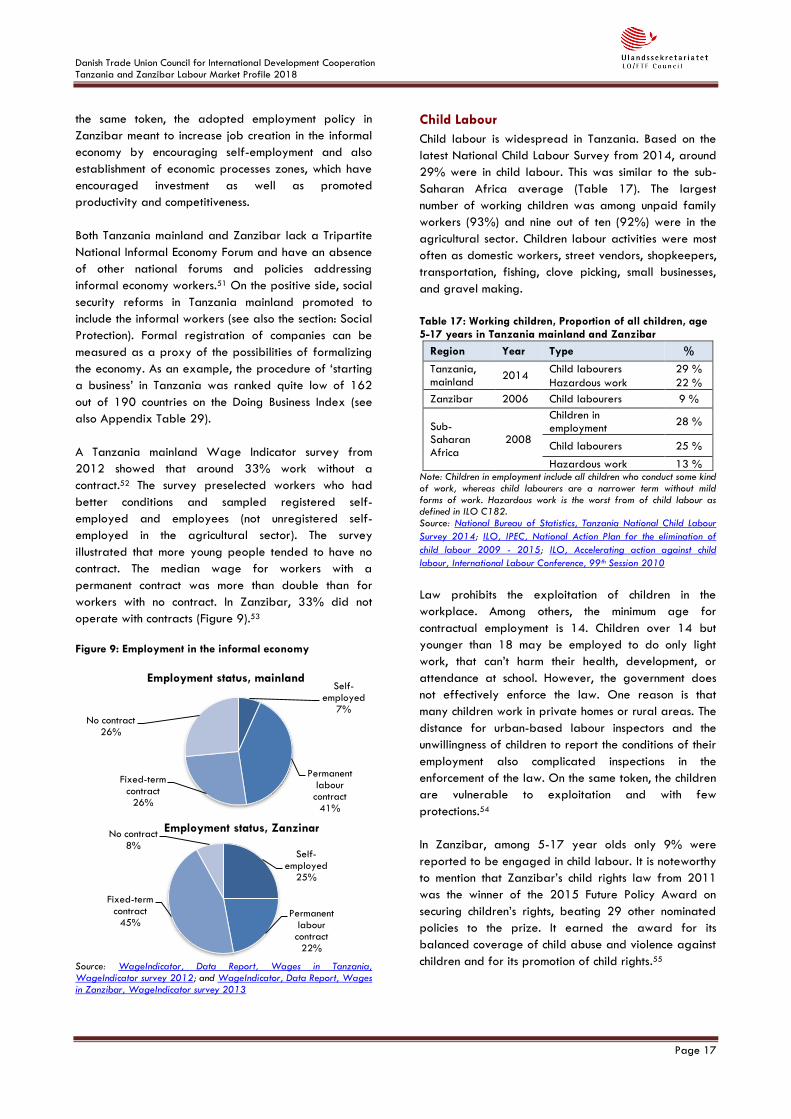
Danish Trade Union Council for International Development Cooperation Tanzania and Zanzibar Labour Market Profile 2018
Page 17
the same token, the adopted employment policy in
Zanzibar meant to increase job creation in the informal
economy by encouraging self-employment and also
establishment of economic processes zones, which have
encouraged investment as well as promoted
productivity and competitiveness.
Both Tanzania mainland and Zanzibar lack a Tripartite
National Informal Economy Forum and have an absence
of other national forums and policies addressing
informal economy workers.51 On the positive side, social
security reforms in Tanzania mainland promoted to
include the informal workers (see also the section: Social
Protection). Formal registration of companies can be
measured as a proxy of the possibilities of formalizing
the economy. As an example, the procedure of ‘starting
a business’ in Tanzania was ranked quite low of 162
out of 190 countries on the Doing Business Index (see
also Appendix Table 29).
A Tanzania mainland Wage Indicator survey from
2012 showed that around 33% work without a
contract.52 The survey preselected workers who had
better conditions and sampled registered self-
employed and employees (not unregistered self-
employed in the agricultural sector). The survey
illustrated that more young people tended to have no
contract. The median wage for workers with a
permanent contract was more than double than for
workers with no contract. In Zanzibar, 33% did not
operate with contracts (Figure 9).53
Figure 9: Employment in the informal economy
Source: WageIndicator, Data Report, Wages in Tanzania, WageIndicator survey 2012; and WageIndicator, Data Report, Wages in Zanzibar, WageIndicator survey 2013
Child Labour
Child labour is widespread in Tanzania. Based on the
latest National Child Labour Survey from 2014, around
29% were in child labour. This was similar to the sub-
Saharan Africa average (Table 17). The largest
number of working children was among unpaid family
workers (93%) and nine out of ten (92%) were in the
agricultural sector. Children labour activities were most
often as domestic workers, street vendors, shopkeepers,
transportation, fishing, clove picking, small businesses,
and gravel making.
Table 17: Working children, Proportion of all children, age 5-17 years in Tanzania mainland and Zanzibar
Region Year Type %
Tanzania, mainland
2014 Child labourers 29 %
Hazardous work 22 %
Zanzibar 2006 Child labourers 9 %
Sub-Saharan Africa
2008
Children in employment
28 %
Child labourers 25 %
Hazardous work 13 % Note: Children in employment include all children who conduct some kind of work, whereas child labourers are a narrower term without mild forms of work. Hazardous work is the worst from of child labour as defined in ILO C182. Source: National Bureau of Statistics, Tanzania National Child Labour
Survey 2014; ILO, IPEC, National Action Plan for the elimination of
child labour 2009 - 2015; ILO, Accelerating action against child
labour, International Labour Conference, 99th Session 2010
Law prohibits the exploitation of children in the
workplace. Among others, the minimum age for
contractual employment is 14. Children over 14 but
younger than 18 may be employed to do only light
work, that can’t harm their health, development, or
attendance at school. However, the government does
not effectively enforce the law. One reason is that
many children work in private homes or rural areas. The
distance for urban-based labour inspectors and the
unwillingness of children to report the conditions of their
employment also complicated inspections in the
enforcement of the law. On the same token, the children
are vulnerable to exploitation and with few
protections.54
In Zanzibar, among 5-17 year olds only 9% were
reported to be engaged in child labour. It is noteworthy
to mention that Zanzibar’s child rights law from 2011
was the winner of the 2015 Future Policy Award on
securing children’s rights, beating 29 other nominated
policies to the prize. It earned the award for its
balanced coverage of child abuse and violence against
children and for its promotion of child rights.55
Self-employed
7%
Permanent labour contract
41%
Fixed-term contract
26%
No contract26%
Employment status, mainland
Self-employed
25%
Permanent labour contract
22%
Fixed-term contract
45%
No contract8%
Employment status, Zanzinar
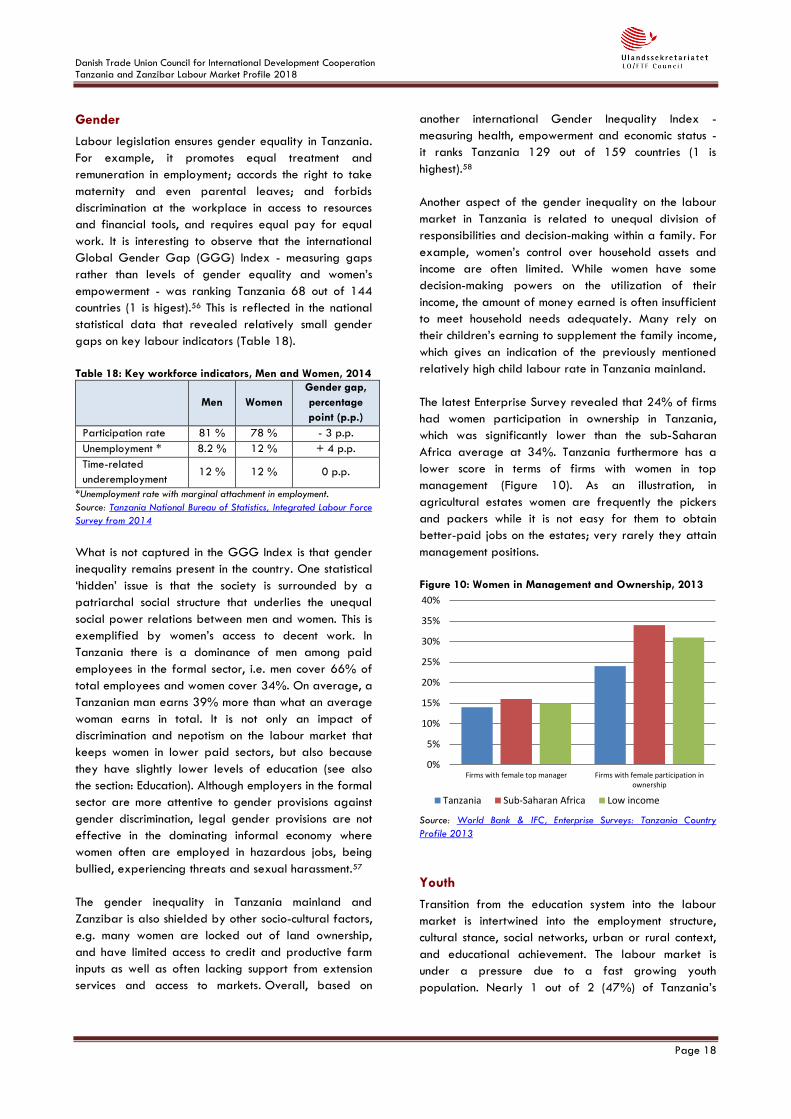
Danish Trade Union Council for International Development Cooperation Tanzania and Zanzibar Labour Market Profile 2018
Page 18
Gender
Labour legislation ensures gender equality in Tanzania.
For example, it promotes equal treatment and
remuneration in employment; accords the right to take
maternity and even parental leaves; and forbids
discrimination at the workplace in access to resources
and financial tools, and requires equal pay for equal
work. It is interesting to observe that the international
Global Gender Gap (GGG) Index - measuring gaps
rather than levels of gender equality and women’s
empowerment - was ranking Tanzania 68 out of 144
countries (1 is higest).56 This is reflected in the national
statistical data that revealed relatively small gender
gaps on key labour indicators (Table 18).
Table 18: Key workforce indicators, Men and Women, 2014
Men Women
Gender gap,
percentage
point (p.p.)
Participation rate 81 % 78 % - 3 p.p.
Unemployment * 8.2 % 12 % + 4 p.p.
Time-related
underemployment 12 % 12 % 0 p.p.
*Unemployment rate with marginal attachment in employment.
Source: Tanzania National Bureau of Statistics, Integrated Labour Force
Survey from 2014
What is not captured in the GGG Index is that gender
inequality remains present in the country. One statistical
‘hidden’ issue is that the society is surrounded by a
patriarchal social structure that underlies the unequal
social power relations between men and women. This is
exemplified by women’s access to decent work. In
Tanzania there is a dominance of men among paid
employees in the formal sector, i.e. men cover 66% of
total employees and women cover 34%. On average, a
Tanzanian man earns 39% more than what an average
woman earns in total. It is not only an impact of
discrimination and nepotism on the labour market that
keeps women in lower paid sectors, but also because
they have slightly lower levels of education (see also
the section: Education). Although employers in the formal
sector are more attentive to gender provisions against
gender discrimination, legal gender provisions are not
effective in the dominating informal economy where
women often are employed in hazardous jobs, being
bullied, experiencing threats and sexual harassment.57
The gender inequality in Tanzania mainland and
Zanzibar is also shielded by other socio-cultural factors,
e.g. many women are locked out of land ownership,
and have limited access to credit and productive farm
inputs as well as often lacking support from extension
services and access to markets. Overall, based on
another international Gender Inequality Index -
measuring health, empowerment and economic status -
it ranks Tanzania 129 out of 159 countries (1 is
highest).58
Another aspect of the gender inequality on the labour
market in Tanzania is related to unequal division of
responsibilities and decision-making within a family. For
example, women’s control over household assets and
income are often limited. While women have some
decision-making powers on the utilization of their
income, the amount of money earned is often insufficient
to meet household needs adequately. Many rely on
their children’s earning to supplement the family income,
which gives an indication of the previously mentioned
relatively high child labour rate in Tanzania mainland.
The latest Enterprise Survey revealed that 24% of firms
had women participation in ownership in Tanzania,
which was significantly lower than the sub-Saharan
Africa average at 34%. Tanzania furthermore has a
lower score in terms of firms with women in top
management (Figure 10). As an illustration, in
agricultural estates women are frequently the pickers
and packers while it is not easy for them to obtain
better-paid jobs on the estates; very rarely they attain
management positions.
Figure 10: Women in Management and Ownership, 2013
Source: World Bank & IFC, Enterprise Surveys: Tanzania Country
Profile 2013
Youth
Transition from the education system into the labour
market is intertwined into the employment structure,
cultural stance, social networks, urban or rural context,
and educational achievement. The labour market is
under a pressure due to a fast growing youth
population. Nearly 1 out of 2 (47%) of Tanzania’s
0%
5%
10%
15%
20%
25%
30%
35%
40%
Firms with female top manager Firms with female participation inownership
Tanzania Sub-Saharan Africa Low income
Danish Trade Union Council for International Development Cooperation Tanzania and Zanzibar Labour Market Profile 2018
Page 19
population is under 15 years of age. A youth boom is
thus expected to rise in the upcoming years.
In Tanzania mainland, youth was statistically defined as
persons who are 15 to 35 years of age. There is a total
youth population of 15 million persons; of whom 13
million (85%) were economically active and 2.3 million
(16%) were economically inactive. Out of the
economically active youth population, 11 million (88%)
persons were employed and 1.5 million (12%) were
unemployed.59 When comparing the youth
unemployment rate between men and women, the latter
outnumbers the former with a percentage point gender
gap of 5. Similarly, young women have a much higher
Not in Employment or in Education and Training (NEET)
rate than men, which is part of the previously mentioned
patriarchal social structures, still evident in the country
(see more on Table 19 below).
The youth often has limited options available in the
formal sector. Data from the Integrated Labour Force
Survey 2014 revealed that only 16% of youth were
paid employees while a large majority were in unpaid
family helpers in agriculture (45%), work on own farm
in agriculture (19%), and self-employed in non-
agriculture without employees (15%). After all, young
people were rarely found in professional jobs as
managers, professionals or technicians.60 The private
sector employs slightly more young people than the
public sector.61 Since paid employment in rural areas is
limited, it pushes an increasing rural-urban migration of
young people. This is not met by supply of formal jobs
and it explains the fast increase of contributing family
workers among youth (see also Figure 4).
Table 19: Youth population in employment, unemployment and NEET in Tanzania mainland, % and gender gap, 2014
Men Women
Gender gap,
percentage
point (p.p.)
Employment
participation rate * 78 % 76 % - 2 p.p.
Youth unemployment * 7.0 % 12 % + 5 p.p.
Not in employment
(NEET) ** 12 % 21 % + 9 p.p.
*Age group: 15-24. ** Not in employment or in education and training
(NEET).
Source: Tanzania National Bureau of Statistics, Integrated Labour Force
Survey from 2014
Sources have demonstrated that Zanzibar’s youth tend
to be slightly better educated than the mainland’s. In
contrast, the former are less likely to be employed than
the latter along with higher unemployment rates. The
agriculture and tourism sectors are the primary
industries employing youth in Zanzibar.62
EDUCATION
A way to measure the education system’s influence of
employability is through the education attainment levels.
According to the available data, 30% (4.4 million) of
children were not attending school and the population
has 5 years’ education attainment on average.63 Many
children are not in education which explains the high
child labour rate. Likewise, the relatively low education
attainment reduces workers’ labour skill capacity level
that turn into a lower labour productivity.
Based on the Basic Education Master Plan, the
Tanzanian government aimed to achieve universal
access to basic education for children over the age of 7
years and ensures that at least 80% of children
complete primary education. On this background, the
government promoted free and compulsory primary
education since 2001. Net enrolment in primary schools
increased fast during the 2000s, peaking at 95% for
both boys and girls in 2008. However, this enrolment
rate started to fall afterwards dropping down to an
80% average in 2014. It was more in line with the sub-
Saharan Africa average rate for boys while Tanzanian
girls were still on a relatively higher enrolment rate
(Figure 11).
To tackle youth unemployment, free education was re-
introduced in Tanzania in 2017, at pre-primary,
primary and ordinary level of the secondary education.
However, in recent years in Tanzania mainland, there
has been a lack of replacement of public sector retiring
teachers, terminated ‘ghost’ teachers and teachers
caught up with fake academic and professional
certificates. This furthermore happened for employees
in other public sectors as an impact of a thorough audit
of employees prior to a vast move for replacements.
However, this placed the government and other
stakeholders in a challenging position to ensure that
there was a corresponding improvement of the
education infrastructure, a manageable teachers’
workload, an increase of study materials/equipment,
quality assurance strategies and resources. To some
extent this situation was reflected in the declining net
enrolment in primary education. As an example, the
influx of students was not equalled by an expansion of
teachers and schools’ facilities constrained the
educational system. This included low teaching time,
weak performance incentives for teachers, delayed or
insufficient resource flows to schools and absence of
student assessments in early grades64.
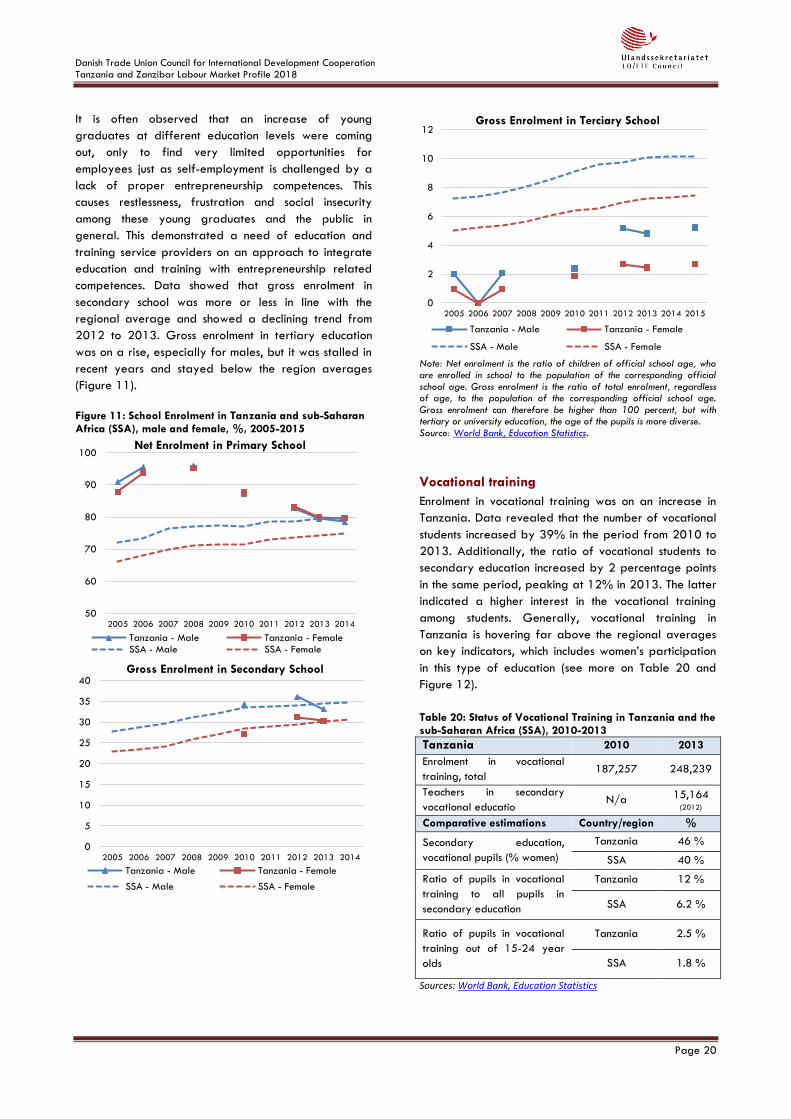
Danish Trade Union Council for International Development Cooperation Tanzania and Zanzibar Labour Market Profile 2018
Page 20
It is often observed that an increase of young
graduates at different education levels were coming
out, only to find very limited opportunities for
employees just as self-employment is challenged by a
lack of proper entrepreneurship competences. This
causes restlessness, frustration and social insecurity
among these young graduates and the public in
general. This demonstrated a need of education and
training service providers on an approach to integrate
education and training with entrepreneurship related
competences. Data showed that gross enrolment in
secondary school was more or less in line with the
regional average and showed a declining trend from
2012 to 2013. Gross enrolment in tertiary education
was on a rise, especially for males, but it was stalled in
recent years and stayed below the region averages
(Figure 11).
Figure 11: School Enrolment in Tanzania and sub-Saharan Africa (SSA), male and female, %, 2005-2015
Note: Net enrolment is the ratio of children of official school age, who are enrolled in school to the population of the corresponding official school age. Gross enrolment is the ratio of total enrolment, regardless of age, to the population of the corresponding official school age. Gross enrolment can therefore be higher than 100 percent, but with tertiary or university education, the age of the pupils is more diverse. Source: World Bank, Education Statistics.
Vocational training
Enrolment in vocational training was on an increase in
Tanzania. Data revealed that the number of vocational
students increased by 39% in the period from 2010 to
2013. Additionally, the ratio of vocational students to
secondary education increased by 2 percentage points
in the same period, peaking at 12% in 2013. The latter
indicated a higher interest in the vocational training
among students. Generally, vocational training in
Tanzania is hovering far above the regional averages
on key indicators, which includes women’s participation
in this type of education (see more on Table 20 and
Figure 12).
Table 20: Status of Vocational Training in Tanzania and the sub-Saharan Africa (SSA), 2010-2013
Tanzania 2010 2013
Enrolment in vocational
training, total 187,257 248,239
Teachers in secondary
vocational educatio N/a 15,164
(2012)
Comparative estimations Country/region %
Secondary education,
vocational pupils (% women)
Tanzania 46 %
SSA 40 %
Ratio of pupils in vocational
training to all pupils in
secondary education
Tanzania 12 %
SSA 6.2 %
Ratio of pupils in vocational
training out of 15-24 year
olds
Tanzania 2.5 %
SSA 1.8 %
Sources: World Bank, Education Statistics
50
60
70
80
90
100
2005 2006 2007 2008 2009 2010 2011 2012 2013 2014
Net Enrolment in Primary School
Tanzania - Male Tanzania - FemaleSSA - Male SSA - Female
0
5
10
15
20
25
30
35
40
2005 2006 2007 2008 2009 2010 2011 2012 2013 2014
Gross Enrolment in Secondary School
Tanzania - Male Tanzania - Female
SSA - Male SSA - Female
0
2
4
6
8
10
12
2005 2006 2007 2008 2009 2010 2011 2012 2013 2014 2015
Gross Enrolment in Terciary School
Tanzania - Male Tanzania - Female
SSA - Male SSA - Female
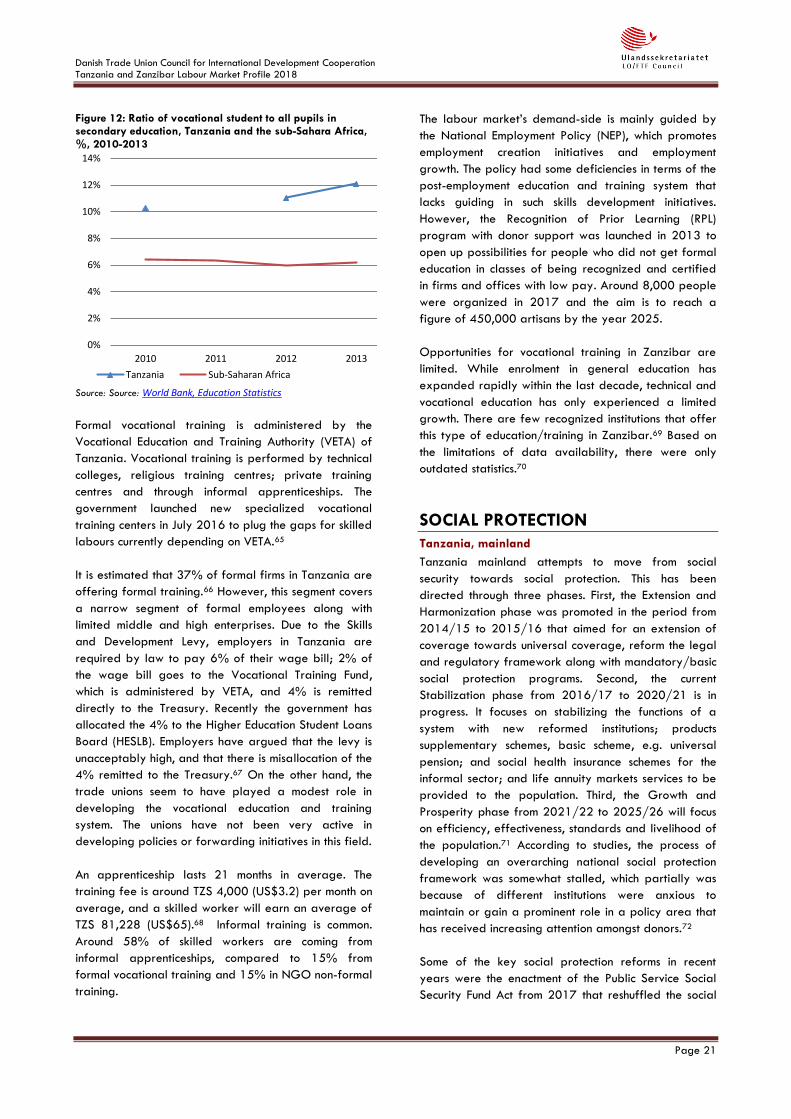
Danish Trade Union Council for International Development Cooperation Tanzania and Zanzibar Labour Market Profile 2018
Page 21
Figure 12: Ratio of vocational student to all pupils in secondary education, Tanzania and the sub-Sahara Africa, %, 2010-2013
Source: Source: World Bank, Education Statistics
Formal vocational training is administered by the
Vocational Education and Training Authority (VETA) of
Tanzania. Vocational training is performed by technical
colleges, religious training centres; private training
centres and through informal apprenticeships. The
government launched new specialized vocational
training centers in July 2016 to plug the gaps for skilled
labours currently depending on VETA.65
It is estimated that 37% of formal firms in Tanzania are
offering formal training.66 However, this segment covers
a narrow segment of formal employees along with
limited middle and high enterprises. Due to the Skills
and Development Levy, employers in Tanzania are
required by law to pay 6% of their wage bill; 2% of
the wage bill goes to the Vocational Training Fund,
which is administered by VETA, and 4% is remitted
directly to the Treasury. Recently the government has
allocated the 4% to the Higher Education Student Loans
Board (HESLB). Employers have argued that the levy is
unacceptably high, and that there is misallocation of the
4% remitted to the Treasury.67 On the other hand, the
trade unions seem to have played a modest role in
developing the vocational education and training
system. The unions have not been very active in
developing policies or forwarding initiatives in this field.
An apprenticeship lasts 21 months in average. The
training fee is around TZS 4,000 (US$3.2) per month on
average, and a skilled worker will earn an average of
TZS 81,228 (US$65).68 Informal training is common.
Around 58% of skilled workers are coming from
informal apprenticeships, compared to 15% from
formal vocational training and 15% in NGO non-formal
training.
The labour market’s demand-side is mainly guided by
the National Employment Policy (NEP), which promotes
employment creation initiatives and employment
growth. The policy had some deficiencies in terms of the
post-employment education and training system that
lacks guiding in such skills development initiatives.
However, the Recognition of Prior Learning (RPL)
program with donor support was launched in 2013 to
open up possibilities for people who did not get formal
education in classes of being recognized and certified
in firms and offices with low pay. Around 8,000 people
were organized in 2017 and the aim is to reach a
figure of 450,000 artisans by the year 2025.
Opportunities for vocational training in Zanzibar are
limited. While enrolment in general education has
expanded rapidly within the last decade, technical and
vocational education has only experienced a limited
growth. There are few recognized institutions that offer
this type of education/training in Zanzibar.69 Based on
the limitations of data availability, there were only
outdated statistics.70
SOCIAL PROTECTION
Tanzania, mainland
Tanzania mainland attempts to move from social
security towards social protection. This has been
directed through three phases. First, the Extension and
Harmonization phase was promoted in the period from
2014/15 to 2015/16 that aimed for an extension of
coverage towards universal coverage, reform the legal
and regulatory framework along with mandatory/basic
social protection programs. Second, the current
Stabilization phase from 2016/17 to 2020/21 is in
progress. It focuses on stabilizing the functions of a
system with new reformed institutions; products
supplementary schemes, basic scheme, e.g. universal
pension; and social health insurance schemes for the
informal sector; and life annuity markets services to be
provided to the population. Third, the Growth and
Prosperity phase from 2021/22 to 2025/26 will focus
on efficiency, effectiveness, standards and livelihood of
the population.71 According to studies, the process of
developing an overarching national social protection
framework was somewhat stalled, which partially was
because of different institutions were anxious to
maintain or gain a prominent role in a policy area that
has received increasing attention amongst donors.72
Some of the key social protection reforms in recent
years were the enactment of the Public Service Social
Security Fund Act from 2017 that reshuffled the social
0%
2%
4%
6%
8%
10%
12%
14%
2010 2011 2012 2013
Tanzania Sub-Saharan Africa
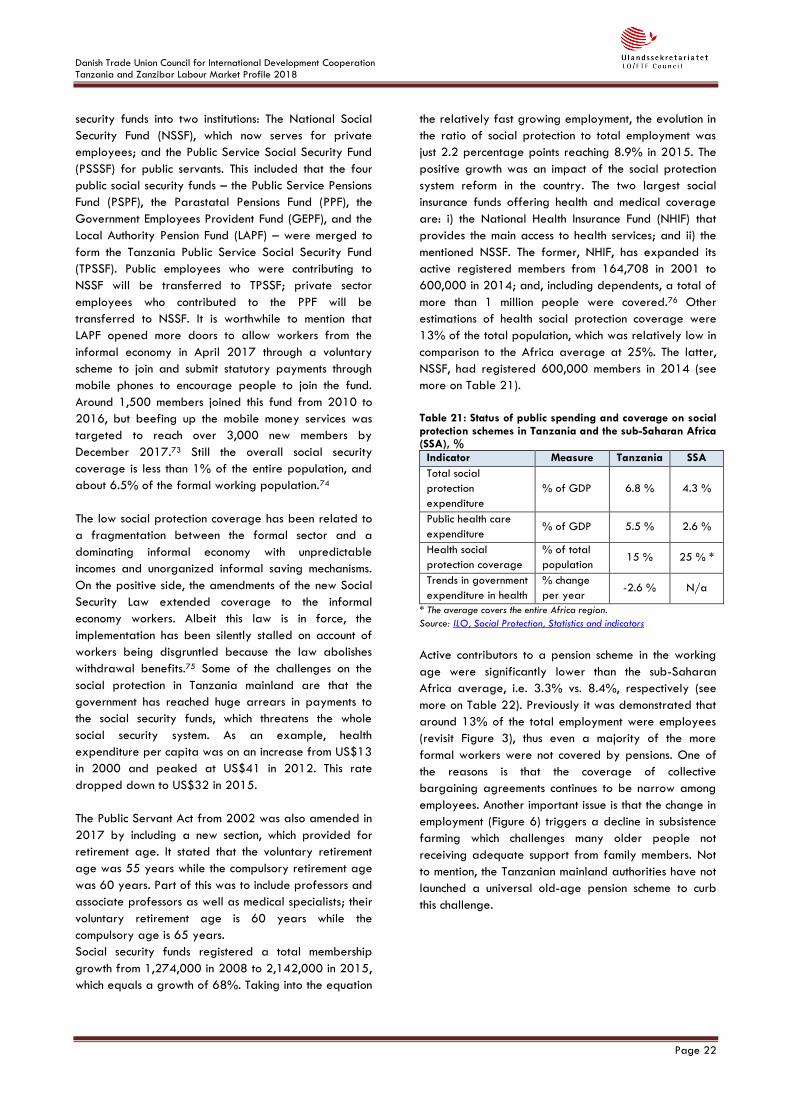
Danish Trade Union Council for International Development Cooperation Tanzania and Zanzibar Labour Market Profile 2018
Page 22
security funds into two institutions: The National Social
Security Fund (NSSF), which now serves for private
employees; and the Public Service Social Security Fund
(PSSSF) for public servants. This included that the four
public social security funds – the Public Service Pensions
Fund (PSPF), the Parastatal Pensions Fund (PPF), the
Government Employees Provident Fund (GEPF), and the
Local Authority Pension Fund (LAPF) – were merged to
form the Tanzania Public Service Social Security Fund
(TPSSF). Public employees who were contributing to
NSSF will be transferred to TPSSF; private sector
employees who contributed to the PPF will be
transferred to NSSF. It is worthwhile to mention that
LAPF opened more doors to allow workers from the
informal economy in April 2017 through a voluntary
scheme to join and submit statutory payments through
mobile phones to encourage people to join the fund.
Around 1,500 members joined this fund from 2010 to
2016, but beefing up the mobile money services was
targeted to reach over 3,000 new members by
December 2017.73 Still the overall social security
coverage is less than 1% of the entire population, and
about 6.5% of the formal working population.74
The low social protection coverage has been related to
a fragmentation between the formal sector and a
dominating informal economy with unpredictable
incomes and unorganized informal saving mechanisms.
On the positive side, the amendments of the new Social
Security Law extended coverage to the informal
economy workers. Albeit this law is in force, the
implementation has been silently stalled on account of
workers being disgruntled because the law abolishes
withdrawal benefits.75 Some of the challenges on the
social protection in Tanzania mainland are that the
government has reached huge arrears in payments to
the social security funds, which threatens the whole
social security system. As an example, health
expenditure per capita was on an increase from US$13
in 2000 and peaked at US$41 in 2012. This rate
dropped down to US$32 in 2015.
The Public Servant Act from 2002 was also amended in
2017 by including a new section, which provided for
retirement age. It stated that the voluntary retirement
age was 55 years while the compulsory retirement age
was 60 years. Part of this was to include professors and
associate professors as well as medical specialists; their
voluntary retirement age is 60 years while the
compulsory age is 65 years.
Social security funds registered a total membership
growth from 1,274,000 in 2008 to 2,142,000 in 2015,
which equals a growth of 68%. Taking into the equation
the relatively fast growing employment, the evolution in
the ratio of social protection to total employment was
just 2.2 percentage points reaching 8.9% in 2015. The
positive growth was an impact of the social protection
system reform in the country. The two largest social
insurance funds offering health and medical coverage
are: i) the National Health Insurance Fund (NHIF) that
provides the main access to health services; and ii) the
mentioned NSSF. The former, NHIF, has expanded its
active registered members from 164,708 in 2001 to
600,000 in 2014; and, including dependents, a total of
more than 1 million people were covered.76 Other
estimations of health social protection coverage were
13% of the total population, which was relatively low in
comparison to the Africa average at 25%. The latter,
NSSF, had registered 600,000 members in 2014 (see
more on Table 21).
Table 21: Status of public spending and coverage on social protection schemes in Tanzania and the sub-Saharan Africa (SSA), %
Indicator Measure Tanzania SSA
Total social
protection
expenditure
% of GDP 6.8 % 4.3 %
Public health care
expenditure % of GDP 5.5 % 2.6 %
Health social
protection coverage
% of total
population 15 % 25 % *
Trends in government
expenditure in health
% change
per year -2.6 % N/a
* The average covers the entire Africa region.
Source: ILO, Social Protection, Statistics and indicators
Active contributors to a pension scheme in the working
age were significantly lower than the sub-Saharan
Africa average, i.e. 3.3% vs. 8.4%, respectively (see
more on Table 22). Previously it was demonstrated that
around 13% of the total employment were employees
(revisit Figure 3), thus even a majority of the more
formal workers were not covered by pensions. One of
the reasons is that the coverage of collective
bargaining agreements continues to be narrow among
employees. Another important issue is that the change in
employment (Figure 6) triggers a decline in subsistence
farming which challenges many older people not
receiving adequate support from family members. Not
to mention, the Tanzanian mainland authorities have not
launched a universal old-age pension scheme to curb
this challenge.
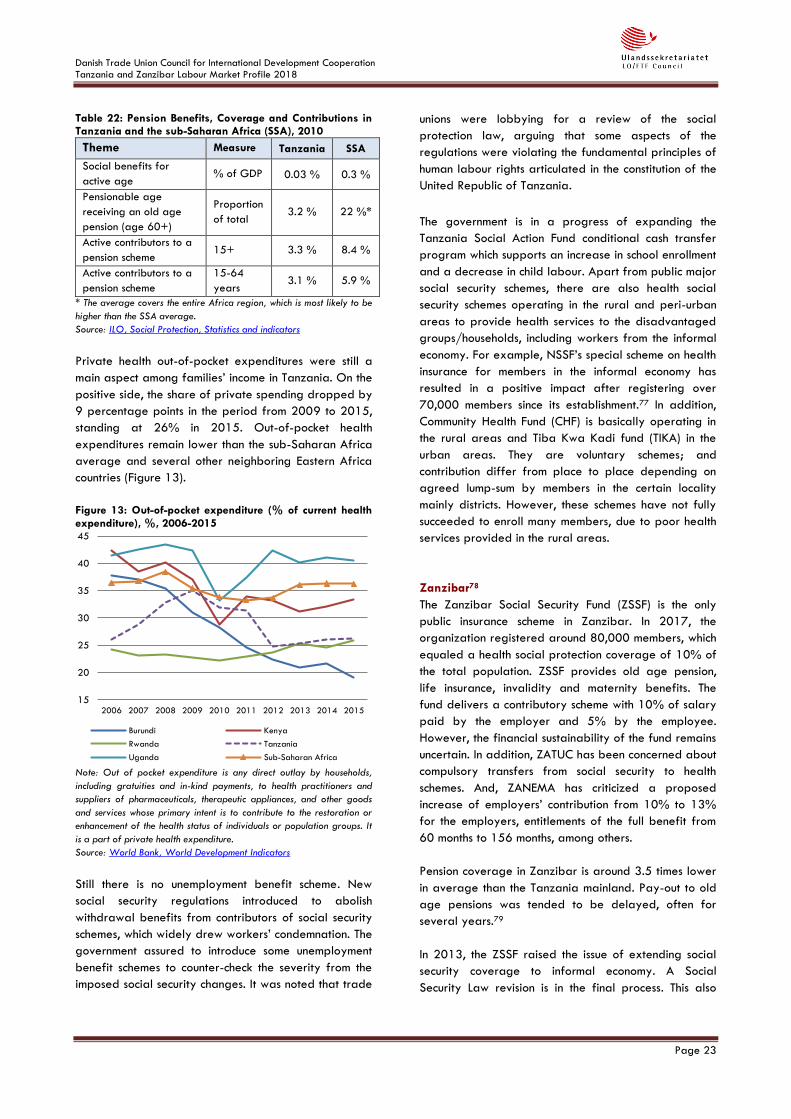
Danish Trade Union Council for International Development Cooperation Tanzania and Zanzibar Labour Market Profile 2018
Page 23
Table 22: Pension Benefits, Coverage and Contributions in Tanzania and the sub-Saharan Africa (SSA), 2010
Theme Measure Tanzania SSA
Social benefits for
active age % of GDP 0.03 % 0.3 %
Pensionable age
receiving an old age
pension (age 60+)
Proportion
of total 3.2 % 22 %*
Active contributors to a
pension scheme 15+ 3.3 % 8.4 %
Active contributors to a
pension scheme
15-64
years 3.1 % 5.9 %
* The average covers the entire Africa region, which is most likely to be
higher than the SSA average.
Source: ILO, Social Protection, Statistics and indicators
Private health out-of-pocket expenditures were still a
main aspect among families’ income in Tanzania. On the
positive side, the share of private spending dropped by
9 percentage points in the period from 2009 to 2015,
standing at 26% in 2015. Out-of-pocket health
expenditures remain lower than the sub-Saharan Africa
average and several other neighboring Eastern Africa
countries (Figure 13).
Figure 13: Out-of-pocket expenditure (% of current health expenditure), %, 2006-2015
Note: Out of pocket expenditure is any direct outlay by households,
including gratuities and in-kind payments, to health practitioners and
suppliers of pharmaceuticals, therapeutic appliances, and other goods
and services whose primary intent is to contribute to the restoration or
enhancement of the health status of individuals or population groups. It
is a part of private health expenditure.
Source: World Bank, World Development Indicators
Still there is no unemployment benefit scheme. New
social security regulations introduced to abolish
withdrawal benefits from contributors of social security
schemes, which widely drew workers’ condemnation. The
government assured to introduce some unemployment
benefit schemes to counter-check the severity from the
imposed social security changes. It was noted that trade
unions were lobbying for a review of the social
protection law, arguing that some aspects of the
regulations were violating the fundamental principles of
human labour rights articulated in the constitution of the
United Republic of Tanzania.
The government is in a progress of expanding the
Tanzania Social Action Fund conditional cash transfer
program which supports an increase in school enrollment
and a decrease in child labour. Apart from public major
social security schemes, there are also health social
security schemes operating in the rural and peri-urban
areas to provide health services to the disadvantaged
groups/households, including workers from the informal
economy. For example, NSSF’s special scheme on health
insurance for members in the informal economy has
resulted in a positive impact after registering over
70,000 members since its establishment.77 In addition,
Community Health Fund (CHF) is basically operating in
the rural areas and Tiba Kwa Kadi fund (TIKA) in the
urban areas. They are voluntary schemes; and
contribution differ from place to place depending on
agreed lump-sum by members in the certain locality
mainly districts. However, these schemes have not fully
succeeded to enroll many members, due to poor health
services provided in the rural areas.
Zanzibar78
The Zanzibar Social Security Fund (ZSSF) is the only
public insurance scheme in Zanzibar. In 2017, the
organization registered around 80,000 members, which
equaled a health social protection coverage of 10% of
the total population. ZSSF provides old age pension,
life insurance, invalidity and maternity benefits. The
fund delivers a contributory scheme with 10% of salary
paid by the employer and 5% by the employee.
However, the financial sustainability of the fund remains
uncertain. In addition, ZATUC has been concerned about
compulsory transfers from social security to health
schemes. And, ZANEMA has criticized a proposed
increase of employers’ contribution from 10% to 13%
for the employers, entitlements of the full benefit from
60 months to 156 months, among others.
Pension coverage in Zanzibar is around 3.5 times lower
in average than the Tanzania mainland. Pay-out to old
age pensions was tended to be delayed, often for
several years.79
In 2013, the ZSSF raised the issue of extending social
security coverage to informal economy. A Social
Security Law revision is in the final process. This also
15
20
25
30
35
40
45
2006 2007 2008 2009 2010 2011 2012 2013 2014 2015
Burundi Kenya
Rwanda Tanzania
Uganda Sub-Saharan Africa
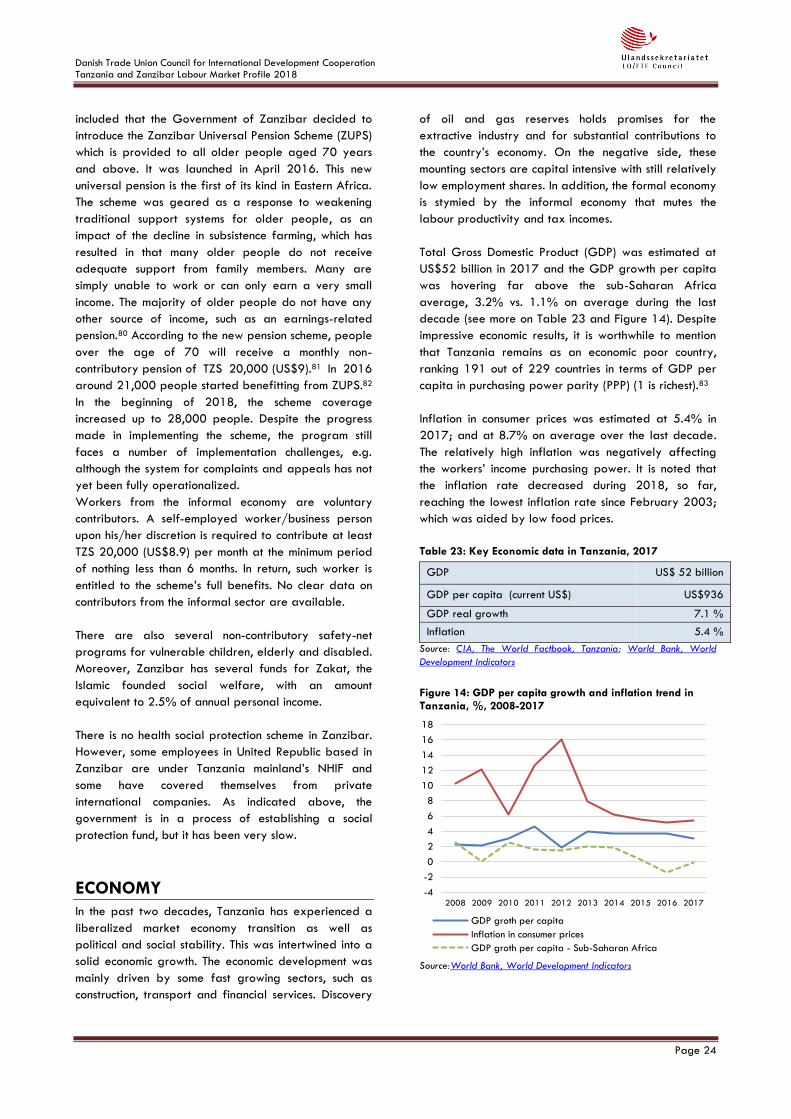
Danish Trade Union Council for International Development Cooperation Tanzania and Zanzibar Labour Market Profile 2018
Page 24
included that the Government of Zanzibar decided to
introduce the Zanzibar Universal Pension Scheme (ZUPS)
which is provided to all older people aged 70 years
and above. It was launched in April 2016. This new
universal pension is the first of its kind in Eastern Africa.
The scheme was geared as a response to weakening
traditional support systems for older people, as an
impact of the decline in subsistence farming, which has
resulted in that many older people do not receive
adequate support from family members. Many are
simply unable to work or can only earn a very small
income. The majority of older people do not have any
other source of income, such as an earnings-related
pension.80 According to the new pension scheme, people
over the age of 70 will receive a monthly non-
contributory pension of TZS 20,000 (US$9).81 In 2016
around 21,000 people started benefitting from ZUPS.82
In the beginning of 2018, the scheme coverage
increased up to 28,000 people. Despite the progress
made in implementing the scheme, the program still
faces a number of implementation challenges, e.g.
although the system for complaints and appeals has not
yet been fully operationalized.
Workers from the informal economy are voluntary
contributors. A self-employed worker/business person
upon his/her discretion is required to contribute at least
TZS 20,000 (US$8.9) per month at the minimum period
of nothing less than 6 months. In return, such worker is
entitled to the scheme’s full benefits. No clear data on
contributors from the informal sector are available.
There are also several non-contributory safety-net
programs for vulnerable children, elderly and disabled.
Moreover, Zanzibar has several funds for Zakat, the
Islamic founded social welfare, with an amount
equivalent to 2.5% of annual personal income.
There is no health social protection scheme in Zanzibar.
However, some employees in United Republic based in
Zanzibar are under Tanzania mainland’s NHIF and
some have covered themselves from private
international companies. As indicated above, the
government is in a process of establishing a social
protection fund, but it has been very slow.
ECONOMY
In the past two decades, Tanzania has experienced a
liberalized market economy transition as well as
political and social stability. This was intertwined into a
solid economic growth. The economic development was
mainly driven by some fast growing sectors, such as
construction, transport and financial services. Discovery
of oil and gas reserves holds promises for the
extractive industry and for substantial contributions to
the country’s economy. On the negative side, these
mounting sectors are capital intensive with still relatively
low employment shares. In addition, the formal economy
is stymied by the informal economy that mutes the
labour productivity and tax incomes.
Total Gross Domestic Product (GDP) was estimated at
US$52 billion in 2017 and the GDP growth per capita
was hovering far above the sub-Saharan Africa
average, 3.2% vs. 1.1% on average during the last
decade (see more on Table 23 and Figure 14). Despite
impressive economic results, it is worthwhile to mention
that Tanzania remains as an economic poor country,
ranking 191 out of 229 countries in terms of GDP per
capita in purchasing power parity (PPP) (1 is richest).83
Inflation in consumer prices was estimated at 5.4% in
2017; and at 8.7% on average over the last decade.
The relatively high inflation was negatively affecting
the workers’ income purchasing power. It is noted that
the inflation rate decreased during 2018, so far,
reaching the lowest inflation rate since February 2003;
which was aided by low food prices.
Table 23: Key Economic data in Tanzania, 2017
GDP US$ 52 billion
GDP per capita (current US$) US$936
GDP real growth 7.1 %
Inflation 5.4 %
Source: CIA, The World Factbook, Tanzania; World Bank, World
Development Indicators
Figure 14: GDP per capita growth and inflation trend in Tanzania, %, 2008-2017
Source:World Bank, World Development Indicators
-4
-2
0
2
4
6
8
10
12
14
16
18
2008 2009 2010 2011 2012 2013 2014 2015 2016 2017
GDP groth per capita
Inflation in consumer prices
GDP groth per capita - Sub-Saharan Africa
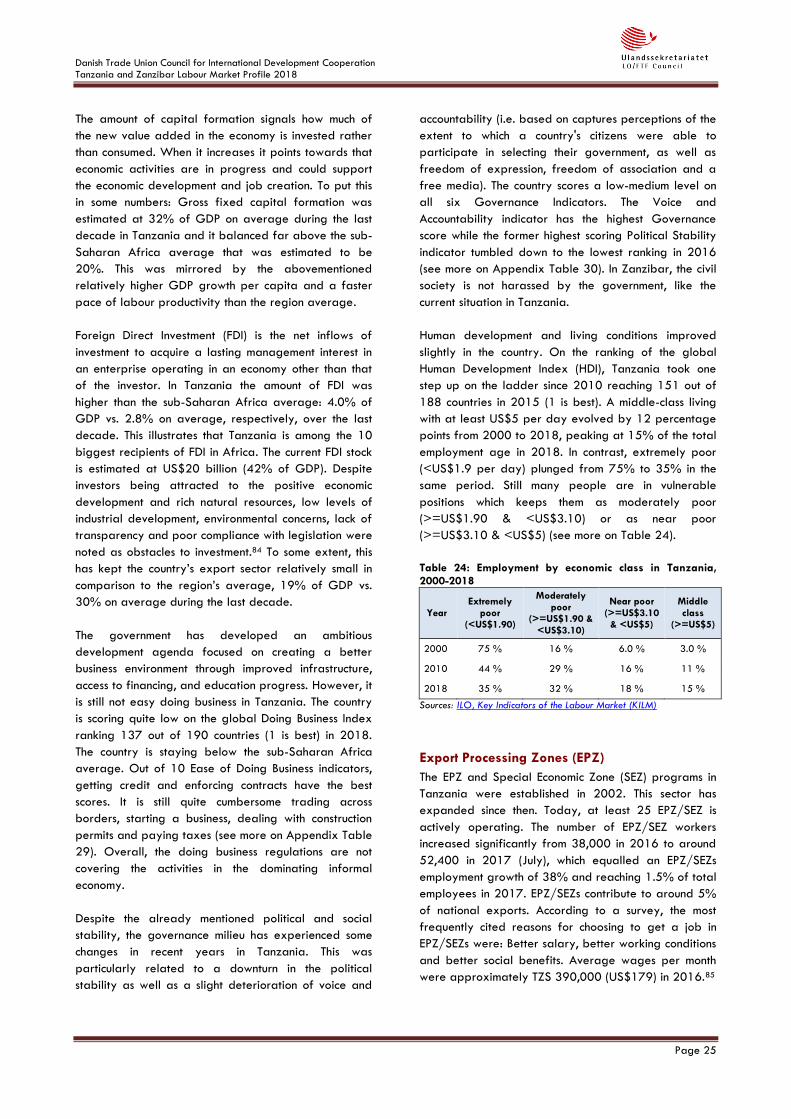
Danish Trade Union Council for International Development Cooperation Tanzania and Zanzibar Labour Market Profile 2018
Page 25
The amount of capital formation signals how much of
the new value added in the economy is invested rather
than consumed. When it increases it points towards that
economic activities are in progress and could support
the economic development and job creation. To put this
in some numbers: Gross fixed capital formation was
estimated at 32% of GDP on average during the last
decade in Tanzania and it balanced far above the sub-
Saharan Africa average that was estimated to be
20%. This was mirrored by the abovementioned
relatively higher GDP growth per capita and a faster
pace of labour productivity than the region average.
Foreign Direct Investment (FDI) is the net inflows of
investment to acquire a lasting management interest in
an enterprise operating in an economy other than that
of the investor. In Tanzania the amount of FDI was
higher than the sub-Saharan Africa average: 4.0% of
GDP vs. 2.8% on average, respectively, over the last
decade. This illustrates that Tanzania is among the 10
biggest recipients of FDI in Africa. The current FDI stock
is estimated at US$20 billion (42% of GDP). Despite
investors being attracted to the positive economic
development and rich natural resources, low levels of
industrial development, environmental concerns, lack of
transparency and poor compliance with legislation were
noted as obstacles to investment.84 To some extent, this
has kept the country’s export sector relatively small in
comparison to the region’s average, 19% of GDP vs.
30% on average during the last decade.
The government has developed an ambitious
development agenda focused on creating a better
business environment through improved infrastructure,
access to financing, and education progress. However, it
is still not easy doing business in Tanzania. The country
is scoring quite low on the global Doing Business Index
ranking 137 out of 190 countries (1 is best) in 2018.
The country is staying below the sub-Saharan Africa
average. Out of 10 Ease of Doing Business indicators,
getting credit and enforcing contracts have the best
scores. It is still quite cumbersome trading across
borders, starting a business, dealing with construction
permits and paying taxes (see more on Appendix Table
29). Overall, the doing business regulations are not
covering the activities in the dominating informal
economy.
Despite the already mentioned political and social
stability, the governance milieu has experienced some
changes in recent years in Tanzania. This was
particularly related to a downturn in the political
stability as well as a slight deterioration of voice and
accountability (i.e. based on captures perceptions of the
extent to which a country's citizens were able to
participate in selecting their government, as well as
freedom of expression, freedom of association and a
free media). The country scores a low-medium level on
all six Governance Indicators. The Voice and
Accountability indicator has the highest Governance
score while the former highest scoring Political Stability
indicator tumbled down to the lowest ranking in 2016
(see more on Appendix Table 30). In Zanzibar, the civil
society is not harassed by the government, like the
current situation in Tanzania.
Human development and living conditions improved
slightly in the country. On the ranking of the global
Human Development Index (HDI), Tanzania took one
step up on the ladder since 2010 reaching 151 out of
188 countries in 2015 (1 is best). A middle-class living
with at least US$5 per day evolved by 12 percentage
points from 2000 to 2018, peaking at 15% of the total
employment age in 2018. In contrast, extremely poor
(<US$1.9 per day) plunged from 75% to 35% in the
same period. Still many people are in vulnerable
positions which keeps them as moderately poor
(>=US$1.90 & <US$3.10) or as near poor
(>=US$3.10 & <US$5) (see more on Table 24).
Table 24: Employment by economic class in Tanzania, 2000-2018
Year Extremely
poor (<US$1.90)
Moderately poor
(>=US$1.90 & <US$3.10)
Near poor (>=US$3.10
& <US$5)
Middle class
(>=US$5)
2000 75 % 16 % 6.0 % 3.0 %
2010 44 % 29 % 16 % 11 %
2018 35 % 32 % 18 % 15 %
Sources: ILO, Key Indicators of the Labour Market (KILM)
Export Processing Zones (EPZ)
The EPZ and Special Economic Zone (SEZ) programs in
Tanzania were established in 2002. This sector has
expanded since then. Today, at least 25 EPZ/SEZ is
actively operating. The number of EPZ/SEZ workers
increased significantly from 38,000 in 2016 to around
52,400 in 2017 (July), which equalled an EPZ/SEZs
employment growth of 38% and reaching 1.5% of total
employees in 2017. EPZ/SEZs contribute to around 5%
of national exports. According to a survey, the most
frequently cited reasons for choosing to get a job in
EPZ/SEZs were: Better salary, better working conditions
and better social benefits. Average wages per month
were approximately TZS 390,000 (US$179) in 2016.85
Danish Trade Union Council for International Development Cooperation Tanzania and Zanzibar Labour Market Profile 2018
Page 26
A study concluded that Tanzania’s EPZ program was
falling behind, mainly due to rigid and expensive
infrastructural issues. While EPZ firms were enjoying
fiscal incentives, the government has not been reaping
benefits from the scheme as well as borne fiscal losses
in terms of huge tax exemptions extending over up to
10 years.86 The EPZ/SEZ programs face a number of
other challenges: A high cost of operations and
production due to unreliable supply of electricity and
water, which made the operating enterprises
uncompetitive on the international markets.87 Another
recent study revealed that EPZ/SEZs in Tanzania were
highly disorganized. Many firms were non-operational
and it appeared that the EPZA did not have a good
handling on how the SEZs were functioning in practice.
The firms were overly burdened with red-tape and
bureaucratic procedures that add significantly to their
cost structure and reduced their competitiveness (see
more on Appendix Table 29). Accessing labour with the
necessary skills moreover appeared problematic for
firms located in Tanzania.88
There are two EPZs on Zanzibar, where there previously
have been unconfirmed reports of trade union rights
violations.
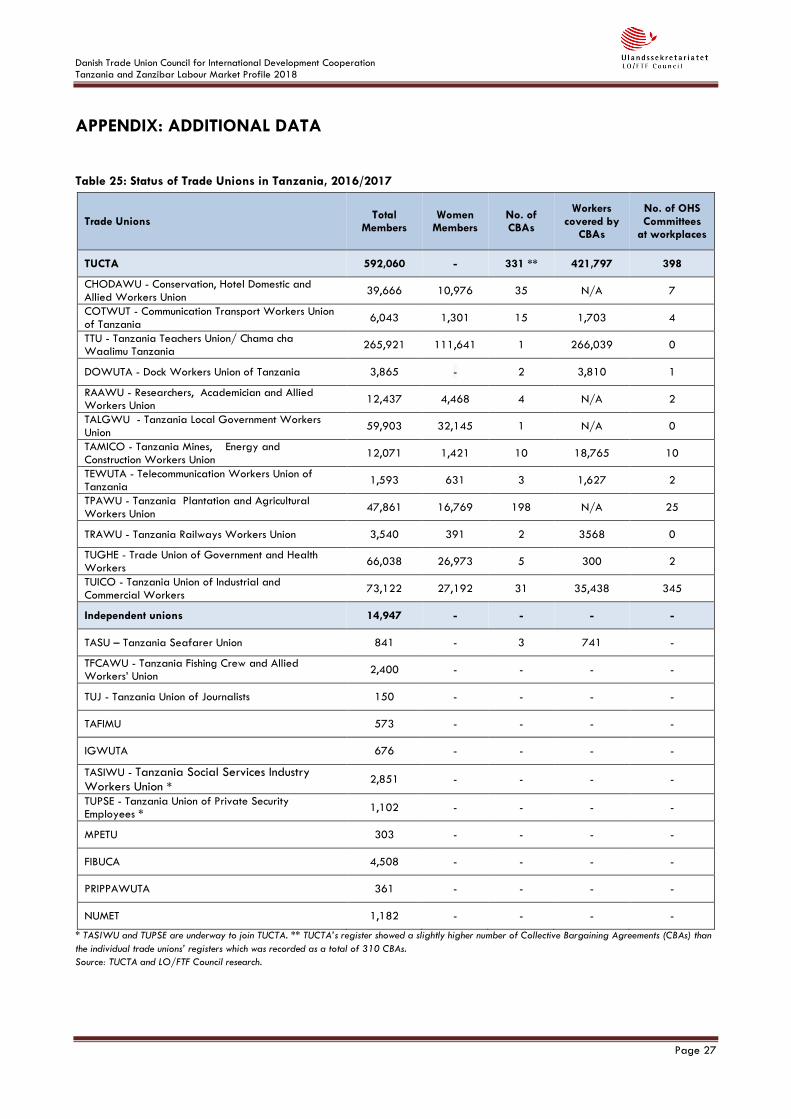
Danish Trade Union Council for International Development Cooperation Tanzania and Zanzibar Labour Market Profile 2018
Page 27
APPENDIX: ADDITIONAL DATA
Table 25: Status of Trade Unions in Tanzania, 2016/2017
Trade Unions Total
Members Women
Members No. of CBAs
Workers covered by
CBAs
No. of OHS Committees
at workplaces
TUCTA 592,060 - 331 ** 421,797 398
CHODAWU - Conservation, Hotel Domestic and Allied Workers Union
39,666 10,976 35 N/A 7
COTWUT - Communication Transport Workers Union of Tanzania
6,043 1,301 15 1,703 4
TTU - Tanzania Teachers Union/ Chama cha Waalimu Tanzania
265,921 111,641 1 266,039 0
DOWUTA - Dock Workers Union of Tanzania 3,865 - 2 3,810 1
RAAWU - Researchers, Academician and Allied Workers Union
12,437 4,468 4 N/A 2
TALGWU - Tanzania Local Government Workers Union
59,903 32,145 1 N/A 0
TAMICO - Tanzania Mines, Energy and Construction Workers Union
12,071 1,421 10 18,765 10
TEWUTA - Telecommunication Workers Union of Tanzania
1,593 631 3 1,627 2
TPAWU - Tanzania Plantation and Agricultural Workers Union
47,861 16,769 198 N/A 25
TRAWU - Tanzania Railways Workers Union 3,540 391 2 3568 0
TUGHE - Trade Union of Government and Health Workers
66,038 26,973 5 300 2
TUICO - Tanzania Union of Industrial and Commercial Workers
73,122 27,192 31 35,438 345
Independent unions 14,947 - - - -
TASU – Tanzania Seafarer Union 841 - 3 741 -
TFCAWU - Tanzania Fishing Crew and Allied Workers’ Union
2,400 - - - -
TUJ - Tanzania Union of Journalists 150 - - - -
TAFIMU 573 - - - -
IGWUTA 676 - - - -
TASIWU - Tanzania Social Services Industry Workers Union *
2,851 - - - -
TUPSE - Tanzania Union of Private Security Employees *
1,102 - - - -
MPETU 303 - - - -
FIBUCA 4,508 - - - -
PRIPPAWUTA 361 - - - -
NUMET 1,182 - - - -
* TASIWU and TUPSE are underway to join TUCTA. ** TUCTA’s register showed a slightly higher number of Collective Bargaining Agreements (CBAs) than
the individual trade unions’ registers which was recorded as a total of 310 CBAs.
Source: TUCTA and LO/FTF Council research.
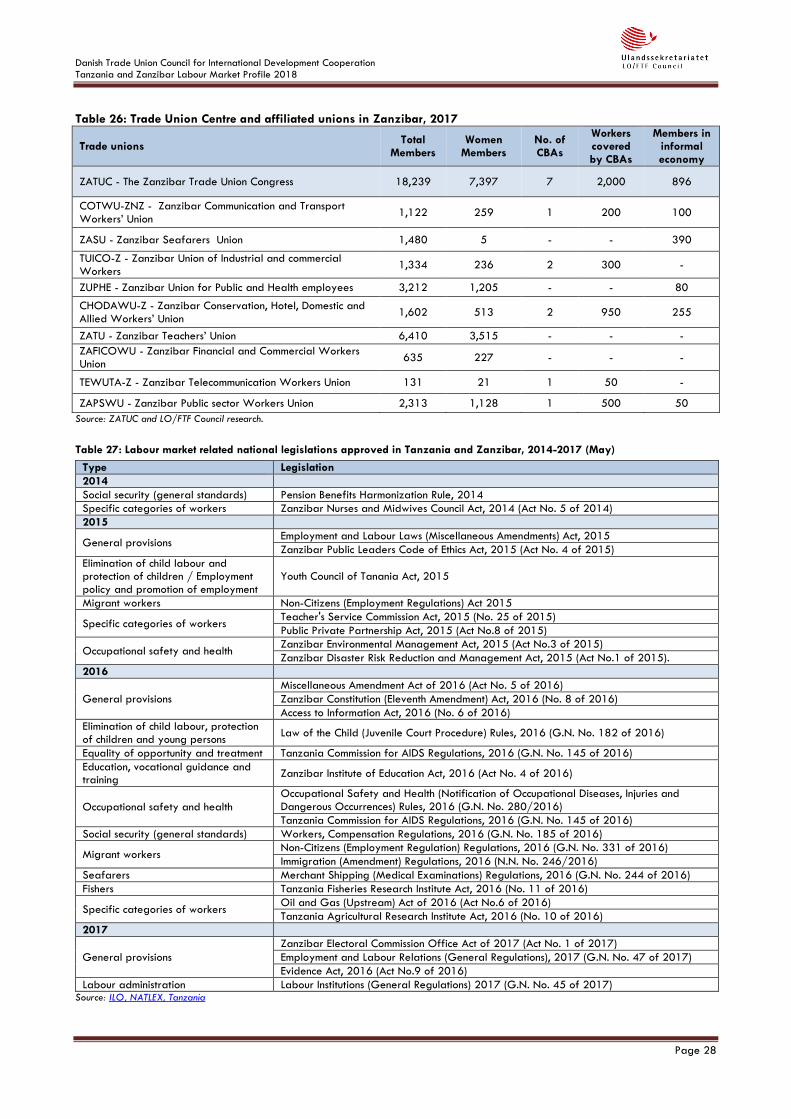
Danish Trade Union Council for International Development Cooperation Tanzania and Zanzibar Labour Market Profile 2018
Page 28
Table 26: Trade Union Centre and affiliated unions in Zanzibar, 2017
Trade unions Total
Members Women
Members No. of CBAs
Workers covered by CBAs
Members in informal economy
ZATUC - The Zanzibar Trade Union Congress 18,239 7,397 7 2,000 896
COTWU-ZNZ - Zanzibar Communication and Transport Workers’ Union
1,122 259 1 200 100
ZASU - Zanzibar Seafarers Union 1,480 5 - - 390
TUICO-Z - Zanzibar Union of Industrial and commercial Workers
1,334 236 2 300 -
ZUPHE - Zanzibar Union for Public and Health employees 3,212 1,205 - - 80
CHODAWU-Z - Zanzibar Conservation, Hotel, Domestic and Allied Workers’ Union
1,602 513 2 950 255
ZATU - Zanzibar Teachers’ Union 6,410 3,515 - - -
ZAFICOWU - Zanzibar Financial and Commercial Workers Union
635 227 - - -
TEWUTA-Z - Zanzibar Telecommunication Workers Union 131 21 1 50 -
ZAPSWU - Zanzibar Public sector Workers Union 2,313 1,128 1 500 50
Source: ZATUC and LO/FTF Council research.
Table 27: Labour market related national legislations approved in Tanzania and Zanzibar, 2014-2017 (May)
Type Legislation
2014
Social security (general standards) Pension Benefits Harmonization Rule, 2014
Specific categories of workers Zanzibar Nurses and Midwives Council Act, 2014 (Act No. 5 of 2014)
2015
General provisions Employment and Labour Laws (Miscellaneous Amendments) Act, 2015
Zanzibar Public Leaders Code of Ethics Act, 2015 (Act No. 4 of 2015)
Elimination of child labour and protection of children / Employment policy and promotion of employment
Youth Council of Tanania Act, 2015
Migrant workers Non-Citizens (Employment Regulations) Act 2015
Specific categories of workers Teacher's Service Commission Act, 2015 (No. 25 of 2015)
Public Private Partnership Act, 2015 (Act No.8 of 2015)
Occupational safety and health Zanzibar Environmental Management Act, 2015 (Act No.3 of 2015)
Zanzibar Disaster Risk Reduction and Management Act, 2015 (Act No.1 of 2015).
2016
General provisions
Miscellaneous Amendment Act of 2016 (Act No. 5 of 2016)
Zanzibar Constitution (Eleventh Amendment) Act, 2016 (No. 8 of 2016)
Access to Information Act, 2016 (No. 6 of 2016)
Elimination of child labour, protection of children and young persons
Law of the Child (Juvenile Court Procedure) Rules, 2016 (G.N. No. 182 of 2016)
Equality of opportunity and treatment Tanzania Commission for AIDS Regulations, 2016 (G.N. No. 145 of 2016)
Education, vocational guidance and training
Zanzibar Institute of Education Act, 2016 (Act No. 4 of 2016)
Occupational safety and health
Occupational Safety and Health (Notification of Occupational Diseases, Injuries and Dangerous Occurrences) Rules, 2016 (G.N. No. 280/2016)
Tanzania Commission for AIDS Regulations, 2016 (G.N. No. 145 of 2016)
Social security (general standards) Workers, Compensation Regulations, 2016 (G.N. No. 185 of 2016)
Migrant workers Non-Citizens (Employment Regulation) Regulations, 2016 (G.N. No. 331 of 2016)
Immigration (Amendment) Regulations, 2016 (N.N. No. 246/2016)
Seafarers Merchant Shipping (Medical Examinations) Regulations, 2016 (G.N. No. 244 of 2016)
Fishers Tanzania Fisheries Research Institute Act, 2016 (No. 11 of 2016)
Specific categories of workers Oil and Gas (Upstream) Act of 2016 (Act No.6 of 2016)
Tanzania Agricultural Research Institute Act, 2016 (No. 10 of 2016)
2017
General provisions
Zanzibar Electoral Commission Office Act of 2017 (Act No. 1 of 2017)
Employment and Labour Relations (General Regulations), 2017 (G.N. No. 47 of 2017)
Evidence Act, 2016 (Act No.9 of 2016)
Labour administration Labour Institutions (General Regulations) 2017 (G.N. No. 45 of 2017) Source: ILO, NATLEX, Tanzania
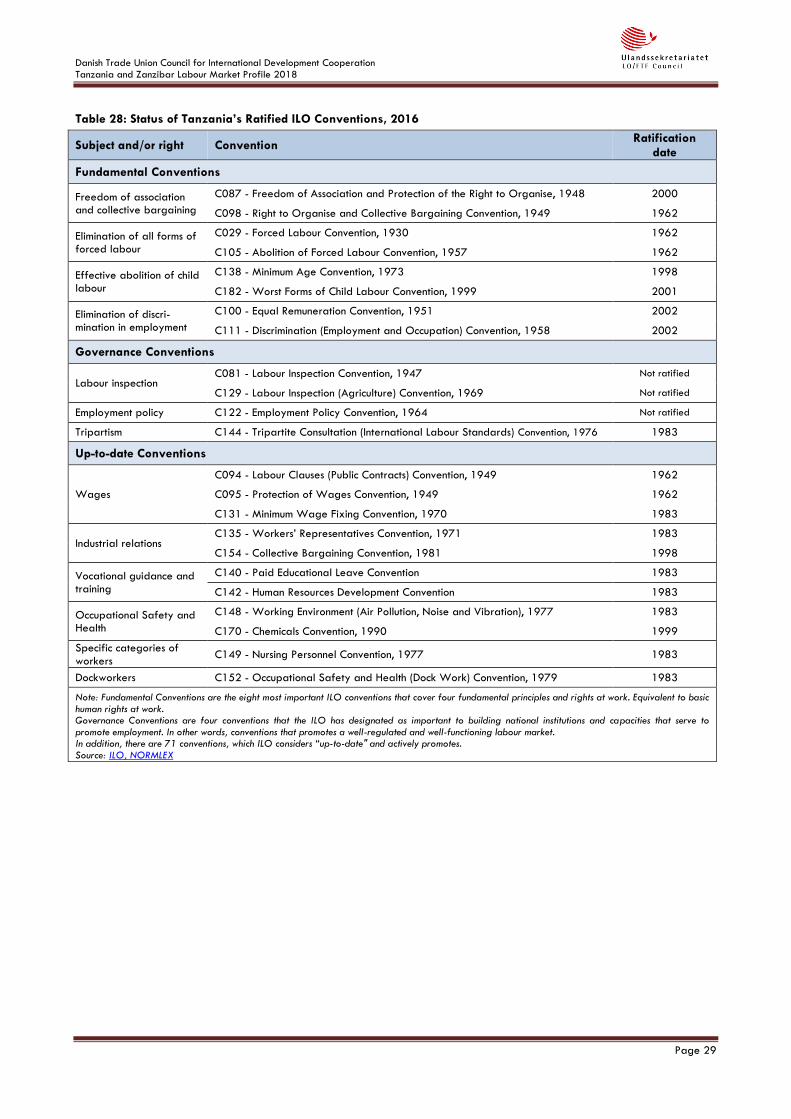
Danish Trade Union Council for International Development Cooperation Tanzania and Zanzibar Labour Market Profile 2018
Page 29
Table 28: Status of Tanzania’s Ratified ILO Conventions, 2016
Subject and/or right Convention Ratification
date
Fundamental Conventions
Freedom of association and collective bargaining
C087 - Freedom of Association and Protection of the Right to Organise, 1948 2000
C098 - Right to Organise and Collective Bargaining Convention, 1949 1962
Elimination of all forms of forced labour
C029 - Forced Labour Convention, 1930 1962
C105 - Abolition of Forced Labour Convention, 1957 1962
Effective abolition of child labour
C138 - Minimum Age Convention, 1973 1998
C182 - Worst Forms of Child Labour Convention, 1999 2001
Elimination of discri-mination in employment
C100 - Equal Remuneration Convention, 1951 2002
C111 - Discrimination (Employment and Occupation) Convention, 1958 2002
Governance Conventions
Labour inspection C081 - Labour Inspection Convention, 1947 Not ratified
C129 - Labour Inspection (Agriculture) Convention, 1969 Not ratified
Employment policy C122 - Employment Policy Convention, 1964 Not ratified
Tripartism C144 - Tripartite Consultation (International Labour Standards) Convention, 1976 1983
Up-to-date Conventions
Wages
C094 - Labour Clauses (Public Contracts) Convention, 1949 1962
C095 - Protection of Wages Convention, 1949 1962
C131 - Minimum Wage Fixing Convention, 1970 1983
Industrial relations C135 - Workers’ Representatives Convention, 1971 1983
C154 - Collective Bargaining Convention, 1981 1998
Vocational guidance and training
C140 - Paid Educational Leave Convention 1983
C142 - Human Resources Development Convention 1983
Occupational Safety and Health
C148 - Working Environment (Air Pollution, Noise and Vibration), 1977 1983
C170 - Chemicals Convention, 1990 1999
Specific categories of workers
C149 - Nursing Personnel Convention, 1977 1983
Dockworkers C152 - Occupational Safety and Health (Dock Work) Convention, 1979 1983
Note: Fundamental Conventions are the eight most important ILO conventions that cover four fundamental principles and rights at work. Equivalent to basic human rights at work. Governance Conventions are four conventions that the ILO has designated as important to building national institutions and capacities that serve to promote employment. In other words, conventions that promotes a well-regulated and well-functioning labour market. In addition, there are 71 conventions, which ILO considers “up-to-date" and actively promotes. Source: ILO, NORMLEX
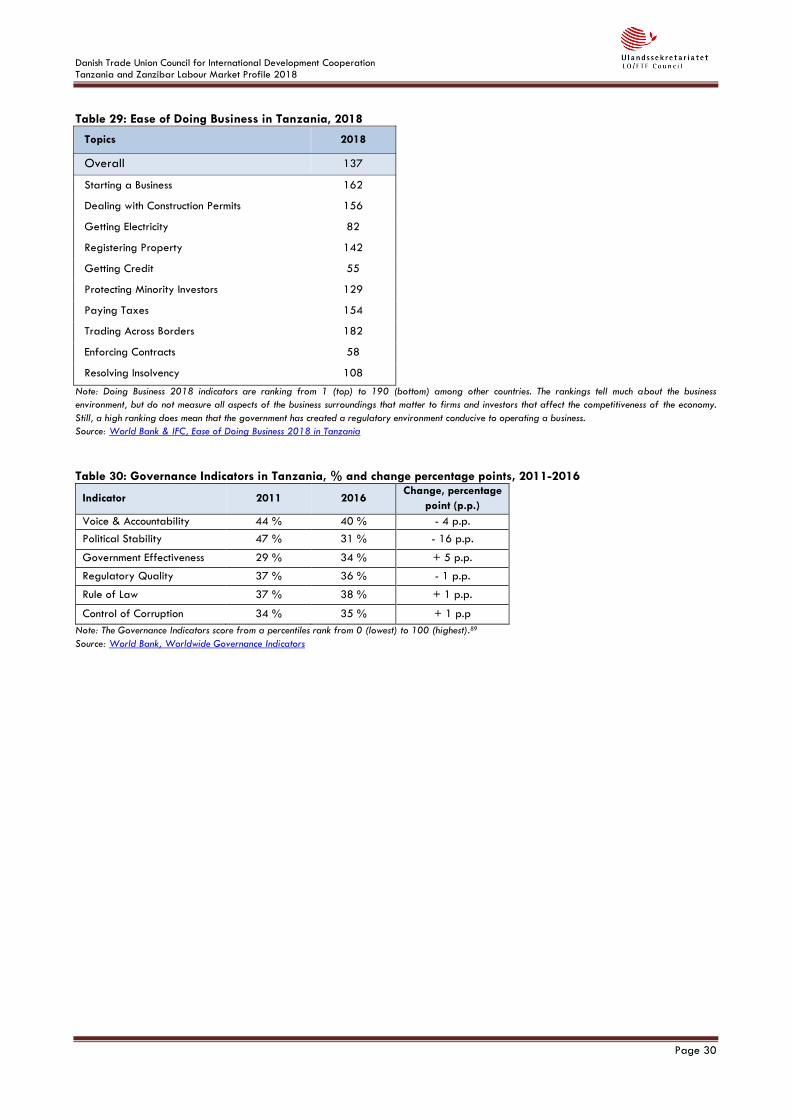
Danish Trade Union Council for International Development Cooperation Tanzania and Zanzibar Labour Market Profile 2018
Page 30
Table 29: Ease of Doing Business in Tanzania, 2018
Topics 2018
Overall 137
Starting a Business 162
Dealing with Construction Permits 156
Getting Electricity 82
Registering Property 142
Getting Credit 55
Protecting Minority Investors 129
Paying Taxes 154
Trading Across Borders 182
Enforcing Contracts 58
Resolving Insolvency 108
Note: Doing Business 2018 indicators are ranking from 1 (top) to 190 (bottom) among other countries. The rankings tell much about the business
environment, but do not measure all aspects of the business surroundings that matter to firms and investors that affect the competitiveness of the economy.
Still, a high ranking does mean that the government has created a regulatory environment conducive to operating a business.
Source: World Bank & IFC, Ease of Doing Business 2018 in Tanzania
Table 30: Governance Indicators in Tanzania, % and change percentage points, 2011-2016
Indicator 2011 2016 Change, percentage
point (p.p.)
Voice & Accountability 44 % 40 % - 4 p.p.
Political Stability 47 % 31 % - 16 p.p.
Government Effectiveness 29 % 34 % + 5 p.p.
Regulatory Quality 37 % 36 % - 1 p.p.
Rule of Law 37 % 38 % + 1 p.p.
Control of Corruption 34 % 35 % + 1 p.p
Note: The Governance Indicators score from a percentiles rank from 0 (lowest) to 100 (highest).89
Source: World Bank, Worldwide Governance Indicators
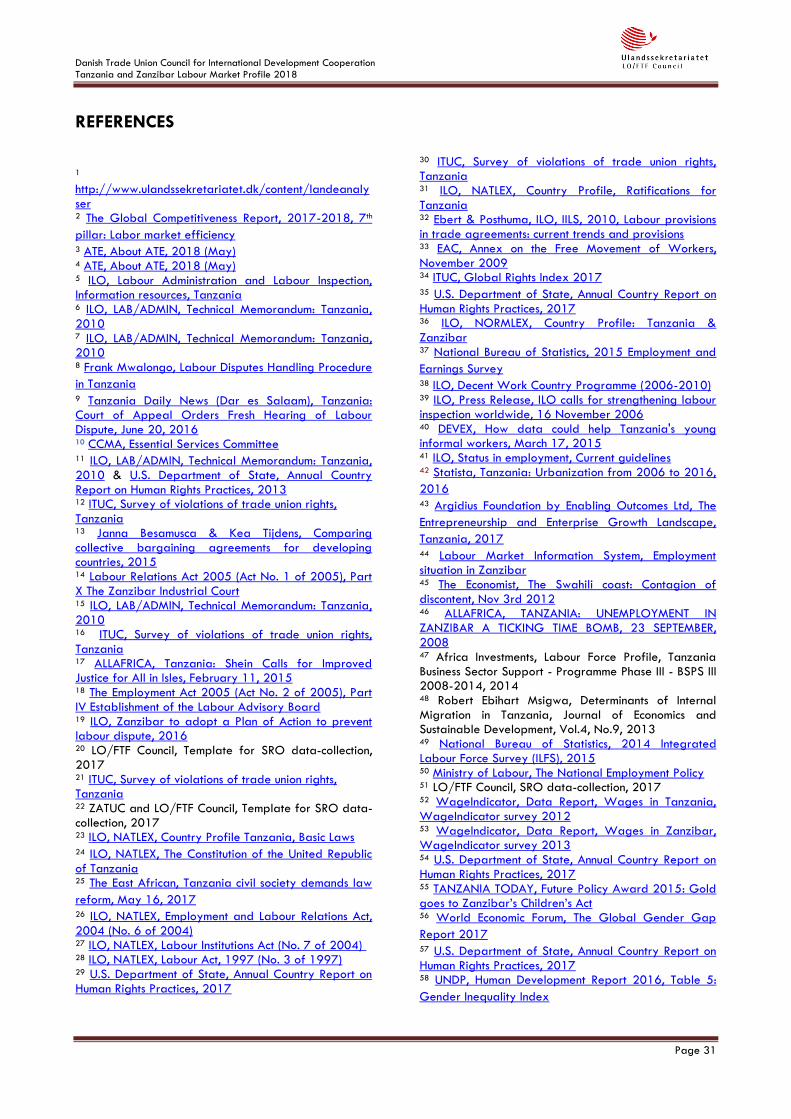
Danish Trade Union Council for International Development Cooperation Tanzania and Zanzibar Labour Market Profile 2018
Page 31
REFERENCES
1 http://www.ulandssekretariatet.dk/content/landeanalyser 2 The Global Competitiveness Report, 2017-2018, 7th
pillar: Labor market efficiency 3 ATE, About ATE, 2018 (May) 4 ATE, About ATE, 2018 (May) 5 ILO, Labour Administration and Labour Inspection, Information resources, Tanzania 6 ILO, LAB/ADMIN, Technical Memorandum: Tanzania, 2010 7 ILO, LAB/ADMIN, Technical Memorandum: Tanzania, 2010 8 Frank Mwalongo, Labour Disputes Handling Procedure
in Tanzania 9 Tanzania Daily News (Dar es Salaam), Tanzania: Court of Appeal Orders Fresh Hearing of Labour Dispute, June 20, 2016 10 CCMA, Essential Services Committee 11 ILO, LAB/ADMIN, Technical Memorandum: Tanzania, 2010 & U.S. Department of State, Annual Country Report on Human Rights Practices, 2013 12 ITUC, Survey of violations of trade union rights, Tanzania 13 Janna Besamusca & Kea Tijdens, Comparing collective bargaining agreements for developing countries, 2015 14 Labour Relations Act 2005 (Act No. 1 of 2005), Part X The Zanzibar Industrial Court 15 ILO, LAB/ADMIN, Technical Memorandum: Tanzania, 2010 16 ITUC, Survey of violations of trade union rights, Tanzania 17 ALLAFRICA, Tanzania: Shein Calls for Improved Justice for All in Isles, February 11, 2015 18 The Employment Act 2005 (Act No. 2 of 2005), Part IV Establishment of the Labour Advisory Board 19 ILO, Zanzibar to adopt a Plan of Action to prevent labour dispute, 2016 20 LO/FTF Council, Template for SRO data-collection, 2017 21 ITUC, Survey of violations of trade union rights, Tanzania 22 ZATUC and LO/FTF Council, Template for SRO data-collection, 2017 23 ILO, NATLEX, Country Profile Tanzania, Basic Laws 24 ILO, NATLEX, The Constitution of the United Republic
of Tanzania 25 The East African, Tanzania civil society demands law
reform, May 16, 2017 26 ILO, NATLEX, Employment and Labour Relations Act, 2004 (No. 6 of 2004) 27 ILO, NATLEX, Labour Institutions Act (No. 7 of 2004) 28 ILO, NATLEX, Labour Act, 1997 (No. 3 of 1997) 29 U.S. Department of State, Annual Country Report on Human Rights Practices, 2017
30 ITUC, Survey of violations of trade union rights, Tanzania 31 ILO, NATLEX, Country Profile, Ratifications for Tanzania 32 Ebert & Posthuma, ILO, IILS, 2010, Labour provisions in trade agreements: current trends and provisions 33 EAC, Annex on the Free Movement of Workers, November 2009 34 ITUC, Global Rights Index 2017 35 U.S. Department of State, Annual Country Report on Human Rights Practices, 2017 36 ILO, NORMLEX, Country Profile: Tanzania & Zanzibar 37 National Bureau of Statistics, 2015 Employment and
Earnings Survey 38 ILO, Decent Work Country Programme (2006-2010) 39 ILO, Press Release, ILO calls for strengthening labour inspection worldwide, 16 November 2006 40 DEVEX, How data could help Tanzania's young informal workers, March 17, 2015 41 ILO, Status in employment, Current guidelines 42 Statista, Tanzania: Urbanization from 2006 to 2016,
2016 43 Argidius Foundation by Enabling Outcomes Ltd, The
Entrepreneurship and Enterprise Growth Landscape,
Tanzania, 2017 44 Labour Market Information System, Employment situation in Zanzibar 45 The Economist, The Swahili coast: Contagion of discontent, Nov 3rd 2012 46 ALLAFRICA, TANZANIA: UNEMPLOYMENT IN ZANZIBAR A TICKING TIME BOMB, 23 SEPTEMBER, 2008 47 Africa Investments, Labour Force Profile, Tanzania Business Sector Support - Programme Phase III - BSPS III 2008-2014, 2014 48 Robert Ebihart Msigwa, Determinants of Internal Migration in Tanzania, Journal of Economics and Sustainable Development, Vol.4, No.9, 2013 49 National Bureau of Statistics, 2014 Integrated Labour Force Survey (ILFS), 2015 50 Ministry of Labour, The National Employment Policy 51 LO/FTF Council, SRO data-collection, 2017 52 WageIndicator, Data Report, Wages in Tanzania, WageIndicator survey 2012 53 WageIndicator, Data Report, Wages in Zanzibar, WageIndicator survey 2013 54 U.S. Department of State, Annual Country Report on
Human Rights Practices, 2017 55 TANZANIA TODAY, Future Policy Award 2015: Gold goes to Zanzibar’s Children’s Act 56 World Economic Forum, The Global Gender Gap
Report 2017 57 U.S. Department of State, Annual Country Report on Human Rights Practices, 2017 58 UNDP, Human Development Report 2016, Table 5:
Gender Inequality Index
Danish Trade Union Council for International Development Cooperation Tanzania and Zanzibar Labour Market Profile 2018
Page 32
59 Tanzania National Bureau of Statistics, Integrated Labour Force Survey from 2014 60 ILO, Labour market transitions of young women and men in the United Republic of Tanzania, Work4Youth Publication Series No. 26, December 2014 61 Africa Investments, Labour Force Profile, Tanzania Business Sector Support - Programme Phase III - BSPS III 2008-2014, 2014 62 International Youth Foundation, YouthMap: Tanzania,
Zanzibar Youth: Assets & opportunities, Assessment
Report, 2014 63 Tanzania National Bureau of Statistics, Integrated Labour Force Survey from 2014 64 World Bank, How Tanzania Plans To Achieve "Big Results Now" in Education, July 14, 2014 65 ALLAFRICA, Tanzania: Govt Set to Establish
Specialised Vocational Centres, July 5, 2016 66 World Bank, World Development Indicators 67 Association of Tanzania Employers, Business Agenda 2011-2014 68 ILO, EMPLOYMENT, 2009, Understanding informal apprenticeship – Findings from empirical research in Tanzania, Employment Working Paper No. 32 69 Revolutional Government of Zanzibar, Ministry of Education and Vocational Training; Technical Education, Vocational Education & Training 70 ILO, Social Protection Expenditure and Performance Review and Social Budget: Zanzibar, 2010 & Ministry of Education and Vocational training 71 Social Security Regulatory Authority, Challenges
facing Social Protection and future plans in Tanzania,
2016 72 Centre for Social Science Research, The development of social protection policies in Tanzania, 2000-2015; CSSR Working Paper No. 377; Legislating and Implementing Welfare Policy Reforms, May 2016 73 AfricaAll, Tanzania: LAPF Uses Mobile Tech to
Penetrate Informal Sector, April 18, 2017 74 ILO, Social Protection, Tanzania 75 Tulia Ackson & Juliana Masabo, Social Protection for the Informal Sector in Tanzania 76 NHIF, Fact Sheet Inside NHIF 2012-13 77 AllAfrica, Tanzania: Over 70,000 Register in NSSF Health Insurance, August 7, 2015 78 ILO, Zanzibar, Social Protection Expenditure and Performance Review and Social Budget 79 LO/FTF Council 80 HelpAge International, Pension Watch, Voice and
accountability in the Zanzibar Universal Pension
Scheme, 2018 81 Help Age, Zanzibar's new universal pension the first of its kind in east Africa, April 14, 2016 82 ILO, Zanzibar implements a Universal Pension Scheme
(ZUPS) in line with the ILO Recommendation 202, June
10, 2016 83 CIA, The World Factbook, Tanzania 84 Santander, Tanzania: Foreign Investment
85 UNU-WIDER, The role and effectiveness of Special Economic Zones in Tanzania, WIDER Working Paper 2016/122, November 2016 86 Charles Domician, An Evaluation of Tanzania’s EPZ Programme – Challenges and Prospects, August 2009 87 EPZA, Annual Report 2011-2012 88 UNU-WIDER, The role and effectiveness of Special Economic Zones in Tanzania, WIDER Working Paper 2016/122, November 2016 89 World Bank, The Worldwide Governance Indicators,
Methodology and Analytical Issues, Policy Research
Working Paper 5430, 2010