Embed Size (px)
Citation preview
CE
UeT
DC
olle
ctio
n
LABOUR FORCE MIGRATION WITHIN EU: ANALYSIS OF
PUSH AND PULL FACTORS
By
Viktorija Gurcinaite
Submitted to:
Central European University
Department of Economics
In partial fulfilment of the requirements for the degree of Master of Arts in Economic
Policy in Global Markets
Supervisor: Professor Miklós Koren
2014
CE
UeT
DC
olle
ctio
n
i
Abstract
This thesis analyses recent intra-EU migration trends and migration policy changes in the
European Union. I find that migration policies adopted by separate EU member states in many
cases put more focus on the outcomes of the migration process rather than on the changes of the
economic incentives behind it. Therefore, the goal of this thesis is to identify key push-pull factors
of the intra-EU migration in the period of 2000-2011 by carrying out econometric analysis based on
the gravity model. There are four key findings of my empirical study. Firstly, labour market
characteristics (average wage and unemployment rate) are statistically significant intra-EU migration
drivers. Secondly, the pull factors tend to have higher significance in general intra-EU migration.
Thirdly, the findings also suggest that there are significant regional differences in intra-EU migration
and push factors tend to be more significant in the migration process from new to old EU member
states. Finally, I show that two big shocks in the period of 2000-2011 (EU enlargement and the
global financial crisis) made the intra-EU migration process more wage sensitive. Based on the
finding I propose policy suggestions that include the ways to improve selective migration. In
addition, I suggest keeping a certain level of freedom for regional adjustments when unifying EU
migration policies and also improving the labour market supervision for certain countries.
Key words: intra-EU migration, migration policies, push-pull factors
CE
UeT
DC
olle
ctio
n
ii
Table of Contents
Introduction ................................................................................................................................................. 1
1. European migration ................................................................................................................................. 5
1.1. History of European migration ............................................................................................................ 5
1.2. Current trends of intra-EU mobility ..................................................................................................... 8
1.3. Labour market of the migrants .......................................................................................................... 13
1.4. How does the intra-EU migrant look like? ......................................................................................... 17
1.5. EU migration policies ........................................................................................................................ 20
2. Migration theories and empirical evidence ......................................................................................... 25
2.1. Neo-classical migration theory ........................................................................................................... 26
2.2. Gravity model for migration .............................................................................................................. 30
2.3. Push-pull factors theory ..................................................................................................................... 32
3. Empirical study ..................................................................................................................................... 35
3.1. How important is labour migration? .................................................................................................. 35
3.2. Methodology and data commentary ................................................................................................... 37
3.3. Empirical findings ............................................................................................................................. 41
3.3.1. Original gravity model ................................................................................................................. 41
3.3.2. Modified gravity models: the influence of economic factors. ....................................................... 43
3.3.3. Regional differences in intra-EU migration ................................................................................. 48
3.3.4. The influence of EU enlargement policies and global financial crisis ........................................... 51
Conclusions ................................................................................................................................................ 55
Policy recommendations ........................................................................................................................... 58
Appendix .................................................................................................................................................... 59
Reference List ............................................................................................................................................ 61
CE
UeT
DC
olle
ctio
n
iii
The list of the Tables
Table 1. Top 5 receiving and source countries in intra-EU migration in 2011 .…………………..10
Table 2. Population trends in top 5 receiving countries ………………………………………….11
Table 3. The historical link between migration-related researches and policy responses …………26
Table 4. A summary of the main push-pull migration factors ………………………………….…33
Table 5. Reasons for migration (% of total migrants) …………………………………….………36
Table 6. Correlations between dependent and independent variables…………………………….40
Table 7. Estimation results: Stewart’s model……………………………………………………...42
Table 8. Estimation results: neo-classical (macro level) migration theory ………………………...45
Table 9. Estimation results: the influence of economic factors on migration decision…………….47
Table 10. Estimation results: regional differences in intra-EU migration………………………….50
Table 11. Estimation results: the influence of EU enlargement and the crisis…………………….53
CE
UeT
DC
olle
ctio
n
iv
The list of the Graphs
Graph 1. Net migration in European regions (in thousands of migrants)…………………………..6
Graph 2. Unemployment rate in EU-27 (%)………………………………………………………15
Graph 3. Age structure of immigrants by basic citizenship groups, EU-27, 2008 (1)………………18
Graph 4. EU8 population in major EU15 receiving countries, 2005-2011 (thousands of people)…22
CE
UeT
DC
olle
ctio
n
1
Introduction
Migration process changes the “face“ of a country. With boundaries and migration costs
decreasing, countries become more and more culturally diversified. Foreign workers significantly
contribute to a country’s economic growth – they pay taxes, buy goods and services, some even
create new jobs for others. Moreover, they also contribute to the economy of the country of their
origin. Emigrants tend to send back home part of the money they earn– in 2012 over $400bn were
sent as remittances to developing countries (ILO, 2013). As the unemployment rate is expected to
rise over the years and Europe is rapidly ageing, the number of migrants is expected to increase
steadily over the years. According to the projections of OECD, Germany will need approximately
3.6 million immigrants a year in the period of 2000-2050 to keep up its constant dependency rates
(K. Lorant, 2005). Without the support of immigrants the old age dependency ratio in EU would
increase dramatically putting high pressure on the social welfare, health care and pension systems.
The demographic changes that Europe is undergoing increase the importance of the sound
management of migration process.
Migration brings to a country new opportunities as well as challenges. With a properly
managed migration, a country can stimulate its development and economic growth by sufficiently
using extra labour force or benefitting from remittances. On the other hand, migration can bring
lots of social, security and economic problems. Poorly integrated immigrant minorities can cause
social tension in the country. In addition to that, high level of emigration in certain EU states
reduces the working capacities of the country itself, may slow down the economy and may also
reduce the income of the public budget. These are the main issues addressed by the EU politicians
focusing on migration. In the past decade intra-EU migration became one of the most popular
topics for EU policy makers, politicians and researchers. The implementation of free labour force
CE
UeT
DC
olle
ctio
n
2
movement regulations changed the economic, demographic and social stance of the countries. The
increasing amount of debates about migration from East to West Europe has been mainly based on
the researches providing results of an impact of migration process or in the worst cases – based on
prejudice, “populist” ideas or a fear of increasing amount of social welfare migrants. This research,
as few others analysing intra-EU migration (M. Kahanec (2012), Y. Pascouau (2013)), focus on the
immigration as a beneficial process for a country. In particular, this thesis differs from majority of
researches in the way that it provides an analysis of the key drivers of intra-EU migration rather than
consequences. The findings of the empirical study proves the importance of economic incentives in
the intra-EU migration process and therefore oppose the migration policies focused on
manipulating the access to social benefits as the key for controlling immigration.
Many steps have been taken in uniting the migration policies within EU. Unfortunately, the
global financial crisis triggered a relatively negative response from different countries within EU and
policy makers adopted a lot of immigration-unfriendly policies. Most of them were focused on
reducing the number of work permits, limiting the access to social benefits or even introducing
restrictions on certain countries (e.g. Greece and Hungary tightened restrictions for immigrants from
Romania and Bulgaria). Unfortunately, those policies were mainly adopted under the pressure and
did not reflect the short and long term demographic and economic goals (J. Koehler et al., 2010).
The lack of in-depth analysis of main migration drivers in some countries (like UK which did not
manage to bring net migration down and Lithuania which still struggles with high emigration rate)
resulted in a lack of effectiveness of the policies. Despite the attempts, EU migration laws still
widely differ among the member states.
Despite the differences in national migration laws, there is a great number of people moving
within EU and using the advantages of borderless Europe. The intra-EU migration in 2011
increased the populations of top five host countries (Germany, UK, Spain, France and Italy) by
CE
UeT
DC
olle
ctio
n
3
700,000 people. In terms of emigration, the top five EU countries in 2011 sourced above 800,000
people (most mobile were Polish, Romanians and French). It is a great responsibility for the policy
makers to make this process easier and at the same time to ensure that migration does not harm
national economies. State has an undeniably big power in balancing migration through influencing
push and pull factors. The decisions that policy makers make have an impact on both – immediate
labour market outcomes as well as perspectives of long term economic integration (A. Cangiano,
2012). Therefore, a thorough understanding of migration patterns and drivers is key in adopting
successful and fruitful migration policies.
Historically there has been many attempts to explain what determines a person’s choice to
migrate. Most of the researchers base their analysis on the neo-classical migration theory. C. A.
Pissarides and I. McMaster (1990) present strong statistical proof of an importance of the wage
differentials in determining migration. D. Karemera et al. (2010) reach the conclusion that the size of
a source country’s population and income of receiving country are the key migration drivers.
Nevertheless, many more researchers argue that those economic factors are not enough to
determine the complex personal choice of migration and there are many more cultural,
demographic, environmental and other factors that contribute to this process. D. Chiquiar and G.
Hanson (2002) proved the importance of education, R. Ramos and J. Surinach (2013) showed the
relationship between the distance, cultural and colonial history with decision to migrate, P. Antolin
and O. Bover (1997) pointed out the importance of personal characteristics. Unfortunately, most of
these researchers analyse international rather than intra-EU migration. Eurostat, Eurobarometer,
International Migration Institute and other release periodical analysis of the intra-EU migration
trends but do not carry researches of the importance of separate key migration drivers.
The goal of this thesis is to determine what were the main intra-EU migration drivers (push-
pull factors) in the period of 2000-2011. The analysis mainly focuses on the importance of the
CE
UeT
DC
olle
ctio
n
4
economic (wage, unemployment rate, unemployment benefits) as well as some non-economic
(population, distance, language) factors. I raise hypothesis that pull factors (the changes made in a
host country) have more influence in predicting migration patterns. I also prove that there are
regional differences in intra-EU migration and raise a hypothesis that two major shocks in the
period of 2000-2011 (EU enlargement and global financial crisis) had a significant impact on the
change in migration patterns from new to old EU countries. To prove my hypotheses I use gravity
model for migration. GLS model with 4211 observations is used in the quantitative research. I find
that intra-EU migration follows the patterns of the classical gravity model – immigration decreases
with an increase of the distance between the countries and increases with the greater population of
host or source countries. I also prove that the average wage and unemployment rate are statistically
significant economic factors influencing personal migration choice. My first hypothesis that pull
factors play more important role is accepted when the sample consists of all EU country pairs and
rejected when the model includes only migration from new to old EU countries. Finally, I accept my
second hypothesis and show that the immigration process became more wage sensitive due to EU
enlargement and global financial crisis.
My thesis starts with an overview of European migration where I present the common
migration trends and policy adjustments that responded to the changes or on the contrary, triggered
the changes in the intra-EU migration. The second chapter gives a theoretical background of
migration theories that have been developed throughout the years as an attempt to explain the
reasoning behind the migration process. This chapter also presents the findings of economic
researches that have been conducted in order to support the existing theories. The third chapter
includes an empirical study where I try to identify the importance of regional differences and
economic factors in migration process and accept (or deny) my hypotheses. Finally, I draw the
conclusions and present policy recommendations that are in line with my findings.
CE
UeT
DC
olle
ctio
n
5
1. European migration
This chapter provides an overview of the history of European migration as well as current
trends of the intra-EU migration. Moreover, as the goal of this thesis is to identify key push-pull
intra-EU migration factors, the sub-chapter 1.3.sets the base for the analysis of pull migration
factors by providing an overview of the immigrants’ labour market in a host country. In addition to
that, sub-chapter 1.4. specifies the characteristics of an average migrant that makes a decision to
migrate or stay in a home country as a result of cost-benefit analysis of push-pull intra-EU migration
factors. Finally, an overview of main migration policy changes of the last decade are analysed in sub-
chapter 1.5.
1.1. History of European migration
In the past decades there has been a significant change in the characteristics of migration as
well as policy responses targeted towards migration regulation. Before 1950 Europe was majorly a
source continent in the migration process (G. Zincone et al., 2011). Many Europeans were leaving
the continent with the hopes to find better job opportunities. There was no significant restrictions
for labour force migration up to the World War I. The war created a need for security, therefore
passports and visas became a part of policy response which allowed to track the people movements
more easily (S. Koikkalainen, 2011). Situation started to change rapidly in 1960s (in South Europe –
since 1970s). The war was over and European countries became increasingly popular destinations
among international as well as regional migrants. Recovering economies were more willing to accept
CE
UeT
DC
olle
ctio
n
6
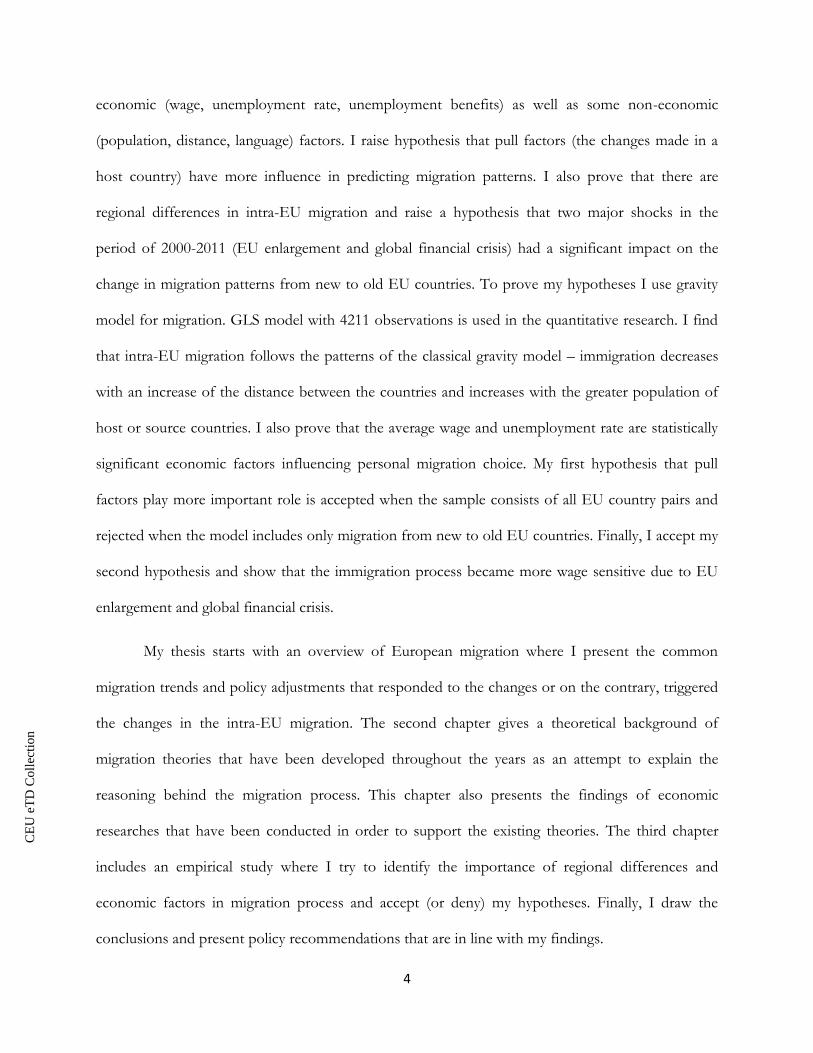
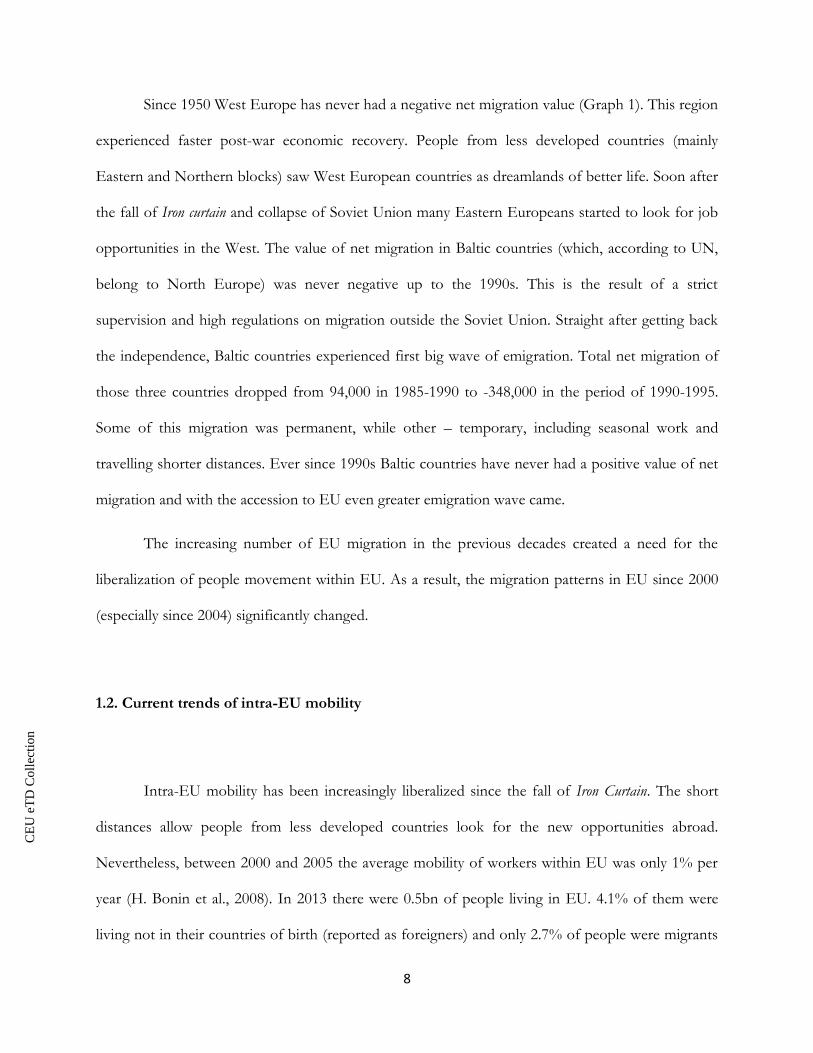
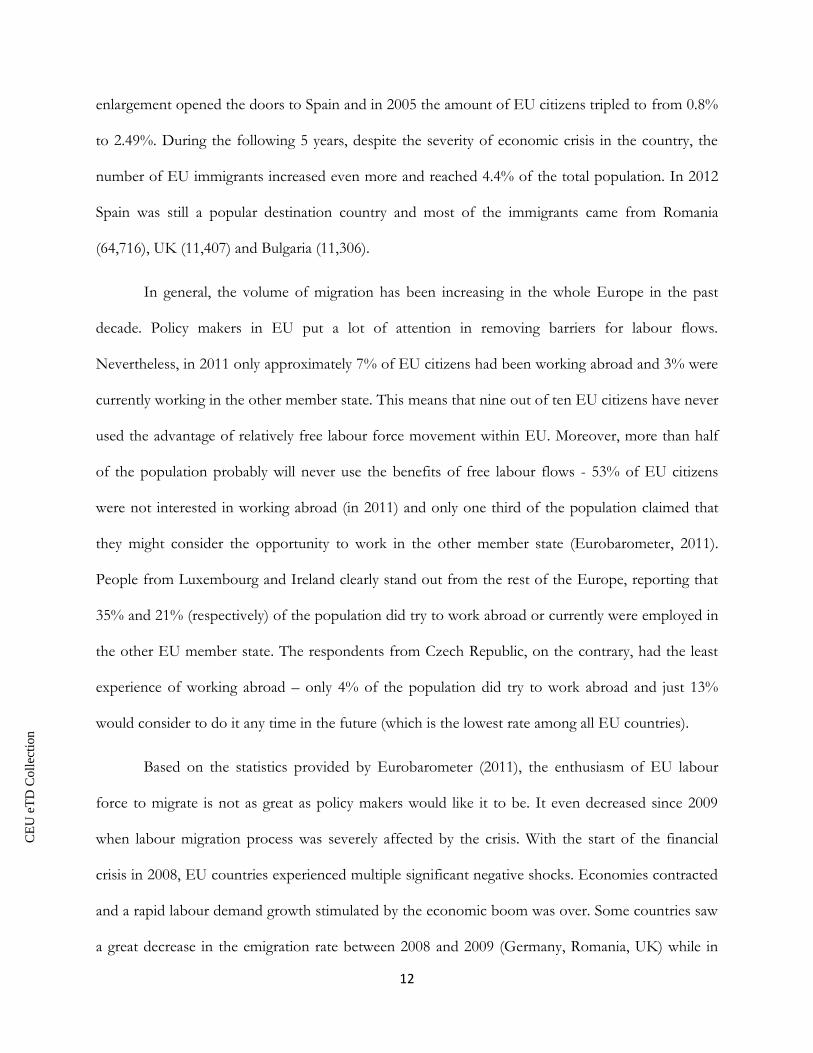
extra labour force from abroad. It can be seen from the Graph 1, that overall trend of European net
migration has been consistent in all parts of Europe (the rate of net migration has been increasing).
Graph 1. Net migration in European regions (in thousands of migrants)
Source: Net population prospects: The 2012 Revision. United Nations
As a response to the rapidly changing situation of labour force movements, it was decided by the
Council of the Organisation for European Economic Co-operation that each member country
should work on liberalization of conditions for foreign workers in Europe and should submit the
reports describing the process on a yearly basis. This allowed to increase the monitoring process of
migration and analyse the links between migration process and the level of country’s development
CE
UeT
DC
olle
ctio
n
7
(OECD, 2011). One of the main advantages of better monitoring process was greater availability of
data. During the period of 1958-1972 more than 8 million work permits were given to foreigners in
six founder members of European Economic Community (West Germany, Netherlands,
Luxembourg, Italy, France and Belgium). Out of those 8 million, one third (2.4 million) were
migrants from one of the other EEC countries (S. Koikkalainen, 2011). The highest number of EEC
immigrants came from Italy whose economy was severely hit by the war and increasing
unemployment level.
In 1973-74, global oil crisis hit economies and the level of the inflows of foreign workers in
West Europe decreased dramatically. The main reason was the economic slowdown, but the
increased tension between nationals and foreigners in the country played a significant role as well.
Later, at the beginning of 1980s the flows of labour migrants levelled out and the migration policies
were shifted towards the integration of the foreign population that was already living in a particular
country. Up to the 1980s the migrants were grouped into three categories depending on the purpose
of migration (G. Zincone et al., 2011, page 8):
1. Labour migration;
2. Migration with a colonial background;
3. Refugee migration.
Later on it was agreed that these three categories are not enough to classify all the migrants.
Even though the immigration after the oil crisis did not stop, but the work related migration which
was previously leading against other types, gave up for the family related migration (OECD, 2011).
At this time migration process became more popular topic in political debates. It was realized that
the movement of the people significantly influences country’s economic situation and development,
therefore should be targeted according to the country’s level of development and economic
perspectives.
CE
UeT
DC
olle
ctio
n
8
Since 1950 West Europe has never had a negative net migration value (Graph 1). This region
experienced faster post-war economic recovery. People from less developed countries (mainly
Eastern and Northern blocks) saw West European countries as dreamlands of better life. Soon after
the fall of Iron curtain and collapse of Soviet Union many Eastern Europeans started to look for job
opportunities in the West. The value of net migration in Baltic countries (which, according to UN,
belong to North Europe) was never negative up to the 1990s. This is the result of a strict
supervision and high regulations on migration outside the Soviet Union. Straight after getting back
the independence, Baltic countries experienced first big wave of emigration. Total net migration of
those three countries dropped from 94,000 in 1985-1990 to -348,000 in the period of 1990-1995.
Some of this migration was permanent, while other – temporary, including seasonal work and
travelling shorter distances. Ever since 1990s Baltic countries have never had a positive value of net
migration and with the accession to EU even greater emigration wave came.
The increasing number of EU migration in the previous decades created a need for the
liberalization of people movement within EU. As a result, the migration patterns in EU since 2000
(especially since 2004) significantly changed.
1.2. Current trends of intra-EU mobility
Intra-EU mobility has been increasingly liberalized since the fall of Iron Curtain. The short
distances allow people from less developed countries look for the new opportunities abroad.
Nevertheless, between 2000 and 2005 the average mobility of workers within EU was only 1% per
year (H. Bonin et al., 2008). In 2013 there were 0.5bn of people living in EU. 4.1% of them were
living not in their countries of birth (reported as foreigners) and only 2.7% of people were migrants
CE
UeT
DC
olle
ctio
n
9
with a nationality of one of the EU country (Eurostat). Therefore, even though one of the key
principles of EU is free movement of people, the overall EU citizens’ mobility within EU is still
relatively small and mostly includes movements from East to West or between South and West-
North.
Western European countries have always been more developed and richer than the Eastern
ones. With the higher speed of economic growth West always used to attract more labour force
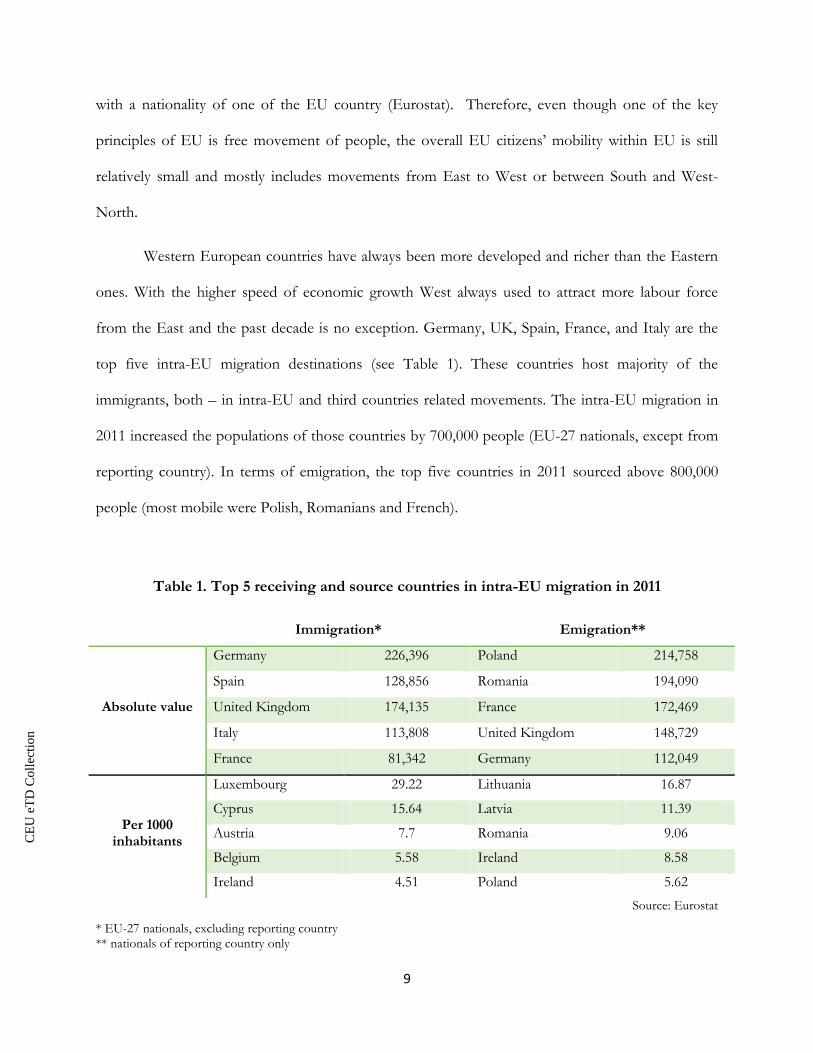
from the East and the past decade is no exception. Germany, UK, Spain, France, and Italy are the
top five intra-EU migration destinations (see Table 1). These countries host majority of the
immigrants, both – in intra-EU and third countries related movements. The intra-EU migration in
2011 increased the populations of those countries by 700,000 people (EU-27 nationals, except from
reporting country). In terms of emigration, the top five countries in 2011 sourced above 800,000
people (most mobile were Polish, Romanians and French).
Table 1. Top 5 receiving and source countries in intra-EU migration in 2011
Immigration* Emigration**
Absolute value
Germany 226,396 Poland 214,758
Spain 128,856 Romania 194,090
United Kingdom 174,135 France 172,469
Italy 113,808 United Kingdom 148,729
France 81,342 Germany 112,049
Per 1000 inhabitants
Luxembourg 29.22 Lithuania 16.87
Cyprus 15.64 Latvia 11.39
Austria 7.7 Romania 9.06
Belgium 5.58 Ireland 8.58
Ireland 4.51 Poland 5.62
Source: Eurostat
* EU-27 nationals, excluding reporting country ** nationals of reporting country only
CE
UeT
DC
olle
ctio
n
10
Even though countries, mentioned above, attract most of the immigrants or are main source
countries in absolute value, they are also the most populous countries in the Europe. Therefore,
there is no surprise that these countries attract most of the migrants. Even if Germany hosts most of
the EU-27 immigrants, in terms of its total population they account only to about 2 percent. When
we consider the immigration and emigration for a 1000 of inhabitants rather than in absolute value,
the results change completely. In 2011 Luxembourg and Cyprus attracted about 29 and 16
immigrants per 1000 inhabitants accordingly. Most migrant were Lithuanians (17) and Latvians (11).
High level of emigration became a serious issue for some countries. For example, since 2000
to 2012 approximately 433,000 people left Lithuania and mostly did not come back. This number
accounts to 1/6 of Lithuania’s total population. Poland, similarly, lost a significant part of its
nationals – over 1 million people emigrated from the country in the period of 2000-2012. A great
loss of people (mainly working age) raised concerns in society and reduced economic capacity of the
countries. As a result, policies targeted towards the reduction of emigration rate gained a significant
importance.
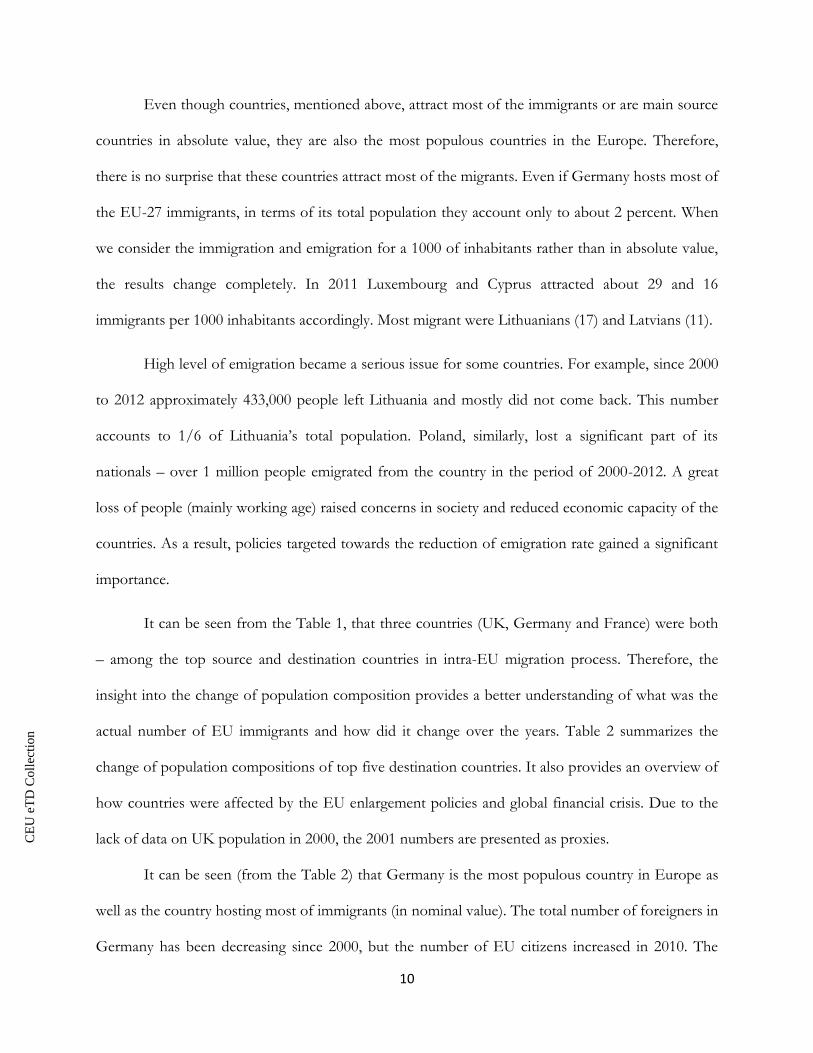
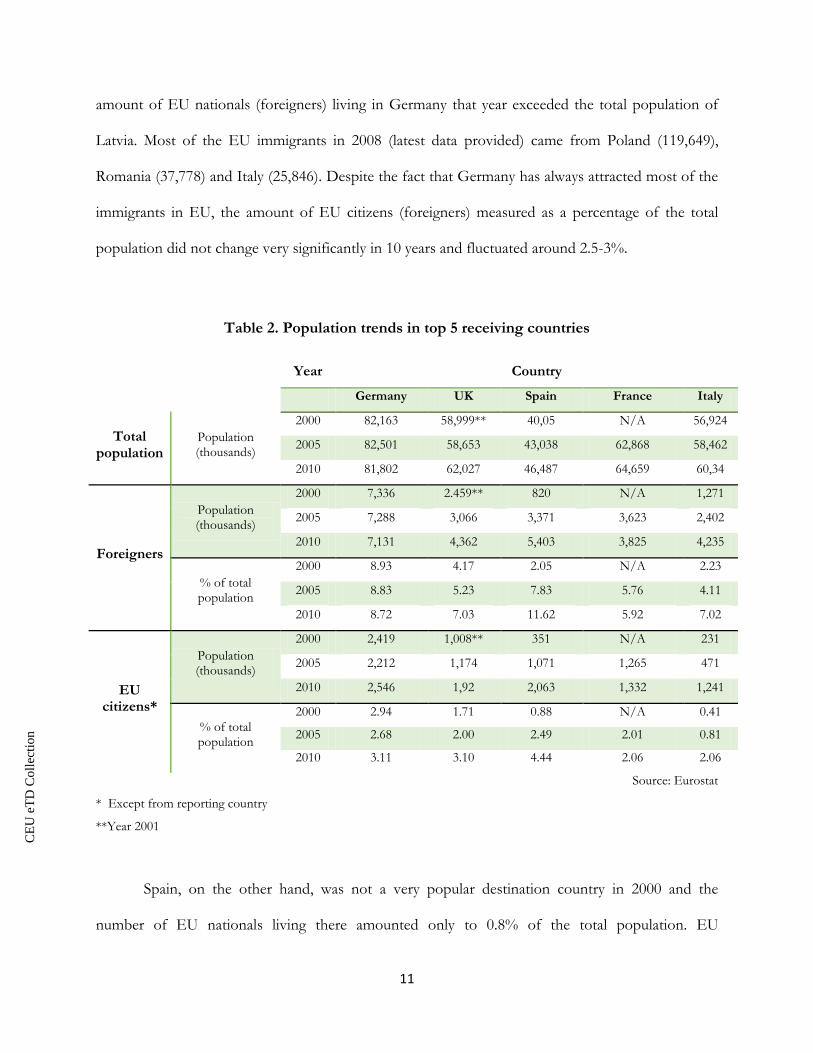
It can be seen from the Table 1, that three countries (UK, Germany and France) were both
– among the top source and destination countries in intra-EU migration process. Therefore, the
insight into the change of population composition provides a better understanding of what was the
actual number of EU immigrants and how did it change over the years. Table 2 summarizes the
change of population compositions of top five destination countries. It also provides an overview of
how countries were affected by the EU enlargement policies and global financial crisis. Due to the
lack of data on UK population in 2000, the 2001 numbers are presented as proxies.
It can be seen (from the Table 2) that Germany is the most populous country in Europe as
well as the country hosting most of immigrants (in nominal value). The total number of foreigners in
Germany has been decreasing since 2000, but the number of EU citizens increased in 2010. The
CE
UeT
DC
olle
ctio
n
11
amount of EU nationals (foreigners) living in Germany that year exceeded the total population of
Latvia. Most of the EU immigrants in 2008 (latest data provided) came from Poland (119,649),
Romania (37,778) and Italy (25,846). Despite the fact that Germany has always attracted most of the
immigrants in EU, the amount of EU citizens (foreigners) measured as a percentage of the total
population did not change very significantly in 10 years and fluctuated around 2.5-3%.
Table 2. Population trends in top 5 receiving countries
Year Country
Germany UK Spain France Italy
Total population
Population (thousands)
2000 82,163 58,999** 40,05 N/A 56,924
2005 82,501 58,653 43,038 62,868 58,462
2010 81,802 62,027 46,487 64,659 60,34
Foreigners
Population (thousands)
2000 7,336 2.459** 820 N/A 1,271
2005 7,288 3,066 3,371 3,623 2,402
2010 7,131 4,362 5,403 3,825 4,235
% of total population
2000 8.93 4.17 2.05 N/A 2.23
2005 8.83 5.23 7.83 5.76 4.11
2010 8.72 7.03 11.62 5.92 7.02
EU citizens*
Population (thousands)
2000 2,419 1,008** 351 N/A 231
2005 2,212 1,174 1,071 1,265 471
2010 2,546 1,92 2,063 1,332 1,241
% of total population
2000 2.94 1.71 0.88 N/A 0.41
2005 2.68 2.00 2.49 2.01 0.81
2010 3.11 3.10 4.44 2.06 2.06
Source: Eurostat
* Except from reporting country
**Year 2001
Spain, on the other hand, was not a very popular destination country in 2000 and the
number of EU nationals living there amounted only to 0.8% of the total population. EU
CE
UeT
DC
olle
ctio
n
12
enlargement opened the doors to Spain and in 2005 the amount of EU citizens tripled to from 0.8%
to 2.49%. During the following 5 years, despite the severity of economic crisis in the country, the
number of EU immigrants increased even more and reached 4.4% of the total population. In 2012
Spain was still a popular destination country and most of the immigrants came from Romania
(64,716), UK (11,407) and Bulgaria (11,306).
In general, the volume of migration has been increasing in the whole Europe in the past
decade. Policy makers in EU put a lot of attention in removing barriers for labour flows.
Nevertheless, in 2011 only approximately 7% of EU citizens had been working abroad and 3% were
currently working in the other member state. This means that nine out of ten EU citizens have never
used the advantage of relatively free labour force movement within EU. Moreover, more than half
of the population probably will never use the benefits of free labour flows - 53% of EU citizens
were not interested in working abroad (in 2011) and only one third of the population claimed that
they might consider the opportunity to work in the other member state (Eurobarometer, 2011).
People from Luxembourg and Ireland clearly stand out from the rest of the Europe, reporting that
35% and 21% (respectively) of the population did try to work abroad or currently were employed in
the other EU member state. The respondents from Czech Republic, on the contrary, had the least
experience of working abroad – only 4% of the population did try to work abroad and just 13%
would consider to do it any time in the future (which is the lowest rate among all EU countries).
Based on the statistics provided by Eurobarometer (2011), the enthusiasm of EU labour
force to migrate is not as great as policy makers would like it to be. It even decreased since 2009
when labour migration process was severely affected by the crisis. With the start of the financial
crisis in 2008, EU countries experienced multiple significant negative shocks. Economies contracted
and a rapid labour demand growth stimulated by the economic boom was over. Some countries saw
a great decrease in the emigration rate between 2008 and 2009 (Germany, Romania, UK) while in
CE
UeT
DC
olle
ctio
n
13
other countries emigration boomed as locals lost their jobs and were forced to move abroad. The
number of emigrants increased from 67,329 to 178,915 in Poland between 2008 and 2009; in
Lithuania the number increased from 21,793 to 33,522. The main destination countries felt the crisis
as well. The amount of immigrants Germany received in 2009 was 210,142 smaller than in 2008, in
Italy -76,729, in Spain -44,366, in UK -30,296 and in France -7,468.The migration from EU8
countries was affected as well. The biggest drop of immigrants from EU8 was felt in UK and Ireland
(Eurostat), while Germany, Spain and Italy felt smaller change in the amount of arrivals from new
EU member states.
In general, work related migration was most severely affected by the crisis while other type
of migration declined to a lesser extent. Despite the consistent increase in the number of intra-EU
migrants up to 2008 and EU attempts to gradually liberalize migration policies, permanent regulated
labour intra-EU migration decreased by about 36% from the year 2007 to 2009 (OECD, 2011).Crisis
changed the face of labour market all over the Europe.
1.3. Labour market of the migrants
After a great increase of the number of foreign workers in EU member states, policy makers
faced a need to take some actions in order to ease up the integration process for arrivals. The policy
decisions had to be adapted to each country accordingly, since the nature of work related migration
differs from country to country. The stance of the labour market of the immigrants significantly
influences the pull factors of the migration process.
Generally, more developed countries experience a greater amount of low skilled labour
immigration while less developed countries are attracting high skilled workers from abroad who are
offered a relatively high salary. At the moment of EU enlargement more industrialized countries
CE
UeT
DC
olle
ctio
n
14
(Germany, France, Belgium) attracted more immigrants to such sectors as manufacturing,
information and communication technology. North countries employed immigrants in state
agencies, community service, health and education sectors. South Europe has always been
developing its agricultural traditions, therefore, such countries as Spain, Italy, Greece, were always
offering some seasonal jobs in the agriculture sector as well as employment in retail, construction
and tourism (L.T. Katseli, 2004).
With the opening of their markets, EU member states expected that the flow of immigrants
would fill in the gaps in the labour market (especially in those markets that pay close to minimum
wage).The industries that were expected to be mostly affected in UK were agriculture,
manufacturing, food, production and catering. The expectations partially came true since majority of
immigrants took over low paid jobs, but they also moved to business, clerical and administrative
jobs (ONS).Between May 2004 and December 2006 UK registered most of the immigrants having
such occupations as factory worker (270,180 immigrants), warehouse operative (39,545) and packer
(32,210). In 2012 situation did not change significantly and immigrants in UK were still mainly
working in a low paid sectors, such as elementary process plant and food preparation and hospitality
(C. Rienzo, 2013).
Immigration changes the labour supply in a destination country. As low skilled job vacancies
are being filled in, an increasing amount of jobs in UK require graduate-level qualifications. In 20
years (1986-2006) the amount of jobs that do not require proper qualifications decreased from 38%
to 28% and it dropped even more to 23% in 2012. The number of jobs that do require certain
qualifications was increasing accordingly from 20% in 2006 to 26% in 2012 (D. Adam, 2014).
Germany has seen a similar trend. In 2013 the Labour Minister of Germany claimed that the country
seeks long-term prosperity, therefore it needs skilled immigrants (EUbusiness, 2013). The country
focused in attracting a greater amount of immigrants qualified in health care, electronics and
robotics.
CE
UeT
DC
olle
ctio
n
15
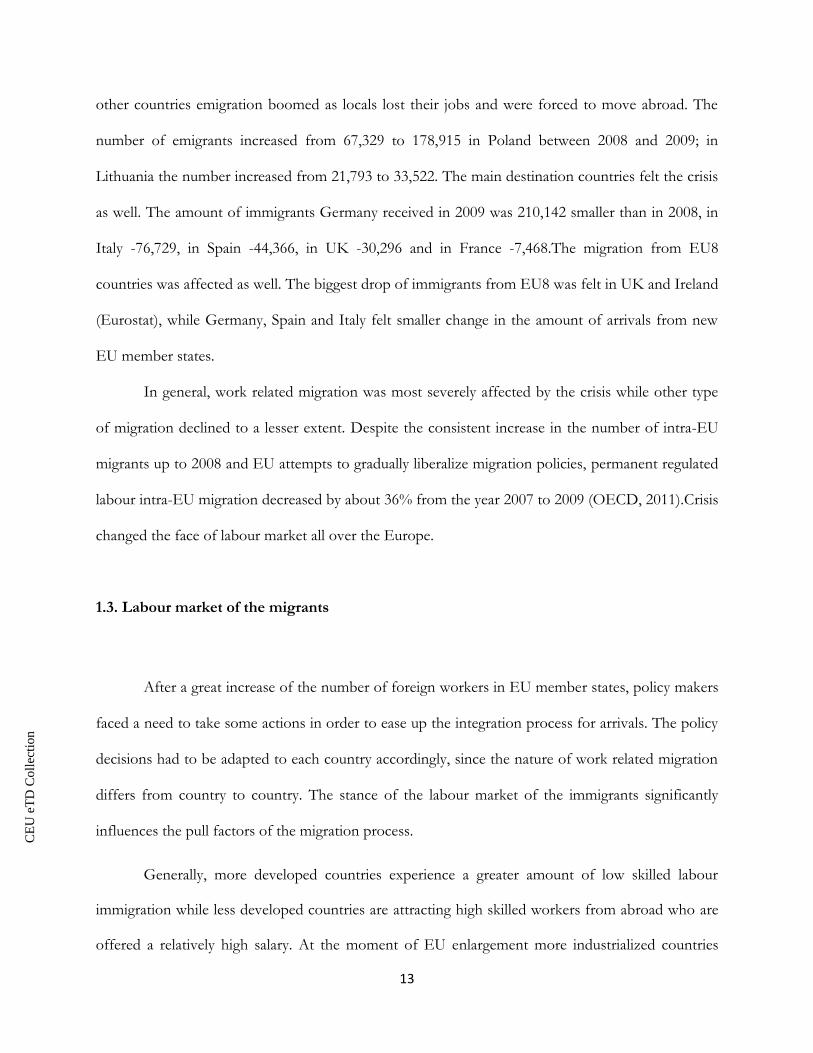
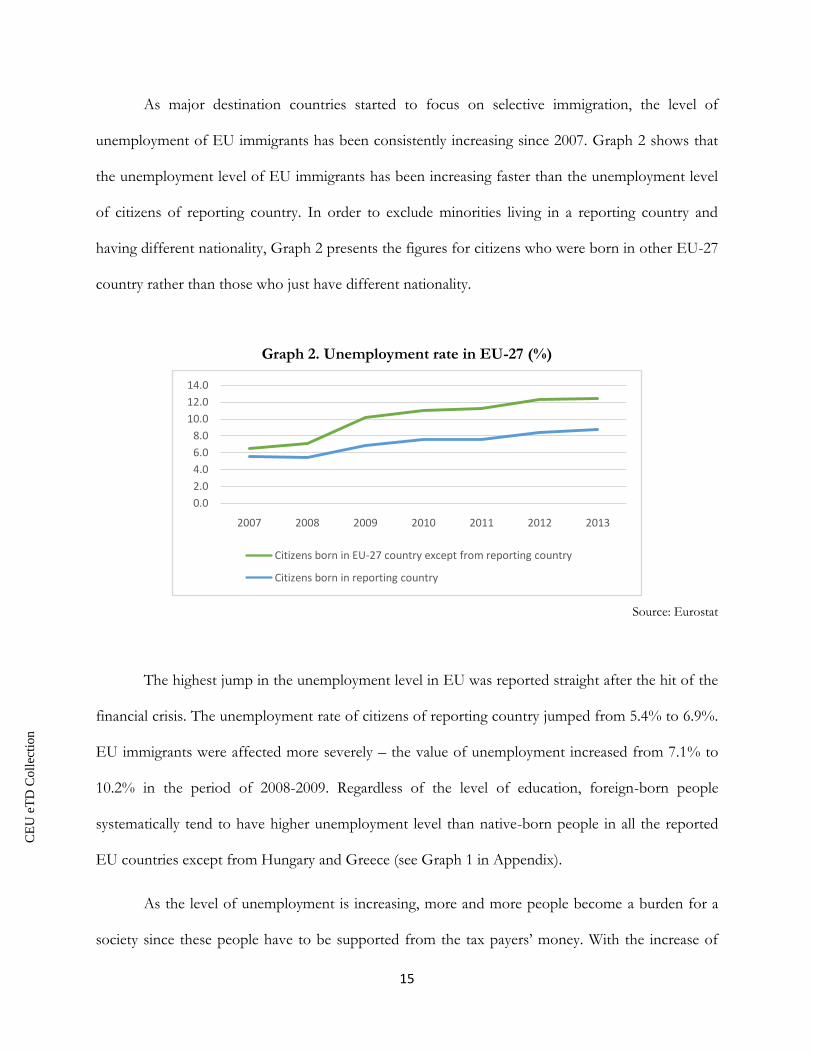
As major destination countries started to focus on selective immigration, the level of
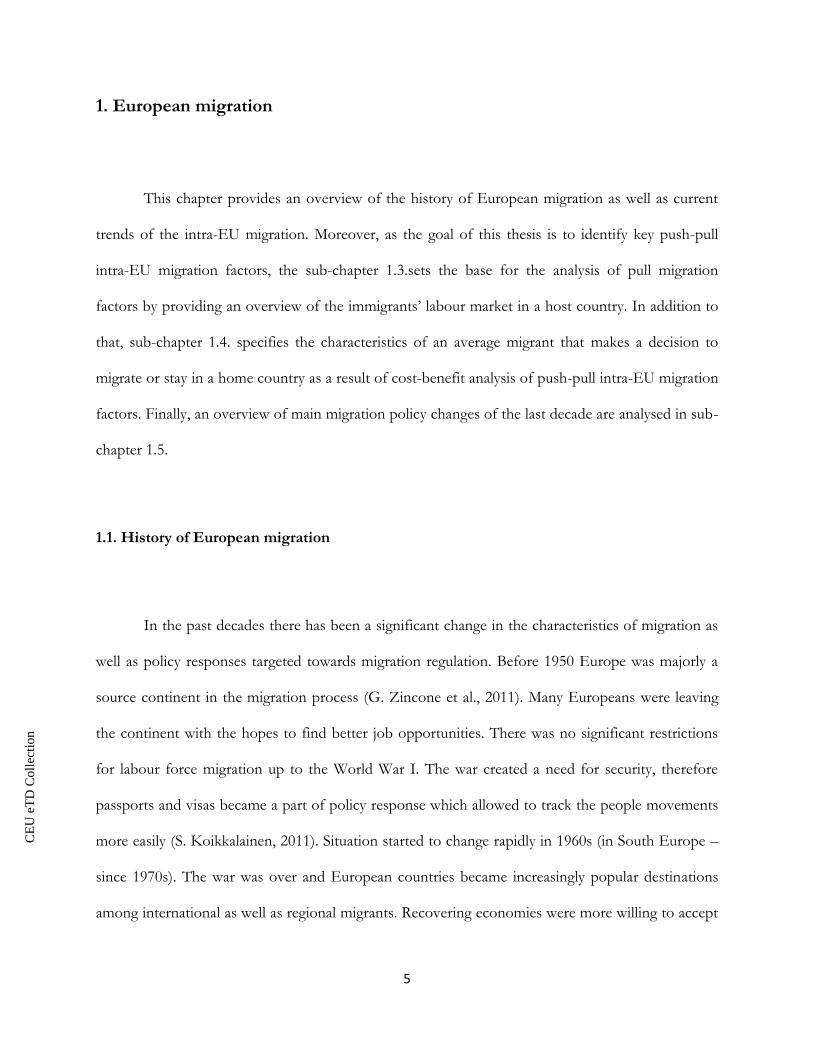
unemployment of EU immigrants has been consistently increasing since 2007. Graph 2 shows that
the unemployment level of EU immigrants has been increasing faster than the unemployment level
of citizens of reporting country. In order to exclude minorities living in a reporting country and
having different nationality, Graph 2 presents the figures for citizens who were born in other EU-27
country rather than those who just have different nationality.
Graph 2. Unemployment rate in EU-27 (%)
Source: Eurostat
The highest jump in the unemployment level in EU was reported straight after the hit of the
financial crisis. The unemployment rate of citizens of reporting country jumped from 5.4% to 6.9%.
EU immigrants were affected more severely – the value of unemployment increased from 7.1% to
10.2% in the period of 2008-2009. Regardless of the level of education, foreign-born people
systematically tend to have higher unemployment level than native-born people in all the reported
EU countries except from Hungary and Greece (see Graph 1 in Appendix).
As the level of unemployment is increasing, more and more people become a burden for a
society since these people have to be supported from the tax payers’ money. With the increase of
0.0
2.0
4.0
6.0
8.0
10.0
12.0
14.0
2007 2008 2009 2010 2011 2012 2013
Citizens born in EU-27 country except from reporting country
Citizens born in reporting country
CE
UeT
DC
olle
ctio
n
16
unemployment level of immigrants, the public dissatisfaction rise even more – people are not happy
with the idea that they have to support arrivals from other countries. This leads to a situation where
policy makers implement restrictions of who and under what conditions can apply for social
benefits. Decreased level of availability to social protection significantly reduces country’s
attractiveness among the migrants.
The situation where unemployment of immigrants is rising and social benefits are
increasingly more difficult to get results in and greater number of immigrants working illegally. The
activity of authorities and labour unions determine which countries are more popular among
migrants willing to work illegally. Denmark in general pays high wages, nevertheless, it is not very
popular destination country among the low-skilled migrants. Main reason is that when it comes to
hiring a person for a low paid job, local people are preferred against immigrants and since high level
of regulation makes it difficult to pay lower wages than minimum, immigrants have a great
disadvantage against the locals. In Denmark there are 169 trade unions. Due to high level of
competition, trade unions are deeply involved in the cases of work-related injuries, wage and
working conditions determination, rehabilitation and other (Work in Denmark). On the contrary to
Denmark, in UK there is only one union confederation and some independent trade unions and
only less than 1/3 of UK employees are the members of either of it(ETUI, 2013). With lower
representation rate immigrants in UK are more vulnerable and employers have more freedom to
obey the law and pay wages that are lower than the official minimum. This results in a greater low
skilled labour force flow to UK even if official wages in UK are smaller than in Denmark (according
to UN, the average wage in Denmark in 2012 was $5646.8 while in UK $4220.9).
CE
UeT
DC
olle
ctio
n
17
1.4. How does the intra-EU migrant look like?
The migration trends provide the information about the total number of migrants within
EU. Nevertheless, some EU citizens are more willing to migrate than the others. As previously
mentioned, citizens from some countries are more open to new opportunities abroad than the other.
Ireland and Luxembourg have the highest ratio of people who have worked abroad. Moreover,
people in Nordic countries are more willing to consider working in another EU member state – 71%
of Swedish and 46% of Finnish people would like to get some experience of working within EU
(Eurobarometer, 2011).
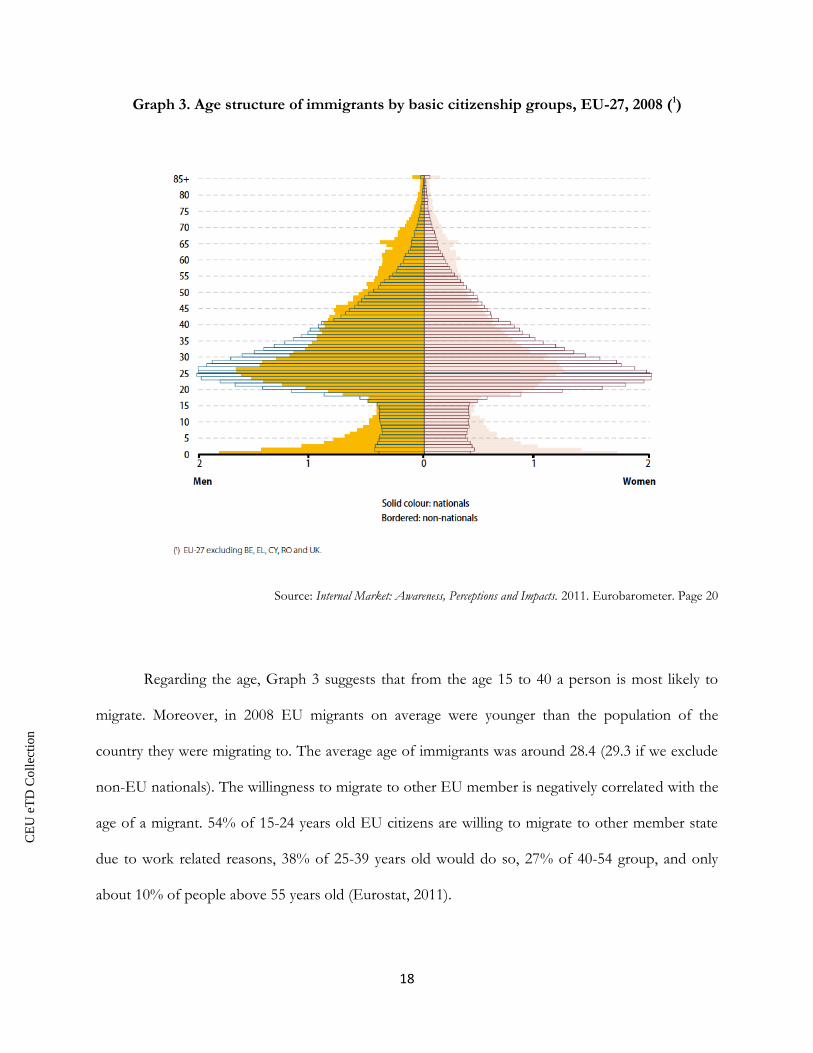
There are also significant gender differences in the migration process. The migration
statistics provided by Eurostat does not show a high difference in the amount of migrant males and
females. It can be seen from the Graph 3, that the population structure in EU-27 for nationals and
non-nationals is relatively similar regardless of gender. Nevertheless, Eurostat provides the total
number of people who migrated, despite the fact that many of them migrate due to non-work
related reasons (especially women, who are more likely to migrate due to family reasons). According
to the Eurobarometer (2011) survey results, men are more likely to migrate than women due to
work related reasons. On average 31% of male respondents would consider working in other EU
member state while only 24%of women would do the same. In addition to that, the higher
percentage of women are not interested in changing their country for work related reasons.
CE
UeT
DC
olle
ctio
n
18
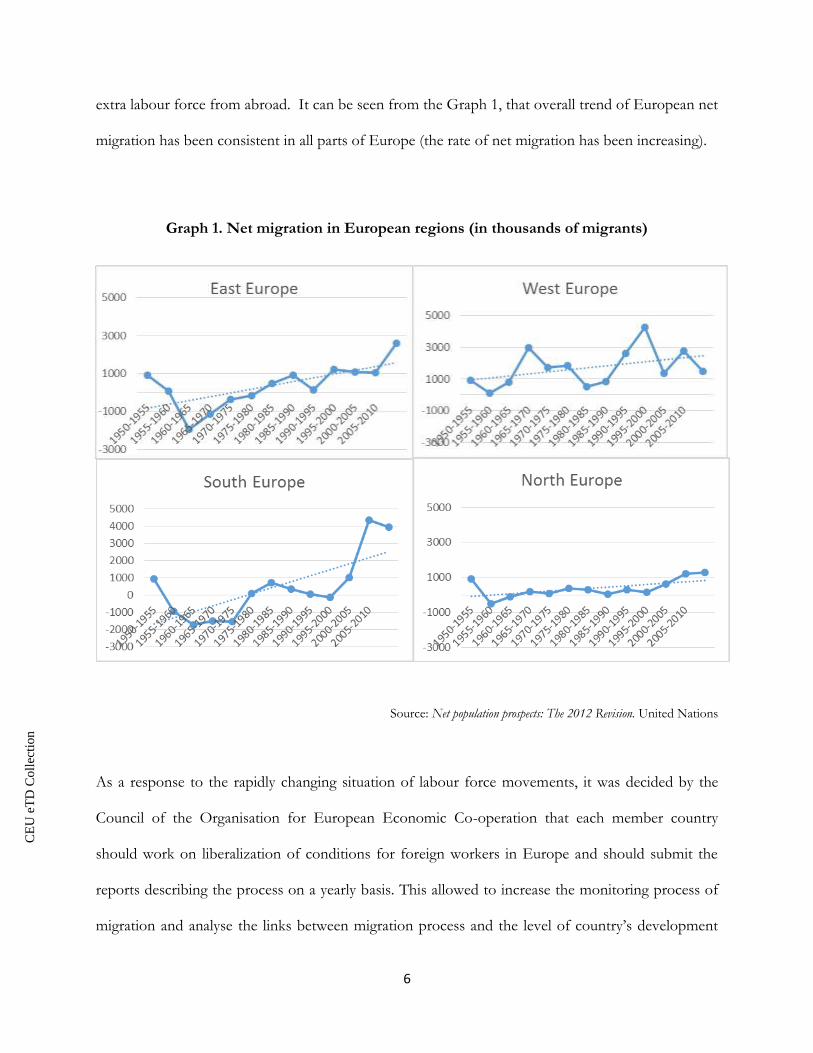
Graph 3. Age structure of immigrants by basic citizenship groups, EU-27, 2008 (1)
Source: Internal Market: Awareness, Perceptions and Impacts. 2011. Eurobarometer. Page 20
Regarding the age, Graph 3 suggests that from the age 15 to 40 a person is most likely to
migrate. Moreover, in 2008 EU migrants on average were younger than the population of the
country they were migrating to. The average age of immigrants was around 28.4 (29.3 if we exclude
non-EU nationals). The willingness to migrate to other EU member is negatively correlated with the
age of a migrant. 54% of 15-24 years old EU citizens are willing to migrate to other member state
due to work related reasons, 38% of 25-39 years old would do so, 27% of 40-54 group, and only
about 10% of people above 55 years old (Eurostat, 2011).
CE
UeT
DC
olle
ctio
n
19
One of the key reasons why young people are more mobile is that on average they have less
constraints to move – young working age person is more likely to migrate if he/ she does not have a
family nor children yet. According to the survey, the activity ratio of an immigrant woman drops
from 79% to 69% with a birth of a child. Even if the immigrant women who are EU nationals are
less affected by the birth of a child than non-EU ones, they still follow the same pattern –the activity
ration has a negative correlation to the number of dependent children in the family (Eurobarometer,
2011).
Finally, the level of education plays an important role in making the decision to migrate as
well, as more educated people are more likely to migrate. According to Eurostat (2011), people who
left the school at the age of 15 or below are less willing to try their luck in the other member state
(only 12% of citizens from this age group would be interested in working abroad). 23% of people
who left education at the age of 16-19 would agree to work abroad and 36% of citizens who
continued their education up to their 20s would move to other EU member state for job related
reasons.
The outcomes of H. Bonin et al. (2008) research are in line with the discussed results of the
surveys. According to the authors, a person who is more likely to migrate is a young male, who is
not married and has no children, has acquired higher skills and education, is unemployed or already
has experienced one or another way of movement in the past.
The typical characteristics of an average EU migrant are constantly observed by policy
makers who use this information in shaping migration policies. Thorough understanding of
migration patterns and drivers is key in adopting successful and fruitful migration policies.
According to A. Cangiano (2012), the decisions that policy makers make have an impact on both –
immediate labour market outcomes as well as perspectives of long term economic integration.
CE
UeT
DC
olle
ctio
n
20
1.5. EU migration policies
Despite the significant influence of various economic factors in the migration process, policy
decisions determine how open the country is for the immigration. Many steps have been taken by
EU in the past decades in order to encourage the process of intra-EU migration. One of the first
and most significant steps taken by EU in reducing the barriers for people movement was the
Schengen agreement which created a borderless area within EU. Ever since this agreement EU was
working towards creating a Single European Market that would bring more freedom into the
movements within EU. After signing around 280 separate legislation acts in 1993 Single European
market became reality (EC). The purpose of it is to reduce the barriers and simplify existing rules for
everyone in the EU. This goal is being reached by ensuring the existence of four freedoms – free
movement of people, capital, goods and services. The creation of Single Market was just a beginning
in a long ongoing process of securing four freedoms and many laws and treaties have been adopted
ever since.
Labour migration policies of EU prioritize legal immigration that fulfils the individual labour
market needs of each member state. Already in 1999 the Treaty of Amsterdam concluded that there
is a need of creation of common immigration and asylum policies within EU member states.
Nevertheless, the process of migration liberalization was developing very slowly as it is never easy to
find a common agreement between so many countries. Member states agreed to work on family
reunification question but failed to adopt common rules regarding admission of immigrants (Y.
Pascouau, 2013).
The further big step taken by EU was the accession of 10 new member states in 2004. The
enlargement of EU brought new work opportunities for the citizens of new member states and new
labour force pools for existing ones. Nevertheless, most of the older member states decided to restrict
CE
UeT
DC
olle
ctio
n
21
the labour force movements from new member states for a predefined period of time. Only three
countries welcomed new immigrants from the very first day – UK, Sweden and Ireland. Before 2004,
the number of EU immigrants in Sweden fluctuated around 14,000. With the EU enlargement new
immigration wave came into the country bringing up the number to 16,417 in 2004 and 18,421 in 2005
(Eurostat). Ireland has seen even higher increase in the number of EU immigrants, but was still far
away from UK. From all the new Eastern European countries members, Poland, Slovakia and
Lithuania sourced most of the migrants to UK after the enlargement (S. Longhi and M. Rokicka,
2012). The UK net migration rate hit its high in 2004 and equalled 222,600, compared to 151,000 a
year earlier. According to the ONS, about 52,600 workers came from newly accepted EU member
states – this represent about 40% of the total increase in immigration rate. In the later years, the
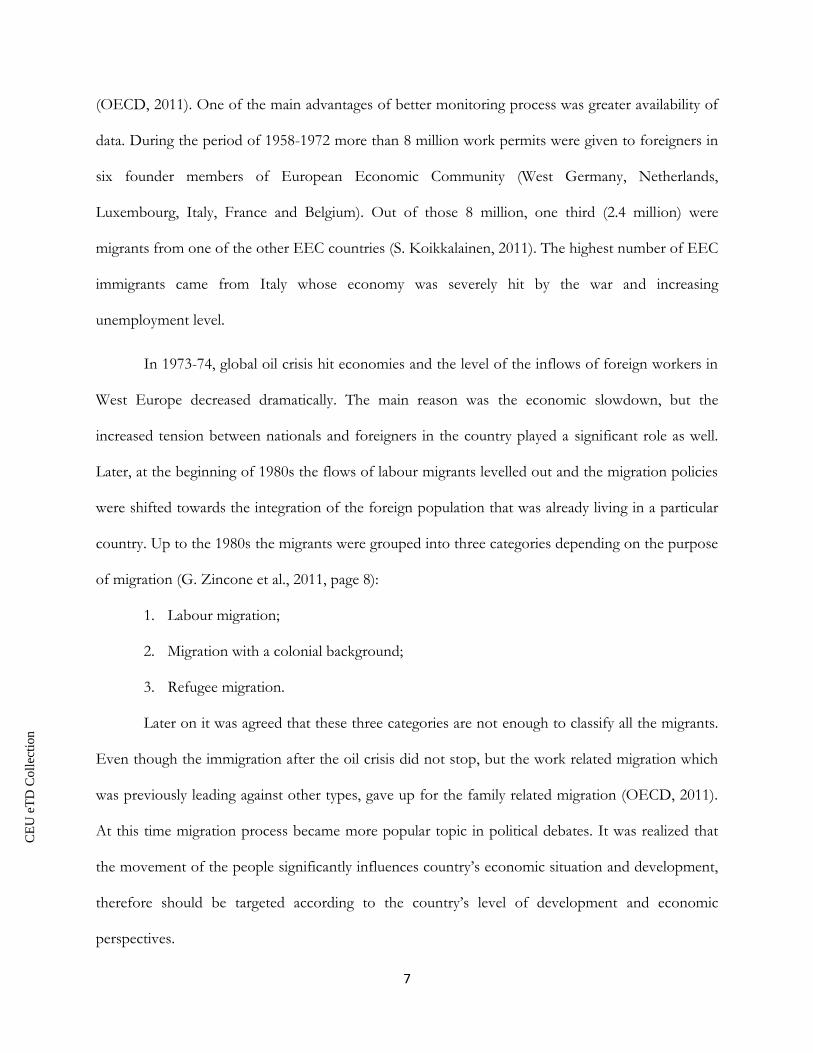
immigration rate from EU8 countries kept growing dramatically up to 2008 financial crisis (see Graph
4). Despite the fact, that only these three countries opened up their borders for the new EU labour
migrants, some other countries felt the increase in the amount of immigrants as well. Germany saw an
increase of more than 36,000 people, Spain – above 54,000 people. On the other hand, the amount of
EU-27 immigrants in Italy decreased by 10% (Eurostat).
CE
UeT
DC
olle
ctio
n
22
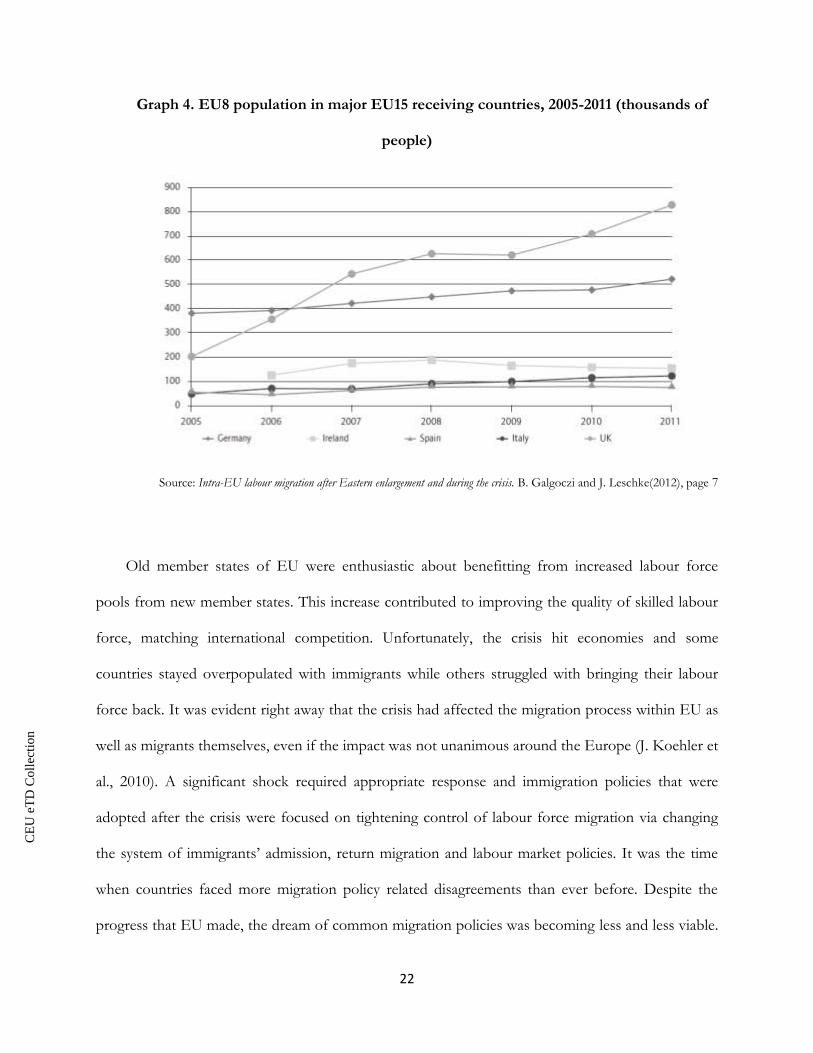
Graph 4. EU8 population in major EU15 receiving countries, 2005-2011 (thousands of
people)
Source: Intra-EU labour migration after Eastern enlargement and during the crisis. B. Galgoczi and J. Leschke(2012), page 7
Old member states of EU were enthusiastic about benefitting from increased labour force
pools from new member states. This increase contributed to improving the quality of skilled labour
force, matching international competition. Unfortunately, the crisis hit economies and some
countries stayed overpopulated with immigrants while others struggled with bringing their labour
force back. It was evident right away that the crisis had affected the migration process within EU as
well as migrants themselves, even if the impact was not unanimous around the Europe (J. Koehler et
al., 2010). A significant shock required appropriate response and immigration policies that were
adopted after the crisis were focused on tightening control of labour force migration via changing
the system of immigrants’ admission, return migration and labour market policies. It was the time
when countries faced more migration policy related disagreements than ever before. Despite the
progress that EU made, the dream of common migration policies was becoming less and less viable.
CE
UeT
DC
olle
ctio
n
23
Based on A. Cangiano (2012) research, migration policies of EU up to now remain a question of
national policy framework.
Post-crisis policy changes complicated immigration process in many EU countries. The first
countries to take actions were those that imposed no restrictions on immigration after EU
enlargement. Ireland was one of few countries that opened its borders in 2004. After a record high
immigration rate prior the crisis, this country took actions in restructuring the immigration rules for
the family members of a migrant, making it more difficult to get work permit (OECD). UK reacted
even more harsh and set the goal that the number of immigrants in the future would remain within
tens of thousands per year. The country also reformed its social benefits system making it more
difficult for immigrants to get housing provided by a state. In general, most of the countries
(including Italy, Slovenia, Hungary, Portugal, Croatia) implemented restrictive immigration policies
by reducing the number of work permits issued. Other countries chose implementation of minimum
salary requirements, restrictions on certain countries (e.g. Greece and Hungary put restrictions for
immigrants from Romania and Bulgaria) or chose other tools. New rules led to higher emigration
rates in some countries (UK and Ireland) where a greater part of the emigrants were the people who
immigrated to those countries before the economic difficulties. Post-crisis migration policies were
mainly adopted under a pressure and were not reflecting short and long term demographic and
economic goals (J. Koehler et al., 2010).
Migration policies that do not fully reflect economic needs of a country may cause more harm
than benefit. Germany is one of the countries that still struggles to attract a sufficient number of
qualified immigrants. The German firms identify Germany’s migration policies as one of the key
restraints for intensifying the recruitment of the foreigners (A. F. Constant and U. Rinne, 2013).
There are also other EU countries that struggle to achieve the desired results of the implemented
migration policies. Even if the goal of UK’s post-crisis immigration policy changes was to reduce the
CE
UeT
DC
olle
ctio
n
24
number of net migration to “thousands of immigrants”, country never came even close to this
number (see Graph 4). One of the main reasons was the failure of policy makers to thoroughly
analyse the main push and pull factors influencing migration process. Instead of focusing on
selective migration, policy makers put their attention towards creating unfriendly atmosphere for
social welfare migrants. On the other side, countries trying to fight emigration problem (like
Lithuania) were not successful in attracting their citizens back neither. There is a wide variety of
factors determining person’s willingness to migrate and all of those factors have to be taken into
consideration by policy makers while shaping migration policies.
CE
UeT
DC
olle
ctio
n
25
2. Migration theories and empirical evidence
Throughout the years, various theories have been developed as an attempt to explain the
patterns of people movement. They all have one common assumption – migration is a voluntary act
of people and the models do not attempt to explain forced migration (M.J. Greenwood, 2005).
Despite this unanimous agreement, the scientists of different fields provide different explanations of
the causes of migration. According to the social network theories, people move to already existing
migration networks. Cultural theories focus on migration caused by the center-periphery patterns.
Economic theories consider migration as a process of people’s response to economic and labour
market stimulus (M. Hooghe et al., 2008). The aim of this chapter is to analyse those key concepts of
major migration theories and empirical studies in order to set a background for the further research
and policy suggestions.
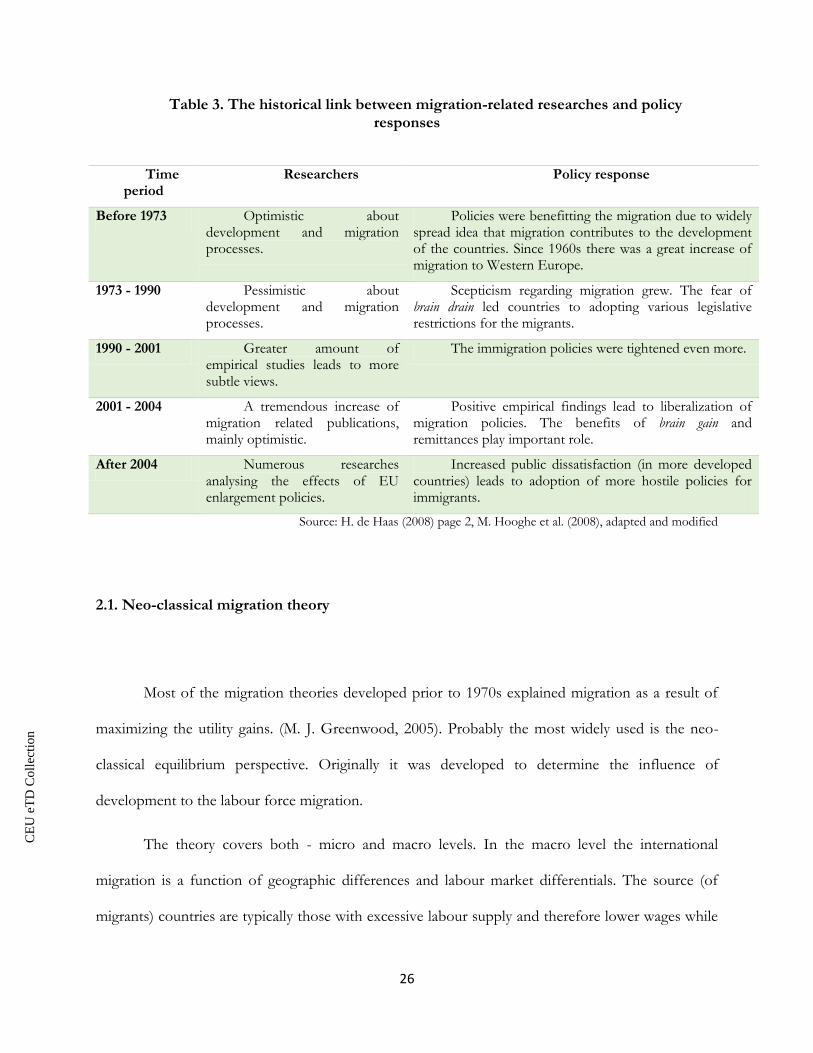
The various migration theories and findings have always played a significant role in policy
decisions making (see Table 3). As it can be seen, the policy decisions in general reflected the
direction of researches. With the increase in the number of researches emphasizing the benefits of
migration, the policy makers were more willing to liberalize the migration process. As the amount of
researches proving the harm of the migration was increasing, so did the amount of legislative
restrictions.
CE
UeT
DC
olle
ctio
n
26
Table 3. The historical link between migration-related researches and policy responses
Time period
Researchers Policy response
Before 1973 Optimistic about development and migration processes.
Policies were benefitting the migration due to widely spread idea that migration contributes to the development of the countries. Since 1960s there was a great increase of migration to Western Europe.
1973 - 1990 Pessimistic about development and migration processes.
Scepticism regarding migration grew. The fear of brain drain led countries to adopting various legislative restrictions for the migrants.
1990 - 2001 Greater amount of empirical studies leads to more subtle views.
The immigration policies were tightened even more.
2001 - 2004 A tremendous increase of migration related publications, mainly optimistic.
Positive empirical findings lead to liberalization of migration policies. The benefits of brain gain and remittances play important role.
After 2004 Numerous researches analysing the effects of EU enlargement policies.
Increased public dissatisfaction (in more developed countries) leads to adoption of more hostile policies for immigrants.
Source: H. de Haas (2008) page 2, M. Hooghe et al. (2008), adapted and modified
2.1. Neo-classical migration theory
Most of the migration theories developed prior to 1970s explained migration as a result of
maximizing the utility gains. (M. J. Greenwood, 2005). Probably the most widely used is the neo-
classical equilibrium perspective. Originally it was developed to determine the influence of
development to the labour force migration.
The theory covers both - micro and macro levels. In the macro level the international
migration is a function of geographic differences and labour market differentials. The source (of
migrants) countries are typically those with excessive labour supply and therefore lower wages while
CE
UeT
DC
olle
ctio
n
27
the adopting countries tend to have higher labour demand and are willing to provide higher wages.
As a result the migration process is described as a tool to reach the equilibrium between countries
having excess labour supply and scarce capital and countries lacking the labour supply but having a
significant capital flow to offer (D. S. Massey et al., 1993). This movement of opposite directions
leads to convergence meaning that in a long term the incentive to migrate disappears (H. de Haas,
2008). Since, according to this theory, the absence of wage differentials would mean no incentive to
migrate – the best policy options targeting migration flows are related to intervening into the labour
market in order to eliminate the disequilibrium between the source and receiving countries.
The macro level theory did not provide full satisfactory explanation of why people chose to
leave one country and move to another one. Various scientists argue that there is much more than
just wage differentials determining the decision to migrate. As a result, economists turned back to
the micro level data. According to this adapted theory, a migrant is a rational thinking person who
forms his/ her decision to migrate depending on the thorough cost-benefit analysis (H. de Haas,
2008). The wage differentials are no longer solely most important factor in making the decision to
migrate. A migrant also tries to find a place where he/she could be most productive regarding the
skills he/ she possess and also reach the highest net benefits. Micro level neo-classical migration
theory takes into account such factors as costs related to migration process itself. Those costs
include actual price of migration, learning the language, getting familiar with new culture, and other.
Therefore, a person who is more educated, more skilled or knows the local language is more likely to
migrate. D. Chiquiar and G. Hanson (2002) empirically proved that Mexican immigrants to US on
average are more educated than people staying in Mexico.
The other important factor in making decision to migrate, according to this theory, is the
employment level difference that helps to determine how likely an individual is to find the job in a
new country. In other words, before making a decision to migrate, a person calculates expected net
CE
UeT
DC
olle
ctio
n
28
gain (discounted value of future earnings minus the migration costs) in other country with what he/
she would earn by staying home or moving to even another country (T. Mitze and J. Reinkowski,
2010). This rational decision making was explained by many scientists. One of the most well-known
is Harris – Todaro model according to which the migration from rural to urban areas is based on net
income rather than wage differentials (J. R. Harris and M. P. Todaro, 1970). This model can also be
used to explain international migration and willingness to migrate can be expressed as (T. Mitze and
J. Reinkowski, 2010):
𝑌𝑖𝑖𝐸 < 𝑌𝑖𝑗
𝐸 − 𝐶𝑖𝑗
(1)
where:
𝑌𝑖𝑖𝐸 - expected income in a home country which is determined as a function of wage/ income rate in
home country and a probability to be employed in home country.
𝑌𝑖𝑗𝐸 - expected income in the host country
𝐶𝑖𝑗 - migration costs
This formula shows that a person chooses to migrate if the value of income in home country
is smaller than the difference of income in other country minus migration costs. Since the micro
level neo-classical migration theory includes a wider variety of factors, the policy response aimed at
targeting migration, according to this theory, must be broader than just influencing the labour
market. In addition, it must also cover such areas as controlling expected (rather than observed)
income, costs of migration or probability of getting work.
Even though the neo-classical migration model is widely used by various scientists as well as
policy makers, the empirical studies do not provide full support to it, nor they give enough evidence
to deny it. G. J Borjas (2000) provides evidence that the differences in migration costs significantly
CE
UeT
DC
olle
ctio
n
29
contribute in determining the willingness to migrate – those people whose costs of migration are
lower are more likely to migrate. Even if the migration costs are equal, the shape of income
distribution determines the migration. C. A. Pissarides and I. McMaster (1990) show similar findings.
Authors present strong statistical proof that wage differentials have a significant impact in
determining migration. But differently from G.J Borjas, they claim that the differences in the growth
of wages influence migration, not the level of wages. In addition to wage differences, unemployment
ratios have a great impact on the scope of migration too and, in the contrast to wage differences, it
has permanent effects.
If we take into account static macro level neo-classical migration model, the wages should be
the most important determinant in shaping the migration models. Nevertheless, most of the scientists
avoid the limitations and turn their view towards much broader spectrum of migration determinants.
In the contrast to previously described findings, C. Dustmann (2003) develops the idea that wage
differences may even lead to misleading conclusions when trying to determine migration patterns.
The author analyses the optimal duration of the migration period and finds out that people may come
back to their home country earlier if the wages increase in the host country. This process can be
explained by the wage and income effects. The wage effect supports the neo-classical model and
suggests that when the wages in host country increase, immigrants prefer to stay there longer. But, on
the other hand, the income effect describes marginal utility of wealth which has an opposite effect
because of the decreasing gain in staying in the host country. Moreover, narrowing down the sample
of migrants into the subgroups can provide interesting results. In his paper, M. Vujicic (2004)
narrows down the population to health care sector and finds that there is a very little correlation
between the size of the difference in source and receiving country and supply of the migrants. He
even suggests that the professionals of health care take the decision to migrate based not on the wage
differentials but rather on other non-wage related factors. People with certain personal characteristics
CE
UeT
DC
olle
ctio
n
30
(like those having families) are less likely to move even if the wage differences are high (P. Antolin
and O. Bover, 1997).
The key concepts of neo-classical theory of migration are often contradicting with actual
empirical findings. Nevertheless, this model still remains a starting point for most of the empirical
studies analysing external as well as internal and regional migration (T. Mitze and J. Reinkowski,
2010).
2.2. Gravity model for migration
As mentioned above, the geographic differences play an important role in the neo-classical
migration theory. One of the most significant migration costs is the actual price of moving to other
country. Therefore, according to this theory, people are less likely to migrate with an increase of the
distance between the countries. Already in 1940s scientists noticed the pattern that distance has a
significant impact in person's willingness to move. Princeton astronomer Stewart was observing his
students (regarding the distance to their home) and described their behaviour in terms of
gravitational or demographic force which depends on the population sizes and squared distances (M.
J. Greenwood, 2005). Later on this model was adapted to depict migration patterns and expressed
as:
Mij =GPiβ1
Pjβ2
Dijα
(2)
where:
Mij- migration from region i to j
G - constant
Pi / j - population size of iand j respectively
Dij - distance between iand j
CE
UeT
DC
olle
ctio
n
31
According to this formula, person’s willingness to migrate increases together with population
size (in source, adapting or both countries) and decreases with an increase of distance between the
regions. This gravity model of migration was rarely tested since it is pretty straightforward and does
not require additional effort. Nevertheless, it is very broad and do not provide satisfactory
background for migration related researches. In 1960s the original model was modified as many
economists were including various behavioural factors into it. There were many attempts to define
the best explanatory variables and common expression of those models can be defined as:
lnMij = lnβ0 + β1lnDij + β2lnPi + β3lnPj + β4lnYi + β5lnYj + βin ln Xin
m
n=1
+ βjn ln Xjn
m
n=1
+ eij
(3)
where:
Mij- migration from region i to j
Dij - distance between iand j
Pi / j - population size of iand j respectively
Yi / j - income of i/j region
Xi/ j - other commonly included factors (such as unemployment rate, taxes, environmental factors, development proxies and other)
Modified gravity models are still important in empirical studies since they manage to
incorporate behavioural factors to the traditional model (M. J. Greenwood, 2005). Many authors
chose gravity migration model as a base for their studies. R. Ramos and J. Surinach (2013) use this
model to prove that the neighbouring countries are the main source countries of legal as well as
illegal immigrants coming to EU, meaning that the small geographic difference has a significant
impact on decision to migrate. D. Karemeraet al. (2010) use gravity model to test the neo-classical
CE
UeT
DC
olle
ctio
n
32
model of migration and reach the conclusion that the size of population (of source country) and
income of receiving country are the key migration drivers.
2.3. Push-pull factors theory
Even though gravity and other neo-classical migration models help to narrow down the
number of migration drivers, they do not answer the question why certain people in the same
country chose to migrate and others do not. In 1966 E. S. Lee introduced a new approach in
creating a migration process framework. According to the author, migration process always involves
origin, destination and intervening obstacles, where distance is a constant intervening factor (E.S.
Lee, 1966). E. S. Lee divides factors into “plus”, “minus“ and “0”, where “plus” is a factor
stimulating migration process, “minus“ – a factor discouraging migration and “0” – a factor to
which a migrant is indifferent. All of them can be put into 4 distinct categories:
1. Factors related to the area of destination.
2. Factors related to the area of origin.
3. Interfering obstacles.
4. Personal characteristics.
It may seem that the factors related to the area of origin and destination should be opposite
signs, but E. S. Lee points out that a migrant has lots of information and experience to evaluate the
factors related to area of origin but, on the other hand, while evaluating the factors of area of
destination a person always encounters some sort of uncertainty and lack of information which makes
the decision to migrate more complicated. In addition to that, the choice to migrate is not a fully
CE
UeT
DC
olle
ctio
n
33
rational decision, as personal differences (like level of openness to change) can never be put into a
model.
Even though E. S. Lee did not give a precise name to his theory, but generally it is known as
a “push-pull” factors theory. “Push-pull” factors theory is similar to the neo-classical migration
theory since it connects equilibrium model with the individual choice model (H. de Haas, 2008).
This theory gained a tremendous popularity among the scientists and policy makers throughout the
years. One of the main reasons why this model is so popular is that it allows researchers to combine
not only economic, but also personal, political, demographic, ecologic and all other factors when
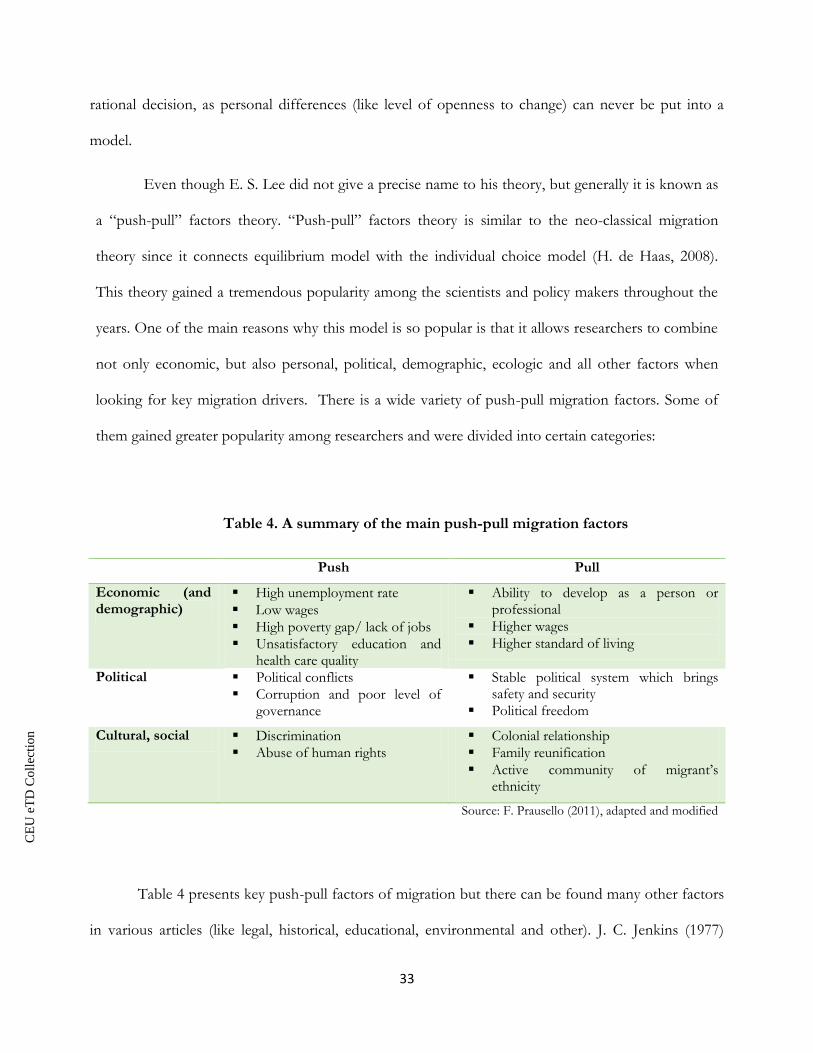
looking for key migration drivers. There is a wide variety of push-pull migration factors. Some of
them gained greater popularity among researchers and were divided into certain categories:
Table 4. A summary of the main push-pull migration factors
Push Pull
Economic (and demographic)
High unemployment rate
Low wages
High poverty gap/ lack of jobs
Unsatisfactory education and health care quality
Ability to develop as a person or professional
Higher wages
Higher standard of living
Political Political conflicts
Corruption and poor level of governance
Stable political system which brings safety and security
Political freedom
Cultural, social Discrimination
Abuse of human rights
Colonial relationship
Family reunification
Active community of migrant’s ethnicity
Source: F. Prausello (2011), adapted and modified
Table 4 presents key push-pull factors of migration but there can be found many other factors
in various articles (like legal, historical, educational, environmental and other). J. C. Jenkins (1977)
CE
UeT
DC
olle
ctio
n
34
found out that Mexican migration to US is driven not only by wage and standard of living differences
but also by the fact that in Mexico there has been an increasing mismatch between rural population
growth and the amount of arable land. There can be seen a pattern that on average pull migration is
economically beneficial while push migration is a result of some kind of disturbances and can cause
even more economic problems.
Even though push-pull factor model is one of the most widely used, it has also been
criticized by some economists. It has been argued that push and pull factors are just a different side
of the same coin, meaning that they are of descriptive rather than analytical value and this concept
should not even be called a model (H. de Haas, 2008). In addition to that, in this concept migration
drivers have same weights, therefore it is not clear which ones are of a greater importance.
To conclude, migration is mostly a voluntary human act based on utility maximization. It has
been proved by many researchers that neo-classical migration theory does work in the real life and
migration is often driven by labour market differences. In addition to that, gravity model also
emphasizes the importance of distance and population size when analysing migration process.
Depending on the perspective, all the factors having influence on willingness to migrate can be
grouped into push and pull factors depending on the country where the changes have been
introduced. In the next chapter I use the models introduced in this chapter as a base for
econometric calculations in order to identify key push-pull intra-EU migration drivers.
CE
UeT
DC
olle
ctio
n
35
3. Empirical study
In this chapter I carry out an econometric research in order to determine the importance of
various economic and policy factors in person’s decision to migrate. First, I try to identify the most
significant economic push-pull factors affecting personal migration choice. Second, I raise
hypothesis, that pull factors (the changes in a host country) has significantly more influence in
determining the number of immigrants coming to a specific country than push factors. Last, I test
the hypothesis that the two biggest shocks in the period of 2000-2011 (EU enlargement and global
financial crisis) notably affected the migration process from new to old EU member states.
3.1. How important is labour migration?
The choice to migrate is a hard and complex decision that a person has to make. Therefore,
sometimes it is difficult to determine which factors are the key drivers in a personal migration
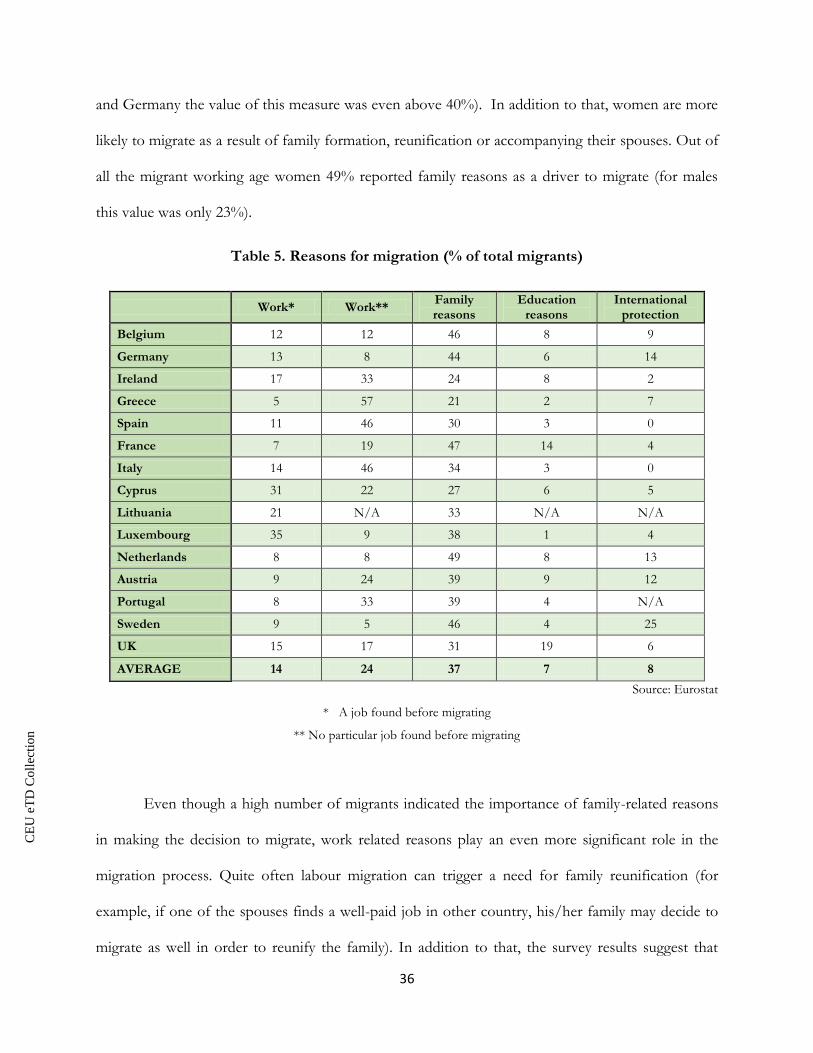
choice. Nevertheless, some factors on average have more influence than the others. Table 5 presents
the results of a Labour Force Survey ad hoc module on the labour market situation of migrants and
their immediate descendants. It combines the results of the surveys conducted in 15 EU member
states. The respondents are the people who immigrated to the particular country at the age 15 and
above. Survey was conducted in 2008. Results, that are presented in the Table 5, show that in 2008
more than one third of the working age (15-64 years old) migrants in 15 EU member states indicated
“Family reasons” as a key motive of migration. On average 37% of the respondents stated this
reason as migration trigger. There can be seen a trend that richer countries attract more migrants
who enter a country with a family reunification purpose (in Netherlands, France, Sweden, Belgium
CE
UeT
DC
olle
ctio
n
36
and Germany the value of this measure was even above 40%). In addition to that, women are more
likely to migrate as a result of family formation, reunification or accompanying their spouses. Out of
all the migrant working age women 49% reported family reasons as a driver to migrate (for males
this value was only 23%).
Table 5. Reasons for migration (% of total migrants)
Work* Work** Family reasons
Education reasons
International protection
Belgium 12 12 46 8 9
Germany 13 8 44 6 14
Ireland 17 33 24 8 2
Greece 5 57 21 2 7
Spain 11 46 30 3 0
France 7 19 47 14 4
Italy 14 46 34 3 0
Cyprus 31 22 27 6 5
Lithuania 21 N/A 33 N/A N/A
Luxembourg 35 9 38 1 4
Netherlands 8 8 49 8 13
Austria 9 24 39 9 12
Portugal 8 33 39 4 N/A
Sweden 9 5 46 4 25
UK 15 17 31 19 6
AVERAGE 14 24 37 7 8
Source: Eurostat
* A job found before migrating
** No particular job found before migrating
Even though a high number of migrants indicated the importance of family-related reasons
in making the decision to migrate, work related reasons play an even more significant role in the
migration process. Quite often labour migration can trigger a need for family reunification (for
example, if one of the spouses finds a well-paid job in other country, his/her family may decide to
migrate as well in order to reunify the family). In addition to that, the survey results suggest that
CE
UeT
DC
olle
ctio
n
37
work related reasons were more significant for greater amount of respondents. On an average 14%
of migrants reported that they moved because they already found a job in another EU country while
24% of respondents moved with a hope to find a working place after changing their location. In
total, it is approximately 38% of migrants who changed their living country as a result of work
related reasons. Migrants in Luxemburg, Cyprus and Lithuania were more likely to move if they
already had a job prior to migration process, while Greece, Spain, Ireland, and Portugal attracted on
average more risk-takers who migrated without a prior job placement. Opposite to family related
reasons, more working age men reported work as a cause for migration. The other two significant
drivers for migration in 2008 were education related reasons and international protection (on
average 7% and 8% respectively).
EU survey provides a good overview of why people choose to migrate but does not give an
information whether the decisions made by the respondents are rational. Further research is carried
out in order to determine whether the migration patterns respond to the changes of a country’s
characteristics (change of population size, development, income and other).
3.2. Methodology and data commentary
In this chapter I use random-effects generalized least squares linear regressions model for
the panel data with 4211 observations. Due to the nature of Gravity model, the fixed effects model
cannot be used since it would omit the distance variable as it is not changing over the time. The
sample of the panel data used in this empirical study consists of 607 country pairs (EU member
states). The availability of data dictates the time constraint and the analysis is carried out for the
period of time between 2000-2011, using annual observations. Cyprus is excluded from the analysis
CE
UeT
DC
olle
ctio
n
38
due to the data limitations. The variables used in regressions are expressed in logarithms, except
form the dummy variables.
There are possible issues with the data that may bias the results of the empirical study. The
risk of endogeneity is one of the key problems. First of all, the decision to migrate includes a variety
of factors that cannot be observed or expressed quantitatively, therefore the omitted variable bias
may occur. Such factors as job related skills, personal work-leisure preferences or openness to move
cannot be measured quantitatively and put into the model, even though they have a high influence
on a person’s willingness to migrate. Secondly, there is a risk of a reverse causality. The population
has the highest risk for reverse causality in this empirical study. Nevertheless, it cannot be excluded
from the calculations since it is one of the key factors of a gravity model. Regressions with
population lags provided close to identical results. Lastly, there is a risk of a high level of correlation
between the independent variables. Few important independent variables (GDP per capita, social
benefits) were excluded from the model due to collinearity (see Table 2 in Appendix). In this
research I use GLS model since various literature suggests that it has lower chance of providing
misleading results or being statistically inefficient. Nevertheless, the results of an OLS model
provided similar results.
The independent variable of this research is immigration. It is a yearly data of migration
flow. The value of this variable is expressed as a number of certain nationality people who legally
immigrated to a certain host country at predefined year. For example, immigration for Lithuania-UK
country pair in 2004 was equal to 10,800 which means that this amount of Lithuanians immigrated
to UK in 2004. Unfortunately, there is a notable amount of missing data which reduced the original
sample by almost half. Moreover, Eurostat provides the number of immigrants disregarding the
nature of migration. As it was showed in the subchapter 3.1., the work related migration is a key
cause for people movement within EU, therefore in this analysis I use the total number of EU
migrants as a proxy for labour force migration. The data is taken from the Eurostat database.
CE
UeT
DC
olle
ctio
n
39
In this research I use various independent variables:
Distance. This variable shows the distance (expressed in kilometres) between the capitals of a
country pair. The data is taken from CEPII GeoDist.
Population. It is a size of population of a country in particular year. Data provided by Eurostat.
Average wage is measured in cash and kind (except from Estonia that measures wages in cash
only), before social security and other tax deductions. Data is provided for a full-time
equivalent employee which enables to disregard the differences in average working time among
the countries. The value is expressed in US dollars. The average wage data was collected from
UNECE Statistical Database.
Unemployment shows what is the percentage of unemployed people in the total amount of
labour force (Eurostat).
Unemployment benefits variable shows the size of government expenditure for unemployment
benefits (as a percentage of GDP). Data was taken from Eurostat.
Language dummy indicates the level of foreign language (English) knowledge in the country.
The dummy is calculated by observing what was the percentage of pupils studying English at
ISCED level 1 (as percentage of total amount of pupils at this level). Dummy equals 1 if the
average percentage amount of pupils learning language in the period of 2005-2011 was above
60 percent, and 0 if this amount was below 60 percent.
Old/ new dummy indicates whether the country joined EU before or after 2004. The dummy
equals 1 if the member state joined EU before 2004 (Belgium, Denmark, Germany, Ireland,
Greece, Spain, France, Italy, Luxembourg, Netherlands, Austria, Portugal and Finland) and
equals 0 if the country joined the EU after 2004 (Bulgaria, Czech Republic, Estonia, Croatia,
Latvia, Lithuania. Hungary, Malta, Poland, Romania, Slovenia and Slovakia).
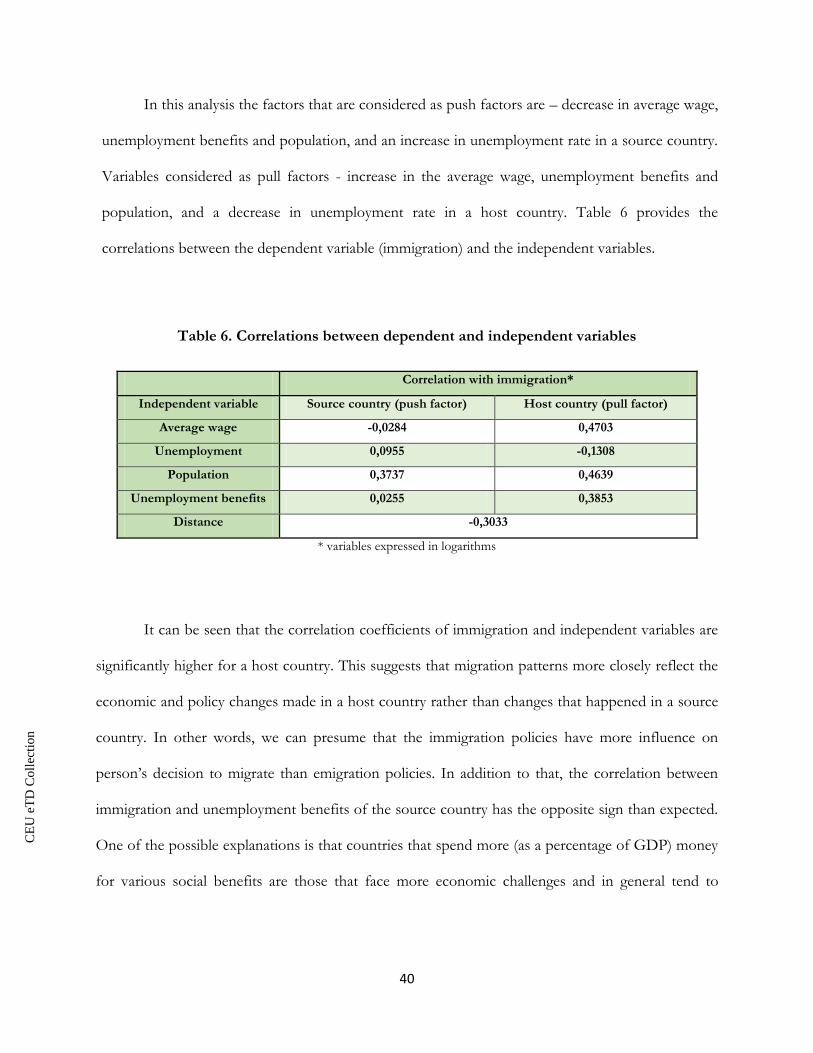
CE
UeT
DC
olle
ctio
n
40
In this analysis the factors that are considered as push factors are – decrease in average wage,
unemployment benefits and population, and an increase in unemployment rate in a source country.
Variables considered as pull factors - increase in the average wage, unemployment benefits and
population, and a decrease in unemployment rate in a host country. Table 6 provides the
correlations between the dependent variable (immigration) and the independent variables.
Table 6. Correlations between dependent and independent variables
Correlation with immigration*
Independent variable Source country (push factor) Host country (pull factor)
Average wage -0,0284 0,4703
Unemployment 0,0955 -0,1308
Population 0,3737 0,4639
Unemployment benefits 0,0255 0,3853
Distance -0,3033
* variables expressed in logarithms
It can be seen that the correlation coefficients of immigration and independent variables are
significantly higher for a host country. This suggests that migration patterns more closely reflect the
economic and policy changes made in a host country rather than changes that happened in a source
country. In other words, we can presume that the immigration policies have more influence on
person’s decision to migrate than emigration policies. In addition to that, the correlation between
immigration and unemployment benefits of the source country has the opposite sign than expected.
One of the possible explanations is that countries that spend more (as a percentage of GDP) money
for various social benefits are those that face more economic challenges and in general tend to
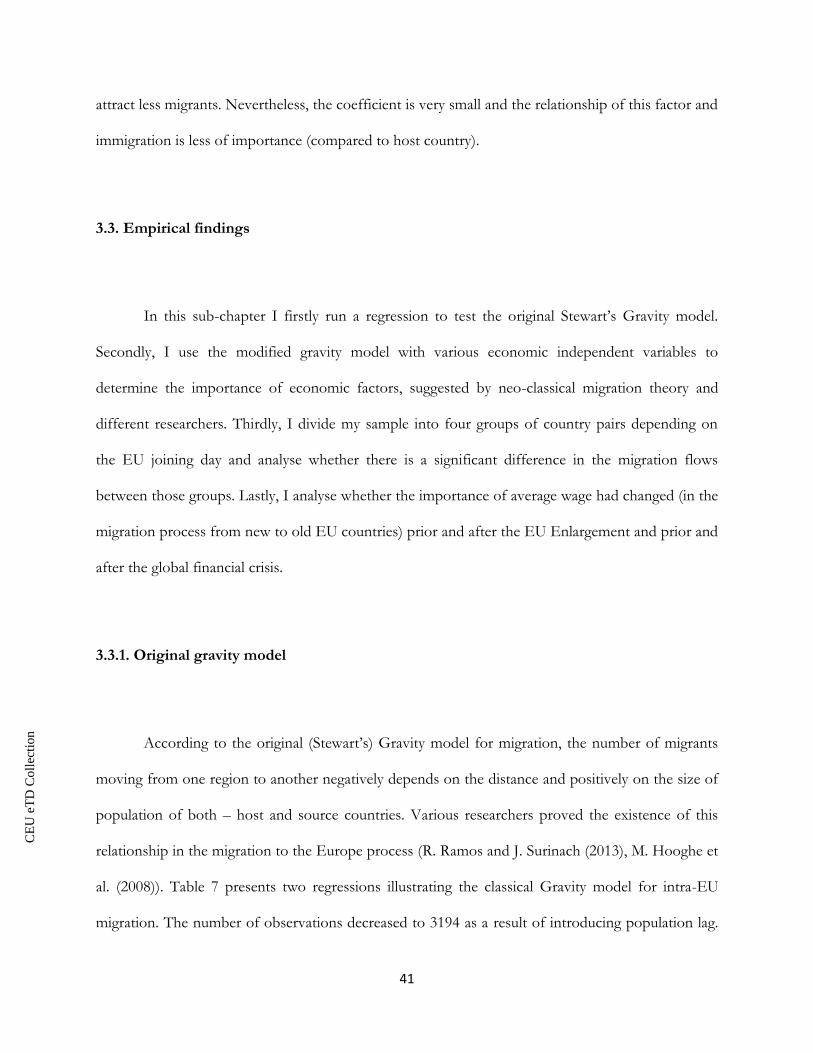
CE
UeT
DC
olle
ctio
n
41
attract less migrants. Nevertheless, the coefficient is very small and the relationship of this factor and
immigration is less of importance (compared to host country).
3.3. Empirical findings
In this sub-chapter I firstly run a regression to test the original Stewart’s Gravity model.
Secondly, I use the modified gravity model with various economic independent variables to
determine the importance of economic factors, suggested by neo-classical migration theory and
different researchers. Thirdly, I divide my sample into four groups of country pairs depending on
the EU joining day and analyse whether there is a significant difference in the migration flows
between those groups. Lastly, I analyse whether the importance of average wage had changed (in the
migration process from new to old EU countries) prior and after the EU Enlargement and prior and
after the global financial crisis.
3.3.1. Original gravity model
According to the original (Stewart’s) Gravity model for migration, the number of migrants
moving from one region to another negatively depends on the distance and positively on the size of
population of both – host and source countries. Various researchers proved the existence of this
relationship in the migration to the Europe process (R. Ramos and J. Surinach (2013), M. Hooghe et
al. (2008)). Table 7 presents two regressions illustrating the classical Gravity model for intra-EU
migration. The number of observations decreased to 3194 as a result of introducing population lag.
CE
UeT
DC
olle
ctio
n
42
Both models are fixed for the year variable in order to exclude the influence of the years when
immigration rates substantially changed in the same direction for all the analysed countries. The first
regression is an exact fit for the model and shows that the number of immigrants in the country
decreases with an increase of the distance between the country pairs. In addition to that, a 1%
increase in a source country’s population on average increases the number of immigrants in host
country by 0.7% (ceteris paribus). Similarly, the 1% increase in the population of a host country
increases the attractiveness of a country and the number of immigrants raises on average by 0.9%
(ceteris paribus).
Table 7. Estimation results: Stewart’s model
Independent variables (1) (2)
ln_distance -1.085*** -1.084***
[0.090] [0.090]
ln_population (source) 0.732***
[0.051]
ln_population (host) 0.910***
[0.063]
ln_population (source), t-1 0.735***
[0.051]
ln_population (host), t-1 0.901***
[0.063]
Year Yes Yes
Constant -13.738*** -13.650***
[1.421] [1.422]
Observations 3,194 3,194
Number of country pairs 536 536
R-squared
within 0.0956 0.0947
between 0.489 0.4871
overall 0.5394 0.4371
Robust standard errors in parentheses
*** p<0.01, ** p<0.05, *p<0.1
CE
UeT
DC
olle
ctio
n
43
Due to the free labour force movement within EU it is difficult to trace the migration flows.
People can live in a country for few years before they register as migrants, nevertheless, the source
country’s population decreases the same year they leave. To test whether this situation has an
influence on the results, I introduce one year population lag in regression 2. The results are not
significantly different from the ones in first regression and further lags provided no major change
neither. Therefore, it can be said that intra-EU migration in 2000-2011 followed patterns of the
classical gravity (Stewart’s) model for migration.
3.3.2. Modified gravity models: the influence of economic factors.
Modified gravity models are widely used among researchers as they enable to include variety
of behavioural factors into analysis. The macro level neo-classical migration theory puts it’s attention
on importance of labour market differences in determining person’s willingness to migrate. Since
migration decision is understood as an attempt to maximize utility gains, it is thought that wage
differentials and differences in unemployment rate are the most significant push-pull factors in
migration process. Formula (4) shows the general expression of modified gravity model that I use as
a base for the regressions. It shows that the migration elasticity is a function of a distance,
populations, average wages, unemployment rates, unemployment benefits, English language
knowledge in source and host countries.
CE
UeT
DC
olle
ctio
n
44
lnMsh = lnβ0 + β1lnDsh + β2ln𝑃st + β3lnPht + β4lnYst + β5lnYht + β6ln𝑈𝑛st + β7ln𝑈𝑛ht
+ (β8ln𝑏𝑒𝑛𝑒𝑓𝑖𝑡st + β9ln𝑏𝑒𝑛𝑒𝑓𝑖𝑡ht + β10𝑙𝑎𝑛𝑔𝑢𝑎𝑔𝑒s + β11𝑙𝑎𝑛𝑔𝑢𝑎𝑔𝑒) + 𝛼1𝑡
+ 𝛼2𝑠 + 𝛼3 + 𝑢𝑠 + e𝑠
(4) where:
Msh- immigration from source to host country
Dsh - distance between source and host country
Ps/h - population size of source and host country respectively
Ys/h–average wage of source and host country
Uns/h – unemployment rate of source and host country
benefit– unemployment benefit (as a percentage of GDP) in source and host country
language– language dummy
α1t – year fixed effect
αs/h - source/ host country fixed effect
Firstly, I test the importance of the average wage and unemployment rate in the migration
process, therefore I run regressions excluding variables put in the bracket in formula (4)
(unemployment benefits and language dummy). Equations 3 and 4 in Table 8 present the results of
the GLS model. Equation 3 is fixed for the year variable. In the period of 2000-2011 some of the
analysed countries systematically attracted more immigrants due to their size, therefore, regression 4
includes dummies for the host and source countries as well. The independent variables of a classical
gravity model (distance and population sizes of host and source countries) are statistically significant
and the coefficients have the expected directions in both equations. The wage and unemployment
independent variables are highly significant for a host country – an increase in average wage in a
host country on average results in an increase in the number of the immigrants coming to that
country. As expected, increase in particular country’s unemployment rate decreases the
attractiveness of the country for labour force migration and the number of immigrants on average
decreases.
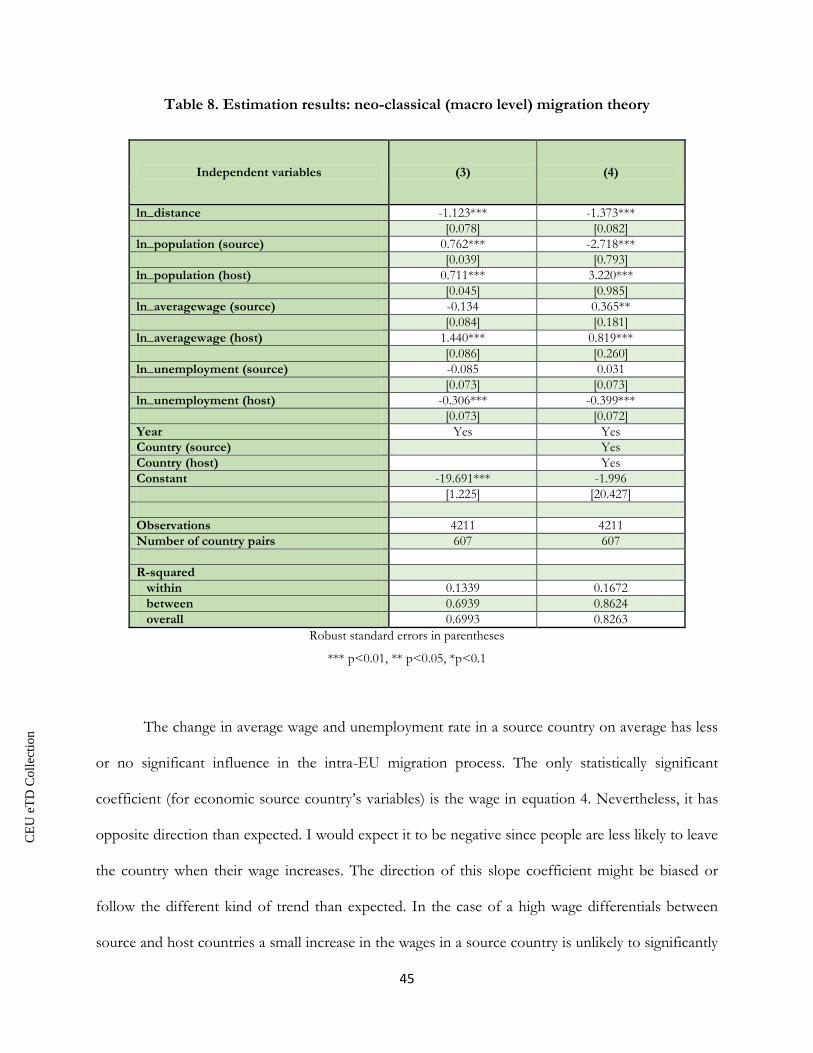
CE
UeT
DC
olle
ctio
n
45
Table 8. Estimation results: neo-classical (macro level) migration theory
Independent variables (3) (4)
ln_distance -1.123*** -1.373***
[0.078] [0.082]
ln_population (source) 0.762*** -2.718***
[0.039] [0.793]
ln_population (host) 0.711*** 3.220***
[0.045] [0.985]
ln_averagewage (source) -0.134 0.365**
[0.084] [0.181]
ln_averagewage (host) 1.440*** 0.819***
[0.086] [0.260]
ln_unemployment (source) -0.085 0.031
[0.073] [0.073]
ln_unemployment (host) -0.306*** -0.399***
[0.073] [0.072]
Year Yes Yes
Country (source) Yes
Country (host) Yes
Constant -19.691*** -1.996
[1.225] [20.427]
Observations 4211 4211
Number of country pairs 607 607
R-squared
within 0.1339 0.1672
between 0.6939 0.8624
overall 0.6993 0.8263
Robust standard errors in parentheses
*** p<0.01, ** p<0.05, *p<0.1
The change in average wage and unemployment rate in a source country on average has less
or no significant influence in the intra-EU migration process. The only statistically significant
coefficient (for economic source country’s variables) is the wage in equation 4. Nevertheless, it has
opposite direction than expected. I would expect it to be negative since people are less likely to leave
the country when their wage increases. The direction of this slope coefficient might be biased or
follow the different kind of trend than expected. In the case of a high wage differentials between
source and host countries a small increase in the wages in a source country is unlikely to significantly
CE
UeT
DC
olle
ctio
n
46
affect the person’s migration choice. Another possible explanation is that with an increased
migration the population size is decreasing and since nominal wages are rigid, the average wage of a
country increases. Moreover, due to lack of information, people are more likely to observe the
common trend of a host country and are more sensitive to what average wage in there is. When it
comes to the source country’s wages, a person judges his own income and an increase of the average
wage of a country does not necessarily reduce his/ her willingness to migrate if his own (her own)
wage did not increase. Same tendencies work in judging the level of unemployment. People tend to
be biased when judging the information that they have about their own situation in the source
country and trust more general information about the host country.
In addition to average wage and unemployment rate, there are variety of other factors that
have a significant influence on a personal migration choice. To analyse the influence of those
factors, I estimated the model using major economic push-pull factors (wage, unemployment rate,
unsatisfactory education and social care level) that is expressed in formula (4). Table 9 includes social
care and education level in the regression as unemployment benefits (as a percentage of GDP) and
language dummy. The coefficients for unemployment benefits in a source country are not
statistically significant. For the host country they are negative. Negative relationship between
increase in unemployment benefits and immigration can be explained by the fact that countries
spending most of their budget for various social benefits (as a percentage of GDP) are on average
those that face more economic difficulties and are less attractive for the immigrants. The other
possible explanation for the more developed countries is that those countries that pay higher
unemployment and other social benefits on average have more restricted immigration policies or
imply higher control on minimum wage workers (like earlier in the research discusses case of
Denmark), therefore even if they increase the size of benefits, there is no observed corresponding
increase in immigration rate.
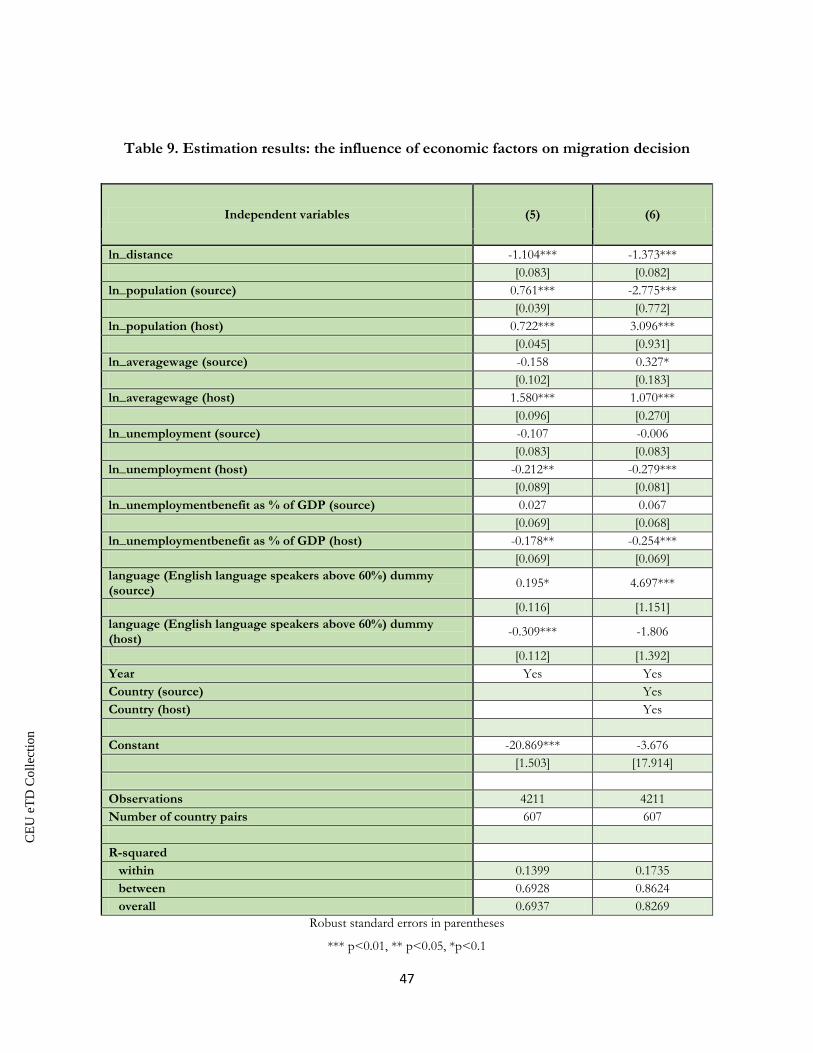
CE
UeT
DC
olle
ctio
n
47
Table 9. Estimation results: the influence of economic factors on migration decision
Independent variables (5) (6)
ln_distance -1.104*** -1.373***
[0.083] [0.082]
ln_population (source) 0.761*** -2.775***
[0.039] [0.772]
ln_population (host) 0.722*** 3.096***
[0.045] [0.931]
ln_averagewage (source) -0.158 0.327*
[0.102] [0.183]
ln_averagewage (host) 1.580*** 1.070***
[0.096] [0.270]
ln_unemployment (source) -0.107 -0.006
[0.083] [0.083]
ln_unemployment (host) -0.212** -0.279***
[0.089] [0.081]
ln_unemploymentbenefit as % of GDP (source) 0.027 0.067
[0.069] [0.068]
ln_unemploymentbenefit as % of GDP (host) -0.178** -0.254***
[0.069] [0.069]
language (English language speakers above 60%) dummy (source)
0.195* 4.697***
[0.116] [1.151]
language (English language speakers above 60%) dummy (host)
-0.309*** -1.806
[0.112] [1.392]
Year Yes Yes
Country (source) Yes
Country (host) Yes
Constant -20.869*** -3.676
[1.503] [17.914]
Observations 4211 4211
Number of country pairs 607 607
R-squared
within 0.1399 0.1735
between 0.6928 0.8624
overall 0.6937 0.8269
Robust standard errors in parentheses
*** p<0.01, ** p<0.05, *p<0.1
CE
UeT
DC
olle
ctio
n
48
The proxy for education level in this model is a language dummy. In the survey carried out
by Eurobarometer (2011), respondents identified language barrier as one of the two main reasons
discouraging people from working in another EU member state. The research of A.F. Constant
(2013) is in line with the survey and proves that language barrier is one of the key obstacles for
reaching a higher level of skilled labour immigration in Germany. The results of my empirical study
confirms those findings – the language dummy in Table 9 is positive for a source country (in fixed
year model and fixed year and countries model) which suggests that people living in the country with
a higher foreign language teaching level are more likely to migrate to the other EU member state.
The GLS models used in this subchapter proved the importance of average wage and
unemployment level as significant migration pull factors. The increase in wage in a host country
significantly contributes to an increase in the number of the immigrants coming to that country. The
opposite relationship was observed in the relationship between unemployment and immigration.
Unemployment benefits, on the contrary, did not seem to have a strong causal relationship with the
immigration. Education level was proved to be a push factor – countries having lower level of pupils
studying English language on average tend to source less immigrants.
3.3.3. Regional differences in intra-EU migration
One of the key goals of EU is free labour mobility between the member states and
harmonization of migration laws. Previous sub-chapter introduced models for a general intra-EU
migration. Nevertheless, EU is a highly diversified region with 27 countries that all differ in their
development level, economic stance and policies. EU can be divided into “old” and “new” countries
depending on the day they joined the Union (2004 is a benchmark year). Migration between those
CE
UeT
DC
olle
ctio
n
49
regions reflect the differences in economic situation and labour market needs, therefore may differ
in the nature. The increased need for a geographic mobility comes from the wish to reduce the
labour market imbalances in the Union (H. Bonin et al., 2008). Geographic mobility also equilibrates
regional labour market imbalances. Therefore, the goal of this sub-chapter is to show that there is
significant differences in the regional intra-EU migration.
The results of GLS model for country pairs divided into regions are presented in the Table
10. The “old” refers to the countries that became EU members before 2004 and “new” to the
countries that joined EU during or post 2004 EU enlargement. The first indicator of a country pair
shows the nationality of a migrant (source country), the second one – the destination/ host country.
Therefore, the regression 9 (new-old) provides the results for the migration process from the new
EU countries to the old ones.
The distance and population variables are statistically significant for the all country groups.
Average wage of the source country, on the other hand, follows the expected patterns only in the
migration where the source country is a new EU member state. An increase in the average wage in a
new state on average results in a decreased number of immigrants in the particular host country.
Increasing the average wage in the host country is a significantly reliable method in the migration
between new EU countries. For the other regional migration coefficients of average wage in a host
country are statistically insignificant. Unemployment rate of a source country is insignificant for all
the country groups. The host country’s unemployment rate is strongly significant and consistent
throughout the regions. The increase in unemployment rate in the host country on average decreases
the number of immigrants coming to that country in the cases of all the country pairs.
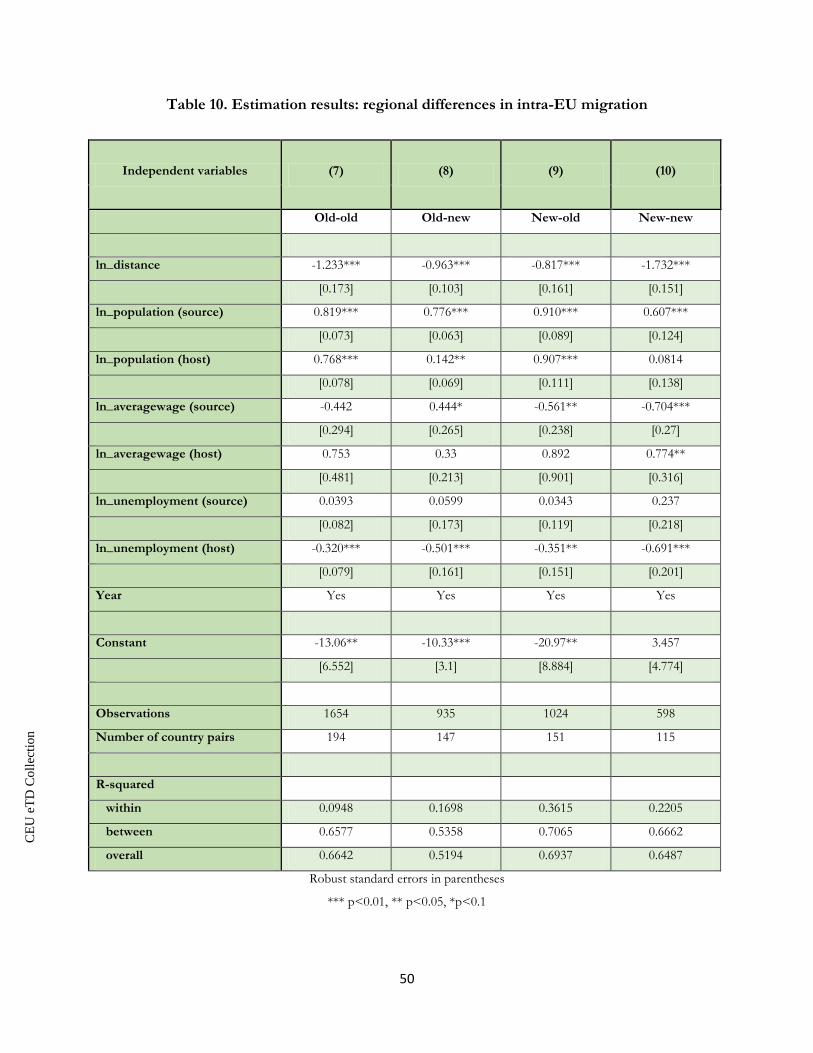
CE
UeT
DC
olle
ctio
n
50
Table 10. Estimation results: regional differences in intra-EU migration
Independent variables (7) (8) (9) (10)
Old-old Old-new New-old New-new
ln_distance -1.233*** -0.963*** -0.817*** -1.732***
[0.173] [0.103] [0.161] [0.151]
ln_population (source) 0.819*** 0.776*** 0.910*** 0.607***
[0.073] [0.063] [0.089] [0.124]
ln_population (host) 0.768*** 0.142** 0.907*** 0.0814
[0.078] [0.069] [0.111] [0.138]
ln_averagewage (source) -0.442 0.444* -0.561** -0.704***
[0.294] [0.265] [0.238] [0.27]
ln_averagewage (host) 0.753 0.33 0.892 0.774**
[0.481] [0.213] [0.901] [0.316]
ln_unemployment (source) 0.0393 0.0599 0.0343 0.237
[0.082] [0.173] [0.119] [0.218]
ln_unemployment (host) -0.320*** -0.501*** -0.351** -0.691***
[0.079] [0.161] [0.151] [0.201]
Year Yes Yes Yes Yes
Constant -13.06** -10.33*** -20.97** 3.457
[6.552] [3.1] [8.884] [4.774]
Observations 1654 935 1024 598
Number of country pairs 194 147 151 115
R-squared
within 0.0948 0.1698 0.3615 0.2205
between 0.6577 0.5358 0.7065 0.6662
overall 0.6642 0.5194 0.6937 0.6487
Robust standard errors in parentheses
*** p<0.01, ** p<0.05, *p<0.1
CE
UeT
DC
olle
ctio
n
51
The most analysed intra-EU migration related policy question in the recent decade was what
are the drivers and consequences of the migration from the new EU countries to the old ones.
Equation 9 in Table 9 shows the results of GLS model for a country pair where the source country
is a new EU member state and the host country is the old one. This model provides the best fit (the
highest R-squared value) from all four types of regional migration. Except from the high importance
of the distance and population sizes, the average wage of a source country is a strongly significant
push factor and unemployment rate of a host country is a strongly statistically significant pull factor
in the migration between “new-old” country pair migration.
3.3.4. The influence of EU enlargement policies and global financial crisis
The opening up the borders for new Eastern European countries in 2004 resulted in many
concerns especially among old member states that feared that a great amount of lower skilled labour
force and people benefitting from social welfare will flood the countries. It was a great shock in the
migration process, since one of the major barrier for the mobility was removed. The other shock
came with the global financial crisis in 2008. Policy makers in many EU countries adopted various
national laws that were migration-unfriendly. In this subchapter I analyse the influence of these two
shocks on the migration patterns from new to old EU countries. In particular, I focus on whether
migration process became more or less wage sensitive after the EU enlargement in 2004 and after
the hit of the global financial crisis in 2008.
The model that I use is presented by formula (5). It is based on previously used modified
migration model. The key difference is that I introduce the interaction dummy which indicates the
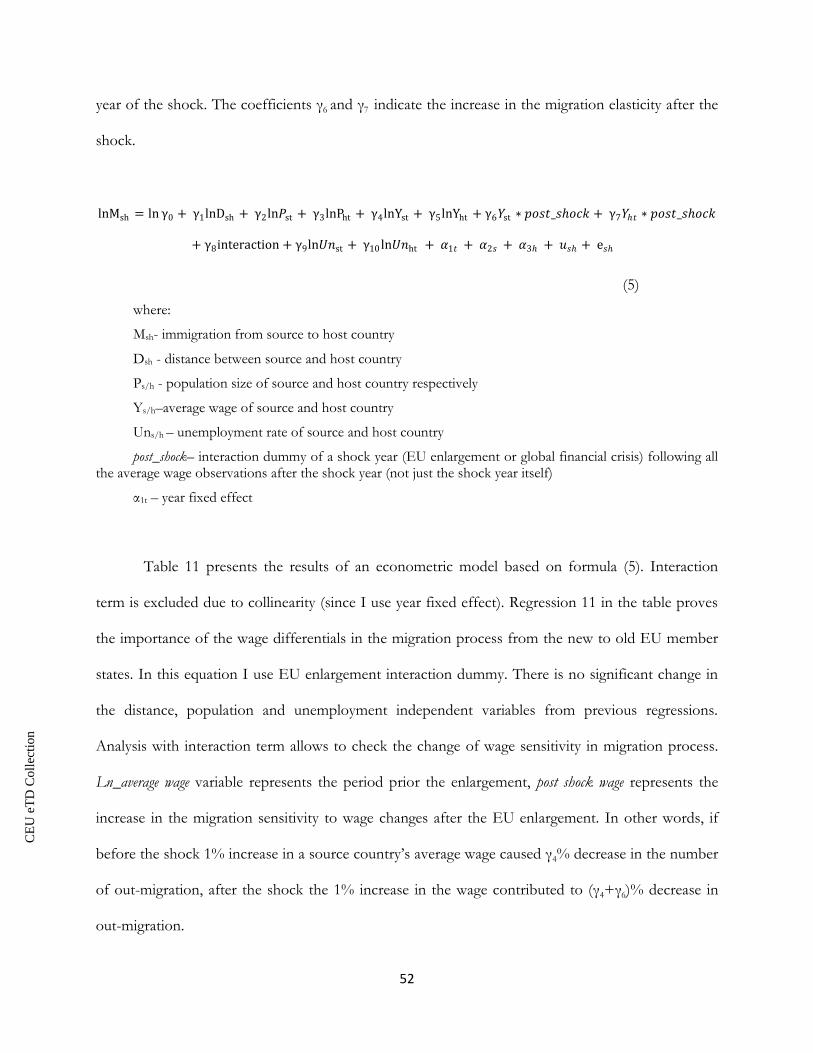
CE
UeT
DC
olle
ctio
n
52
year of the shock. The coefficients γ6 and γ7 indicate the increase in the migration elasticity after the
shock.
lnMsh = ln γ0 + γ1lnDsh + γ2ln𝑃st + γ3lnPht + γ4lnYst + γ5lnYht + γ6𝑌st ∗ 𝑝𝑜𝑠𝑡_𝑠𝑜𝑐𝑘 + γ7𝑌𝑡 ∗ 𝑝𝑜𝑠𝑡_𝑠𝑜𝑐𝑘
+ γ8interaction + γ9ln𝑈𝑛st + γ10 ln𝑈𝑛ht + 𝛼1𝑡 + 𝛼2𝑠 + 𝛼3 + 𝑢𝑠 + e𝑠
(5)
where:
Msh- immigration from source to host country
Dsh - distance between source and host country
Ps/h - population size of source and host country respectively
Ys/h–average wage of source and host country
Uns/h – unemployment rate of source and host country
post_shock– interaction dummy of a shock year (EU enlargement or global financial crisis) following all the average wage observations after the shock year (not just the shock year itself)
α1t – year fixed effect
Table 11 presents the results of an econometric model based on formula (5). Interaction
term is excluded due to collinearity (since I use year fixed effect). Regression 11 in the table proves
the importance of the wage differentials in the migration process from the new to old EU member
states. In this equation I use EU enlargement interaction dummy. There is no significant change in
the distance, population and unemployment independent variables from previous regressions.
Analysis with interaction term allows to check the change of wage sensitivity in migration process.
Ln_average wage variable represents the period prior the enlargement, post shock wage represents the
increase in the migration sensitivity to wage changes after the EU enlargement. In other words, if
before the shock 1% increase in a source country’s average wage caused γ4% decrease in the number
of out-migration, after the shock the 1% increase in the wage contributed to (γ4+γ6)% decrease in
out-migration.
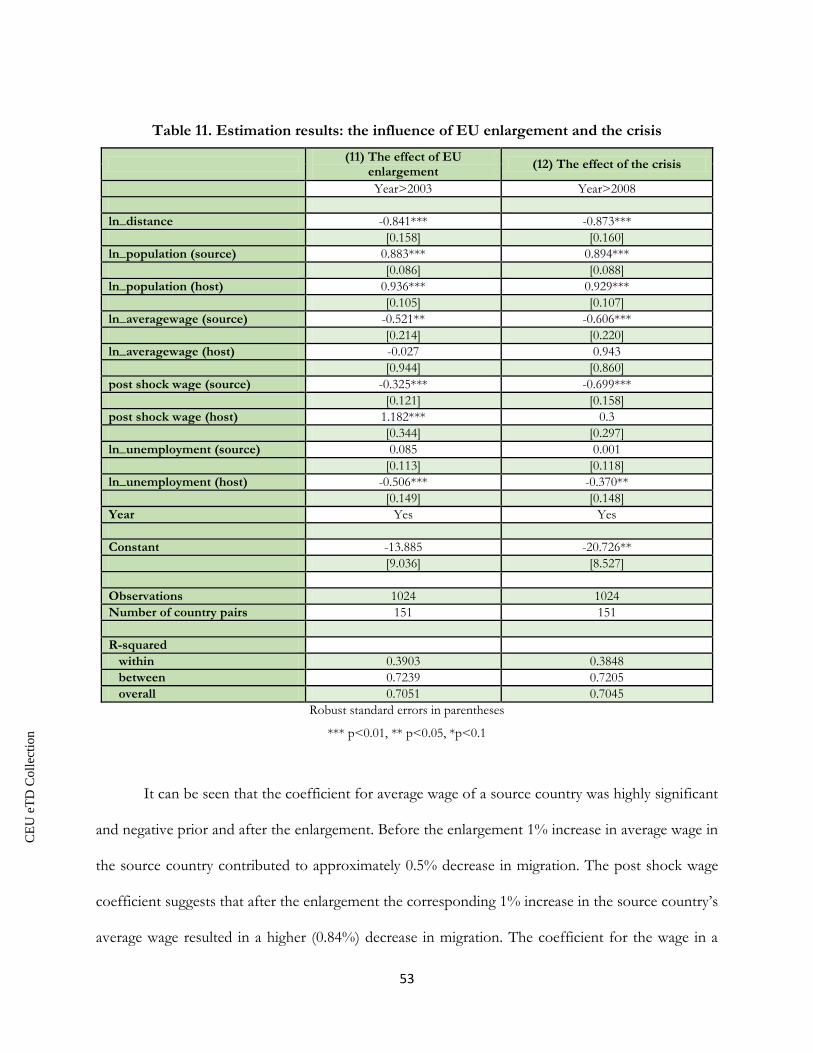
CE
UeT
DC
olle
ctio
n
53
Table 11. Estimation results: the influence of EU enlargement and the crisis
(11) The effect of EU
enlargement (12) The effect of the crisis
Year>2003 Year>2008
ln_distance -0.841*** -0.873***
[0.158] [0.160]
ln_population (source) 0.883*** 0.894***
[0.086] [0.088]
ln_population (host) 0.936*** 0.929***
[0.105] [0.107]
ln_averagewage (source) -0.521** -0.606***
[0.214] [0.220]
ln_averagewage (host) -0.027 0.943
[0.944] [0.860]
post shock wage (source) -0.325*** -0.699***
[0.121] [0.158]
post shock wage (host) 1.182*** 0.3
[0.344] [0.297]
ln_unemployment (source) 0.085 0.001
[0.113] [0.118]
ln_unemployment (host) -0.506*** -0.370**
[0.149] [0.148]
Year Yes Yes
Constant -13.885 -20.726**
[9.036] [8.527]
Observations 1024 1024
Number of country pairs 151 151
R-squared
within 0.3903 0.3848
between 0.7239 0.7205
overall 0.7051 0.7045
Robust standard errors in parentheses
*** p<0.01, ** p<0.05, *p<0.1
It can be seen that the coefficient for average wage of a source country was highly significant
and negative prior and after the enlargement. Before the enlargement 1% increase in average wage in
the source country contributed to approximately 0.5% decrease in migration. The post shock wage
coefficient suggests that after the enlargement the corresponding 1% increase in the source country’s
average wage resulted in a higher (0.84%) decrease in migration. The coefficient for the wage in a
CE
UeT
DC
olle
ctio
n
54
host country, became highly significant after the enlargement. If prior 2004 the changes in host
country’s average wage did not significantly affect the number of immigrants coming to the country,
after the enlargement a 1 % increase on average wage in a host country contributed to on average
1.2% increase in the number of immigrants coming to that particular country.
The other significant shock was the hit of global financial crisis starting 2008. As discussed
previously, the crisis resulted in a significant decrease in the migration volume within EU. The
country pairs that were affected the most were those where the source country was a new EU
member state and a host country – old member state. Equation 12 in Table 11 shows a significant
change in the wage sensitivity prior and post the crisis. The coefficients for the average wage in a
source country are negative and statistically significant for both periods. The crisis increased the
sensitivity of migration process to the changes in the average wage in a source country. The host
country’s changes in average wage remained statistically insignificant both periods of time.
In this chapter I ran various regressions that proved the significance of average wage and
unemployment rate as important push-pull factors in migration process. Moreover, if we consider
general intra-EU migration, the changes in host country’s wages play much more important role in
determining the change in a number of immigrants coming to the country. When we consider the
movement of people from new EU member states to the old ones, the significance of increase in
source country’s wage outpaces the influence of the changes in a host country. Therefore, my
hypothesis that pull factors have more influence in migration decision making process is confirmed
for a general intra-EU migration and rejected for the regional migration from new to old EU
member states migration. In addition to that, I accepted the second hypothesis and proved that two
biggest shocks in the period of 2000-2011 notably affected the migration process from new to old
EU member states. I found that migration process became more wage sensitive as a results of EU
enlargement and global financial crisis.
CE
UeT
DC
olle
ctio
n
55
Conclusions
In this thesis I showed that there has been a lack of consistency between changes in
migration policies within EU member states and actual migration drivers. At the beginning of the
last decade EU countries were optimistic about the benefits brought from the increased intra-EU
migration. As the adopted policies were increasingly liberalizing the labour force movement, some
of the old EU member states became overpopulated by the immigrants and became sceptic about
further enlargement. In addition to that, the hit of global financial crisis contributed to an increase in
the existing tension inside and between the countries. As a result, despite the numerous attempts,
EU migration policies still remain a question of a national policy framework. Many local legislative
acts related to immigration policies were targeted to the consequences of the immigration and were
adopted without proper pre-evaluation and as a result did not achieve expected results (e.g. right
after the crisis in 2008 the goal of UK was to reduce the number of net migration to “thousands of
migrants” but country never came even close to this number). Some of the policies were a prompt
response to the global financial crisis and did not reflect the medium and long term economic and
demographic targets. State has an important role in shaping the migration patterns therefore a lack
of understanding of particular push-pull factors influencing migration process results in a failure of
the policies. Therefore, the goal of this research was to determine the key push-pull migration
factors in the intra-EU migration in the period of 2000-2011.
The study includes data and literature review and gravity model based econometric models
for the panel data of 4211 observations for EU country pairs in the period of 2000-2011. The results
of the study suggest that labour market characteristics (average wage and unemployment rate) are
statistically significant economic drivers in the intra-EU migration process. I also found that the
features of a host country (pull factors) have significantly higher influence in determining intra-EU
CE
UeT
DC
olle
ctio
n
56
migration patterns. The other important factor in the decision to migrate is the knowledge of a
language (which was used as a proxy for education level). My findings are in line with the results of
Eurobarometer (2011) survey and confirms that citizens from a country with the higher level of
pupils studying English language on average are more mobile.
The other pattern observed in the research is that there are significant differences as well as
similarities in the importance of migration drivers among different EU regions. I have divided the
intra–EU migration into four subsamples: migration from a new EU member state (joined after
2003) to another new EU member state, from new to old, from old to new and from old to old.
What I have found is that the decrease in unemployment rate in the host country is a statistically
significant pull factor for all regions. When it comes to the average wage, dividing the sample into
four groups resulted in different results. Regional regressions showed that if the person is migrating
from a new EU member state, the increase in average wage in his/ her own country decreases
person’s willingness to migrate and the number of immigrants accordingly decreases in a host
country. Finally, the results of the empirical study proved that EU enlargement and global financial
crisis increased the wage sensitivity in the migration process from new to old EU member states.
The findings of my study confirm the results of most of the researchers focusing on the
influence of migration drivers. The income differentials (expressed as average wage in this study) is a
major pull factor in the migration process. In addition to that, intra-EU labour force migration
follows the patterns of a classical gravity model. Nevertheless, differently from my research, majority
of the researchers focus on international rather than intra-EU migration. Moreover, I introduce the
regional differences that suggest that policy decisions have to be adapted for the regions separately
since the nature of labour force migration differs among those regions. This statement contradicts
with the goal of EU that aims to unify the migration policies for all the member states. There is a
CE
UeT
DC
olle
ctio
n
57
lack of similar researches focusing on intra-EU migration and in particular showing the existence of
regional differences in determining the key migration drivers.
As it was stated in the thesis, the increasing unemployment level and ageing society creates
the situation where in a long term EU member states will have to compete with other countries for
attracting the skilled immigrants (R. Munz, 2008). Therefore, the migration policies have to be pro-
active and predict the future labour market needs. It was proved in my study that economic factors
have a significant impact on personal migration choice. Migration policies targeted on those factors
have a higher chance of benefitting from the migration process. With the properly managed
migration a country can reduce the shortages in the labour supply, stimulate its economic growth
and development.
CE
UeT
DC
olle
ctio
n
58
Policy recommendations
Based on the findings of my thesis, I propose policy recommendations that could increase
the effectiveness of the migration policies in the EU:
1. EU countries should focus more on the selective immigration. The enthusiasm of opening the
borders decreased significantly in few years after EU enlargement and once the lower skilled job
shortages had been alleviated, old EU member states started to increase restrictions on labour force
migration. As European countries are ageing there is an increasing need for skilled labour force
therefore the tight restrictions may cause serious economic and social issues in the future. The
creation of well-planned training programs in the countries where the need for certain type of skills
exists would bring economic benefits and eliminate (or at least reduce) the labour market imbalances
in the long run. Y. Pascouau (2013) also suggests that creation of clear system of skills and
qualifications recognition among the countries would benefit in creating selective migration.
2. The goal of EU is a creation of single European market. Nevertheless, the results of my empirical
study proved the existence of regional differences, therefore, as EU keeps increasing the level of law
harmonization, it should also focus on those differences and leave some room for regional
adjustments.
3. One of the key purposes of the recent hostile immigration policies in certain EU member states
was the attempt to reduce the amount of social welfare, lower skilled and illegal migrants. Countries
that are concerned about illegal labour force immigration should invest in increasing the quality of
their own labour market supervision. Denmark is a great example of the country that pays high wages
but avoids unnecessary illegal immigration. The desirable results are achieved as an outcome of a strict
supervision of the authorities and trade unions that leave very little place for employers to pay lower
than minimum wage or employ immigrants illegally. UK, on the other hand, lacks fruitful supervision
of the labour market and therefore is a popular destination country for lower skilled migrants willing
to work for lower salary than official minimum.
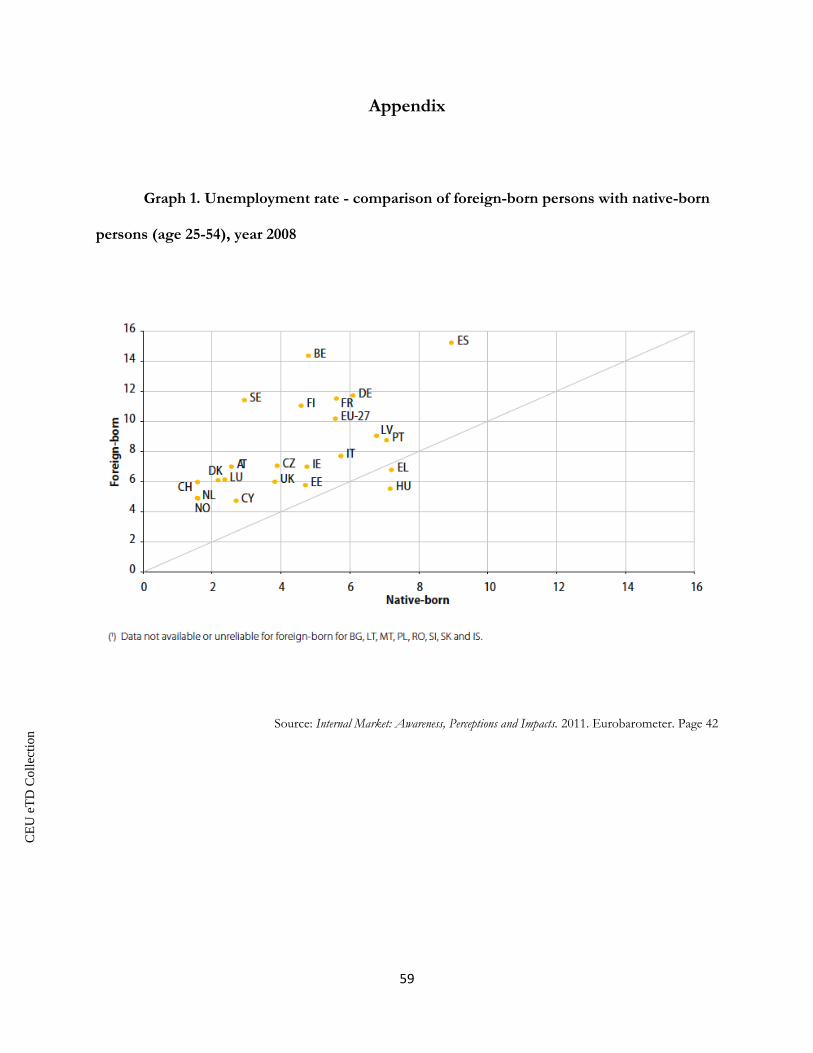
CE
UeT
DC
olle
ctio
n
59
Appendix
Graph 1. Unemployment rate - comparison of foreign-born persons with native-born
persons (age 25-54), year 2008
Source: Internal Market: Awareness, Perceptions and Impacts. 2011. Eurobarometer. Page 42
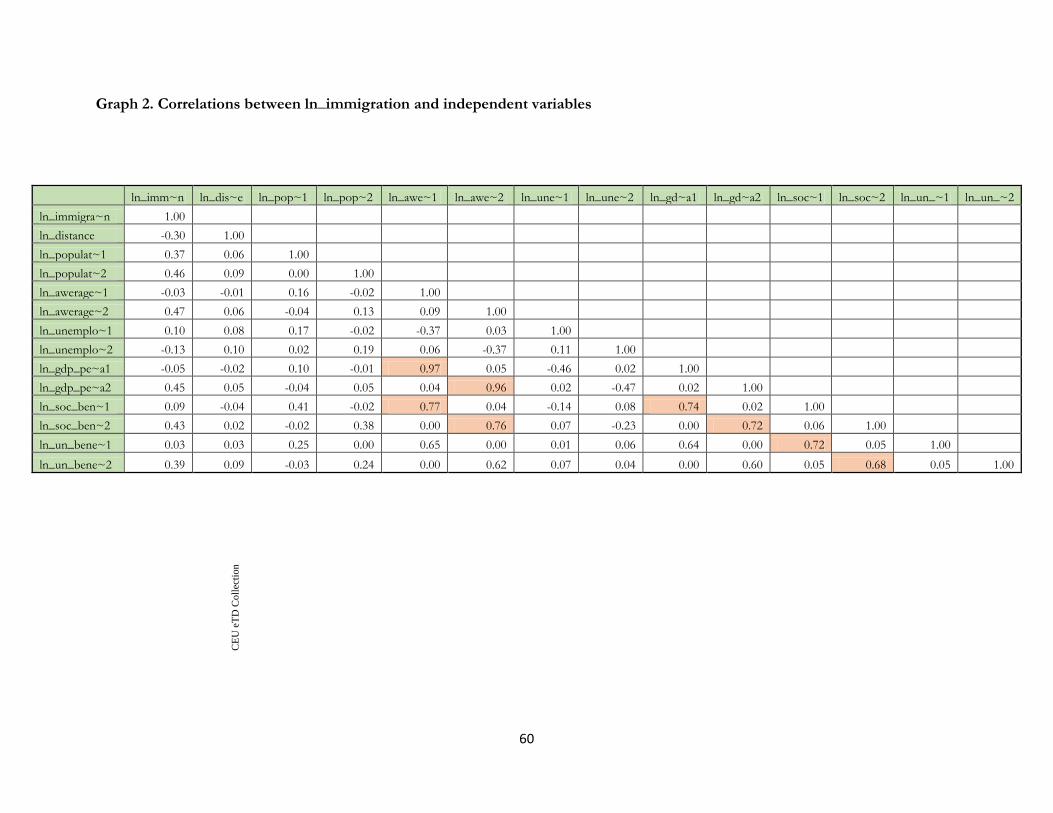
CE
UeT
DC
olle
ctio
n
60
Graph 2. Correlations between ln_immigration and independent variables
ln_imm~n ln_dis~e ln_pop~1 ln_pop~2 ln_awe~1 ln_awe~2 ln_une~1 ln_une~2 ln_gd~a1 ln_gd~a2 ln_soc~1 ln_soc~2 ln_un_~1 ln_un_~2
ln_immigra~n 1.00
ln_distance -0.30 1.00
ln_populat~1 0.37 0.06 1.00
ln_populat~2 0.46 0.09 0.00 1.00
ln_awerage~1 -0.03 -0.01 0.16 -0.02 1.00
ln_awerage~2 0.47 0.06 -0.04 0.13 0.09 1.00
ln_unemplo~1 0.10 0.08 0.17 -0.02 -0.37 0.03 1.00
ln_unemplo~2 -0.13 0.10 0.02 0.19 0.06 -0.37 0.11 1.00
ln_gdp_pe~a1 -0.05 -0.02 0.10 -0.01 0.97 0.05 -0.46 0.02 1.00
ln_gdp_pe~a2 0.45 0.05 -0.04 0.05 0.04 0.96 0.02 -0.47 0.02 1.00
ln_soc_ben~1 0.09 -0.04 0.41 -0.02 0.77 0.04 -0.14 0.08 0.74 0.02 1.00
ln_soc_ben~2 0.43 0.02 -0.02 0.38 0.00 0.76 0.07 -0.23 0.00 0.72 0.06 1.00
ln_un_bene~1 0.03 0.03 0.25 0.00 0.65 0.00 0.01 0.06 0.64 0.00 0.72 0.05 1.00
ln_un_bene~2 0.39 0.09 -0.03 0.24 0.00 0.62 0.07 0.04 0.00 0.60 0.05 0.68 0.05 1.00
CE
UeT
DC
olle
ctio
n
61
Reference List
A. Cangiano. 2012.Immigration Policy and migrant labour market outcomes in the European Union: New evidence from the EU Labour Force Survey. Working paper, Fieri. URL: http://www.labmiggov.eu/wp-content/uploads/2012/05/Cangiano-Lab-Mig-Gov-Final-Report-WP4.pdf
A. F. Constant and U. Rinne. 2013. Labour Market Information for Migrants and Emploers: The Case of Germany. IZA Research Report No. 50. URL: http://www.iza.org/en/webcontent/publications/reports/report_pdfs/iza_report_50.pdf
B. Galgoczi and J. Leschke. 2012.Intra-EU labour migration after Eastern enlargement and during the crisis. European Trade Union Institute, Working Paper. URL: http://www.etui.org/Publications2/Working-Papers/Intra-EU-labour-migration-after-Eastern-enlargement-and-during-the-crisis
C. A. Pissarides and I. McMaster. 1990.Regional Migration, Wages and Unemployment: Empirical Evidence and Implications for Policy. Oxford Economic Papers, New Series, Vol. 42, No. 4, p. 812-831.
C. Dustmann. 2003.Return migration, wage differentials, and the optimal migration duration. European Economic Review, Vol. 47, Issues 2, p. 353-369. URL: http://www.sciencedirect.com/science/article/pii/S0014292101001842
C. Rienzo. 2013.Migrants in the UK Labour Market: An Overview. University of Oxford, The Migration Observatory. URL: http://www.migrationobservatory.ox.ac.uk/briefings/migrants-uk-labour-market-overview
CEPII. Rechercheet expertise surl’economiemondiale. 2014. URL: http://www.cepii.fr/anglaisgraph/bdd/distances.htm
D. Adam. 2014.Trends in skills requirements and work-related issues. Report for European Foundation for the Improvement of Living and Working Conditions. URL: http://www2.warwick.ac.uk/fac/soc/ier/publications/2014/
D. Chiquiar and G. H. Hanson. 2002. International Migration, Self-Selection, and the Distribution of Wages: Evidence from Mexico and the United States. NBER Working Paper No. 9242. URL: http://www.nber.org/papers/w9242
D. Holland and P. Paluchowski. 2013.Geographical labour mobility in the context of the crisis. European Employment Observatory. URL: http://www.eu-employment-observatory.net/resources/reports/ESDE-SynthesisPaper-June2013-Final.pdf
D. Karemera et al. 2010. A gravity model analysis of international migration to North America. Applied Economics, Vol. 32, Issues 13. URL: http://www.tandfonline.com/doi/abs/10.1080/000368400421093#.U023mfkbWgZ
D. Lytvyniuk. The EU migration policy in a context of economic crisis in Europe. Odessa Regional Institute of Public Administration of the National Academy of Public Administration. URL: http://www.mbf-eu.info/Files/9a9fa2ed-fe4d-47f1-8ebe-f40ec8f725e8/Essay_Dmytro%20LYTVYNIUK.pdf
CE
UeT
DC
olle
ctio
n
62
D. S. Massey et al. 1993.Theories of International Migration: A Review and Appraisal. Population and Development Review. Vol. 19, p. 431 – 466. URL: http://www.jstor.org/stable/2938462
E. S. Lee. 1966.A Theory of Migration. Demography, Vol. 3, No. 1, p. 47-57. http://www.students.uni-mainz.de/jkissel/Skripte/Lee.pdf
EUbusiness. 2013. Germany seeks skilled migrants for some sectors. URL: http://www.eubusiness.com/news-eu/germany-economy.pzm
Eurobarometer. 2011. Internal Market: Awareness, Perceptions and Impacts. URL: http://ec.europa.eu/public_opinion/archives/ebs/ebs_363_en.pdf
European Commission. General Policy Framework. The EU Single Market. URL: http://ec.europa.eu/internal_market/top_layer/index_en.htm
European Trade Union Institute.2013. Trade unions. UK. URL: http://www.worker-participation.eu/National-Industrial-Relations/Countries/United-Kingdom/Trade-Unions
Eurostat Database. 2014. URL: http://epp.eurostat.ec.europa.eu/portal/page/portal/eurostat/home/
Eurostat statistical books. 2011. Migrants in Europe.A statistical portrait of the first and second generation. URL: http://epp.eurostat.ec.europa.eu/cache/ITY_OFFPUB/KS-31-10-539/EN/KS-31-10-539-EN.PDF
F. Prausello. 2011.The European Neighbourhood Policy and migration flows. URL: http://www.jeanmonnet.unige.it/materialedidattico/ENP%2BMigration.pdf
G. J. Borjas. 2000.Economics of Migration. Harvard University, International Encyclopedia of the Social and Behavioral Sciences, Section 3.4, Article No. 38. URL: http://www.ppge.ufrgs.br/giacomo/arquivos/eco02268/borjas-2000.pdf
G. Zincone et al. 2011. Migration Policymaking in Europe. The Dynamics of Actors and Centexts in Past and Present. IMISCOE Research, Amsterdam Univeristy Press. P. 7-21; 377-431.
H. Bonin etal.2008.Geographic mobility in the European Union: Optimising its Economic and Social Benefits. 2008. IZA Research Report No. 19. URL: http://www.iza.org/en/webcontent/publications/reports/report_pdfs/iza_report_19.pdf
H. Bonin et al. 2008. Geographick Mobility in the European Union: Optimising its Economic and Social Benefits. IZA Research Report No. 19. URL: http://www.iza.org/en/webcontent/publications/reports/report_pdfs/iza_report_19.pdf
H. de Haas. Migration and development. Theoretical perspective. International Migration Institute. 2008. Working Papers, Paper 9. URL: http://www.imi.ox.ac.uk/pdfs/wp/WP9%20Migration%20and%20development%20theory%20HdH.pdf
International Labout organization. 2013.New thinking on labour migration needed. URL: http://www.ilo.org/brussels/information-resources/news/WCMS_222792/lang--en/index.htm
J. Jenkins. 1977.Push/ Pull in Recent Mexican Migration to the US. International migration review. Vol. 11, No.2, p. 178-189. URL: http://www.jstor.org/stable/pdfplus/2545157.pdf?acceptTC=true&jpdConfirm=true
CE
UeT
DC
olle
ctio
n
63
J. Koehler et al. 2010. Migration andthe economic crisis in the European Union: Implications for policy. Independent Network of Labour Migration and Integration Experts. IOM Thematic Study. URL: file:///C:/Users/Administrator/Downloads/Migration%20and%20the%20Economic%20Crisis%20in%20the%20European%20Union-%20Implications%20for%20Policy.pdf
J. R. Harris and M. P. Todaro. 1970.Migration, Unemployment and Development: A Two-Sector Analysis. URL: http://www.aeaweb.org/aer/top20/60.1.126-142.pdf
K. Lorant. 2005. The demographic challenge in Europe. European Parliament. URL: http://www.europarl.europa.eu/inddem/docs/papers/The%20demographic%20challenge%20in%20Europe.pdf
L.T. Katseli. 2004.Immigrants and EU Labour Markets. International Labour Organization.URL: http://www.migrationpolicy.org/article/immigrants-and-eu-labour-markets
M. Benton and M. Petrovic. 2013.How free is free movement? Dynamics and drivers of mobility within the European Union. Migration Policy Institute. URL: http://www.migrationpolicy.org/research/how-free-free-movement-dynamics-and-drivers-mobility-within-european-union
M. Hooghe et al. 2008.Migration to European Countries: A Structural Explanation of Patterns, 1980-2004. International Migration Review. Vol. 42, p. 476-504. URL: http://onlinelibrary.wiley.com/doi/10.1111/j.1747-7379.2008.00132.x/full
M. J. Greenwood. 1985.Human migration: Theory, models, and empirical studies. Journal of Regional Science. Vol. 25, p. 521-544. URL: http://storage.globalcitizen.net/data/topic/knowledge/uploads/20101025103329533.pdf
M. J. Greenwood. 2005.Modeling migration. Encyclopedia of Social Measurement. Vol. 2, p. 725-734. URL: http://www.colorado.edu/econ/courses/spring12-4292-001/Modeling%20Migration.pdf
M. Kahanec. 2012. Skilled Labor Flows: Lessons from the European Union. IZA Research Report No. 49. URL: http://www.iza.org/en/webcontent/publications/reports/report_pdfs/iza_report_49.pdf
M. Vujicic. 2004.The role of wages in the migration of health care professionals from developing countries. Human Resource for Health. URL: http://www.human-resources-health.com/content/2/1/3
Migrant workers: What we know. 2006. BBC News. URL: http://news.bbc.co.uk/2/hi/uk_news/5384516.stm
OECD. 2011. Internationl Migration Outlook.. URL: http://www.keepeek.com/Digital-Asset-Management/oecd/social-issues-migration-health/international-migration-outlook-2011_migr_outlook-2011-en#page1
Office for National Statistics. International migration. URL: http://www.ons.gov.uk/ons/taxonomy/index.html?nscl=International+Migration#tab-data-tables
P. Antolin and O. Bover. 1997. Regional migration in Spain: The effect of personal characteristics and of unemployment, wage and house price differentials using pooled cross-sections. Oxford Bulletin of Economics and Statistics. Vol. 59, Issue 2, p. 215-235. URL: http://onlinelibrary.wiley.com/doi/10.1111/1468-0084.00061/full
CE
UeT
DC
olle
ctio
n
64
R. Munz. 2008. Migration, Labor Markets, and Integration of Migrants: An Overview for Europe. The World Bank. SP Discussion Paper, No. 0807. URL: http://siteresources.worldbank.org/SOCIALPROTECTION/Resources/SP-Discussion-papers/Labor-Market-DP/0807.pdf
R. Ramos and J. Surinach. 2013. A gravity model of migration between ENC and EU. Research Institute of Applied Economics. Working Paper 2013/17. URL: http://ftp.iza.org/dp7700.pdf
S. Koikkalainen. 2001. Free Movement in Europe: Past and Present. Migration Policy Institute. URL: http://www.migrationpolicy.org/article/free-movement-europe-past-and-present
S. Longhi and M. Rokicka. 2012.European immigrants in the UK before and after the 2004 enlargement: Is there a change in immigrant self-selection?Northface migration. Discussion Paper No. 2012-30. URL: http://www.norface-migration.org/publ_uploads/NDP_30_12.pdf
T. Mitze and J. Reinkowski. 2010.Testing the Neoclassical Migration Model: Overall and Age-Group Specific Results for German Regions. RUHR Economic Papers. No. 226.URL: http://www.rwi-essen.de/media/content/pages/publikationen/ruhr-economic-papers/REP_10_226.pdf
UNECE statistical database. 2014. URL: http://w3.unece.org/pxweb/dialog/Saveshow.asp
United Nations. 2013. World Population Prospects: The 2012 Revision. URL: http://esa.un.org/unpd/wpp/Excel-Data/migration.htm
Work in Denmark. Trade Union. URL: https://www.workindenmark.dk/en/Find_information/Information_for_job_seekers/Working_in_Denmark/Trade_unions
Y. Pascouau. 2013.Intra-EU mobility: the ‘second building block’ of EU labour migration policy. European Policy Centre. Issue Paper No. 74. URL: http://www.epc.eu/documents/uploads/pub_3500_intra-eu_mobility.pdf