Embed Size (px)
Citation preview

TRANSPORTATION RESEARCH RECORD 1250 25
Laboratory Evaluation of Shape and Surface Texture of Fine Aggregate for Asphalt Concrete
W. R. MEIER, JR., AND EDWARD J. ELNICKY
The evaluation of the shape and surface texture of various fine aggregates was studied. Asphalt concretes using these fine aggregates were evaluated for mix design and deformation under load. Seven different test procedures for evaluating aggregate shape and surface texture were studied. Three sources of fine aggregate with four percentages of crushed material were utilized for both the fine aggregate and the asphalt concrete studies. Of the seven tests for aggregate shape and surface texture, all but the direct shear test provided data that correlated with the percentage of fine aggregate with crushed faces. Best results were obtained from the National Crushed Stone Association (now the National Aggregates Association) test, the Rex and Peck time index, and the specific rugosity. These results were correlated to the Hveem stability of asphalt concrete mixtures designed to a constant 4 percent air voids using the study aggregates. Similar correlations were performed with Hveem stability and asphalt concrete mixtures with an additional 0.5 percent asphalt binder. Statistically significant relationships were found between the results of these aggregate tests and the Hveem stabilities.
The properties of asphalt concrete depend on a large number of factors , many of which relate to the aggregate used. It is recognized that the aggregate shape and surface texture have a significant effect on these properties. Whereas aggregate gradation and durability have fairly definitive tests, aggregate shape and surface texture generally do not. Visual examination of coarse aggregate particles larger than the No. 4 or No . 8 sieve is used to identify particles with fractured faces. This is the most common method of judging aggregate shape and surface texture. This method has a number of drawbacks; one is that it tells nothing about the fine aggregate.
Investigators have determined that the properties of the asphalt alone are not sufficient to predict or control the deformation of asphalt concrete mixtures . As early as 1954, Herrin and Goetz (1) reported on the effect of aggregate shape on stability of bituminous mixtures. In 1956, Rex and Peck (2) developed a simple direct test to measure the relative angularity and surface roughness of sand. Huang (3) developed a particle index test (rhombohedron mold) to reflect the discernible geometric characteristics of an aggregate. Tons and Goetz ( 4) measured specific rugosity and packing volume of aggregates. In 1977, Ishai and Tons (5) developed a pouring test for the direct measurement of the packing specific gravity of one-sized aggregate particles.
McLeod and Davidson (6) presented test data showing that 2- and 3-in. diameter molds could be used to determine the
Western Technologies Inc., P.O. Box 21387, Phoenix, Ariz. 85036.
particle index values for fine aggregates. Other procedures, such as a 1959 test proposed by the National Crushed Stone Association (the National Crushed Stone Association is now the National Aggregates Association), have been used.
The geometric irregularity of aggregate particles has a major effect on the physical properties and mechanical behavior of bituminous paving mixtures . Griffith and Kallas (7) determined that the type of fine aggregate greatly influenced the stability of asphaltic mixtures. Boutilier (8) determined that there was a relationship between the particle index of an aggregate and the physical properties of a bituminous aggregate mixture. Further work of Ishai and Tons (9), Kalcheff and Tunnicliff (10), and Ishai and Gelber (11) has produced in-depth evidence that the surface texture of the aggregate is a significant factor in the deformation characteristics of bituminous mixtures.
This project was conducted to evaluate various test methods that provide information about the shape and surface texture of fine aggregate for asphalt concrete. It was also intended to relate these fine aggregate properties to asphalt concrete properties.
MATERIALS
Aggregates
Three aggregate sources were selected for use in the test program. Crushed basalt was obtained from Flagstaff, Arizona , and crushed river gravels were obtained from the Salt River in Phoenix, Arizona, and the Santa Cruz River near Tucson, Arizona. For reference throughout the study, these were referred to as Flagstaff, Salt River, and Tucson sources. Uncrushed fine aggregate was also obtained from the Santa Cruz River source at Tucson. Physical properties for coarse and fine aggregates are shown in Table 1.
Asphalt
AC-20 asphalt cement for the asphalt concrete testing came from the Edgington Refinery (Wilmington crude) source. Physical properties of the asphalt cement are shown in Table 2. A large number of samples of asphalt cement were taken in metal containers. The contents of a container were heated to mixing temperature when required for batching mixtures , and any unused material was discarded . This allowed all work

26 TRANSPORTATION RESEARCH RECORD 1250
TABLE 1 PHYSICAL PROPERTIES OF AGGREGATES
crushed Coarse Aggregate
Salt River Tucson Plagsta f
L.A. Abrasion 20.5 15.7 14.4 Bulk Sp. Gr. 2.650 2.530 2.840 S.S. D. Sp. Gr. 2.673 2. 571 2.865 App. Sp. Gr. 2.712 2.638 2. 913 Absorption ( % ) 0.86 l. 63 0.88
Crushed Fine Aggregate
Salt River Tucson Flagstaff Tucson(l)
Bulk Sp. Gr. S.S.D. Sp. Gr. App. Sp. Gr. Absorption (%) Sand Equivalent
2.632 2.664 2.719 l. 21
2.510 2.561 2.647 2.06
2.920 2.946 2.999 0.91
2.456 2.519 2.620 2.50
82 73 41 81
(1) Uncrushed Fine Aggregate
TABLE 2 PHYSICAL PROPERTIES OF AC-20 ASPHALT CEMENT
Property
Absolute Viscosity @ 140F Kinematic Viscosity @ 275F Penetration @ 77F Flash Point, Cleveland Open Cup Solubility in Trichloroethylene Absolute Viscosity @ 140F (1) Ductility (l)
Unit
Poises est 1/10 mm F Percent Poises cm
Test Value
2235 263.1
44 529
99.98 4262
50+
(1) Tests conducted on residue from thin film over test
to be performed using asphalt cement in a once-heated condition, so that the properties of the asphalt cement used would be constant.
Aggregate Preparation
The basalt aggregate obtained from Flagstaff had been crushed from a ledge source and contained all newly fractured faces. The Salt River and Tucson materials required laboratory crushing to obtain fine aggregate with fractured faces on all particles.
The crushed river gravels were dried, and the material passing the No. 4 sieve was discarded. The aggregate larger than the No. 4 sieve was put through a laboratory jaw crusher three to five times to produce a material with a maximum size of approximately Y4 in. During laboratory crushing, it was necessary to maintain a surcharge of material over the jaw opening to reduce the production of elongated particles.
Following crushing, the aggregates were separated into several fractional sizes, from the No. 4 sieve to the No. 200 sieve and passing the No. 200 sieve, by mechanically shaking the dry material. The Flagstaff fine aggregate and the uncrushed
fine aggregate from the Tucson source were separated into sizes in a similar manner. Coarse aggregates from the three study sources were mechanically sieved into fractional sizes between % in . and the No. 4 sieve. Aggregate gradation control during the study was accomplished by proportioning the individual fractions of aggregate.
TEST PROCEDURES
Tests of aggregate shape and surface texture and tests of asphalt concrete were performed during this study. A brief description of the tests follows.
Tests of Aggregate Shape and Surface Texture
National Crushed Stone Association
This test was used to determine the voids in individual fractions of fine aggregate. A cylinder of known volume was filled by letting aggregate flow into the cylinder in a standard manner until it was overflowing. The cylinder was then carefully

Meier and Elnicky
struck off and weighed. The sand was recombined, and two additional weight determinations were made. Three differentsized aggregate fractions were used, and an average test result of the three results was calculated.
Index of Aggregate Particle Shape and Texture
This test provided an index value of the relative particle shape and texture characteristics of aggregates . A single fraction of aggregate was compacted in a mold using two different compactive efforts (10 and 50 drops). The test was completed on six different aggregate fractions between the No. 4 and No . 200 sieves. An index value was obtained for each aggregate fraction . The weighted average index for the composite aggregate was obtained by using the proportions of each aggregate fraction and its index value.
The test procedure followed ASTM Method D3398-81 except for the mold and tamping rod used. A mold 3 in. in diameter, 3.5 in . in height, and 54 in. 3 in volume was used. The tamping rod was 5/15 in . in diameter, approximately 12 in. long, and weighed between 0.254 and 0.259 lb .
Rex and Peck Time Index
This test was developed on the principle that smooth-textured, rounded sand particles offer less resistance to free flow than do rough-textured, angular particles. The test was performed by placing a 0.11-lb sample of a one-sized fraction of aggregate (passing No. 20 and retained on No. 30 sieves) into a glass jar with a cone-shaped lid and orifice . The jar was inverted, the stopper in the orifice removed, and a timer started. The rate of flow for the sample was then compared to the rate of flow for standard Ottawa sand of the same gradation.
Void Ratio by Western Technologies
The test was performed by placing a known volume of a single aggregate fraction into a graduated cylinder in a standard manner. The void ratio was calculated from the measured and absolute volumes of the aggregate . The test was repeated for three different-sized aggregate fractions and an average void ratio was computed. The test was specifically designed to use material separated into individual fractions from a sieve analysis and does not require a specific amount of material for performance of the test.
Florida Bearing Ratio
This test (Indiana State Highway Commission Test Method Inc. 201-72) was used to determine the bearing value of a fine aggregate. Fine aggregate was mixed with water and compacted into a bearing cup in lifts with a specified compressive load. The filled bearing cup was placed in a compression testing machine and given final compaction up to 1,500 lb at a rate of 2.4 in./min. The compacted specimen in the bearing cup was placed in the Florida bearing value machine with a 1-in.2 bearing plate centered on the specimen. A compressive load was applied to the bearing plate by a flow of steel shot
27
at a standard rate. When the rate of deformation of the specimen reached 0.01 in. in 5 sec, the loading was discontinued and the weight of shot up to that moment was measured. The bearing ratio was calculated from the weight of shot.
Direct Shear Test
This test method was used to measure the internal friction angle of a fine aggregate under different normal stresses. A prepared sample of an aggregate was consolidated in a shear mold . The sample was then placed in a direct shear device and sheared by a horizontal force while applying a known normal stress. Other samples of the same aggregate were prepared and tested in the same manner under different normal stresses. The normal stresses and maximum shear stresses were plotted and the internal friction angle was measured.
Specific Rugosity by Packing Volume
A pouring test was used for direct measurement of the packing specific gravity of one-sized aggregate particles. Each of four different aggregate particle sizes was placed in a cone-shaped bin and then poured into a calibrated constant-volume container. The surface of the aggregate was leveled, the container and aggregate weighed, and the packing specific gravity computed. The macrosurface and microsurface voids were calculated using the apparent, bulk, and packing specific gravities . The specific rugosity was computed by adding the macrosurface and microsurface voids.
Asphalt Concrete Mix Design
Asphalt concrete mix designs were prepared for the various aggregate combinations by the Marshall method, using 75 blows per specimen face. The aggregate proportions are shown in Table 3; the aggregate gradations are shown in the following table.
Sieve Size
%in. 1/2 in. % in. V. in. No. 4 No. 8 No. 16 No. 20 No. 50 No. 200
Percent Passing
100 92 82 70 62 47 33 23 15 5
Triplicate specimens were prepared for each aggregate combination studied by adding from 4 to 6 percent of the once-heated AC-20 asphalt cement. Coarse aggregate (CA) from each source was mixed with crushed fine aggregate (CFA) from the same source. When mixes utilized uncrushed fine aggregate (UFA), it was aggregate from the Tucson source regardless of the source of crushed aggregate. Specimens were compacted at 280°F with a mechanized compactor.
Specimens were extruded from their molds, cooled, and then weighed in air and in water. Specimens were then placed in a 140°F water bath for 30 to 40 min and tested for stability

28 TRANSPORTATION RESEARCH RECORD 1250
TABLE 3 MARSHALL MIX DESIGN
Crushed Aggregate Proportions (% )"
Fine Aggregate (%) CA CFA UFA
Salt River Aggregate Pit
Tucson Aggregate Pit
Flagstaff Aggregate Pit
"See text for aggregate gradations.
and flow in a Marshall test machine. Air voids, voids in mineral aggregate (VMA), voids filled with asphalt, and asphalt absorption were calculated using the mixture proportions, the bulk specific gravities of the specimens, and the maximum specific gravities of the mixtures.
Asphalt Concrete Strength and Deformation Tests
Tests of strength and deformation of compacted asphalt concrete were performed to develop data on the effect of crushed fine aggregate on these properties . Testing was performed on mixtures using the three aggregate sources and at two asphalt contents: (a) the asphalt content needed to produce 4 percent air voids, and (b) these asphalt contents plus 0.5 percent. This procedure was designed both to measure the effect of crushed fine aggregate on the strength and deformation of asphalt concrete and to obtain an indication of the effect of an increase of 0.5 percent in the asphalt content .
Tests performed to measure strength and deformation properties were the Hveem stability, resilient modulus, and two static creep tests. The two creep tests, one axial and one diametral, were both performed at 140°F. The axial creep test was also performed at 77°F. Only the Hveem stability test produced usable data. The diametral creep often exceeded the capacity of the deformation measuring device, resulting in incomplete data. The axial creep tests were not reproducible, which was believed to be the result of either deficient equipment or testing techniques . Time and funding did not permit further development of the creep testing . The small strains developed during resilient modulus testing are believed to be less than required to mobilize the effects of aggregate particle interaction; as a result, the resilient modulus is mostly a measure of the stiffness of the bituminous binder. It would not be expected to be significantly affected by aggregate shape and surface texture.
Triplicate specimens representing each of the aggregate sources, each of the crushed fine aggregate levels, and the two asphalt contents (at 4 percent air voids and 0.5 percentage points greater) were compacted with the kneading compactor (ASTM D-1561). Specimens were then tested for Hveem stability by ASTM Test Method D-1560.
100 67 33 0
100 67 33 0
100 67 33 0
38.0 62.0 0 38.5 41.6 19.9 38.8 20.9 40.3 39.8 0 60.2 38.0 62.0 0 38.1 41.3 20.6 38.3 20.4 41.3 38 7 0 61.3 37.4 62.6 0 38.4 43.1 18.5 39.5 22.1 38.4 41.4 0 58.6
TEST RES UL TS
Aggregate Shape and Surface Texture
The seven test procedures for aggregate shape and surface texture for the three study sources were tested using fine aggregate with 100, 67, 33, or 0 percent crushed aggregate .
National Crushed Stone Association Procedure
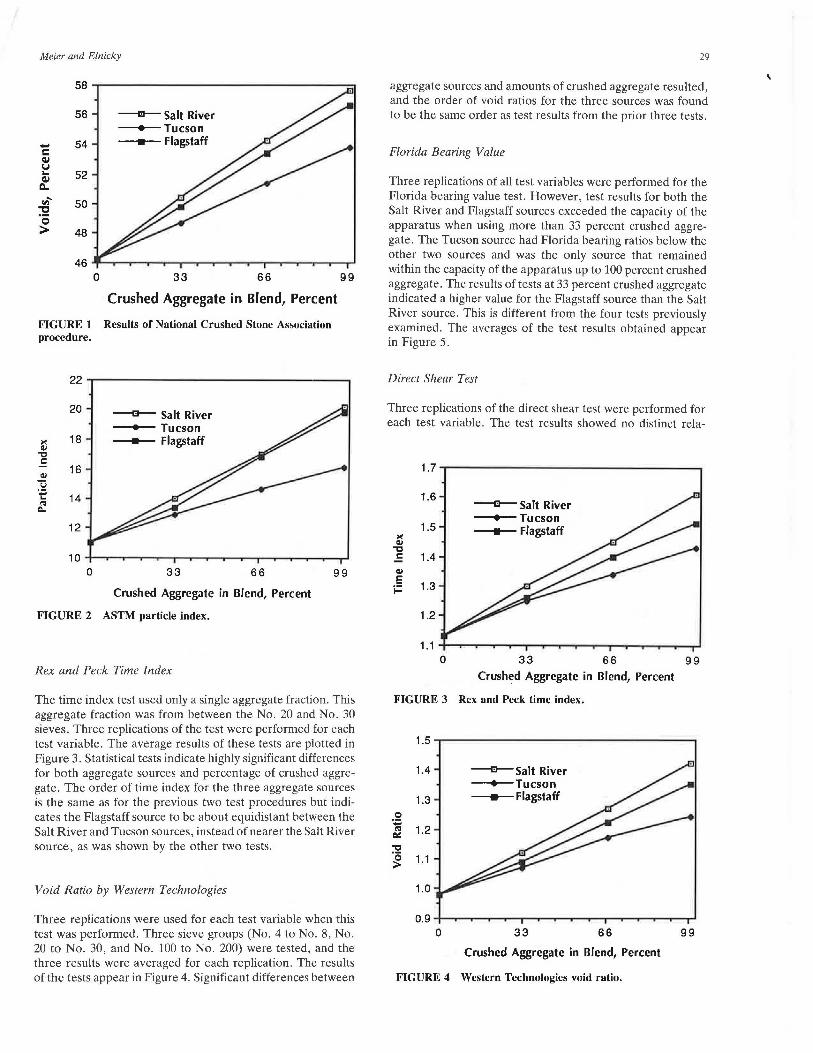
This test procedure was performed using three replications of each test. The tests were performed using aggregate fractions from mechanical sieving. The sieve sizes used were No. 8 to No. 16, No. 16 to No. 30, and No. 30 to No. 50. The percent voids were calculated using the bulk specific gravity of the aggregate and the unit weights of the three aggregate fractions. The final test results are the averages of the results for the three aggregate fractions. An analysis of variance and the F-test indicated highly significant differences between the results of tests for individual aggregate sources and for percentage of crushed aggregate. Figure 1 is a plot of the mean result of each of the test variables for the National Crushed Stone Association procedure.
Index of Particle Shape and Texture
This test procedure used six different aggregate fractions, and each fraction was compacted by two different compactive efforts. The six sieve groups used were No. 4 to No. 8, No . 8 to No. 16, No. 16 to No. 30, No. 30 to No. 50, No. 50 to No . 100, and No. 100 to No. 200. Because of the amount of testing to obtain a single data point, replications of the test results were not performed, and data points are a single value. The test results are plotted in Figure 2. A definite relationship between particle index and amount of crushed aggregate existed. Results indicated the Tucson source to have considerably lower voids than the other two sources. The Salt River and Flagstaff particle indexes were only slightly different; however, the Flagstaff source had a lower particle index for all test results .
Meier and Elnicky
58
56 ~Salt River Tucson ... 54 • Flagstaff
c Q,j u ... 52 Q,j
Q.. ,,, ...
50 "'Cl ·cs > 48
0 33 66 99
Crushed Aggregate in Blend, Percent
FIGURE 1 Results of National Crushed Stone Association procedure.
>< ~
"'C c: ~
u "f
!'Cl Cl..
22
20
18
16
14
12
10 0
~Salt River --- Tucson
• Flagstaff
33 66
Crushed Aggregate in Blend, Percent
FIGURE 2 ASTM particle index.
Rex and Peck Time Index
99
The time index test used only a single aggregate fraction. This aggregate fraction was from between the No. 20 and No. 30 sieves. Three replications of the test were performed for each test variable. The average results of these tests are plotted in Figure 3. Statistical tests indicate highly significant differences for both aggregate sources and percentage of crushed aggregate. The order of time index for the three aggregate sources is the same as for the previous two test procedures but indicates the Flagstaff source to be about equidistant between the Salt River and Tucson sources, instead of nearer the Salt River source, as was shown by the other two tests.
Void Ratio by Western Technologies
Three replications were used for each test variable when this test was performed. Three sieve groups (No. 4 to No. 8, No. 20 to No. 30, and No. 100 to No. 200) were tested, and the three results were averaged for each replication. The results of the tests appear in Figure 4. Significant differences between
29
aggregate sources and amounts of crushed aggregate resulted, and the order of void ratios for the three sources was found to be the same order as test results from the prior three tests.
Florida Bearing Value
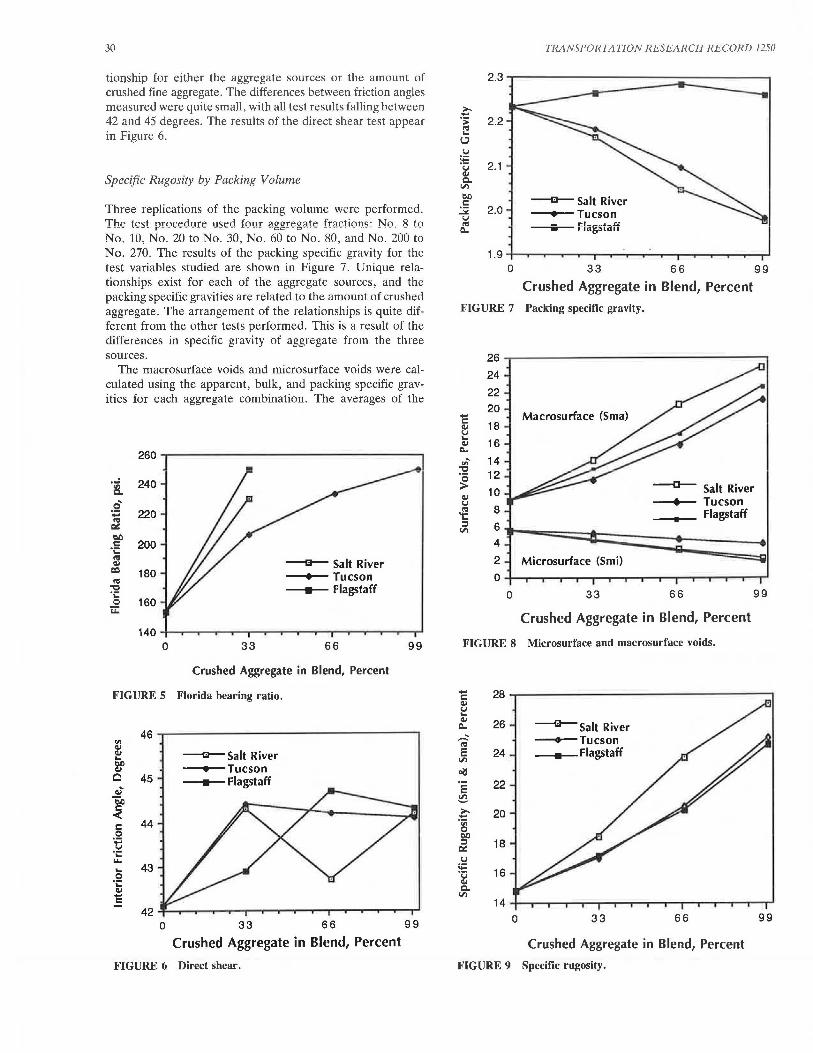
Three replications of all test variables were performed for the Florida bearing value test. However, test results for both the Salt River and Flagstaff sources exceeded the capacity of the apparatus when using more than 33 percent crushed aggregate. The Tucson source had Florida bearing ratios below the other two sources and was the only source that remained within the capacity of the apparatus up to 100 percent crushed aggregate. The results of tests at 33 percent crushed aggregate indicated a higher value for the Flagstaff source than the Salt River source. This is different from the four tests previously examined. The averages of the test results obtained appear in Figure 5.
Direct Shear Test
Three replications of the direct shear test were performed for each test variable. The test results showed no distinct rela-
1.7
1.6
1.5 >< ~
"'C c: 1.4 ~
E 1.3 i=
1.2
1.1 0
~Salt River ---Tucson
• Flagstaff
33 66
Crushed Aggregate in Blend, Percent
FIGURE 3 Rex and Peck time index.
1.5
1.4
1.3 0
·.;: !'Cl 1.2 ~
"'C ·cs 1.1 ;>
1.0
0.9 0
~Salt River ---Tucson
• Flagstaff
33 66
Crushed Aggregate in Blend, Percent
FIGURE 4 Western Technologies void ratio.
99
99
30
tionship for either the aggregate sources or the amount of crushed fine aggregate. The differences between friction angles measured were quite small, with all test results falling between 42 and 45 degrees. The results of the direct shear test appear in Figure 6.
Specific Rugosity by Packing Volume
Three replications of the packing volume were performed. The test procedure used four aggregate fractions: No. 8 to No. 10, No. 20 to No. 30, No. 60 to No. 80, and No. 200 to No. 270. The results of the packing specific gravity for the test variables studied are shown in Figure 7. Unique relationships exist for each of the aggregate sources, and the packing specific gravities are related to the amount of crushed aggregate. The arrangement of the relationships is quite different from the other tests performed. This is a result of the differences in specific gravity of aggregate from the three sources.
The macrosurface voids and microsurface voids were calculated using the apparent, bulk, and packing specific gravities for each aggregate combination. The averages of the
260
"ii 240
c' ; 220 Ill
Clli: bl) c 200 ·;:: Ill ~ co 180 Ill
"Cl ·;:: c 160 u:::
140 0 33
~Salt River ----Tucson
• Flagstaff
66
Crushed Aggregate in Blend, Percent
FIGURE 5 Florida bearing ratio.
<ll ~ ~ ~Salt River ... bl)
Tucson ~
0 45 • Flagstaff ~'
eii ~ c 44 c
·-a ·;:: ...... ... 43 c ·;:: ~ --=
99
0 33 66 99
Crushed Aggregate in Blend, Percent
FIGURE 6 Direct shear.
TRANSPORTATION RESEARCH RECORD 1250
~ ·~ u u
I+:
2.2
·o 2.1 ~ c.. Vl bl) c
:.:;: 2.0 u :.
~Salt River ----Tucson
• Flagstaff
0 33 66 99
Crushed Aggregate in Blend, Percent
FIGURE 7 Packing specific gravity.
26
24
22 20
Macrosurface (Sma) -c ~ 18 u ...
16 ~ c..
' 14 <ll "Cl
12 ·cs > 10
--a-- Salt River ~ • Tucson u
~ 8 Flagstaff ::I 6 Vl
4
2 Microsurface (Smi) 0
0 33 66
Crushed Aggregate in Blend, Percent
FIGURE 8 Microsurface and macrosurface voids.
- 28 c ~ u ... ~ 26 c.. --a--Salt River '(; --+-Tucson E 24 Vl
• Flagstaff
~
E 22 ~ >- 20 -·~ bl) ::I 18 Clli: u
I+: 16 ·o ~ c.. Vl
14 0 33 66
Crushed Aggregate in Blend, Percent
FIGURE 9 Specific rugosity.
99
99
Meier and Elnicky
results of these calculations are shown in Figure 8. Although relationships between the voids and the percentage of crushed aggregate appear to exist, the order for the aggregate sources shows no relation to that demonstrated by other tests.
The specific rugosity is the sum of the macrosurface and the microsurface voids. The specific rugosities for the study variables appear in Figure 9. Statistical tests indicated significant differences for percentage of crushed aggregate and also significant differences for aggregate sources. It is apparent from Figure 9 that the significant difference for aggregate sources was the result of the Salt River source being different from the Tucson and Flagstaff sources, which had almost identical test results.
Asphalt Concrete Mix Design
Mix designs were performed using the Marshall method with 75 compactive blows per specimen face. Asphalt cement was AC-20. Four mix designs were prepared for each of the three sources of aggregate, using that source's coarse aggregate and four different combinations of crushed and uncrushed aggregate. Crushed fine aggregate was from the same source as the coarse aggregate, and uncrushed fine aggregate was from the Tucson source. Aggregate combinations were adjusted for bulk specific gravity to provide a constant gradation by volume. A summary of the aggregate combinations, the percent by weight for each of the aggregates, and the combined gradation was previously shown in Table 3.
Mixtures were prepared and compacted at four or more asphalt contents for each aggregate source. The asphalt con-
31
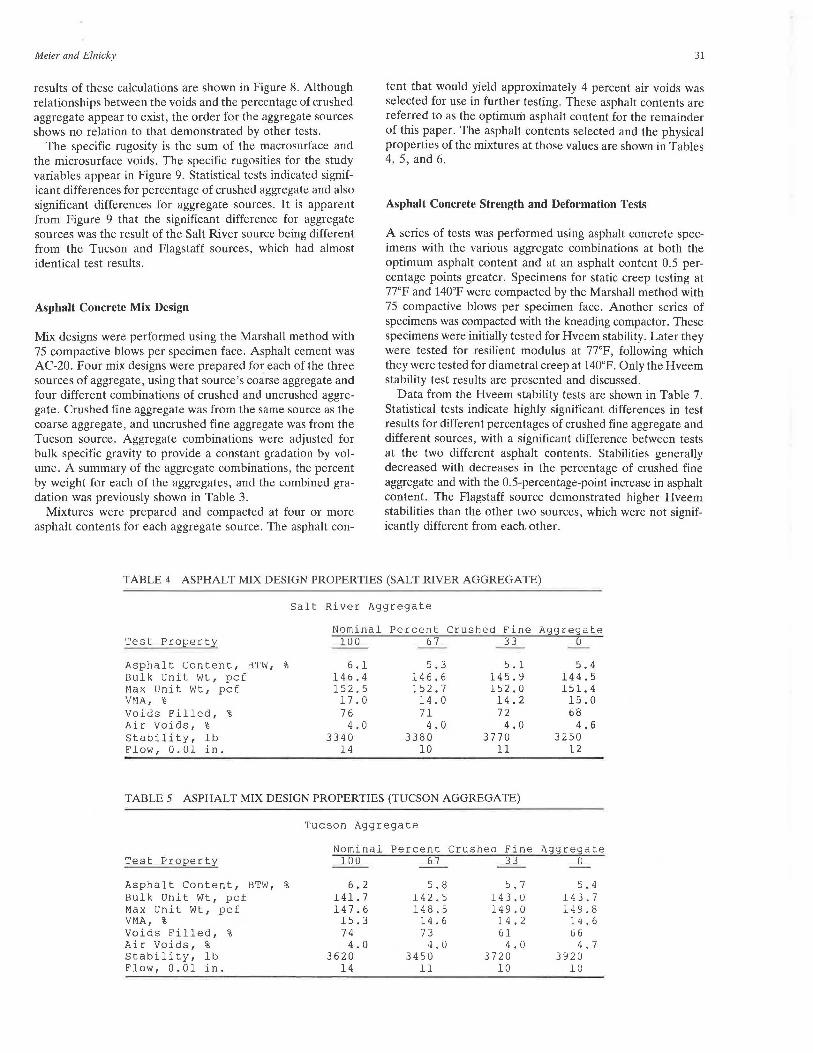
tent that would yield approximately 4 percent air voids was selected for use in further testing. These asphalt contents are referred to as the optimum asphalt content for the remainder of this paper. The asphalt contents selected and the physical properties of the mixtures at those values are shown in Tables 4, 5, and 6.
Asphalt Concrete Strength and Deformation Tests
A series of tests was performed using asphalt concrete specimens with the various aggregate combinations at both the optimum asphalt content and at an asphalt content 0.5 percentage points greater. Specimens for static creep testing at 77°F and 140°F were compacted by the Marshall method with 75 compactive blows per specimen face. Another series of specimens was compacted with the kneading compactor. These specimens were initially tested for Hveem stability. Later they were tested for resilient modulus at 77°F, following which they were tested for diametral creep at 140°F. Only the Hveem stability test results are presented and discussed.
Data from the Hveem stability tests are shown in Table 7. Statistical tests indicate highly significant differences in test results for different percentages of crushed fine aggregate and different sources, with a significant difference between tests at the two different asphalt contents. Stabilities generally decreased with decreases in the percentage of crushed fine aggregate and with the 0.5-percentage-point increase in asphalt content. The Flagstaff source demonstrated higher Hveem stabilities than the other two sources, which were not significantly different from each. other.
TABLE 4 ASPHALT MIX DESIGN PROPERTIES (SALT RIVER AGGREGATE)
Salt River Aggregate
Nominal Percent Crushed Fine Aggregate Test Property 100 67 33 0
Asphalt Content, BTW, % 6 .1 5. 3 5 .1 5. 4 Bulk Unit Wt, pcf 146.4 146. 6 145. 9 144. 5 Max Unit Wt, pcf 152.5 152.7 152.0 151. 4 VMA, % 17.0 14. 0 14. 2 15.0 Voids Filled, % 76 71 72 68 Air Voids, % 4. 0 4. 0 4. 0 4.6 Stability, lb 3340 3380 3770 3250 Flow, 0.01 in. 14 10 11 12
TABLE 5 ASPHALT MIX DESIGN PROPERTIES (TUCSON AGGREGATE)
Tucson Aggregate
Nominal Percent crushed Fine Aggregate Test Property 100 67 33 0
Asphalt Content, BTW, % 6. 2 5. 8 5. 7 5. 4 Bulk Unit wt, pcf 141.7 142.5 143.0 143. 7 Max Unit Wt, pcf 14 7. 6 148. 5 149.U 149. 8 VMA, % 15.3 14. 6 14. 2 14. 6 Voids Filled, % 74 73 61 66 Air Voids, % 4.0 4. 0 4. 0 4. 7 Stability, lb 3620 3450 3720 3920 Flow, 0.01 in. 14 11 10 10

32 TRANSI'ORTA TION RESEARCH RECORD 1250
TABLE 6 ASPHALT MIX DESIGN PROPERTIES (FLAGSTAFF AGGREGATE)
Flagstatf Aggregate
Nominal Percent Crushed Fine Aggregate Test Property 100 67 33 0
Asphalt Content, BTW, % 5. 7 5. 5 5. 4 5. 3 Bulk Unit Wt, pcf 15 9. 8 157.2 152.4 149. 2 Max Unit Wt, pcf 167.5 16 2. 9 158.l 155.5 VMA, % 16. 5 15. 5 15. 0 14. 0 Voids Filled, % 76 73 74 71 Air Voids, % 4. l 4.1 3. 7 4. 0 Stdbil ity, lu 3800 , A f"\ A 3700 "l->on
J"iUU .J.JVV
Flow, 0.01 in. 12 11 10 10
TABLE 7 HVEEM STABILITY
Percent Crushed Aggregate 100 67 33 u
Pit Trial I II I II I II I II
Salt l 31 18 30 24 31 31 28 21 River 2 35 23 31 20 34 29 20
3 27 26 35 35 31 24 21 25 Mean 31 22 32 30 27 30 2b 22
Tucson l 31 36 29 33 19 24 22 19 2 47 29 31 31 22 22 24 30 3 42 33 29 27 28 23 22 25
Mean 40 33 30 30 23 23 23 25
Flagstaff 1 42 32 37 44 32 30 34 31 2 38 34 34 32 24 21 26 23 3 44 33 32 25 27 31 32 21
Mean 41 33 34 34 28 27 31 25
Notes: ( 1) I Optimum asphalt content at 4% air voids ( 2 ) II - Optimum asphalt content plus 0.5% ( 3) Data are Hveem stabilities
Aggregate-Asphalt Concrete Relations
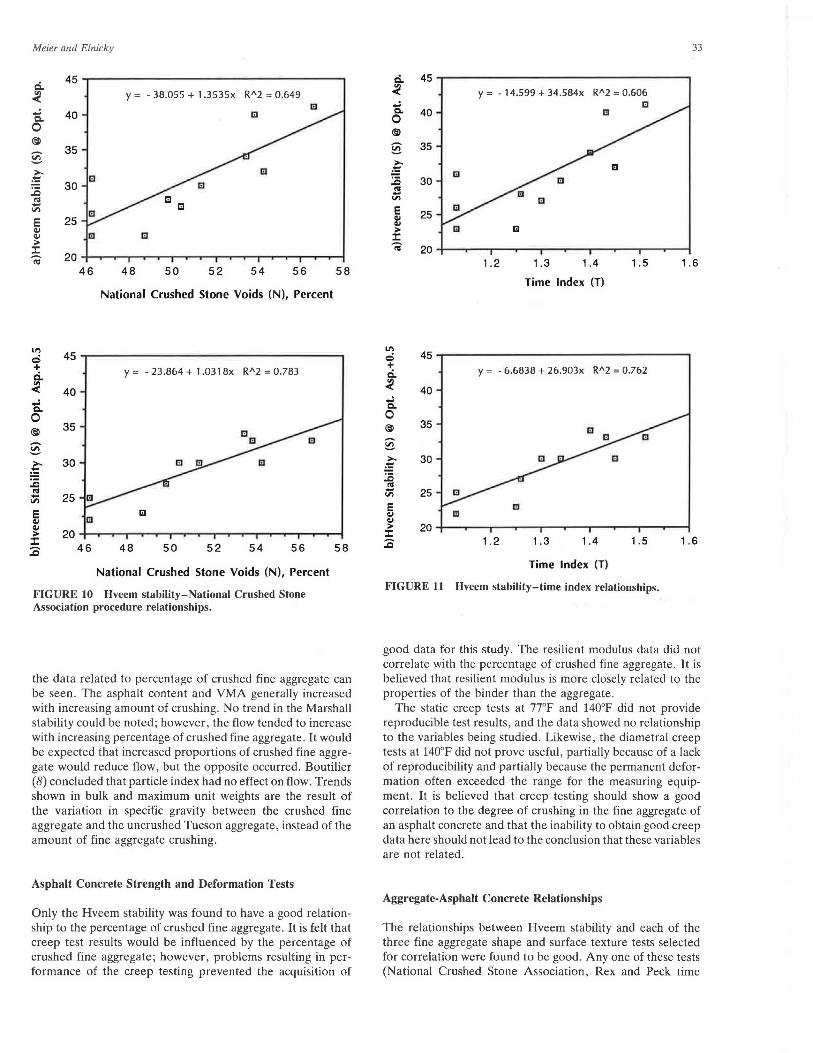
Three of the aggregate shape and texture tests (National Crushed Stone Association procedure, Rex and Peck time index, and specific rugosity) were selected to examine a relationship to Hveem stability. The best-fi t straight lines were computed u ing a least-squares linear regre si n analysis. The re ults of these analyses are shown in Figur s 10, l J, and 12. The relationships developed have values for R (coefficient of correlation) from 0.78 to 0.89. These correspond to coefficients of determination from 0.61 to 0.79. These values indicate that the relationships are a good fit for the data and that there is a good correlation between the variables being tested.
DISCUSSION OF TEST RESULTS
Aggregate Shape and Surface Texture
The results of the aggregate shape and surface texture testing were examined to select the most practical tests for routine use that also gave reliable data. Of the seven test procedures studied, only the direct shear test failed to differentiate between either percentage of crushed fine aggregate or aggregate source.
The Florida bearing value had incomplete data due to the inability to reach failure loads for some tests. The ASTM particle index was found to be very labor-intensive and timeconsuming; it is more practical for special studies than for routine testing. The Western Technologies Inc. void test has not been researched sufficiently to be accepted at this time.
The three remaining test procedures (National Crushed Stone Association procedure, Rex and Peck time index, and specific rugosity) were found to be the preferred tests. Specific rugosity involves the development of both microsurface and macrosurface voids that should be examined; however, the specific rugosity was considered to be the most valuable test result. The Rex and Peck time index has the disadvantage that it uses only a single aggregate fraction and may not always be representative of the character of the entire fine aggregate. These three tests were selected to correlate with the results of asphalt concrete strength and deformation test results .
Asphalt Concrete Mixtures
The results of mix design testing were summarized in Tables 4, 5, and 6. The properties shown are the results of the mix design at approximately 4 percent air voids. Some trends in
Meier and Elnicky
ci 45
"' y = - 38.055 + 1.3535x R"2 = 0.649 < Ill ..: 40 c..
0 @
§ 35
>-."!::
30 :E "' -VI
E 25 Cl.I Cl.I l!I l!I >
::i::: ~ 20
46 48 50 52 54 56
National Crushed Stone Voids (N), Percent
ll'l 45 0
+ y = - 23.864 + 1.0318x R"2 = 0.783 ci "' < 40 ..: c.. 0 @ 35
§ >- 30
."!::
:E "' - 25 VI
E El Cl.I El Cl.I
20 > ::i:::
46 48 50 52 54 56 :E
National Crushed Stone Voids (N), Percent
FIGURE 10 Hveem stability-National Crushed Stone Association procedure relationships.
58
58
the data related to percentage of crushed fine aggregate can be seen. The asphalt content and VMA generally increased with increasing amount of crushing. No trend in the Marshall stability could be noted; however, the flow tended to increase with increasing percentage of crushed fine aggregate. It would be expected that increased proportions of crushed fine aggregate would reduce flow, but the opposite occurred. Boutilier (8) concluded that particle index had no effect on flow. Trends shown in bulk and maximum unit weights are the result of the variation in specific gravity between the crushed fine aggregate and the uncrushed Tucson aggregate, instead of the amount of fine aggregate crushing.
Asphalt Concrete Strength and Deformation Tests
Only the Hveem stability was found to have a good relationship to the percentage of crushed fine aggregate. It is felt that creep test results would be influenced by the percentage of crushed fine aggregate; however, problems resulting in performance of the creep testing prevented the acquisition of
33
ci 45
< y = - 14.599 + 34.584x R"2 = 0.606 ..: c.. 40 0 @
§ 35
>-~ :E 30 "' -VI
E 25 t > Ill
:I: ta' 20
1 .2 1.3 1.4 1 .5 1 .6
Time Index (T)
ll'l 0 45 + y = -6.6838 + 26.903x R"2 = 0.762 ci < 40 ..: c.. 0 @ 35
§ >- 30
:::: :E "' - 25 VI
E El Cl.I
Cl.I > 20
::i::: :E 1 .2 1.3 1 .4 1.5 1 .6
Time Index (T)
FIGURE 11 Hveem stability-time index relationships.
good data for this study. The resilient modulus data did not correlate with the percentage of crushed fine aggregate. It is believed that resilient modulus is more closely related to the properties of the binder than the aggregate .
The static creep tests at 77°F and 140°F did not provide reproducible test results , and the data showed no relationship to the variables being studied . Likewise , the diametral creep tests at 140°F did not prove useful , partially because of a lack of reproducibility and partially because the permanent deformation often exceeded the range for the measuring equipment . It is believed that creep testing should show a good correlation to the degree of crushing in the fine aggregate of an asphalt concrete and that the inability to obtain good creep data here should not lead to the conclusion that these variables are not related.
Aggregate-Asphalt Concrete Relationships
The relationships between Hveem stability and each of the three fine aggregate shape and surface texture tests selected for correlation were found to be good . Any one of these tests (National Crushed Stone Association, Rex and Peck time

34
40
35
30
E 25 t > ::c
y = 6.0596 + 1.2707x R"2 = 0.684
D
'° 20+--r--r-"T"'""..,...."T"'""T-..-..-..-..-........ ..-,......,.....,,.-,.....,r-1
14 1 6 18 20 22 24 26
Specific Rugosity (R), Percent
ll'! 45 Q + y = 11.207 + 0.89370x R"2 = 0.703 ci.. "' < 40 ..: c. 0 @ 35
§ >--~
30
:c ~ - 25 .,, E a ~ [!I ~
20 > ::c 14 1 6 18 20 22 24 26 ~
Specific Rugosity (R), Percent
FIGURE 12 Hveem stability-specific rugosity relationships.
index, or specific rugosity) could be used to screen fine aggregate properties for use in asphalt concrete mixtures.
CONCLUSIONS
The shape and surface texture of fine aggregate can be evaluated by a number of tests. Seven tests were studied and results of all but direct shear were found to be related to the proportion of the fine aggregate with crushed faces.
Asphalt concrete mixture properties were affected by the percentage of fine aggregate with fractured faces resulting
TRANSPORTATION RESEARCH RECORD 1250
from aggregate crushing. Voids in mineral aggregate increased with increasing percentage of crushed fine aggregate, which resulted in increased asphalt content to achieve 4 percent air voids.
The Hveem stability of asphalt concrete mixtures was found to be linearly related to the results of tests of fine aggregate shape and surface texture.
ACKNOWLEDGMENTS
The authors recognize the Arizona Department of Transportation and Federal Highway Administration for their support for this study. Particular recognition should go to Frank McCullagh of the Arizona Transportation Research Center and his staff for their assistance and support.
REFERENCES
l. M. Herrin and W. H . G e1z. Effect of Aggregate Shape on Stability of Bituminous Mixes. NRB Proc., Vol. 33, 1954, pp. 293-308.
2. H. M. Rex and R. A. Peck. A Laboratory Test to Evaluate the Shape and Surface Texture of Fine Aggregate Particles. Public Roads , Dec. 1956.
3. E. Y. Huang. An Improved Particle Index Test for the Evaluation of Geometric Characteristics of Aggregates. ASTM Journal of Materials, Vol. 2, No. 1, March 1987.
4. E. Tons and W. H. Goetz. Packing Volume Concept for Aggregates. Highway Research Record 236. HRB, National Research Council, Washington, D.C., 1968, pp. 76-92.
5. I. Ishai and E. Tons. A Concept and a Test Method for a Unified Characterization of the Geometric Irregularity of Aggregate Particles. ASTM Journal of Testing and Evaluation, Vol. 5, No. 1, Jan. 1977.
6. N. W. McLeod and J. K. Davidson. Particle Index Evaluation of Aggregates for Asphalt Paving Mixtures. Proc:, AAPT, Vol. 50, 1981.
7. J. M. Griffith and B. F. Kallas. Influence of Fine Aggregate on Asphaltic Concrete Paving Mixtures. HRB Proc., Vol. 37, 1958, pp. 219-255.
8. 0. D. Boutilier. A Study of the Relation Between the Particle Index of the Aggregate and the Properties of Bituminous Aggregate Mixtures. Proc., AAPT, Vol. 33, 1967, pp. 157-179.
9. I. Ishai and E. Tons. Aggregate Factors in Bituminous Mixture Design. Report 335140-1-F. University of Michigan, Ann Arbor, Mich., 1971.
10. I. V. Kalcheff and D. G. Tunnicliff. Effects of Crushed Stone Aggregate Size and Shape on Properties of Asphalt Concrete. Proc., AAPT, Vol. 51, 1982.
11. I. Ishai and H. Gelber. Effect of Geometriclrregularity of Aggregates on the Properties and Behavior of Bituminous Concrete. Proc., AAPT, Vol. 51, 1982.