Embed Size (px)
Citation preview

Labor Market Matching Efficiency and Mismatch in Switzerland
Labor Market Matching Efficiency and Mismatch inSwitzerland
Debra Hevenstone, Emily Murphy, Helen Buchs
Swiss Job Market Monitor, University of Zurich
April 12, 2016
1 / 36
Labor Market Matching Efficiency and Mismatch in Switzerland
Research Question
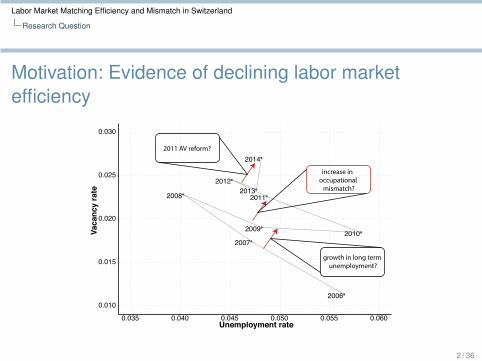
Motivation: Evidence of declining labor marketefficiency
2008
2012
2007
2013
2014
2009
2011
2006
2010
0.010
0.015
0.020
0.025
0.030
0.035 0.040 0.045 0.050 0.055 0.060Unemployment rate
Vaca
ncy
rate
growth in long term unemployment?
increase in occupational mismatch?
2011 AV reform?
2 / 36
Labor Market Matching Efficiency and Mismatch in Switzerland
Research Question
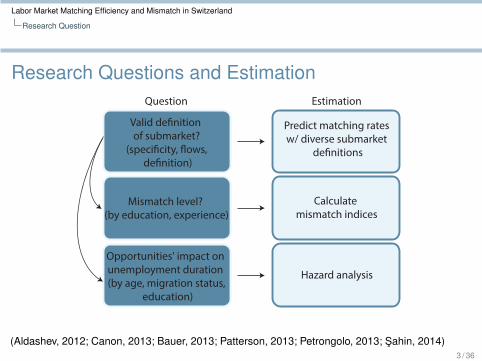
Research Questions and Estimation
Predict matching ratesw/ diverse submarket
de�nitions
Valid de�nition of submarket?
(speci�city, �ows, de�nition)
Question Estimation
Mismatch level? (by education, experience)
Calculate mismatch indices
Opportunities' impact on unemployment duration (by age, migration status,
education)
Hazard analysis
(Aldashev, 2012; Canon, 2013; Bauer, 2013; Patterson, 2013; Petrongolo, 2013; Sahin, 2014)3 / 36
Labor Market Matching Efficiency and Mismatch in Switzerland
Research Question
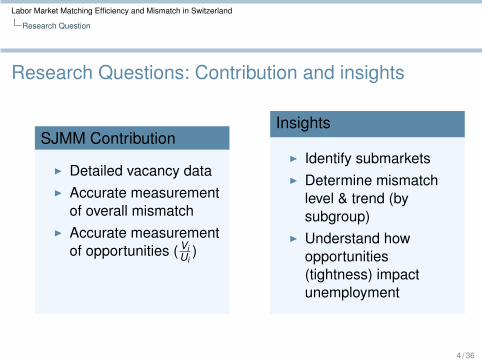
Research Questions: Contribution and insights
SJMM Contribution
▶ Detailed vacancy data▶ Accurate measurement
of overall mismatch▶ Accurate measurement
of opportunities ( ViUi
)
Insights
▶ Identify submarkets▶ Determine mismatch
level & trend (bysubgroup)
▶ Understand howopportunities(tightness) impactunemployment
4 / 36
Labor Market Matching Efficiency and Mismatch in Switzerland
Data
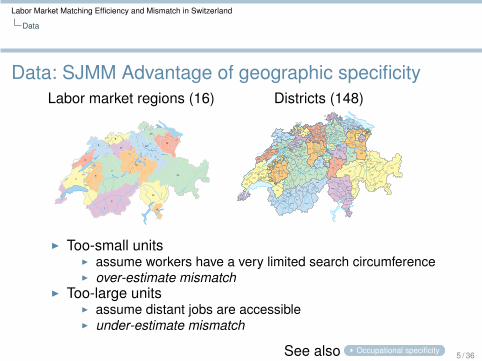
Data: SJMM Advantage of geographic specificityLabor market regions (16) Districts (148)
SH
ZH
ZG
BS
LU
BE
TI
VD FR
NE
GE
GR
SO
BL
AGAR
AI
SZ
OW
SG
VS
JU
TG
NW
GL
UR
101
102
103104
105
106
107
108109111 112
201
202
203
204 205206
207
208
209
210
211
212
213
214
215216
217218
219
220
221
222
223
224
225
226
301
302
303
304305
400
501
502
503
504
505
506
600
700
800
900
1001
1002
1003
1004
1005
1006
1007
11011102
1103
1104
1105
11061107
1108
1109
1110
1200
1301
1302
1303
1304
1305
1501
15021503
1600
1723
1725
1722
1726
17281721
1727
1724
1821
1822
1831
1823
1824
1825
1827
1828
18301829
1826
1901
1902
1903
1904
1905
1906
1907
1908
1909
1910
191120012002
2003
2004
2005
2006
2007
2008
2101
2102
2103
2104
2105
2106
21072108
2221
2227
2223
2226
2222
2228
2224
23012302
2303
2304
2305
2306
2307
2308
2309
2310
2311
2312
2313
2401
2402
2403
24042405
2406
2500
2601
2602
2603
110
1401
14021403
1404
14051406
22252229
2230
▶ Too-small units▶ assume workers have a very limited search circumference▶ over-estimate mismatch
▶ Too-large units▶ assume distant jobs are accessible▶ under-estimate mismatch
See also Occupational specificity5 / 36
Labor Market Matching Efficiency and Mismatch in Switzerland
Data
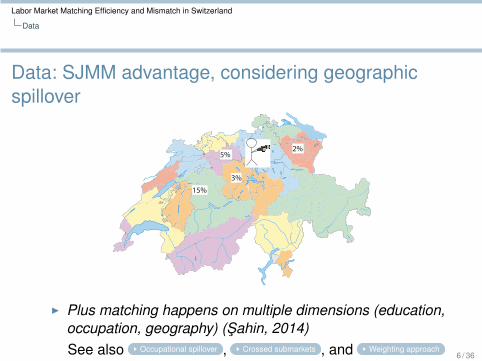
Data: SJMM advantage, considering geographicspillover
15%
5%
3%
2%
▶ Plus matching happens on multiple dimensions (education,occupation, geography) (Sahin, 2014)See also Occupational spillover , Crossed submarkets , and Weighting approach
6 / 36
Labor Market Matching Efficiency and Mismatch in Switzerland
Data
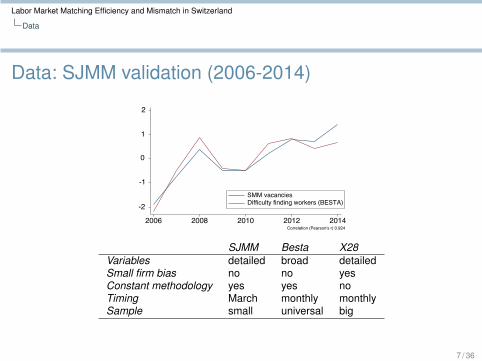
Data: SJMM validation (2006-2014)
2006 2008 2010 2012 2014
SMM vacanciesDifficulty finding workers (BESTA)
Correlation (Pearson's r) 0.924
2
1
0
-1
-2
SJMM Besta X28Variables detailed broad detailedSmall firm bias no no yesConstant methodology yes yes noTiming March monthly monthlySample small universal big
7 / 36

Labor Market Matching Efficiency and Mismatch in Switzerland
Methods
Methods: Matching function
▶ Predict the match rate based on vacancies/unemployed
ln(mituit) = ϕ+ γdt + ln(ρi) + ψi ln(
vituit) + αln( vit
uit) + ϵit
i submarket, t time, mit matches, uit unemployed, v it vacancies
(From Cobb Douglas Matching: mit = ϕvαit u1−α
it )
1. Use best-fitting model to choose valid submarket definition2. Estimate submarket matching efficiency3. Estimate annual matching efficiency
8 / 36
Labor Market Matching Efficiency and Mismatch in Switzerland
Methods
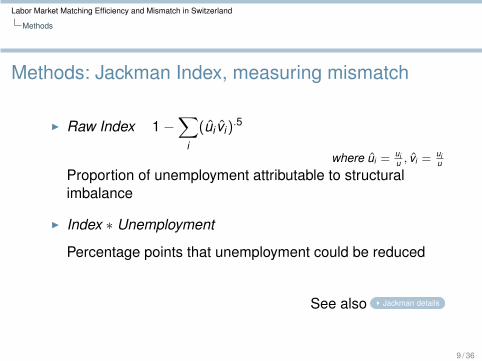
Methods: Jackman Index, measuring mismatch
▶ Raw Index 1 −∑
i
(ui vi).5
where ui =uiu , vi =
uiu
Proportion of unemployment attributable to structuralimbalance
▶ Index ∗ Unemployment
Percentage points that unemployment could be reduced
See also Jackman details
9 / 36
Labor Market Matching Efficiency and Mismatch in Switzerland
Results
Validation through the matching function
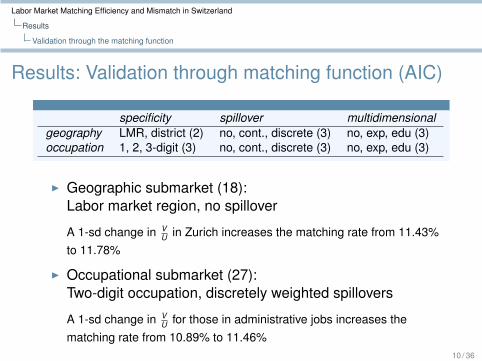
Results: Validation through matching function (AIC)
specificity spillover multidimensionalgeography LMR, district (2) no, cont., discrete (3) no, exp, edu (3)occupation 1, 2, 3-digit (3) no, cont., discrete (3) no, exp, edu (3)
▶ Geographic submarket (18):Labor market region, no spillover
A 1-sd change in VU in Zurich increases the matching rate from 11.43%
to 11.78%
▶ Occupational submarket (27):Two-digit occupation, discretely weighted spillovers
A 1-sd change in VU for those in administrative jobs increases the
matching rate from 10.89% to 11.46%10 / 36
Labor Market Matching Efficiency and Mismatch in Switzerland
Results
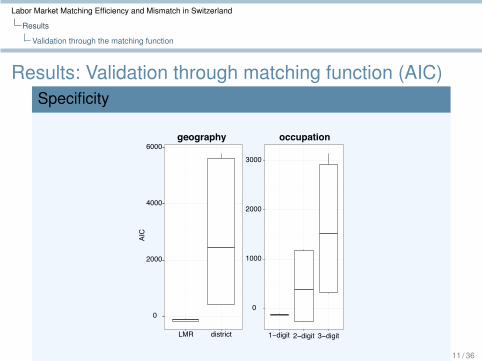
Validation through the matching function
Results: Validation through matching function (AIC)Specificity
0
2000
4000
6000
LMR district
AIC
geography
0
1000
2000
3000
1−digit 2−digit 3−digit
occupation
See also Multivariate definitions
11 / 36
Labor Market Matching Efficiency and Mismatch in Switzerland
Results
Validation through the matching function
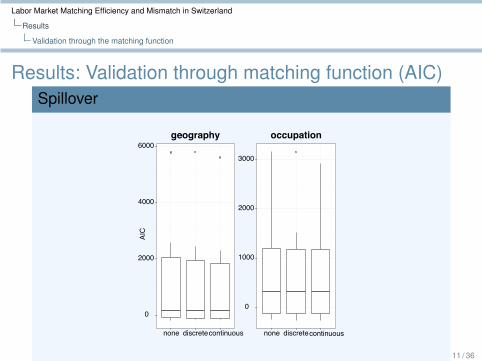
Results: Validation through matching function (AIC)Spillover
0
2000
4000
6000
none discretecontinuous
AIC
geography
0
1000
2000
3000
none discretecontinuous
occupation
See also Multivariate definitions
11 / 36
Labor Market Matching Efficiency and Mismatch in Switzerland
Results
Validation through the matching function
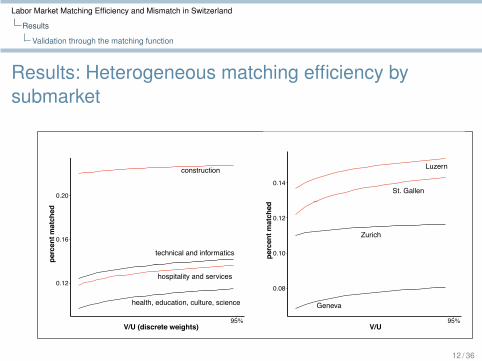
Results: Heterogeneous matching efficiency bysubmarket
0.12
0.16
0.20
95%V/U (discrete weights)
perc
ent m
atch
ed
construction
health, education, culture, science
hospitality and services
technical and informatics
0.08
0.10
0.12
0.14
95%V/U
perc
ent m
atch
ed
Geneva
Luzern
St. Gallen
Zurich
12 / 36
Labor Market Matching Efficiency and Mismatch in Switzerland
Results
Validation through the matching function
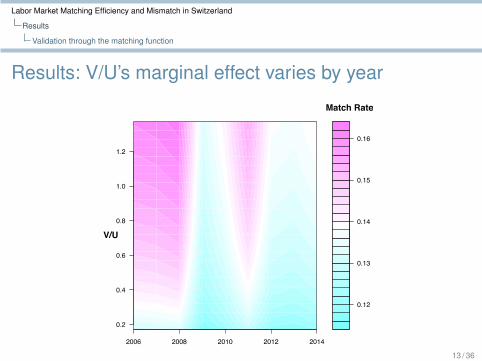
Results: V/U’s marginal effect varies by year
0.12
0.13
0.14
0.15
0.16
2006 2008 2010 2012 2014
0.2
0.4
0.6
0.8
1.0
1.2
V/U
Match Rate
13 / 36
Labor Market Matching Efficiency and Mismatch in Switzerland
Results
Labor Market Mismatch
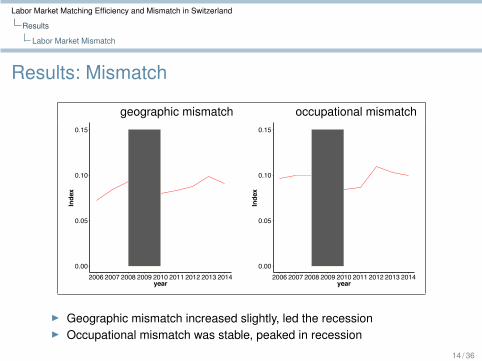
Results: Mismatch
geographic mismatch occupational mismatch
0.00
0.05
0.10
0.15
2006 2007 2008 2009 2010 2011 2012 2013 2014year
Inde
x
0.00
0.05
0.10
0.15
2006 2007 2008 2009 2010 2011 2012 2013 2014year
Inde
x
▶ Geographic mismatch increased slightly, led the recession▶ Occupational mismatch was stable, peaked in recession
14 / 36
Labor Market Matching Efficiency and Mismatch in Switzerland
Results
Labor Market Mismatch
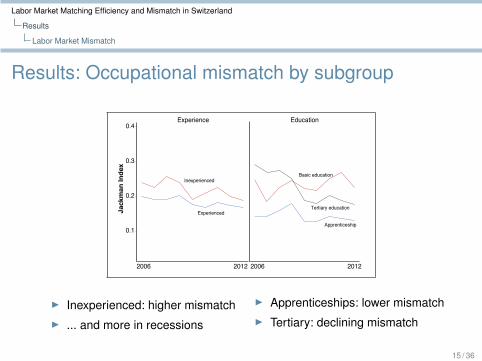
Results: Occupational mismatch by subgroup
Inexperienced
Experienced
0.1
0.2
0.3
0.4
2006 2012
Jack
man
Inde
x
2006 2012
Basic education
Tertiary education
Apprenticeship
Experience Education
▶ Inexperienced: higher mismatch▶ ... and more in recessions
▶ Apprenticeships: lower mismatch▶ Tertiary: declining mismatch
15 / 36
Labor Market Matching Efficiency and Mismatch in Switzerland
Results
Labor Market Mismatch
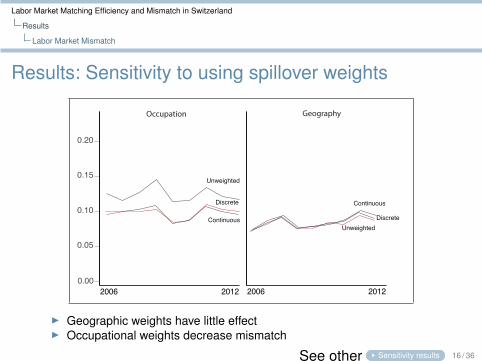
Results: Sensitivity to using spillover weights
Discrete
Continuous
Occupation Geography
Unweighted
2006 20120.00
0.05
0.10
0.15
0.20
2006 2012
Discrete
Continuous
Unweighted
▶ Geographic weights have little effect▶ Occupational weights decrease mismatch
See other Sensitivity results 16 / 36
Labor Market Matching Efficiency and Mismatch in Switzerland
Conclusion
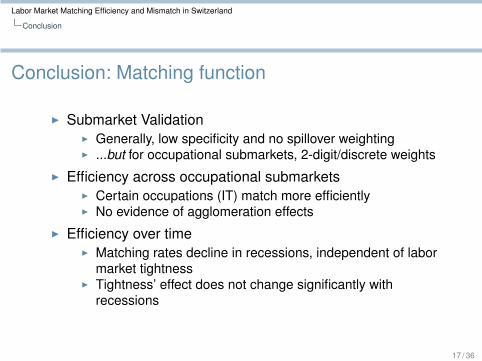
Conclusion: Matching function
▶ Submarket Validation▶ Generally, low specificity and no spillover weighting▶ ...but for occupational submarkets, 2-digit/discrete weights
▶ Efficiency across occupational submarkets▶ Certain occupations (IT) match more efficiently▶ No evidence of agglomeration effects
▶ Efficiency over time▶ Matching rates decline in recessions, independent of labor
market tightness▶ Tightness’ effect does not change significantly with
recessions
17 / 36
Labor Market Matching Efficiency and Mismatch in Switzerland
Conclusion
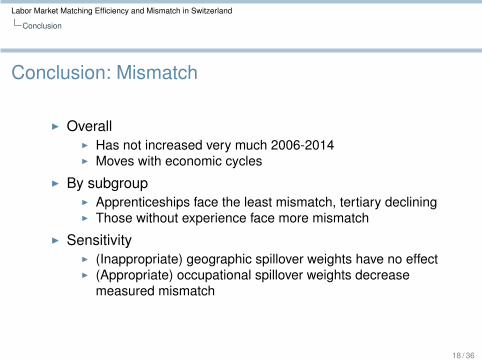
Conclusion: Mismatch
▶ Overall▶ Has not increased very much 2006-2014▶ Moves with economic cycles
▶ By subgroup▶ Apprenticeships face the least mismatch, tertiary declining▶ Those without experience face more mismatch
▶ Sensitivity▶ (Inappropriate) geographic spillover weights have no effect▶ (Appropriate) occupational spillover weights decrease
measured mismatch
18 / 36

Labor Market Matching Efficiency and Mismatch in Switzerland
Thanks
Thank You
19 / 36

Labor Market Matching Efficiency and Mismatch in Switzerland
Appendix
Appendix: Occupational submarket specificity
SBN1 (9)
1 agriculture2 manufacturing3 technical/inform4 construction5 retail6 hospitality7 management8 health/edu/culture9 other
SBN2 (38)
81 media82 art83 caring84 education85 soc/nat sci86 health87 sport
SBN3 (87)
861 medicine862 therapy 863 dental864 veterinary865 nursing
SBN5 (380)
861.01 doctor861.02 medical ass.861.03 pharmacist861.04 pharmacy ass.
Go back to Geographic specificity
20 / 36

Labor Market Matching Efficiency and Mismatch in Switzerland
Appendix
Appendix: Occupational spillover
10% 3%1%
Back to Geographic spillover
See also Weighting approach
21 / 36
Labor Market Matching Efficiency and Mismatch in Switzerland
Appendix
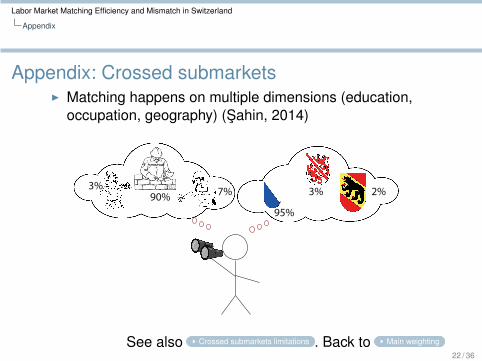
Appendix: Crossed submarkets▶ Matching happens on multiple dimensions (education,
occupation, geography) (Sahin, 2014)
90% 7%3%
95%
3% 2%
See also Crossed submarkets limitations . Back to Main weighting
22 / 36

Labor Market Matching Efficiency and Mismatch in Switzerland
Appendix
Appendix: Crossed submarkets limitation▶ Problem is small cell counts, inflating mismatch▶ Weighting by spillover could exacerbate or improve
problem
Vacancies w/ tertiary education, 2014, by LMRZurich Ticino
IT 1201 36Banking & Insurance 288 0Law 228 0Teachers in Tertiary Education 95 0Social Sciences and Economics 134 0Natural Sciences 82 0Human Medicine and Pharmacy 248 40Veterinary Medicine 0 0
Go back to Crossed submarkets
23 / 36

Labor Market Matching Efficiency and Mismatch in Switzerland
Appendix
Appendix: Unemployment records validation
140
160
180
200
220
240
2006 2007 2008 2009 2010 2011 2012 2013 2014Year
Une
mpl
oyed
Job
−see
kers
AVAM ILOUnemployed in 1000s
▶ Administrative records exceeded ILO count until 2011revision
▶ ILO: Unemployed and available for work w/in 30 days▶ AVAM: Includes people who are eligible, not necessarily
available for work24 / 36
Labor Market Matching Efficiency and Mismatch in Switzerland
Appendix
Appendix: Spillover weighting
Appendix: Spillover weighting, data
▶ Occupational changes▶ SAKE (Swiss labor market survey)
▶ Location of residence and job▶ SAKE (Swiss labor market survey)
▶ Commuting time distribution▶ Swiss census structural survey
▶ Distances▶ Google maps (driving)
Go back to Main weighting slides
25 / 36

Labor Market Matching Efficiency and Mismatch in Switzerland
Appendix
Appendix: Spillover weighting
Appendix: Spillover weighting, overview▶ Discrete weights (for vacancies)
▶ Geography: location of residence before job change vs.location of new job
▶ Occupation: occupation of job 1 vs. occupation of job 2
▶ Continuous weights (for vacancies)▶ Geography: probability taking a job in a given location (vs
residence)▶ Occupation: probability occupational change by sbn digit
change
V∗ =
(1, 1) (1, 2) (2, 1) (2, 2)
(1, 1) .7 .13 .13 .04(1, 2) . . . . . . . . . . . .(2, 1) . . . . . . . . . . . .(2, 2) . . . . . . . . . . . .
3479
=
3.89. . .. . .. . .
Go back to Main weighting slides
26 / 36
Labor Market Matching Efficiency and Mismatch in Switzerland
Appendix
Appendix: Spillover weighting
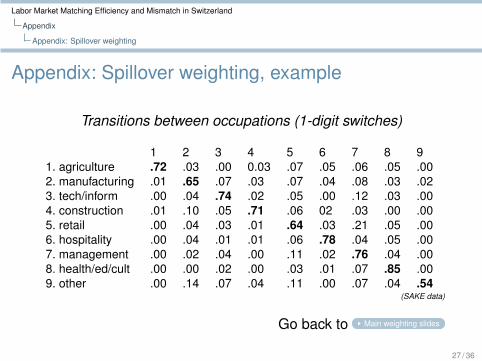
Appendix: Spillover weighting, example
Transitions between occupations (1-digit switches)
1 2 3 4 5 6 7 8 91. agriculture .72 .03 .00 0.03 .07 .05 .06 .05 .002. manufacturing .01 .65 .07 .03 .07 .04 .08 .03 .023. tech/inform .00 .04 .74 .02 .05 .00 .12 .03 .004. construction .01 .10 .05 .71 .06 02 .03 .00 .005. retail .00 .04 .03 .01 .64 .03 .21 .05 .006. hospitality .00 .04 .01 .01 .06 .78 .04 .05 .007. management .00 .02 .04 .00 .11 .02 .76 .04 .008. health/ed/cult .00 .00 .02 .00 .03 .01 .07 .85 .009. other .00 .14 .07 .04 .11 .00 .07 .04 .54
(SAKE data)
Go back to Main weighting slides
27 / 36
Labor Market Matching Efficiency and Mismatch in Switzerland
Appendix
Appendix: Spillover weighting
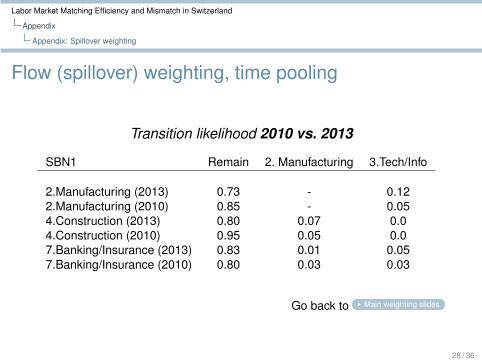
Flow (spillover) weighting, time pooling
Transition likelihood 2010 vs. 2013
SBN1 Remain 2. Manufacturing 3.Tech/Info
2.Manufacturing (2013) 0.73 - 0.122.Manufacturing (2010) 0.85 - 0.054.Construction (2013) 0.80 0.07 0.04.Construction (2010) 0.95 0.05 0.07.Banking/Insurance (2013) 0.83 0.01 0.057.Banking/Insurance (2010) 0.80 0.03 0.03
Go back to Main weighting slides
28 / 36
Labor Market Matching Efficiency and Mismatch in Switzerland
Appendix
Appendix: Spillover weighting
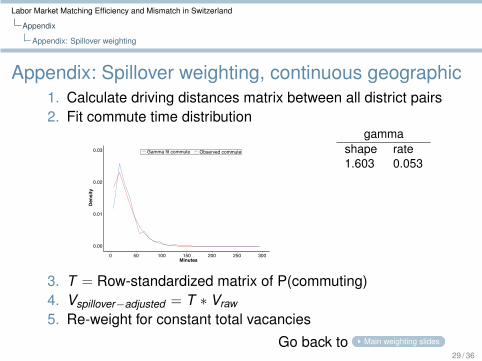
Appendix: Spillover weighting, continuous geographic1. Calculate driving distances matrix between all district pairs2. Fit commute time distribution
0.00
0.01
0.02
0.03
0 50 100 150 200 250 300Minutes
Den
sity
Gamma fit commute Observed commute
gammashape rate1.603 0.053
3. T = Row-standardized matrix of P(commuting)4. Vspillover−adjusted = T ∗ Vraw
5. Re-weight for constant total vacancies
Go back to Main weighting slides
29 / 36
Labor Market Matching Efficiency and Mismatch in Switzerland
Appendix
Appendix: Spillover weighting
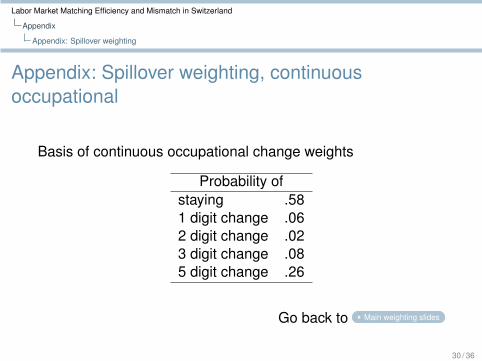
Appendix: Spillover weighting, continuousoccupational
Basis of continuous occupational change weights
Probability ofstaying .581 digit change .062 digit change .023 digit change .085 digit change .26
Go back to Main weighting slides
30 / 36
Labor Market Matching Efficiency and Mismatch in Switzerland
Appendix
Appendix: Spillover weighting
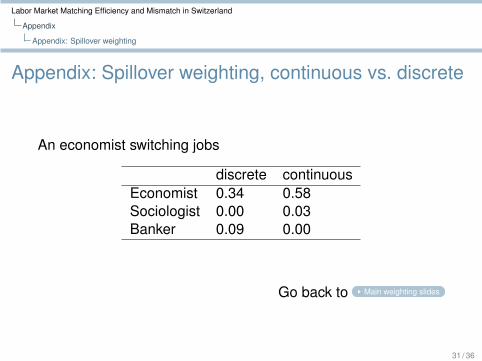
Appendix: Spillover weighting, continuous vs. discrete
An economist switching jobs
discrete continuousEconomist 0.34 0.58Sociologist 0.00 0.03Banker 0.09 0.00
Go back to Main weighting slides
31 / 36

Labor Market Matching Efficiency and Mismatch in Switzerland
Appendix
Appendix: Spillover weighting
Appendix: Jackman Index alternatives/critique▶ Alternatives
▶ V-U correlations▶ Proportion of unemployed in the wrong sector
12
∑i
|ui − vi |
▶ Jackman w/ weights for submarket efficiency (Sahin, 2013)▶ Lilien Turbulence Index▶ Standard deviation of the rate of employment growth across
occupations (Evans 1993; Daly,2012)▶ Jackman advantages/disadvantages
▶ See Canon et. al., 2013▶ Composition invariance example
Increasing occupation 3 in canton 1 increased in the spread betweenoccupations 1 & 2’s vacancy and unemployment shares.
Go back to Main jackman slide
32 / 36
Labor Market Matching Efficiency and Mismatch in Switzerland
Appendix
Appendix: Additional Matching Equation Results
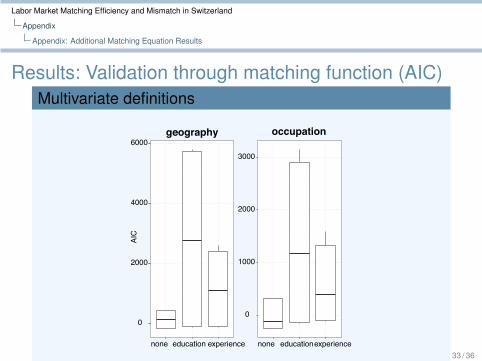
Results: Validation through matching function (AIC)Multivariate definitions
0
2000
4000
6000
none education experience
AIC
geography
0
1000
2000
3000
none educationexperience
occupation
33 / 36
Labor Market Matching Efficiency and Mismatch in Switzerland
Appendix
Appendix: Additional Mismatch Results
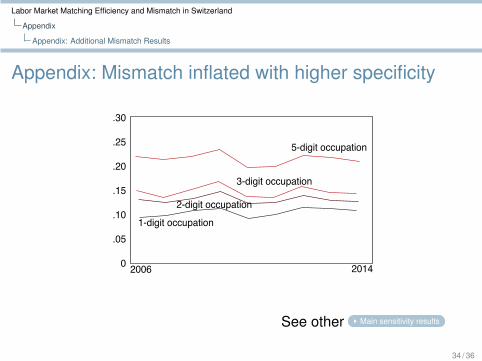
Appendix: Mismatch inflated with higher specificity
5-digit occupation
3-digit occupation
2-digit occupation1-digit occupation
2006 2014
.30
.25
.20
.15
.10
.05
0
See other Main sensitivity results
34 / 36
Labor Market Matching Efficiency and Mismatch in Switzerland
Appendix
Appendix: Additional Mismatch Results
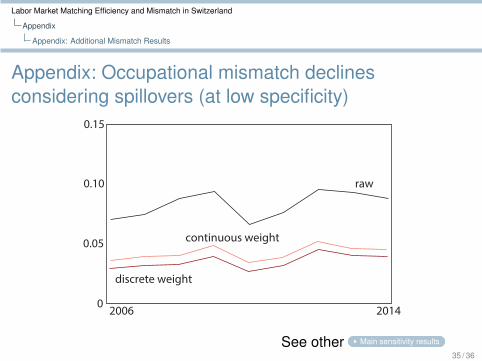
Appendix: Occupational mismatch declinesconsidering spillovers (at low specificity)
raw
discrete weight
continuous weight
0
0.05
0.10
0.15
2006 2014
See other Main sensitivity results
35 / 36
Labor Market Matching Efficiency and Mismatch in Switzerland
Appendix
Appendix: Additional Mismatch Results
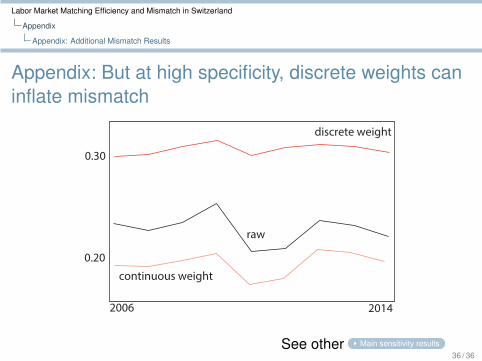
Appendix: But at high specificity, discrete weights caninflate mismatch
0.20
0.30
raw
discrete weight
continuous weight
2006 2014
See other Main sensitivity results36 / 36


![IEEE TRANSACTIONS ON MICROWAVE THEORY …778413/FULLTEXT01.pdfin load impedance mismatch may reduce its efficiency [15]. In summary, the effects of the load impedance mismatch may](https://img.pdfslide.us/doc/110x75/5e5d4755ca603a2d951a0a11/ieee-transactions-on-microwave-theory-778413fulltext01pdf-in-load-impedance-mismatch.jpg)