Embed Size (px)
Citation preview

1 | P a g e
Lab #3: Map Reading
OBJECTIVE: The primary objective of this lab is for you to become familiar with and learn
how to read quadrangle maps and contour lines.
SPECIFICS:
• For your convenience, hard‐copy and digital maps will be provided. o Create a lab3 folder in U:\classes\gtech201\labs\ o Download data to your lab3 folder. o Using WinZip, extract the data to your lab3 folder.
• Begin working on assignment.
• Record only the answers in a MS Word document.
DUE DATE AND METHOD: The lab is due by 9 am Wednesday, October 6, 2010. Email
your instructor the MS Word file using the proper file naming convention (e.g., ajeu04.docx).

2 | P a g e
Quadrangle Maps and Reading Contour Lines
A. Overview of the Components of Quadrangle Maps In lecture you were introduced to USGS 1:24,000 maps, the standard map used to represent local geographic features. Today’s laboratory will examine components that comprise a USGS 7.5‐minute (1:24,000) quadrangle map. Map name – All USGS quadrangle maps have a unique name representative of the region the map depicts. The map name is always indicated in the upper right corner of the map (Figure 1). A small reference map is also included as an inset, at the lower margin of the map, showing the location of the quadrangle map within the state. Finally, along the four edges and four corners of the map, names are given that indicate the names of adjacent quadrangle maps. Time of Revisions – In rapidly growing regions such as the South Texas Borderlands region, geographic features can change over time. Therefore, it is important to note the dates in which the map was revised, provided on the bottom of the map (Figure1). Direction – There are actually several types of direction that can be depicted on a map. Geographic directions, such as a true north arrow, indicate how the map is oriented toward the geographic North Pole. Quadrangle maps are always oriented with the long dimension in a true north‐south direction. However, a second type of north (magnetic north) is commonly used for navigation purposes. Note that geographic north and magnetic north do not correspond. The difference in degrees between geographic north and magnetic north is indicated on the map, and is referred to as the magnetic declination (Figure 1). Scale – Map scale is indicated on the bottom of the map both in the form of a representative fraction and as graphic scale bars (Figure 1). The 7.5‐minute USGS quadrangle maps have a representative fraction of 1:24,000 that translates into 1 inch on the map representing 2000 feet on the earth’s surface. For common applications on land, either statute miles or feet are used.

3 | P a g e

4 | P a g e

5 | P a g e
Map Colors and Symbols – USGS quadrangle maps use a standardized set of map colors and symbols to depict geographic features (Figure 2). As you can see, there are numerous types of features that can be illustrated on a quadrangle map. The following list does not describe in detail all the features on this key but instead refers to the categories of geographic features as indicated by specific colors.
• Blue – water features such as rivers, streams, lakes, and reservoirs
• Green – vegetation features such as woods, swamps and scrub
• Red – major roads
• Pink or Gray – generalized depiction of built‐up urban areas
• Black – discrete constructed features such as roads or buildings
• Purple – buildings under construction at the time of surveying
• Brown – sand and gravel; there are also brown lines on the map called contour lines
Questions: Answer the following questions. You may refer to the file o44068d2.tif to double check your answers. Using ArcMap, add this data (i.e., the TIFF file) to a new empty map; Click yes to build pyramids.
1. What is the name of your map? 2. What quadrangle map is present to the south of your map? 3. When was the map surveyed? 4. When was your map revised? 5. What is the magnetic declination indicated on your map? Is it different for today? 6. How many miles long is your map from north to south, according to the map scales
at the bottom of the map? 7. How many miles wide is your map from east to west, according to the map scales at
the bottom of the map? 8. How accurate is the depiction of human constructed features on your map (hint: was
it photo‐revised)? How accurately does it depict Bar Harbor today? 9. What horizontal datum was used to produce this map? 10. What vertical datum was used to produce this map? 11. If the more up‐to‐date NAD 1983 was used to produce this map how far, in meters,
would the projection lines have to be moved and in what direction? 12. What is the mean tidal range for this area of Maine?

6 | P a g e
B. Introduction to Elevation and Contour Lines A map is a two‐dimensional representation of a region of the earth. However, the landscape obviously varies in the third dimension (elevation). Technically, elevation is the number of feet (or meters) above an established datum a geographic feature is. The datum is designated as 0 ft (or meters), which is commonly defined as mean (average) sea level in the region. The USGS has established a network of known reference points, referred to as bench marks (BM) that are symbolized with an X. The elevation of the BM is the number immediately adjacent to the X (Figure 2). Look at your topographic map. Contour lines provide a method for depicting the variation in elevation in between bench marks. A contour line is a line of equal elevation that is drawn on a topographic map. The significance of a contour line is that along this line the elevation is always the same. For example, every point along a 100‐ft contour line has an elevation of 100 feet. Again, look at your topographic map. The vertical distance in elevation between two adjacent contour lines is referred to as the contour interval. The contour interval (often abbreviated as “CI) is always indicated on the bottom of a USGS quadrangle map, below the graphic scale bars. The specific contour interval of a map depends on the nature of the landscape that the map depicts. For relatively flat areas such as New York City the contour interval may be as low as 10 feet. For steep, highly mountainous regions the contour interval may be as large as 100 ft. Finally, notice on your map that every fifth contour line is printed as a bold line and is labeled. These labeled contour lines are referred to as index contours. Questions: 13. What is the elevation of the bench mark located immediately east of the Municipal
building on your quadrangle map? 14. What is the contour interval of your quadrangle map?

7 | P a g e
C. Reading Contour Lines on a Topographic Map There are several rules for reading the contour lines on a topographic map. Rule 1 – Contour lines connect points of equal elevation (Figure 3a). Every fifth contour line is darker and labeled, and is called an index contour line. Rule 2 – Contour lines never branch or split and never cross each other (Figure 3b). EXCEPTION: Overhanging rock over a cliff; contour lines can also merge into a single line to show a vertical cliff. Rule 3 – Gentle slopes (flatter areas) have widely spaced contour lines and steep slopes have closely spaced contour lines (Figure 3c).
Slope – is the vertical change in elevation per horizontal distance. More commonly, this is referred to as “rise over run,” which is usually expressed as feet (vertical) per mile (horizontal).
Rule 4 – Hills are represented by a series of concentric, closed contour lines (Figure 3d). Note that all contour lines always close on themselves; however, contour lines do not necessarily have to close on themselves within the area of the map. Note: when a hill is between two contour lines, the first contour of the hill always takes on the higher contour line and then contours of the hill increase in elevation. Rule 5 – Topographic depressions (holes) are indicated by a series of concentric, closed contour lines with hachure marks on the insides of the circles (Figure 3e). Note: when a depression is between two contour lines, then the first contour of the depression always takes on the lower contour line, and additional contours of the depression decrease in elevation. Rule 6 – When rivers and streams cross a contour line, the contours will form a “V” that points upstream towards the source of the river, or in the opposite direction form that in which the water is flowing (Figure 3f). Note: ALL rivers and streams flow downstream; it is proper to give the compass direction when indicating the direction in which a river or stream is flowing.

8 | P a g e
Figure 3: a) Contour lines connect points of equal elevation; b) Contour lines never branch or split; c) Gentle and steep areas depicted on a topographic map; d) Illustration of hills with contour lines; e) Illustration of depressions (holes) with contour lines; f) The rule of V’s and streams.
9 | P a g e
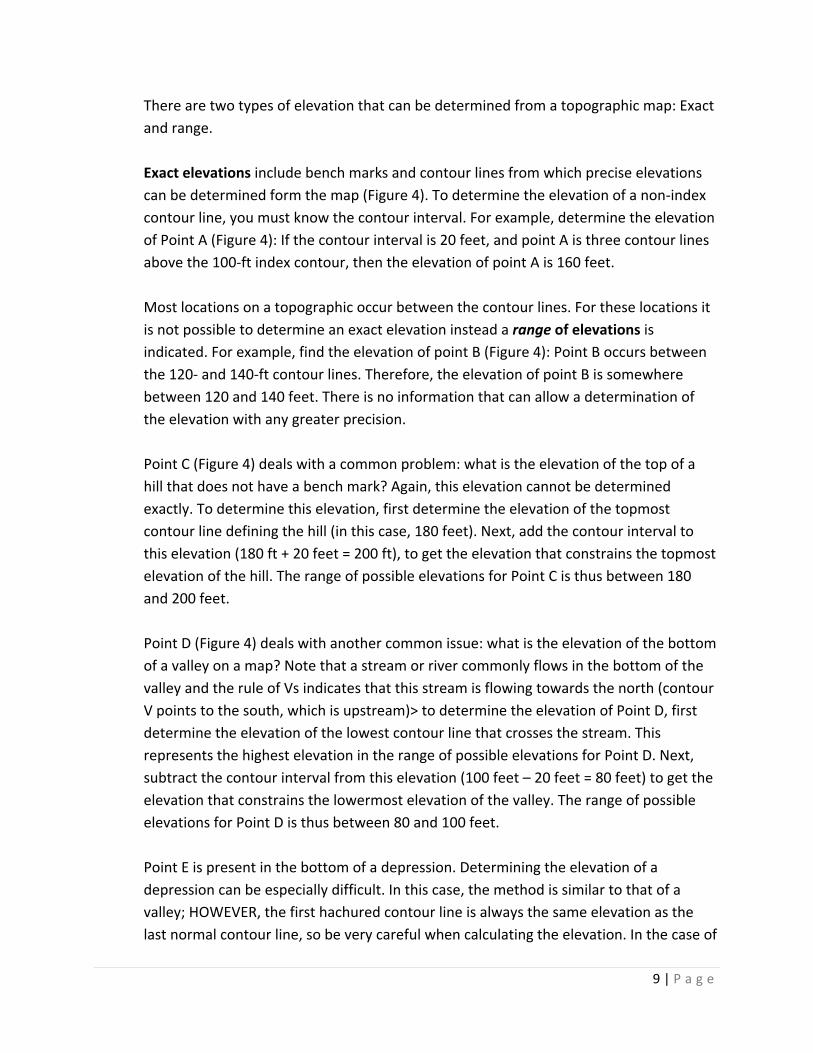
There are two types of elevation that can be determined from a topographic map: Exact and range. Exact elevations include bench marks and contour lines from which precise elevations can be determined form the map (Figure 4). To determine the elevation of a non‐index contour line, you must know the contour interval. For example, determine the elevation of Point A (Figure 4): If the contour interval is 20 feet, and point A is three contour lines above the 100‐ft index contour, then the elevation of point A is 160 feet. Most locations on a topographic occur between the contour lines. For these locations it is not possible to determine an exact elevation instead a range of elevations is indicated. For example, find the elevation of point B (Figure 4): Point B occurs between the 120‐ and 140‐ft contour lines. Therefore, the elevation of point B is somewhere between 120 and 140 feet. There is no information that can allow a determination of the elevation with any greater precision. Point C (Figure 4) deals with a common problem: what is the elevation of the top of a hill that does not have a bench mark? Again, this elevation cannot be determined exactly. To determine this elevation, first determine the elevation of the topmost contour line defining the hill (in this case, 180 feet). Next, add the contour interval to this elevation (180 ft + 20 feet = 200 ft), to get the elevation that constrains the topmost elevation of the hill. The range of possible elevations for Point C is thus between 180 and 200 feet. Point D (Figure 4) deals with another common issue: what is the elevation of the bottom of a valley on a map? Note that a stream or river commonly flows in the bottom of the valley and the rule of Vs indicates that this stream is flowing towards the north (contour V points to the south, which is upstream)> to determine the elevation of Point D, first determine the elevation of the lowest contour line that crosses the stream. This represents the highest elevation in the range of possible elevations for Point D. Next, subtract the contour interval from this elevation (100 feet – 20 feet = 80 feet) to get the elevation that constrains the lowermost elevation of the valley. The range of possible elevations for Point D is thus between 80 and 100 feet. Point E is present in the bottom of a depression. Determining the elevation of a depression can be especially difficult. In this case, the method is similar to that of a valley; HOWEVER, the first hachured contour line is always the same elevation as the last normal contour line, so be very careful when calculating the elevation. In the case of

10 | P a g e
Point E, to find the upper value in the range of possible elevations (first hachured line = last normal line = 160 feet – 20 feet = 140 feet). Next, subtract the contour interval from the elevation of the lowest hachured contour line (140 feet – 20 feet = 120 feet), to find the lower constraint on possible elevations for Point E. The range of possible elevations is thus 120 to 140 feet. Finally, if your map has a contour line indicating sea level (0 feet), this line will almost always define the lowest elevation on your map, especially if your map is next to the ocean. Note that any river that intersects the coastline always flows towards the ocean. So if you forget the rule of Vs, just remember that water flows towards the ocean. Obviously, the Vs that are formed as a river crosses contour lines will point upstream, away from the ocean.

11 | P a g e
Questions: Refer to the Bar Harbor, Maine Quadrangle Map below and answer the following questions. You can also view the map by going to this file:
• bar.harbor.topo.map.jpg Using Adobe Photoshop you can then zoom in on any area of the map.
As precisely as possible determine the elevation of the following labeled points on the Bar Harbor map:
15. Point #1: point NW of New Mills Meadow Pond 16. Point #2: point near Great Hill 17. Point #3: Park Loop Road
As precisely as possible determine the elevation of the following labeled points on the Bar Harbor map:
18. Bar Harbor hospital 19. Building at the College of the Atlantic with a flag 20. Park Headquarters near Canoe Point 21. What direction is the stream flowing between New Mills Meadow Pond and Eagle Lake? 22. What is the straight line distance from the post office in Bar Harbor to Park
Headquarters?

12 | P a g e

13 | P a g e
Universal Transverse Mercator Coordinate Interpretation
Take out the Bar Harbor 1:24,000 map. Notice the black boxes or grid lines on the map. These are UTM grid lines spaced every 1 kilometer (1000 meters). Look along the bottom border of the map at the numbers. There are grid coordinates for three different systems, Latitude/Longitude, UTM and State Plane. UTM coordinates will be associated with the UTM grid lines and look like this: 560.
Along the bottom you have:
560 562 564 566 567
Along the side you have:
4914 4915 4916 4917 4918 etc
Even though the zeros are not printed, it is implied that they are there. For example:
Along the bottom you have:
560000 562000 564000 566000 567000
Along the side you have:
4914000 4915000 4916000 4917000 4918000
Example: UTM coordinates for the bottom‐left corner of the map are:
19 559650mE 4913600mN
Example: Latitude/Longitude coordinates for the bottom‐left corner of the map are:
42o22’30”N, 68o14’57”W

14 | P a g e
Questions:
What natural or man‐made feature is located at the following UTM coordinates:
23. 19 562125mE 4914150mN 24. 19 561480mE 4916150mN 25. 19 562775mE 4918625mN
26. What are the UTM coordinates for the 125 foot benchmark on Burnt Porcupine Island? 27. What are the UTM coordinates for the water tower located next to the pump house to
the east of New Mills Meadow Pond? 28. What are the UTM coordinates of the 202 foot benchmark southwest of Sorrento
Community Church in the upper portion of the map? 29. What is the straight line distance in miles from the west side of the Customhouse at the
Ferry Terminal to the west side of Bar Harbor Hospital? 30. What is the straight line distance in kilometers from Lookout Point to Canoe Point across
Hulls Cove?