Embed Size (px)
Citation preview
Topographic Maps
Lab 2
Concepts Map projections Map scale Topographic maps
Contour lines Topographic profiles Basic map elements
“map”: a representation, usually on a flat surface, of features on the earth showing respective forms, sizes, and spatial relationships
Map Projections
Why “projections”? A globe is the only true representation of the Earth Have many methods of transforming the 3D Earth’s
features onto a 2D flat surface Flat maps cannot exist without a projection Projections distort features in one of the following ways:
Size Shape Direction Distance
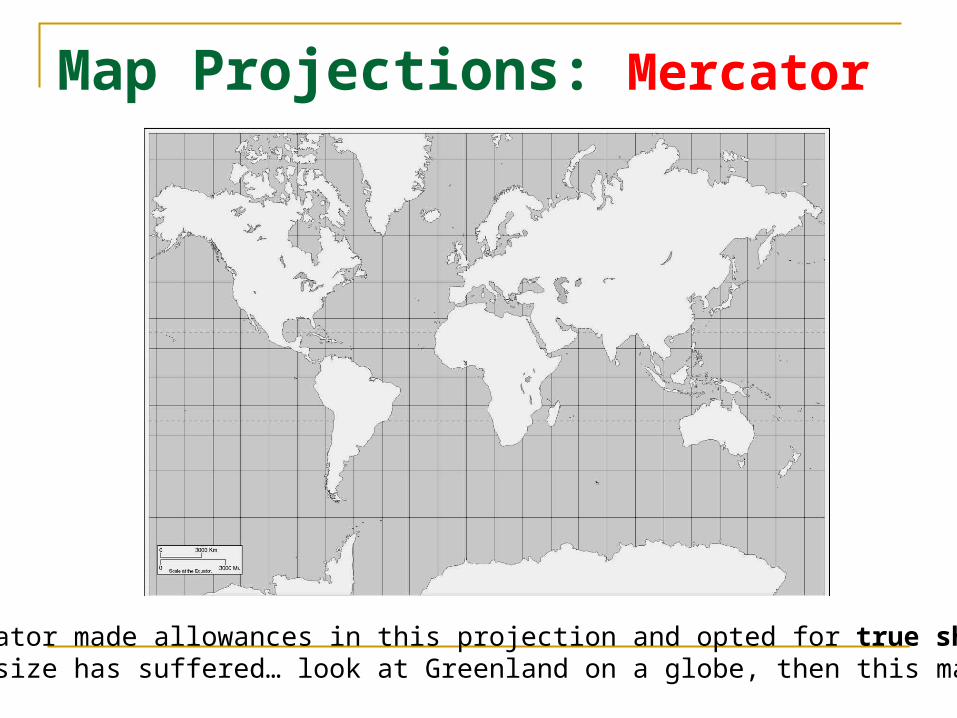
Map Projections: Mercator
Mercator made allowances in this projection and opted for true shape.But size has suffered… look at Greenland on a globe, then this map.
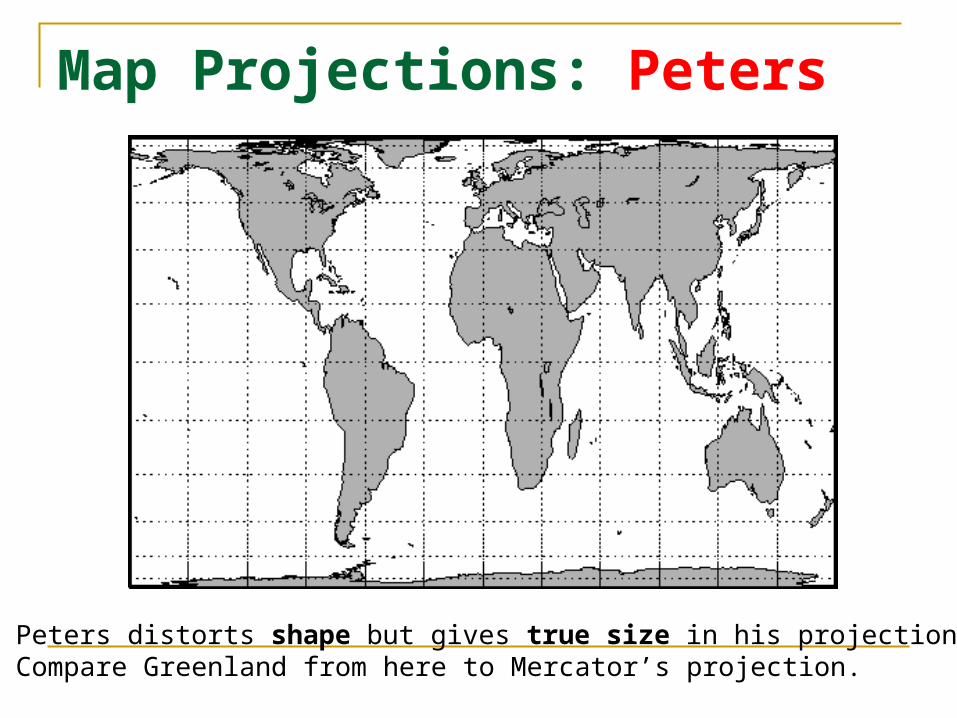
Map Projections: Peters
Peters distorts shape but gives true size in his projection.Compare Greenland from here to Mercator’s projection.
Mercator vs Peters – who is right? No single projection is ideal for all
purposes. Depending on the use of your map, choose
the projection carefully. Learn more about projections here:
http://erg.usgs.gov/isb/pubs/MapProjections/projections.html
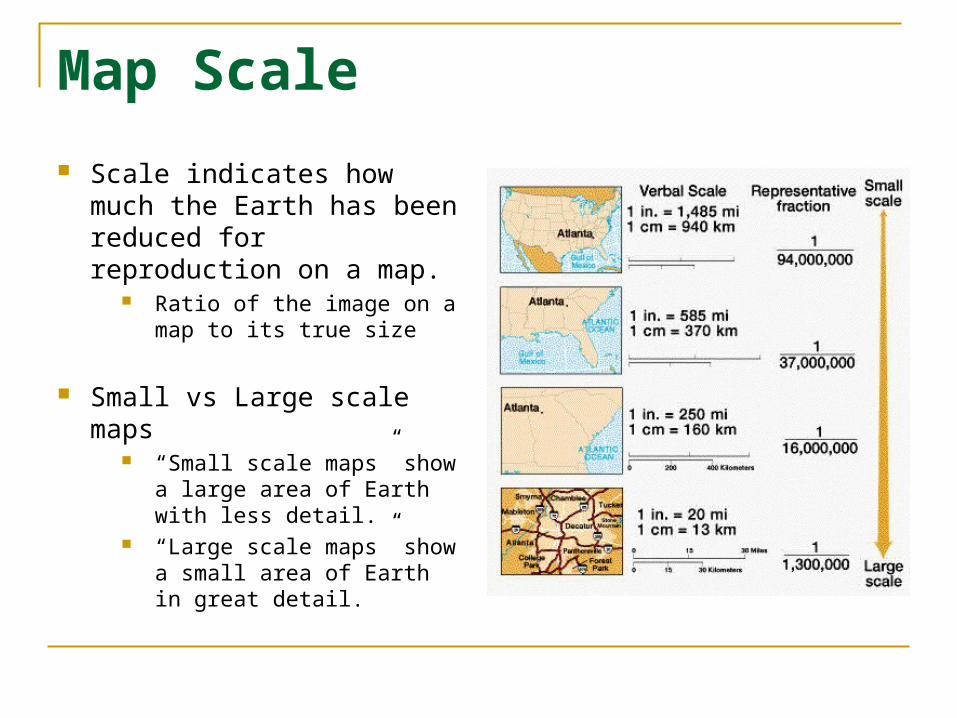
Map Scale
Scale indicates how much the Earth has been reduced for reproduction on a map.
Ratio of the image on a map to its true size
Small vs Large scale maps “Small scale maps” show a
large area of Earth with less detail.
“Large scale maps” show a small area of Earth in great detail.
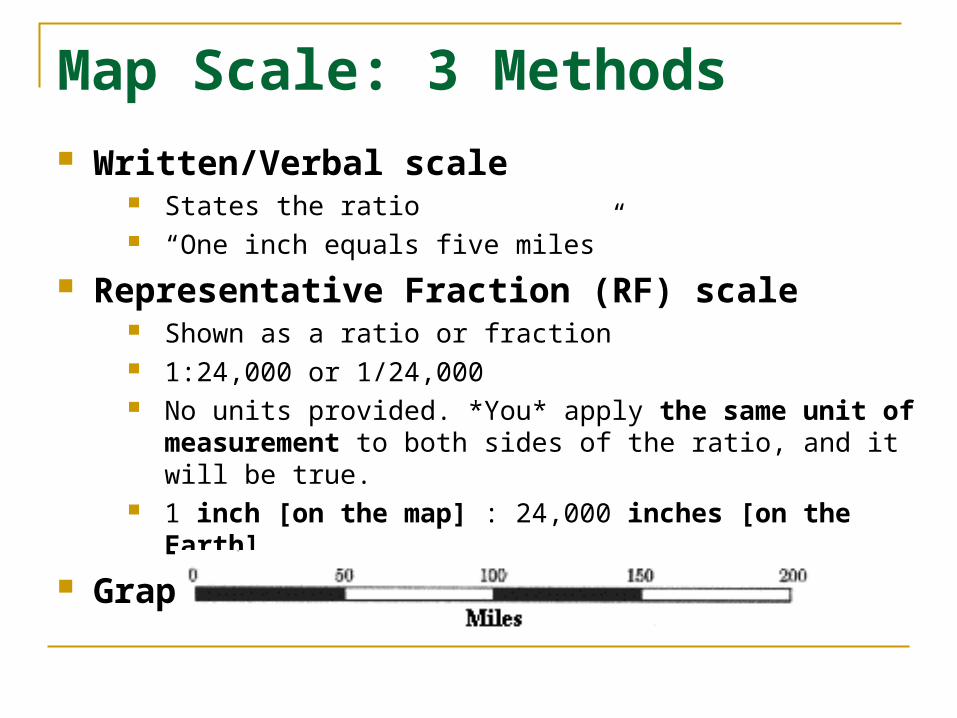
Map Scale: 3 Methods Written/Verbal scale
States the ratio “One inch equals five miles”
Representative Fraction (RF) scale Shown as a ratio or fraction 1:24,000 or 1/24,000 No units provided. *You* apply the same unit of
measurement to both sides of the ratio, and it will be true. 1 inch [on the map] : 24,000 inches [on the Earth]
Graphic scale
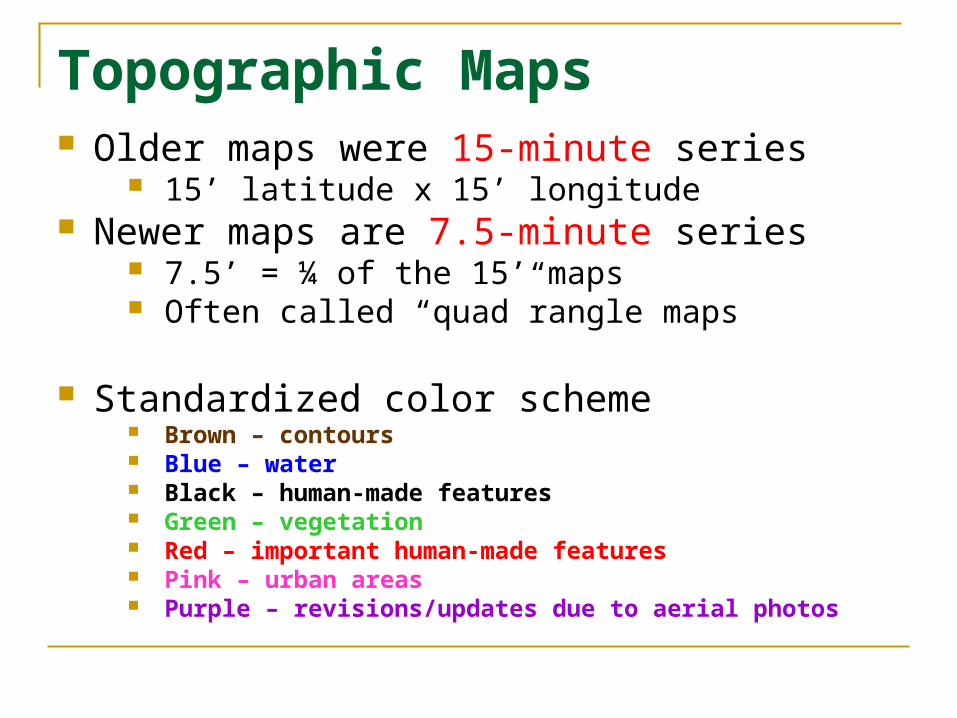
Topographic Maps Older maps were 15-minute series
15’ latitude x 15’ longitude Newer maps are 7.5-minute series
7.5’ = ¼ of the 15’ maps Often called “quad”rangle maps
Standardized color scheme Brown – contours Blue – water Black – human-made features Green – vegetation Red – important human-made features Pink – urban areas Purple – revisions/updates due to aerial photos
Topographic Maps: Contours Topographic maps show the lay of the land
using isolines called “contours” Isoline = line connecting points of equal value Contours connect points of equal elevation
A datum is a reference point from which all elevations are measured.
On topo maps, what do you think is the reference point (“zero datum”)?
Topographic Maps: Contours Rules of Contour Lines
Contours are drawn at regular intervals (e.g., every 10 feet of elevation). Called “Contour Interval.”
Contours are always closed loops, though they usually travel beyond the margins of the map.
Contours never cross each other. Where contours are close together, they show a rapid
change in elevation. Where they are far apart, they show a gradual change.
Values inside a closed contour line are higher than outside the contour line.
See other rules on page 59 of your lab manual.
Topographic Maps: ContoursCONTOUR INTERVAL Spacing between
each contour line This will be a
consistent number. Watch for the unit of
measurement associated with the contour interval.
INDEX CONTOUR Every 5th contour line Indicated by a heavier
line. Helps draw your eye
to certain intervals. Allows the mapmaker
to simplify the map – may only label index contours instead of every line.
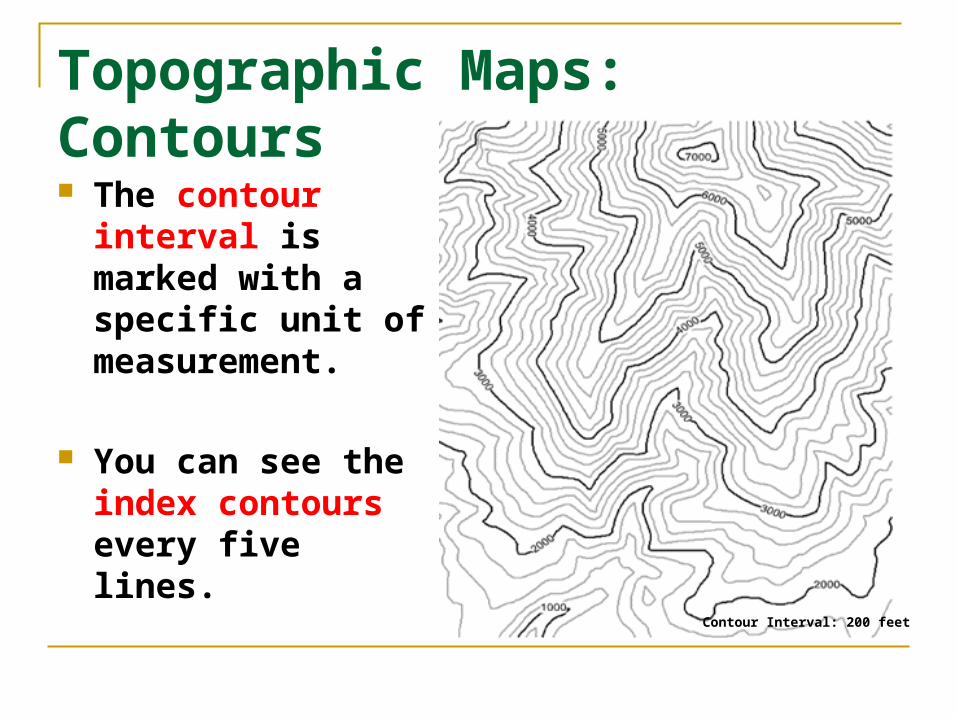
Topographic Maps: Contours The contour interval
is marked with a specific unit of measurement.
You can see the index contours every five lines.
Contour Interval: 200 feet
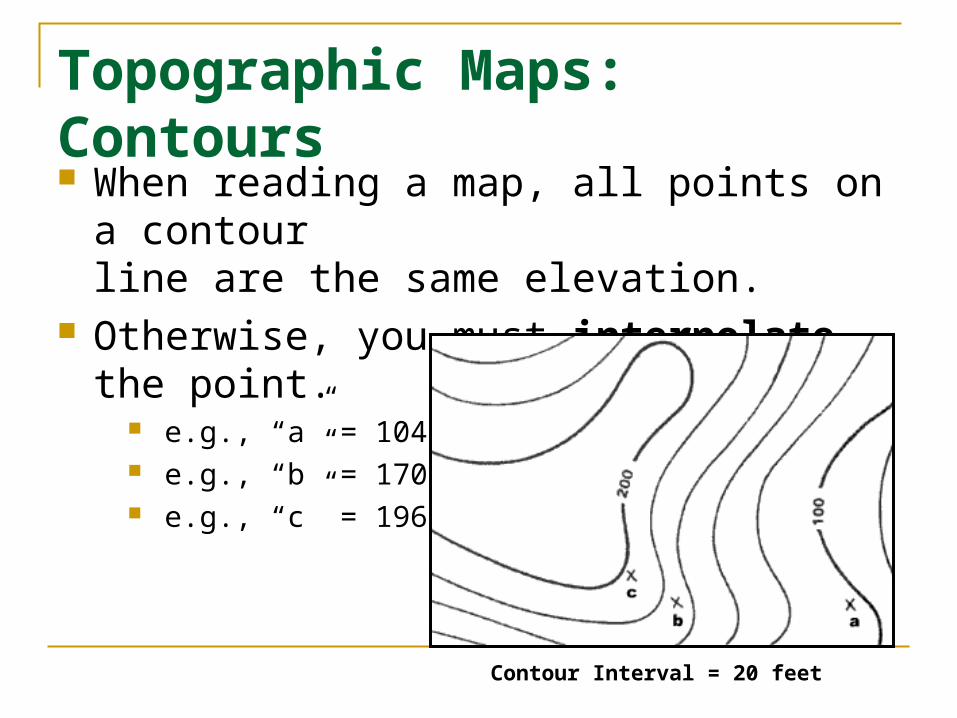
Topographic Maps: Contours When reading a map, all points on a contour
line are the same elevation. Otherwise, you must interpolate the point.
e.g., “a” = 104 ft e.g., “b” = 170 ft e.g., “c” = 196 ft
Contour Interval = 20 feet
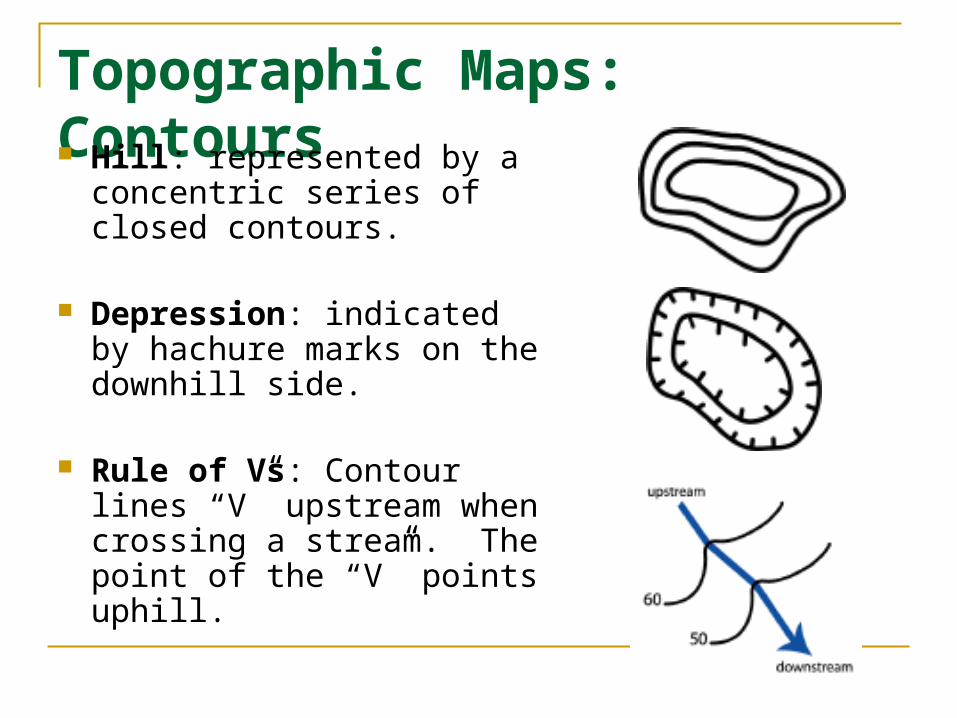
Topographic Maps: Contours Hill: represented by a
concentric series of closed contours.
Depression: indicated by hachure marks on the downhill side.
Rule of Vs: Contour lines “V” upstream when crossing a stream. The point of the “V” points uphill.
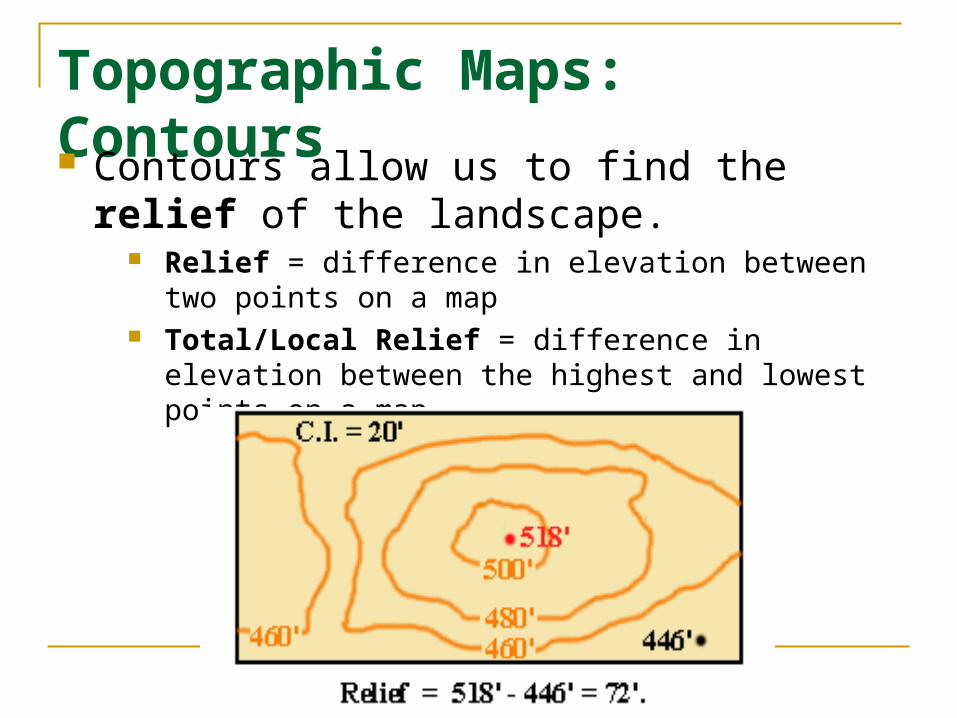
Topographic Maps: Contours Contours allow us to find the relief of the
landscape. Relief = difference in elevation between two points on a
map Total/Local Relief = difference in elevation between the
highest and lowest points on a map
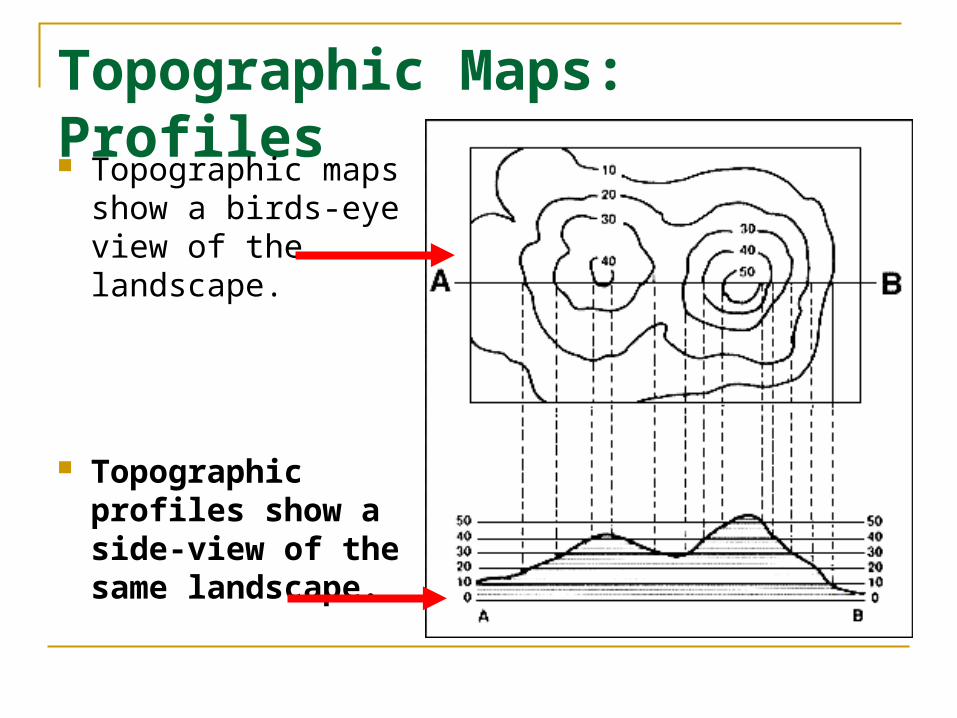
Topographic Maps: Profiles Topographic maps
show a birds-eye view of the landscape.
Topographic profiles show a side-view of the same landscape.
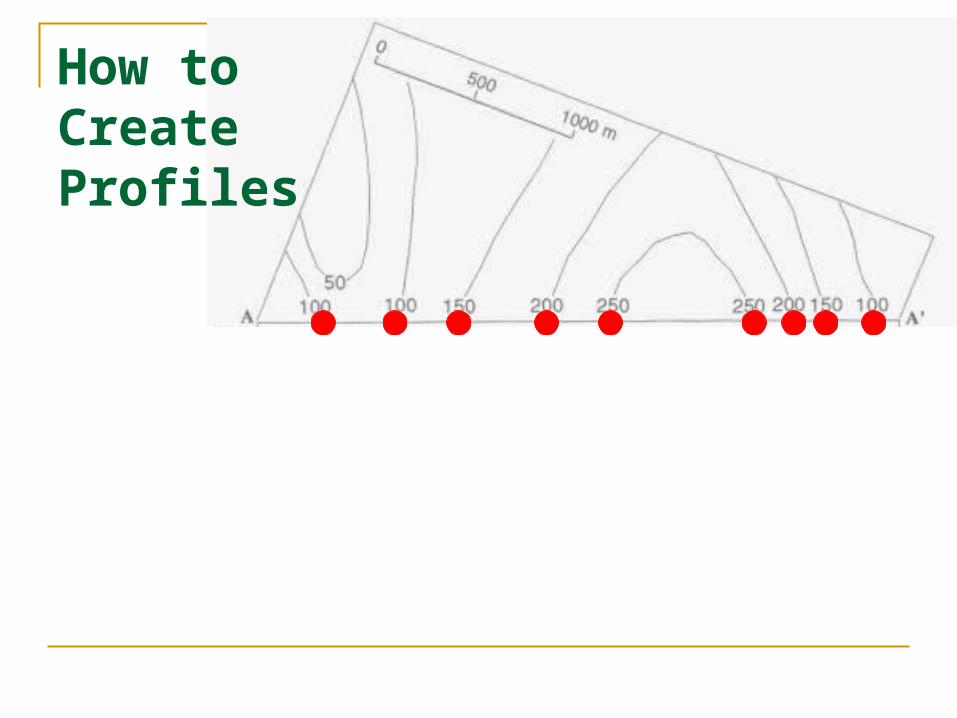
How toCreateProfiles
Ele
vatio
n (m
)
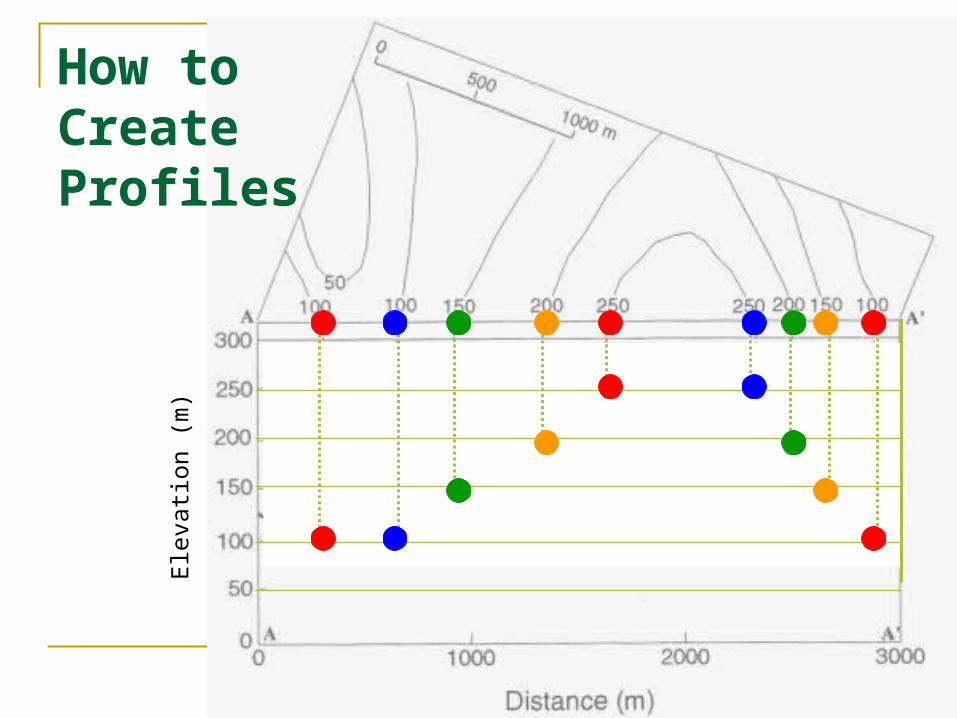
How toCreateProfiles
Ele
vatio
n (m
)
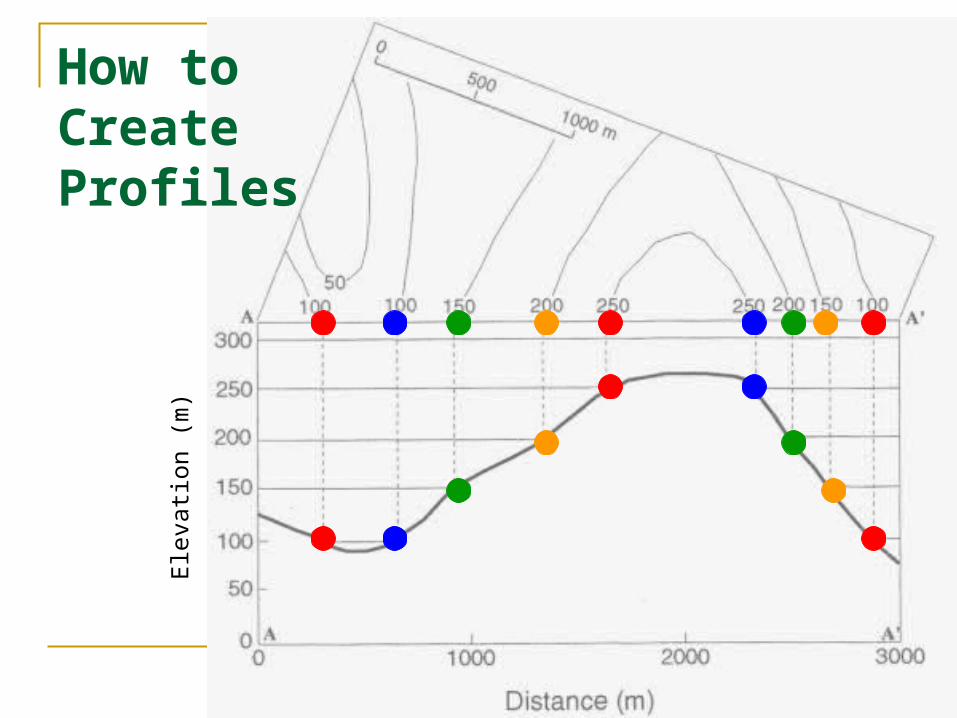
How toCreateProfiles
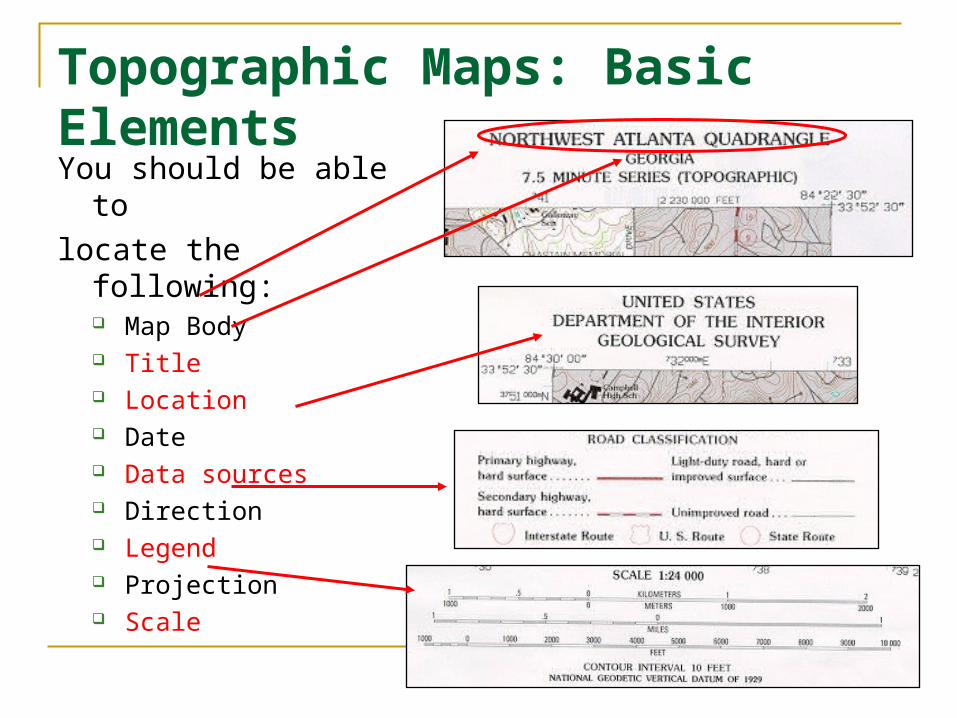
Topographic Maps: Basic ElementsYou should be able to
locate the following: Map Body Title Location Date Data sources Direction Legend Projection Scale