Embed Size (px)
Citation preview
Lab Manual
Chem 332L Experimental Analytical Chemistry
Fall 2010
TABLE OF CONTENTS
PRINCIPLES FOR SAFETY IN THE CHEMICAL LABORATORY. . . . . . . . . . . . . . . . 3
LABORATORY NOTEBOOKS.. . . . . . . . . . . . . . . . . . . . . . . . . . . . . . . . . . . . . . . . . . . 8
Experiment 1: STATISTICS.. . . . . . . . . . . . . . . . . . . . . . . . . . . . . . . . . . . . . . . . . . . . . 9
Experiment 2: AN INTRODUCTION TO COMPUTER SPREADSHEETS. . . . . . . . . . 12
Experiment 3: A SIMPLE PRECIPITATION TITRATION. . . . . . . . . . . . . . . . . . . . . . . 16
Experiment 4: DIRECT TITRATION OF TRIS WITH HCl.. . . . . . . . . . . . . . . . . . . . . . 18
AExperiment 5: SPECTROPHOTOMETRIC DETERMINATION OF THE K OF ANACID-BASE INDICATOR. . . . . . . . . . . . . . . . . . . . . . . . . . . . . . . . . . . . . . . . . 22
Experiment 6: POTENTIOMETRIC TITRATION OF AMINO ACIDS. . . . . . . . . . . . . . 24
Experiment 7: EDTA TITRATION OF Ca AND Mg IN NATURAL WATERS.. . . . .2+ 2+ 30
Experiment 8. POTENTIOMETRIC HALIDE TITRATION WITH Ag . . . . . . . . . . . . . .+ 34
Experiment 9. BACK TITRATION OF TRIS. . . . . . . . . . . . . . . . . . . . . . . . . . . . . . . . . 38
Experiment 10. REDOX TITRATION OF VITAMIN C.. . . . . . . . . . . . . . . . . . . . . . . . . 43
Experiment 11: SPECTROPHOTOMETRIC DETERMINATION OF IRON IN DIETARY TABLETS. . . . . . . . . . . . . . . . . . . . . . . . . . . . . . . . . . . . . . . . . . . . . 46
Experiment 12: SPECTROPHOTOMETRIC ANALYSIS OF A MIXTURE: CAFFEINEAND BENZOIC ACID IN A SOFT DRINK. . . . . . . . . . . . . . . . . . . . . . . . . . . . . 49
Experiment 13: MICROSCALE SPECTROPHOTOMETRIC MEASUREMENT OF IRONIN FOOD BY STANDARD ADDITION. . . . . . . . . . . . . . . . . . . . . . . . . . . . . . . . 52
Experiment 14:MULTI-COMPONENT ANALYSIS OF HOPS. . . . . . . . . . . . . . . . . . . 54
3
PRINCIPLES FOR SAFETY IN THE CHEMICAL LABORATORY
Safe practices in the chemical laboratory are of prime importance. A studentshould consider it an essential part of his or her educational experience to
develop safe and efficient methods of operation in a lab. To do this, one mustacquire a basic knowledge of properties of materials present in the lab, and oneshould realize the types of hazards that exist and the accidents and injuries that
can result from ignorance or irresponsibility on the part of the student or aneighbor.
Regulations
1. Wear safety goggles at all times while in the laboratory.
2. Report all accidents to the instructor or lab assistant immediately.
3. NEVER eat, drink, chew, or smoke in the laboratory.
4. NEVER leave an experiment unattended. Inform the lab assistant if you mustleave the lab.
5. After the experiment is completed, turn all equipment off, making sure it isproperly stored, and clean your area.
Failure to comply with these regulations is cause for immediate dismissal fromlab.
Precautions
1. Approach the laboratory with a serious awareness of personal responsibilityand consideration for others in the lab.
2. Become familiar with the location of safety equipment, such as acid-baseneutralizing agents, eye wash, fire extinguisher, emergency shower, and fire
blanket.
3. Pay strict attention to all instructions presented by the instructor. If somethingis not clear, do not hesitate to ask the instructor or lab assistant.
4. Clean up all chemical spills immediately.
4
5. Be aware of all activities occurring within a reasonable proximity of yourselfsince you are always subject to the actions of others.
6. To avoid contamination of community supplies, do not use personalequipment such as spatulas in shared chemicals and replace all lids after use.
7. Avoid unnecessary physical contact with chemicals; their toxic properties mayresult in skin irritation.
8. Use all electrical and heating equipment carefully to prevent shocks andburns.
9. NEVER handle broken glassware with your hands; use a broom and a dustpan.
10. Wash your hands at the end of the laboratory.
Personal Attire
Choice of clothing for the laboratory is mainly left to the discretion of the student.Because of the corrosive nature of chemicals, it is in your best interest to wear
comfortable, practical clothing. Long, floppy sleeves can easily come into contactwith chemicals. A lab coat is suggested to help keep clothes protected and close
to the body. Accessories also need consideration. Jewelry can be ruined bycontact with chemicals. Open toed shoes do not adequately protect one againstchemical spills. If hair is long enough to interfere with motion or observation, it
should be tied back. Remember that your clothes are worn to protect you.
Assembling Equipment
Equipment should be assembled in the most secure and convenient manner.Utility clamps are provided to fasten flasks, etc., to the metal grid work located atthe center of each bench. This keeps top-heavy or bulky equipment away from
the edge where it can be knocked easily off the bench. Consider the safe locationof the hot plate. Keep it near the grid work to minimize chances of contact withthe body. If the aspirator is being used, locate your apparatus near the sink for
convenience.
5
Handling Glassware
Laboratory glassware is usually fragile, and if it is not properly handled, seriousinjuries may result Do not force glass tubing or thermometers into a rubber
stopper. Lubricate the tubing or thermometer with glycerol or water, wrap it in atowel, and gently insert it into the stopper by using pressure in a lengthwisedirection while rotating it. Always grasp the tubing near the stopper. When
removing the tubing, remember to protect your hands with a towel. If there aredifficulties with this procedure, ask for the instructor's assistance. Apparatus thatcan roll should be placed between two immobile objects away from the edge of
the bench. Chipped or broken glassware cannot be used. There are specialreceptacles near each bench for these waste materials. After the experiment is
completed, all glassware should be emptied, rinsed, and cleaned.
Acids and Bases
In this lab sequence, you will come in contact with several acids and bases. Aswith all chemicals, caution must be taken to prevent contact with the skin. When
handling these chemicals, keep hands away from the eyes and face until theyhave been thoroughly washed. If an acid or base comes in contact with your skin,
flush the area with large quantities of clean, cold water. Eyes are extremelysensitive. Use the eye wash provided in the laboratory, or wash with water for atleast 10 minutes. Again, the instructor must be notified immediately. To insureyour safety, neutralize acid or base spills before cleaning them up. Boric acid
solution is available to neutralize base spills, and carbonate powder is provided toneutralize acids.
6
Attention:Students are advised against wearing contact lenses whileobserving or participating in science laboratory activities.
While hard contact lenses do not seem to aggravatechemical splash injuries, soft contact lenses absorb vaporsand may aggravate some chemical exposures, particularly
if worn for extended periods.
Please take your contact lenses out prior to enteringthe laboratory.
Contact Lens Administrative Policy and Waiver Form
Students are advised against wearing contact lenseswhile observing or participating in science laboratoryactivities. While hard contact lenses do not seem toaggravate chemical splash injuries, soft contact lensesabsorb vapors and may aggravate some chemicalexposures, particularly if worn for extended periods.You are asked to please remove your contact lensesprior to entering the laboratory.
If you do not wish to comply with this recommendation,you must fill out the next page, which is a waiver form.
7
Waiver of Liability, Indemnification and Medical Release
I am aware of the dangers involved in wearing contact lensesin a science laboratory setting. On behalf of myself, my
executors, administrators, heirs, next of kin, successors, andassigns, I hereby:
a. waive, release and discharge from any and all liability formy personal injury, property damage, or actions of any kind,which may hereafter, accrue to me and my estate, the State ofSouth Dakota, and its officers, agents and employees; and
b. indemnify and hold harmless the State of South Dakota,and its officers, agents and employees from and against anyand all liabilities and claims made by other individuals orentities as a result of any of my actions during this laboratory.
I hereby consent to receive any medical treatment, which maybe deemed advisable in the event of injury during thislaboratory.
This release and waiver shall be construed broadly to providea release and waiver to the maximum extent permissibleunder applicable law.
I, the undersigned participant, acknowledge that I have readand understand the above Release.
Name _________________________ Age ______________
Signature ______________________ Date ______________
Is there any health information you would like us to know ifthere is an accident?
8
LABORATORY NOTEBOOKS
You are required to use a bound notebook in Chem 332L lab to record all primarydata and observations. You should prepare your notebook each week beforecoming to lab by writing the title of the experiment on a new numbered page,summarizing relevant equations from the lab manual, and starting calculationsinvolving molar masses, etc. Take note of theoretical ideas and specialinstructions given by your instructor at the start of each experiment. Yournotebook should be a complete record of your work in lab. You or other chemistsshould be able to understand the notes in the future, not just during the currentexperiment Good note taking in lab is a valuable skill that you can learn with alittle effort and practice.
Guidelines to be Followed:
1. Always bring your notebook with you to lab. You will be graded on thecompleteness of your previous note taking and your preparation for the currentexperiment. You may use your notebook during a lab quiz.
2. Number the pages sequentially and reserve space at the beginning for a tableof contents.
3. Take your notebook to the balance room, etc. and record values directly in it -not on loose scraps of paper.
4. Specify each measured quantity by name and include the units.
5. If you make a mistake in your notebook, simply draw a solid line through theerror and write the correction nearby.
6. Tables greatly simplify data entry; they should be set up before coming to lab.
7. Write down all observations such as color and phase changes - don't rely onyour memory.
8. Save time by doing trial calculations in your notebook before filling out anyreport sheets.
9. Save time by making preliminary sketches of graphs on the ruled lines in yournotebook.
9
Experiment 1: STATISTICS
Reading AssignmentAll of Chapters 3&4. This lab will introduce the student to some of the basic
statistics that will be used in the lab.
MaterialsEach student will be given a package of M&M's (plain). Each student is to count
the number of each color and determine the fraction (# color / # total) of each color forhis or her pack of M&M's before they are eaten.
After you have entered these calculations in your notebook, a sheet will be passedaround for you to enter your data into so we can tabulate the results for the entire lab. The sheet will look like this:
Desk # Brown Blue Red Orange Yellow Green 1 .55 .10 .50 .12 0.00 .18 2 3 4 . . .
When the sheet is complete we will write down the lab's results on the board for you tocopy into your notebook.
The student takes their numbers, and those of the next 3 higher groups as 4experimental determinations of fraction color. (Students with the highest group willcycle to groups 1 and 2)
For this lab I want you to do all of the following eight statistical calculations. About fiveminutes after you have started these calculations you will notice that there are manyrepetitive and tedious calculations here. It will reduce both the tedium and your chanceof error if you get the manual of your calculator out and figure out how to make thecalculator do the calculations instead of cranking them out by hand (You can alsouse computer spreadsheet calculations). But don't depend entirely on the calculator. Show an example equation for each calculation, and show how one set of data isused in this equation.
NOTE - Because this lab is not well suited to being written up in your labnotebook, no notebook entries are required for this portion of the lab.
10
Questions an calculations to be completed for lab write-up (50 points)
1. Determine the mean, standard deviation, and relative standard deviation (Coefficientof Variation) for each color fraction based on your four measurements.
2. Looking at your data (4 measurements) do you have any you think should berejected? If so, does the Q test allow it to be rejected? (Even if you don't think youneed to, try the Q-test on at least two sets of data.)
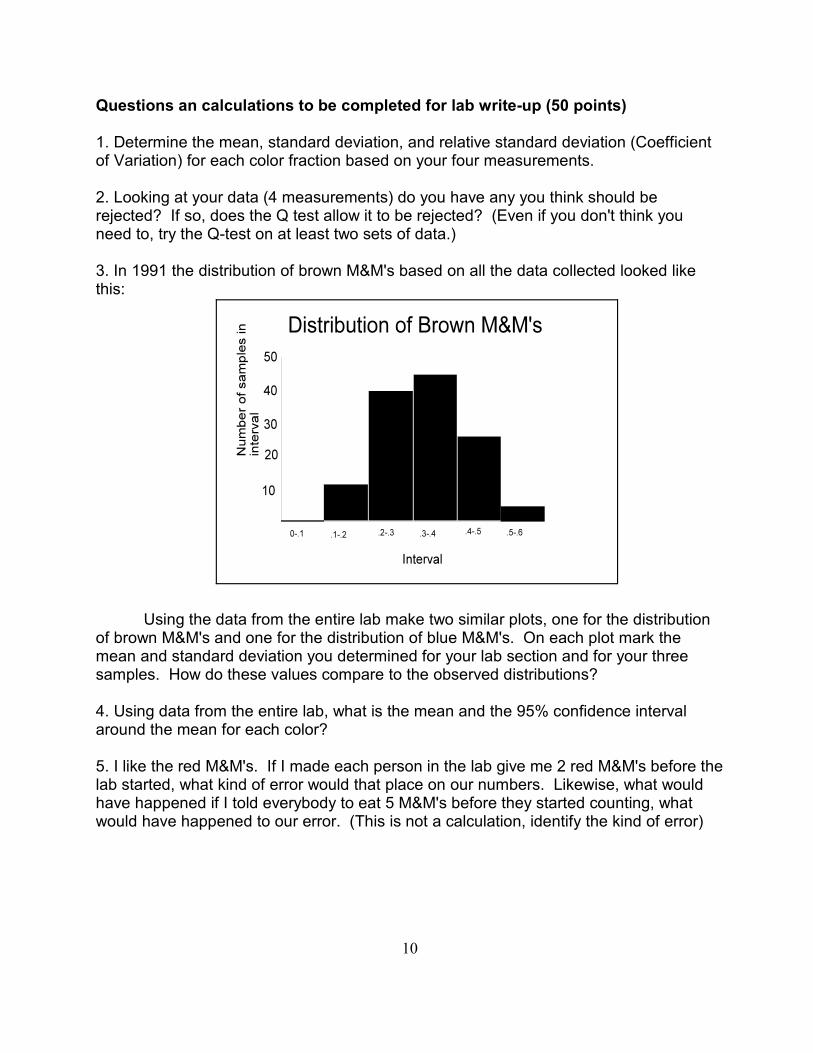
3. In 1991 the distribution of brown M&M's based on all the data collected looked likethis:
Using the data from the entire lab make two similar plots, one for the distributionof brown M&M's and one for the distribution of blue M&M's. On each plot mark themean and standard deviation you determined for your lab section and for your threesamples. How do these values compare to the observed distributions?
4. Using data from the entire lab, what is the mean and the 95% confidence intervalaround the mean for each color?
5. I like the red M&M's. If I made each person in the lab give me 2 red M&M's before thelab started, what kind of error would that place on our numbers. Likewise, what wouldhave happened if I told everybody to eat 5 M&M's before they started counting, whatwould have happened to our error. (This is not a calculation, identify the kind of error)
11
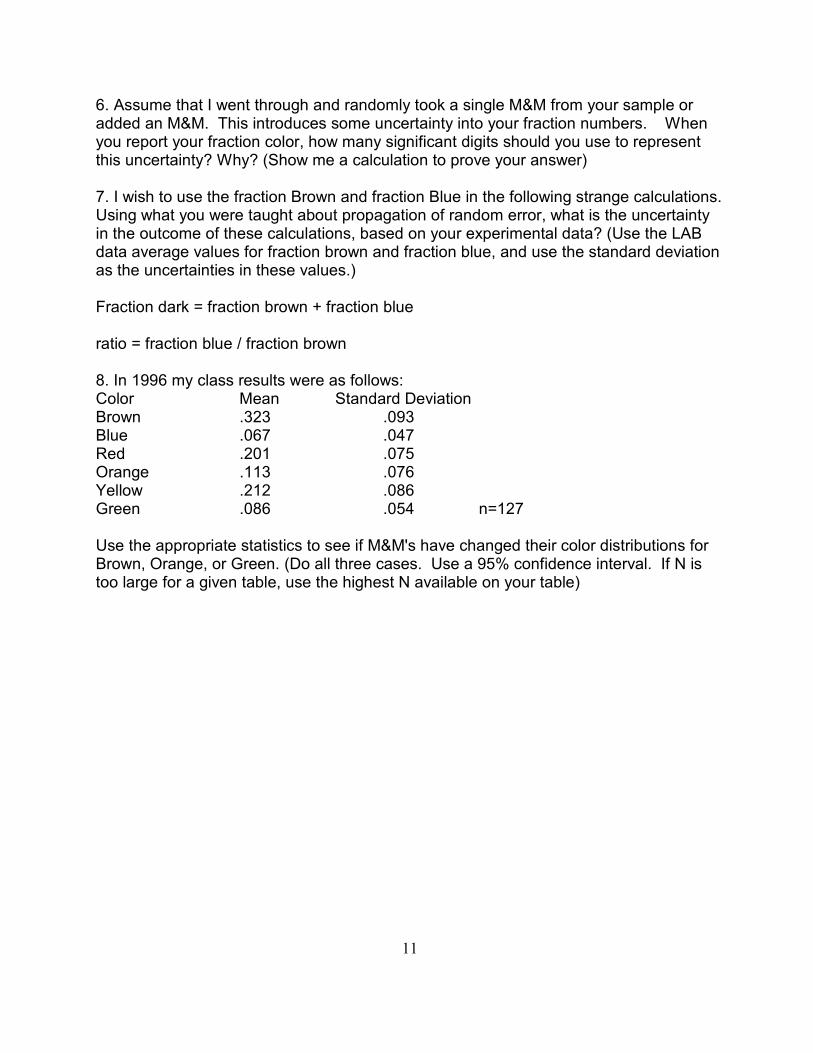
6. Assume that I went through and randomly took a single M&M from your sample oradded an M&M. This introduces some uncertainty into your fraction numbers. Whenyou report your fraction color, how many significant digits should you use to representthis uncertainty? Why? (Show me a calculation to prove your answer)
7. I wish to use the fraction Brown and fraction Blue in the following strange calculations. Using what you were taught about propagation of random error, what is the uncertaintyin the outcome of these calculations, based on your experimental data? (Use the LABdata average values for fraction brown and fraction blue, and use the standard deviationas the uncertainties in these values.)
Fraction dark = fraction brown + fraction blue
ratio = fraction blue / fraction brown
8. In 1996 my class results were as follows:Color Mean Standard DeviationBrown .323 .093Blue .067 .047Red .201 .075Orange .113 .076Yellow .212 .086Green .086 .054 n=127
Use the appropriate statistics to see if M&M's have changed their color distributions forBrown, Orange, or Green. (Do all three cases. Use a 95% confidence interval. If N istoo large for a given table, use the highest N available on your table)
12
Experiment 2: AN INTRODUCTION TO COMPUTERSPREADSHEETS
Reading Assignment Section 3-5,3-6,4-6 of your text To analyze a set of X & Y data, you need to fit a set of points to a straight line.
Many of you have calculators that will do this, but not all of these ‘canned’ calculatorprograms will give you all the statistics I require. If you do the statistics the long waythey show in the book, there are lots of places for calculation errors or round off errors.
There are computer programs called Spreadsheets that also do these kinds ofcalculations. Besides doing just statistics they can be extremely flexible and can do awide variety of mathematical tasks. In this lab you will get introduced to the Microsoftspreadsheet, Excel. I hope you learn to use it, because once you have, you can use itfor every other calculations in this class, as well as lots of exercises in the text, and lotsof problems outside of class.If you have a PC of your own and you are familiar with a different spread sheet, goahead and use the tool you already know.
Starting the spreadsheet Go to that upper bar on the windows screen and click on the x symbol. You now
get a window that looks something like the Word window; a lot of buttons that do variousmysterious functions across the top, and a large working area. This time the workingarea is divided into rectangles called cells. The way a spread sheet works is that youput data into some of the cells, and formulas into other cells, and the computer doescalculations based on the data and the formulas you have given it.
Each cell has a unique position. A number on the left hand side determines itsrow position and a letter along the top edge determines its column position. Also alongthe bottom there are pages for additional sheets as well.
For the first part of this exercise we will determine the average and standarddeviation of a set of 10 numbers. Click the mouse on cell A1 then type 95. You will see95 entered into a work area along the top edge of the sheet as well as in the cell itself. Now fill in 92, 88, 100, 78, 90, 93, 95, 89, 92 into positions 2 through 10 of the A column. The easiest way to this is to simply hit the down arrow on your key pad after each entryso you don’t have to grab the mouse each time. Now go back through the list and check.Any mistakes? If so, simply click the mouse on the mistake and type it in again.
13
Now for the fun. Let’s calculate the mean and place it in cell A11.Click on cell A11 and type: =average(a1:a10)then hit the return button. The average now appears at that position! Just for grins goback and misspell average ‘avrage’ What happens? You get a cell that looks like#name? This means that the computer doesn’t understand what you typed. So the nexttime you get this error, take a look at what you typed. Also note that the programunderstands average but not mean. Now let’s go to cell a12 and try for the standarddeviation. Type =stdev (a1:a10)
Wasn’t that faster than doing it on your calculator? If you want to see what other
xstatistical function are available on Excel hit the f button. This button is the key to lots
xof different mathematical tools in lots of different fields. After you hit the f button you geta menu, click on statistics and on the left hand side, and on the right side will bedisplayed all the statistical function available. Many more than we have covered inclass! Pick out a function you like, click on it, then click on help. The computer now
xtells you how that function works, its formula, and how to use it. You can also use the fbutton to call the function wizard that can help you set up calculations with that function. IF you want to use the function wizard press the next button. You can play with that foryourself, but I won’t go into that here, so for now, hit cancel.
Now that you have a feel for a spreadsheet, let’s try something a little morecomplicated. First, clear the present worksheet by clicking on file..close..no. Did yousee the ‘close’ command under the file menu? If not, that is because Word likes to hidemenu pieces it doesn’t think you need. To get ALL the commands under a window clickon the double arrows pointing down at the bottom of the window. Do you see the closecommand now??
To start a new window click file .. New. Go to section 3-6 of your text and do thefirst exercise dealing with plotting a function. Try to reproduce figure 3-4 from your text.
Now how do you plot the data to get a figure like 3-5 from your text?
1. Click on cell b4 and hold the mouse button down. Move the mouse to cell c11and release, both columns should be outlined in dark.
2. Click on the little button that looks like a bar graph on your icon bar. This is the‘graph wizard’. In 4 steps it will make a graph for you.
Step 1 is setting up the type of graph you want-Find Scatter plot in the left hand column and click to chose this plot. Whenever you have paired X-Y data you must always use the scatter plot.- Now on the right column select the kind o plot you want, points, lines,
curves, etc.- Now hit the Next button on the bottom of the window
Step 2 defines the data set up. You should be OK here. You only need thswindow if your X and Y is reversed or your data is in some other formatthat the computer need to have explained-Hit the Next button
Step 3 defines char optionseach tab lets you set different options like labels, axes, appearance of the
14
plot. Try different things, flip from one tab to the next until you have justwhat you want, then-Hit the Next button
Step 4 defines where you want the plot put. I am happy to have it put right on thedata shet I am working with so simply-Hit the Next button
Your plot should appear on the speadsheet. Use the mouse to move the plotwhere you want it, and use the mouse to grab the corners and edges of the plot to makeit jsut the size you want. You can also try double clicking on the plot or parts of the plotto see what things you can go and change
Now click on the littler printer and make a copy of this page for your labreport.
(The fifth button from the left)
Now try to make a spreadsheet like that shown in section 4-6 to do a Leastsquares fit of X-Y data. First try to make this spreadsheet using the data given in thetext example, so you can see if the computer is actually do the calculations it issupposed to.
Note: the only numbers you should be entering are a2:c5. For the rest of the numbersyou should be entering the formula and letting the computer calculate for you. Also besure you include the documentation cells that help explain the calculations. Also be sureyou go back to the text and see if you can figure out which equation from the text eachcalculation corresponds to.
One thing I want you to notice is the definition of A12 given in cell d11. Do yousee the expression “D= $A$10*E9-B9*B9"? What do you think the $ means? To explainthis, let’s go back to the calculation you used for column D. How did you get the xy termon column D. In cell D2 you should have used the expression “=B2*C2". Then, as youused the fill command for cells c3,c4,c5,etc, the computer automatically changed theexpression to use A3&B3, A4&B4, A5&B5, etc.
In column F2 you want to use two numbers (the slope and intercept of the line)that are constant. Since you don’t want the computer to automatically change thesenumbers with each answer cell, you use the $ to tell the computer to keep this valueconstant.
Final NoteIn science never, NEVER, NEVER calculate a line of best fit and derive values
from it without actually looking at your data. Use Excel to make a plot of absorbance vsconcentration for your actual data and see how it looks. Any wild values? Next plot yourline of best fit on the same plot. How close is the line of best fit to the actual data. Also,check by eye the value you have derived for the concentration of your unknown. Does itlook reasonable?
15
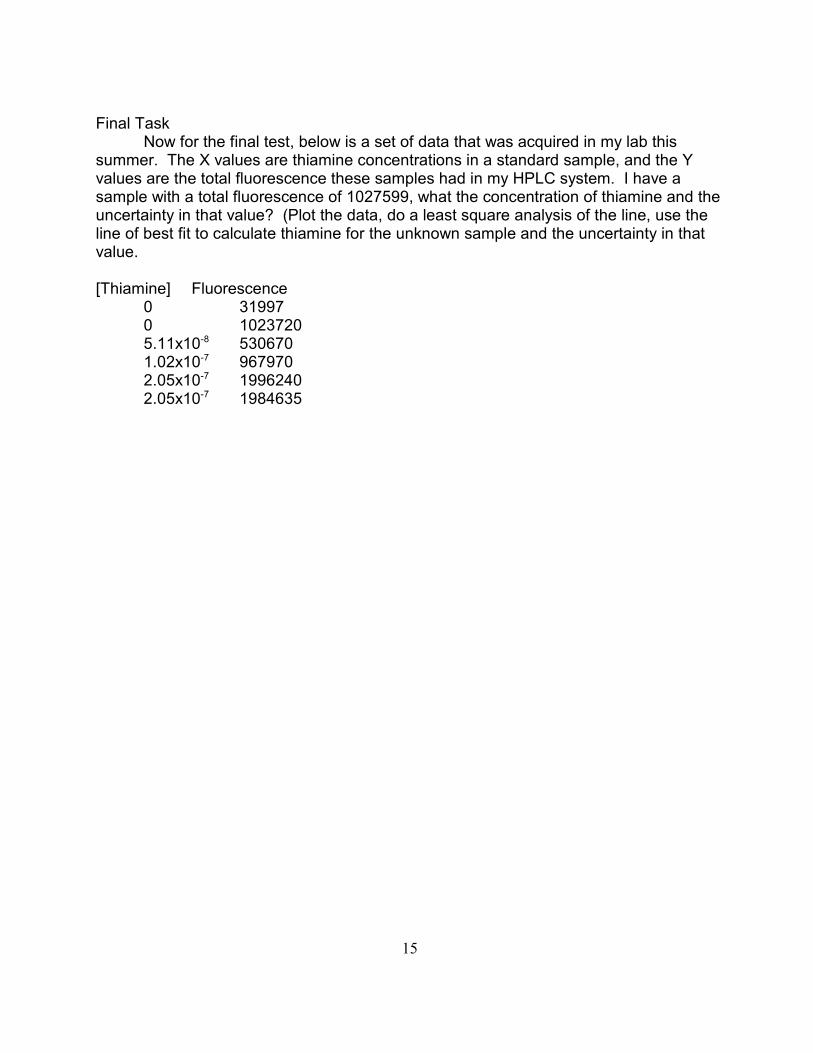
Final TaskNow for the final test, below is a set of data that was acquired in my lab this
summer. The X values are thiamine concentrations in a standard sample, and the Yvalues are the total fluorescence these samples had in my HPLC system. I have asample with a total fluorescence of 1027599, what the concentration of thiamine and theuncertainty in that value? (Plot the data, do a least square analysis of the line, use theline of best fit to calculate thiamine for the unknown sample and the uncertainty in thatvalue.
[Thiamine] Fluorescence0 319970 10237205.11x10 530670-8
1.02x10 967970-7
2.05x10 1996240-7
2.05x10 1984635-7
16
Experiment 3: A SIMPLE PRECIPITATION TITRATION
Read section 6-6 from your text (pages 123-125) this lab is based on the demonstrationof the Fajans method that is given as Demonstration 6-1 on page 124
3I. Preparation of ~0.05M AgNO Standard
3Dry about 5.0 g of AgNO (FM 169.87) at 105 C for one hour *(get this in the oven first,o
and then work on the other solutions). Cool in a desiccator for 30 minutes with minimum
3exposure to light. Accurately weigh about 4.2 g of the AgNO and place in a 500 mlvolumetric flask. Add water to bring to the line and mix throughly.* Don’t leave for more than an hour, it will decompose. Even after only one hour may beslightly discolored but titration will not be affected
II. Preparation of Unknown
3 I will give you an unknown sample containing about 0.5 g NaCl and a spike of NaNO soyou cannot simply weigh the unknown to determine the Cl . content. Place this sample in-
a 250 ml volumetric flask. Rinse your weighing boat several times with deionized waterto make sure the entire sample has been transferred to the flask, then fill to the markand mix throughly.
III. Preparation of Indicator (if not provided)Weigh out about .2g of dichlorofluorescein and place in a 100 ml beaker. Add 75 ml ofethanol and 25 ml of water. Once this has dissolved transfer to a small bottle with aneyedropper cap.
IV. Titration
3Rinse your buret once with the AgNO solution, then fill and record your initial volume. Use a volumetric pipet to remove a 50 aliquot of your unknown and place this aliquot ina 250 ml beaker with a stirring bar. Add about 50 ml of deionized water, 0.2g of dextrin,and 5 drops of indicator. Place this beaker on a magnetic stirrer under your buret so youcan add titrant and stir the solution at the same time. Titrate to the endpoint.* For thefirst run you can be fairly sloppy and add large amounts of titrant (1-3 ml shots) to findout approximately where the endpoint is. Do three more runs as accurately as possible,trying to hit the endpoint to within a drop or two (.05 ml)* Do not do titration in direct sunlight, light will make the complex decompose.
17
V. Calculations (Show an example for each calculation)
Part A: Experimental results1. What is your unknown number?
32. (5 points) What was the molarity of your AgNO standard solution?
3. (5 points) For each of your good titration runs, calculate the molarity of NaCl in yourunknown solution. (Show one example calculation, then show final molarity for all runs)
4. (5 points) Calculate the amount of NaCl (in grams) of your unknown using each of thedifferent concentrations listed in question 3 above.
5. (5 points) Based on values listed in question 4, calculate your average grams of NaCl,the standard deviation of your amounts of NaCl, and the relative standard deviation foryour set of NaCl data
Part B: Error analysis
36. (10 points) Considering the experimental error in weight of AgNO and theexperimental error in volume of the volumetric flask, what is the uncertainty in the above
3molarity of AgNO (Question 2)?
37. (10 points) Considering the experimental uncertainty in the molarity of AgNO(Question 6), and the experimental uncertainty in the volume of the unknown, and theuncertainty in the volume of the titrant, what is the relative uncertainty in the molarity ofthe NaCl (Question 3)? For this error analysis chose any single run.
8. (10 points) Based on the uncertainty in the molarity of NaCl (Question 7) and the uncertainty in the volume of the volumetric flask you made the solution in, what is theuncertainty in your final g amount of NaCl in your unknown (Question 4)?
9. How does your experimental uncertainty (relative standard deviation - Question 5)compare to your theoretical uncertainty (answer question 8) Is your experimentaltechnique good, or could it be improved? If so, how?
10. Other - To be determined by instructor. 40 points - How close you are to actual value of NaCl.10 points - How large is your experiment relative error.
18
Experiment 4: DIRECT TITRATION OF TRIS WITH HCl
Preparation of Standard HClPrepare and standardize 0.1M HCl using the procedure given your text on pages 215and 216. Use 6 drops of indicator instead of 3 drops listed in procedure. Also, since thecolor is hard to see, do the blank titration first so you can see the endpoint color you aretrying to achieve at the end of the titration.
Preparation of Unknown Tris Base
2 2 3Obtain a sample of Tris (Tris [hydroxymethyl]aminomethane, NH C(CH OH) ,MW121.14). This sample will be about 2 grams. Transfer this unknown to a 250mlvolumetric, fill to the mark with water and mix throughly.
Determination of Unknown Use your 50 ml volumetric pipet to transfer an aliquot of your unknown base to a 250 mlErlenmeyer flask. Add 6 drops of Bromocreosol green indicator and again titrate withthe standard HCl until you see a green color. Again you should do a blank titration first
2 3 2and have this flask available to compare with your endpoint color. Since H CO or CO is
2not a product in this reaction, you do not have to boil the solution to expel CO like you
2did in the previous reaction. The TRIS solution will, however, pick up CO from the air ifit stands overnight, so do not make up your TRIS solution unless you can titrate it thesame day.
Notes on indicatorBromocreosol green is blue in the basic form and yellow in the acid form. It is onlygreen at ~pH 4.5. In this titration it will start off as a pale blue. You are trying to get it tothe green intermediate form. If you overshoot the endpoint you will get the indicator to ayellow form which is so pale it is hard to see. Bottom line: Titrate blue to green- OK,Titrate blue to clear - Overshot!
19
Name:___________________
Report Sheet Direct titration of Tris Base
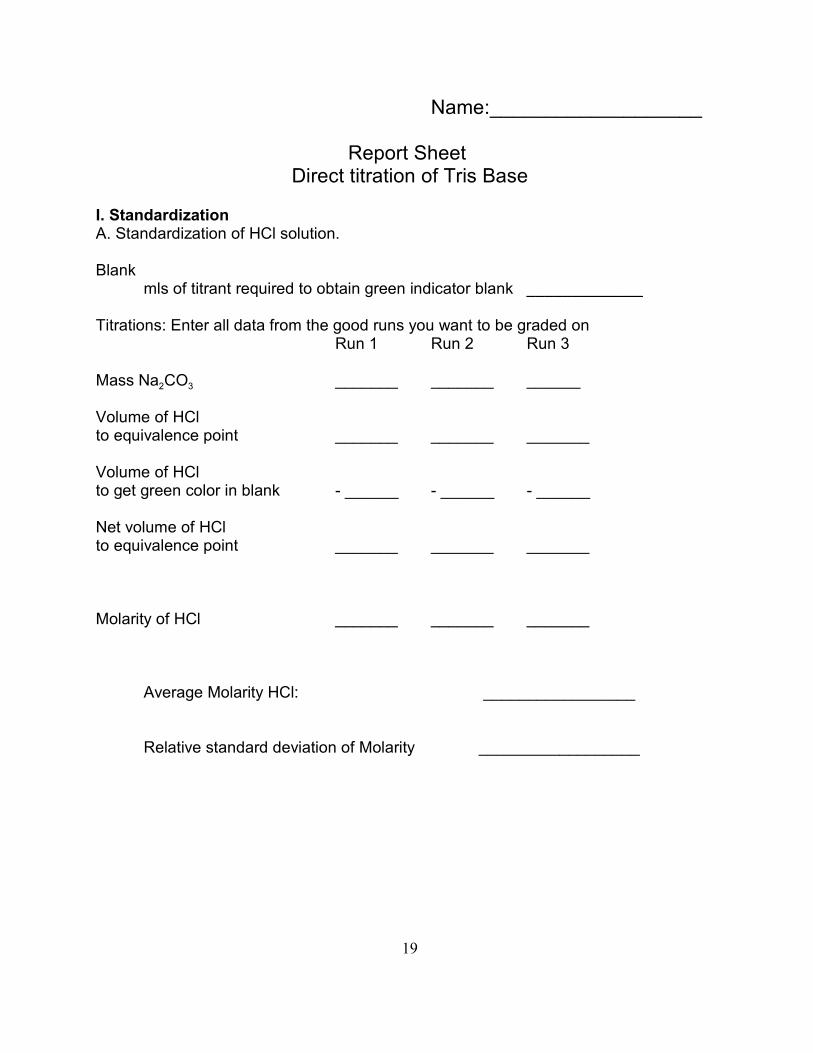
I. StandardizationA. Standardization of HCl solution.
Blankmls of titrant required to obtain green indicator blank _____________
Titrations: Enter all data from the good runs you want to be graded onRun 1 Run 2 Run 3
2 3Mass Na CO _______ _______ ______
Volume of HCl to equivalence point _______ _______ _______
Volume of HClto get green color in blank - ______ - ______ - ______
Net volume of HClto equivalence point _______ _______ _______
Molarity of HCl _______ _______ _______
Average Molarity HCl: _________________
Relative standard deviation of Molarity __________________
20
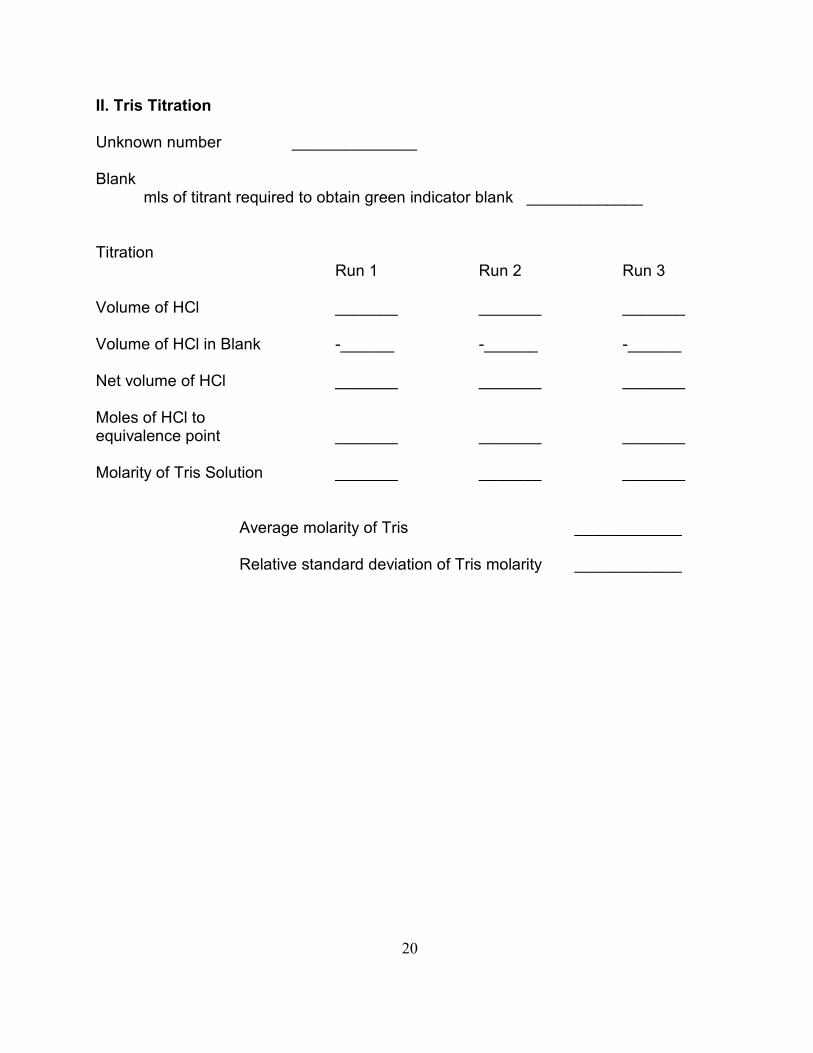
II. Tris Titration
Unknown number ______________
Blankmls of titrant required to obtain green indicator blank _____________
TitrationRun 1 Run 2 Run 3
Volume of HCl _______ _______ _______
Volume of HCl in Blank -______ -______ -______
Net volume of HCl _______ _______ _______
Moles of HCl to equivalence point _______ _______ _______
Molarity of Tris Solution _______ _______ _______
Average molarity of Tris ____________
Relative standard deviation of Tris molarity ____________
21
Questions (Show all calculations)
Results1. Using the data in part I and part II calculate the grams of Tris in your sample.
Error Analysis - Experimental2. Using the relative standard deviations reported for your titrations in section I and II,calculate the experimental uncertainty in your answer for 1.
Error Analysis - Theoretical3. Considering the uncertainties in all weight and volume measurements, what is theexpected uncertainty for your HCl molarity in I? (Use the weights and volumes from asingle run for this calculation.)
4. Considering the uncertainties in all weight and volumes measurements, what is theexpected uncertainty for your Tris molarity in II? (Use the weights and volumes from asingle run for this calculation.)
5. Considering the uncertainties in all weight and volume measurements, what is theexpected uncertainty for your grams of Tris in question 1?
6. How does your experimental uncertainty in grams of Tris (Question 2) compare toyour theoretical uncertainty (Question 5)?
Points40 for how close your gram of Tris is to actual value.6 for relative standard deviation of HCl titrations.6 for relative standard deviation of Tris titrations.8 points for each question, 1-6
22
Experiment 5: SPECTROPHOTOMETRIC DETERMINATION OF THE
AK OF AN ACID-BASE INDICATOR
PurposeTo determine the acid equilibrium constant for an indicator, Bromocreosol Green,
using photometric methods.
BackgroundSpectrophotometry is a method of analysis which uses optical properties of
substances. For the chemist, the main interest in spectrophotometry is the ability ofchemical species to absorb light energy.
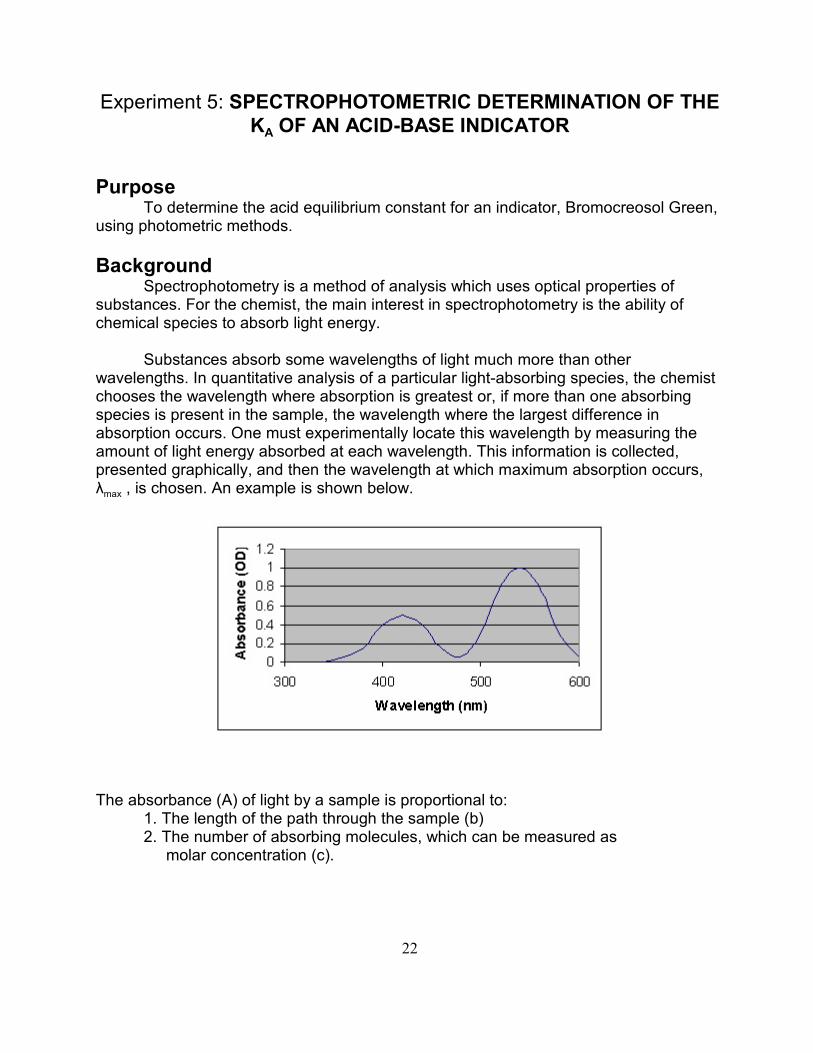
Substances absorb some wavelengths of light much more than otherwavelengths. In quantitative analysis of a particular light-absorbing species, the chemistchooses the wavelength where absorption is greatest or, if more than one absorbingspecies is present in the sample, the wavelength where the largest difference inabsorption occurs. One must experimentally locate this wavelength by measuring theamount of light energy absorbed at each wavelength. This information is collected,presented graphically, and then the wavelength at which maximum absorption occurs,
maxë , is chosen. An example is shown below.
The absorbance (A) of light by a sample is proportional to:1. The length of the path through the sample (b)2. The number of absorbing molecules, which can be measured as molar concentration (c).
23
That is, A %bc. A is measured using a spectrophotometer and is the log of the ratio of
olight intensity entering the sample (I ) to that of the light leaving the sample (I).
The proportionality constant is called the molar absorptivity coefficient, å, if b ismeasured in cm and c in moles/liter.
This is known as the Beer-Lambert Law. If we measure A at a constant wavelength (ëconstant) for a constant path length (b) at two different concentrations of the samespecies,
1 1 1 2 2 2A =å bc and A = å bc
then
1 2 1 1 2 2A / A = å c /å c
1 2If one concentration is known, the other can be calculated after measuring A and A .
In this experiment we use spectrophotometry in the visible region of the spectrum.We will use the spectrophotometer to determine the absorbances of an acid-baseindicator at several different pH values. From data obtained we should be able todetermine the equilibrium constant for the indicator.
24
Acid-base indicators are generally organic compounds that function as weak acids. IfHIn designates the weak acid form of the indicator, then
2 3HIn + H O W H O + In+ -
The only difference between an indicator and a weak acid is that the acid form(HIn) is one color while the base form (In ) is a different color. Hence the color of a-
solution containing an indicator will depend upon the relative concentrations of In-andHin, i.e. upon the ratio [In-]/[HIn]. Note that the total concentration of indicator is equal to [HIn] + [In ]. In a-
solution where the hydronium ion concentration is high, the equilibrium will lie to the left, ([In-]/[HIn] « 1), and the solution will be the color of the acid form of the Indicator. In asolution where the hydronium ion concentration is low, the equilibrium will lie to the right, ([In-J/[HIn] » 1), and the solution will be the color of the base form of the Indicator.Since both the acid and base forms of the Indicator absorb light in the visible region ofthe spectrum, we can use the spectrophotometer to determine the [In-]/[HIn] ratio at agiven pH. This information enables us to calculate Ka for the indicator.
Experimental Procedure
A. Preparation of solutions
Each group should obtain 150 mL of Bromocreosol Green Indicator solution,20 mL of this solution should be placed in each of seven 100 mL volumetric flasks. Label these flasks 1 thru 7.
In flask 1 place 50 mL of 0.02 M HClIn flask 7 place 50 mL of 0.002 M NaOH
Add 1.0 M acetic acid and 1.0M sodium acetate to flasks 2 thru 6 according to thefollowing table
Flask mL of Acetic Acid mL of Sodium acetate2 46 43 38 124 25 255 12 386 4 46
Fill each flask to the mark with deionized water and mix well.
B. SpectrophotometryUsing a 1 cm cell and a water blank in the Lambda2 spectrophotometer, determine the
maxabsorbance spectrum of all solutions from 400-700 nm. Plot this data and determine ë(wavelength with the greatest absorbance).
25
Analysis of data
1. Flasks 1 and 7 represent extremes of pH. What is the color of these two flasks?What it the pH of these two flasks?What is the form of the indicatior (HIn or In ) in these two flasks?-
Plot the absorbance spectrum of Bromocresol Green in the HIn form.Plot the absorbance spectrum of Bromocresol Green in the In form.-
At what wavelength the is the absorbance maxima for HIn? for In forms of-
Bromocresol Green?
2. Flasks 2-6 represent intermediate pH values.(Show sample calculations, then place all this data in a single table)What is the concentration of acetic acid and sodium acetate in each flask? What is the pH in each flask?What is the absorbance of each solution at the wavelength that is the maximum
for HIn?What is the absorbance of each solution at the wavelength that is the maximum
for In ?-
3. Plot absorbance vs pH for your two wavelength maxima.(See diagram on board) From this plot determine the ratio of Hin:In for solutions 1-7. You can also use the-
equation:
4. Now plot log( [In ]/[HIn]) vs pH. What does this tell you? Well let’s go back to the-
Henderson- Haselbach equation, and use HIn for HA and In for A- -
apH = pK +log [In ]/[Hin]-
alog [In ]/[HIn] = pH - pK-
Think of this as Y = mX + b with log [In ]/[HIn]=Y and pH=X The slope should be-
a a1, and the Y intercept is -pK ! (Actually the X intercept is + pK )
a5. What is the pK of your indicator?
26
Experiment 6: POTENTIOMETRIC TITRATION OF AMINO ACIDS
In this experiment group you will learn how to use a pH meter. The pH meter willthen be used to do a potentiometric titration of an unknown amino acid. From this datayou should be able to identify the amino acid, and be reminded of important conceptslike pI, pH free bases and free acids. Remember many drugs behave just the same waythese amino acids do.
Reading AssignmentRead Chapter 11 of your text.
Experimental Procedure
Part I A. Preparation of 0.1 N NaOHPrepare standard 0.1M NaOH using the procedure given on page 214 of your
text. Make sure you boil your water before making this standard. When standardizingthe NaOH do three runs with KHP and phenolphthalein indicator. Your book asks you tocalculate the amount of KHP you need for your titrations. Just so you get off to the rightstart, let’s just say that you should be using about .7-.8 g of KHP for each titration. Yourfourth run will be with the pH meter as given below. Because this run may not be asaccurate, you do not need to use it in your determination of NaOH Molarity.
Part I B. Potentiometric determination of KHPAccurately weigh a final .7-.9 gram sample of KHP. From the above
standardization, calculate where the equivalence point of this titration should be. Add 50mls of water to the KHP and determine the initial pH. Also add 3 drops ofphenolphthalein indicator. Now add NaOH to the KHP in 2 -3 ml increments until youare 2 mls before your expected equivalence point. Record the pH after each of theseadditions of NaOH. When you are 2 mls before the equivalence point change theamount of NaOH added to about 0.1 ml increments. Continue the titration recordingyour pH until you are 2 mls past your expected equivalence point. Make sure you notedown the pH at which the indicator changes color as well.
Part II. Determination of pK's and identity of unknown Amino acidObtain an unknown sample from Dr. Z. Accurately weigh about 3.5 g of this
sample and dissolve in about 200 mLs of water. Transfer the solution to a 250 mLvolumetric and fill to the line with water. Remove a 25 mL aliquot and place in a 100 mLbeaker. Place a stir bar and pH electrode in the beaker determine the pH of thesolution. Titrate your amino acid with base. by adding 5 mL aliquots of titrant andrecording the pH of the solution. Roughly sketch the titrations curve. Decide where theendpoint (or points) of the titrations are. If you have any doubts, check with the TA. This titration is far less dramatic than the one you had for KHP. Why is that? Repeat the titration with another 25 ml aliquot of the unknown solution. Again start off
27
recording the pH at 5 ml intervals, but when you are near the endpoint, slow down anduse 0.25 ml increments. Repeat this slower titration two more times time. Note that forthe amino acid you will probably get better results if you use a Gran plot to find theequivalence point. Gran plots work best using the data from the last 10-20% of thetitration curve, so if your equivalence point is at 20 mL, make sure you have data from16 mL to 20 mL.
From the buffer regions of the graphs determine what the pK's of the amino acidare. From the number of mLs required to reach each endpoint you know how manymoles of amino acid there are. From this and the initial weight, determine the molecularweight of the amino acid, and the identity of the amino acid.
Graphical analysis(Use Excel, it will save you lots of time and grief)
KHP1. Plot pH vs. Vol.of Base for the KHP run done with the pH meter 2. Plots of both the first derivative and the second derivative. (Text section 10-4 pages202-206)
aFrom this data determine your endpoint and K of KHP
Amino AcidFor the ‘best’ run
1. Plot pH vs. Vol. Base for your best run with your amino acid2. 1st and 2nd derivative plots3. A Gran plot (Not in text, see class notes)
For the other two runs1. Select the type of plot worked the best for your amino acid and repeat for the
other two sets of data.
From the above three sets of data you should have obtain an average molecular
aweight and an average K
Notes on experiment and calculations:
a1. The best way to find your unknown is from the molecular weight, not the pK
28
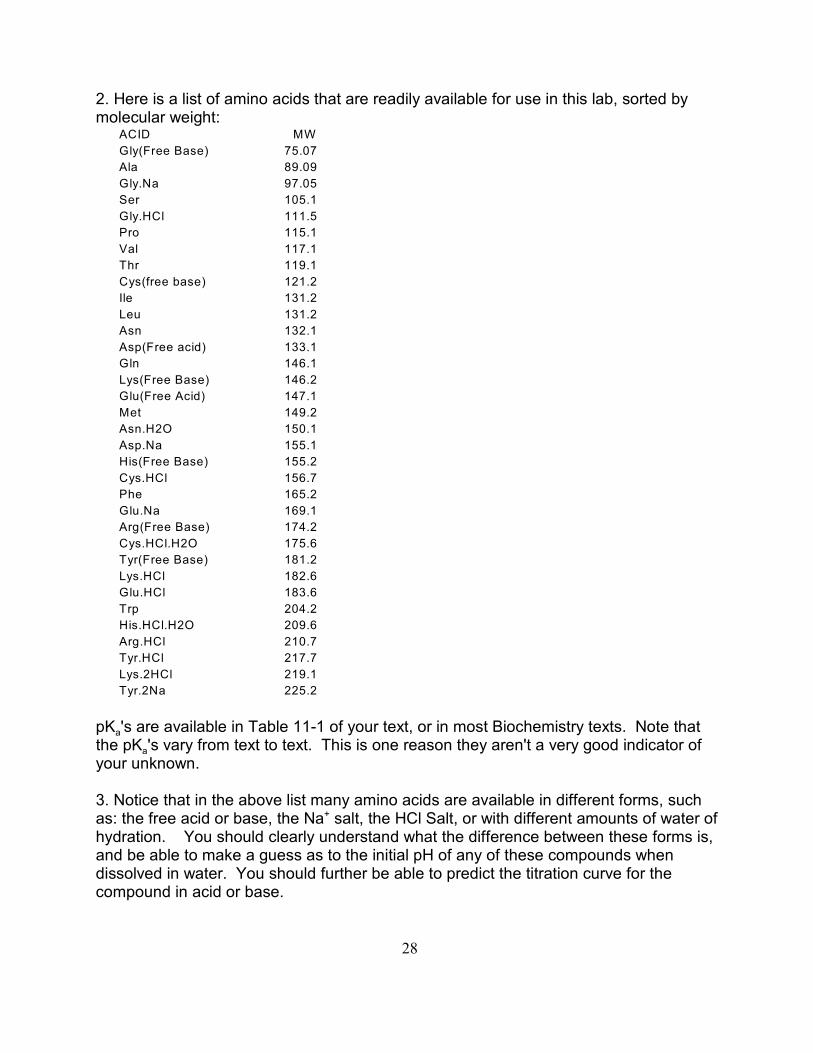
2. Here is a list of amino acids that are readily available for use in this lab, sorted bymolecular weight:
ACID MW
Gly(Free Base) 75.07
Ala 89.09
Gly.Na 97.05
Ser 105.1
Gly.HCl 111.5
Pro 115.1
Val 117.1
Thr 119.1
Cys(free base) 121.2
Ile 131.2
Leu 131.2
Asn 132.1
Asp(Free acid) 133.1
Gln 146.1
Lys(Free Base) 146.2
Glu(Free Acid) 147.1
Met 149.2
Asn.H2O 150.1
Asp.Na 155.1
His(Free Base) 155.2
Cys.HCl 156.7
Phe 165.2
Glu.Na 169.1
Arg(Free Base) 174.2
Cys.HCl.H2O 175.6
Tyr(Free Base) 181.2
Lys.HCl 182.6
Glu.HCl 183.6
Trp 204.2
His.HCl.H2O 209.6
Arg.HCl 210.7
Tyr.HCl 217.7
Lys.2HCl 219.1
Tyr.2Na 225.2
apK 's are available in Table 11-1 of your text, or in most Biochemistry texts. Note that
athe pK 's vary from text to text. This is one reason they aren't a very good indicator ofyour unknown.
3. Notice that in the above list many amino acids are available in different forms, suchas: the free acid or base, the Na salt, the HCl Salt, or with different amounts of water of+
hydration. You should clearly understand what the difference between these forms is,and be able to make a guess as to the initial pH of any of these compounds whendissolved in water. You should further be able to predict the titration curve for thecompound in acid or base.
29
Many of the compounds are in the free form where there is no complexing salt. Inthis case the compound is in its zwitterionic form, and it will have a base titration curvethat resembles figure 7.3 on page 183 of your text. Notice how weak and indistinct theequivalence point is in this titration. If you try to titrate this with acid your results will beeven worse. Your acid standard is not strong enough to titrate the acid functionality.
There is also a chance that your amino acid will not be in its zwitterionic form. Inthis case you will have a different titration curve, or you may have to titrate with acidinstead of base. Your initial pH should give you a good clue as to what to expect. If youare uncertain be sure to ask Dr. Z. before you waste too much time and titrant.
4. Also notice the range of molecular weights. A 3.5 gram sample of glycine (MW 75)has .047 Moles, when diluted to 250 mls and a 25 ml aliquot is removed will yield .0047moles of amino acid and will require 47 mls of .1M NaOH to titrate. On the other handyour lab partner may have Tyr 2Na with a molecular weight of 225.2. In this case it will.
take only 15.54 mls to titrate. So don't worry if these amounts vary widely. Also feel freeto compensate. If you need 47 mls to titrate a 25 ml aliquot of glycine cut the aliquotback to only 10 mls. Your new endpoint can be calculated from the simpleproportionality 47/25 = X/10 ; X= 18.8 mls. This will save you lots of titrant.
5. Some amino acids cannot be completely identified in this experiment. Leucine andisoleucine, for example, have exactly the same molecular weight. If this happens to youDON'T PANIC. Simply write down the range of molecular weights that you calculate foryour unknown, identify all amino acids in this range, and if your unknown is in there youare safe. You might try to look at some of the possible amino acids in the list and rulethem out based on some observed or predicted properties.
30
Experiment 7: EDTA TITRATION OF Ca AND Mg IN NATURAL2+ 2+
WATERS
Note: This procedure was originally found in the 2 edition of your text, but since Harrisnd
hasn’t put it in your current edition I have copied it here for your use.
Note for Steps 2 and 3. The pH 10 buffer is an ammonia buffer, so it is pretty stinky. Add the buffer in the hood and then titrate the sample right away, then flush the sampledown the drain with plenty of water. Please do not set up all your samples at one timeand have them sitting on the lab bench stinking up the lab.
2 2 21. Dry Na H EDTA@2H O ( Molar mass 372.24) at 80 C for one hour and cool in a0
desiccator. Accurately weigh out ~1.2 g and dissolve it with heating in 800 ml of distilledwater in a 1 liter volumetric flask. Cool to room temperature, dilute to the mark, and mixwell.
2. Preparation of a blank for the first titration. Place 40 mls of distilled water, 3 ml of pH10 buffer and 6 drops of Eriochrome Black T indicator in a flask. This should be a bluesolution (not reddish blue or purple). If it isn’t blue, add a drop of two of EDTA to make itblue, and note the volume required for this indicator error in your notebook. Keep thissolution on the lab bench for your next titration so you can try to match this color at everyend point. You will also have to subtract this volume from the total volumes of all yourtitrations to correct for this indicator error.
3. Determination of total Mg and Ca . Pipet 20 ml of Dr. Z’s well water into a 250 ml2+ 2+
flask. To this flask add 10 ml of distilled water, 3 ml of pH 10 buffer and 6 drops ofEriochrome Black T. Titrate this same until you have roughly the same shade of blueyou saw in your blank in step 2. Do this sample once for each group. Now, for eachindividual in a group find a different simulated water sample, and do this titration at least3 times on your simulated water sample.
4. Preparation of a blank for the second titration. Place 100 mls of distilled water in aflask. Add 30 drops of 50% NaOH and ~0.1g of solid hydroxynapthol blue indicator.This should be a different blue solution. If it isn’t blue add a drop of two of EDTA andsee if the color changes. Again mark down the volume required for this indicator error inyour notebook, and keep the solution for visual comparison to your other endpoints. Beaware that this color comparison is a bit trickier. With a real sample you will have
2suspended Mg(OH) particles that will make the titration solution look a bit different.
5. Determination of Ca only. Place 10 ml of Dr. Z’s well water in a flask and add ~65 ml2+
of deionized water. Add 30 drops of 50% NaOH and swirl for 2 minutes. You will
2probably see a Mg(OH) precipitate form. Add ~0.1g of solid hydroxynapthol blueindicator and titration with your EDTA solution to an endpoint similar to that seen in Step4. Again your group only has to do the titration once with Dr. Z’s well water one, but eachindividual in the group must do this titration at least three times with his or her simulatedwater sample to get accurate results on an unknown.
31
Name:___________________
Report Sheet EDTA Titration of Ca and Mg In Dr. Z’s drinking water2+ 2+
I. EDTAGrams of EDTA used: __________________
Molarity of EDTA solution: _______________
II. Data MZ well water sample (1 titration per group)
1. Total Molarity of Ca and Mg2+ 2+
Total volume of EDTA to endpoint in Ca Mg Titration ________2+ 2+
Volume of EDTA in Ca Mg Blank ________2+ 2+
Actual volume of EDTA to endpoint in Ca Mg Titration ________ 2+ 2+
Total Molarity of Ca and Mg ________2+ 2+
2. Molarity of Ca ONLY2+
Total volume of EDTA to endpoint in Ca only Titration ________2+
Volume of EDTA in Ca only Blank ________2+
Actual volume of EDTA to endpoint in Ca only Titration ________ 2+
Total Molarity of Ca ________2+
6. Convert from Moles/liter to g/liter Ca (g/l) _______________2+
Mg (g/l) _______________2+
7. Convert from g/liter to ppm Ca (ppm)_____________2+
Mg (ppm) _____________2+
32
III. Simulated water data
Simulated water sample # ________________
1. Total Molarity of Ca and Mg Run I Run II Run III2+ 2+
Total volume of EDTA to endpoint in Ca Mg Titration ____ ____ _____2+ 2+
Volume of EDTA in Ca Mg Blank ____ ____ ____2+ 2+
Final Volume of EDTA to endpoint in Ca Mg Titration ____ ____ ____ 2+ 2+
2. Total Molarity of Ca and Mg ____ ____ ____2+ 2+
Average Molarity ______________
Relative Standard Deviation of molarity ______________
3. Molarity of Ca ONLY2+
Total volume of EDTA to endpoint in Ca only Titration ____ ____ ____2+
Volume of EDTA in Ca only Blank ____ ____ ____2+
Actual volume of EDTA to endpoint in Ca only Titration ____ ____ ____2+
4. Molarity of Ca ONLY ____ ____ ____2+
Average Molarity ______________
Relative Standard Deviation of molarity ______________
5. Molarity of Mg only (total-moles Ca ) ______________2+ 2+
6. Convert from Moles/liter to g/liter Ca (g/l) _______________2+
Mg (g/l) _______________2+
7. Convert from g/liter to ppm Ca (ppm)_____________2+
Mg (ppm) _____________2+
33
Now for the comparisonsMilk . 30 mM Ca (10 mM free ion, 20 mM bound to casein)2+
Soft Water 0-17.1 ppmSlightly Hard Water 17.1-60Moderately Hard 60-120Hard 120-180Very Hard >180
(Water hardness numbers taken from www.hardwater.org)Note that water hardness does not differentiate between Ca and Mg so you should2+ 2+
add the Ca and Mg ppm together before you decide if I have hard water.2+ 2+
II. Error AnalysisUncertainty in Molarity of EDTAUsing the uncertainty of the mass of EDTA and the uncertainty of the volumetric
flask, and the uncertainty in the purity of EDTA, calculate the uncertainty you shouldhave in the molarity of EDTA.
Uncertainty in total molarityAssume you used a 10 ml type A volumetric pipet twice to deliver the 20 mls
volume of MZ water, and this took 25.00 mls of EDTA (measured in a buret) to titrate,what is the total metal molarity and the uncertainty in this molarity?
Uncertainty in Ca molarity2+
Assume you used a 10 ml type A volumetric pipet twice to deliver the 20 mlsvolume of MZ water, and this took 16.00 mls of EDTA (measured in a buret) to titrate,what is the Ca molarity and the uncertainty in this molarity?+2
Uncertainty in Mg Molarity2+
Based on the above numbers, what is the Mg molarity and the uncertainty in this2+
number?
34
Experiment 8. POTENTIOMETRIC HALIDE TITRATION WITH Ag+
This procedure also comes from the 2 edition of your textnd
Earlier in the semester you did a precipitation titration of Cl with Ag . This titration will- +
be similar, but this time you will have a mixture of both Cl and I to deal with. How do- -
you determine two different precipitates at once? You make an electrode that sensesthe Ag concentration, and watch the the potential of the Ag ion change as the different+ +
precipitates form.
Unknown: Each student will receive an unknown containing between 0.22-0.44g of KClplus 0.5-1.0g of KI
Procedure1. Pour your unknown into a 100ml volumetric flask and dissolve with 50 ml of distilledwater. Fill to mark and mix well.
32. Dry ~3 g of AgNO (FM 169.87) at 105 C for one hour and cool in a desiccator for 30o
min with minimal exposure to light. Accurately weigh 3.0 g and dissolve in a 250mlvolumetric flask. Keep flask covered if the solution will not be used the same day it ismade.
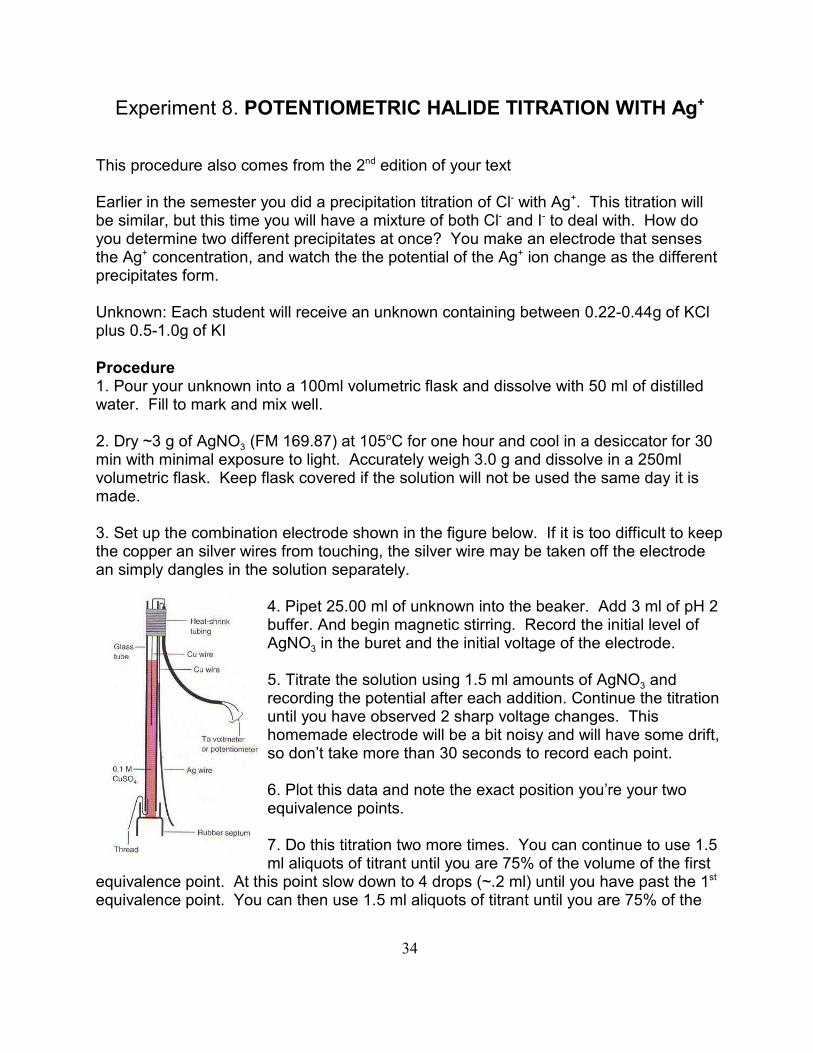
3. Set up the combination electrode shown in the figure below. If it is too difficult to keepthe copper an silver wires from touching, the silver wire may be taken off the electrodean simply dangles in the solution separately.
4. Pipet 25.00 ml of unknown into the beaker. Add 3 ml of pH 2buffer. And begin magnetic stirring. Record the initial level of
3AgNO in the buret and the initial voltage of the electrode.
35. Titrate the solution using 1.5 ml amounts of AgNO andrecording the potential after each addition. Continue the titrationuntil you have observed 2 sharp voltage changes. Thishomemade electrode will be a bit noisy and will have some drift,so don’t take more than 30 seconds to record each point.
6. Plot this data and note the exact position you’re your twoequivalence points.
7. Do this titration two more times. You can continue to use 1.5ml aliquots of titrant until you are 75% of the volume of the first
equivalence point. At this point slow down to 4 drops (~.2 ml) until you have past the 1st
equivalence point. You can then use 1.5 ml aliquots of titrant until you are 75% of the
35
way to the second equivalence point. The slow down to 4 drops per point until you haveobtained your second equivalence point.
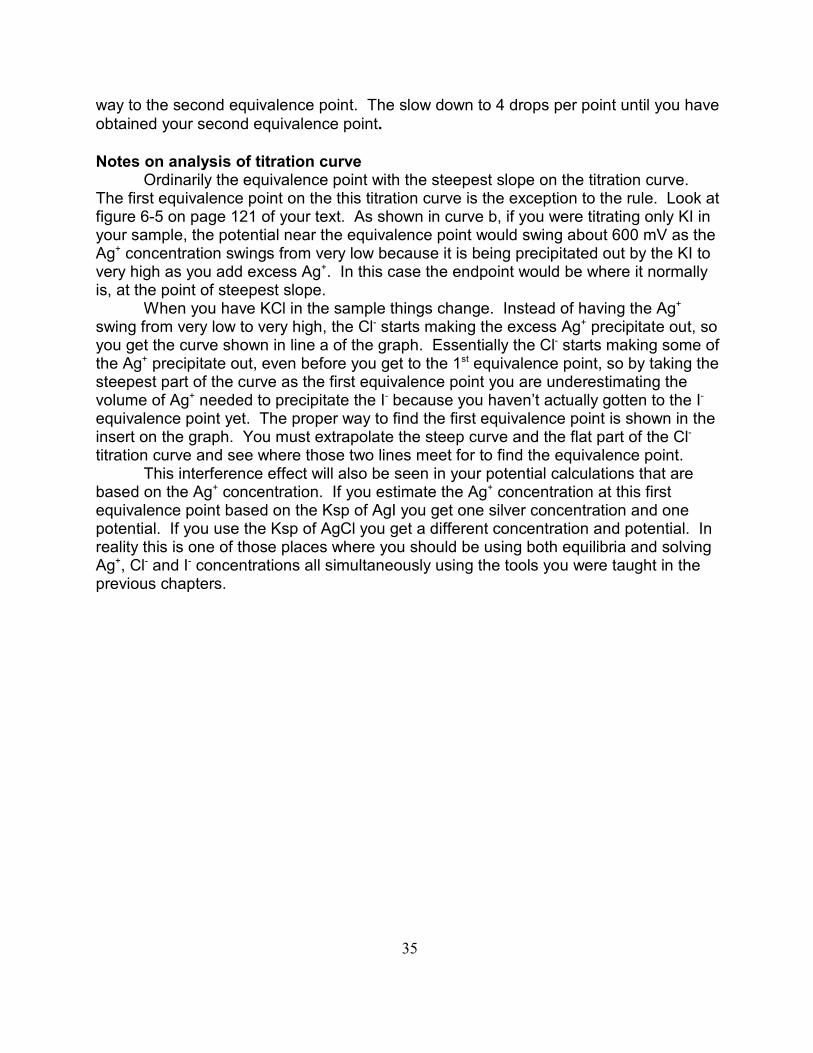
Notes on analysis of titration curveOrdinarily the equivalence point with the steepest slope on the titration curve.
The first equivalence point on the this titration curve is the exception to the rule. Look atfigure 6-5 on page 121 of your text. As shown in curve b, if you were titrating only KI inyour sample, the potential near the equivalence point would swing about 600 mV as theAg concentration swings from very low because it is being precipitated out by the KI to+
very high as you add excess Ag . In this case the endpoint would be where it normally+
is, at the point of steepest slope. When you have KCl in the sample things change. Instead of having the Ag+
swing from very low to very high, the Cl starts making the excess Ag precipitate out, so- +
you get the curve shown in line a of the graph. Essentially the Cl starts making some of-
the Ag precipitate out, even before you get to the 1 equivalence point, so by taking the+ st
steepest part of the curve as the first equivalence point you are underestimating thevolume of Ag needed to precipitate the I because you haven’t actually gotten to the I+ - -
equivalence point yet. The proper way to find the first equivalence point is shown in theinsert on the graph. You must extrapolate the steep curve and the flat part of the Cl-
titration curve and see where those two lines meet for to find the equivalence point.This interference effect will also be seen in your potential calculations that are
based on the Ag concentration. If you estimate the Ag concentration at this first+ +
equivalence point based on the Ksp of AgI you get one silver concentration and onepotential. If you use the Ksp of AgCl you get a different concentration and potential. Inreality this is one of those places where you should be using both equilibria and solvingAg , Cl and I concentrations all simultaneously using the tools you were taught in the+ - -
previous chapters.
36
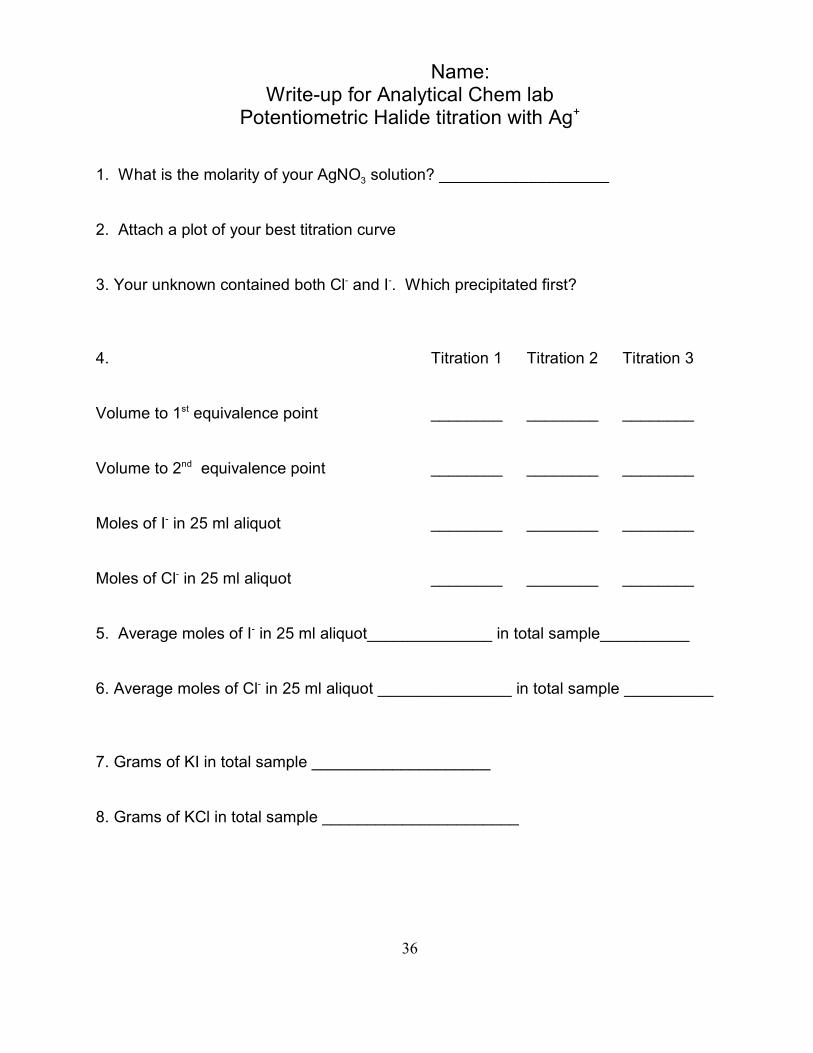
Name: Write-up for Analytical Chem lab
Potentiometric Halide titration with Ag+
31. What is the molarity of your AgNO solution? ___________________
2. Attach a plot of your best titration curve
3. Your unknown contained both Cl and I . Which precipitated first?- -
4. Titration 1 Titration 2 Titration 3
Volume to 1 equivalence point ________ ________ ________st
Volume to 2 equivalence point ________ ________ ________nd
Moles of I in 25 ml aliquot ________ ________ ________-
Moles of Cl in 25 ml aliquot ________ ________ ________-
5. Average moles of I in 25 ml aliquot______________ in total sample__________-
6. Average moles of Cl in 25 ml aliquot _______________ in total sample __________-
7. Grams of KI in total sample ____________________
8. Grams of KCl in total sample ______________________
37
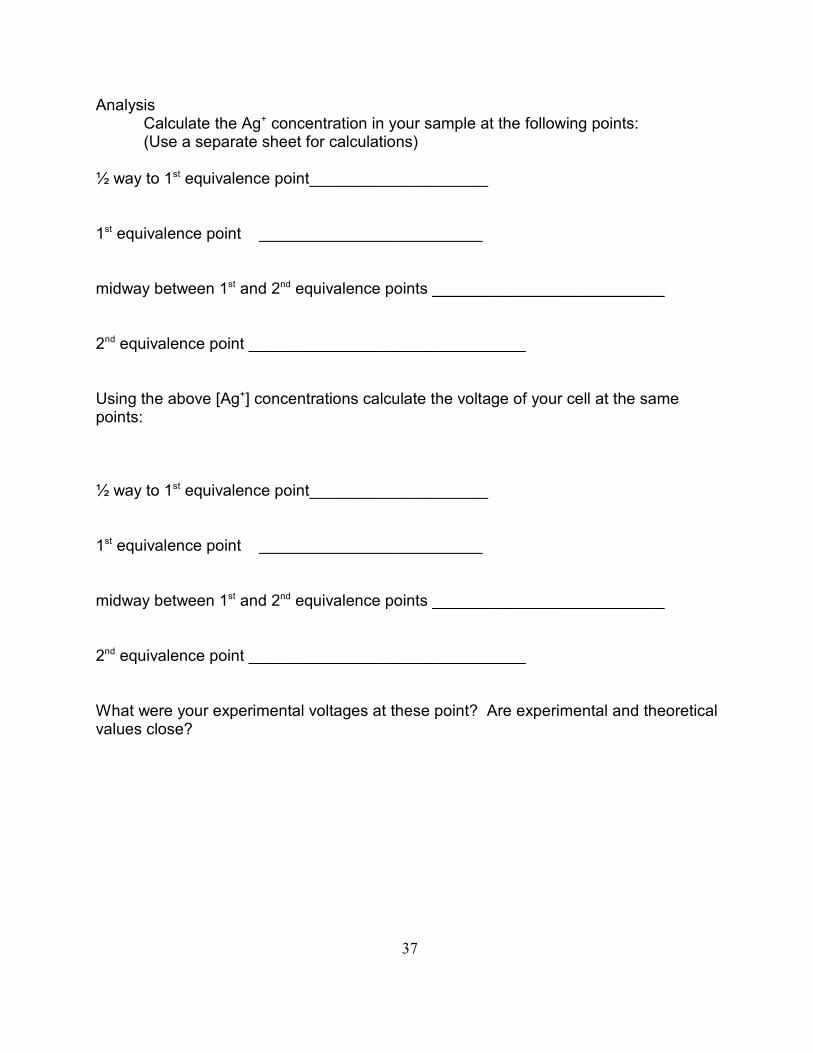
AnalysisCalculate the Ag concentration in your sample at the following points:+
(Use a separate sheet for calculations)
½ way to 1 equivalence point____________________st
1 equivalence point _________________________st
midway between 1 and 2 equivalence points __________________________st nd
2 equivalence point _______________________________nd
Using the above [Ag ] concentrations calculate the voltage of your cell at the same+
points:
½ way to 1 equivalence point____________________st
1 equivalence point _________________________st
midway between 1 and 2 equivalence points __________________________st nd
2 equivalence point _______________________________nd
What were your experimental voltages at these point? Are experimental and theoreticalvalues close?
38
Experiment 9. BACK TITRATION OF TRIS
Part I - Preparation of standard acid and base solution
Part II - Titration of unknown quantity of Tris
2 2 3Tris (Tris [hydroxymethyl]aminomethane, NH C(CH OH) ) is a common reagent used formaking buffers with a pH of around 7.5. Earlier in this manual there is a procedure forthe direct titration of this base. Here we explore a back titration of the same material..
Experimental ProcedurePart I - Preparation and standardization of solutions (Week 1)
KHP: Place about 4-5 grams of potassium acid phthalate (KHP) in the oven anddry at 110 for 1 hour. Get this sample into the oven FIRST, and then proceed to makeo
up the next two solutions
2 4H SO : Measure approximately 1 liter of distilled water into a glass stoppered
2 4bottle. With your 5 ml graduated pipet transfer 2.8 mLs of H SO into this bottle. Mixwell and label the bottle. BE CAREFUL WITH THE SULFURIC ACID. CLEAN UP ANDSPILLS IMMEDIATELY. NO MOUTH PIPETTING.
NaOH: Measure approximately 1 liter of distilled water into a plastic bottle. Carefully transfer 6 to 7 mls of the 1:1 NaOH stock solution (Provided by TA’s) into thebottle. Mix well and label.
Standardization of NaOH with KHP: Cool you KHP sample in the desiccators provided. When cool weigh accurately 0.7-0.9grams of KHP into each of three Erlenmeyer flasks. Label flasks and record theappropriate weights in your lab notebook. To each flask add 50 mls of distilled water anddissolve the KHP. Titrate the KHP with NaOH using phenolphthalein indicator. NOTE:in this titration, since there is a different amount of KHP in each sample, the endpointswill be different, so you won’t be able to go as quickly as you did in the HCl titration.
2 4Determination of Relative Concentrations of H SO and NaOH Solutions: Using your 25 ml volumetric pipet place 25.0 mls of your acid solution into a 125 mlerlenmeyer flask. Add two drops of PHENOLPHTHALEIN indicator. Fill your buret withthe NaOH solution and titrate the acid with the NaOH. In this procedure use a buretreader. Also make sure there are no bubbles in the buret tip. Occasionally rinse thesides of the flask with distilled water to wash any sprayed drops back into solution. Asyou get close to the endpoint you will see a pink color that persists for a longer andlonger period of time. The endpoint is achieved when you get a pink color that persistsat least 15 seconds during mixing. (This color may disappear over long periods of time
39
2as the solution picks up CO from the atmosphere.) Record your final volume. Repeatat least 2 more times. Note: Since you titrate exactly the same amount of acid everytime your NaOH volume should be exactly the same every time. Thus, on your secondand third titrations you can add NaOH to within .2 mls in one big shot and save yourselflots of time.
Save all solutions for Week II!
Part II - Titration of Tris (Week 2)
A weighing boat containing an unknown quantity of Tris will be distributed to eachperson. You want to transfer ALL of this material into your 250 ml volumetric flask and
2 4add to it exactly 150mLs of your H SO solution. The best way to do this is to transferthe Tris into your 250 ml volumetric flask, and then use about 50 ml of deionized waterto rinse the remaining Tris from the weighing boat into the flask. Then fill your 50 mLvolumetric pipet with acid solution and pour the acid into the volumetric flask. Swirl theTris solution around until it is dissolved, then REPEAT 2 MORE TIMES for a totalvolume of 150 mls of acid. Fill the volumetric to the line with distilled water and mixthoroughly.
Use your volumetric pipet to remove a 50 mL aliquot out of the flask. Place thealiquot in a 150 ml erlenmeyer, add 2 drops METHYL RED / BROMOCRESOL GREEN INDICATOR. Titrate with NaOH. The solution should start off an orangy-pink. It turnsclear at the endpoint. If it turns green you overshot. Do this 3 times total.
Notes on experiment:
b1. Tris has a formula weight of 121.1 g/mol. It is a weak base, pK =8.075. It is so weakthat it can't be directly titrated with strong acid in aqueous solution (Try to figure out why,when we get to acids and bases in lecture). That is why we use an indirect procedure
2 4here. A known amount of a strong acid (H SO ) is initially reacted with an unknownamount of lidocaine. The excess strong acid reacts with the weak base, and we thentitrate the remaining acid with NaOH, a strong base.
In this titration we use a mixture of methyl red (that changes from red to yellowbetween pH 3.1 and 4.4) and bromocresol green (that changes from yellow to blue between pH 3.8 and 5.4). Neither of these yellows is very strong so you should first seeyour red solution turning clear, and then your clear solution turning green. The endpointyou want is when the solution first turns clear. If it turns green you have overshot andare beginning to titrate the conjugate acid form of the lidocaine back into the base form.
40
Notes on Calculations: Standardization of NaOH from KHPLet's say it takes 39.64 mls of NaOH to titrate .8543 grams of KHP. The
molecular weight of KHP is 204.233 so our sample contained .8543 grams / 204.223(grams/mole) or 4.183x10 moles of KHP. We don't know the molarity of the NaOH, but-3
we do know that each mole of NaOH reacts with a mole of KHP. Thus our 39.64 mls ofNaOH also contained 4.183x10 moles of NaOH. If Molarity = Moles/volume, then-3
molarity = 4.183x10 /39.64x10 = .1055 M. Note that for NaOH, Molarity = Normality-3 -3
2 4Standardization of H SO with NaOH.Here it is convenient to work in normality because at the equivalence point we
1 1 2 2have N V =N V . Let's say our volumetric pipette delivers exactly 25 mls of solution, andthat it took 26.02 mls of NaOH to titrate this solution. Since Normality = Molarity forNaOH we have: 26.02(.1055)=25.00(X); and X=.1098 N.
Determination of TrisHere I will calculate how much of the above NaOH solution is needed to titrate a
2 40.7 gram sample of Tris made up in 150 mls of the above H SO solution. You will haveto turn the equations around to find out how much Tris is in your unknown sample.
Let's start with how many moles of Tris is in our 0.7 grams sample:0.7/121.1=5.780x10 moles or equivalents (1:1 reaction with acid)-3
2 4We react this with 150 mls of .1098 equivalents of H SO so we have
2 4 2 4Equivalents of H SO remaining= Total equivalents ofH SO - equivalents of Tris
150x10 (.1098)-5.780x10 = 10.69x10⁻³ -3 -3
This 10.69x10 moles is then placed in a 250 mls volumetric and a 50 ml aliquot-3
is removed. This aliquot represents 50/250 or 1/5 of the total volume. 1/5 of the total
2 4volume is that same as 1/5 of the number of moles, so the number of moles of H SO inthe aliquot is 10.69x10 x (1/5) = 2.138x10 . This is the total number of equivalents. If-3 -3
the NaOH is .1098 Normal then : Equivalents= Normality X Volume and we have2.138x10 =.1055(Volume) ; and it would take 20.27 mls of .1055 N NaOH to reach our-3
endpoint.
41
Grading:70 points on relative error between your value and the unknowns actual value. (Actual value- your value)/actual value. <6 ppt 70 points- 0.75 points for each additional ppt
10 points each for the coefficient of variation for your standard acid and base<1 ppt 10 points-1 point for each additional ppt
10 points for the coefficient of variation of the unknown. <2 ppt 10 points-1 point for each additional %
42
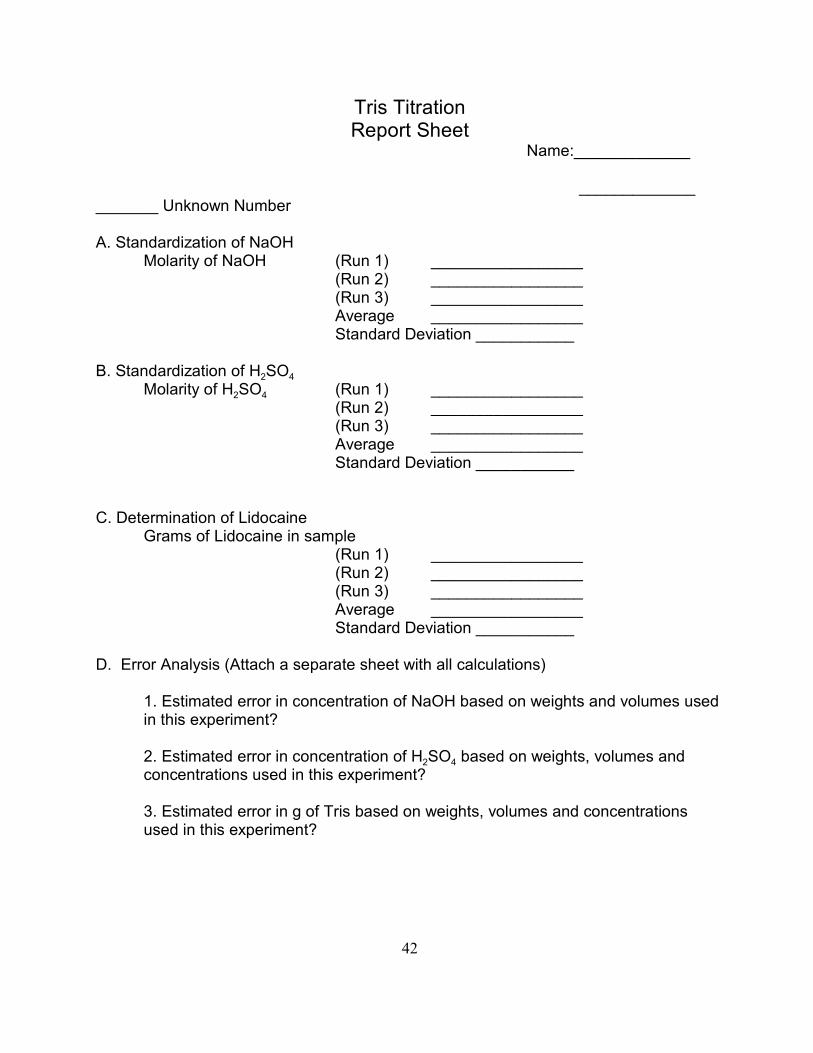
Tris TitrationReport Sheet
Name:_____________
____________________ Unknown Number
A. Standardization of NaOHMolarity of NaOH (Run 1) _________________
(Run 2) _________________(Run 3) _________________Average _________________Standard Deviation ___________
2 4B. Standardization of H SO
2 4Molarity of H SO (Run 1) _________________(Run 2) _________________(Run 3) _________________Average _________________Standard Deviation ___________
C. Determination of LidocaineGrams of Lidocaine in sample
(Run 1) _________________(Run 2) _________________(Run 3) _________________Average _________________Standard Deviation ___________
D. Error Analysis (Attach a separate sheet with all calculations)
1. Estimated error in concentration of NaOH based on weights and volumes usedin this experiment?
2 42. Estimated error in concentration of H SO based on weights, volumes andconcentrations used in this experiment?
3. Estimated error in g of Tris based on weights, volumes and concentrationsused in this experiment?
43
Experiment 10. REDOX TITRATION OF VITAMIN C
Reading AssignmentRead section 16-9 of your text.
Experimental Procedure
Part I A. Preparation of 0.05 N IodineObtain a 250 ml Erlenmeyer flask with a rubber stopper and cover the stopper
with a piece of Al foil. In the hood, using a triple beam balance, weigh out 20 gms ofKI ( you need not be very accurate) and dissolve it in 50 ml of distilled water. Weigh out
2 approx 6.4 gms of I and dissolve it in the KI solution. Do not take iodine crystals backto your lab bench because they give off a corrosive vapor! Once you have theiodine in solution, then you can take it back to your lab bench.
2Once your I and I are dissolved, pour the solution into a 1000 ml volumetric, add-
water to bring the volume up to the 1000 ml mark, then mix the solution and store it in
2your cabinet, out of direct sunlight. It may not be possible to completely dissolve the I .
2If you have some undissolved I simply decant your solution into a 1 L glass bottle and
2dilute it to 1 L with distilled water. When doing this make sure that no undissolved I istransferred into your solution because this will dissolve over a period of time and changethe normality of your solution. Standardize this solution in the next step, but Do notthrow away because this solution is needed in the second part of the lab.
Part 1 B. Preparation of 0.05 N Sodium thiosulfate
2 2 3Accurately weigh about 2 g of Na S O (Primary Standard). This will be found inthe lab desiccator. Place this sample in a 250 volumetric and fill to the mark. Note: thissolution is not stable for long periods of time. If won’t be using this solution within thenext 24 hours, see your instructor or your text for instructions for making a stablestandard solution
2Part 1 C. Standardization of IPipette out a 25 mL aliquot of your sodium thiosulfate standard using a volumetric
pipette and add about 2 mL of the starch indicator solution. Titrate this solution against
2 the I solution. The end point is indicated by the appearance of a deep blue color whichshould persist for at least 1 min. Unlike the earlier titrations which you have done, theendpoint in this reaction does not come instantly. Instead, as you near the end point youwill see the appearance of a blue color which disappears when swirling the solution. So
2when you reach this point in your titration add the I solution one drop at a time and swirlyour flask vigorously. Do this until you reach the endpoint. The dropwise addition is veryimportant if you want to get accurate results. When you have standardized your Iodinesolution you may dispose of the Thiosulfate solution.
Part II. Determination of Vitamin CVitamin C spontaneously oxidizes when exposed to air. If you don't keep Vitamin
44
C tablets tightly closed they will slowly lose their potency. You can see that if you everwanted to determine the potency of Vitamin C that has sat on the shelf for a while, thiswould be a reasonable procedure. You will do two determinations of Vitamin C. In thefirst you will be given a standard of known potency from Dr. Z., so we can see how yourtechnique is, and in the second you will be given some off the shelf pills, so you can seefor yourself how good the manufacture of these pills is.
Part II A. Determination of an unknown (One unknown for each person)You will be given an unknown containing approximately 1 gm of Vitamin C.
Quantitatively transfer this to your 250 ml volumetric (Make sure is was well cleaned andrinsed since it just had Thiosulfate in it) and dissolve the Vitamin C in 250 mls of water. Since this will slowly air oxidize, keep this volumetric capped and place it in a beaker ofice to slow the oxidation rate down. Do all titrations of your unknown on the same dayand DO NOT store the solution overnight.
To titrate this solution simply remove a 25 ml aliquot with a volumetric pipette andtransfer the aliquot to a 250 ml Erlenmeyer and add 2 mL drops of starch indicator. Titrate directly with your Iodine solution. Do at least three titrations
Part II B. Determination of % purity in an vitamin pill (One set of 3 for each group)Obtain 3 Vitamin C pills. For EACH pill, weigh pill, grind to a fine powder,
accurately weigh about 100 mg of the powder into a 250 ml Erlenmeyer, dissolve in 25mls of water, add 2 mL of starch indicator, and titrate with the Iodine solution.
Notes on Experiment:
21. I sublimes (goes directly into a vapor form) at room temperature. This vapor form iscaustic and a potential health threat. That is why you must weigh it in the hood, and add
2the KI and put it into solution as quickly as possible. DO NOT HAVE SOLID I SITTINGON YOUR LAB BENCH FOR ANY LENGTH OF TIME. It is also a good idea to disposeof the Iodine solution in a sink in the hood, rather than the sinks in open part of the lab.
45
Notes on Calculations:1. Notice that the concentration of the stock solution is in NORMALITY. Normality =Molarity * n, where n is a coefficient that takes care of reaction stoichiometries. In redoxreaction n = number of electrons in the reagent’s ½ reaction. The nice thing is that N*V=N*V. No matter what the reaction stoichiometry is. So if we had 50 mls of .1007 N
2stock solution and added to it 50 mls of H O, our final normality is .05035N. If 25 mls ofthis is titrated with 26 mls of our Iodine solution we then have 25(.05035)=26(X), andX=.05144N .
2. What is the Normality of our thiosulfate solution? In making this solution we have 2 g
2 2 3or Na S O (FW=158.09) in 250 mL of water so the Molarity is 2/158.09/.25 = .05061M
2 3 4 6The thiosulfate ½ reaction is: 2S O 6S O + 2e In this equation we see that each2- 2- -
mole of thiosulfate makes 1 mole of electrons so N=M and N= .05061
2. Let's assume you have a 1.0 gram sample that was 95% Vitamin C. 1.0 grams X.95= 0.95 grams. The equivalent weight of Vitamin C is 88.07 in this reaction so .95grams represents .95/88.07 or 10.787 mequivalents of vitamin C. You take a 25 mlaliquot from a 250 ml volumetric, so you are actually titrating 1.079 meq. This will
2require 1.079 meq of I solution to titrate it, so the equivalence point should be at1.079x10 /.05144 or 20.98 mls.-3
3. We are titrating the vitamin C in the individual tablets so you can see how muchvariability there is in the manufacturing. For each tablet multiply the % purity times theweight of the tablet to find out how many milligrams of vitamin C was actually in the pill. Note that the tablets can be in many different sizes, but will probably have a nominaldosase like 100, 250, 500, or 1000 mg.
Grading:75 points on the relative error in your unknown or relative error in your % purity. <3 ppt 75 points-1.5 point for each additional ppt.
10 points each for the coefficient of variation for your standardization of the Iodine.<1ppt 10 points-1 point for each additional ppt.
10 points each for the coefficient of variation in your unknown determination.<1ppt 10 points-1 point for each additional ppt.10 points of the variability of the unknown
5 points for your determination of % purity in the Vitamin Pills. Note: Experience hasshown that there will be MUCH more of variability in these answers!
46
Experiment 11: SPECTROPHOTOMETRIC DETERMINATION OFIRON IN DIETARY TABLETS
This is another experiment that is taken almost verbatim from the second edition of yourtext.
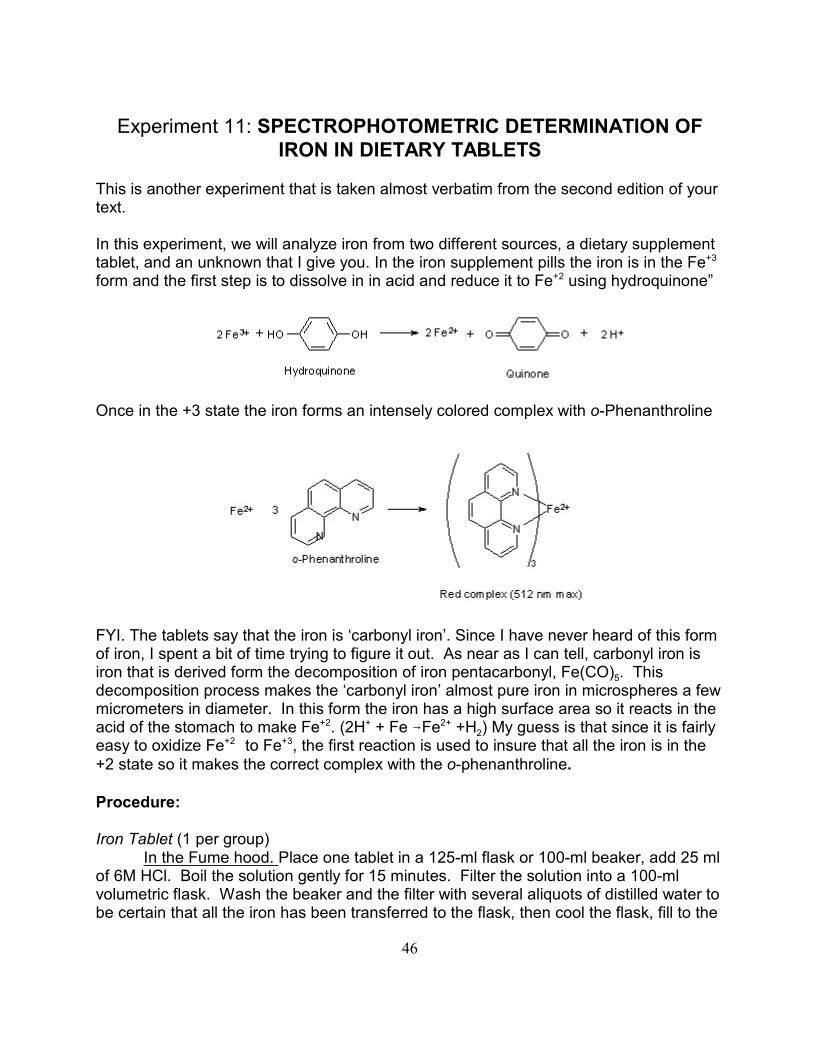
In this experiment, we will analyze iron from two different sources, a dietary supplementtablet, and an unknown that I give you. In the iron supplement pills the iron is in the Fe+3
form and the first step is to dissolve in in acid and reduce it to Fe using hydroquinone”+2
Once in the +3 state the iron forms an intensely colored complex with o-Phenanthroline
FYI. The tablets say that the iron is ‘carbonyl iron’. Since I have never heard of this formof iron, I spent a bit of time trying to figure it out. As near as I can tell, carbonyl iron is
5iron that is derived form the decomposition of iron pentacarbonyl, Fe(CO) . Thisdecomposition process makes the ‘carbonyl iron’ almost pure iron in microspheres a fewmicrometers in diameter. In this form the iron has a high surface area so it reacts in the
2acid of the stomach to make Fe . (2H + Fe 6Fe +H ) My guess is that since it is fairly+2 + 2+
easy to oxidize Fe to Fe , the first reaction is used to insure that all the iron is in the+2 +3
+2 state so it makes the correct complex with the o-phenanthroline.
Procedure:
Iron Tablet (1 per group)In the Fume hood. Place one tablet in a 125-ml flask or 100-ml beaker, add 25 ml
of 6M HCl. Boil the solution gently for 15 minutes. Filter the solution into a 100-mlvolumetric flask. Wash the beaker and the filter with several aliquots of distilled water tobe certain that all the iron has been transferred to the flask, then cool the flask, fill to the
47
mark, and mix well. Make a more dilute iron solution by using a 5.00 ml volumetric pipetto transfer 5.00 ml of your original iron solution into a second 100-ml volumetric flask. Fill this second flask to the line with distilled water and mix. This is your iron tabletsample.
Pipet 10.00 ml of the final iron tablet solution into a beaker and measure the pHwith pH paper. Add sodium citrate solution one drop at a time until the pH is about 3.5Record the number of drops in your notebook and discard this solution. (It may take asmuch as 3.5 ml of the citrate solution to get to the proper pH)
Using the appropriate volumetric pipet, transfer 10.00 of the iron tablet solutioninto a 100-ml volumetric flask. Add the appropriate amount of citrate solution to bringthe pH to 3.5. Do NOT fill this flask to the mark. This will happen later in the procedure
Unknown (1 for each student)You will be given a 50 ml volumetric flask containing an iron unknown. Fill the
volumetric to the mark with distilled water and mix.Pipet 10.00 ml of the unknown solution into a beaker and measure the pH with pH
paper. Add sodium citrate solution one drop at a time until the pH is about 3.5 Recordthe number of drops in your notebook and discard this solution. (This should take lessthan 30 drops)
Using the appropriate volumetric pipet, transfer 10.00 of the iron unknownsolution into a 100-ml volumetric flask. Add the appropriate amount of citrate solution tobring the pH to 3.5. Do NOT fill this flask to the mark. This will happen later in theprocedure. If you have enough glassware you may want to make up one or twoadditional unknown samples to you have multiple determinations for added accuracy.
Preparation of standards (1 set for each group)1. Pipet 10.00 ml of the standard Fe solution into a beaker and measure the pH
with pH paper. Add sodium citrate solution one drop at a time until the pH is about 3.5Record the number of drops in your notebook and discard this solution. (It should havetaken around 30 drops)
2. Using the appropriate volumetric pipets, transfer 10.00, 5.00, 2.00 and 1.00 mlsof the standard iron solution into four 100-ml volumetric flasks. Make a fifth volumetric flask to be used as a blank by adding 10.00 ml of distilled water to the flask.
3. To ALL the volumetrics containing iron samples at pH 3.5 (4 standards, 1blank, 1 iron tablet, 1 or more unknowns) add:
2.00 ml of hydroquinone solution3.00 ml of o-phenanthroline solutionAdd water to the mark and mix well
Let the solutions stand for 15 minutes to react. Using distilled water as a blank,measure the absorbance of all the solution at 512 nm using the samespectrophotometer.
48
AnalysisUse the least squares spreadsheet that you prepared at the beginning of the
semester to determine the line of best fit for the standards. From this line of best fit youcan determine the concentration of iron in your unknown.
To be turned in1. Fe calibration curve. Both the plot, and the spread sheet analysis2. Amount of Fe in dietary tablet3. Amount of iron in the 50 ml volumetric that I gave you
Uncertainty in this number based on uncertainty in calibration curveUncertainty in the number based on sample repetition.
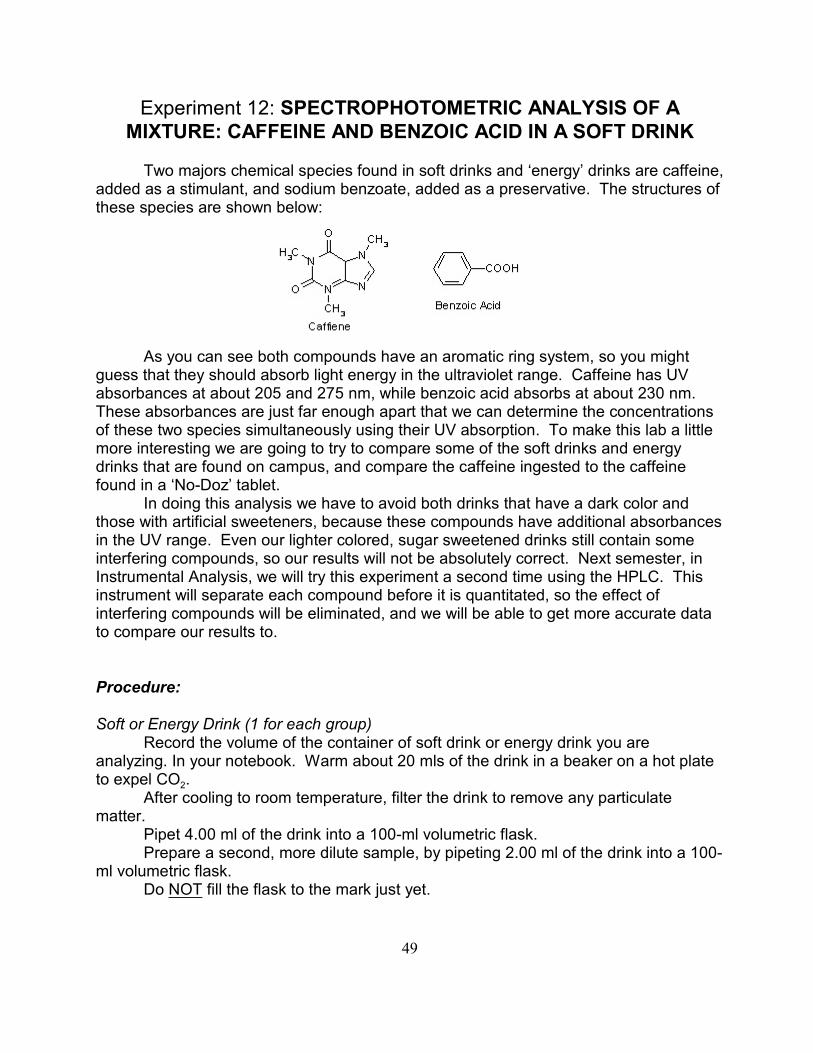
49
Experiment 12: SPECTROPHOTOMETRIC ANALYSIS OF AMIXTURE: CAFFEINE AND BENZOIC ACID IN A SOFT DRINK
Two majors chemical species found in soft drinks and ‘energy’ drinks are caffeine,added as a stimulant, and sodium benzoate, added as a preservative. The structures ofthese species are shown below:
As you can see both compounds have an aromatic ring system, so you mightguess that they should absorb light energy in the ultraviolet range. Caffeine has UVabsorbances at about 205 and 275 nm, while benzoic acid absorbs at about 230 nm. These absorbances are just far enough apart that we can determine the concentrationsof these two species simultaneously using their UV absorption. To make this lab a littlemore interesting we are going to try to compare some of the soft drinks and energydrinks that are found on campus, and compare the caffeine ingested to the caffeinefound in a ‘No-Doz’ tablet.
In doing this analysis we have to avoid both drinks that have a dark color andthose with artificial sweeteners, because these compounds have additional absorbancesin the UV range. Even our lighter colored, sugar sweetened drinks still contain someinterfering compounds, so our results will not be absolutely correct. Next semester, inInstrumental Analysis, we will try this experiment a second time using the HPLC. Thisinstrument will separate each compound before it is quantitated, so the effect ofinterfering compounds will be eliminated, and we will be able to get more accurate datato compare our results to.
Procedure:
Soft or Energy Drink (1 for each group)Record the volume of the container of soft drink or energy drink you are
analyzing. In your notebook. Warm about 20 mls of the drink in a beaker on a hot plate
2to expel CO .After cooling to room temperature, filter the drink to remove any particulate
matter.Pipet 4.00 ml of the drink into a 100-ml volumetric flask.Prepare a second, more dilute sample, by pipeting 2.00 ml of the drink into a 100-
ml volumetric flask.Do NOT fill the flask to the mark just yet.
50
Unknown (1 for each person)You will be given an unknown in a 100-ml volumetric flask. Write down the
number of the flask in your notebook. Do NOT fill the flask to the mark just yet.
StandardsBenzoic acidAdd 2.00, 4.00, 6.00, 8.00 and 10.00 mls of 100 mg/L benzoic acid standard to
each of 5 100-ml volumetric flasks. CaffeineAdd 2.00, 4.00, 6.00, 8.00 and 10.00 mls of 200 mg/L caffeine standard to each
of 5 different 100-ml volumetric flasks.Blank Prepare one blank 100 ml volumetric with 10 mls of distilled water
Solution PreparationTo all solutions (1 blank, 5 benzoic standards, 5 caffeine standards, 2 drink, and
all unknowns) add 10.0 mls of 0.1M HCl.Fill all volumetric to the mark with distilled water.
Spectrophotometric MeasurementUsing your blank sample as a reference, determine the UV absorbance curve of
Caffeine from 200 to 350 nm.Using your blank sample as a reference, determine the UV absorbance curve of
Benzoic Acid from 200 to 350 nm.From the above two absorbance curves determine wavelengths at which both
these compounds have their absorbance maxima. Check with the instructor that youhave properly found these wavelengths before proceeding further.
Using the blank sample as the reference, determine the absorbance for allsamples (5 benzoic standards, 5 caffeine standards, 2 drink, and all unknowns) at BOTHof the wavelength found above.
AnalysisUsing the equations found in section 19-2 (page 404) of your text, determine the
concentration of caffeine and benzoic acid in your unknowns and your drinks.Once you have determined the concentration of these species in the soft drink aliquot,use the original volume of th drink container to calculate the total number of mg ofcaffeine you would have ingested if you had drunk the entire container.
For a reference point, a NO-DOZ tablet contains 100 mg of caffeine, and you arenot supposed to take more than 2 tablets every 3-4 hours.
51
What to hand in:
1. Absorption spectrum of benzoic acid with chosen absorption peak marked.2. Absorption spectrum of caffeine with chosen absorption peak marked.3. Plot of Absorbance vs concentration for benzoic acid at chosen wavelengths.4. Plot of Absorbance vs concentration for caffeine at chosen wavelengths.5. Molar absorptivity of benzoic acid at chosen wavelengths.6. Molar absorptivity of caffeine at chosen wavelengths.7. Absorption spectra of the drinks your group prepared and analyzed.
Comment on the above spectra.8. The Concentration of caffeine and benzoic acid in all drinks your group analyzed.9. Using the above concentrations, calculate the total amount of caffeine in each of theoriginal drink cans. How does this compare to the 200 mg dose of caffeine you wouldget from consuming two No-Doz tablets.10. Number of your unknown.11. Absorption spectrum of your unknown12. Concentration of Benzoic acid and Caffeine in your unknown.
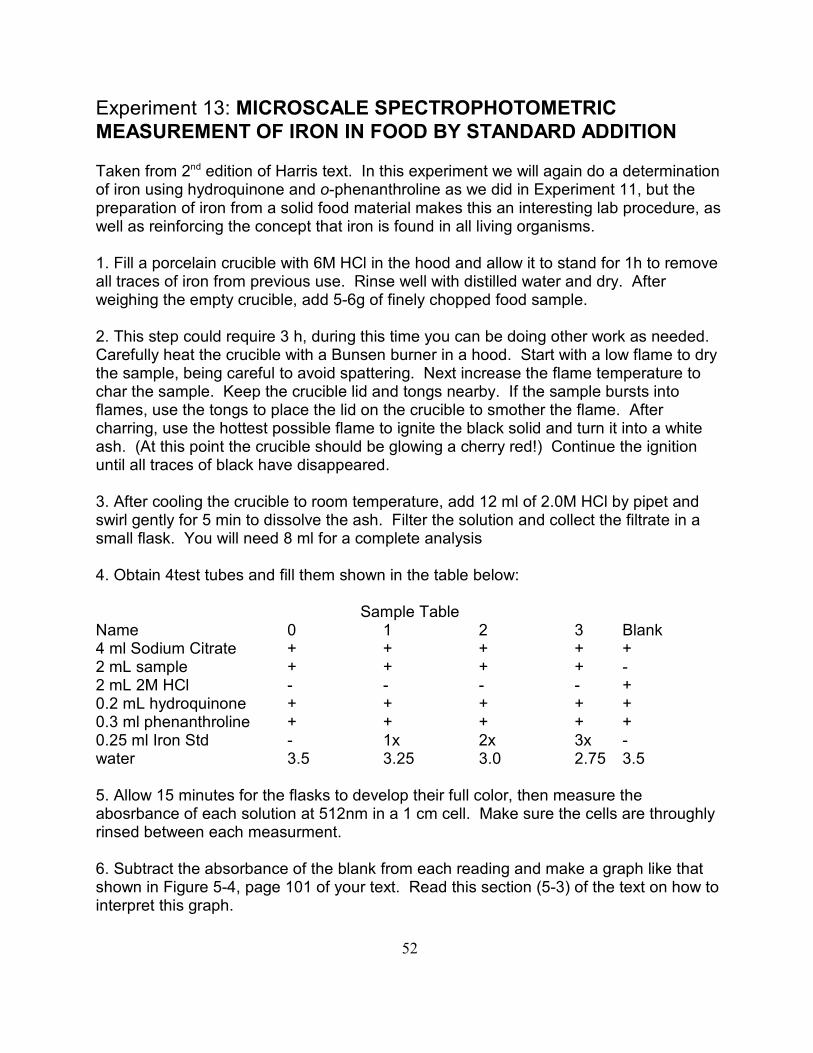
52
Experiment 13: MICROSCALE SPECTROPHOTOMETRICMEASUREMENT OF IRON IN FOOD BY STANDARD ADDITION
Taken from 2 edition of Harris text. In this experiment we will again do a determinationnd
of iron using hydroquinone and o-phenanthroline as we did in Experiment 11, but thepreparation of iron from a solid food material makes this an interesting lab procedure, aswell as reinforcing the concept that iron is found in all living organisms.
1. Fill a porcelain crucible with 6M HCl in the hood and allow it to stand for 1h to removeall traces of iron from previous use. Rinse well with distilled water and dry. Afterweighing the empty crucible, add 5-6g of finely chopped food sample.
2. This step could require 3 h, during this time you can be doing other work as needed. Carefully heat the crucible with a Bunsen burner in a hood. Start with a low flame to drythe sample, being careful to avoid spattering. Next increase the flame temperature tochar the sample. Keep the crucible lid and tongs nearby. If the sample bursts intoflames, use the tongs to place the lid on the crucible to smother the flame. Aftercharring, use the hottest possible flame to ignite the black solid and turn it into a whiteash. (At this point the crucible should be glowing a cherry red!) Continue the ignitionuntil all traces of black have disappeared.
3. After cooling the crucible to room temperature, add 12 ml of 2.0M HCl by pipet andswirl gently for 5 min to dissolve the ash. Filter the solution and collect the filtrate in asmall flask. You will need 8 ml for a complete analysis
4. Obtain 4test tubes and fill them shown in the table below:
Sample TableName 0 1 2 3 Blank4 ml Sodium Citrate + + + + +2 mL sample + + + + -2 mL 2M HCl - - - - +0.2 mL hydroquinone + + + + +0.3 ml phenanthroline + + + + +0.25 ml Iron Std - 1x 2x 3x -water 3.5 3.25 3.0 2.75 3.5
5. Allow 15 minutes for the flasks to develop their full color, then measure theabosrbance of each solution at 512nm in a 1 cm cell. Make sure the cells are throughlyrinsed between each measurment.
6. Subtract the absorbance of the blank from each reading and make a graph like thatshown in Figure 5-4, page 101 of your text. Read this section (5-3) of the text on how tointerpret this graph.

53
What to hand in:1. Table of data showing absorbance for each sample
2. Plot of Absorbance vs. concentration for your samples
3. Determination of Iron in your sample, expressed at mg iron/ g sample.
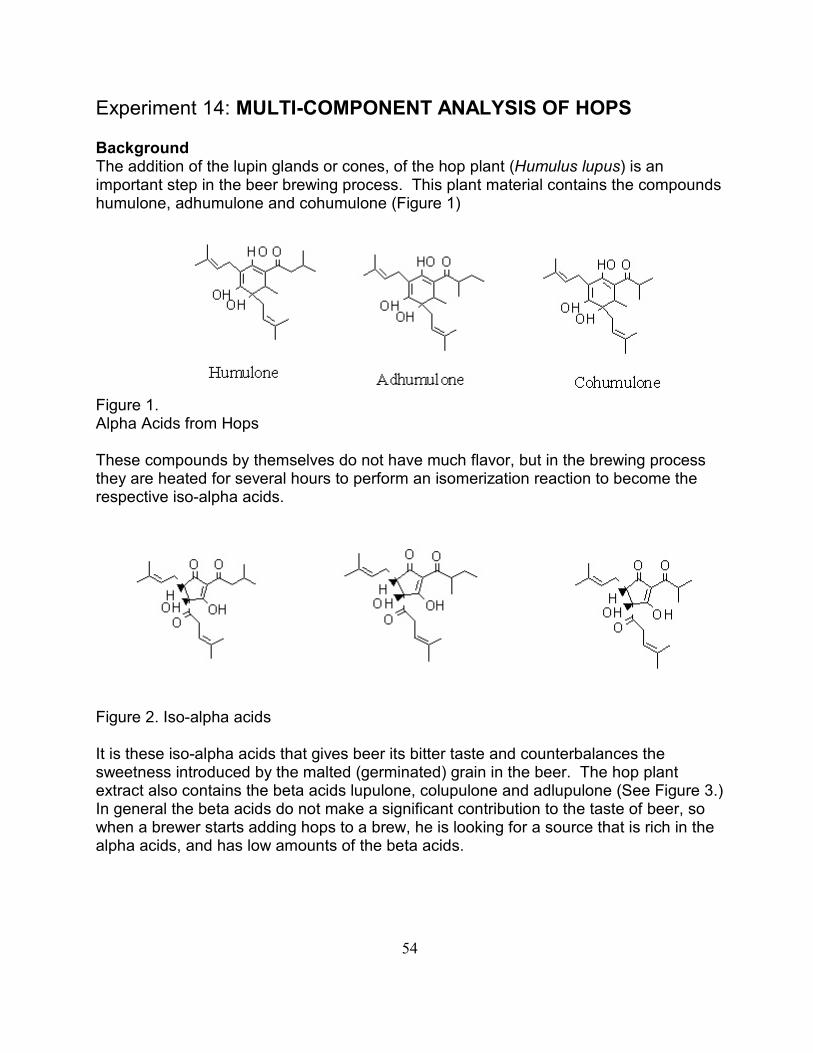
54
Experiment 14: MULTI-COMPONENT ANALYSIS OF HOPS
BackgroundThe addition of the lupin glands or cones, of the hop plant (Humulus lupus) is animportant step in the beer brewing process. This plant material contains the compoundshumulone, adhumulone and cohumulone (Figure 1)
Figure 1.Alpha Acids from Hops
These compounds by themselves do not have much flavor, but in the brewing processthey are heated for several hours to perform an isomerization reaction to become therespective iso-alpha acids.
Figure 2. Iso-alpha acids
It is these iso-alpha acids that gives beer its bitter taste and counterbalances thesweetness introduced by the malted (germinated) grain in the beer. The hop plantextract also contains the beta acids lupulone, colupulone and adlupulone (See Figure 3.)In general the beta acids do not make a significant contribution to the taste of beer, sowhen a brewer starts adding hops to a brew, he is looking for a source that is rich in thealpha acids, and has low amounts of the beta acids.
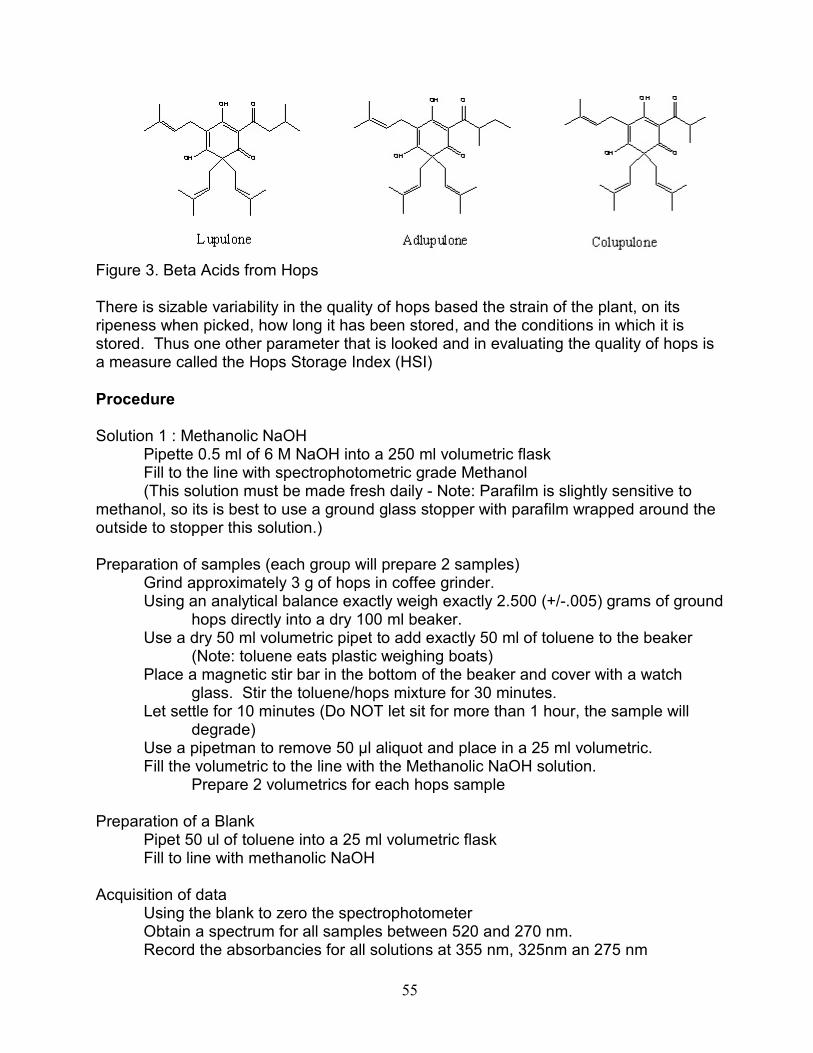
55
Figure 3. Beta Acids from Hops
There is sizable variability in the quality of hops based the strain of the plant, on itsripeness when picked, how long it has been stored, and the conditions in which it isstored. Thus one other parameter that is looked and in evaluating the quality of hops isa measure called the Hops Storage Index (HSI)
Procedure
Solution 1 : Methanolic NaOHPipette 0.5 ml of 6 M NaOH into a 250 ml volumetric flaskFill to the line with spectrophotometric grade Methanol(This solution must be made fresh daily - Note: Parafilm is slightly sensitive to
methanol, so its is best to use a ground glass stopper with parafilm wrapped around theoutside to stopper this solution.)
Preparation of samples (each group will prepare 2 samples)Grind approximately 3 g of hops in coffee grinder.Using an analytical balance exactly weigh exactly 2.500 (+/-.005) grams of ground
hops directly into a dry 100 ml beaker.Use a dry 50 ml volumetric pipet to add exactly 50 ml of toluene to the beaker
(Note: toluene eats plastic weighing boats)Place a magnetic stir bar in the bottom of the beaker and cover with a watch
glass. Stir the toluene/hops mixture for 30 minutes.Let settle for 10 minutes (Do NOT let sit for more than 1 hour, the sample will
degrade)Use a pipetman to remove 50 ìl aliquot and place in a 25 ml volumetric.Fill the volumetric to the line with the Methanolic NaOH solution.
Prepare 2 volumetrics for each hops sample
Preparation of a BlankPipet 50 ul of toluene into a 25 ml volumetric flaskFill to line with methanolic NaOH
Acquisition of dataUsing the blank to zero the spectrophotometerObtain a spectrum for all samples between 520 and 270 nm.Record the absorbancies for all solutions at 355 nm, 325nm an 275 nm
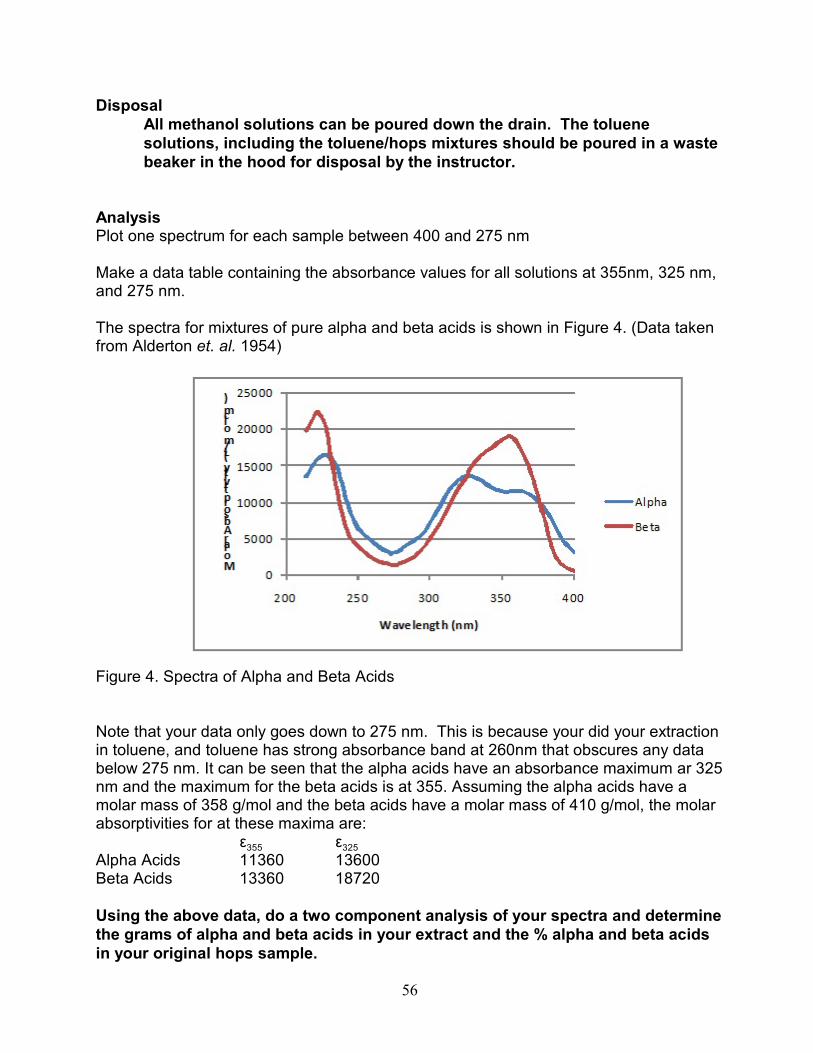
56
DisposalAll methanol solutions can be poured down the drain. The toluenesolutions, including the toluene/hops mixtures should be poured in a wastebeaker in the hood for disposal by the instructor.
AnalysisPlot one spectrum for each sample between 400 and 275 nm
Make a data table containing the absorbance values for all solutions at 355nm, 325 nm,and 275 nm.
The spectra for mixtures of pure alpha and beta acids is shown in Figure 4. (Data takenfrom Alderton et. al. 1954)
Figure 4. Spectra of Alpha and Beta Acids
Note that your data only goes down to 275 nm. This is because your did your extractionin toluene, and toluene has strong absorbance band at 260nm that obscures any databelow 275 nm. It can be seen that the alpha acids have an absorbance maximum ar 325nm and the maximum for the beta acids is at 355. Assuming the alpha acids have amolar mass of 358 g/mol and the beta acids have a molar mass of 410 g/mol, the molarabsorptivities for at these maxima are:
355 325å åAlpha Acids 11360 13600Beta Acids 13360 18720
Using the above data, do a two component analysis of your spectra and determinethe grams of alpha and beta acids in your extract and the % alpha and beta acidsin your original hops sample.
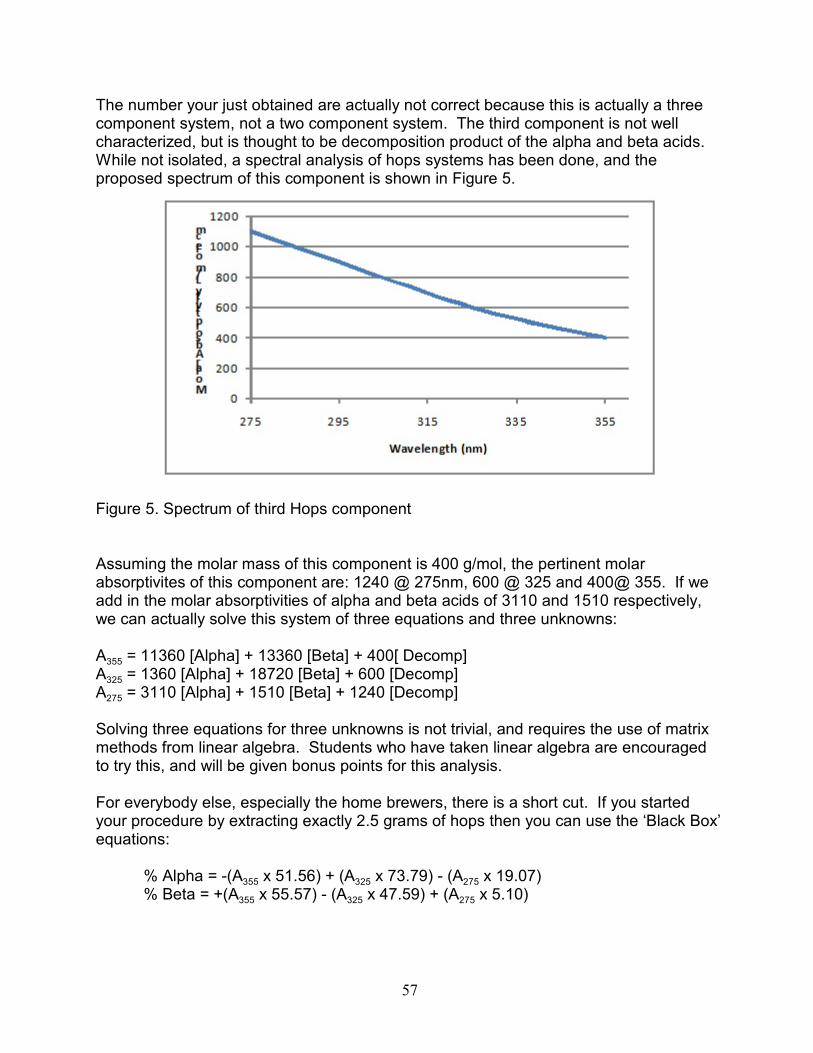
57
The number your just obtained are actually not correct because this is actually a threecomponent system, not a two component system. The third component is not wellcharacterized, but is thought to be decomposition product of the alpha and beta acids. While not isolated, a spectral analysis of hops systems has been done, and theproposed spectrum of this component is shown in Figure 5.
Figure 5. Spectrum of third Hops component
Assuming the molar mass of this component is 400 g/mol, the pertinent molarabsorptivites of this component are: 1240 @ 275nm, 600 @ 325 and 400@ 355. If weadd in the molar absorptivities of alpha and beta acids of 3110 and 1510 respectively,we can actually solve this system of three equations and three unknowns:
355A = 11360 [Alpha] + 13360 [Beta] + 400[ Decomp]
325A = 1360 [Alpha] + 18720 [Beta] + 600 [Decomp]
275A = 3110 [Alpha] + 1510 [Beta] + 1240 [Decomp]
Solving three equations for three unknowns is not trivial, and requires the use of matrixmethods from linear algebra. Students who have taken linear algebra are encouragedto try this, and will be given bonus points for this analysis.
For everybody else, especially the home brewers, there is a short cut. If you startedyour procedure by extracting exactly 2.5 grams of hops then you can use the ‘Black Box’equations:
355 325 275% Alpha = -(A x 51.56) + (A x 73.79) - (A x 19.07)
355 325 275% Beta = +(A x 55.57) - (A x 47.59) + (A x 5.10)
58
These equations were found by solving the three component system, and then makingcoefficients from the solution that could be used to find the % Alpha and % Beta directlyfrom the absorbance values. Calculate your %Alpha and % Beta using theseequations. How to they compare to your two component analysis?
Since the decomposition product has an absorbance at 325 where both Alpha and Betaacids have a minimum, if your sample has a strong absorbance at this wavelength thiswould indicate that your sample had started to decompose. This is the basis for ameasure of hops quality called the HSI or Hops Storage Index.
Calculate the HSI for your sample.
In ordinary usage, the HSI is simply a number that can be used to tell the quality of thehops. If your hops is fresh, or it has been properly stored, the HSI should be .28 +/- .02. As the HSI gets > .3, this indicates the build up of the decomposition product, andpoorer quality hops.
It can be used in a more analytical way to determine the amount of hops decomposition. Likens et. al. (1970) has shown that there is a linear relationship between the log of theHSI parameter and % of alpha acid that has been lost. This relationship is found in theequation:
% Hops acid lost = 61.8 + 102 log(HSI)
Use this equation to calculate the % of hops acid that have been lost in yoursample.
References
Alderton, G., Bailey, G.F., Lewis, C.J., and Stitt,F. Anal. Chem 26:983-992 (1954).
Likens, S.T. & Nickerson, G.B., A.S.B.C Proc. 68-74 (1970).