Embed Size (px)
Citation preview
151
University of Virginia Physics Department Modified from P. Laws, D. Sokoloff, R. Thornton PHYS 2419, Fall 2009
Name ________________________ Date ____________ Partners_______________________________
Lab 9 –AC FILTERS AND RESONANCE
OBJECTIVES
• To understand the design of capacitive and inductive filters
• To understand resonance in circuits driven by AC signals
OVERVIEW
In a previous lab, you explored the relationship between impedance (the AC equivalent of resistance) and frequency for a resistor, capacitor, and inductor. These relationships are very important to people designing electronic equipment. You can predict many of the basic characteristics of simple AC circuits based on what you have learned in previous labs.
Recall that we said that it can be shown that any periodic signal can be represented as a sum of weighted sines and cosines (known as a Fourier series). It can also be shown that the response of a circuit containing resistors, capacitors, and inductors (an “RLC” circuit) to such a signal is simply the sum of the responses of the circuit to each sine and cosine term with the same weights.
Recall further that if there is a current of the form ( )max( ) sinI t I tω= (1)
flowing through a circuit containing resistors, capacitors and/or inductors, then the voltage across the circuit will be of the form
( ) ( )max sinV t I Z tω ϕ= + . (2)
Z is called the impedance (and has units of resistance, Ohms) and φ is called the phase shift (and has units of angle, radians). The peak voltage will be given by
max maxV I Z= . (3)
152 Lab 9 - AC Filters & Resonance
University of Virginia Physics Department Modified from P. Laws, D. Sokoloff, R. Thornton PHYS 2419, Fall 2009
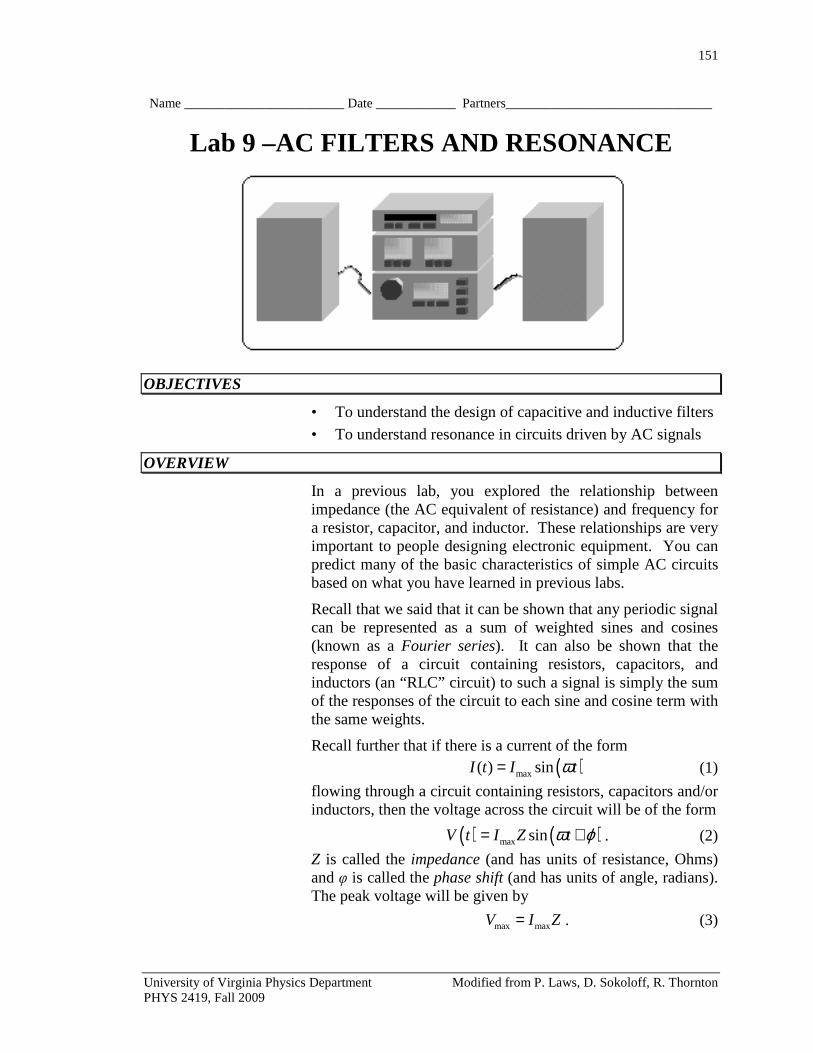
Figure 1 shows the relationship between V and I for an example phase shift of +20°. We say that V leads I in the sense that the voltage rises through zero a time t∆ before the current. When the voltage rises through zero after the current, we say that it lags the current.
Figure 1
The relationship between ϕ and t∆ is given by
2 360t
f tT
ϕ π ∆ = = °× ∆
(4)
where T is the period and f is the frequency.
For a resistor, RZ R= and there is no phase shift ( 0Rϕ = ). For
a capacitor, 1C CZ X Cω= = and 90Cϕ = − ° while for an
inductor, L LZ X Lω= = and 90Lϕ = + ° . In other words:
sin( )R maxV I R tω= (5)
cos( )C max CV I X tω= − (6)
and cos( )L max LV I X tω= (7)
XC is called the capacitive reactance and XL is called the inductive reactance.
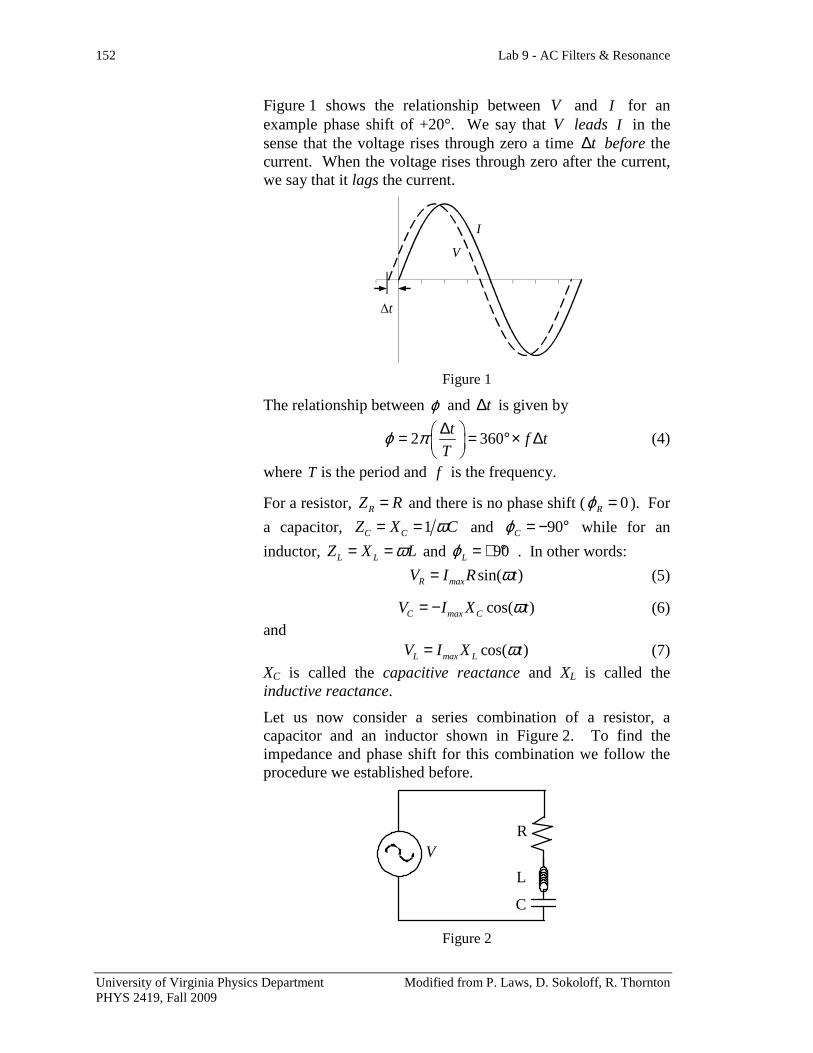
Let us now consider a series combination of a resistor, a capacitor and an inductor shown in Figure 2. To find the impedance and phase shift for this combination we follow the procedure we established before.
V
L
C
R
Figure 2
∆t
I
V
Lab 9 - AC Filters & Resonance 153
University of Virginia Physics Department Modified from P. Laws, D. Sokoloff, R. Thornton PHYS 2419, Fall 2009
From Kirchhoff’s loop rule we get:
R L CV V V V= + + (8)
Adding in Kirchhoff’s junction rule and Equations (5), (6), and (7) yields ( ) ( ) ( ) ( )sin sin cosmax RLC max L CV t I R t X X tω ϕ ω ω+ = + −
Once again using a trigonometric identity1 and equating the coefficients of ( )sin tω and ( )cos tω , we get
( )cosmax RLC maxV I Rφ =
and ( ) ( )sinmax RLC max L CV I X Xφ = −
Hence the phase shift is given by
( )tan L CRLC
X X
Rϕ −= (9)
and the impedance of this series combination of a resistor, an inductor, and a capacitor is given by:
( )22RLC max max L CZ V I R X X= = + − (10)
The magnitudes of the voltages across the components are then
,R max max maxRLC
RV I R V
Z= = (11)
,L
L max max L maxRLC
XV I X V
Z= = (12)
and
,C
C max max C maxRLC
XV I X V
Z= = (13)
Explicitly considering the frequency dependence, we see that
( )
, 22 1R max max
RV V
R L Cω ω=
+ − (14)
( )
, 22 1L max max
LV V
R L C
ω
ω ω=
+ − (15)
and
1 sin( ) sin( ) cos( ) cos( )sin( )α β α β α β+ = +
154 Lab 9 - AC Filters & Resonance
University of Virginia Physics Department Modified from P. Laws, D. Sokoloff, R. Thornton PHYS 2419, Fall 2009
( )
, 22
1
1C max max
CV V
R L C
ω
ω ω=
+ − (16)
This system has a lot in common with the forced mechanical oscillator that we studied in the first semester. Recall that the equation of motion was
F ma bv kx mx bx kx= + + = + +ɺɺ ɺ (17)
Similarly, Equation (8) can be written as
1
V Lq Rq qC
= + +ɺɺ ɺ (18)
We see that charge separation plays the role of displacement, current the role of velocity, inductance the role of mass (inertia), capacitance (its inverse, actually) the role of the spring constant, and resistance the role of friction. The driving voltage plays the role of the external force.
As we saw in the mechanical case, this electrical system displays the property of resonance. It is clear that when the capacitive and inductive reactances are equal, the impedance is at its minimum value, R . Hence, the current is at a maximum and there is no phase shift between the current and the driving voltage.
Denoting the resonant frequency as LCω and the common
reactance of the capacitor and inductor at resonance as LCX ,
we see that, at resonance
( ) ( )LC C LC L LCX X Xω ω≡ =
so
1LC LCω = (19)
and
LCX L C= (20)
At resonance the magnitude of the voltage across the capacitor is the same as that across the inductor (they are still 180° out of phase with each other and ±90° out of phase with the voltage across the resistor) and is given by
( ) ( ), ,LC
C max LC L max LC max
XV V V
Rω ω= = (21)

Lab 9 - AC Filters & Resonance 155
University of Virginia Physics Department Modified from P. Laws, D. Sokoloff, R. Thornton PHYS 2419, Fall 2009
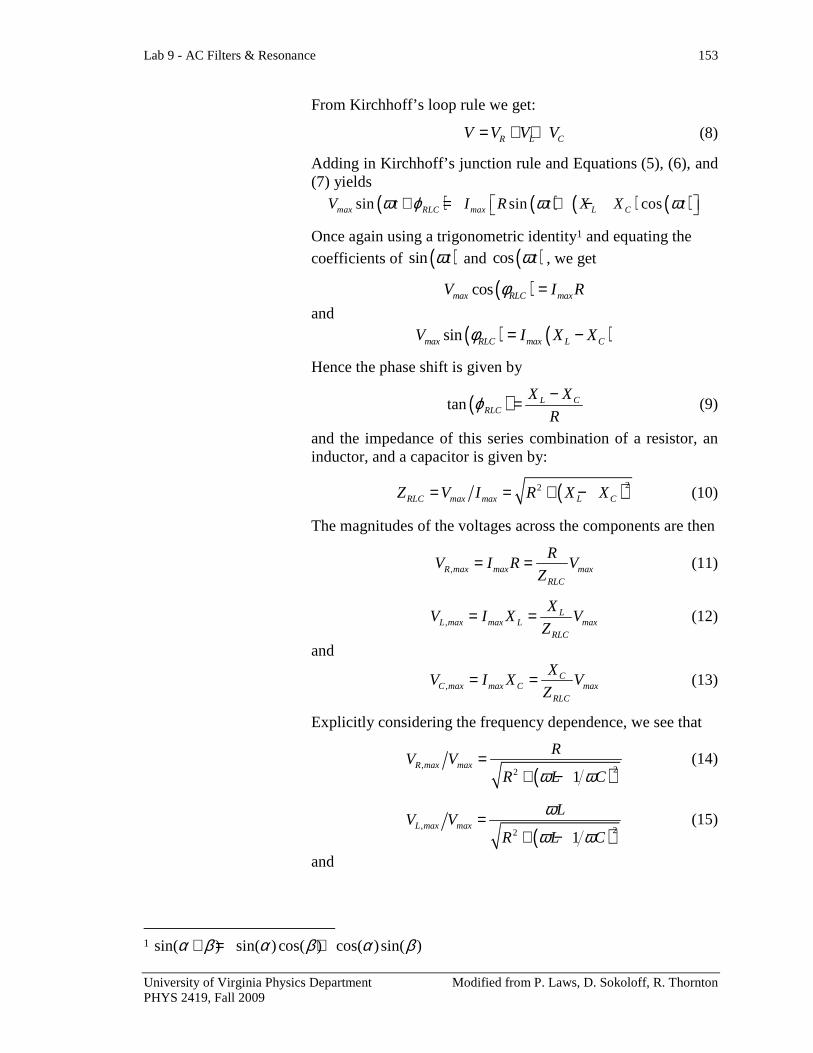
In analogy with the mechanical case, we call the ratio of the amplitude of the voltage across the capacitor (which is proportional to q , our “displacement”) at resonance to the driving amplitude the resonant amplification, which we denote as Q, ( ),C max LC maxQ V Vω≡ (22)
Hence,
LCQ X R L C R= = (23)
Figure 3 (below) shows the voltage across a capacitor (normalized to the driving voltage) as a function of frequency for various values of Q .
Figure 3
In this lab you will continue your investigation of the behavior of resistors, capacitors and inductors in the presence of AC signals. In Investigation 1, you will see how capacitors and inductors can act as “filters”. More precisely, you will see how these elements can be used to suppress the voltage of certain frequency ranges of AC signals, while leaving other signals relatively unchanged.
In Investigation 2, you will explore the relationship between peak current and peak voltage for a series circuit composed of a resistor, inductor, and capacitor. You will also explore the phase difference between the current and the voltage. This circuit is an example of a “resonant circuit”. The phenomenon of resonance is a central concept underlying the tuning of a radio or television to a particular frequency.
INVESTIGATION 1: INTRODUCTION TO AC FILTERS
The purpose of this lab is for you to create circuits that filter out AC signals with frequencies outside the range of interest.
0
5
10
15
20
0.0 0.5 1.0 1.5 2.0
VC
,max
/Vm
ax
f/f0
Q=20
Q=10
Q=5
Q=2
156 Lab 9 - AC Filters & Resonance
University of Virginia Physics Department Modified from P. Laws, D. Sokoloff, R. Thornton PHYS 2419, Fall 2009
In the context of these activities, a filter is a circuit that attenuates the voltage of some range of signal frequencies, while leaving other frequency ranges relatively unaffected.
You will need the following materials:
• Voltage probes • Multimeter
• Amplifier • test leads
• Two 1 MΩ resistors • 1 kΩ resistor
• 800 mH inductor • 820 nF capacitor
• External signal generator
Activity 1-1: Capacitors as Filters
In this activity, you will investigate how a circuit containing a resistor, capacitor, and signal generator responds to signals at various frequencies.
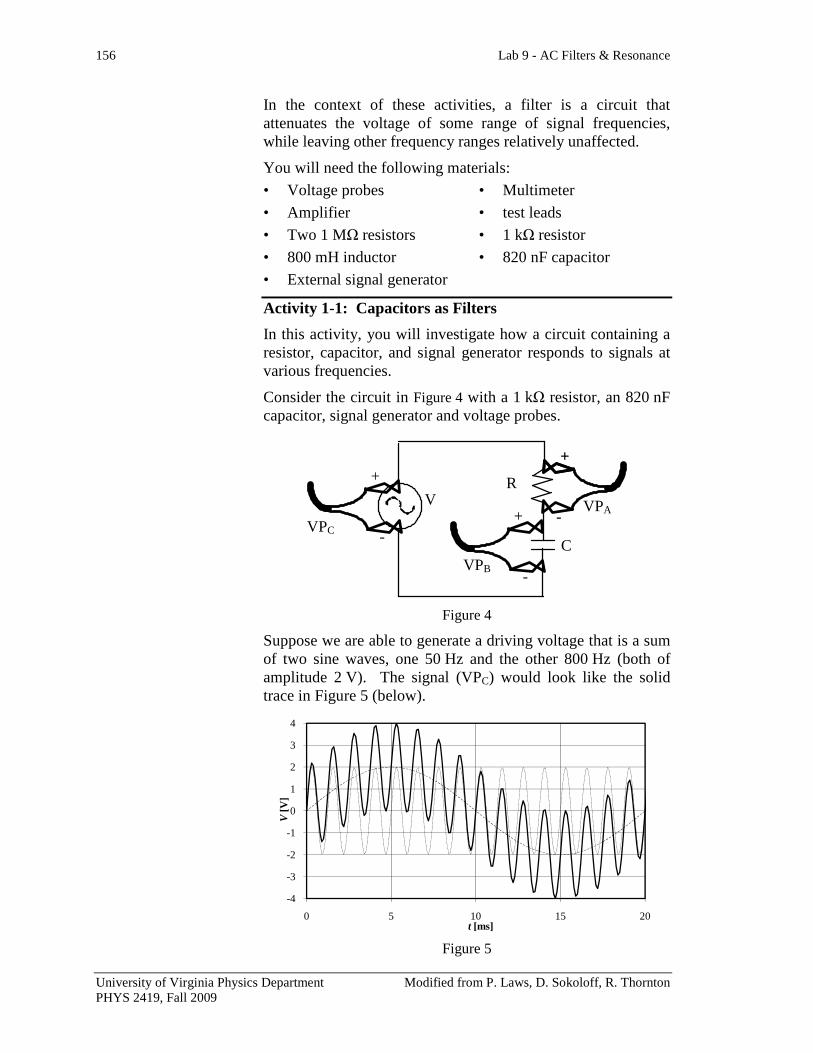
Consider the circuit in Figure 4 with a 1 kΩ resistor, an 820 nF capacitor, signal generator and voltage probes.
VPA V
C
R
+
-
+
-
+
VPB
-
+
VPC
Figure 4
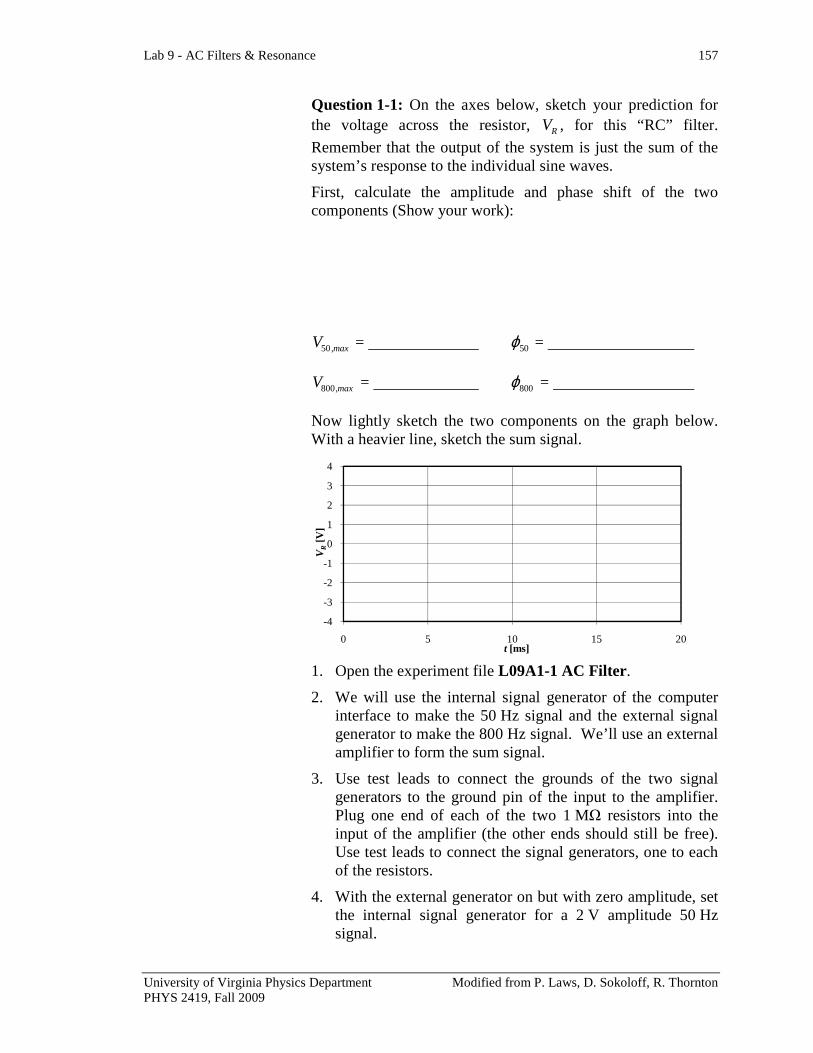
Suppose we are able to generate a driving voltage that is a sum of two sine waves, one 50 Hz and the other 800 Hz (both of amplitude 2 V). The signal (VPC) would look like the solid trace in Figure 5 (below).
Figure 5
-4
-3
-2
-1
0
1
2
3
4
0 5 10 15 20
V[V
]
t [ms]
Lab 9 - AC Filters & Resonance 157
University of Virginia Physics Department Modified from P. Laws, D. Sokoloff, R. Thornton PHYS 2419, Fall 2009
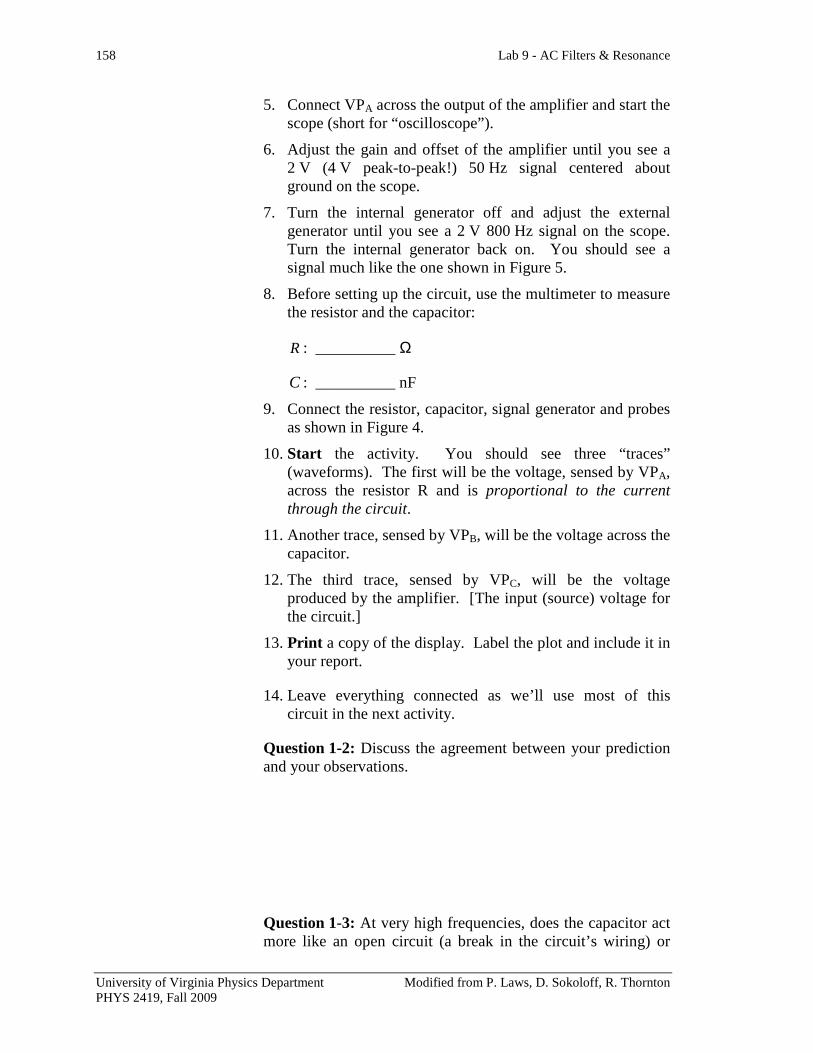
Question 1-1: On the axes below, sketch your prediction for the voltage across the resistor, RV , for this “RC” filter.
Remember that the output of the system is just the sum of the system’s response to the individual sine waves.
First, calculate the amplitude and phase shift of the two components (Show your work):
50,maxV = 50ϕ =
800,maxV = 800ϕ =
Now lightly sketch the two components on the graph below. With a heavier line, sketch the sum signal.
1. Open the experiment file L09A1-1 AC Filter .
2. We will use the internal signal generator of the computer interface to make the 50 Hz signal and the external signal generator to make the 800 Hz signal. We’ll use an external amplifier to form the sum signal.
3. Use test leads to connect the grounds of the two signal generators to the ground pin of the input to the amplifier. Plug one end of each of the two 1 MΩ resistors into the input of the amplifier (the other ends should still be free). Use test leads to connect the signal generators, one to each of the resistors.
4. With the external generator on but with zero amplitude, set the internal signal generator for a 2 V amplitude 50 Hz signal.
-4
-3
-2
-1
0
1
2
3
4
0 5 10 15 20
VR
[V]
t [ms]
158 Lab 9 - AC Filters & Resonance
University of Virginia Physics Department Modified from P. Laws, D. Sokoloff, R. Thornton PHYS 2419, Fall 2009
5. Connect VPA across the output of the amplifier and start the scope (short for “oscilloscope”).
6. Adjust the gain and offset of the amplifier until you see a 2 V (4 V peak-to-peak!) 50 Hz signal centered about ground on the scope.
7. Turn the internal generator off and adjust the external generator until you see a 2 V 800 Hz signal on the scope. Turn the internal generator back on. You should see a signal much like the one shown in Figure 5.
8. Before setting up the circuit, use the multimeter to measure the resistor and the capacitor:
R : __________ Ω
C : __________ nF
9. Connect the resistor, capacitor, signal generator and probes as shown in Figure 4.
10. Start the activity. You should see three “traces” (waveforms). The first will be the voltage, sensed by VPA, across the resistor R and is proportional to the current through the circuit.
11. Another trace, sensed by VPB, will be the voltage across the capacitor.
12. The third trace, sensed by VPC, will be the voltage produced by the amplifier. [The input (source) voltage for the circuit.]
13. Print a copy of the display. Label the plot and include it in your report.
14. Leave everything connected as we’ll use most of this circuit in the next activity.
Question 1-2: Discuss the agreement between your prediction and your observations.
Question 1-3: At very high frequencies, does the capacitor act more like an open circuit (a break in the circuit’s wiring) or
Lab 9 - AC Filters & Resonance 159
University of Virginia Physics Department Modified from P. Laws, D. Sokoloff, R. Thornton PHYS 2419, Fall 2009
more like a short circuit (a connection with very little resistance)? Justify your answer.
Question 1-4: At very low frequencies, does the capacitor act more like an open circuit (a break in the circuit’s wiring) or more like a short circuit (a connection with very little resistance)? Justify your answer.
Comment: You should have observed that the high frequency component of the signal was attenuated less by the capacitor than was the low frequency component. This type of circuit is an example of a “high-pass” circuit or filter.
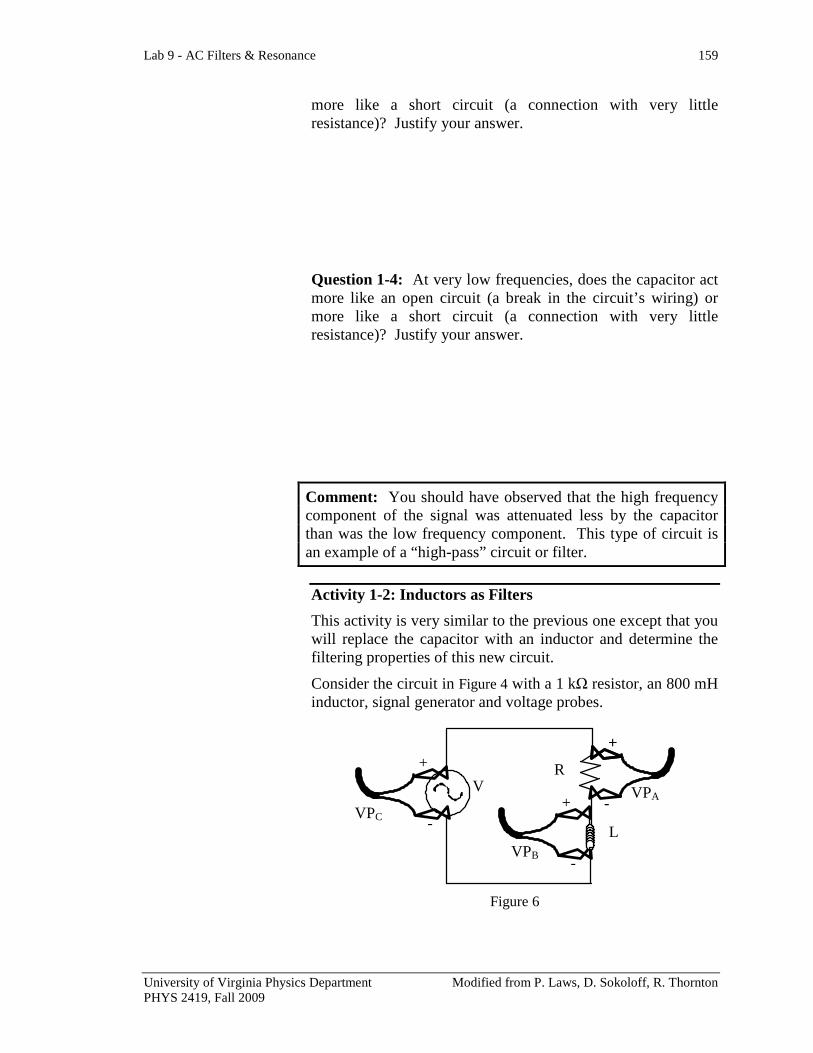
Activity 1-2: Inductors as Filters
This activity is very similar to the previous one except that you will replace the capacitor with an inductor and determine the filtering properties of this new circuit.
Consider the circuit in Figure 4 with a 1 kΩ resistor, an 800 mH inductor, signal generator and voltage probes.
VPA V
L
R
+
-
+
-
+
VPB
-
+
VPC
Figure 6
160 Lab 9 - AC Filters & Resonance
University of Virginia Physics Department Modified from P. Laws, D. Sokoloff, R. Thornton PHYS 2419, Fall 2009
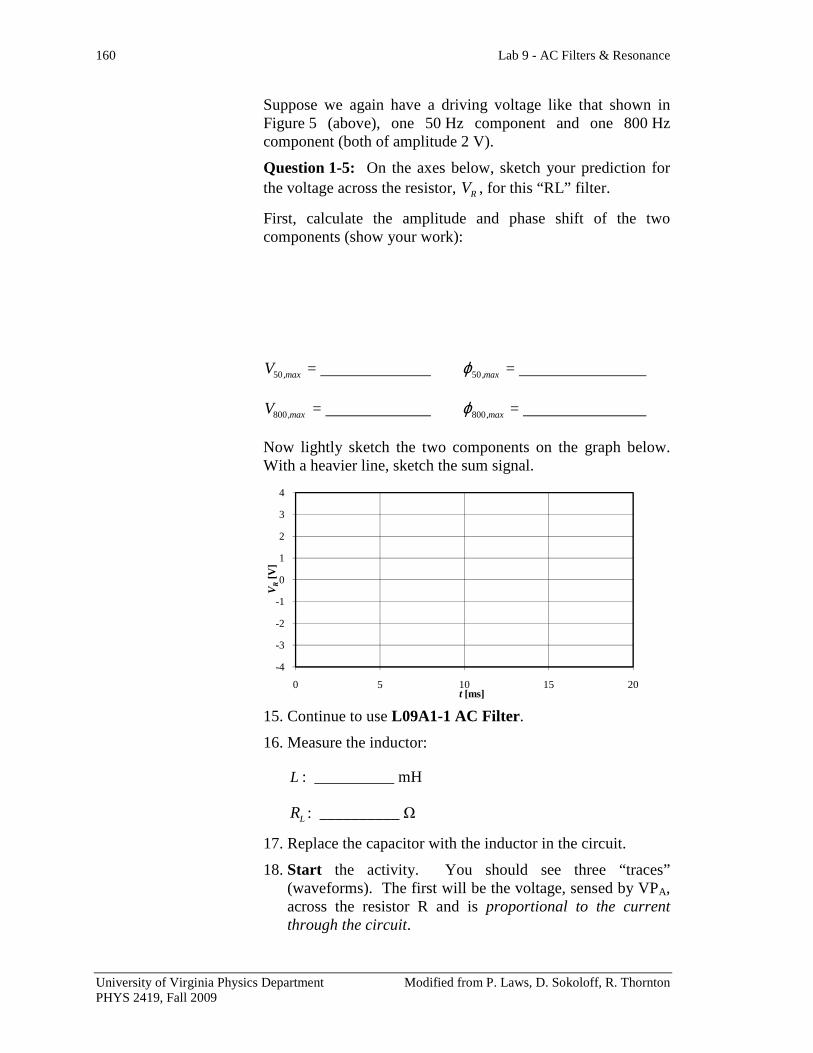
Suppose we again have a driving voltage like that shown in Figure 5 (above), one 50 Hz component and one 800 Hz component (both of amplitude 2 V).
Question 1-5: On the axes below, sketch your prediction for the voltage across the resistor, RV , for this “RL” filter.
First, calculate the amplitude and phase shift of the two components (show your work):
50,maxV = 50,maxϕ =
800,maxV = 800,maxϕ =
Now lightly sketch the two components on the graph below. With a heavier line, sketch the sum signal.
15. Continue to use L09A1-1 AC Filter .
16. Measure the inductor:
L : __________ mH
LR : __________ Ω
17. Replace the capacitor with the inductor in the circuit.
18. Start the activity. You should see three “traces” (waveforms). The first will be the voltage, sensed by VPA, across the resistor R and is proportional to the current through the circuit.
-4
-3
-2
-1
0
1
2
3
4
0 5 10 15 20
VR
[V]
t [ms]
Lab 9 - AC Filters & Resonance 161
University of Virginia Physics Department Modified from P. Laws, D. Sokoloff, R. Thornton PHYS 2419, Fall 2009
19. Another trace, sensed by VPB, will be the voltage across the inductor.
20. The third trace, sensed by VPC, will be the voltage produced by the amplifier. [The input (source) voltage for the circuit.]
21. Print a copy of the display. Label the plot and include it in your report.
Question 1-6: Discuss the agreement between your prediction and your observations.
Question 1-7: At very high frequencies, does the inductor act more like an open circuit (a break in the circuit’s wiring) or more like a short circuit (a connection with very little resistance)? Justify your answer.
Question 1-8: At very low frequencies, does the inductor act more like an open circuit (a break in the circuit’s wiring) or more like a short circuit (a connection with very little resistance)? Justify your answer.
Comment: You should have observed that the low frequency component of the signal was attenuated less by the inductor than was the high frequency component. This type of circuit is an example of a “low-pass” circuit or filter.
162 Lab 9 - AC Filters & Resonance
University of Virginia Physics Department Modified from P. Laws, D. Sokoloff, R. Thornton PHYS 2419, Fall 2009
Digression: Application to Audio Speaker Design
Music is sound waves composed of many different frequencies (pitches) superimposed on each other all at once, and constantly changing. Low notes correspond to sound waves with a low frequency. High notes correspond to sound waves with a high frequency. A microphone is a device that can detect sound waves over a wide range of audible frequencies and convert them to AC signals. Thus, the signal from a microphone generally consists of many AC frequencies superimposed on each other all at once. [These signals can then be encoded and recorded on a storage device, such as a CD.]
Some of the ideas you have studied in this investigation are readily applied to the design of audio speakers. Most audio speakers have at least two separate “drivers” from which sound emanates. Generally, a small driver, or tweeter, generates the high frequency sound waves, and a large driver, or woofer, generates the low frequency sound waves.
Speaker designers use drivers of different size because small drivers are generally better suited for playing the high notes and, conversely, large drivers handle the low notes better. To best utilize the properties of the different sized drivers, speaker designers use capacitive and inductive filter circuits to send high frequency signals to the small driver and low frequency signals to the large driver.
Question 1-9: Would you use an inductor or a capacitor in series with a tweeter? In series with a woofer? Justify your answer.
INVESTIGATION 2: THE SERIES RLC RESONANT (TUNER) CIRCUIT
In this investigation, you will use your knowledge of the behavior of resistors, capacitors and inductors in circuits driven by various AC signal frequencies to predict and then observe the behavior of a circuit with a resistor, capacitor, and inductor connected in series.
Lab 9 - AC Filters & Resonance 163
University of Virginia Physics Department Modified from P. Laws, D. Sokoloff, R. Thornton PHYS 2419, Fall 2009
The RLC series circuit you will study in this investigation exhibits a “resonance” behavior that is useful for many familiar applications such a tuner in a radio receiver.
You will need the following materials:
• Voltage probes • Multimeter
• 510 Ω resistor • test leads
• 800 mH inductor • 820 nF capacitor
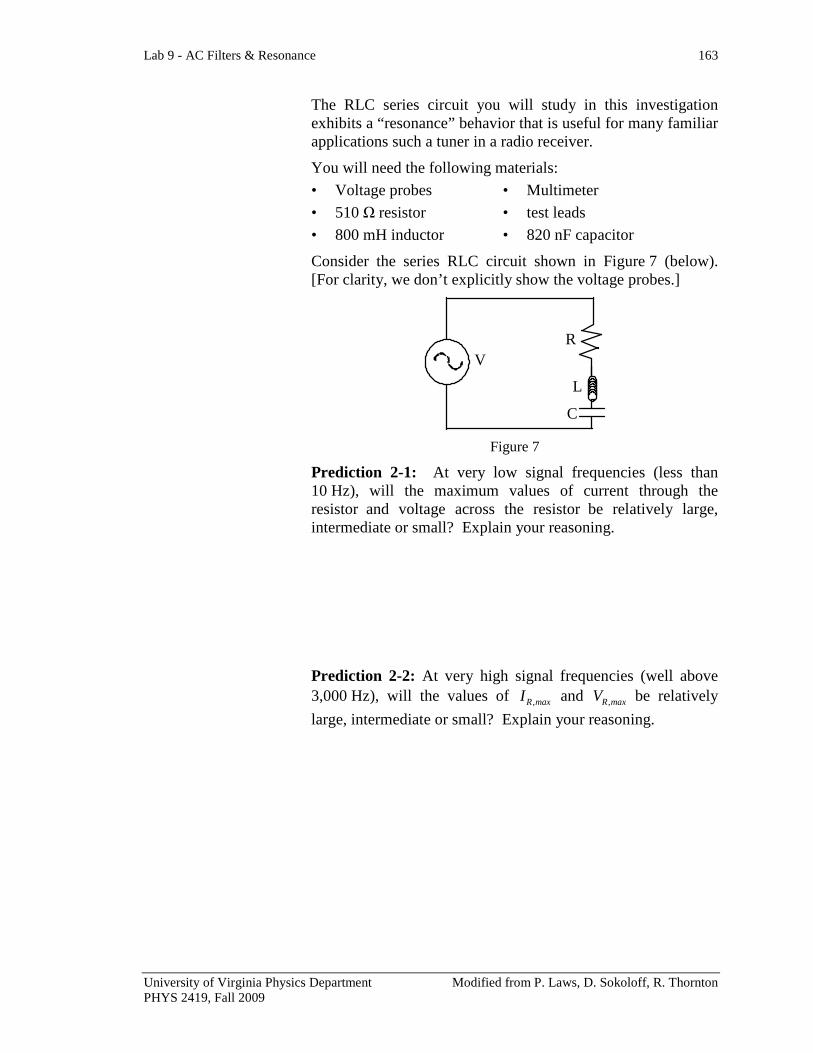
Consider the series RLC circuit shown in Figure 7 (below). [For clarity, we don’t explicitly show the voltage probes.]
V
L
C
R
Figure 7
Prediction 2-1: At very low signal frequencies (less than 10 Hz), will the maximum values of current through the resistor and voltage across the resistor be relatively large, intermediate or small? Explain your reasoning.
Prediction 2-2: At very high signal frequencies (well above 3,000 Hz), will the values of ,R maxI and ,R maxV be relatively
large, intermediate or small? Explain your reasoning.
164 Lab 9 - AC Filters & Resonance
University of Virginia Physics Department Modified from P. Laws, D. Sokoloff, R. Thornton PHYS 2419, Fall 2009
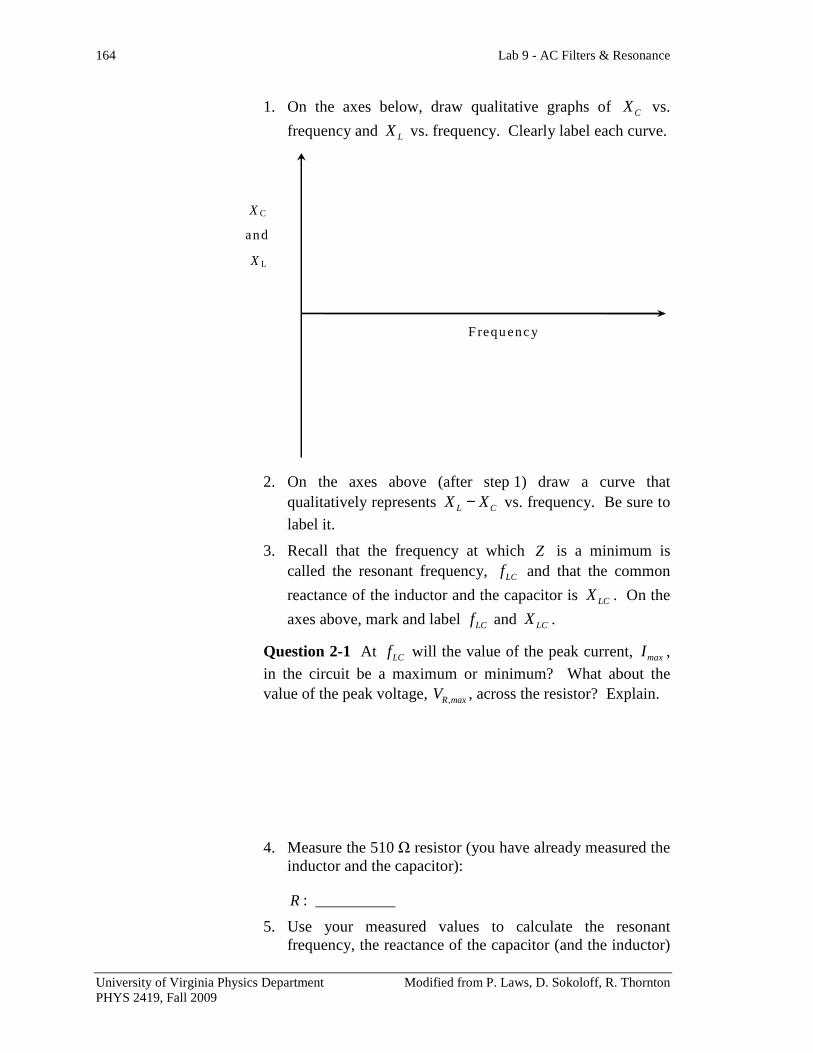
1. On the axes below, draw qualitative graphs of CX vs.
frequency and LX vs. frequency. Clearly label each curve.
F requency
X L
X C
and
2. On the axes above (after step 1) draw a curve that qualitatively represents L CX X− vs. frequency. Be sure to
label it.
3. Recall that the frequency at which Z is a minimum is called the resonant frequency, LCf and that the common
reactance of the inductor and the capacitor is LCX . On the
axes above, mark and label LCf and LCX .
Question 2-1 At LCf will the value of the peak current, maxI ,
in the circuit be a maximum or minimum? What about the value of the peak voltage, ,R maxV , across the resistor? Explain.
4. Measure the 510 Ω resistor (you have already measured the
inductor and the capacitor):
R : __________
5. Use your measured values to calculate the resonant frequency, the reactance of the capacitor (and the inductor)
Lab 9 - AC Filters & Resonance 165
University of Virginia Physics Department Modified from P. Laws, D. Sokoloff, R. Thornton PHYS 2419, Fall 2009
at resonance, and the resonant amplification factor. Show your work. [Don’t forget the units!]
LCf : __________
LCX : __________
Q : __________
Activity 2-1: The Resonant Frequency of a Series RLC Circuit.
1. Open the experiment file L09A2-1 RLC Filter .
2. Connect the circuit with resistor, capacitor, inductor and signal generator shown in Figure 7. [Use the internal generator.]
3. Adjust the generator to make a 50 Hz signal with amplitude of 2 V.
4. Connect voltage probe VPA across the resistor, VPB across the inductor, and VPC across the capacitor.
5. Use the Smart Tool to determine the peak voltages ( ,R maxV ,
,L maxV , and ,C maxV ). Enter the data in the first row of
Table 2-1.
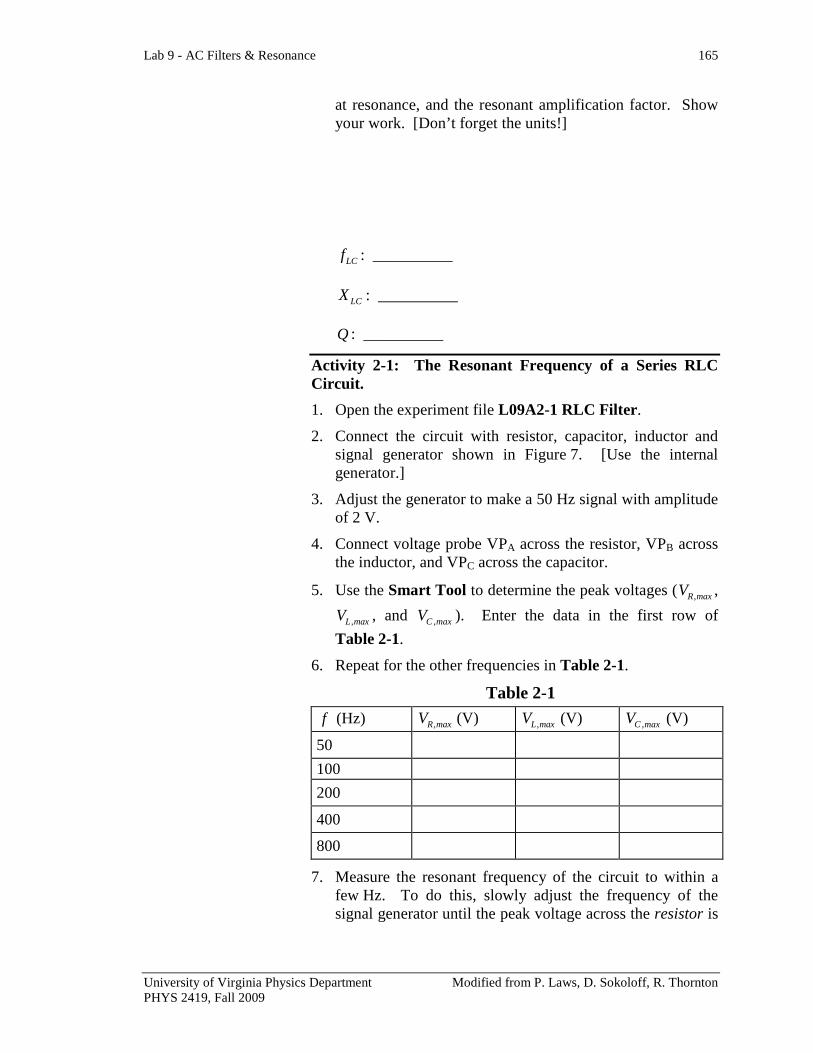
6. Repeat for the other frequencies in Table 2-1.
Table 2-1
f (Hz) ,R maxV (V) ,L maxV (V) ,C maxV (V)
50
100
200
400
800
7. Measure the resonant frequency of the circuit to within a few Hz. To do this, slowly adjust the frequency of the signal generator until the peak voltage across the resistor is
166 Lab 9 - AC Filters & Resonance
University of Virginia Physics Department Modified from P. Laws, D. Sokoloff, R. Thornton PHYS 2419, Fall 2009
maximal. [Use the results from Table 2-1 to help you locate the resonant frequency.]
,LC expf : __________
Question 2-2: Discuss the agreement between this experimental value for the resonant frequency and your calculated one.
8. Use the Smart Tool to determine the peak voltages at resonance.
maxV : __________
,R maxV : __________
,L maxV : __________
,C maxV : __________
Question 2-3: From these voltages, calculate Q and discuss the agreement between this experimental value and your calculated one.
Lab 9 - AC Filters & Resonance 167
University of Virginia Physics Department Modified from P. Laws, D. Sokoloff, R. Thornton PHYS 2419, Fall 2009
Question 2-4: Calculate your experimental value of LCX and
discuss the agreement between this value and your calculated one.
Prediction 2-5: What will we get for Q if we short out the resistor? Show your work.
9. Short out the resistor.
10. Measure Q . [You may have to lower the signal voltage to 0.5 V.] Show your work. Explicitly indicate what you had to measure.
Q : __________
Question 2-6: Discuss the agreement between this experimental value and your predicted one.
168 Lab 9 - AC Filters & Resonance
University of Virginia Physics Department Modified from P. Laws, D. Sokoloff, R. Thornton PHYS 2419, Fall 2009
Activity 2-2: Phase in an RLC Circuit
In previous labs, you investigated the phase relationship between the current and voltage in an AC circuit composed of a signal generator connected to one of the following circuit elements: a resistor, capacitor, or an inductor. You found that the current and voltage are in phase when the element connected to the signal generator is a resistor, the current leads the voltage with a capacitor, and the current lags the voltage with an inductor.
You also discovered that the reactances of capacitors and inductors change in predictable ways as the frequency of the signal changes, while the resistance of a resistor is constant – independent of the signal frequency. When considering relatively high or low signal frequencies in a simple RLC circuit, the circuit element (either capacitor or inductor) with the highest reactance is said to “dominate” because this element determines whether the current lags or leads the voltage. At resonance, the reactances of capacitor and inductor cancel, and do not contribute to the impedance of the circuit. The resistor then is said to dominate the circuit.
In this activity, you will explore the phase relationship between the applied voltage (signal generator voltage) and current in an RLC circuit.
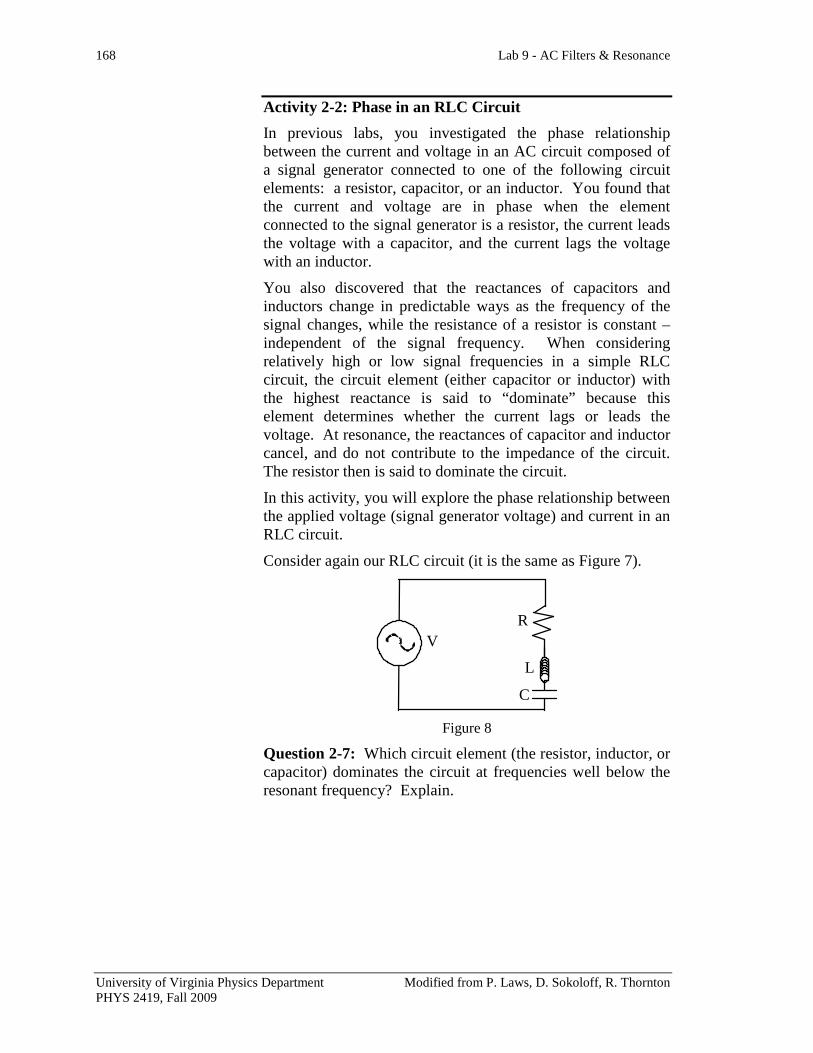
Consider again our RLC circuit (it is the same as Figure 7).
V
L
C
R
Figure 8
Question 2-7: Which circuit element (the resistor, inductor, or capacitor) dominates the circuit at frequencies well below the resonant frequency? Explain.
Lab 9 - AC Filters & Resonance 169
University of Virginia Physics Department Modified from P. Laws, D. Sokoloff, R. Thornton PHYS 2419, Fall 2009
Question 2-8: Which circuit element (the resistor, inductor, or capacitor) dominates the circuit at frequencies well above the resonant frequency? Explain.
Question 2-9a: In the circuit in Figure 8, will the current through the resistor always be in phase with the voltage across the resistor, regardless of the frequency? Explain your reasoning.
Question 2-9b: If your answer to Question 2-9a was no, then which will lead for frequencies below the resonant frequency (current or voltage)? Which will lead for frequencies above the resonant frequency (current or voltage)?
Question 2-10a: In the circuit in Figure 8, will the current through the resistor always be in phase with applied voltage from the signal generator? Explain your reasoning.
Question 2-10b: If your answer to Question 2-10a was no, then which will lead for frequencies below the resonant
170 Lab 9 - AC Filters & Resonance
University of Virginia Physics Department Modified from P. Laws, D. Sokoloff, R. Thornton PHYS 2419, Fall 2009
frequency (current or voltage)? Which will lead for frequencies above the resonant frequency (current or voltage)?
1. Continue to use L09A2-1 RLC Filter .
2. Reconnect the circuit shown in Figure 8. Connect voltage probe VPA across the resistor, VPB across the inductor, and VPC across the capacitor.
3. Start the scope and set the signal generator to a frequency 20 Hz below the resonant frequency you measured in Investigation 1, and set the amplitude of the signal to 2 V.
Question 2-11: Which leads – applied voltage, current or neither – when the AC signal frequency is lower than the resonant frequency? Discuss agreement with your prediction.
4. Set the signal generator to a frequency 20 Hz above the resonant frequency.
Question 2-12: Which leads – applied voltage, current or neither – when the AC signal frequency is higher than the resonant frequency? Discuss agreement with your prediction.
Lab 9 - AC Filters & Resonance 171
University of Virginia Physics Department Modified from P. Laws, D. Sokoloff, R. Thornton PHYS 2419, Fall 2009
Question 2-13: At resonance, what is the phase relationship between the current and the applied voltage?
5. Use this result to find the resonant frequency.
,LC phasef : __________
Question 2-14: Discuss how this experimental value compares with your calculated one.
Question 2-15: How does this experimental value for the resonant frequency compare with the one you determined by looking at the amplitude? Comment on the relative “sensitivities” of the two techniques.
172 Lab 9 - AC Filters & Resonance
University of Virginia Physics Department Modified from P. Laws, D. Sokoloff, R. Thornton PHYS 2419, Fall 2009