Embed Size (px)
Citation preview
Historyof GIS
Prof. Maria Antonia Brovelli
References:
• Milestones of GIS - The Geospatial resource portal – GIS development http://www.gisdevelopment.net/history/index.htm
• Milestones in the History of Thematic Cartography, Statistical Graphics and Data Visualization -http://www.math.yorku.ca/SCS/Gallery/milestone/
•History of GIS – unit 23 http://www.geog.ubc.ca/courses/klink/gis.notes/ncgia/u23.html
• The American Cartographer Vol 15(3), 1988
•Open source GIS historyhttp://wiki.osgeo.org/wiki/Open_Source_GIS_History
• Esri company history http://www.esri.com/company/about/history.html
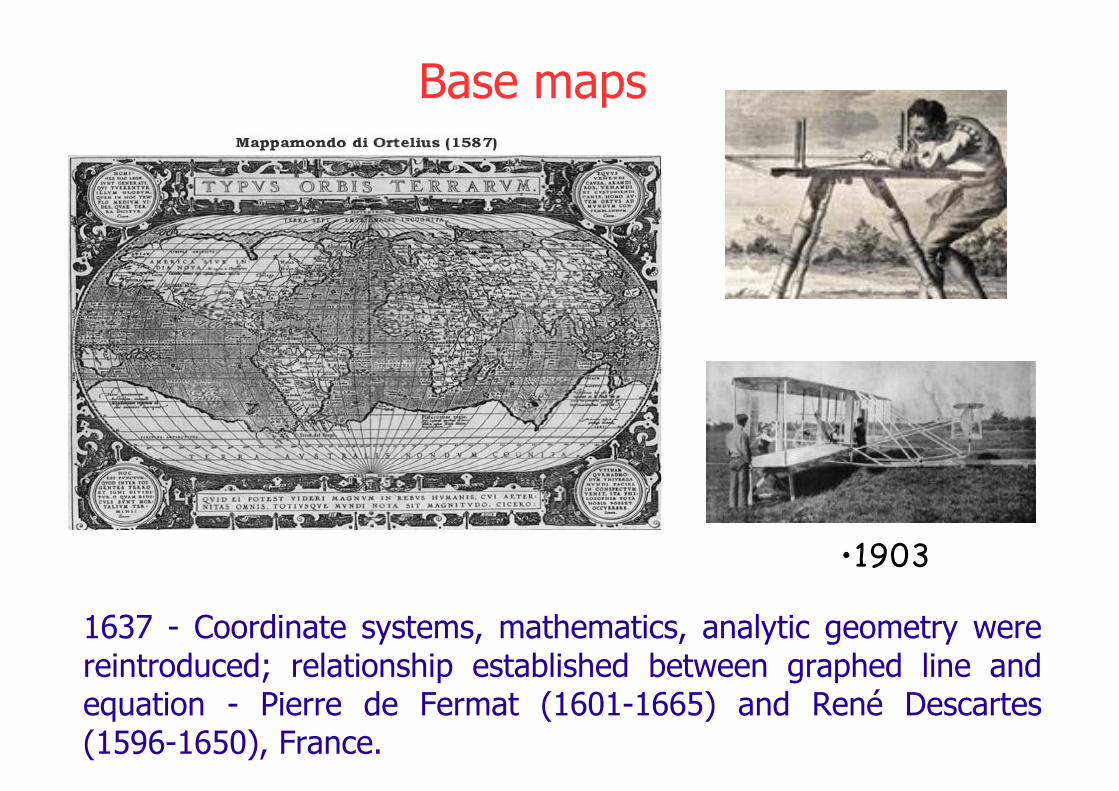
Base maps
•1903
1637 - Coordinate systems, mathematics, analytic geometry were reintroduced; relationship established between graphed line and equation - Pierre de Fermat (1601-1665) and René Descartes (1596-1650), France.
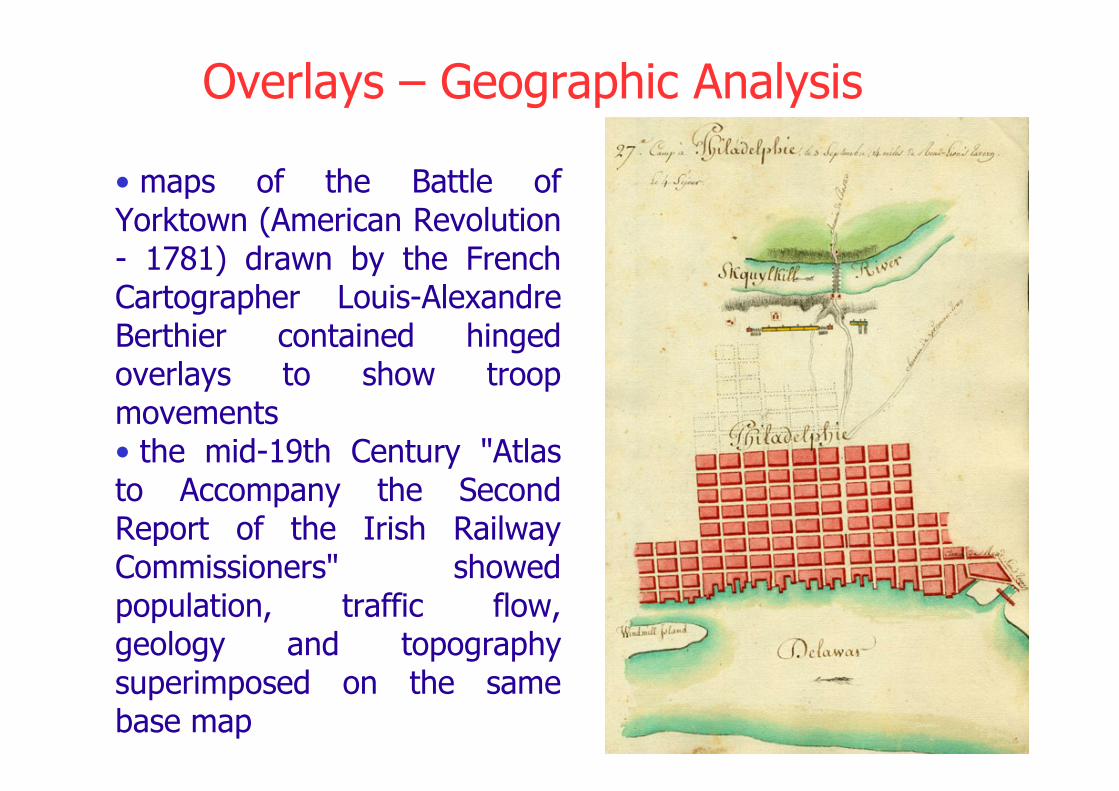
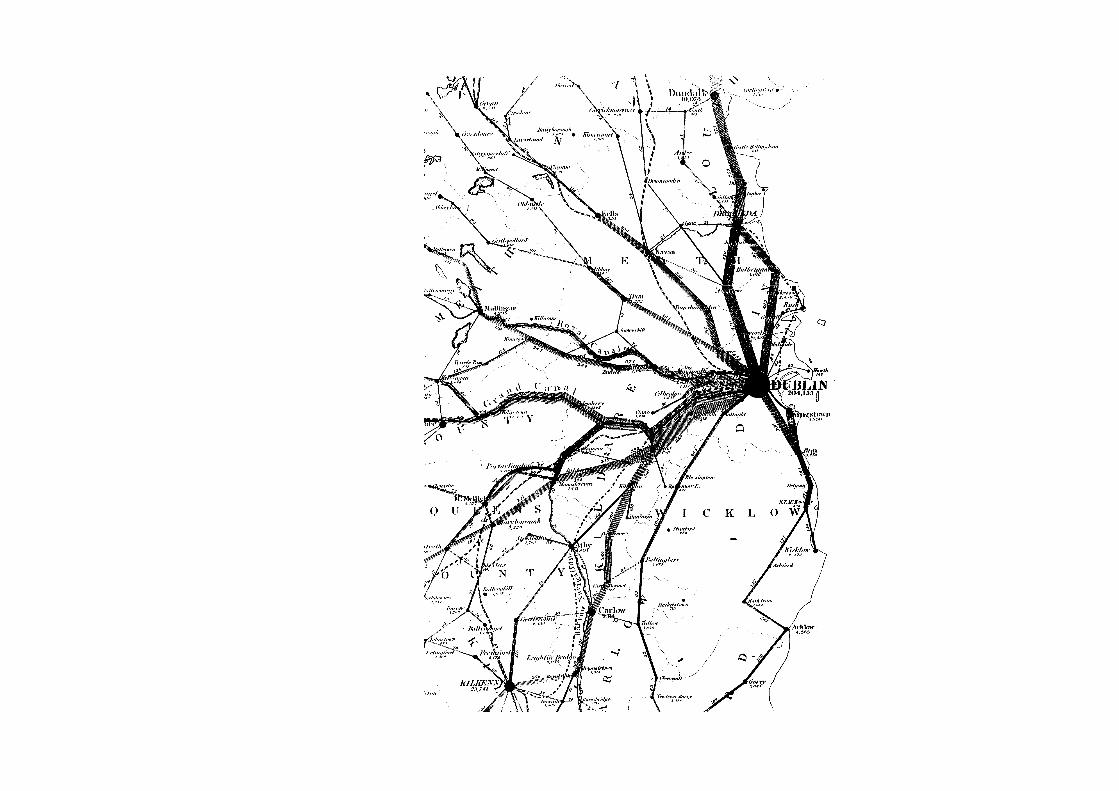
• maps of the Battle of Yorktown (American Revolution - 1781) drawn by the French Cartographer Louis-Alexandre Berthier contained hinged overlays to show troop movements• the mid-19th Century "Atlas to Accompany the Second Report of the Irish Railway Commissioners" showed population, traffic flow, geology and topography superimposed on the same base map
Overlays – Geographic Analysis
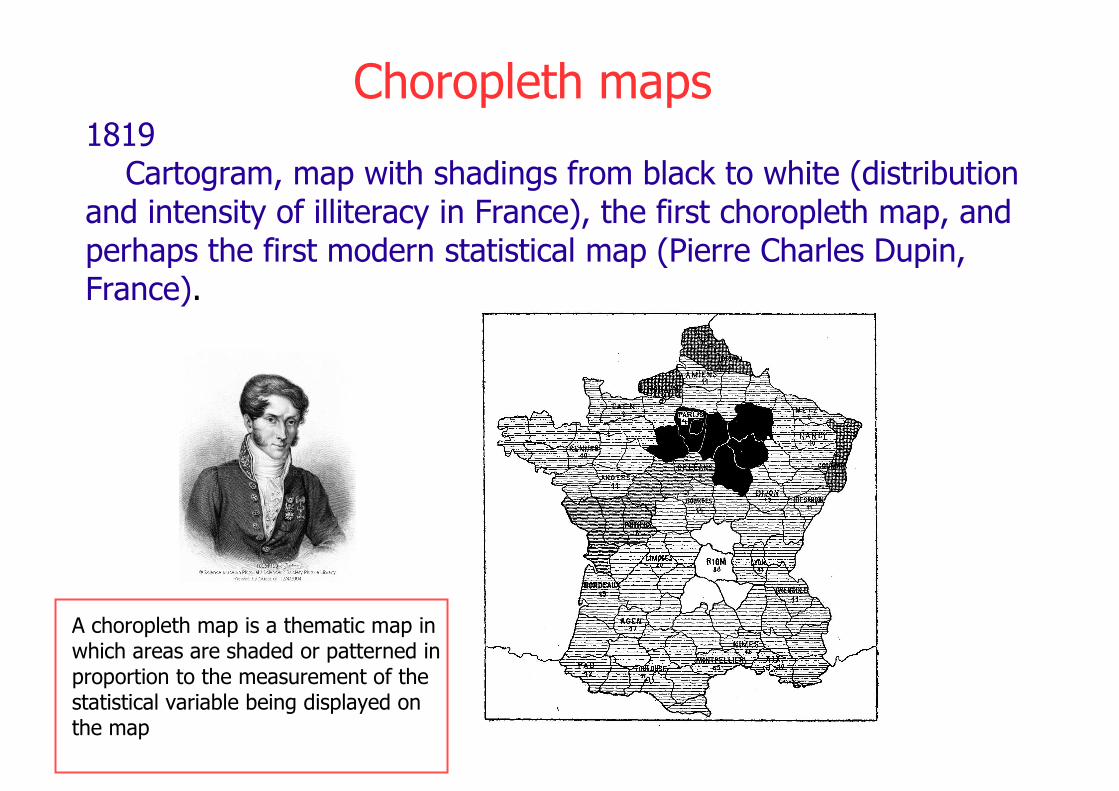
1819Cartogram, map with shadings from black to white (distribution
and intensity of illiteracy in France), the first choropleth map, and perhaps the first modern statistical map (Pierre Charles Dupin, France).
Choropleth maps
A choropleth map is a thematic map in which areas are shaded or patterned in proportion to the measurement of the statistical variable being displayed on the map
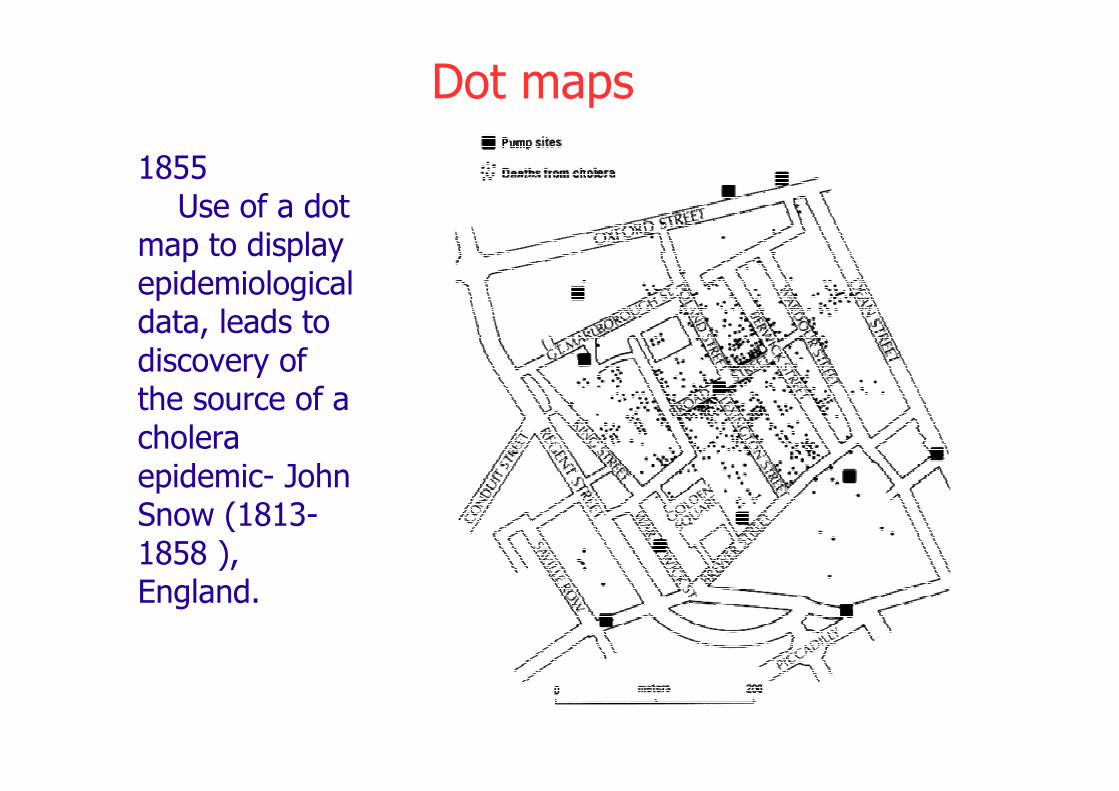
1855Use of a dot
map to display epidemiological data, leads to discovery of the source of a cholera epidemic- John Snow (1813-1858 ), England.
Dot maps
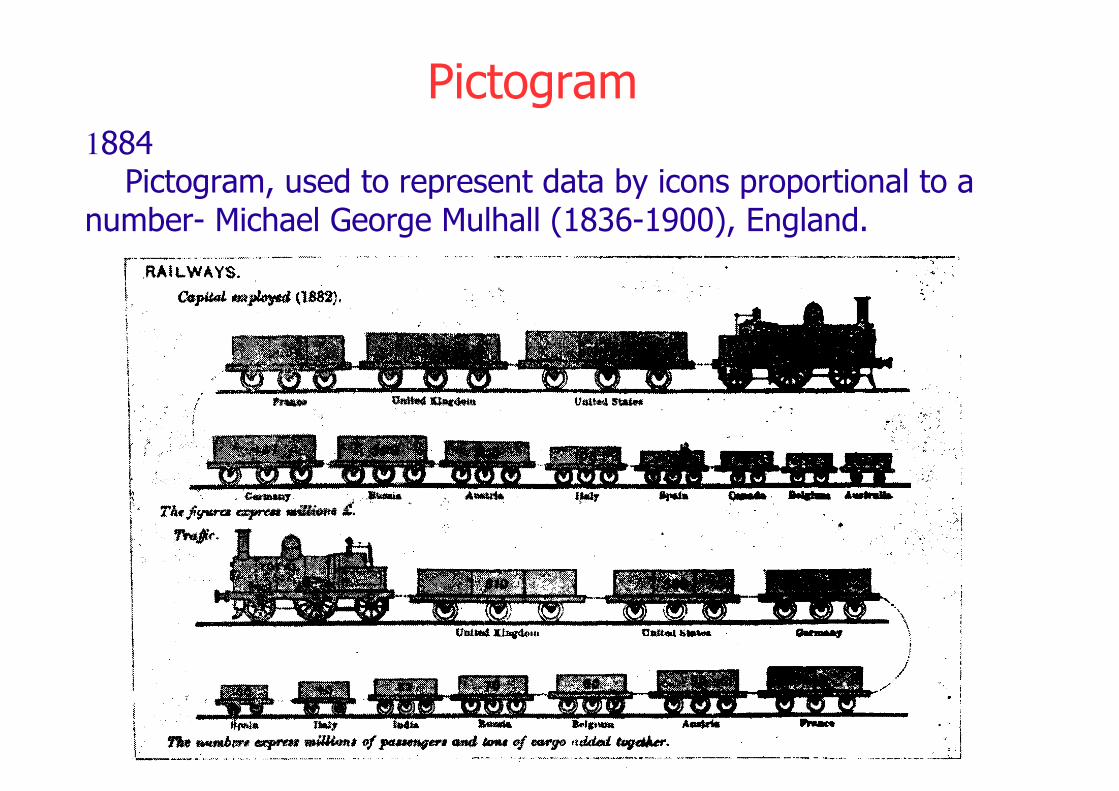
Pictogram1884
Pictogram, used to represent data by icons proportional to anumber- Michael George Mulhall (1836-1900), England.
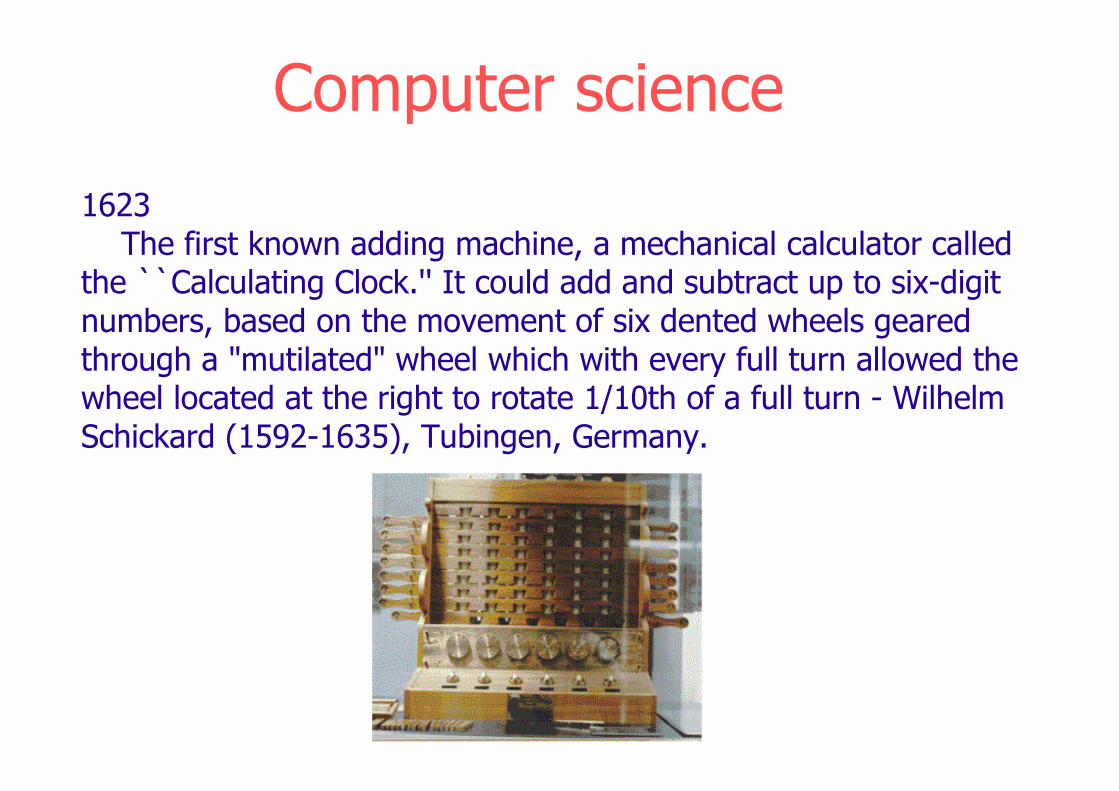
1623The first known adding machine, a mechanical calculator called
the ``Calculating Clock.'' It could add and subtract up to six-digit numbers, based on the movement of six dented wheels geared through a "mutilated" wheel which with every full turn allowed the wheel located at the right to rotate 1/10th of a full turn - Wilhelm Schickard (1592-1635), Tubingen, Germany.
Computer science
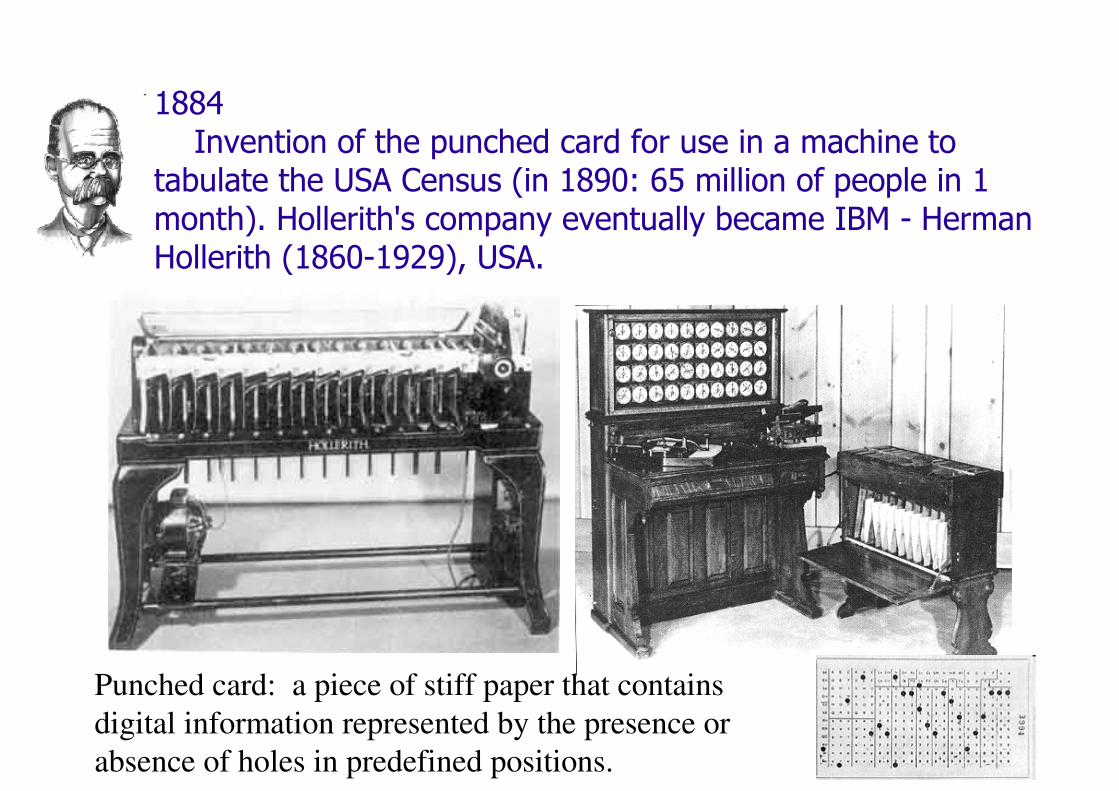
1884Invention of the punched card for use in a machine to
tabulate the USA Census (in 1890: 65 million of people in 1 month). Hollerith's company eventually became IBM - Herman Hollerith (1860-1929), USA.
Punched card: a piece of stiff paper that contains
digital information represented by the presence or
absence of holes in predefined positions.
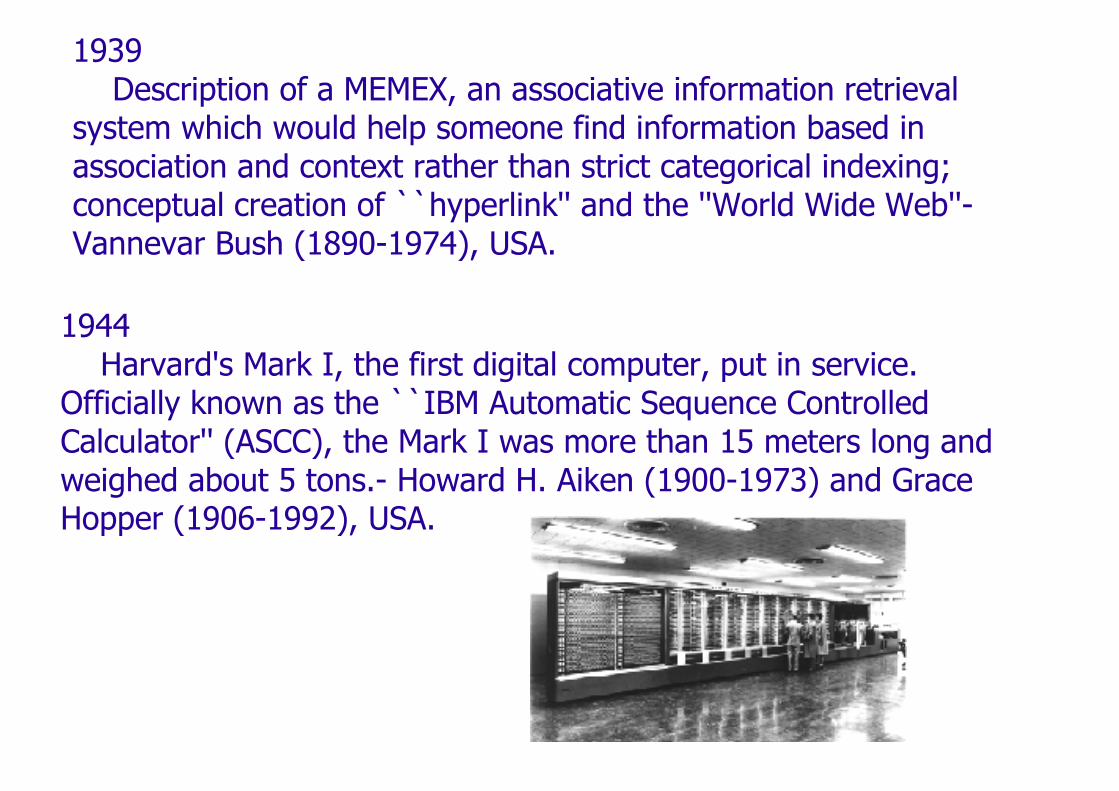
1944Harvard's Mark I, the first digital computer, put in service.
Officially known as the ``IBM Automatic Sequence Controlled Calculator'' (ASCC), the Mark I was more than 15 meters long andweighed about 5 tons.- Howard H. Aiken (1900-1973) and Grace Hopper (1906-1992), USA.
1939Description of a MEMEX, an associative information retrieval
system which would help someone find information based in association and context rather than strict categorical indexing;conceptual creation of ``hyperlink'' and the ''World Wide Web''-Vannevar Bush (1890-1974), USA.
1958-61
Geographic Information Systems (GISs) were developed in the 1950s and 1960s, primarily in the public sector.
University of Washington, Department of Geography, research on advanced statistical methods, rudimentary computer programming, computer cartography:
• Nystuen - fundamental spatial concepts - distance, orientation, connectivity
• Tobler - computer algorithms for map projections, computer cartography
• Bunge - theoretical geography - geometric basis for geography -points, lines and areas
• Berry's Geographical Matrix: organization of geographic data along three “axes”: spatial (geographic), temporal (historic), thematic (attribute) (where-when-what)
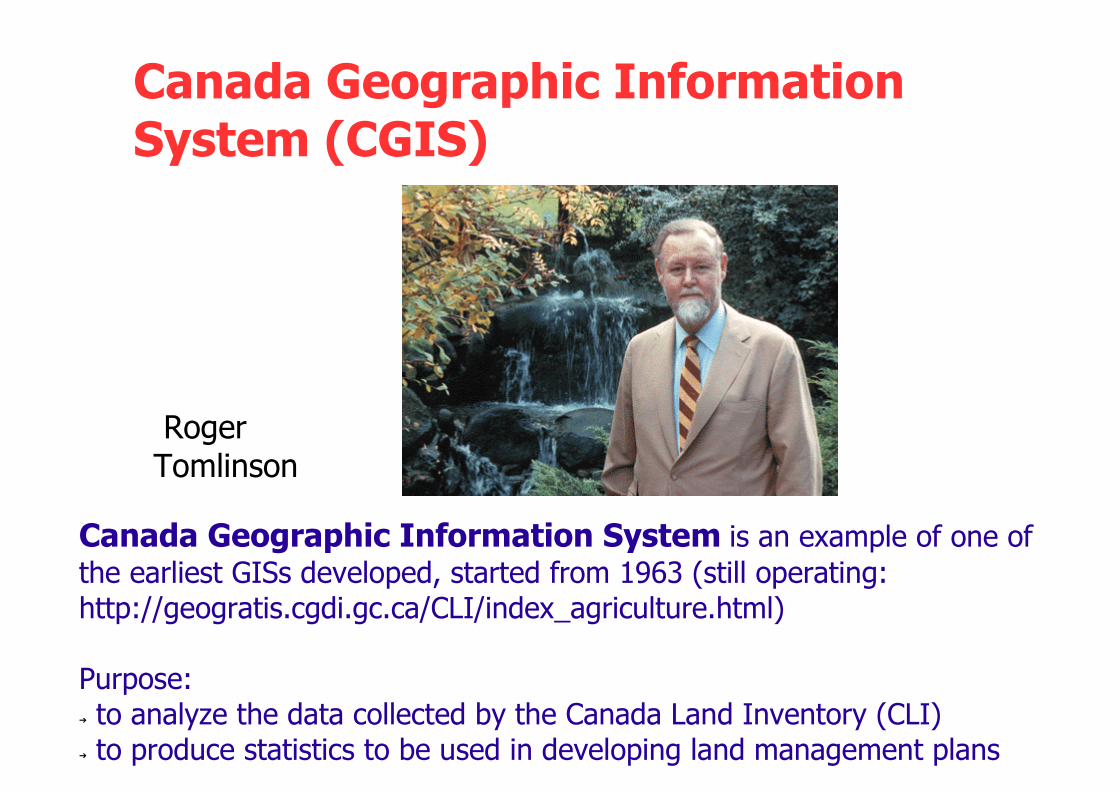
Canada Geographic Information System (CGIS)
Roger Tomlinson
Canada Geographic Information System is an example of one of the earliest GISs developed, started from 1963 (still operating:http://geogratis.cgdi.gc.ca/CLI/index_agriculture.html)
Purpose:➔ to analyze the data collected by the Canada Land Inventory (CLI)➔ to produce statistics to be used in developing land management plans
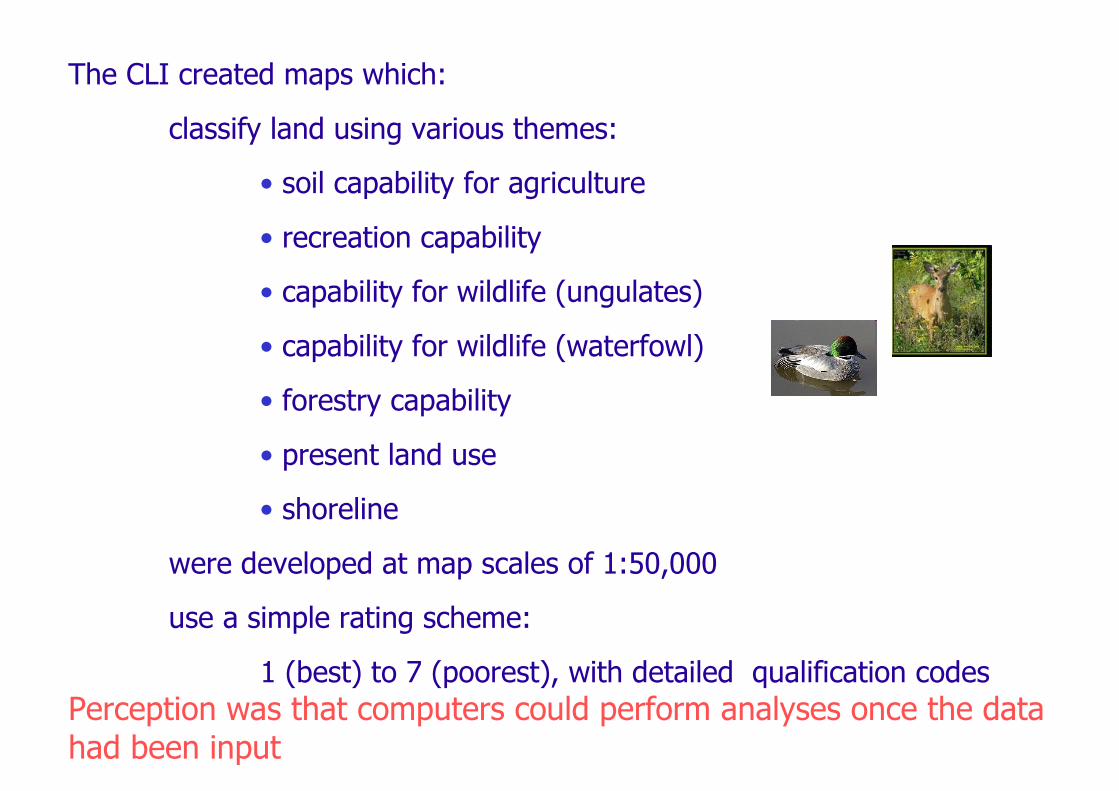
The CLI created maps which:
classify land using various themes:
• soil capability for agriculture
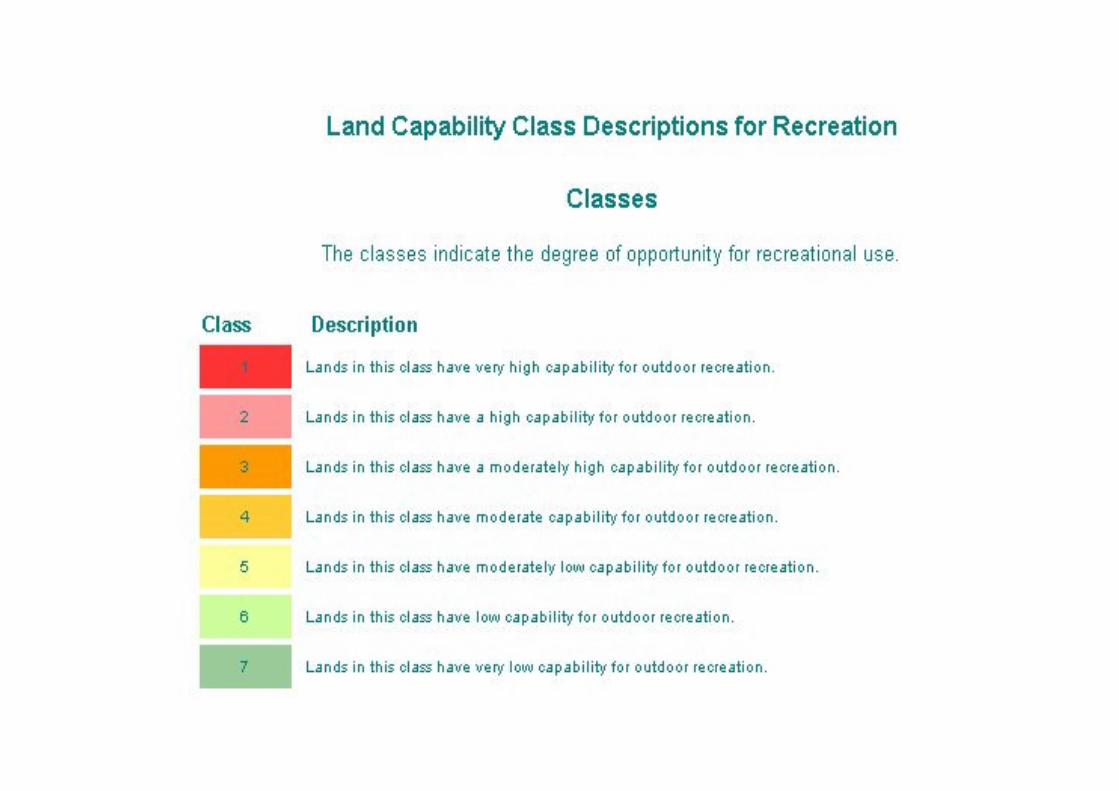
• recreation capability
• capability for wildlife (ungulates)
• capability for wildlife (waterfowl)
• forestry capability
• present land use
• shoreline
were developed at map scales of 1:50,000
use a simple rating scheme:
1 (best) to 7 (poorest), with detailed qualification codes
Perception was that computers could perform analyses once the data had been input
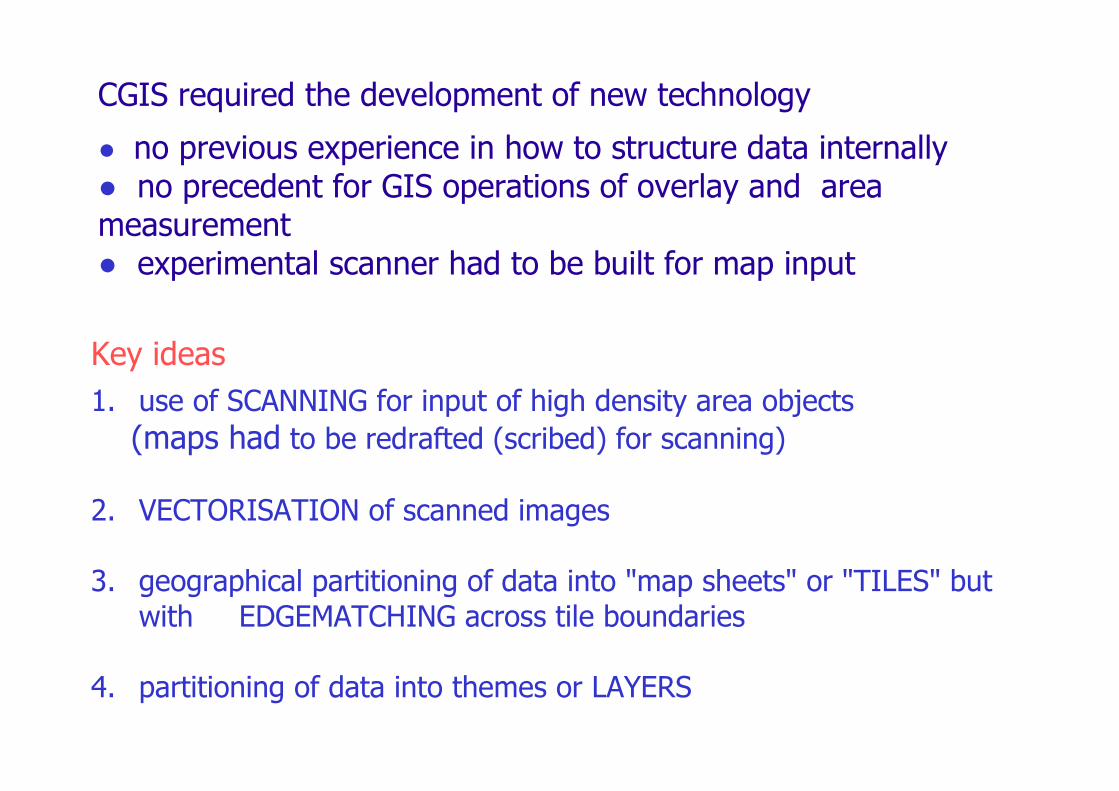
CGIS required the development of new technology
● no previous experience in how to structure data internally● no precedent for GIS operations of overlay and area measurement● experimental scanner had to be built for map input
Key ideas
1. use of SCANNING for input of high density area objects
(maps had to be redrafted (scribed) for scanning)
2. VECTORISATION of scanned images
3. geographical partitioning of data into "map sheets" or "TILES" but with EDGEMATCHING across tile boundaries
4. partitioning of data into themes or LAYERS
5. use of ABSOLUTE SYSTEM of coordinates for entire country with precision adjustable to resolution of data (the number of digits of precision can be set by the system manager and changed from layer to layer)
6. internal representation of line objects as chains of incremental moves in 8 compass directions rather than straight lines between points (FREEMAN CHAIN CODE)
7. coding of area object boundaries by ARC, with pointers to left and right area objects
8. first "TOPOLOGICAL" SYSTEM with planar enforcement in each layer, relationships between arcs and areas coded in the database
9. implementation of functions for POLYGON OVERLAY, measurement of AREA, user-defined circles and polygons for QUERY
The IDS (Imagery Data Set) consisted of text and numericsymbols and contained the information to construct a map;
the DDS (Descriptor Data Set) consisted of text and numericsymbols that represented descriptive data elements for eachgeographic entity.
10. separation of data into attribute and locational files
* "descriptor dataset" (DDS) and "image dataset" (IDS)* concept of attribute table
mid 1960sInitial development of geographic information systems, combiningspatially-referenced data, spatial models and map-based visualization.
1964Harvard Laboratory for Computer Graphics (and Spatial Analysis) was established by Howard Fisher. This lab had major influence on the development of GIS until early 1980s. Many pioneers of newer GIS "grew up" at the Harvard lab.
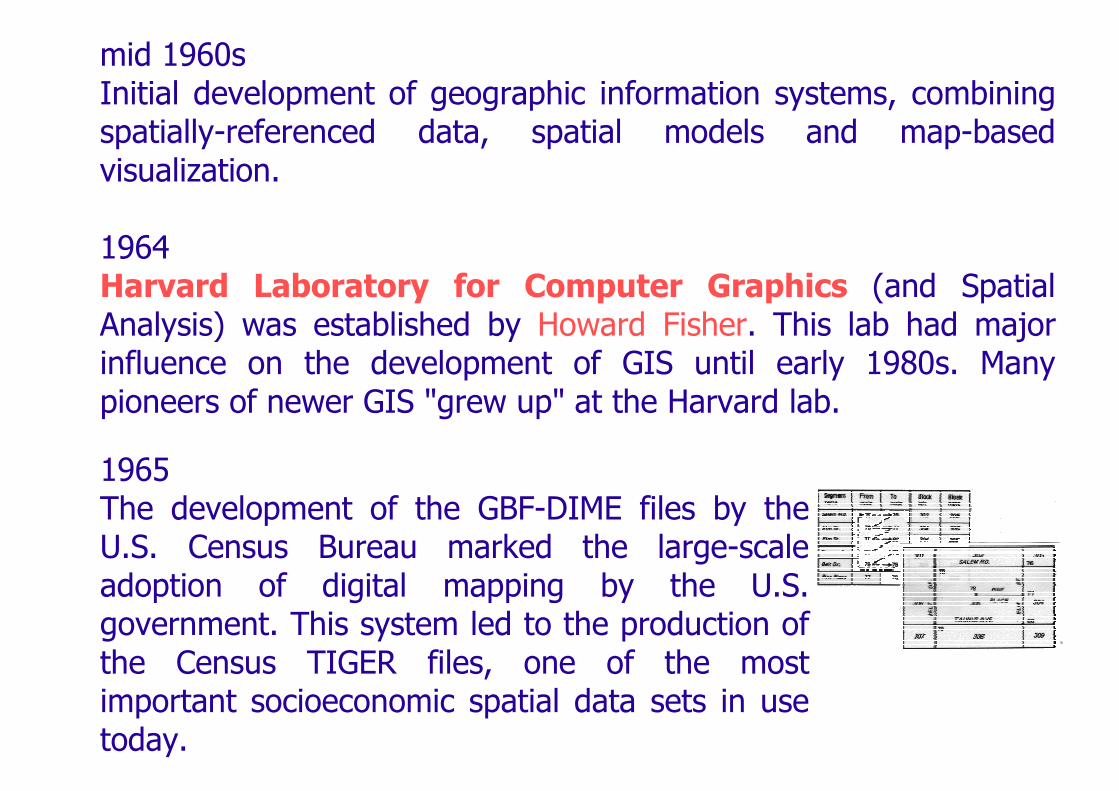
1965The development of the GBF-DIME files by the U.S. Census Bureau marked the large-scale adoption of digital mapping by the U.S. government. This system led to the production of the Census TIGER files, one of the most important socioeconomic spatial data sets in use today.
1966Howard Fisher developed SYMAP (Synagraphic Mapping System) a general-purpose mapping package, producing isoline, choropleth and proximal maps on a line printer. It was characterized by poor resolution and limited functionality, but is was also simple to use. It represented a way for the non-cartographer to make maps and it was a first real demonstration of ability of computers to make maps.
late 1960sCALFORM was developed. It is an improvement of SYMAP:
• SYMAP on a plotter
• user avoided double-coding of internal boundaries by inputting a table of point locations, plus a set of polygons defined by sequences of point IDs
• more cosmetic than SYMAP - North arrows, better legends
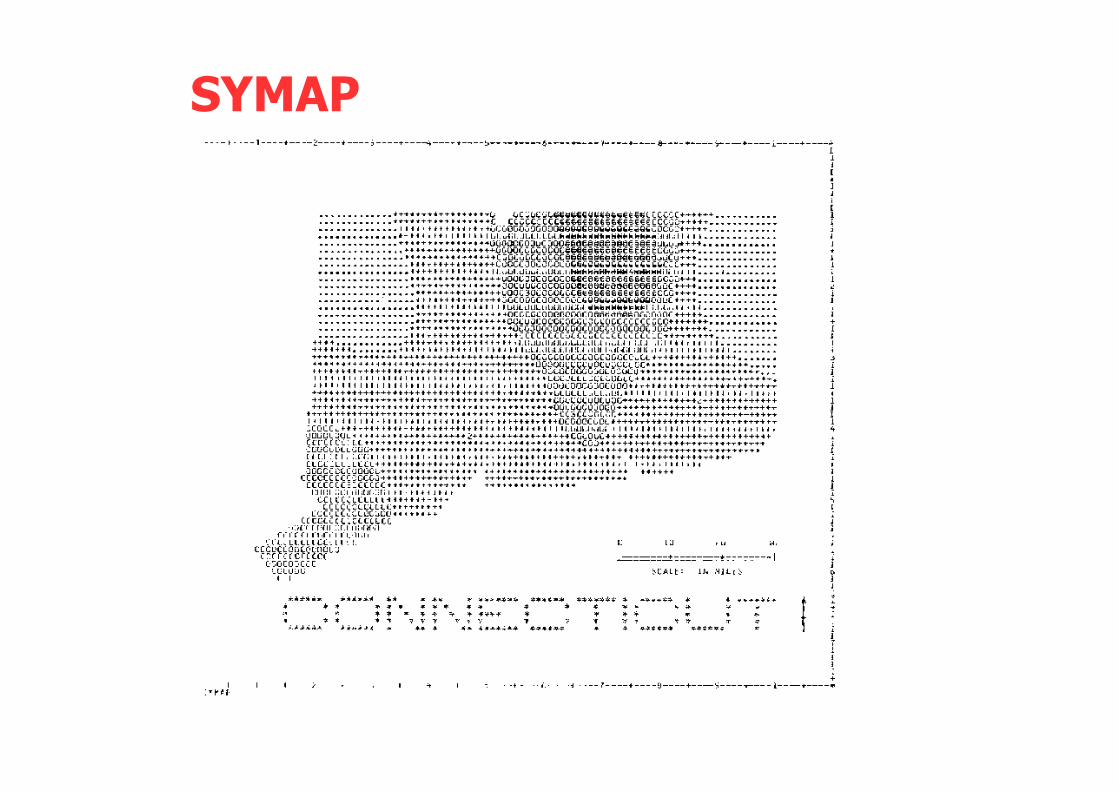
SYMAP
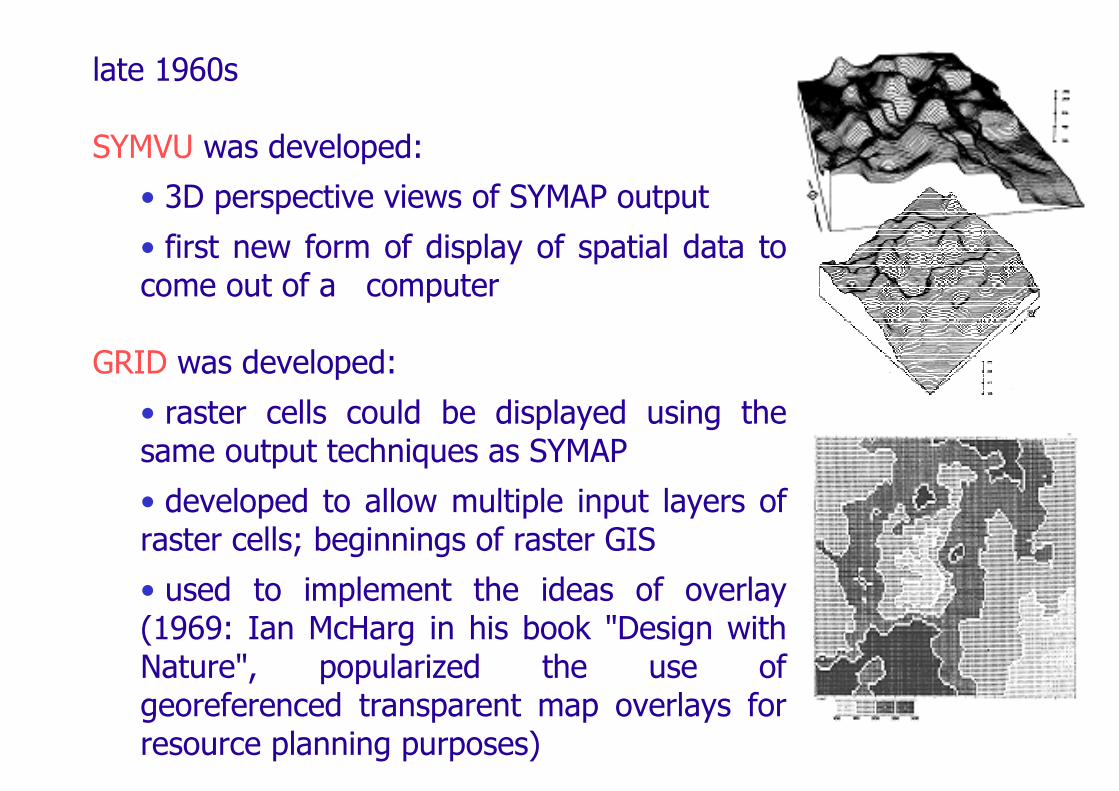
late 1960s
SYMVU was developed:
• 3D perspective views of SYMAP output
• first new form of display of spatial data to come out of a computer
GRID was developed:
• raster cells could be displayed using the same output techniques as SYMAP
• developed to allow multiple input layers of raster cells; beginnings of raster GIS
• used to implement the ideas of overlay (1969: Ian McHarg in his book "Design with Nature", popularized the use of georeferenced transparent map overlays for resource planning purposes)
1969Data formats begin to emerge and private vendors began offeringGIS packages:
Environmental Science Research Institute (ESRI) is founded by Jack and Laura Dangermond as a privately held consulting group. The business began with $1100 from their personal savings and operated out of an historic home located in Redlands, California.
Jim Meadlock establishes Intergraph Corporation (originally called M & S Computing Inc).
early 1970sPOLYVRT
● various alternative ways of forming area objects
● motivated by need of computer mapping packages for flexible input, transfer of boundary files between systems, growing supply of data in digital form, e.g. from Bureau of the Census
mid 1970sODYSSEY
● extended POLYVRT idea beyond format conversion to a comprehensive analysis package based on vector data
● first robust, efficient algorithm for polygon overlay -included sliver removal
1971The Canada Geographic Information System (CGIS) becomes fully operational.
General Information System for Planning (GISP) is developed by the US Department of the Environment.
Maryland Automatic Geographic Information (MAGI), one of the first statewide GIS projects begins in US.
1974The first AUTOCARTO (International Symposium on Computer Assisted Cartography) conference is held in Reston (Virginia).
1976Minnesota Land Management Information System (MLMIS), another significant state-wide GIS, begins as a research project at the Centre for Urban and Regional Analysis, University of Minnesota.
1977 The USGS (U.S. Geological Survey) develops the Digital Line Graph (DLG) spatial data format.
1978ESRI develops the first version of Arc/Info, the current leadingGIS software package.
ERDAS is founded.
the 1980s
Second GIS phase: the GIS was pushed to evolve towards analysis.
• In this stage more functions for USER INTERACTION were developed mainly in a graphical way by a user friendly interface (GUI, Graphical User Interface).
• It gave to the user the ability to sort, select, extract, reclassify, re-project and display data on the basis of complex geographical, topological and statistical criteria.
• The suppliers increased their knowledge on existing and growing data analyses techniques, specific subject matters (e.g.: ecology and hydrology), and data context issues. While data storage were still mainly centralized the user’s access became more decentralized.
1982
ESRI's ARC/INFO® 1.0, the first commercially available GISsoftware package, which ran on mainframe computers(www.esri.com/company/about/history.html) was released.
Army Corps of Engineers at the Construction Engineering Research Laboratory (CERL) started the development of the GIS GRASS –Geographic Resources Analysis Support System – as a raster based GIS programme for land management at military installations
1987
The International Journal of Geographical Information Analysis gets published.
Tydac releases SPANS GIS.
Ron Eastman starts the IDRISI Project at Clark University (http://www.clarklabs.org/IdrisiSoftware.asp).
1986
Laszlo Bardos, Andrew Dressel, John Haller, Mike Marvin andSean O’Sullivan founded MapInfo.
ESRI's PC ARC/INFO® 1.0, the first GIS software available for the personal computer, was released.
1988
First public release of the US bureau of Census ‘TIGER’(Topographically Integrated Geographic Encoding and Referencing)digital data products.
Founded as GIS World, the monthly magazine ‘GEO World’, the world’s first magazine for geographic technology gets published.
The National Centre for Geographic Information and Analysis(NCGIA, http://www.ncgia.ucsb.edu/) is established in the USA.
1989 Intergraph launches MGE.
The desktop image processing software, ‘ER Mapper’ is launched.
1992In Lebanon, the Electricite du Libau (EDL) decides to rebuild the entire nations electricity network in GIS environment.
ESRI released ArcView® 1.0, a desktop mapping system with agraphical user interface that marked a major improvement in usability over Arc/Info’s command-line interface (http://www.esri.com/company/about/history.html).
the 1990s
Starting from the 1990s GIS entered in a new era. As computing power increased and hardware prices plummeted, the GIS became a viable technology for state and municipal planning. In this third phase of evolution GIS is asked to become a real Management Information System (MIS), and thus able to support decision making processes.
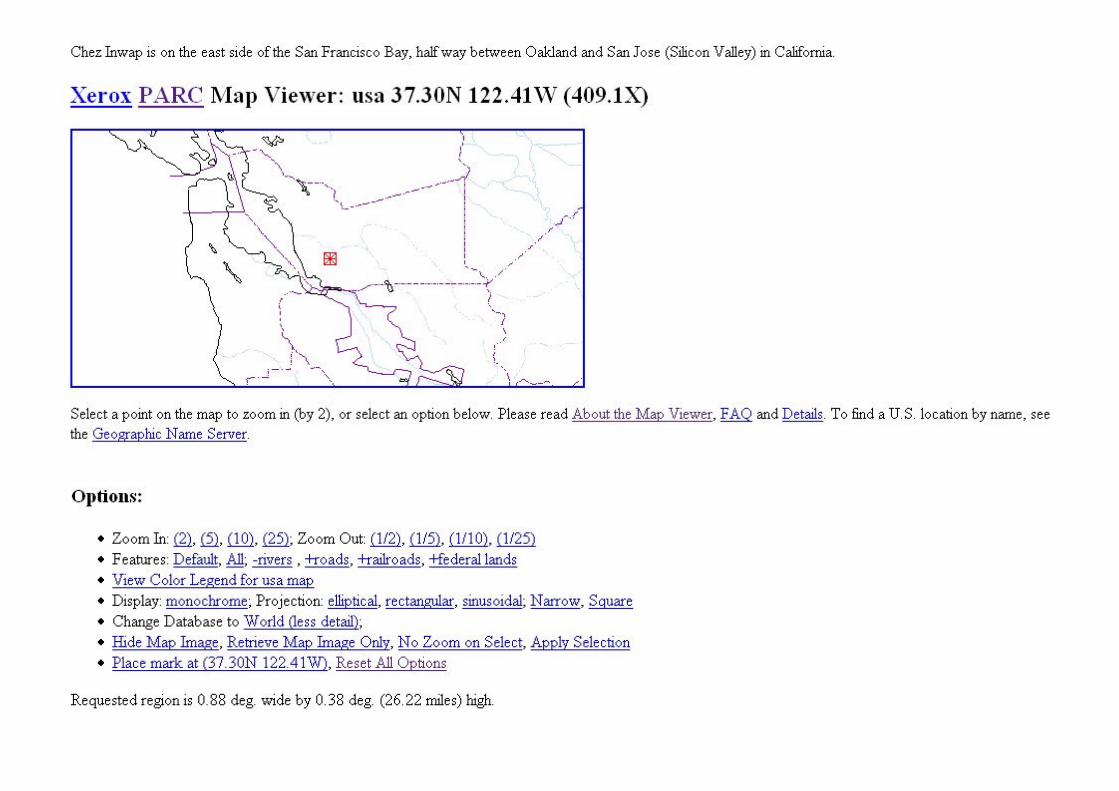
1993Steve Putz developed PARC, the first Web-based interactive mapViewer;
The European Umbrella Organization for Geographic Information (EUROGI) is established in Europe.
1994The Open GIS Consortium aiming at developing publicly available geo-processing specifications was founded.
http://www.opengeospatial.org/
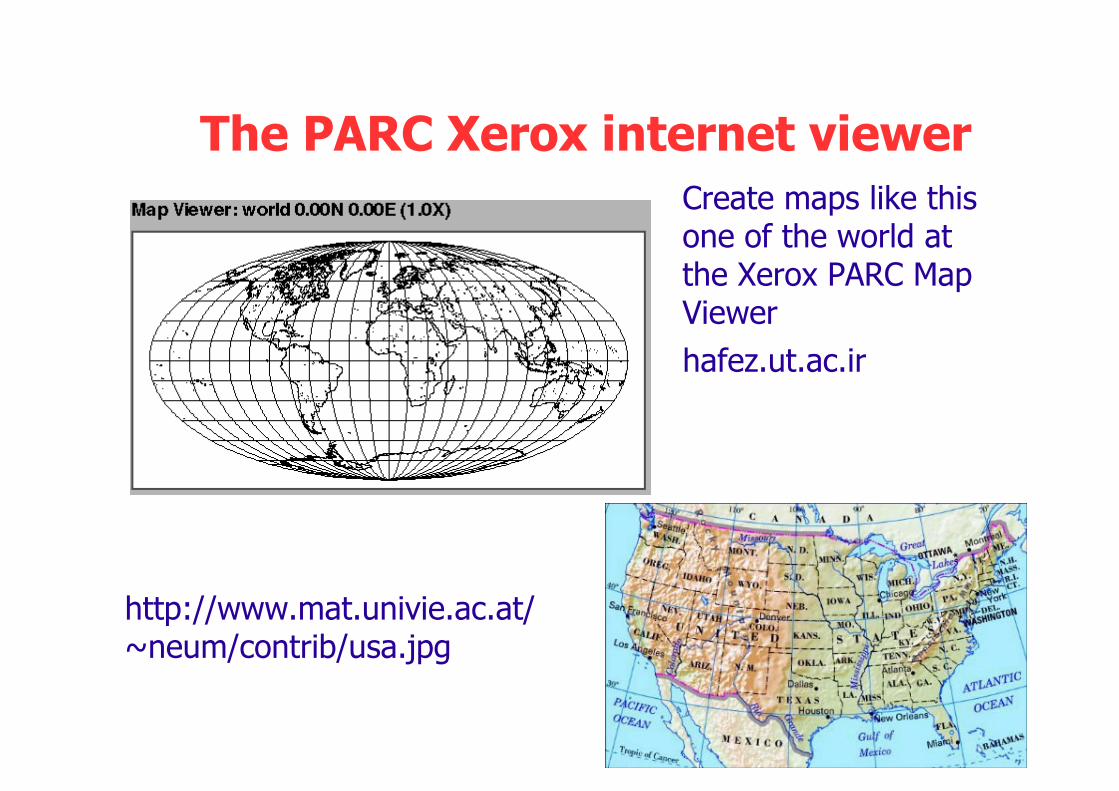
The PARC Xerox internet viewer
Create maps like this one of the world at the Xerox PARC Map Viewer
hafez.ut.ac.ir
http://www.mat.univie.ac.at/~neum/contrib/usa.jpg
1994National Spatial Data Infrastructure (NSDI) is formed in US by an executive order of President Bill Clinton.
PCI Geomatics, a geomatics solution company is formed.
1995National Geographic Data Framework (NGDF) established in UK.
ESRI released Spatial Database Engine (SDE®), an innovativetool for storing and managing GIS data in a commercially availabledatabase management system (DBMS).
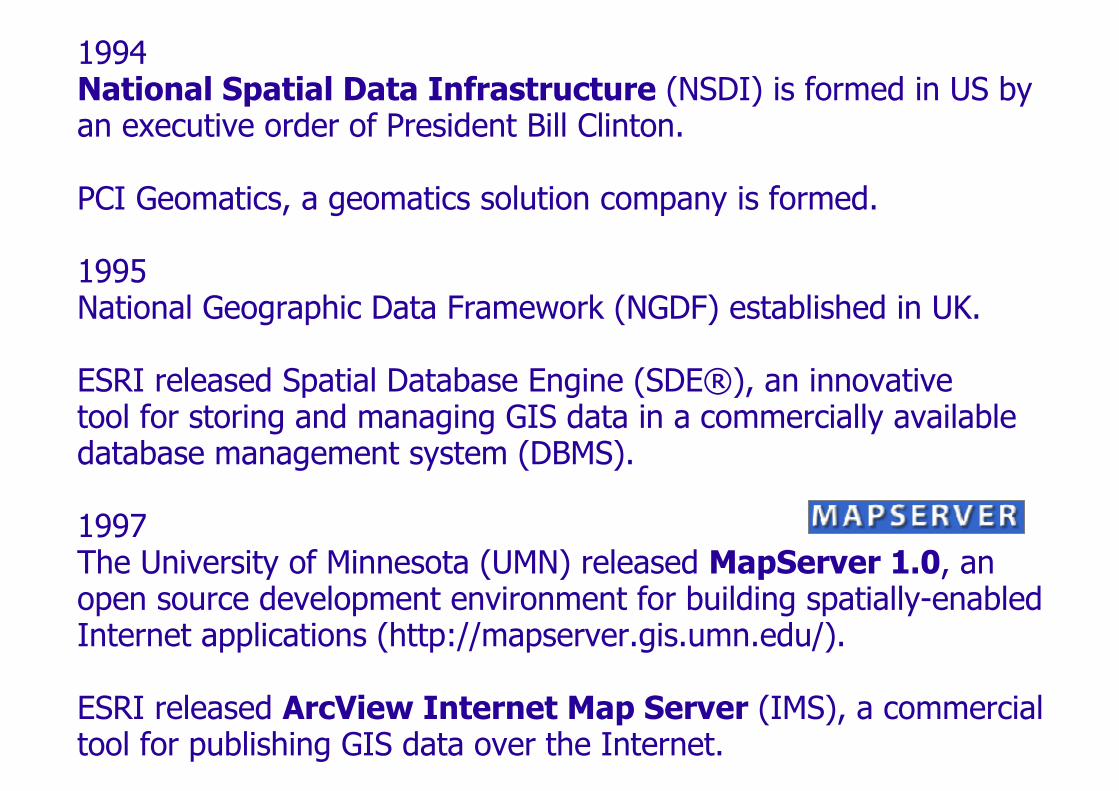
1997The University of Minnesota (UMN) released MapServer 1.0, anopen source development environment for building spatially-enabled Internet applications (http://mapserver.gis.umn.edu/).
ESRI released ArcView Internet Map Server (IMS), a commercial tool for publishing GIS data over the Internet.
1999 GRASS 5.0 is released under GNU GPL by the GRASS Development Team (http://grass.itc.it/). The first major change in years, this version incorporates floating point calculations and NULL support into GRASS raster engine.
2001Refraction Research released PostGIS 0.1(http://postgis.refractions.net/), an open source "spatially enabler"adding support for geographic objects to the PostgreSQL object relational database.
2002ESRI began offering a wide selection of GIS software compatiblewith the Linux operating system. ArcIMS 4, ArcSDE 8.2, MapObjects--Java Standard Edition, and ArcExplorer 4 software are all supported on Linux.
2005GRASS 6.0.0 is released with new interface, vector engine, and database support.
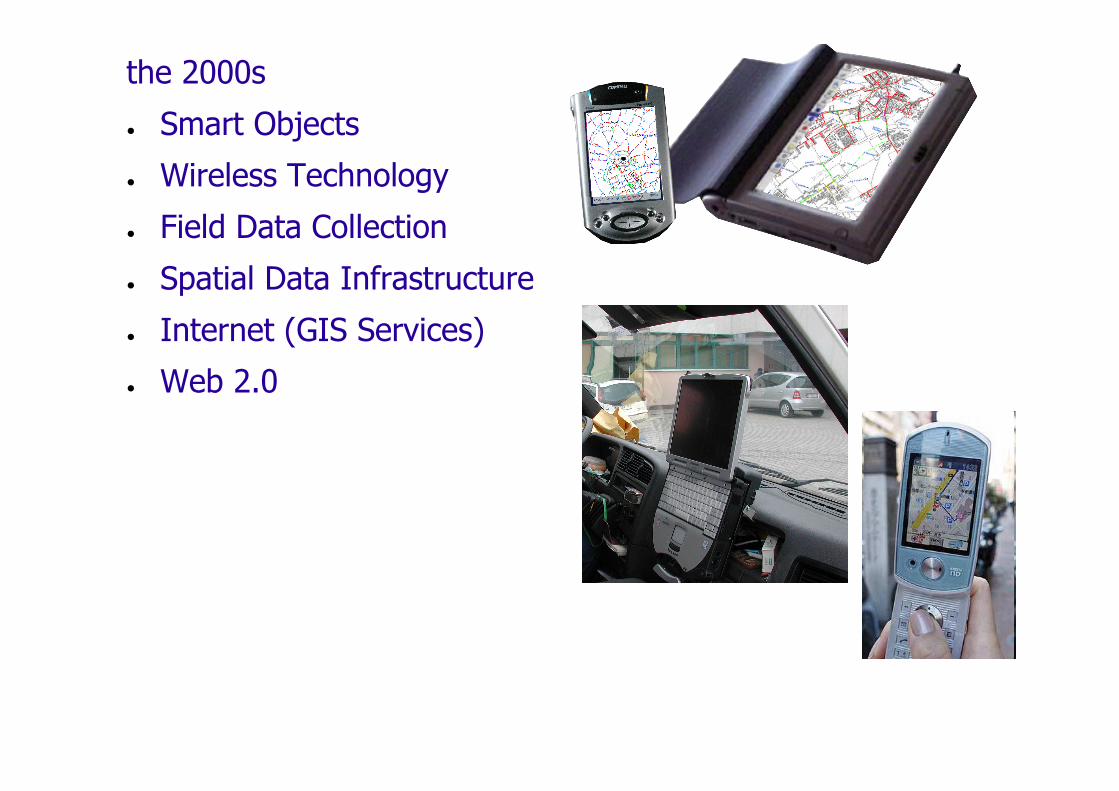
the 2000s
● Smart Objects
● Wireless Technology
● Field Data Collection
● Spatial Data Infrastructure
● Internet (GIS Services)
● Web 2.0
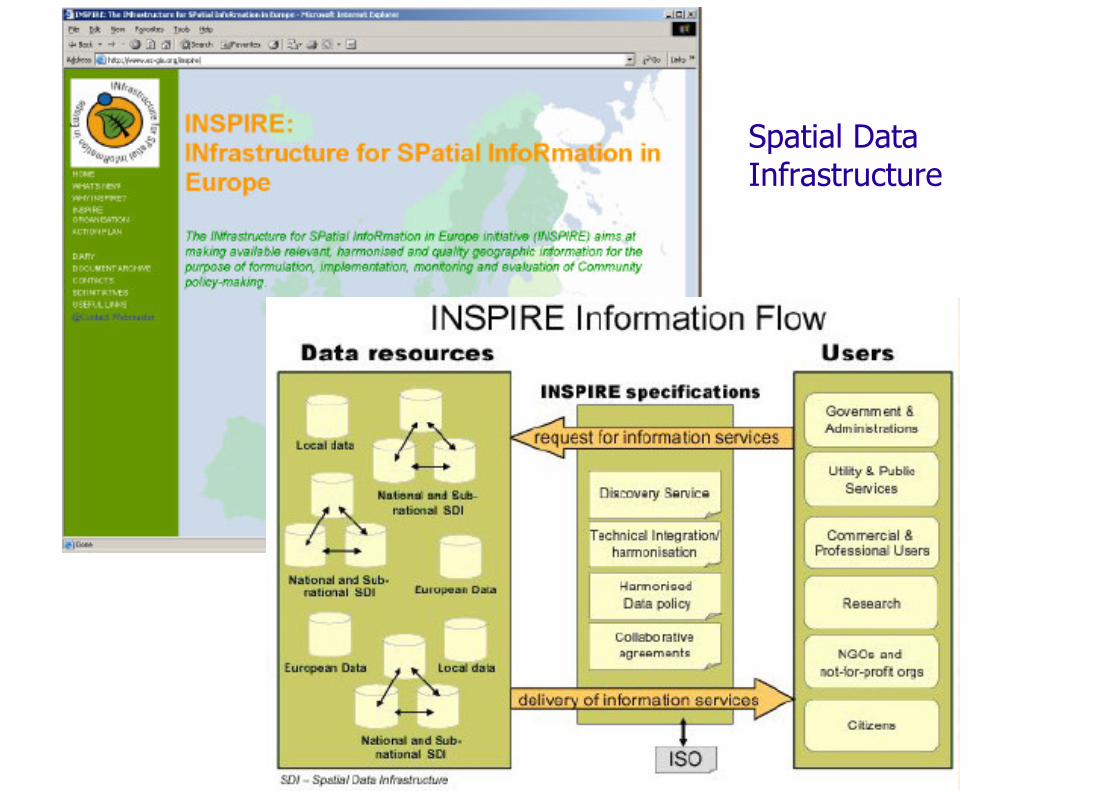
Spatial Data Infrastructure
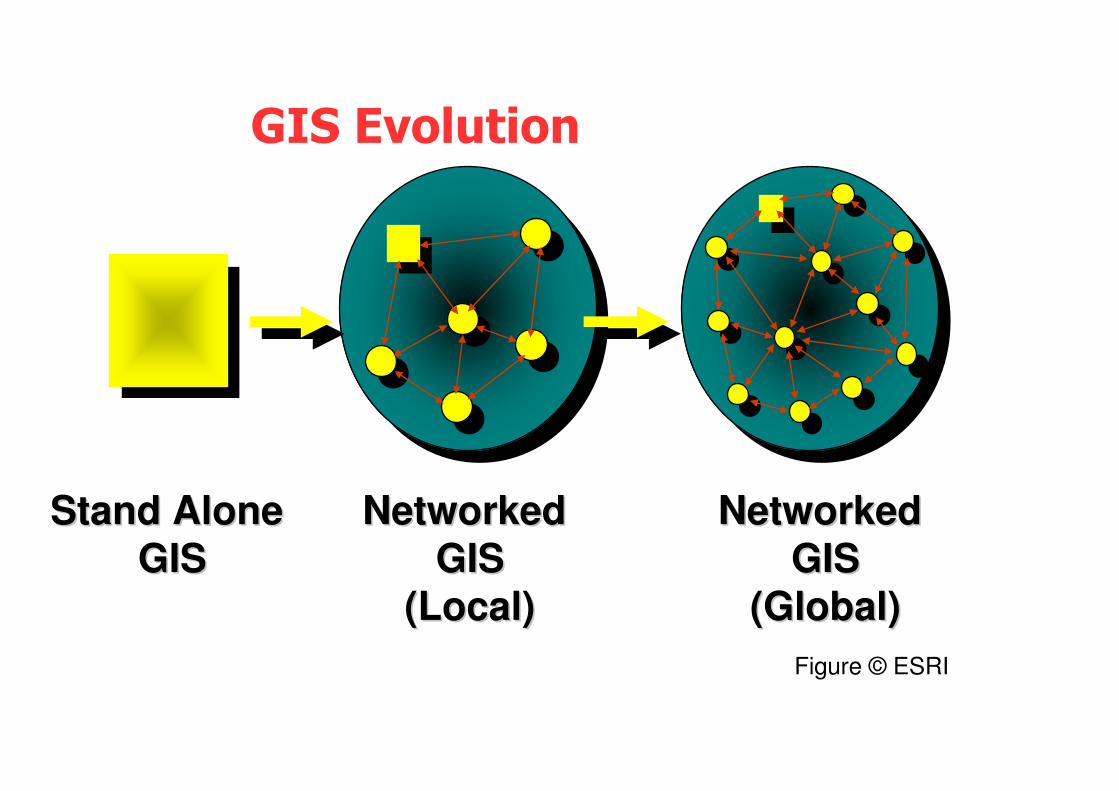
Networked Networked
GISGIS
(Global)(Global)
Networked Networked
GISGIS
(Local)(Local)
Figure © ESRI
Stand Alone Stand Alone
GISGIS
GIS Evolution
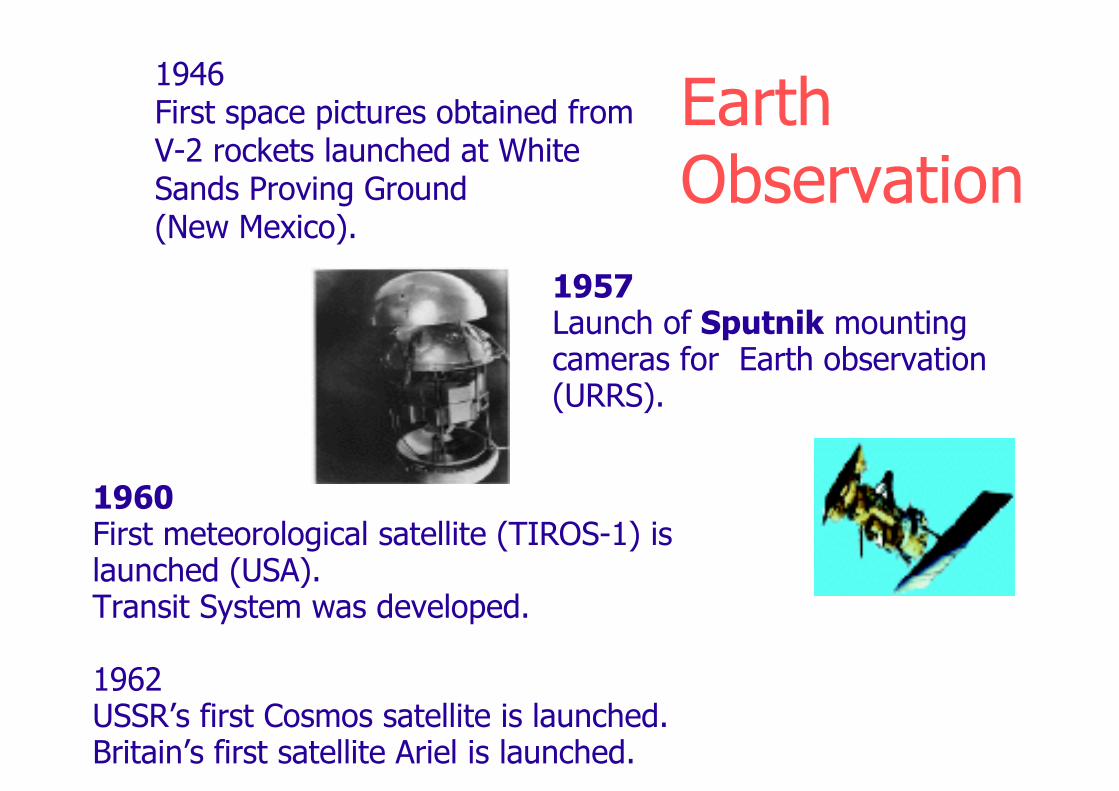
1957Launch of Sputnik mounting cameras for Earth observation (URRS).
1960First meteorological satellite (TIROS-1) is launched (USA).Transit System was developed.
1962USSR’s first Cosmos satellite is launched.Britain’s first satellite Ariel is launched.
1946First space pictures obtained fromV-2 rockets launched at White Sands Proving Ground(New Mexico).
EarthObservation
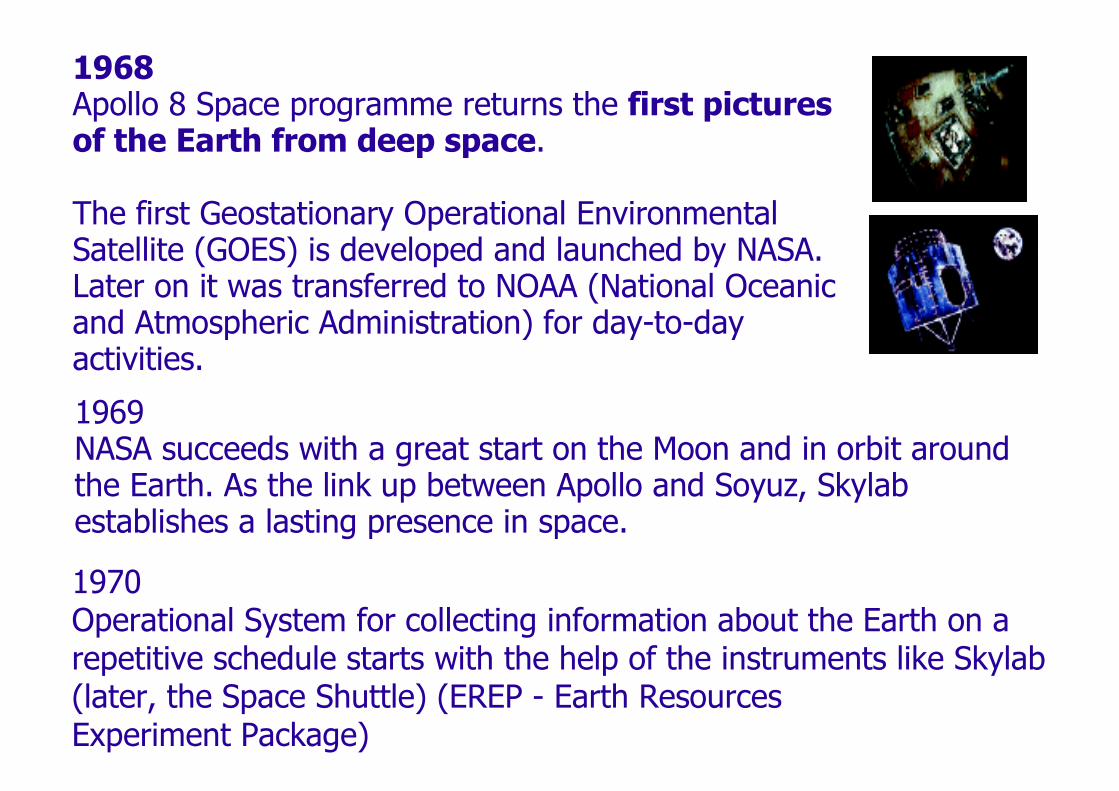
1968Apollo 8 Space programme returns the first pictures of the Earth from deep space.
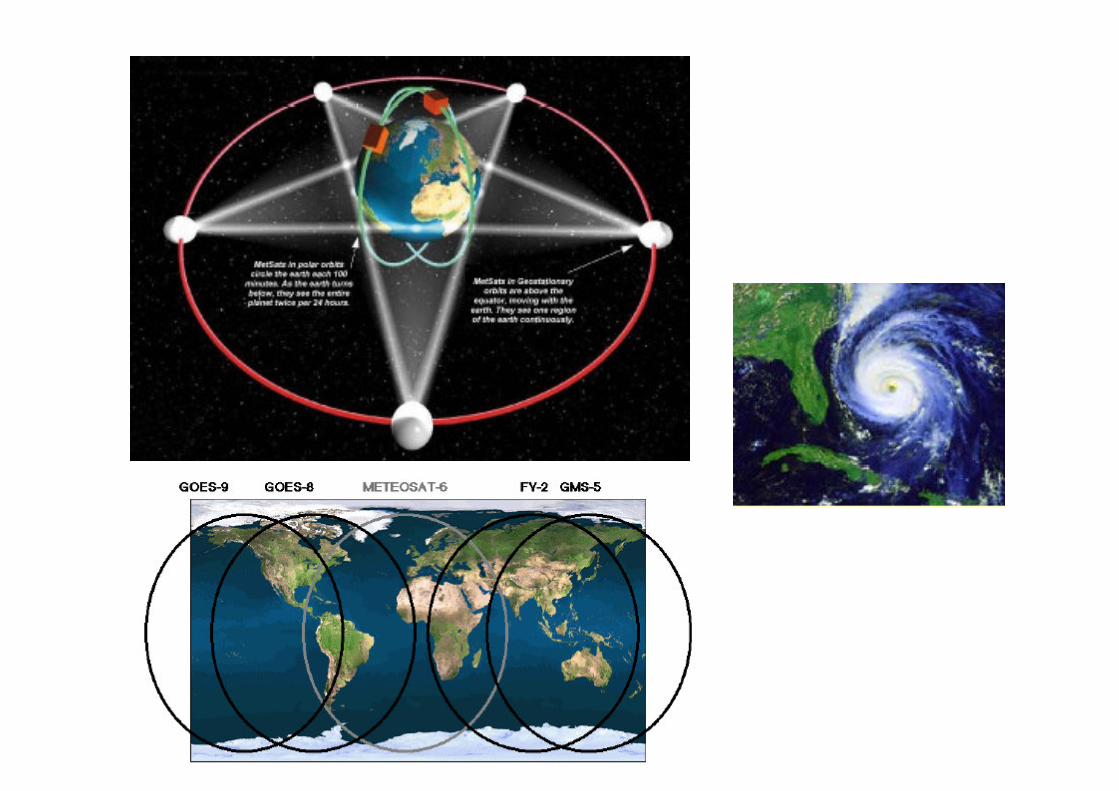
The first Geostationary Operational Environmental Satellite (GOES) is developed and launched by NASA. Later on it was transferred to NOAA (National Oceanic and Atmospheric Administration) for day-to-day activities.
1969NASA succeeds with a great start on the Moon and in orbit aroundthe Earth. As the link up between Apollo and Soyuz, Skylab establishes a lasting presence in space.
1970Operational System for collecting information about the Earth on a repetitive schedule starts with the help of the instruments like Skylab (later, the Space Shuttle) (EREP - Earth ResourcesExperiment Package)
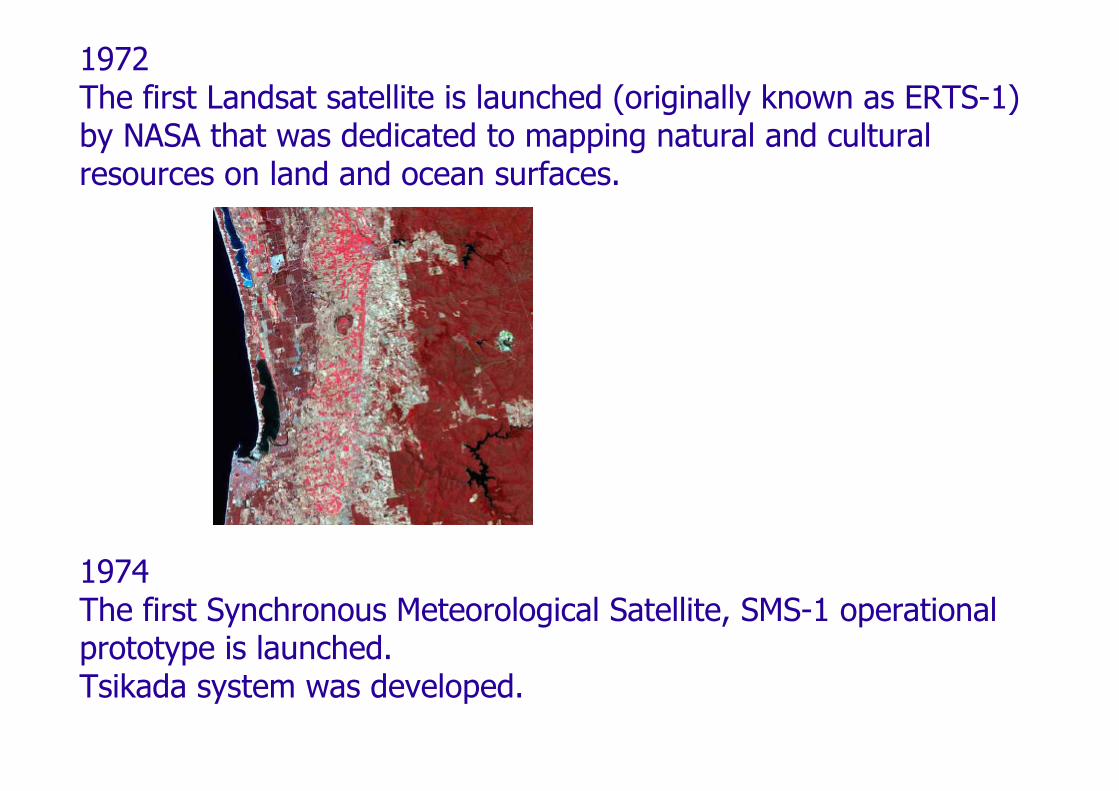
1972The first Landsat satellite is launched (originally known as ERTS-1) by NASA that was dedicated to mapping natural and cultural resources on land and ocean surfaces.
1974The first Synchronous Meteorological Satellite, SMS-1 operational prototype is launched.Tsikada system was developed.
1975India’s first indigenous scientific satellite Aryabhata is launched by the Soviet launch vehicle.
European Space Agency is formed.
Landsat 2 is launched
1978A Radar Imaging System, the main sensor on Seasat, is launched (Seasat 1 survived only for 99 days).
Coastal Zone Color Scanner (CZSC) instrument is flown on-board the NIMBUS 7 platform that collected ocean colour data from November 1978 to June 1986.
Landsat 3 is launched
1979Nimbus 7 is launched
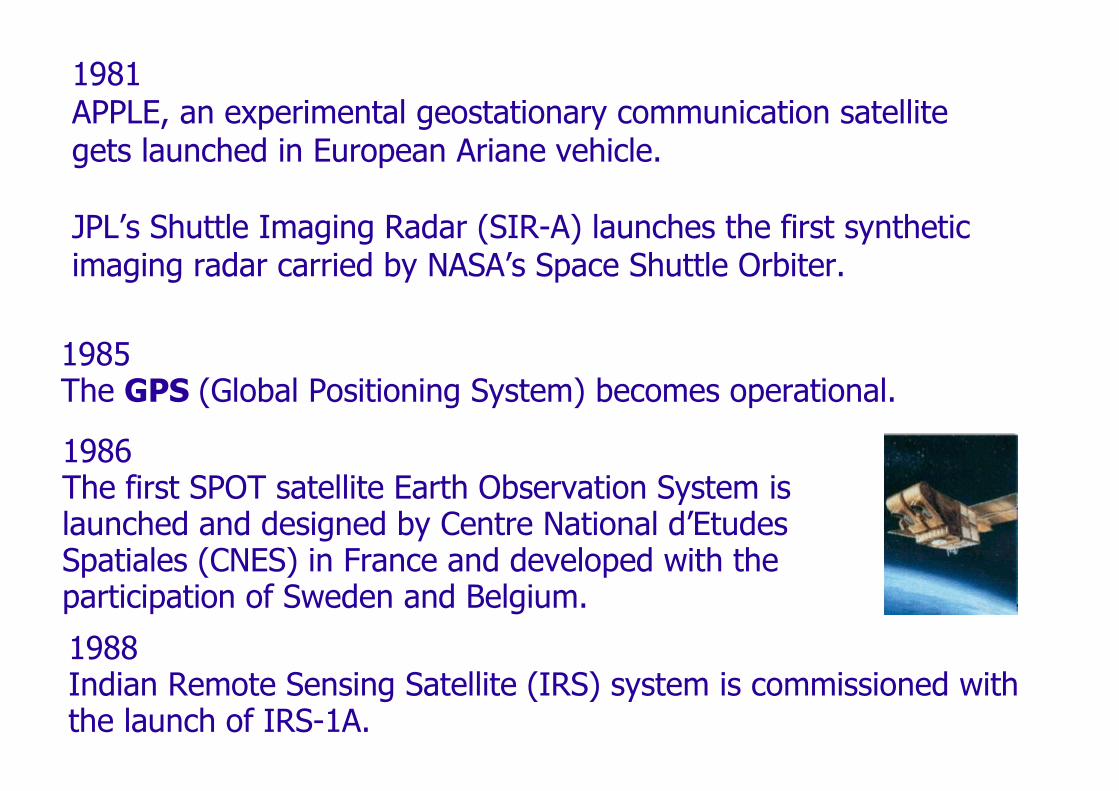
1981APPLE, an experimental geostationary communication satellite gets launched in European Ariane vehicle.
JPL’s Shuttle Imaging Radar (SIR-A) launches the first synthetic imaging radar carried by NASA’s Space Shuttle Orbiter.
1985The GPS (Global Positioning System) becomes operational.
1986The first SPOT satellite Earth Observation System is launched and designed by Centre National d’Etudes Spatiales (CNES) in France and developed with the participation of Sweden and Belgium.
1988Indian Remote Sensing Satellite (IRS) system is commissioned with the launch of IRS-1A.
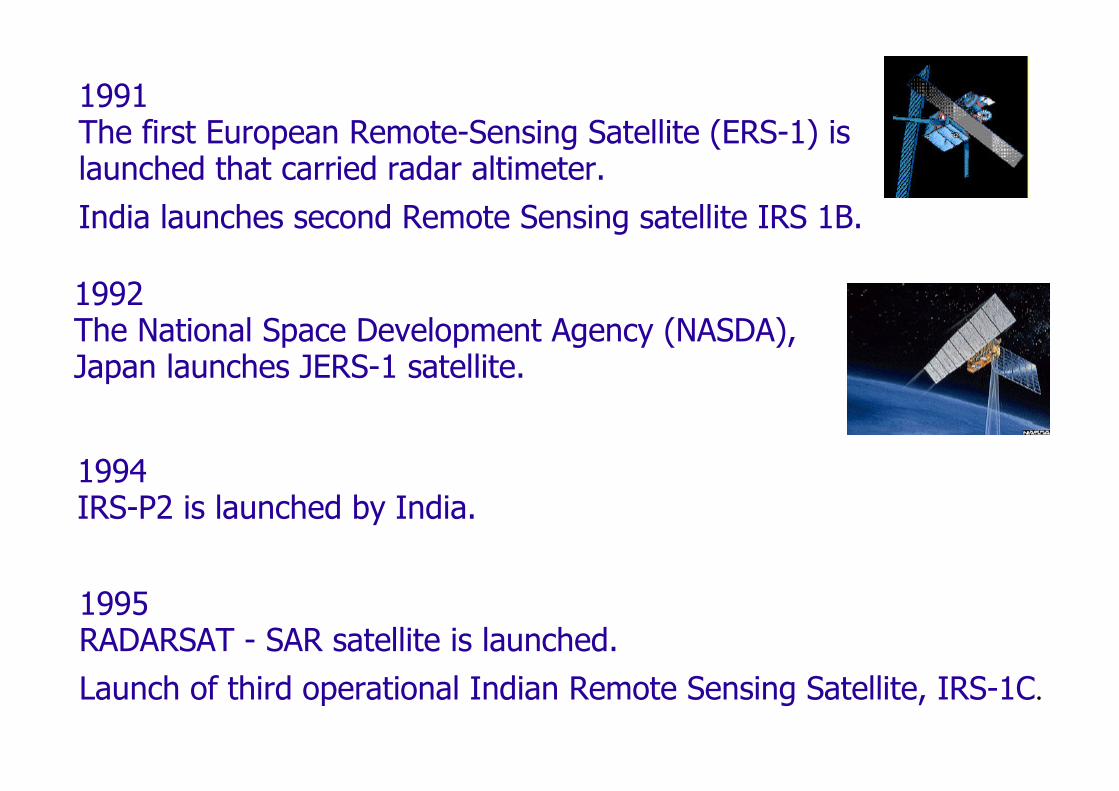
1991The first European Remote-Sensing Satellite (ERS-1) is launched that carried radar altimeter.
India launches second Remote Sensing satellite IRS 1B.
1992The National Space Development Agency (NASDA), Japan launches JERS-1 satellite.
1994IRS-P2 is launched by India.
1995RADARSAT - SAR satellite is launched.
Launch of third operational Indian Remote Sensing Satellite, IRS-1C.
1996Japan’s ‘Advanced Earth Observation Satellite’ is launched.
IRS-P3 is launched by India.
NASA and JPL begin America’s study of Mars by launching ‘Mars Global Surveyor’ (MGS) spacecraft.
1999Landsat 7 carrying Enhanced Thematic Mapper Plus (ETM+) is launched.
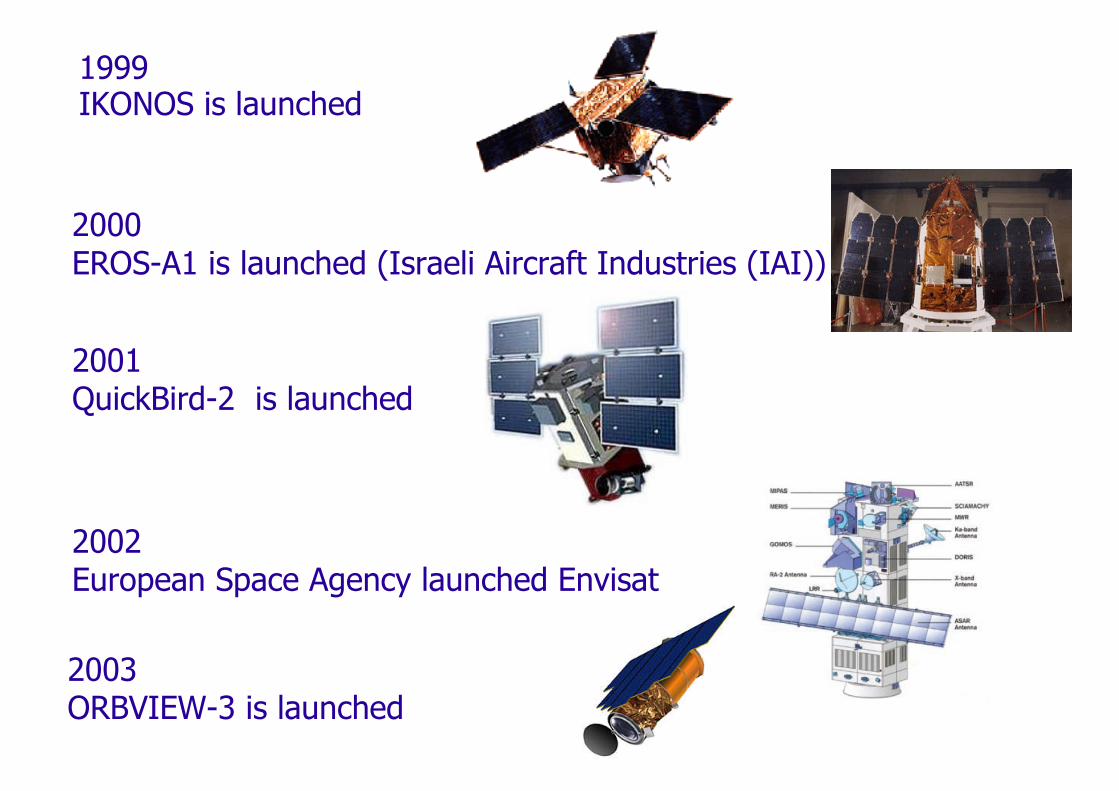
1999IKONOS is launched
2002European Space Agency launched Envisat
2000EROS-A1 is launched (Israeli Aircraft Industries (IAI))
2001QuickBird-2 is launched
2003ORBVIEW-3 is launched
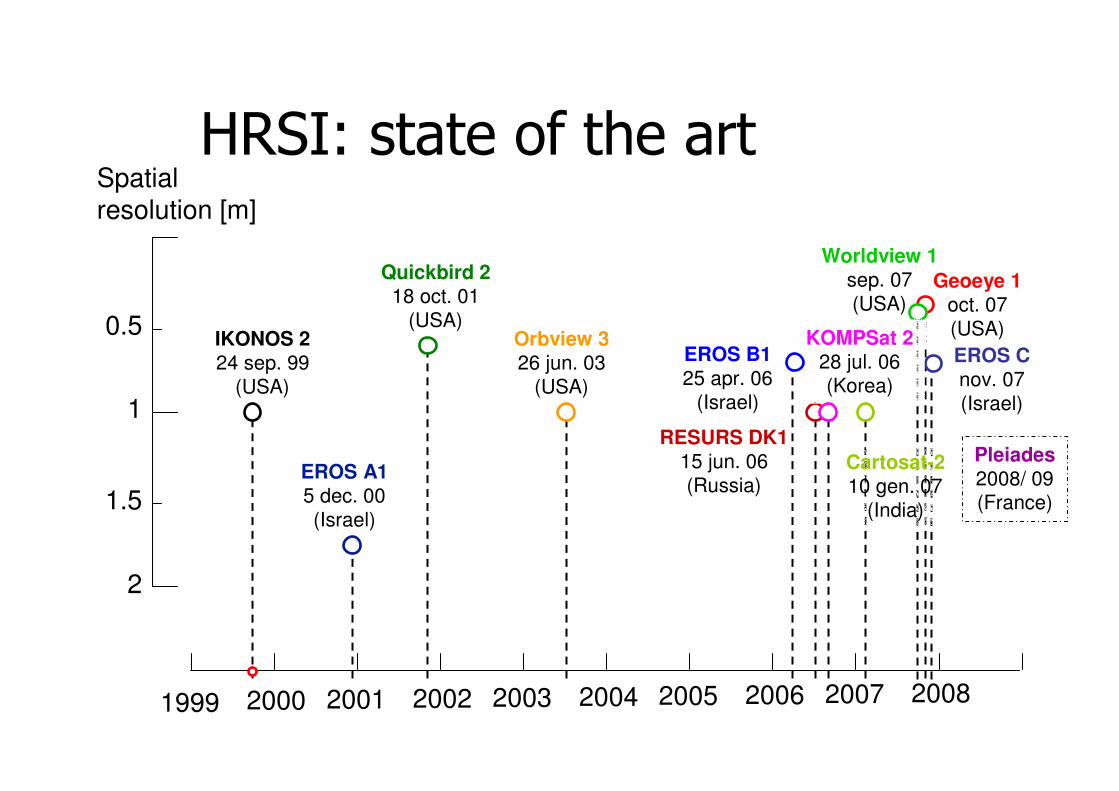
HRSI: state of the art
1999 2000 2001 2002 2003 2004 2005 2006 2007 2008
0.5
1
1.5
2
IKONOS 224 sep. 99
(USA)
EROS A15 dec. 00(Israel)
Quickbird 218 oct. 01
(USA)Orbview 326 jun. 03
(USA)
RESURS DK115 jun. 06(Russia)
Geoeye 1oct. 07(USA)
Worldview 1sep. 07(USA)
EROS Cnov. 07(Israel)
KOMPSat 228 jul. 06(Korea)
Cartosat-210 gen. 07
(India)
EROS B125 apr. 06
(Israel)
Pleiades2008/ 09(France)
Spatialresolution [m]
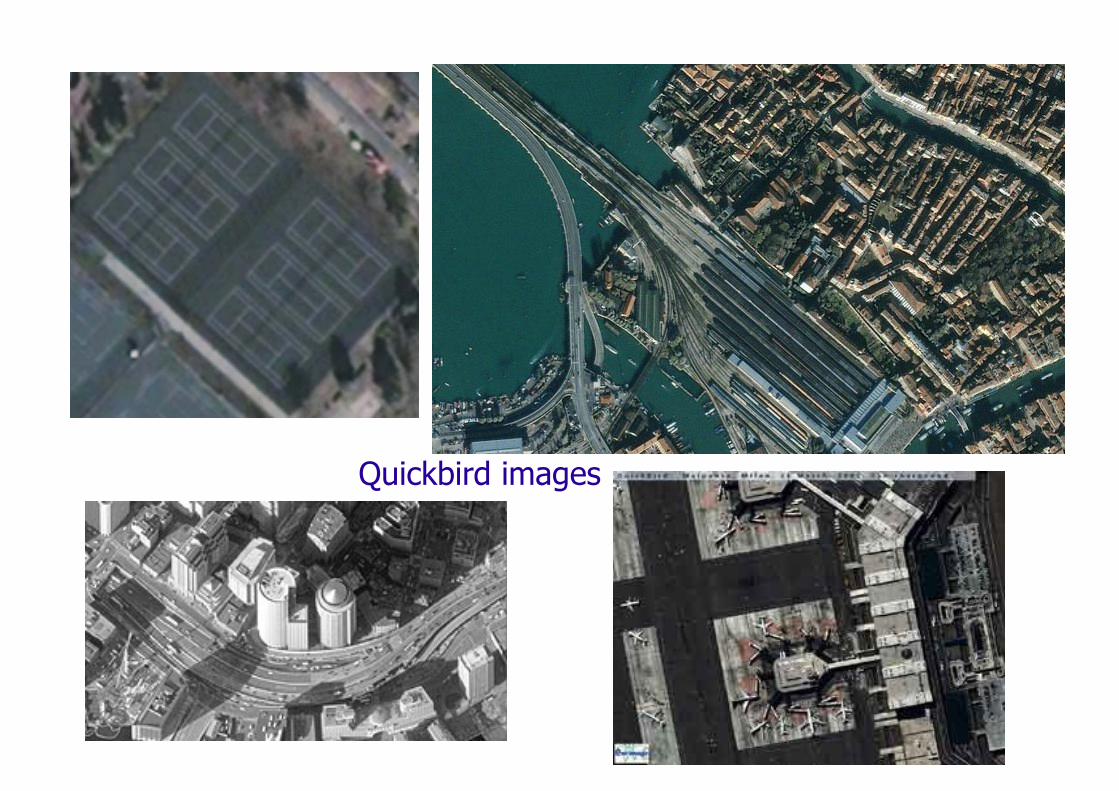
Quickbird images
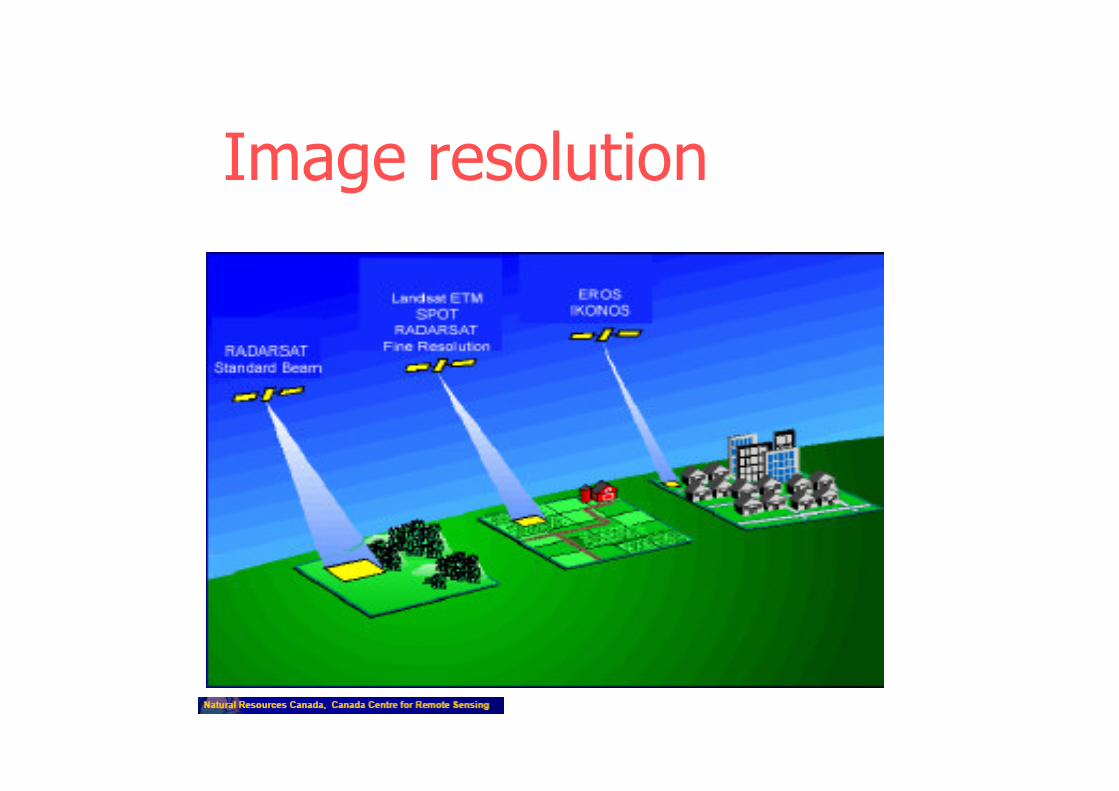
Image resolution