Embed Size (px)
Citation preview
CHAPTER-1
INTRODUCTION
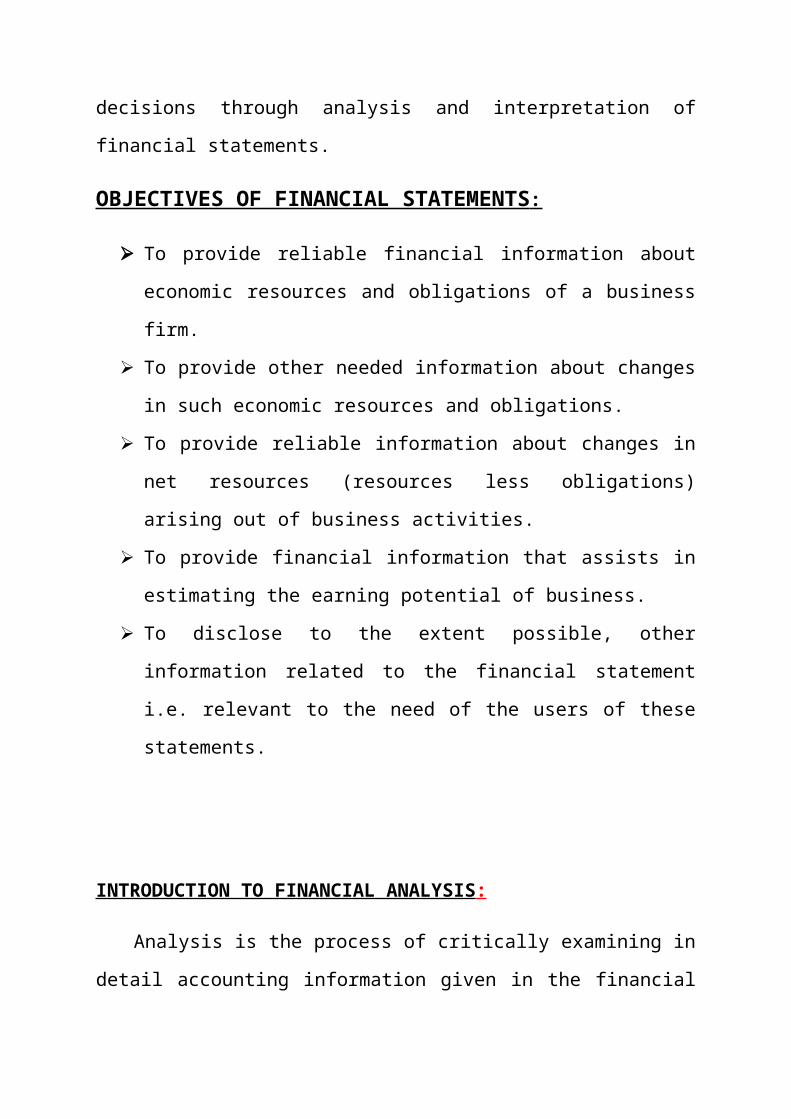
INTRODUCTION TO FINANCIAL STATEMENTS:
Financial statements are generally prepared on the basis of
recorded facts. The recorded facts are those which can be
expressed only in monetary terms. All the transactions are
recorded in a chronological order throughout the year. Financial
statements are prepared from the records which are based on
historical costs.
The financial statements are summarizes of the items recorded
in the business and these statements are prepared periodically,
generally for the accounting period.
The financial statements are prepared mainly for decision-
making purposes. The information given in the financial
statements is of immense use is making decisions through
analysis and interpretation of financial statements.
OBJECTIVES OF FINANCIAL STATEMENTS :
To provide reliable financial information about economic resources and
obligations of a business firm.
To provide other needed information about changes in such economic
resources and obligations.
To provide reliable information about changes in net resources (resources
less obligations) arising out of business activities.
To provide financial information that assists in estimating the earning
potential of business.
To disclose to the extent possible, other information related to the
financial statement i.e. relevant to the need of the users of these
statements.
INTRODUCTION TO FINANCIAL ANALYSIS :
Analysis is the process of critically examining in detail accounting
information given in the financial statements. For the purpose of analysis,
individuals items are studied, their interrelationships with other elated figures
established, the data is sometimes rearranged to have better understanding of the
information with the help of different techniques or tools for ht purpose.
Analyzing financial statements is a process of evaluating relationship between
component parts of financial statements to obtain a better understanding of
firm’s position and performance.
Financial analysis is the process of identifying the financial strengths and
weaknesses of a firm by properly establishing relationship between the items of
the balance sheet and profit and loss account.
From the definition, it is clear that analysis and interpretation of financial
statement is the methodical classification of the data given in the financial
statement into simple component parts of elements, and evaluation of the
significance of the relationship between the classified component parts of
elements, with a view to provide a full diagnosis of the profitability and
financial statement of an enterprise.
SIGNIFICANCE OF FINANCIAL ANALYSIS:
1. HELPS IN SCREENING:
Financial statements can serve as a preliminary tool on the selection of
investments. It greatly helps the investors in studying 3p’s i.e. prospects,
payment and protection. The prospects of a firm can be judge by looking to both
its presenting and future profitability. The capacity can be judge on the basis of
present and prospective rigidity of the firms. The protection can be judged on
the basis of tangible assets backing, which the firm enjoys.
2. HELPS IN FORECASTING:
It can be used as a forecasting tool for future profitability and financial
soundness of business.
3. HELPS IN DIAGNOSIS:
It helps the management to identifying the factors responsible for creating
managerial, operating and other problems.
INTRODUCTION TO FINANCIAL STATEMENTS ANALYSIS:
Financial statement analysis is a process of evaluations of
the relationship between components parts of a financial
statement to obtain a better understanding of a firm’s position
and performance. In this way, the main objective of financial
statement analysis is to analyse and evaluate the information
contained in financial statements to judge the profitability,
solvency and financial soundness of a firm.
A financial analyst analyses the financial statements with
various tools of analysis before commenting upon the financial
health or weakness of an enterprise. The analysis and
interpretation of financial statements is essential to bring out
the mystery behind the figures in financial statements.
MEANING OF FINANCIAL STATEMENTS ANALYSIS:
The term financial statements analysis refers to" the process of
determining financial strengths and weaknesses of the firm by
establishing relationship between the items of the balance sheet and
profit and loss account".
OBJECTIVES OF FINANCIAL STATEMENTS ANALYSIS:
The basic objective of the analysis statements is to understand the information
contained in financial statements with a view to know the weaknesses and
strengths of the firm and to make a forecast about the future prospects of the
firm and thereby enabling the financial analyst to take different decisions
regarding the operation of the firm.
However, some of the specific objectives of the analysis of financial
statements can be identified as;
To asses the current profitability position and operating efficiency of the
firm and as of different departments.
To find out the relative importance of different components of the
financial position of the firm.
To identify the reasons for change in the profitability position of the firm.
To assess the short as well as long-term liquidity position of the firm
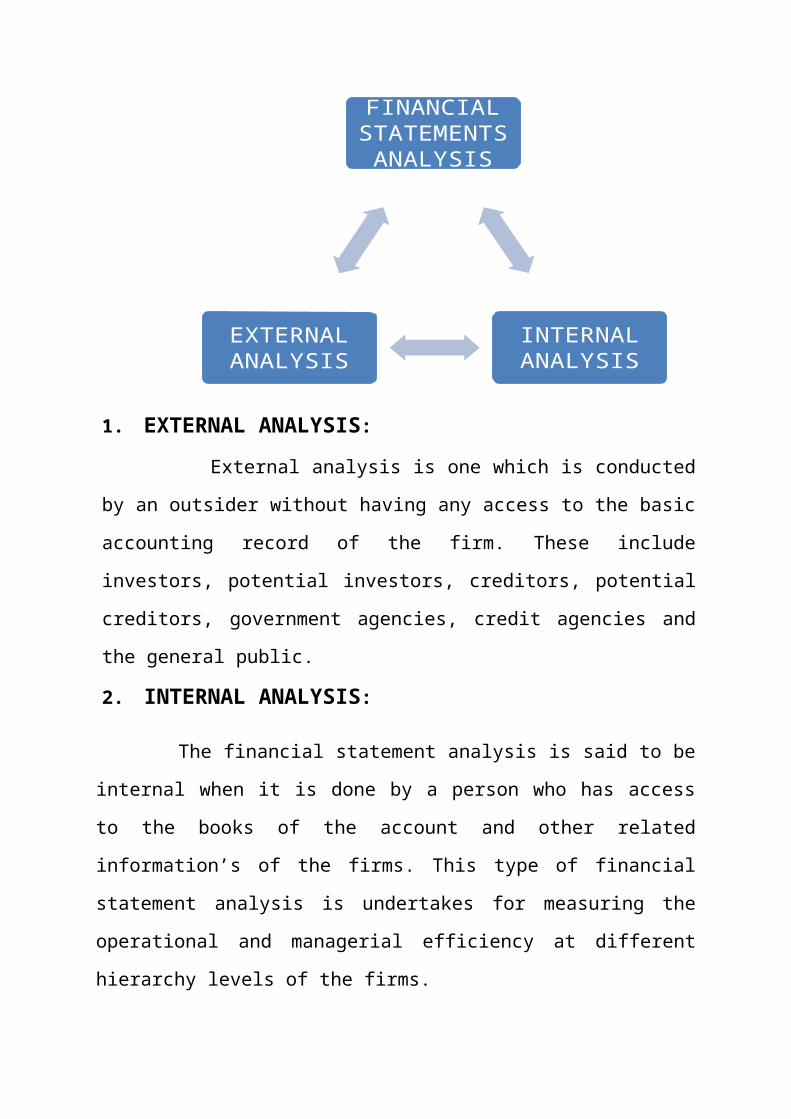
TYPES OF FINANCIAL STATEMENTS ANALYSIS :
1. EXTERNAL ANALYSIS:
External analysis is one which is conducted by an outsider without having
any access to the basic accounting record of the firm. These include investors,
potential investors, creditors, potential creditors, government agencies, credit
agencies and the general public.
2. INTERNAL ANALYSIS:
The financial statement analysis is said to be internal when it is done by a
person who has access to the books of the account and other related
information’s of the firms. This type of financial statement analysis is
undertakes for measuring the operational and managerial efficiency at different
hierarchy levels of the firms.
FINANCIAL STATEMENTS
ANALYSIS
INTERNAL ANALYSIS
EXTERNAL ANALYSIS
CHAPTER-2
RESEARCH DESIGN
STATEMENT OF THE PROBLEM :
Financial statement analysis is very important in financial management;
this requires deep study on the analysis of the available statement and
interpretation. It is very crucial to analyze the performance of a manufacturing
industry.
Analysis of financial performance is one of the major requirements for
planning because owners, management, creditors, prospective investors, and
employees are involved in the decision making process. Government and
financial institutions require it, as they are interested to know the financial
soundness of the company.
Financial statements exhibit the occurrences in a given period of time.
But there are certain important financial matters, which can be known only
through analysis of these financial statements. Thus, it is important to know the
behavior of items in the financial statements. This underlines the importance of
financial statement analysis and the current study is conducted to investigate
into financial statements to evaluate the performance and profitability of
Karnataka Soaps and Detergents Ltd.

OBJECTIVES OF THE STUDY:
Following are the objectives of analyzing the financial statements:
To analyze present and future earning capacity of profitability of
KS&DL,
To understand the short-term and long term solvency of KS&DL for
the benefit of the debenture holders and trade creditors.
To evaluate financial stability of KS&DL.
To study the significance of financial data, and long term liquidity of
its funds.
To evaluate operational efficiency of KS&DL as a whole and of its
various parts or departments.
SCOPE OF THE STUDY :
The scope of the study covers evaluating the financial performance by
analyzing the financial statement of Karnataka Soaps and Detergent Limited
which were collected from the present record and from discussion with the
company’s accountant. The study aims at analyzing the financial statement of
Karnataka Soaps and Detergent Limited over last five years and interpreting
the different ratios and suggesting remedies for better performance
RESEARCH METHODOLOGY
TITLE OF THE STUDY
"A STUDY ON THE ANALYSIS AND INTERPRETATION OF
FINANCIAL STATEMENTS WITH SPECIAL REFRENCE TO
KARNATAKA SOAPS AND DETERGENTS LIMITED”
Research Methodology :
The purpose of methodology is to describe the process involved in research work. This includes the overall research design, data collection method, the field survey and the analysis of data
RESEARCH DESIGN
A research design is a logically and systematic plan prepared for directing a research study. It specifies the objectives of the study, the methodology and the techniques to be adopted for achieving the objectives. It constitutes the blue print for the collection, measurement and analysis of data
It is an outline that specifies the sources and the types of information
relevant to the research question.
It is a blue print specifying the methods to be adopted for gathering and
analysis the data.
It should facilitate in obtaining required information.
It should suit to the availability of resources and time.
TYPE OF STUDY
The research is made in a descriptive way of study. The financial statements
are analyzed through various tools of financial statements analyses. Analytical
study which helps to analyze financial statement of the company.
SOURCES OF DATA
1. Primary data
Primary data can collected through the information within the
organization and through references of the officials of the company.
2. Secondary data
Secondary data is obtained through the use of statistical techniques which
are further used for planning of analysis.
PLAN OF ANALYSIS
The data collected from the secondary sources have to be processed &
interpreted systematically it includes such as:
Interpretation of the study for 5years.
Application of ratio analysis for the period of the study
Identification of the changes in the working capital with the increase or
decrease of the amount in the balance sheet of 5 years.
Calculation of various ratios reflecting the current ratio, quick ratio, cash
ratio, inventory turnover ratio, creditors turnover ratio, average payment
period, working capital ratio etc..
LIMITATION OF THE STUDY
The information is based on data supplied by factory personnel and the data
restricted to KS&DL.
Analysis in the study will be depended on the information provided by the
company.
The study is done only on the basis of financial statement of 5years only.
CHAPTER SCHEME
I. INTRODUCTION: This chapter includes definition of financial
analysis, types of financial analysis, significance of financial analysis.
Introduction, meaning, objectives, types, procedure, methods of
financial statements analysis.
II. RESEARCH DESIGN:
Introduction, meaning, definition of research design.Nature/essential
of a good research design. It also includes Title of the project,
statement of the problem, objective of the study, research technique,
sampling design, methods of data collection, tools of data collection,
plan of analysis, limitations of the study, chapter scheme.
III. COMPANY PROFILE:
This chapter gives us the profile of KS&DL. It provides details
regarding KS&DL, nature of its activities, organizational structure,
functional departments, its vision and mission, business operations,
product profile, market status, competitors, a brief SWOT analysis
and future prospects for the growth of KS&DL.
IV. ANALYSIS AND INTERPRETATION:
This chapter focuses upon the data which is collected to know the
liquidity position, comparative balance sheet and common size
balance sheet. This chapter also shows various ratios like current ratio,
liquidity ratio, turnover ratios and the liquidity position of KS&DL.
V. FINDINGS AND RECOMMENDATIONS:
This chapter of the study includes the findings of the overall study at
KS&DL on basis of data analysis and the conclusion which is online
with objectives of the research.
CHAPTER-3
COMPANY PROFILE
INDUSTRY PROFILE:
Soap is one of the commodities which have become an indispensable part of the life of modern world. Since it is non durable consumer goods, there is a large market for it. The whole soap industry is experiencing changes due to innumerable reasons such as government relations environment and energy problems increase in cost of raw material etc. The changing technology and ever existing desire by the individual and the organization to produce a better product at a more economical rate has also acted as catalyst for the dynamic process of change. More and more soap manufactures are trying to capture a commanding market share by introducing new products. The soap industry in India faces a cut throat competition with mult inat ional companies dominate the market . They are also facing severe threat fromdynamic and enterprising new entrance especially during 1991-92.If we look back into the history of soaps & detergents, mankind knew about soaps nearly 2000 years back i.e. in 70 A.D. when Mr. Elder accidentally discovered the soap, when roasted meat over f lowed on the glow in ashes. This lump l ike product was soap & had foaming & cleansing character. In 1192 A.D. the first commercial batch of soaps was made &marketed by M/s Bristol soap market in London, from there in 1662A.D. the first patent for making soap was taken in London. The world consumption of soap in 1884A.D. was said to be 2 lakh tonnes p.a.
HISTORY OF THE SOAP:
Soap manufacturing was started in North America. Some American companies with well known names were started 200 years ago. During middle age soap was made at various places in Italy, France, England & other countries. France became famous & many small factories were established there.
In India the first soap industry was established by North West soap company in1897 at Meerut following the swadeshi movement. From 1905 on wards few more factories were setup. They are,
Mysore soap factory at Bangalore Godrej soap at Bombay Bengal chemicals Tata oil mills 1930 lever brothers comp
THE INDIAN SOAP INDUSTRY SCENARIO:
The Indian soap industry has long been dominated by hand full of companies such as:
1. Hindustan levers limited2. Tata oil mills (taken over by HLL)3. Godrej soaps private limited.
The Indian soap industry continued to flourish very well until 1967-68, but began to stagnate & soon it started to recover & experienced a short upswing in 1974. This increase in demand can be attributed due to;1 . G r o w t h o f p o p u l a t i o n .2. Income & consumption increase.3 . I n c r e a s e i n u r b a n i z a t i o n .4. Growth in degree of personal hygiene.
PRESENT STATUS:
Market scenario:
India is the ideal market for cleaning products. Hindustan liver, which towers over the cleaning business, sells in all over the cleaning business but the tiniest of Indian settlements. The 7.4 lakhs tons per annum soap market in India in crawling along at 4%The hope lies in raising Rupee worth, the potential for
which is high because the Indian soap market is pseudo in nature & it is amazingly complex being segmented not only on the basis of price benefits, but even a range of emotions within that outlining framework.
PROBLEMS OF SOAP INDUSTRY:
Soap industry faces some problems in case of raw materials.
The major ingredients are soap ash l inear alkyl , benzene& sodium. Tripoli phosphate poses number of serious problems in terms of availability. The demand supply gap for vegetable oil is 1.5 to 2 lakh tons & is met through imports. In recent times, caustic soda and soap ashes in the cheaper varieties of soaps are quite high.
COMPANY PROFILE
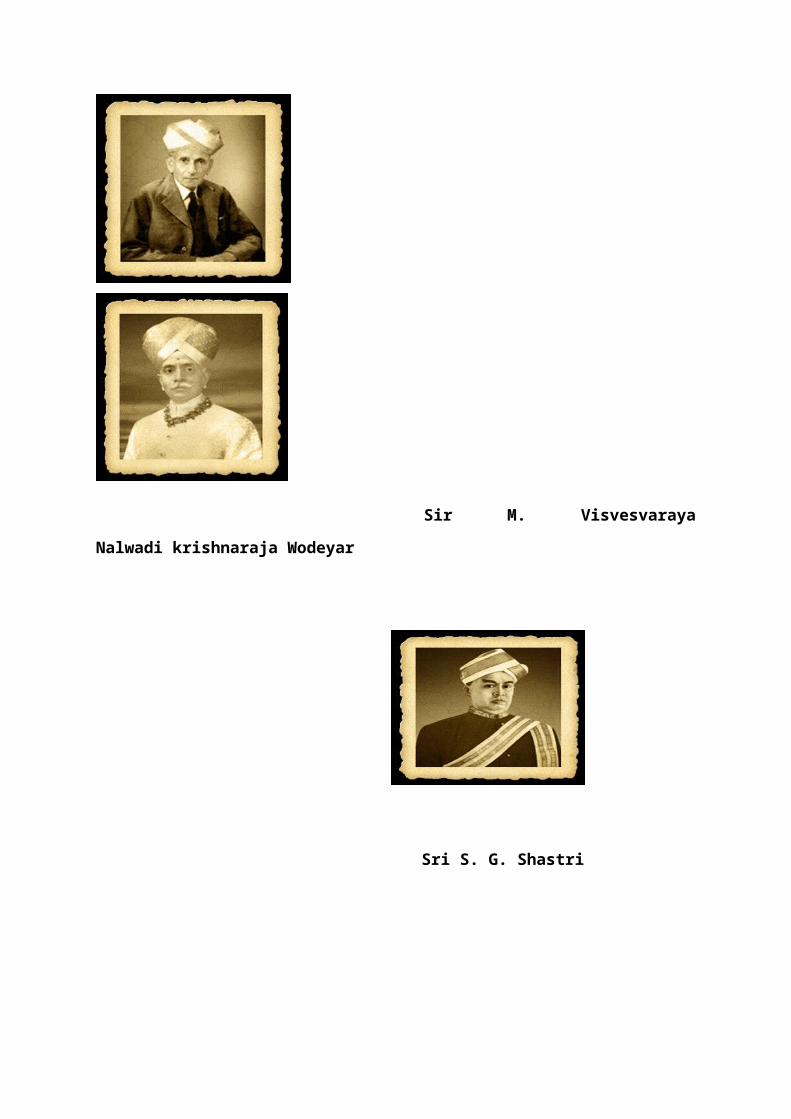
THE FOUNDERS OF MYSORE SANDAL SOAP:
Sir M. Visvesvaraya Nalwadi krishnaraja Wodeyar
Sri S. G. Shastri
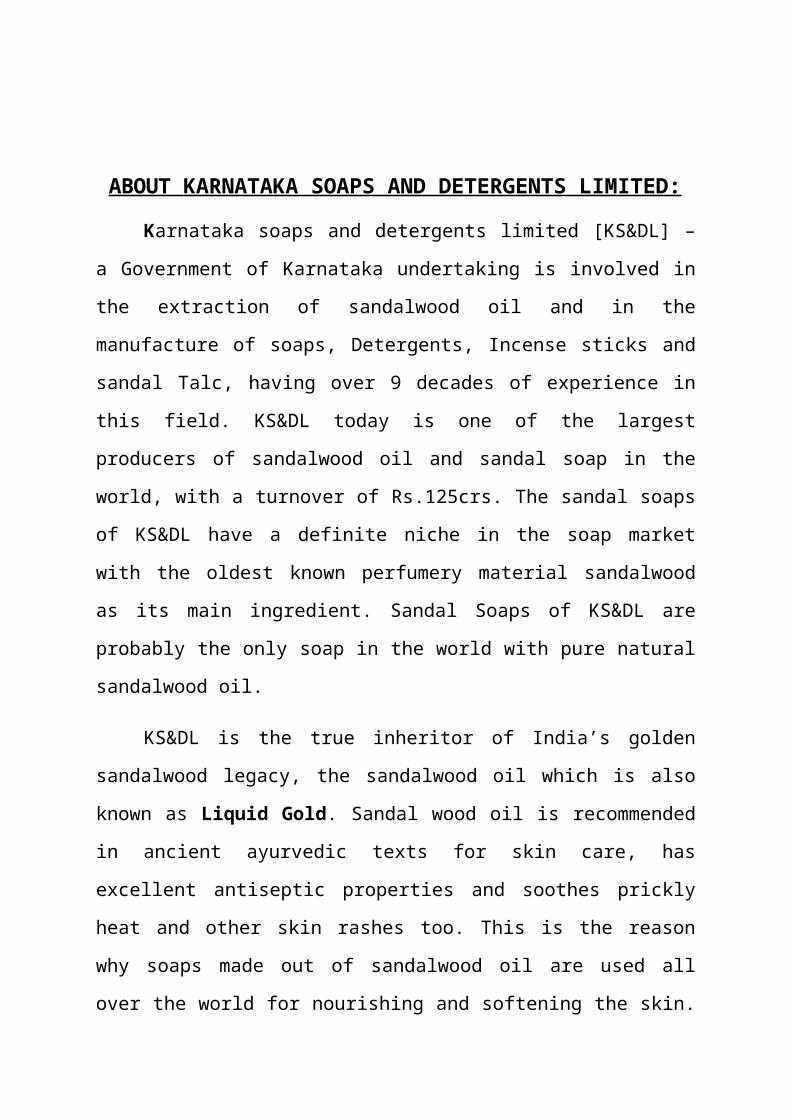
ABOUT KARNATAKA SOAPS AND DETERGENTS LIMITED:
Karnataka soaps and detergents limited [KS&DL] – a Government of
Karnataka undertaking is involved in the extraction of sandalwood oil and in the
manufacture of soaps, Detergents, Incense sticks and sandal Talc, having over 9
decades of experience in this field. KS&DL today is one of the largest
producers of sandalwood oil and sandal soap in the world, with a turnover of
Rs.125crs. The sandal soaps of KS&DL have a definite niche in the soap market
with the oldest known perfumery material sandalwood as its main ingredient.
Sandal Soaps of KS&DL are probably the only soap in the world with pure
natural sandalwood oil.
KS&DL is the true inheritor of India’s golden sandalwood legacy, the
sandalwood oil which is also known as Liquid Gold. Sandal wood oil is
recommended in ancient ayurvedic texts for skin care, has excellent antiseptic
properties and soothes prickly heat and other skin rashes too. This is the reason
why soaps made out of sandalwood oil are used all over the world for
nourishing and softening the skin. It was the availability of sandal wood oil,
which became a reason to set up a soap factory.
“Government soap Factory” in Bangalore was established by the
Maharaja of Mysore Nalwadi Krishna raja Wodeyar and Diwan Sir M.
Visvesvaraya during the year 1916. The soap making process was perfected
under the stewardship of eminent scientist Shri S. G. Shastri. The sandalwood
Oil Division in Mysore was established during the year 1916 and Sandalwood
Oil Division at Shimoga was established during the year 1944.
RENAMING:
On 1st October 1980, the Government Soap Factory was renamed as
“Karnataka Soaps and Detergent Limited” by integrating sandal oil factories at
Mysore, Shimoga and Bangalore. The Company was registered as a public
limited company. Today Company produces varieties of products in the toilet
soaps, detergent, agarbathies and Cosmetics.
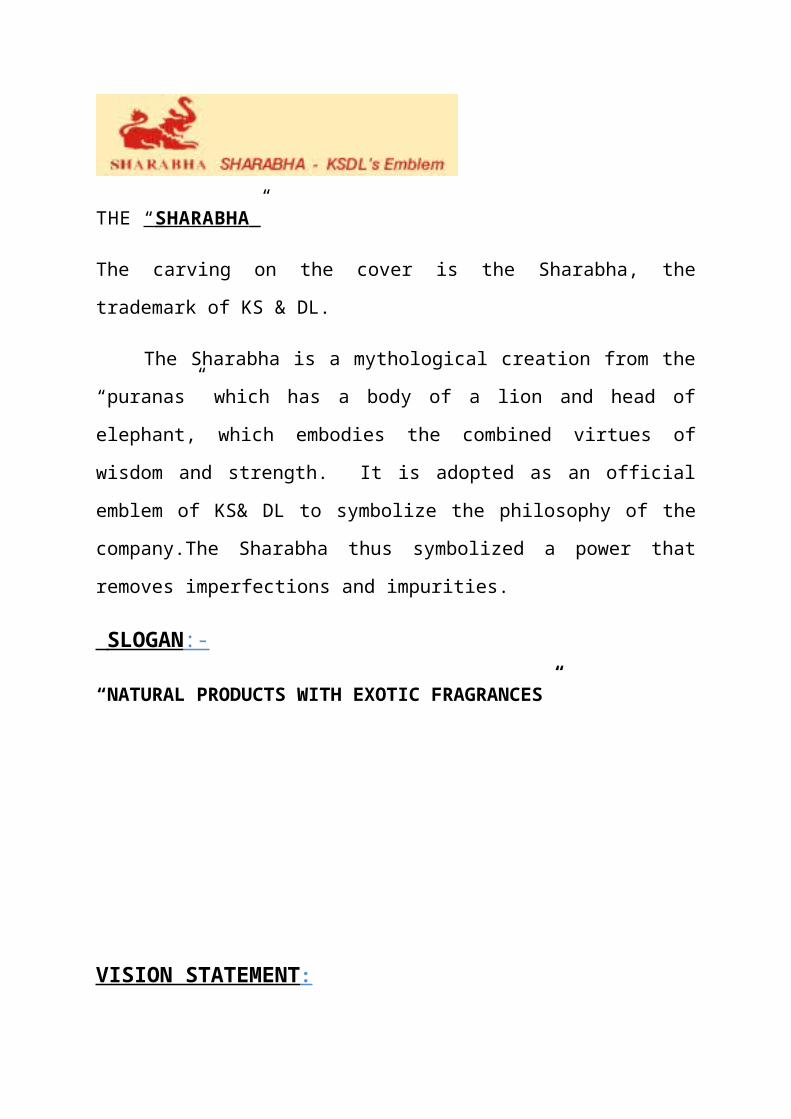
TRADEMAR OF KS & DL : -
THE “ SHARABHA ”
The carving on the cover is the Sharabha, the trademark of KS & DL.
The Sharabha is a mythological creation from the “puranas” which has a
body of a lion and head of elephant, which embodies the combined virtues of
wisdom and strength. It is adopted as an official emblem of KS& DL to
symbolize the philosophy of the company.The Sharabha thus symbolized a
power that removes imperfections and impurities.
SLOGAN :-
“NATURAL PRODUCTS WITH EXOTIC FRAGRANCES”
VISION STATEMENT :
Keeping pace with globalization, global trends and the state’s policy for
technology in every aspect of governance.
Ensuring global presence of Mysore Sandal products while leveraging its
unique strengths to take advantage of the current technology scenario by
intelligent and selective diversification.
Further, ensure Karnataka’s pre-eminent status as a proponent and
provider of technology services to the world, nation, other states public
and private sectors.
Making all out efforts to achieve reasonable profits.
Most importantly to earn the invaluable foreign exchange, both to the
state and to the country.
MISSION STATEMENT :-
To serve the National economy.
To attain self-reliance.
To promote purity & quality products
To maintain the Brand loyalty of its customers.
To build upon the reputation of Mysore sandal soap based on pure sandal
oil.
OBJECTIVES OF KS & DL: -
To attain self – reliance.
To promote and uphold its image as symbol of traditional products
To promote purity and quality products and thus enhance age old – charm
of Sandalwood Oil.
To build upon the reputation of Mysore Sandal soap based on pure sandal
oil.
To maintain the brand loyalty of its customer.
To supply the products mentioned above at most reasonable and
competitive rate.
POLICY OF KS&DL:-
Seek purchase of goods and services from environment responsible
suppliers.
Communicate its environment policy and best practices to all its
employees’ implications.
Set targets and monitor progress through internal and external audits.
Strive to design and develop products, which have friendly environmental
impact during manufacturing.
. Reuse and recycle materials wherever possible and minimize energy
consumption and waste.
COMPETITORS OF KS&DL PRODUCT AND SERVICES:-
KS&DL is facing cut-throat competition in national and international market.
Some of its main competitors are:-
M/S. Hindustan Unilever Ltd
M/S. Godrej Soaps Private Ltd
M/S. Proctor& Gamble
M/S. Wipro
M/S. Nirma Soaps Private Ltd
M/S. Jyothi Laboratories
DEPARTMENTS OF KS&DL:
Human Resources Department
Production Department
Marketing Department
Finance\Accounts Department
Research & Development Department
Stores Department
Welfare Department
Maintenance Department
Materials Department
Management Information System Department
AN ISO-9001 AND ISO-14001 COMPANY :
KS & DL with a tradition of excellence of over eight decades is
committed to customer delight, through total quality management and
continuous improvement through the involvement of all employees. KS&DL
has got ISO 9002 certificate.The Company got itself upgraded to ISO-9001-
2004, Quality Systems in the year 2004-05
The company is located in the heart of the Bangalore city. The management
of the company took a decision to get the ISO-14001 and become model to
other public sector for the techniques used and also to other Government units
to spread the message of maintenance of environment.
ISO-14001 and ISO-9001 will facilitate to improve the corporate brands
in the global market and it will help the company to improve the profits, year
after year on long-term basis. The environment management system adopted in
the company through this motive as follows:
Conservation of energy
Conservation of Surrounding
Conservation of resources
PRODUCT PROFILE :
KS&DL is the true inheritor of golden legacy of India. Continuing the
tradition of excellence for over eight decades, using only the best East Indian
grade Sandalwood oil & Sandalwood soaps in the world. The products produced
at KS&DL are the Soaps, Detergents, Agarbathies and Sandalwood oil.
a)PRODUCT RANGE FROM THE HOUSE OF MYSORE
SANDAL SOAP:
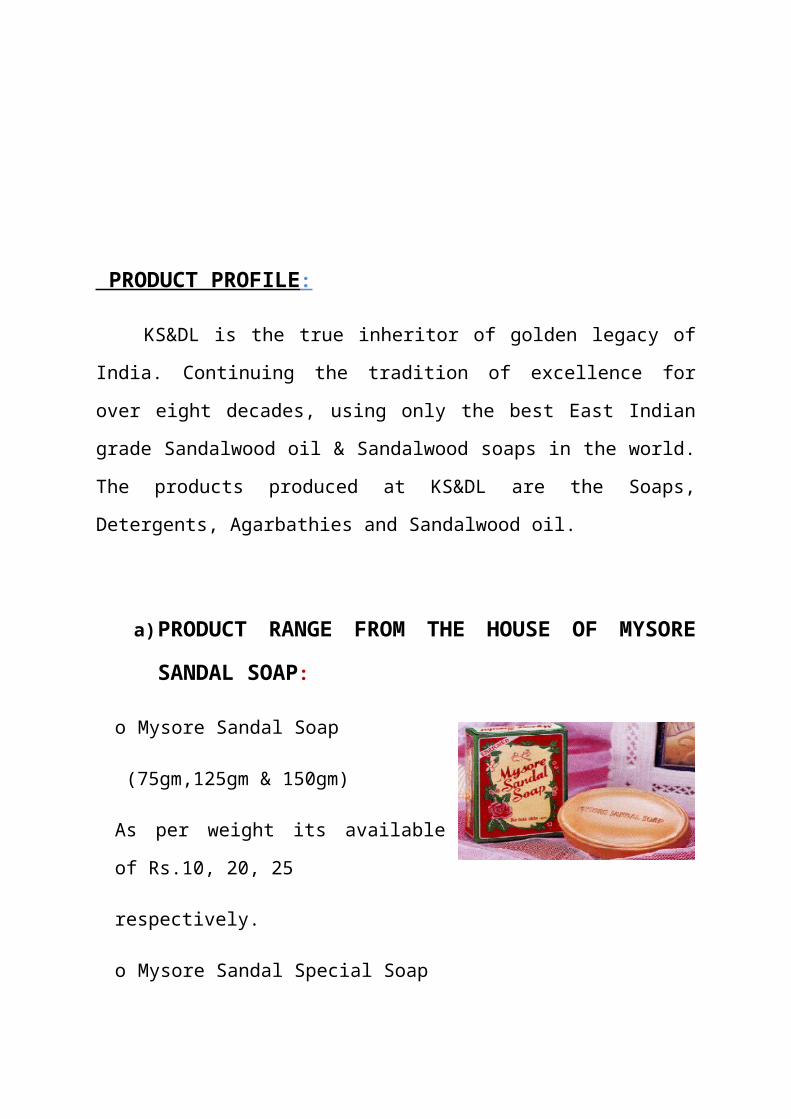
o Mysore Sandal Soap
(75gm,125gm & 150gm)
As per weight its available of Rs.10, 20, 25
respectively.
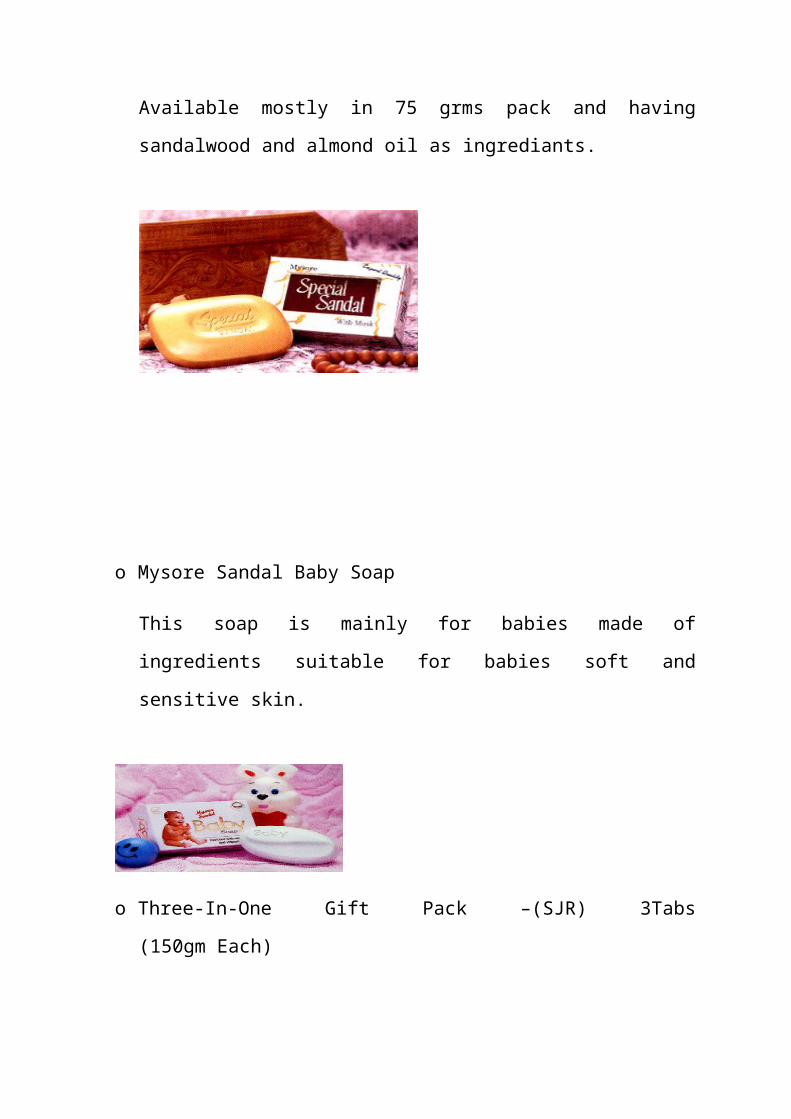
o Mysore Sandal Special Soap
Available mostly in 75 grms pack and having sandalwood and almond oil
as ingrediants.
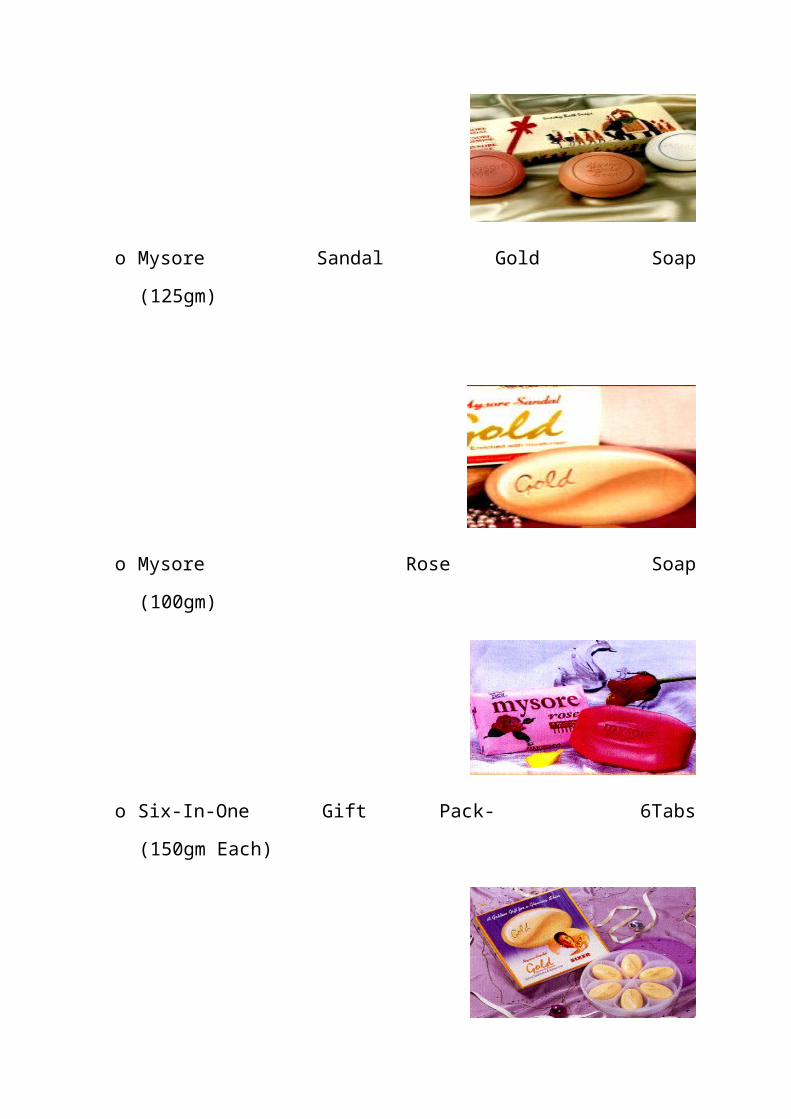
o Mysore Sandal Baby Soap
This soap is mainly for babies made of ingredients suitable for babies soft
and sensitive skin.
o Three-In-One Gift Pack –(SJR) 3Tabs (150gm Each)
o Mysore Sandal Gold Soap (125gm)
o Mysore Rose Soap (100gm)
o Six-In-One Gift Pack- 6Tabs (150gm Each)
o Mysore Sandal Gold sixes 6 Tabs (125gm Each)
o Mysore Sandal Soap Bath Tablet Trio 3nos. (150gm Each)
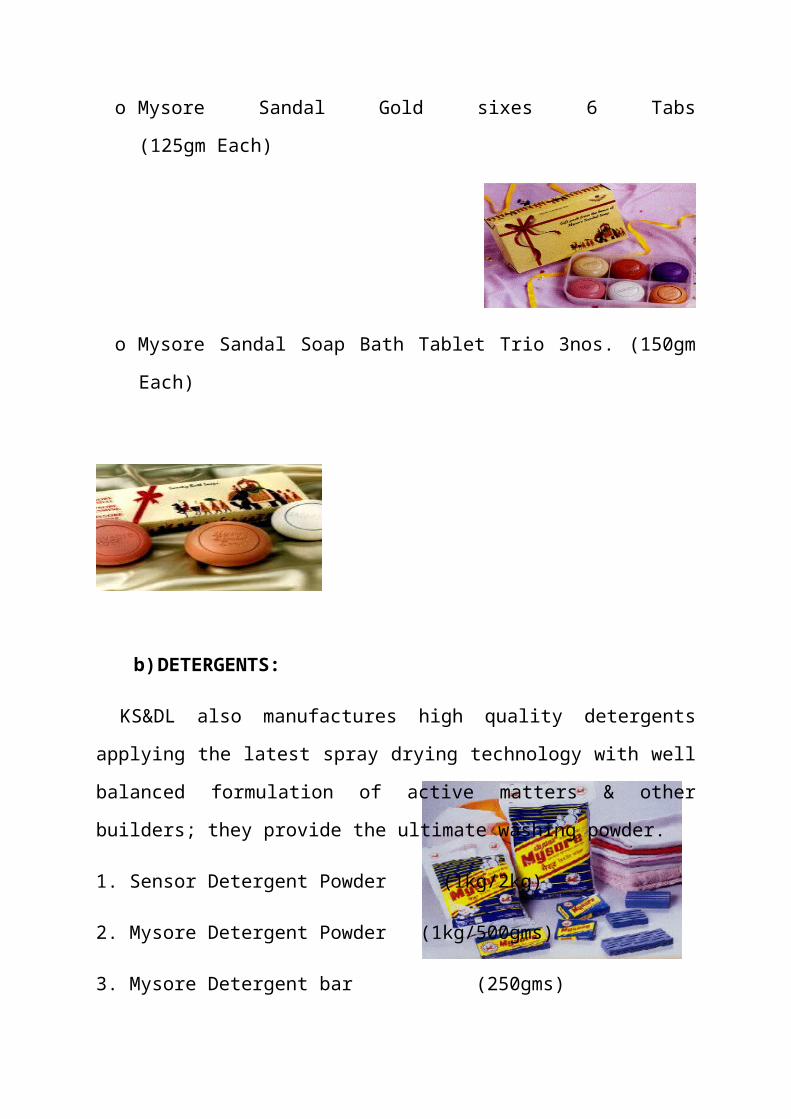
b) DETERGENTS:
KS&DL also manufactures high quality detergents applying the latest spray
drying technology with well balanced formulation of active matters & other
builders; they provide the ultimate washing powder.
1. Sensor Detergent Powder (1kg/2kg)
2. Mysore Detergent Powder (1kg/500gms)
3. Mysore Detergent bar (250gms)
4. Mysore Detergent Cake (125gms/250gms)
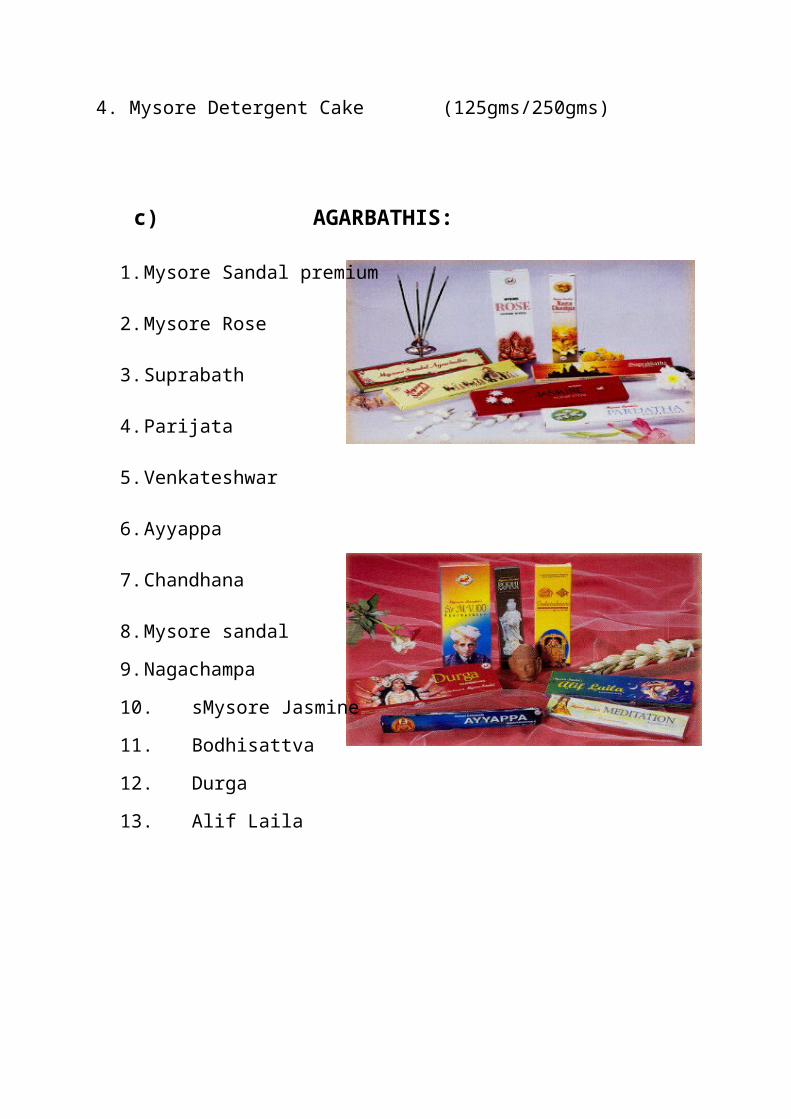
c) AGARBATHIS:
1. Mysore Sandal premium
2. Mysore Rose
3. Suprabath
4. Parijata
5. Venkateshwar
6. Ayyappa
7. Chandhana
8. Mysore sandal
9. Nagachampa
10.sMysore Jasmine
11.Bodhisattva
12.Durga
13.Alif Laila
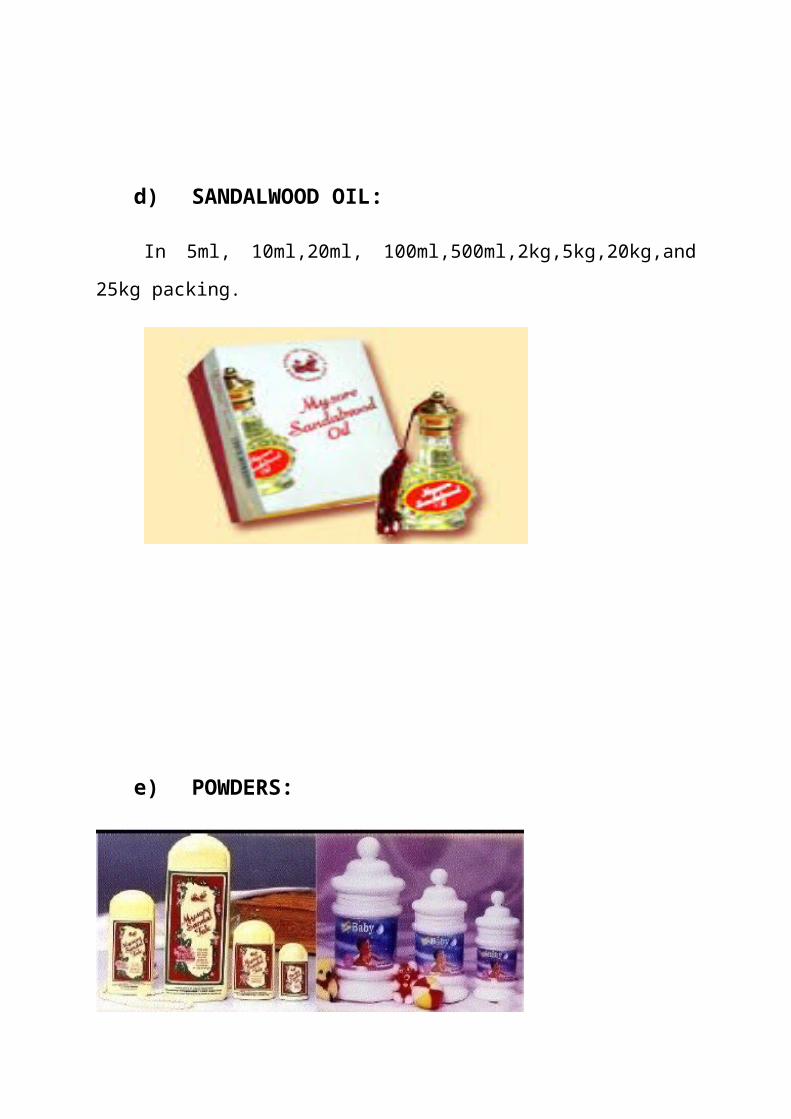
d) SANDALWOOD OIL:
In 5ml, 10ml,20ml, 100ml,500ml,2kg,5kg,20kg,and 25kg packing.
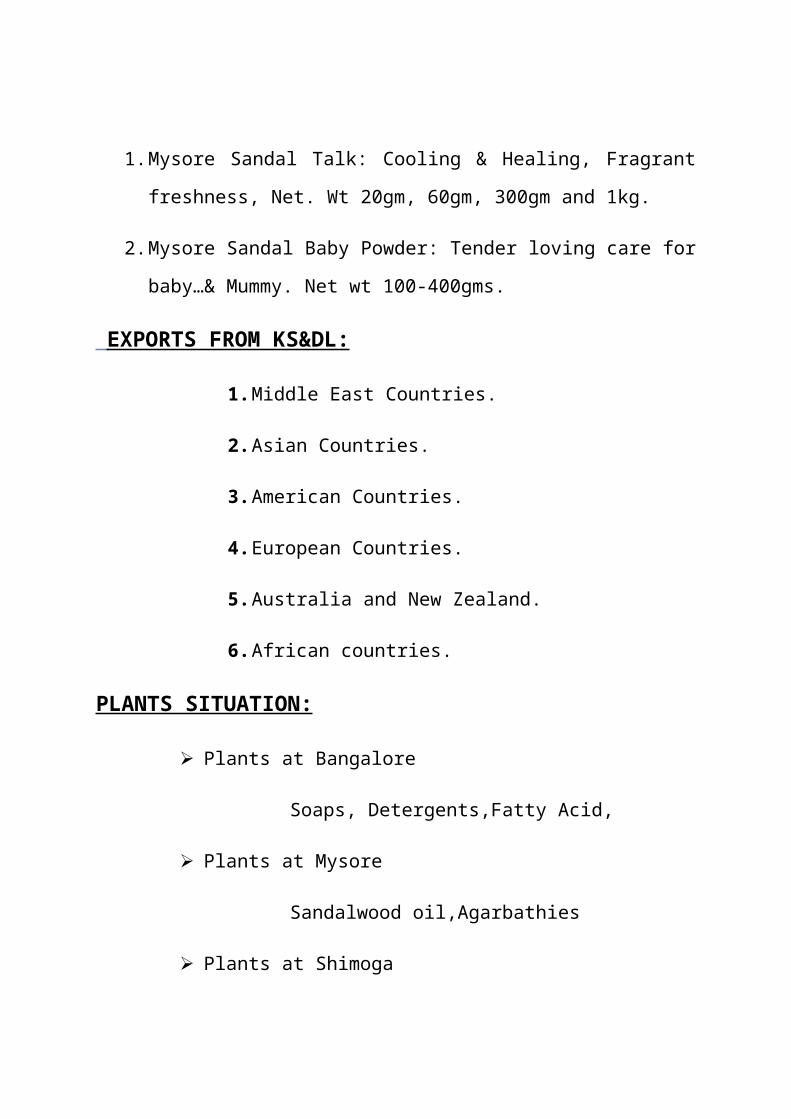
e) POWDERS:
1. Mysore Sandal Talk: Cooling & Healing, Fragrant freshness, Net. Wt
20gm, 60gm, 300gm and 1kg.
2. Mysore Sandal Baby Powder: Tender loving care for baby…& Mummy.
Net wt 100-400gms.
EXPORTS FROM KS&DL:
1. Middle East Countries.
2. Asian Countries.
3. American Countries.
4. European Countries.
5. Australia and New Zealand.
6. African countries.
PLANTS SITUATION:
Plants at Bangalore
Soaps, Detergents,Fatty Acid,
Plants at Mysore
Sandalwood oil,Agarbathies
Plants at Shimoga
OWNERSHIP PATTERN:
“Wholly owned by Government of Karnataka”.
PRESENT STATUS:
1. The company has entered into shampoo, dish wash, detergent bar & room
refresher.
2. The company is striving to develop new perfumes for soaps detergents,
agarbathies & shampoo.
3. The company wants to improve the existing products in terms of quality.
ACHIEVEMENTS AND AWARDS OF KARNATAKA SOAPS
AND DETERGENTS LIMITED :
Government of Karnataka
Dept of Industries and commerce
State Export Promotion Advisory Board. “EXPORT AWARD” 1974-75
Geographical Indication GI-2005
ISO 9001-2000 in the year 1999
ISO 14001-2004 in the year 2000
FUTURE GROWTH AND PROSPECTUS :
Introduction of anti-bacteria, herbal transparent soap, made out of 33
essential oil based Timely introduction and implementation of market
driven decisions.
Improvement in existing products Mysore Sandal classic improved
moisturizers & skin conditions.
Introduction of sandalwood powder in 50gms, 100gms to meet the
growing demand for religious purpose.
Introduction of new higher powered detergent powder for institutional
sales in bulk packaging.
To attain market leadership.
Introduction of new trade schemes to increase sales.
Aggressive advertisement and publicity as part of sales promotion.
Reduction in distribution expenses.
Cost-reduction in all areas.
BANKERS:
“KARNATAKA SOAPS AND DETERGENTS LIMITED” being a
huge organization, should possess better banking facilitates to meet the timely
requirements of capital of the company & to fulfill the financial obligations of
supplies, customers & other personnel having relationship with the company.
The Bankers of the company are:
STATE BANK OF MYSORE
CANARA BANK
VIJAYA BANK
SYNDICATE BANK
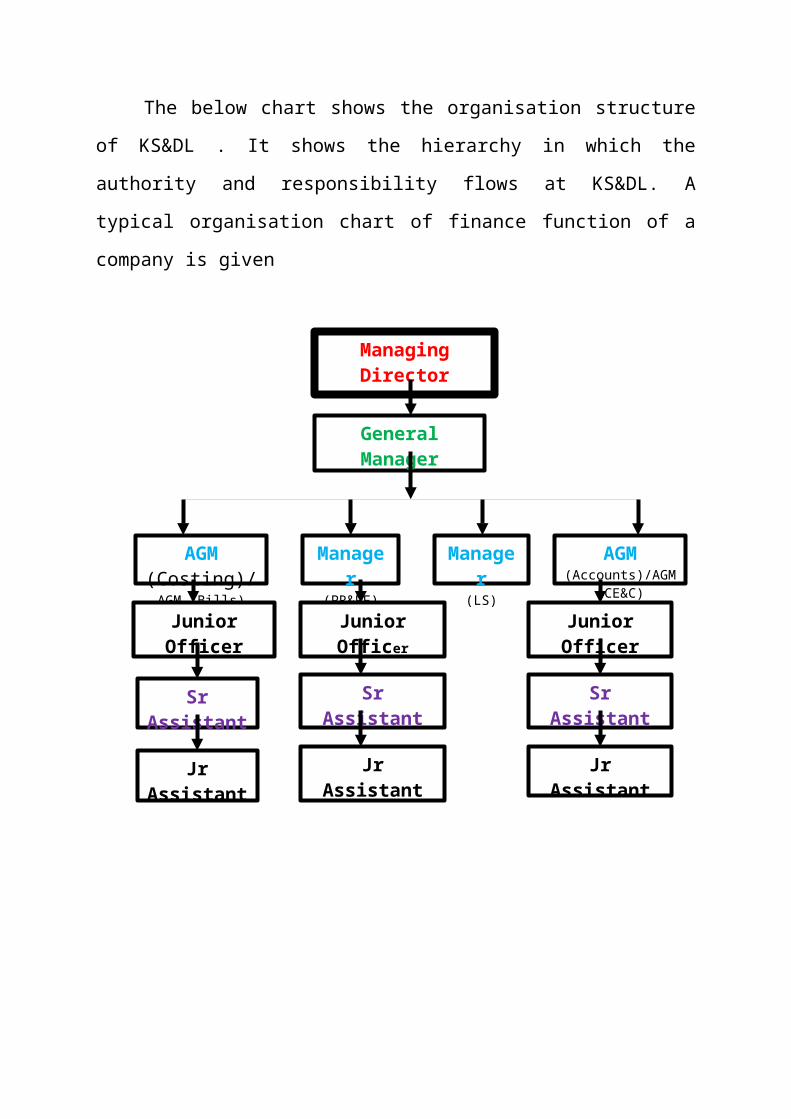
ORGANISATION CHART OF FINANCE FUNCTION :
The below chart shows the organisation structure of KS&DL . It shows
the hierarchy in which the authority and responsibility flows at KS&DL. A
typical organisation chart of finance function of a company is given
Managing Director
General Manager
AGM (Costing)/
AGM (Bills)
Manager(PR&PF)
Manager(LS)
AGM (Accounts)/AGM
(CE&C)
Junior Officer
Sr Assistant
Jr Assistant
Junior Officer
Sr Assistant
Jr Assistant
Junior Officer
Sr Assistant
Jr Assistant
LEVELS OF ORGANISATION :
The organization of KS&DL consists of 4 levels, they are
TOP LEVEL consisting of BOD’s and M.D
SECOND LEVEL consisting of Directors of Finance and Special officers
THIRD LEVEL consisting of senior managers, deputy managers and
officers.
FOURTH LEVEL consisting of clerks, Assistants and Attendees.
SWOT ANALYSIS:
1. STRENGTHS :
The Mysore sandal soap contains pure sandal and almond oil.
Certified by ISO.
World’s largest production of sandalwood oil.
Brand name from decades in soap market.
It has very good dealership network in south which ensures that the
products reach every customer.
Diversified product range helps the company to maintain stability.
2. WEAKNESSESS:
Distribution network is weak in north and east.
Absence of television advertisement.
High oriented cost due to excessive labour force.
Neglecting freshness aspect.
Low turnover resulting in low profit.
3. OPPORTUNITIES :
Traditional benefits that sandal is good for skin.
Skin care is just gaining importance among consumers
As a soap attribute.
Government support and large production capacity.
Advantages of being in the industry for a long time.
Existence of vast market and huge demand.
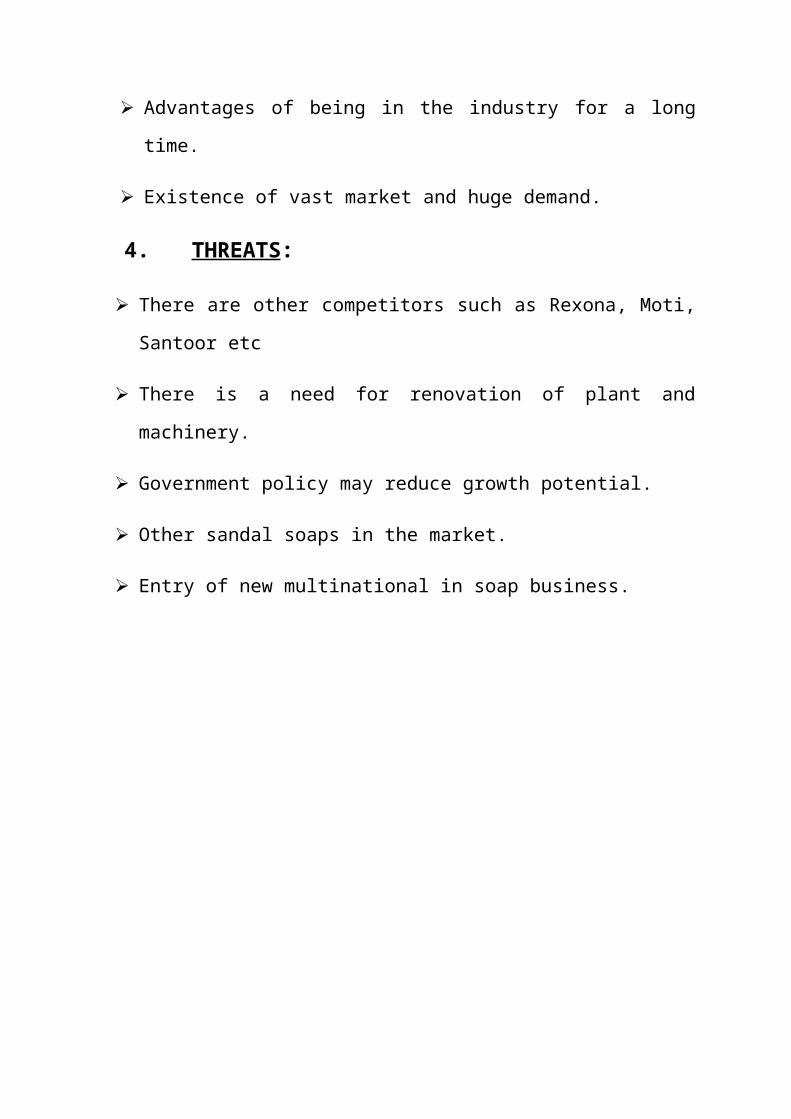
4. THREATS :
There are other competitors such as Rexona, Moti, Santoor etc
There is a need for renovation of plant and machinery.
Government policy may reduce growth potential.
Other sandal soaps in the market.
Entry of new multinational in soap business.
CHAPTER-4
DATA ANALYSIS AND INTERPRETATION
DATA ANALYSIS AND INTERPRETATION
MEANING OF ANALYSIS:
Analysis is the process by which, the whole body of gathered data,
facts, figures and ideas, is converted into meaningful and usable
information.
MEANING OF INTERPRETATION:
Interpretation refers to the task of drawing inferences from the
collected facts after analytical and/or experimental study. In short, it is a
search for broader meaning of research findings.
MEANING OF ANALYSIS AND INTERPRETATION:
In the words of Kennedy and Memullar, "The analysis and
interpretation of financial statements are an attempt to determine the
significance and meaning of the financial statements data so, that a forecast
may be made of the prospects for future earnings"
TECHNIQUES/TOOLS OF ANALYSIS AND INTERPETATION :
1. COMPARITIVE FINANCIAL STATEMENTS
2. COMMON MEASUREMENT STATEMENTS
3. TREND PERCENTAGE ANALYSIS
4. FUNDS FLOW STATEMENTS
5. CASH FLOW STATEMENTS
6. NET WORKING CAPITAL ANALYSIS
7. RATIO ANALYSIS
Among the various above techniques two tools have been selected in
order to analyze the financial statement of KS&DL , the tools used are:
1. COMPARATIVE FINANCIAL STATEMENTS
2. RATIO ANALYSIS
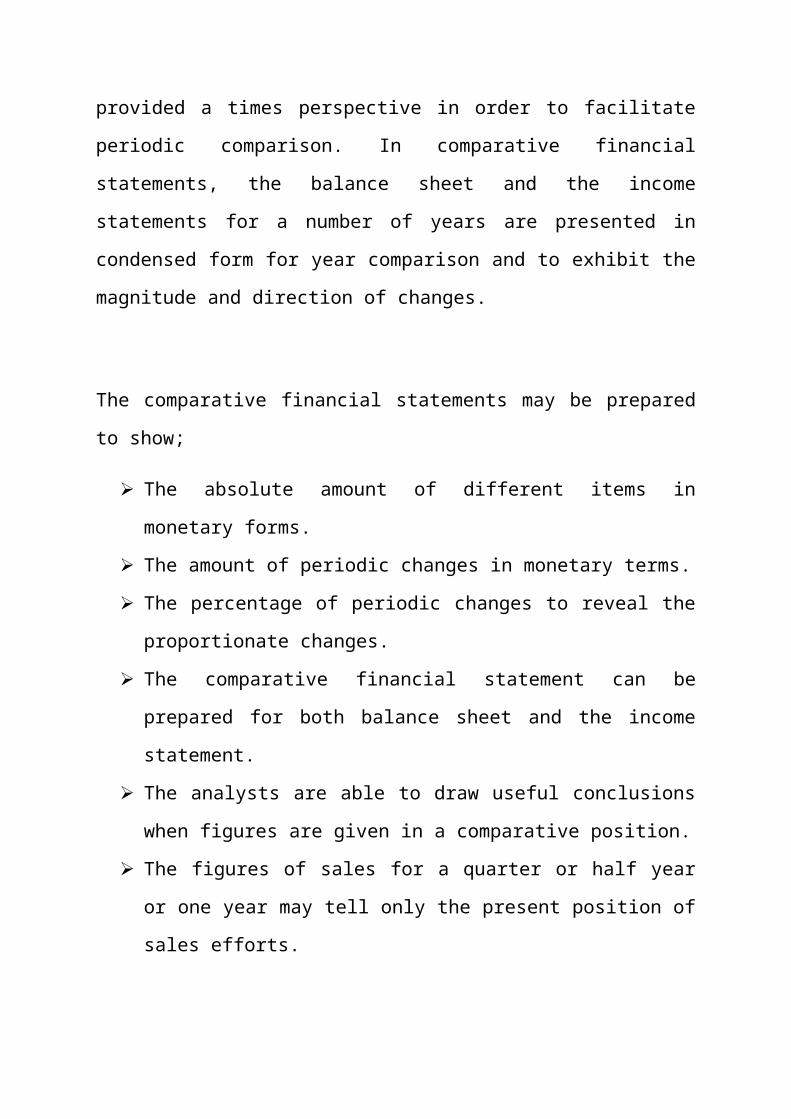
1. COMPARATIVE FINANCIAL STATEMENTS:
In comparative financial statements two or more balance sheets and or the
income statement of a firm are presented simultaneously in columnar form. The
financial data for two or more years are placed and presented
in adjacent columns and thereby the financial data is provided a times
perspective in order to facilitate periodic comparison. In comparative financial
statements, the balance sheet and the income statements for a number of years
are presented in condensed form for year comparison and to exhibit the
magnitude and direction of changes.
The comparative financial statements may be prepared to show;
The absolute amount of different items in monetary forms.
The amount of periodic changes in monetary terms.
The percentage of periodic changes to reveal the proportionate changes.
The comparative financial statement can be prepared for both balance
sheet and the income statement.
The analysts are able to draw useful conclusions when figures are given
in a comparative position.
The figures of sales for a quarter or half year or one year may tell only the
present position of sales efforts.
COMPARATIVE BALANCE SHEET:
The comparative balance sheet analysis is the study of the trend of the
same items, group of items and computed items in two or more balance sheets
of the same business enterprise on different dates. The changes in periodic
balance sheet items reflect the conduct of a business. The changes can be
observed by comparison of the balance sheet at the beginning of the year and at
the end of the year.
These changes will help in forming an opinion about the progress of an
enterprise. The comparative balance sheet has two columns for the data of
columns for the data of original balance sheets. A third column is used to show
increase in figures. The fourth and last column may be added for showing
percentages of increases or decreases.
This statement prepared on two or more different dates can be used for
comparing sources of funds under that secured loans, unsecured loans and
reserves & surplus.
These statements also used to compare fixed and current assets, liabilities
& provision and to find out increase/decrease in these items.
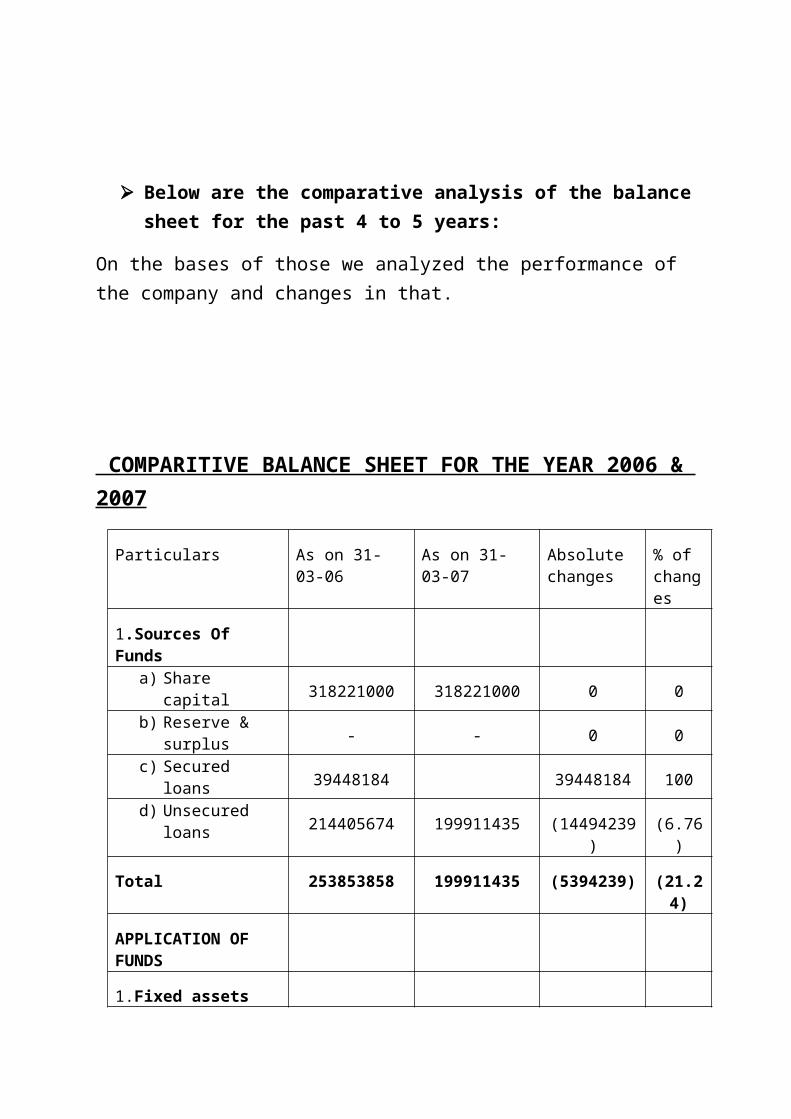
Below are the comparative analysis of the balance sheet for the past 4 to 5 years:
On the bases of those we analyzed the performance of the company and changes in that.
COMPARITIVE BALANCE SHEET FOR THE YEAR 2006 & 2007
Particulars As on 31-03-06 As on 31-03-07 Absolute changes
% of changes
1.Sources Of Fundsa) Share capital
318221000 318221000 0 0b) Reserve & surplus
- - 0 0c) Secured loans
39448184 39448184 100d) Unsecured loans
214405674 199911435 (14494239) (6.76)
Total 253853858 199911435 (5394239) (21.24)
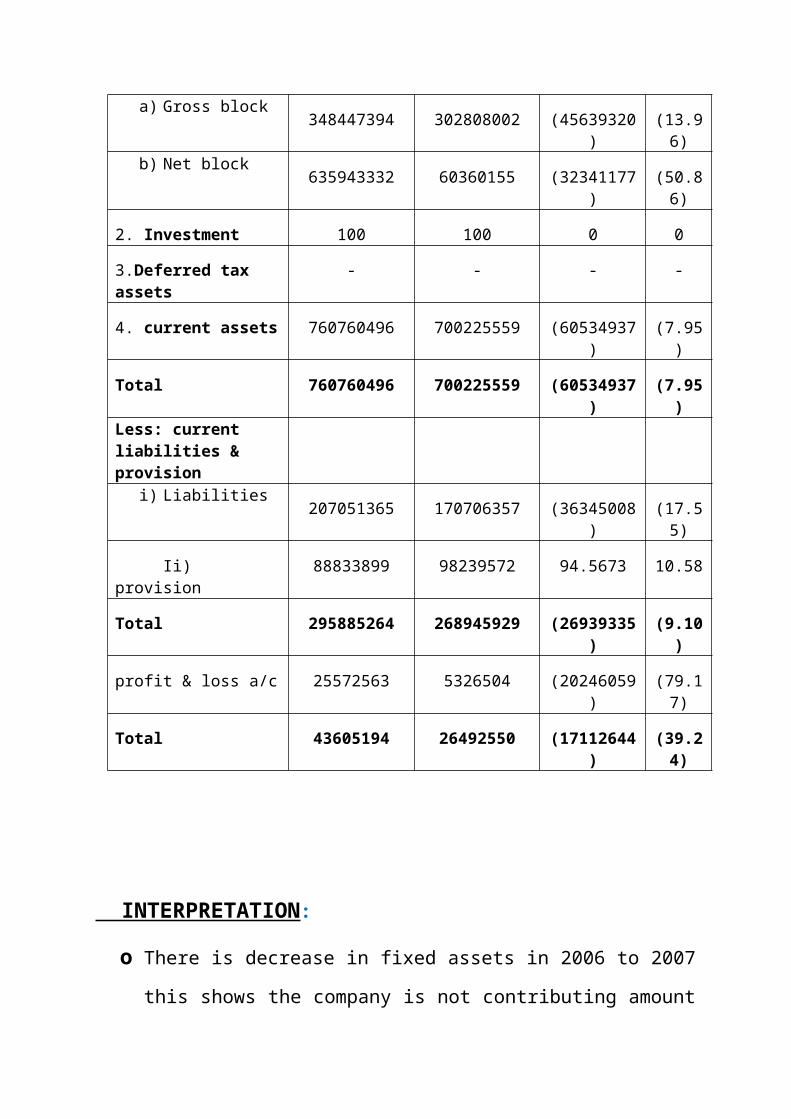
APPLICATION OF FUNDS
1.Fixed assetsa) Gross block
348447394 302808002 (45639320) (13.96)b) Net block
635943332 60360155 (32341177) (50.86)
2. Investment 100 100 0 0
3.Deferred tax assets - - - -
4. current assets 760760496 700225559 (60534937) (7.95)
Total 760760496 700225559 (60534937) (7.95)Less: current liabilities & provision
i) Liabilities207051365 170706357 (36345008) (17.55)
Ii) provision 88833899 98239572 94.5673 10.58
Total 295885264 268945929 (26939335) (9.10)
profit & loss a/c 25572563 5326504 (20246059) (79.17)
Total 43605194 26492550 (17112644) (39.24)
INTERPRETATION:
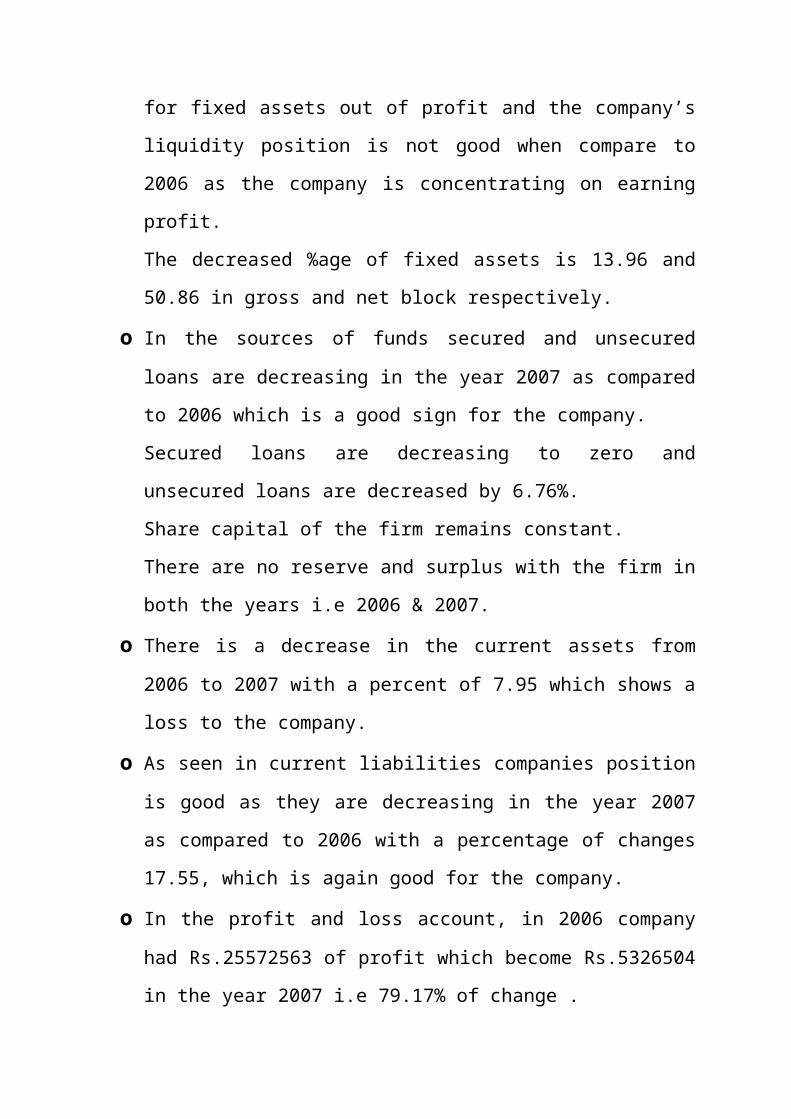
o There is decrease in fixed assets in 2006 to 2007 this shows the company
is not contributing amount for fixed assets out of profit and the
company’s liquidity position is not good when compare to 2006 as the
company is concentrating on earning profit.
The decreased %age of fixed assets is 13.96 and 50.86 in gross and net
block respectively.
o In the sources of funds secured and unsecured loans are decreasing in the
year 2007 as compared to 2006 which is a good sign for the company.
Secured loans are decreasing to zero and unsecured loans are decreased
by 6.76%.
Share capital of the firm remains constant.
There are no reserve and surplus with the firm in both the years i.e 2006
& 2007.
o There is a decrease in the current assets from 2006 to 2007 with a percent
of 7.95 which shows a loss to the company.
o As seen in current liabilities companies position is good as they are
decreasing in the year 2007 as compared to 2006 with a percentage of
changes 17.55, which is again good for the company.
o In the profit and loss account, in 2006 company had Rs.25572563 of
profit which become Rs.5326504 in the year 2007 i.e 79.17% of change .
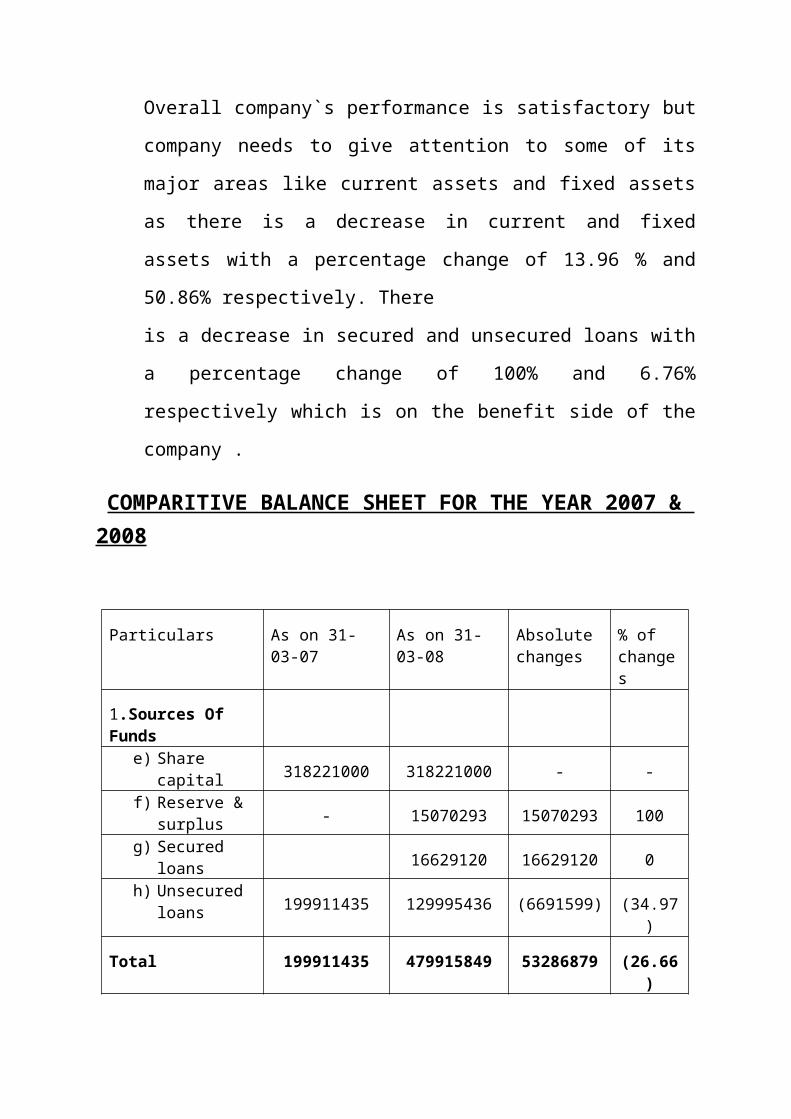
Overall company`s performance is satisfactory but company needs to
give attention to some of its major areas like current assets and fixed
assets as there is a decrease in current and fixed assets with a percentage
change of 13.96 % and 50.86% respectively. There
is a decrease in secured and unsecured loans with a percentage change of
100% and 6.76% respectively which is on the benefit side of the company
.
COMPARITIVE BALANCE SHEET FOR THE YEAR 2007 & 2008
Particulars As on 31-03-07 As on 31-03-08 Absolute changes
% of changes
1.Sources Of Fundse) Share capital
318221000 318221000 - -f) Reserve &
surplus - 15070293 15070293 100
g) Secured loans16629120 16629120 0
h) Unsecured loans 199911435 129995436 (6691599) (34.97)
Total 199911435 479915849 53286879 (26.66)
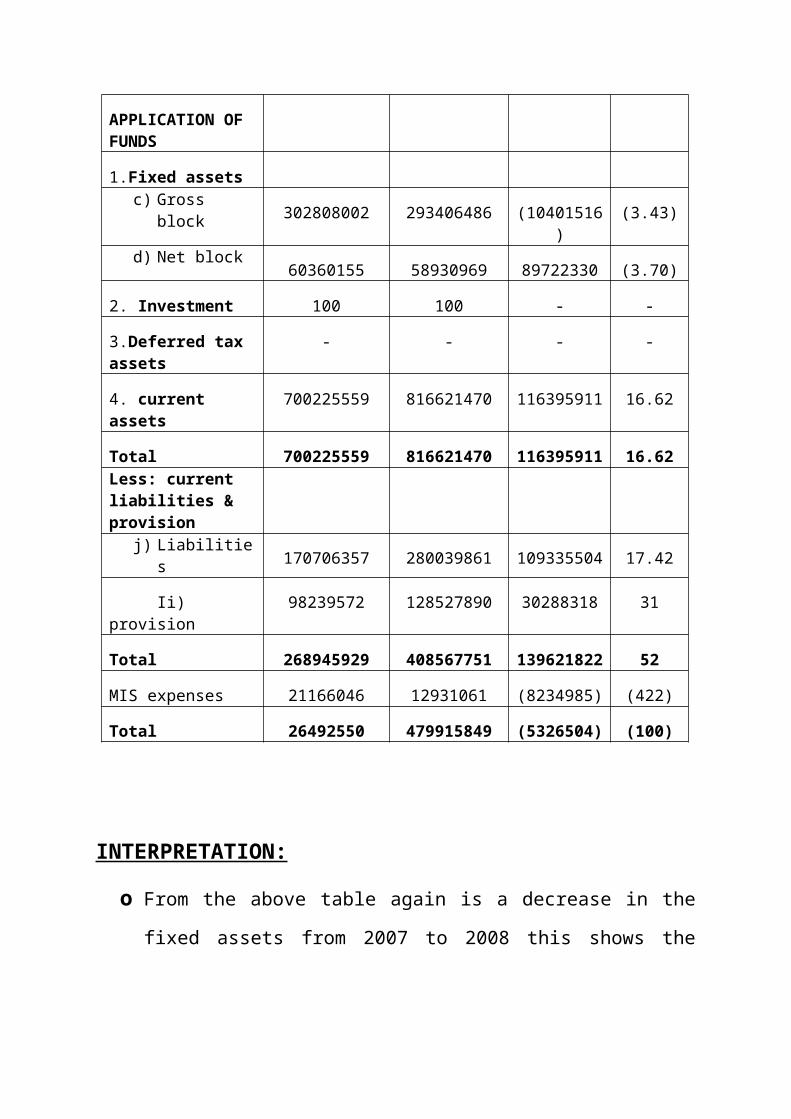
APPLICATION OF FUNDS
1.Fixed assetsc) Gross block
302808002 293406486 (10401516) (3.43)d) Net block
60360155 58930969 89722330 (3.70)
2. Investment 100 100 - -
3.Deferred tax assets - - - -
4. current assets 700225559 816621470 116395911 16.62
Total 700225559 816621470 116395911 16.62Less: current liabilities & provision
j) Liabilities170706357 280039861 109335504 17.42
Ii) provision 98239572 128527890 30288318 31
Total 268945929 408567751 139621822 52
MIS expenses 21166046 12931061 (8234985) (422)
Total 26492550 479915849 (5326504) (100)
INTERPRETATION:
o From the above table again is a decrease in the fixed assets from 2007 to
2008 this shows the company is not contributing amount for fixed assets
out of profit.
The decreased %age of fixed assets is 3.43 and 3.70 in gross and net
block respectively.
o In the sources of funds secured and unsecured loans are increasing in the
year 2008 as compared to 2007 which is a not a good sign for the
company.
Secured loans are increased from zero to Rs.16629120 and unsecured
loans are increased by 34.97%.
Reserve and surplus are also increased by 100% from 2007 to 2008.
Share capital of the firm remains constant.
o There is a increase in the current assets from 2007 to 2008 with a percent
of 16.62 which shows that the company`s liquidation position is
becoming good.
o As seen in current liabilities companies position is not much better as
they are increasing in the year 2008 as compared to 2007 with a
percentage of changes 17.42, which is again not good for the company.
Overall the company`s performance is satisfactory as compared to the
performance of 2007 as there is a decrease in unsecured loans but
increase in secured loans with a percentage change of (34.97)% and 0%
respectively. There is an increase in the current assets but decrease in
fixed assets with a percentage change of 16.62% and (3.43) which is good
on the side of current assets but not good in reference of fixed assets.
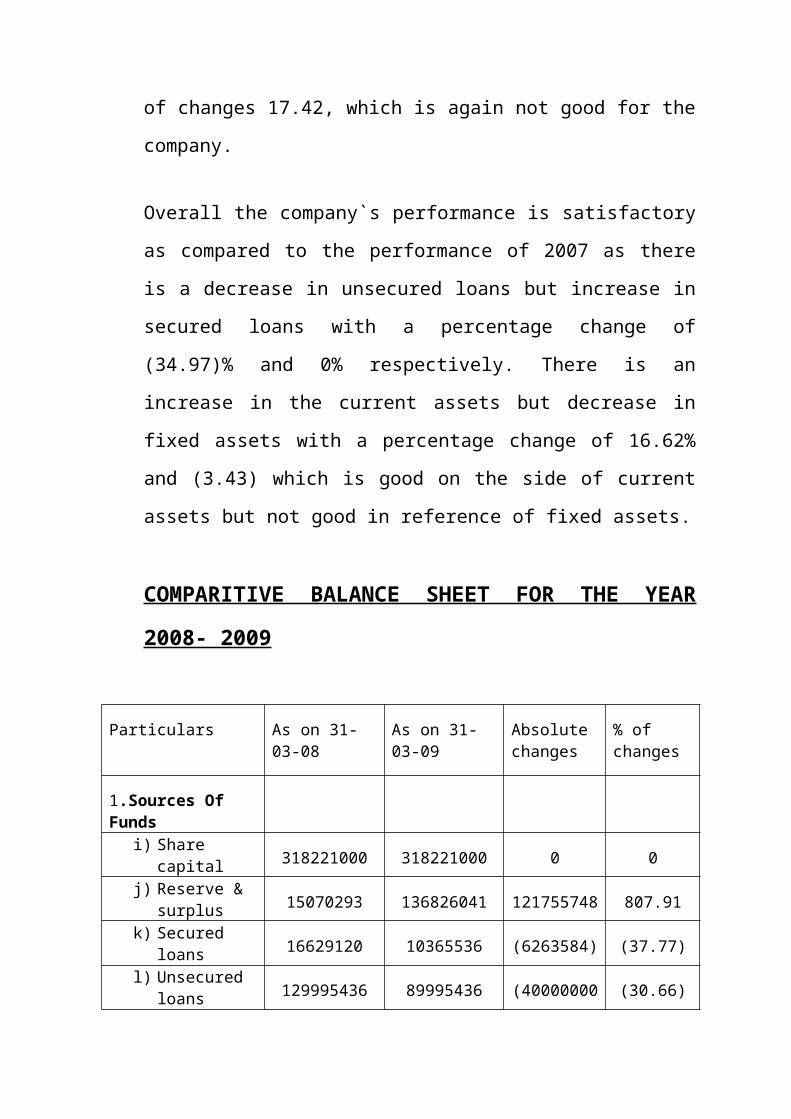
COMPARITIVE BALANCE SHEET FOR THE YEAR
2008- 2009
Particulars As on 31-03-08 As on 31-03-09 Absolute changes
% of changes
1.Sources Of Fundsi) Share capital
318221000 318221000 0 0j) Reserve &
surplus 15070293 136826041 121755748 807.91
k) Secured loans16629120 10365536 (6263584) (37.77)
l) Unsecured loans 129995436 89995436 (40000000) (30.66)
Total 479915849 555408013 75492164 15.73
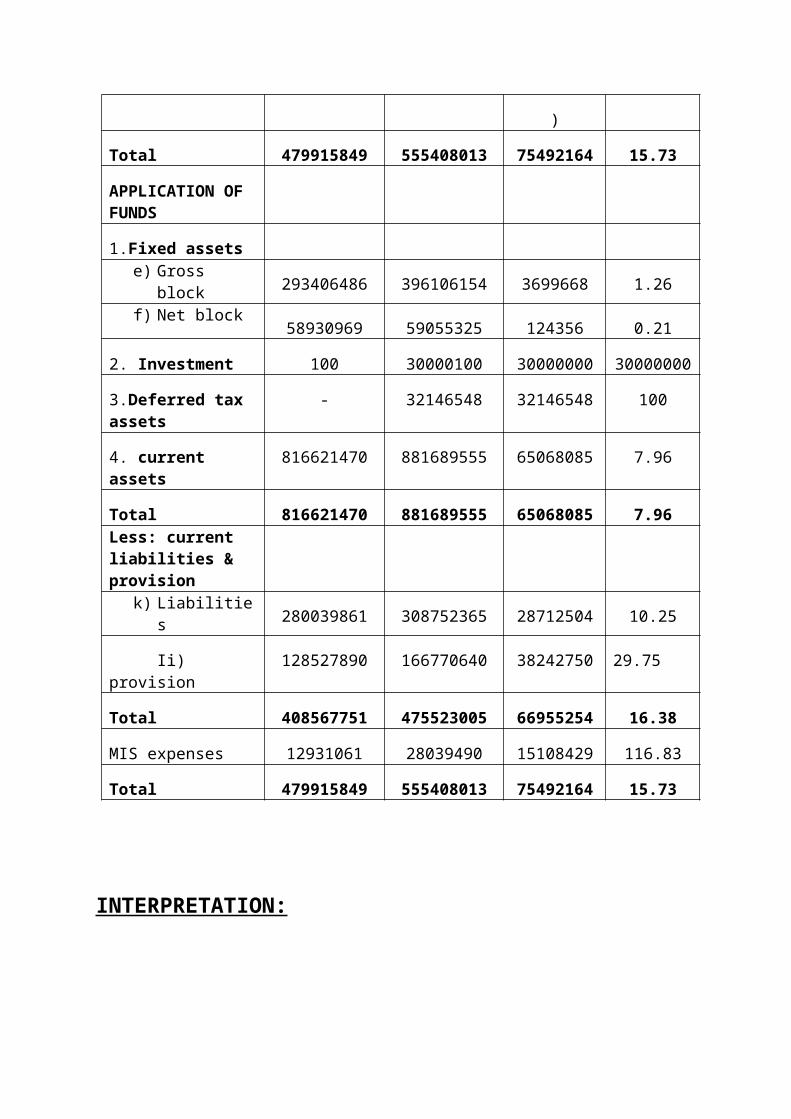
APPLICATION OF FUNDS
1.Fixed assetse) Gross block
293406486 396106154 3699668 1.26f) Net block
58930969 59055325 124356 0.21
2. Investment 100 30000100 30000000 30000000
3.Deferred tax assets - 32146548 32146548 100
4. current assets 816621470 881689555 65068085 7.96
Total 816621470 881689555 65068085 7.96Less: current liabilities & provision
k) Liabilities280039861 308752365 28712504 10.25
Ii) provision 128527890 166770640 38242750 29.75
Total 408567751 475523005 66955254 16.38
MIS expenses 12931061 28039490 15108429 116.83
Total 479915849 555408013 75492164 15.73
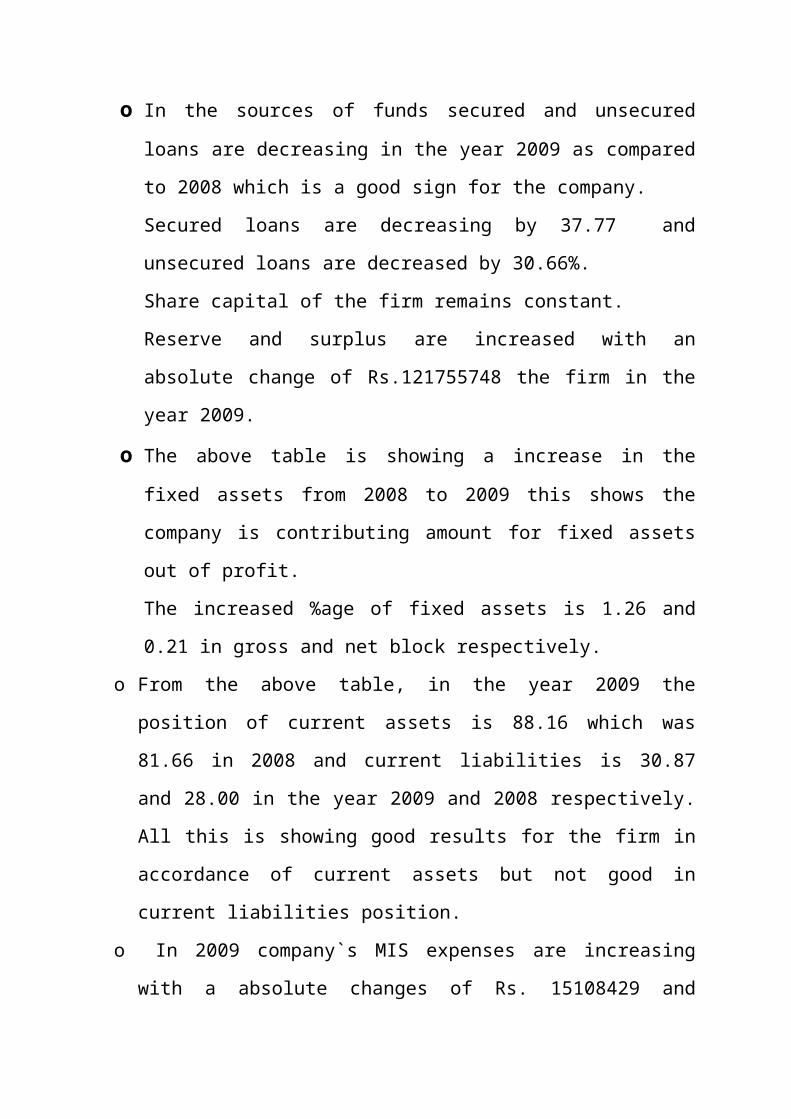
INTERPRETATION:
o In the sources of funds secured and unsecured loans are decreasing in the
year 2009 as compared to 2008 which is a good sign for the company.
Secured loans are decreasing by 37.77 and unsecured loans are decreased
by 30.66%.
Share capital of the firm remains constant.
Reserve and surplus are increased with an absolute change of
Rs.121755748 the firm in the year 2009.
o The above table is showing a increase in the fixed assets from 2008 to
2009 this shows the company is contributing amount for fixed assets out
of profit.
The increased %age of fixed assets is 1.26 and 0.21 in gross and net block
respectively.
o From the above table, in the year 2009 the position of
current assets is 88.16 which was 81.66 in 2008 and
current liabilities is 30.87 and 28.00 in the year 2009 and
2008 respectively. All this is showing good results for the
firm in accordance of current assets but not good in
current liabilities position.
o In 2009 company`s MIS expenses are increasing with a
absolute changes of Rs. 15108429 and percent change of
116.83, it means company should control its undesired
expenses.
Overall the performance of KS&DL is pretty satisfactory,
when compare to the year 2008.It indicate that, in
both the year 2008-2009 the company has a good liquidity
position as there`s an increase in the fixed and current
assets with a percentage change of 1.26% & 7.96% .The
firm position also increasing in the side of sources of funds
as there is a decrease in the secured loans with a change
of (37.77)% and also decrease in the unsecured loans with
(30.66)%.
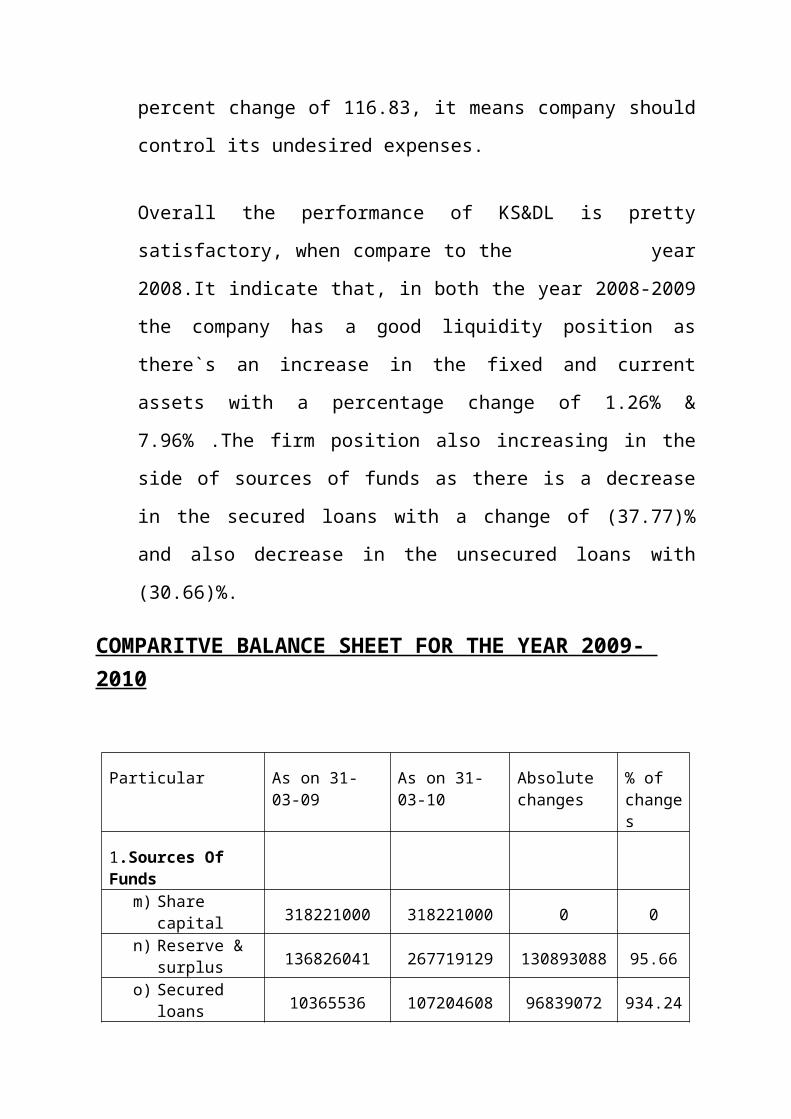
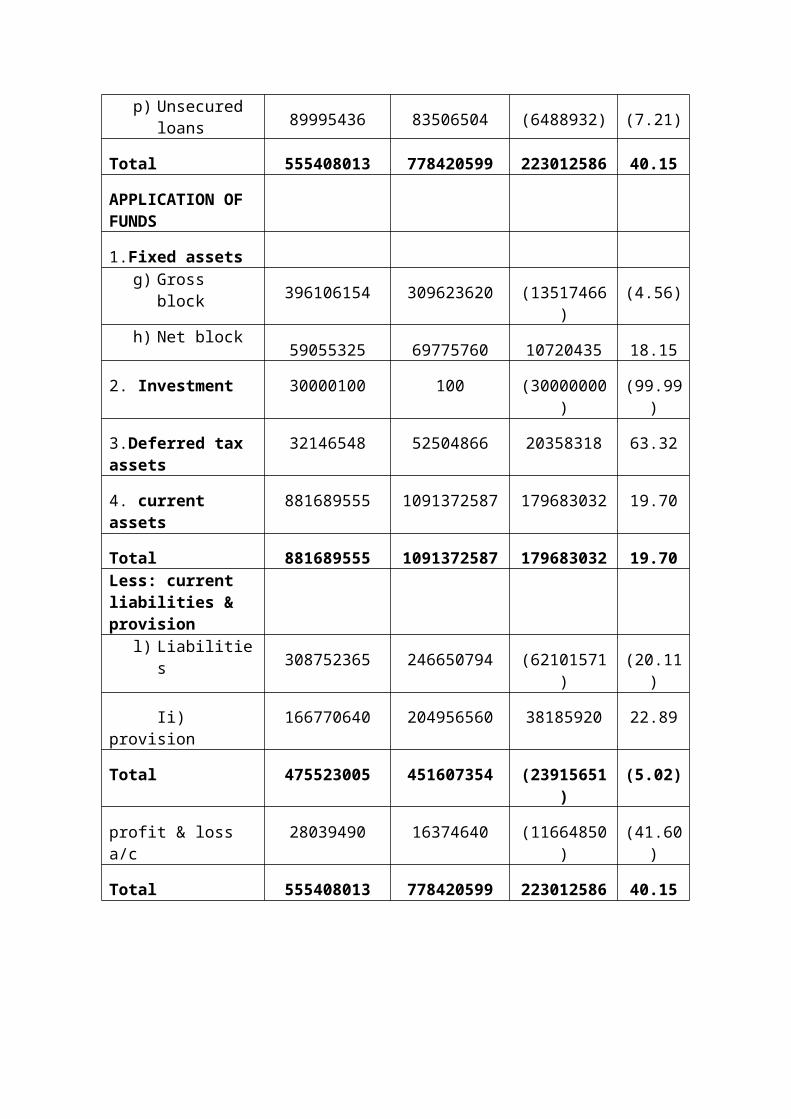
COMPARITVE BALANCE SHEET FOR THE YEAR 2009- 2010
Particular As on 31-03-09 As on 31-03-10 Absolute changes
% of changes
1.Sources Of Fundsm) Share capital
318221000 318221000 0 0n) Reserve &
surplus 136826041 267719129 130893088 95.66
o) Secured loans10365536 107204608 96839072 934.24
p) Unsecured loans 89995436 83506504 (6488932) (7.21)
Total 555408013 778420599 223012586 40.15
APPLICATION OF FUNDS
1.Fixed assetsg) Gross block
396106154 309623620 (13517466) (4.56)h) Net block
59055325 69775760 10720435 18.15
2. Investment 30000100 100 (30000000) (99.99)
3.Deferred tax assets 32146548 52504866 20358318 63.32
4. current assets 881689555 1091372587 179683032 19.70
Total 881689555 1091372587 179683032 19.70Less: current liabilities & provision
l) Liabilities308752365 246650794 (62101571) (20.11)
Ii) provision 166770640 204956560 38185920 22.89
Total 475523005 451607354 (23915651) (5.02)
profit & loss a/c 28039490 16374640 (11664850) (41.60)
Total 555408013 778420599 223012586 40.15
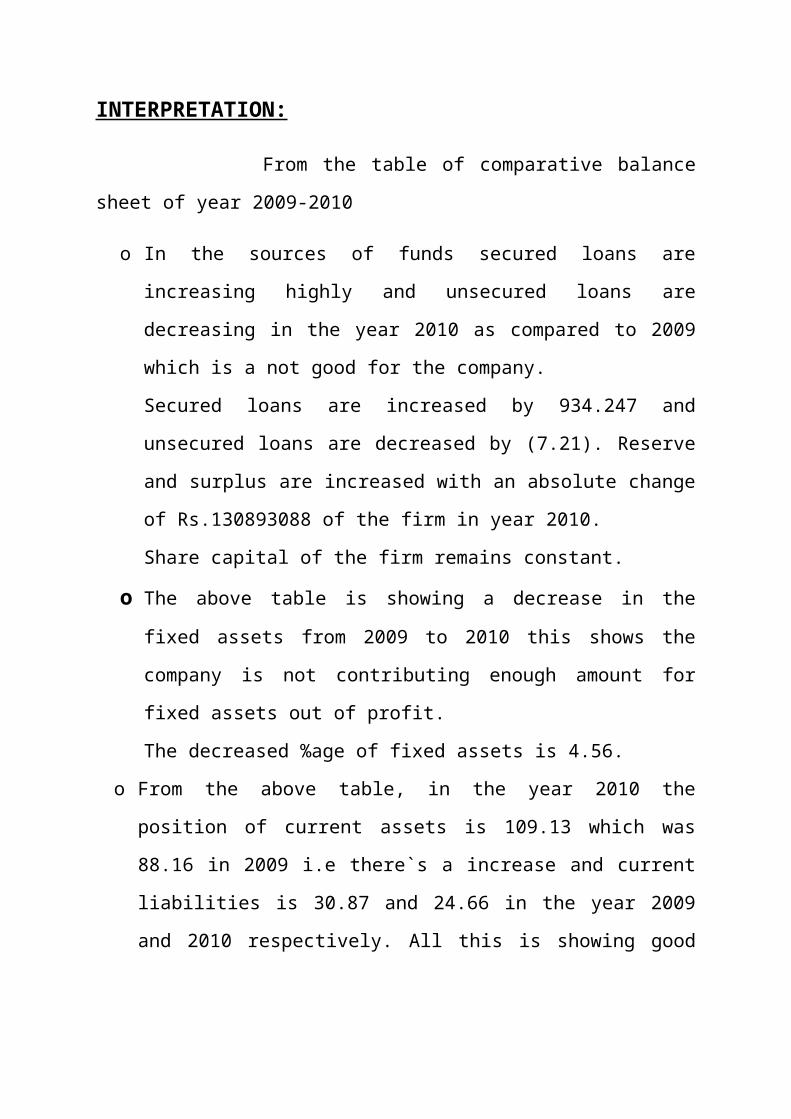
INTERPRETATION:
From the table of comparative balance sheet of year
2009-2010
o In the sources of funds secured loans are increasing highly and unsecured
loans are decreasing in the year 2010 as compared to 2009 which is a not
good for the company.
Secured loans are increased by 934.247 and unsecured loans are
decreased by (7.21). Reserve and surplus are increased with an absolute
change of Rs.130893088 of the firm in year 2010.
Share capital of the firm remains constant.
o The above table is showing a decrease in the fixed assets from 2009 to
2010 this shows the company is not contributing enough amount for fixed
assets out of profit.
The decreased %age of fixed assets is 4.56.
o From the above table, in the year 2010 the position of
current assets is 109.13 which was 88.16 in 2009 i.e
there`s a increase and current liabilities is 30.87 and 24.66
in the year 2009 and 2010 respectively. All this is showing
good results for the firm in both the cases, current assets
and current liabilities.
Overall the performance of KS&DL is satisfactory but when
compared to 2009 it`s not good enough as there is an
increase in secured loans but decrease in unsecured loans
with a percentage change of 934.24% and (7.21)%
respectively. company’s liquidity position is also not
satisfactory when compared to the year 2009 as there is a
decrease in fixed assets gross block with a change of
4.56% but increase in current assets with a percentage of
19.70%.company`s current liabilities are also decreasing
with a absolute changes of Rs.62101571 & percentage
change of (20.11)% which is a good sign for the company.
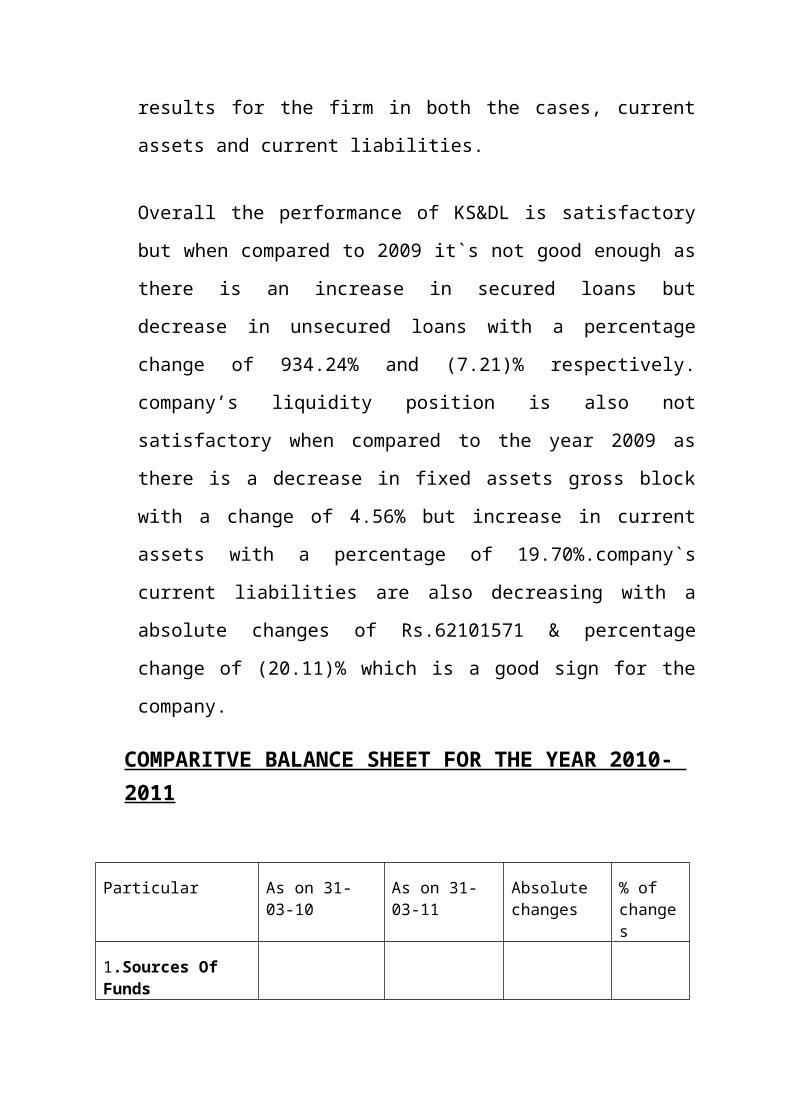
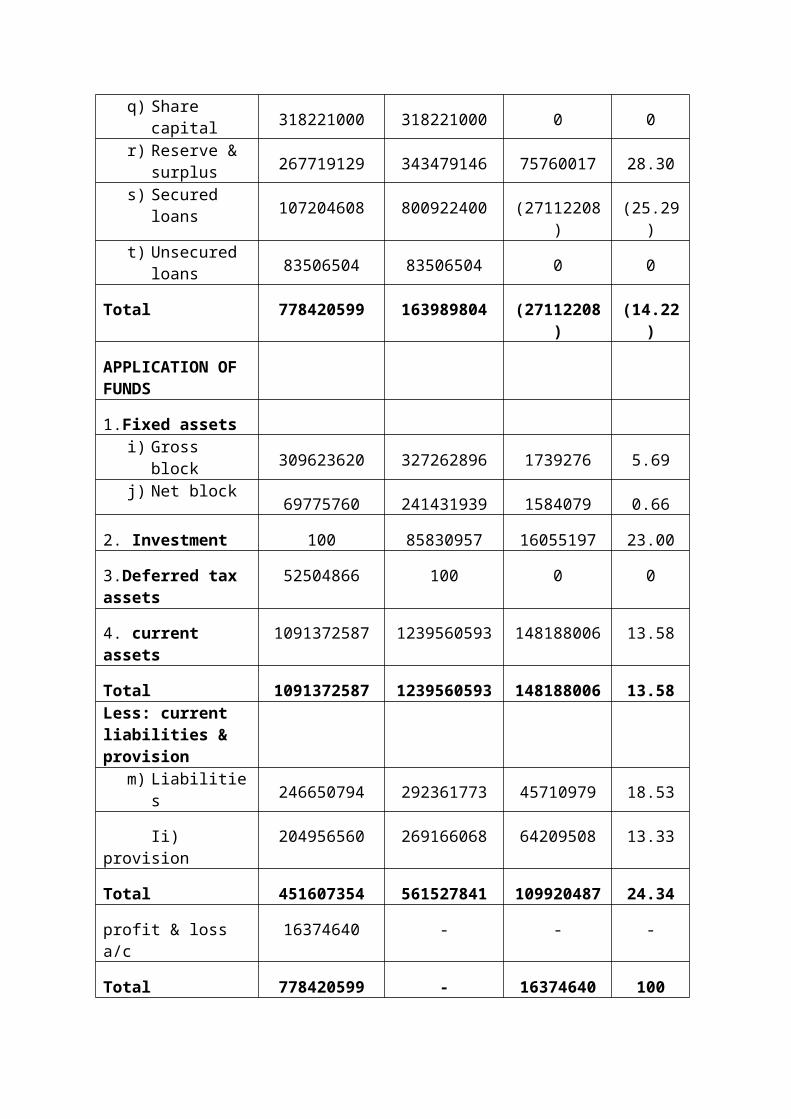
COMPARITVE BALANCE SHEET FOR THE YEAR 2010- 2011
Particular As on 31-03-10 As on 31-03-11 Absolute changes
% of changes
1.Sources Of Fundsq) Share capital
318221000 318221000 0 0r) Reserve &
surplus 267719129 343479146 75760017 28.30
s) Secured loans107204608 800922400 (27112208) (25.29)
t) Unsecured loans 83506504 83506504 0 0
Total 778420599 163989804 (27112208) (14.22)
APPLICATION OF FUNDS
1.Fixed assetsi) Gross block
309623620 327262896 1739276 5.69j) Net block
69775760 241431939 1584079 0.66
2. Investment 100 85830957 16055197 23.00
3.Deferred tax assets 52504866 100 0 0
4. current assets 1091372587 1239560593 148188006 13.58
Total 1091372587 1239560593 148188006 13.58Less: current liabilities & provision
m) Liabilities246650794 292361773 45710979 18.53
Ii) provision 204956560 269166068 64209508 13.33
Total 451607354 561527841 109920487 24.34
profit & loss a/c 16374640 - - -
Total 778420599 - 16374640 100
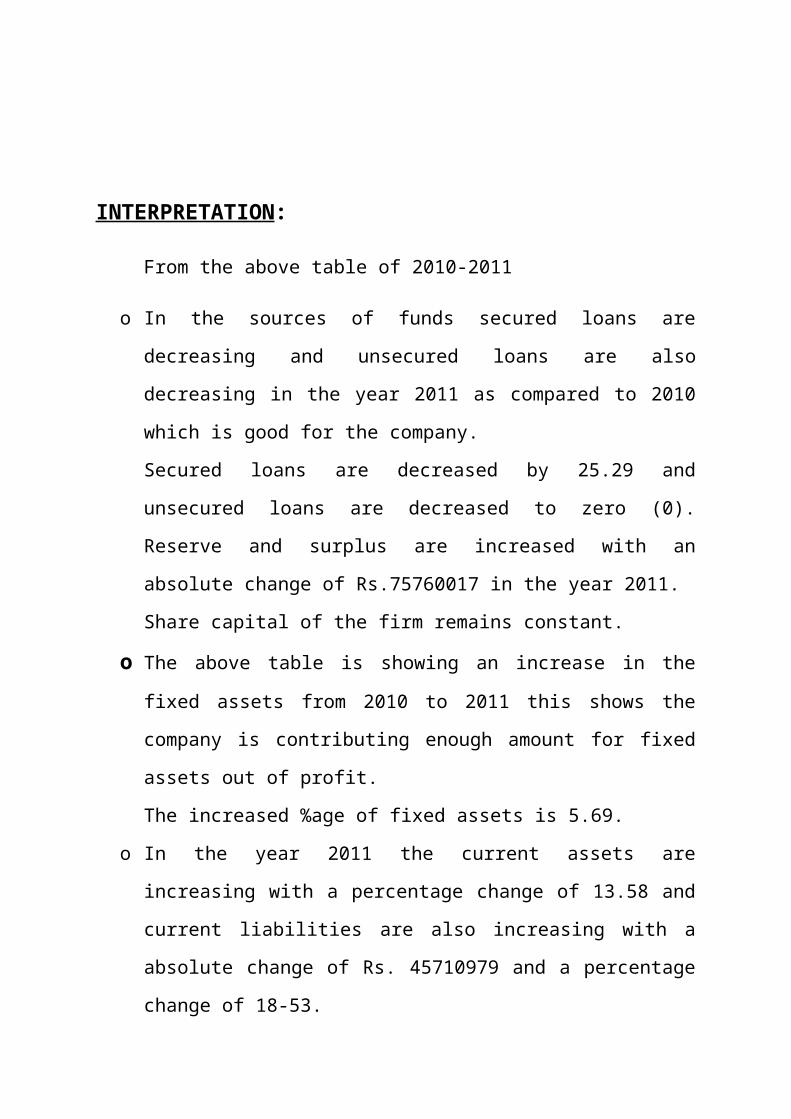
INTERPRETATION:
From the above table of 2010-2011
o In the sources of funds secured loans are decreasing and unsecured loans
are also decreasing in the year 2011 as compared to 2010 which is good
for the company.
Secured loans are decreased by 25.29 and unsecured loans are decreased
to zero (0). Reserve and surplus are increased with an absolute change of
Rs.75760017 in the year 2011.
Share capital of the firm remains constant.
o The above table is showing an increase in the fixed assets from 2010 to
2011 this shows the company is contributing enough amount for fixed
assets out of profit.
The increased %age of fixed assets is 5.69.
o In the year 2011 the current assets are increasing with a percentage
change of 13.58 and current liabilities are also increasing with a absolute
change of Rs. 45710979 and a percentage change of 18-53.
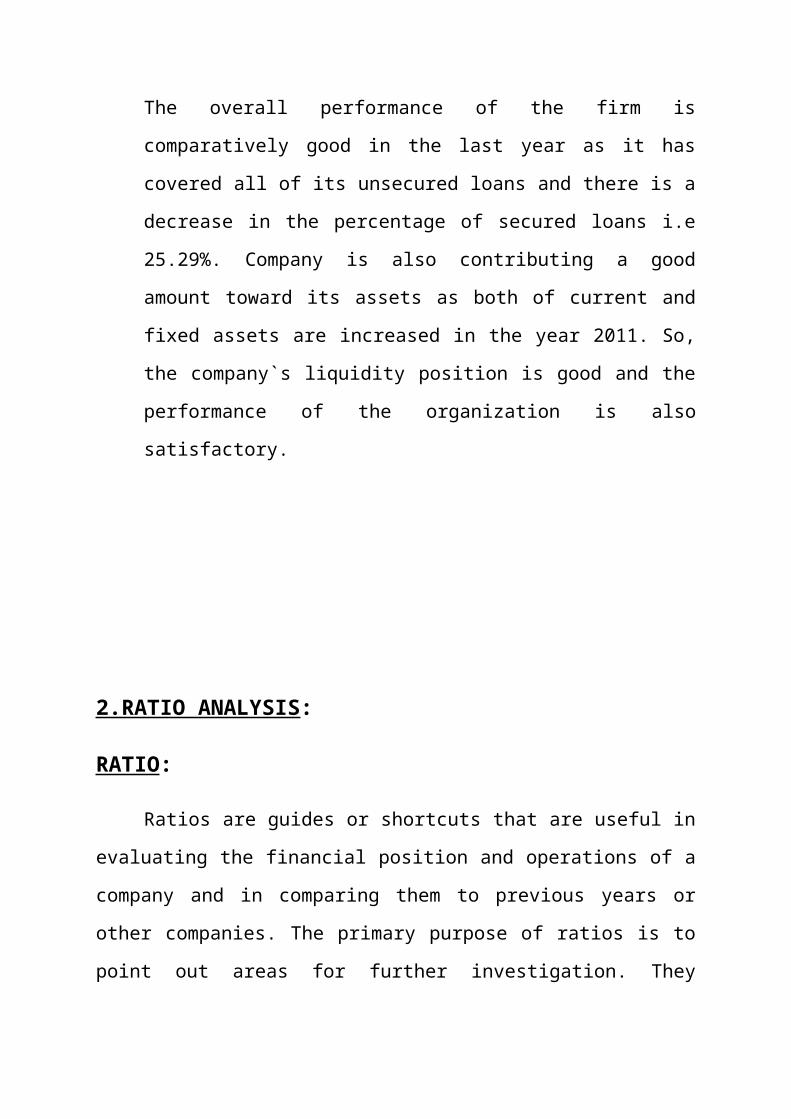
The overall performance of the firm is comparatively good in the last year
as it has covered all of its unsecured loans and there is a decrease in the
percentage of secured loans i.e 25.29%. Company is also contributing a
good amount toward its assets as both of current and fixed assets are
increased in the year 2011. So, the company`s liquidity position is good
and the performance of the organization is also satisfactory.
2.RATIO ANALYSIS:
RATIO:
Ratios are guides or shortcuts that are useful in evaluating the financial
position and operations of a company and in comparing them to previous years
or other companies. The primary purpose of ratios is to point out areas for
further investigation. They should be used in connection with a general
understanding of the company and its environment.
RATIO ANALYSIS:
Ratio analysis is an important means of expressing the relationship
between two numbers. A ratio can be computed form any pair of numbers. To
be useful, a ratio must represent a meaningful relationship, but use of ratios
cannot take the place of studying the underlying data.
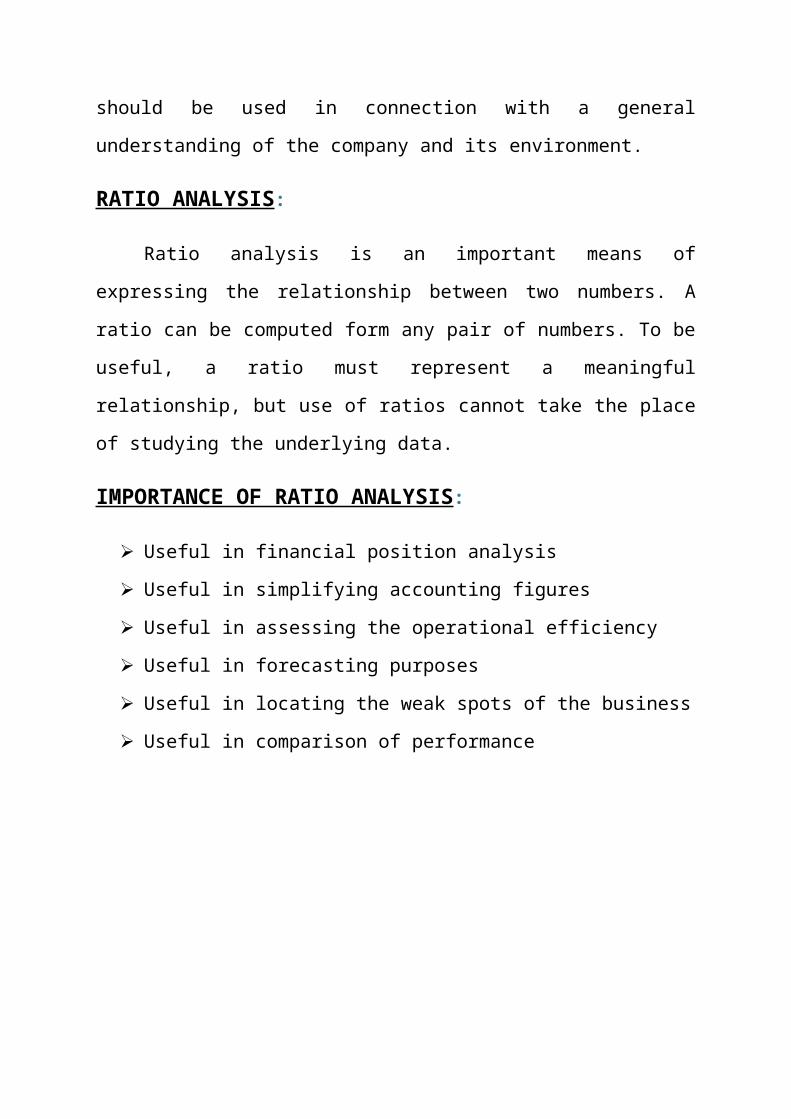
IMPORTANCE OF RATIO ANALYSIS:
Useful in financial position analysis
Useful in simplifying accounting figures
Useful in assessing the operational efficiency
Useful in forecasting purposes
Useful in locating the weak spots of the business
Useful in comparison of performance
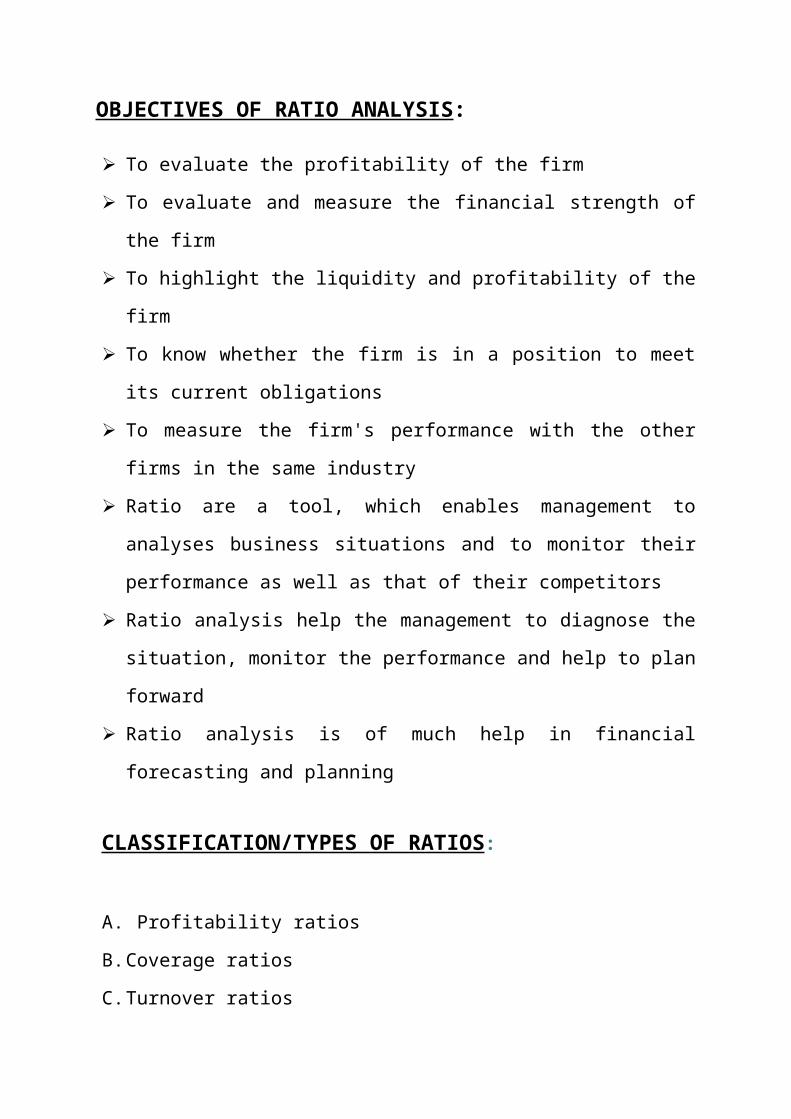
OBJECTIVES OF RATIO ANALYSIS:
To evaluate the profitability of the firm
To evaluate and measure the financial strength of the firm
To highlight the liquidity and profitability of the firm
To know whether the firm is in a position to meet its current obligations
To measure the firm's performance with the other firms in the same industry
Ratio are a tool, which enables management to analyses business situations
and to monitor their performance as well as that of their competitors
Ratio analysis help the management to diagnose the situation, monitor the
performance and help to plan forward
Ratio analysis is of much help in financial forecasting and planning
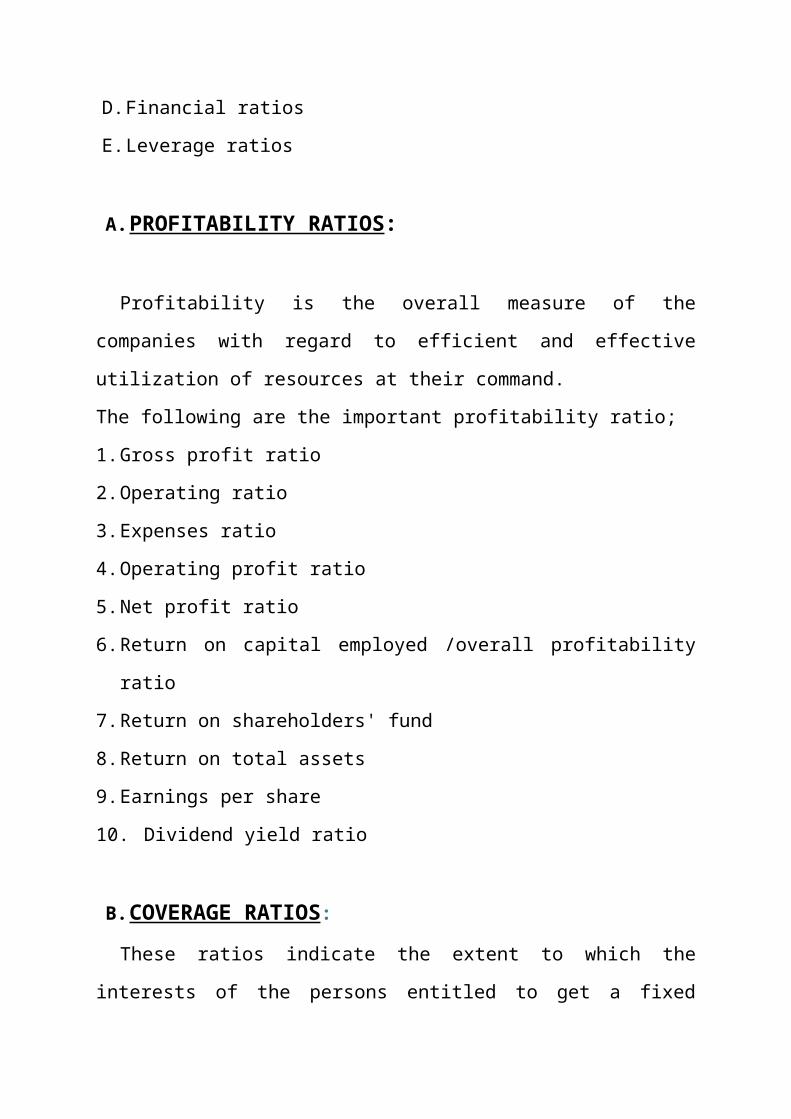
CLASSIFICATION/TYPES OF RATIOS:
A. Profitability ratios
B. Coverage ratios
C. Turnover ratios
D. Financial ratios
E. Leverage ratios
A. PROFITABILITY RATIOS :
Profitability is the overall measure of the companies with regard to efficient
and effective utilization of resources at their command.
The following are the important profitability ratio;
1. Gross profit ratio
2. Operating ratio
3. Expenses ratio
4. Operating profit ratio
5. Net profit ratio
6. Return on capital employed /overall profitability ratio
7. Return on shareholders' fund
8. Return on total assets
9. Earnings per share
10.Dividend yield ratio
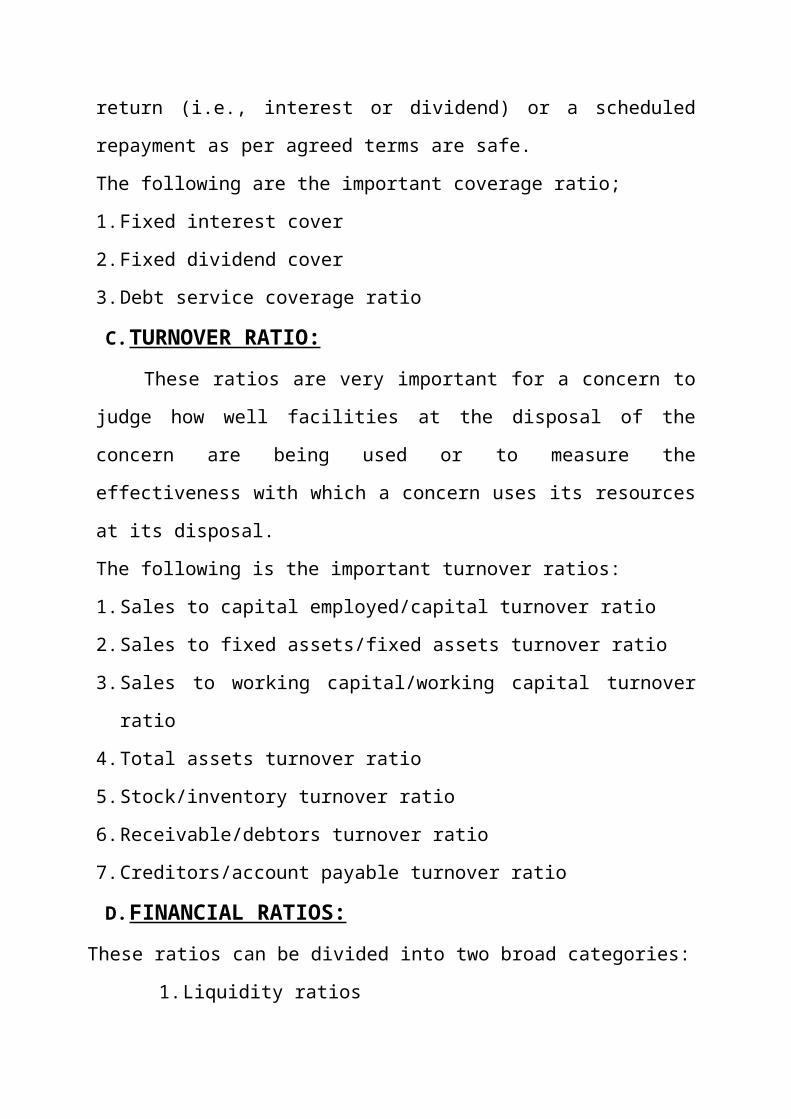
B. COVERAGE RATIOS :
These ratios indicate the extent to which the interests of the persons entitled
to get a fixed return (i.e., interest or dividend) or a scheduled repayment as per
agreed terms are safe.
The following are the important coverage ratio;
1. Fixed interest cover
2. Fixed dividend cover
3. Debt service coverage ratio
C. TURNOVER RATIO:
These ratios are very important for a concern to judge how well facilities
at the disposal of the concern are being used or to measure the effectiveness
with which a concern uses its resources at its disposal.
The following is the important turnover ratios:
1. Sales to capital employed/capital turnover ratio
2. Sales to fixed assets/fixed assets turnover ratio
3. Sales to working capital/working capital turnover ratio
4. Total assets turnover ratio
5. Stock/inventory turnover ratio
6. Receivable/debtors turnover ratio
7. Creditors/account payable turnover ratio
D. FINANCIAL RATIOS:
These ratios can be divided into two broad categories:
1. Liquidity ratios
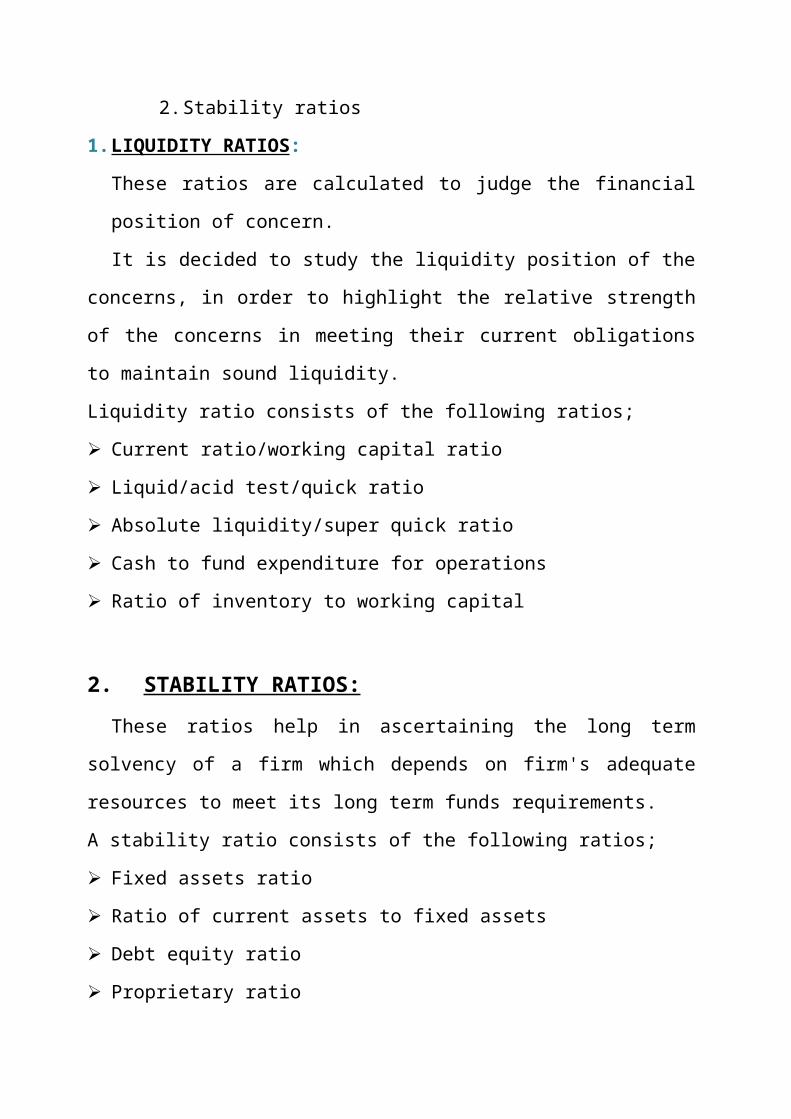
2. Stability ratios
1. LIQUIDITY RATIOS :
These ratios are calculated to judge the financial position of concern.
It is decided to study the liquidity position of the concerns, in order to
highlight the relative strength of the concerns in meeting their current obligations
to maintain sound liquidity.
Liquidity ratio consists of the following ratios;
Current ratio/working capital ratio
Liquid/acid test/quick ratio
Absolute liquidity/super quick ratio
Cash to fund expenditure for operations
Ratio of inventory to working capital
2. STABILITY RATIOS:
These ratios help in ascertaining the long term solvency of a firm which
depends on firm's adequate resources to meet its long term funds requirements.
A stability ratio consists of the following ratios;
Fixed assets ratio
Ratio of current assets to fixed assets
Debt equity ratio
Proprietary ratio
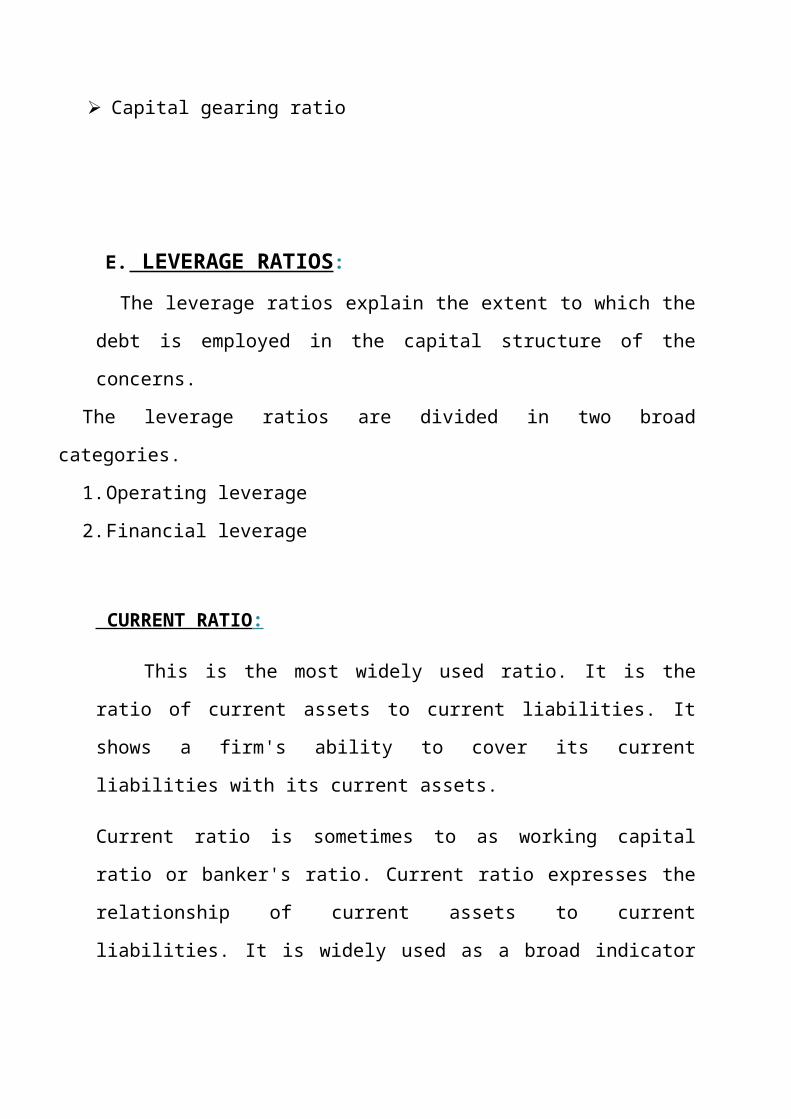
Capital gearing ratio
E. LEVERAGE RATIOS :
The leverage ratios explain the extent to which the debt is employed in the
capital structure of the concerns.
The leverage ratios are divided in two broad categories.
1. Operating leverage
2. Financial leverage
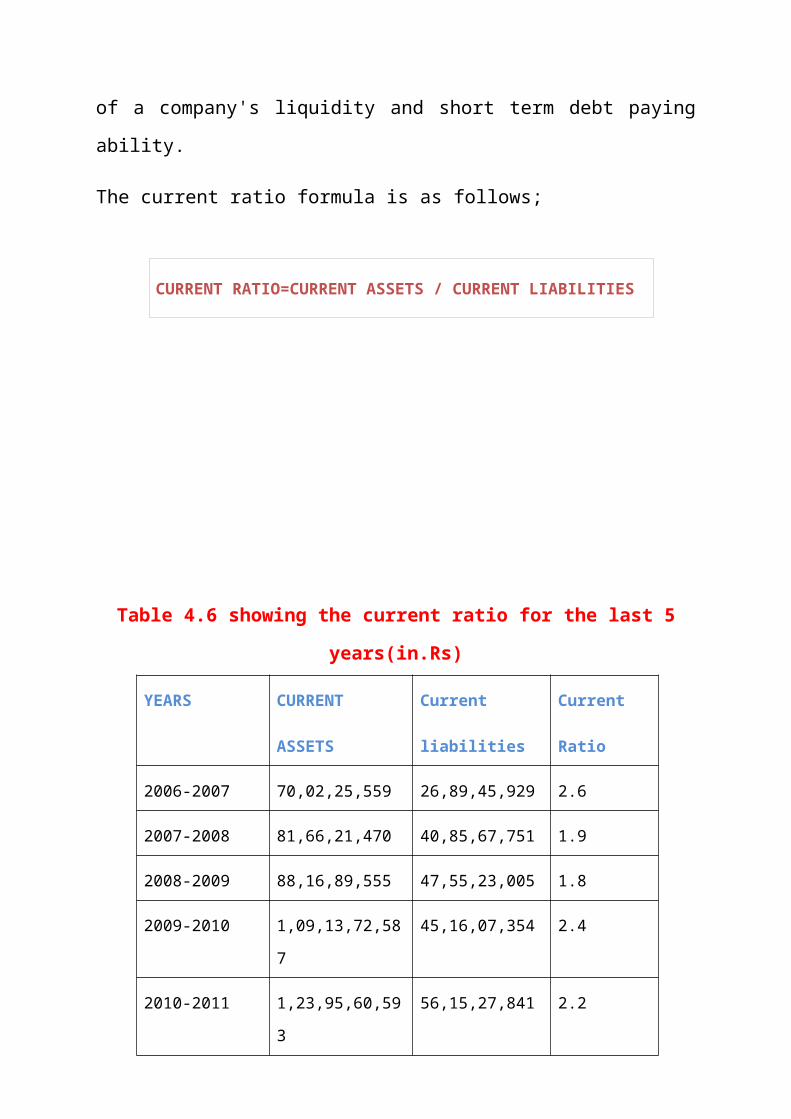
CURRENT RATIO :
This is the most widely used ratio. It is the ratio of current assets to
current liabilities. It shows a firm's ability to cover its current liabilities with its
current assets.
Current ratio is sometimes to as working capital ratio or banker's ratio. Current
ratio expresses the relationship of current assets to current liabilities. It is widely
used as a broad indicator of a company's liquidity and short term debt paying
ability.
The current ratio formula is as follows;
Table 4.6 showing the current ratio for the last 5 years(in.Rs)
H
CURRENT RATIO=CURRENT ASSETS / CURRENT LIABILITIES
YEARS CURRENT
ASSETS
Current
liabilities
Current
Ratio
2006-2007 70,02,25,559 26,89,45,929 2.6
2007-2008 81,66,21,470 40,85,67,751 1.9
2008-2009 88,16,89,555 47,55,23,005 1.8
2009-2010 1,09,13,72,587 45,16,07,354 2.4
2010-2011 1,23,95,60,593 56,15,27,841 2.2
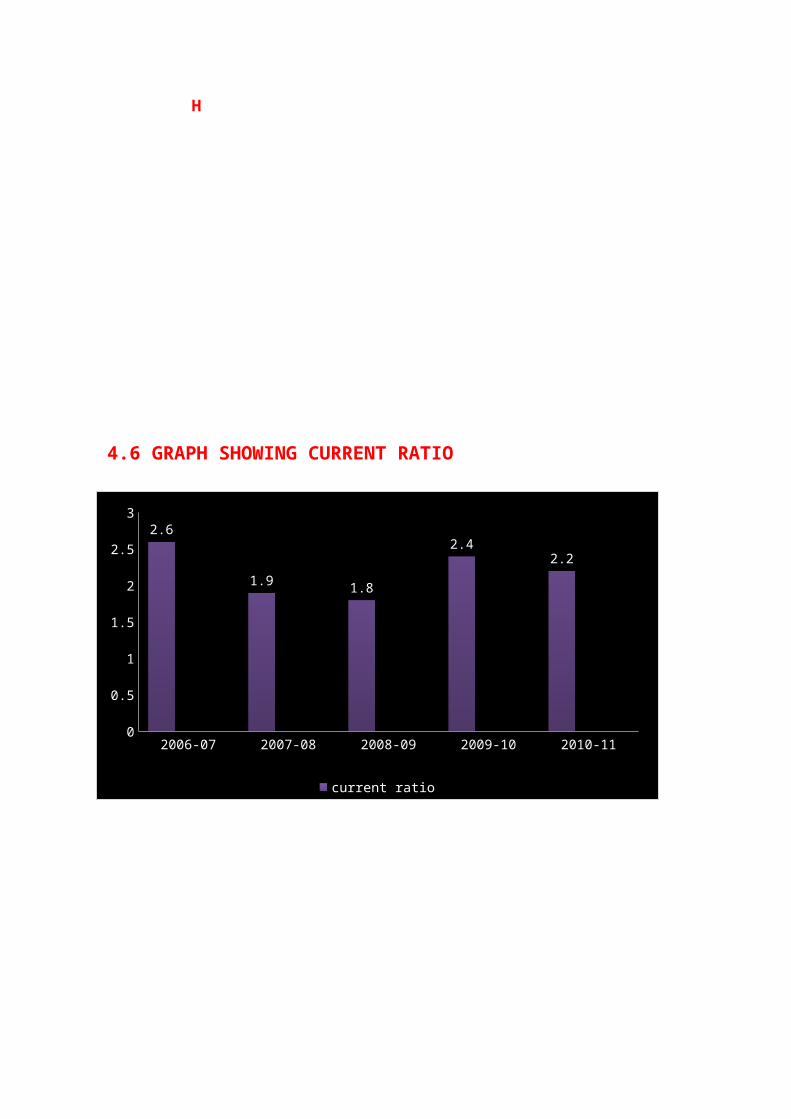
4.6 GRAPH SHOWING CURRENT RATIO
ANALYSIS:
A Relatively high current ratio is an indication that the firm is liquid and has
the ability to pay its current obligations in time as and when they become due.
On the other hand, a relatively low current ratio represents that the liquidity
position of the firm is not good and the firm shall not be able to pay its current
liabilities in time without facing difficulties. The ratio equal or near to the rule
of thumb is 2:1, i.e. current assets double the current liabilities is considered
satisfactory.
INTERPRETATION:
It is inferred that current ratio was up to the standard in the year 2006-07,
2009-10, 2010-11 due to decrease in inventory and debtors. For the two years it
is showing a decreasing trend due to drastic increase in current liabilities.
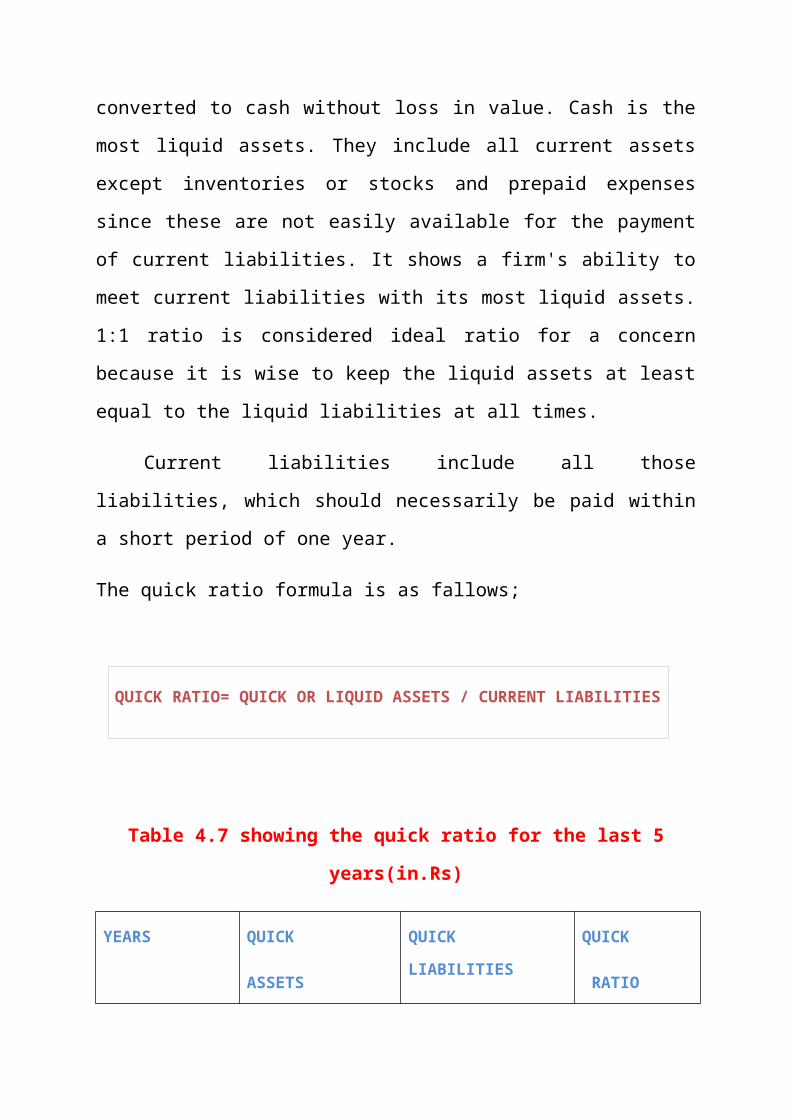
QUICK RATIO :
It is the ratio that expresses the relationship between quick or liquid assets
and quick or liquid liabilities. Any asset is called liquid if it can be converted to
cash without loss in value. Cash is the most liquid assets. They include all
current assets except inventories or stocks and prepaid expenses since these are
not easily available for the payment of current liabilities. It shows a firm's
ability to meet current liabilities with its most liquid assets. 1:1 ratio is
considered ideal ratio for a concern because it is wise to keep the liquid assets at
least equal to the liquid liabilities at all times.
Current liabilities include all those liabilities, which should necessarily be
paid within a short period of one year.
The quick ratio formula is as fallows;
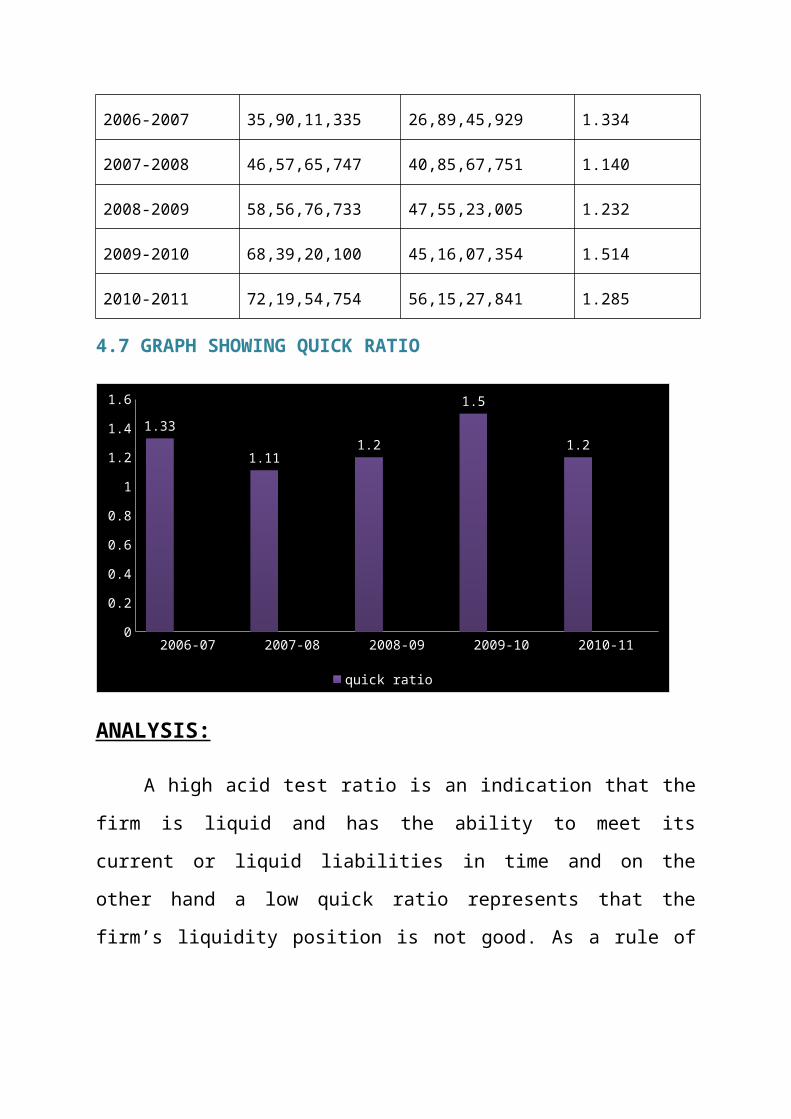
Table 4.7 showing the quick ratio for the last 5 years(in.Rs)
YEARS QUICK
ASSETS
QUICK LIABILITIES QUICK
RATIO
QUICK RATIO= QUICK OR LIQUID ASSETS / CURRENT LIABILITIES
2006-2007 35,90,11,335 26,89,45,929 1.334
2007-2008 46,57,65,747 40,85,67,751 1.140
2008-2009 58,56,76,733 47,55,23,005 1.232
2009-2010 68,39,20,100 45,16,07,354 1.514
2010-2011 72,19,54,754 56,15,27,841 1.285
4.7 GRAPH SHOWING QUICK RATIO
2006-07 2007-08 2008-09 2009-10 2010-110
0.2
0.4
0.6
0.8
1
1.2
1.4
1.6
1.33
1.111.2
1.5
1.2
quick ratio
ANALYSIS:
A high acid test ratio is an indication that the firm is liquid and has the
ability to meet its current or liquid liabilities in time and on the other hand a low
quick ratio represents that the firm’s liquidity position is not good. As a rule of
thumb or as a convention quick ratio of 1:1 is considered satisfactory.
INTERPRETATION:
It is inferred that the company has the ability to meet its current liquid
liabilities as and when they become due as it has pretty good quick ratio above
the normal standard of 1:1.
ABSOLUTE LIQUIDITY RATIO OR CASH RATIO :
Liquidity of a firm can be viewed from an extremely conservative point
of view and the short term liquidity of a company may be measured through
cash ratio.
Cash ratio or absolute liquid ratio is the ratio which expresses the
relationship between liquid assets and quick liabilities. Absolute liquid ratio is
the most rigorous ratio to measure the liquidity of the firm.
Absolute liquid assets include cash in hand and at bank and marketable
securities or temporary investments.
The absolute liquid ratio formula is as follows;
Table 4.8 showing the cash ratio for the last 5 years
YEAR ABSOLUTE
LIQUID ASSETS
CURRENT
LIABILITIES
RATIO
2006-2007 19,57,15,651 26,89,45,929 0.727
2007-2008 31,23,45,581 40,85,67,751 0.765
2008-2009 33,43,85,423 47,55,23,005 0.703
2009-2010 25,51,32,909 45,16,07,354 0.565
2010-2011 28,53,59,727 56,15,27,841 0.508
CASH RATIO= ABSOLUTE LIQUID ASSETS / CURRENT LIABILITIES
4.8 GRAPH SHOWING CASH RATIO
2006-07 2007-08 2008-09 2009-10 2010-110
0.1
0.2
0.3
0.4
0.5
0.6
0.7
0.8
0.9
0.727000000000001
0.765000000000008 0.703000000000
001
0.5650.508
cash ratio
ANALYSIS:
The acceptable norm for this ratio is 50% or 0.5:1 or 1:2 i.e. Re.1 worth
absolute liquid assets are considered adequate to pay Rs.2 worth current
liabilities in time as all the creditors are not expected to demand cash at the
same time and then cash may also be realized form debtors and investors.
INTERPRETATION:
It is inferred that there was an increasing trend in first four years that is
from 2006-2009. But in the previous year it has decreased to 0.508 which was a
result of decrease in cash and bank balance accompanied with increase in
creditors where company won’t be able to meet its short term financial
obligations. So it has to take steps to decrease creditors and also speed up its
collection from debtors to improve its cash reserves.
STOCK OR INVENTORY TURNOVER RATIO :
The inventory turnover ratio also known as stock turnover ratio indicates
whether inventory has been efficiently used or not. The purpose is to see
whether only the required minimum funds have been locked up in inventory.
Inventory turnover during the period and evaluates the efficiency with which a
firm is able to manage its inventory.It denotes the speed at which the inventory
will be converted into sales, thereby contributing for the profits of the concern.
Here cost of goods include ( opening stock + purchases + manufacturing
expenses - closing stock or sales - Gross profit)
And average stock includes opening stock + closing stock
2
Inventory turnover ratio can be calculated as fallows;
Table 4.9 showing the Stock Turnover Ratio for the last 5 years
YEARS SALES AVERAGE
STOCK
RATIO
2006-2007 98,81,11,423 39,24,94,368 2.518
2007-2008 104,43,74,470 34,60,34,973 3.018
2008-2009 1,28,64,62,008 32,34,34,273 3.978
2009-2010 1,53,37,03,531 35,17,32,655 4.360
INVENTORY TURNOVER RATIO= SALES / AVERAGE STOCK
2010-2011 16,47,77,47,37 46,25,29,163 3.562
4.9 GRAPH SHOWING INVENTORY TURNOVER RATIO
2006-07 2007-08 2008-09 2009-10 2010-110
0.5
1
1.5
2
2.5
3
3.5
4
4.5
5
2.518
3.018
3.9784.36
3.562
Inventory turnover ratio
ANALYSIS:
Inventory Turnover Ratio measures the velocity of conversion of stock
into sales. A high inventory turnover/stock velocity indicates efficient
management of inventory because more frequently the stocks are sold, the lesser
amount of money is required to finance the inventory.
A low inventory turnover indicates over-investment in inventory, dull
business, poor quality of goods, stock accumulations, accumulations of obsolete
and slow moving goods and low profits as compared to total investments. There
are no ‘rules of thumb’ or ‘standard inventory turnover ratio’ for interpreting the
inventory turnover ratio.
INTERPRETATION:
It is inferred that the inventory turnover ratio has been showing an
increasing trend from past four years but there was a slight decrease in the
previous year, which indicates that there is an efficient management of
inventory and stocks are sold out within short span of time which reduces the
warehouse cost and avoids the chances of obsolescence of stocks.
DEBTORS OR RECEIVABLE TURNOVER RATIO :
Debtor's turnover ratio indicates the velocity of data collection of firm. In
simple words, it indicated the number of times average debtors are turned over
during a year. This ratio indicates the speed at which the debtors are converted
into cash. Usually a high ratio will be referred to high efficiency in debt
collection and a low ratio for lower efficiency. High ratios indicates that debts
are collected in short time period (i.e., there is little time gap between sales and
payments.
The ratio is obtained by dividing the net credit sales by average debtors
outstanding during that year.
Debtors' turnover ratio can be calculated as fallows:
Table 4.10 showing the Debtors Turnover Ratio for the last 5 years(in.Rs)
YEARS NET CREDIT
SALES
AVERAGE
DEBTORS
RATIO
DEBTORS TURNOVER RATIO= NET CREDIT SALES / AVERAGE DEBTORS
2006-2007 98,81,11,423 7,45,79,779 13.249
2007-2008 1,04,43,74,470 7,48,55,399 13.95
2008-2009 1,28,64,62,008 11,36,10,155 11.323
2009-2010 1,53,37,03,531 15,49,38,144 9.899
2010-2011 16,47,77,47,37 16,80,85,689 9.803
4.10 GRAPH SHOWING DEBTORS TURNOVER RATIO
2006-07 2007-08 2008-09 2009-10 2010-110
2
4
6
8
10
12
14
16
13.24913.95
11.323
9.899 9.803
Debtors turnover ratio
ANALYSIS:
The debtors’ turnover ratio indicates the number of times the debtors
are turned over a year. Generally, the higher the debtors’ turnover the more
efficient is the management of debtors similarly; low debtors turnover implies
inefficient management of debtors or sales.
INTERPRETATION:
From the above table, it is seen that KS&DL has increased by almost
50% for the two years to 13.249 and 13.952 respectively. But in the year 2008-
2009, 2009-2010 & 2010-11 it has gradually decreased to 11.323, 9.899 &
9.803.
It is inferred that it shows a decreasing trend from past three years which is not
a good sign for a company. So it has to take steps to manage debtors through
prompt collection so that it will be able to sell the goods on credit and there by
gaining sales and profit.
CREDITORS OR ACCOUNT RECIEVABLE TURNOVER
RATIO :
Debtor's turnover ratio indicates the velocity of data collection of firm. In
simple words, it indicated the number of times average debtors are turned over
during a year. This ratio indicates the credit facility enjoyed by a firm. It is
calculated by taking into account the net purchase and average creditors.
Creditors' turnover ratio can be calculated as fallows:
Table 4.11 showing the Creditors Turnover Ratio for the last 5 years(in.Rs)
YEARS NET PURCHASE AVERAGE
CREDITORS
RATIO
2006-2007 36,72,38,387 4,53,54,445 8.09
2007-2008 50,70,94,587 4,75,84,558 10.65
2008-2009 54,14,33,115 7,01,84,312 07.71
2009-2010 80,19,28,342 6,97,71,274 11.49
2010-2011 77,53,83,439 6,44,60,999 12.02
4.11 GRAPH SHOWING CREDITORS TURNOVER RATIO
CREDITORS TURNOVER RATIO= NET PURCHASE / AVERAGE CREDITORS
2006-07 2007-08 2008-09 2009-10 2010-110
2
4
6
8
10
12
14
8.09
10.65
7.71
11.4912.02
Creditors turnover ratio
ANALYSIS:
Generally higher the creditors velocity better it is or otherwise lower the
creditors velocity less favorable are results.
INTERPRETATION
From the above table it has seen that KS&DL exhibits high creditors turnover
ratio from 2006-08 where it has decreased gradually in the year 2008-09 and
increased in 2009-10,2010-11 to 11.49 and 12.02 respectively.
WORKING CAPITAL TURNOVER RATIO:
Working capital turnover ratio indicates the velocity of the utilization of
working capital. This ratio indicates the number of times the working capital is
turned over in the course of a year. This measures the efficiency with which the
working capital is being used by the firm. A higher ratio indicates efficient
utilization of working capital and a low ratio indicates otherwise.
Working capital turnover ratio can be calculated as fallows:
Table 4.12 showing the Working Capital Turnover Ratio
GRAPH SHOWING WORKING CAPITAL TURNOVER
RATIO
WORKING CAPITAL TURNOVER RATIO= SALES / NET WORKING CAPITAL
YEARS SALES NET WORKING
CAPITAL
RATIO
2006-2007 98,81,11,423 43,12,79,630 2.291
2007-2008 1,04,43,74,470 40,80,53,719 2.559
2008-2009 1,28,64,62,008 40,61,66,550 3.167
2009-2010 1,53,37,03,531 63,97,65,233 2.397
2010-2011 16,47,77,47,37 67,80,32,752 2.430
2006-07 2007-08 2008-09 2009-10 2010-110
0.5
1
1.5
2
2.5
3
3.5
2.291
2.559
3.167
2.397 2.43
ANALYSIS:
A higher working capital ratio indicates efficient utilization of working capital
and low ratio indicates otherwise.
From the above table, KS&DL working capital turnover ratio in the year
2006-2007 was 2.291 and for next two years it has shown an increasing trend. It
increased in the year 2008-2009 to 3.167 and decreased in the year 2009-2010
to 2.397 & 2010-11 to 2.430.
INTERPRETATION:It is inferred that working capital turnover ratio
shows an increasing trend, but it has decreased in the year 2009-2010 & 2010-
11 which shows there is inefficient management of working capital in the
previous year. The company should take steps to invest in current assets and
other short term investment opportunities.
Chapter-5
Findings, suggestion and conclusion
5.FINDINGS, SUGGESTION AND CONCLUSION
FINDINGS :
1. The Current Ratio of KS&DL even though it shows a decreasing trend in
the years 2007-2008 and 2008-2009, it has increased in the year 2009-
2010 to 2.417 which is above the standard or rule of thumb. The liquidity
position of the organization is satisfactory as it is taking steps to improve
its liquidity position and it has the ability to pay its current obligations in
time.
2. The Quick Ratio of KS&DL has remained stable during all the years. It is
just above the standard which shows that the company has ability to meet
its current liquid liabilities.
3. During the year 2006-2009, the cash ratio has increased gradually for
three years. But it decreased in the year 2009-2010 to 0.565 , 2010-2011
to 0.508 which is just above the standard rule and it has to improve its
short term financial position.The reason for decrease is decreasing cash in
the year 2009-2010, 2010-2011 and due to increase in creditors on the
current liabilities side.
4. The Inventory Turnover Ratio of KS&DL in the year 2006-2007 was
2.518. Thereafter, inventory turnover ratio is showing an increasing trend
which indicates efficient management of inventory as more frequently the
stocks are sold, the lesser amount of money is required to finance the
inventory.
5. The Debtors Turnover Ratio at KS&DL showed an increasing trend in the
next two years. But in the year 2009-2010 and in the year 2010-2011 its
showing a decreasing trend which indicates inefficient management of
debtors.
6. The creditor`s turnover ratio at KS&DL in the year 2006-07 was 8.097
and later on it shows an increasing trend in the year 2007-08 and there
was a constant increase in the year 2009-10 & 2010-11 as it indicates the
creditors are paid in time and this earns a good reputation to company in
the market.
7. The Working Capital Turnover Ratio of KS&DL was 2.291 2006-2007.
Later it showed an increasing trend from 2007-2008 to 2008-2009. But in
the year 2009-2010, the Working Capital Turnover Ratio has decreased to
2.40 which imply inefficient management of working capital. This is due
to decrease in cash and bank balance.
SUGGESTIONS/RECOMMONDATIONS :
1. The liquidity position is showing relatively more the company can go for
reducing the current assets and try to invest it in long term assets or long
term revenue earning investments.
2. The company is suggested to have a continuous check of all cash and bank
balance. In case if the cash is idle it can be brought to the notice and can be
invested in various short term investment opportunities to earn returns.
Forecasting of cash should be made to meet requirements of business.
3. Due to the shortage in cash the company is unable to have adequate
inventory reserves which are hampering its optimum production capacity.
So the company has to have efficient inventory reserves to increase its
production.
4. The company is not able to generate income from other sources due to lack
of skills of the investment analyst. So, the company should try improving
its investment decisions to generate income from other sources.
5. As a part of recommendation it is advisable if KS&DL diverts a little
portion of funds in undertaking expansion activities and ultimately
enhancing its sales and profitability.
6. By adopting good planning towards recovery of debt that is by adopting
Good Credit policy, Proper assessment of credit worthiness of its debtors,
by adopting strict collection measures etc. the company can get into more
profitability.
7. It is suggested to control over and under stocking of raw material using
technical auditors and maintain a coordination between production
processes department and inventory handling department for efficient
outcomes.
8. If the company maintains a favorable cash and bank balance it will help in
smooth running of business and maintain balanced working capital.
CONCLUSION :
The overall performance of the organization is satisfactory, particularly the
last two years trading profit is good but the trading profit is fluctuating every
year. The company can increase its clientele base by doing certain promotional
campaigns such as organizing corporate parties and advertising in a better
manner.
As a part of the study it can be concluded that the quick ratio overall the year
have remains stable which is the good indication for the company`s position,
since its able to meet its current liabilities. Also the creditor`s turnover ratio is a
good indicator that the company is able to meet a timely payments and hence is
enjoying a good reputation in the market. However as per the debtors position
in the balance sheet effective management is required, so that a favorable trend
and position can be observed overall the years.
Also KSDL should try to have an efficient inventory reserve so that its
productivity is increase and hence improve the investment decision and increase
the income level from other sources.
Last but not the least the company can device a competitive pricing strategy
so that it can overcome price related hurdles that it has been facing over the
years and hence leads to a successful organization, fulfilling its operational
objectives.
BIBLIOGRAPHY:
REFERENCE
BOOKS
AUTHOR EDITION PUBLISHER
BBM Financial
Management
Reddy, Appannaiah,
Satyaprasad
1st Edition Himalaya Publishing House,
Delhi
Business Research
Methods
Ramachandra,
Chandrasekhar
1st Edition Himalaya Publishing House,
Delhi
Cost and financial
analysis
Jawahar lal 1st Edition Himalaya publishing
house,delhi
Annual Reports
Journals
Internet references
Company Web Site: www.mysoresandal.co.in
www .KSDL. com
APPENDIX AND ANNEXURE
BALACE SHEET AS AT 31ST MARCH (AMOUNT IN CRORES)
Particulars 2007 2008 2009 2010 2011
1.Sources Of Fundsu) Share capital
31.82 31.82 31.82 31.82 31.82v) Reserve & surplus
- 1.51 13.68 26.77 34.34w) Secured loans
- 1.66 1.04 10.72 8.00x) Unsecured loans
19.99
13.00 9.00 8.35 8.35
Deferred tax liability (Net) - - 3.21 5.25 6.14
1.Fixed assetsGross block
30.28 29.24 29.61 30.96 32.72Less depreciation
24.24 23.35 23.71 23.98 24.14
Net block 6.03 5.89 5.91 6.98 8.85
Capital work in progress - - - - -
Total 6.03 5.89 5.91 6.98 8.85
2. current Assets Loans and Advances Inventories
34.12 35.09 29.60 40.75 51.76Sundary Debtors
6.88 8.09 14.63 16.35 17.29
Cash and Bank Balance 19.57 31.23 33.43 25.51 28.53
Loans and Advances 9.44 7.25 10.49 21.53 21.39
Investments in gratuity fund - - - - -
Total 70.02 81.66 88.17 109.14 123.95
Less: Current Liabilities and Provision
Current Liabilities 17.07 29.26 30.88 24.67 29.23
Provision 9.82 11.59 16.67 20.50 26.91
Net Curerent Assets (6) Less (7) 43.13 40.81 40.62 63.98 67.80
Miscellaneous Expenditure 2.12 1.29 2.80 1.64 -
Total Assets (Net) 51.81 47.99 61.96 77.84 82.52
PROFIT AND LOSS ACCOUNT (RS.IN LAKHS)
PARTICULARS AMOUNT AMOUNT AMOUNT AMOUNT
INCOME(year) 2008 2009 2010 2011
Net Sales 1,04,43,74,470
1,28,64,62,008
1,53,37,03,531
1,64,77,74,737
Other income 1,90,04,300 2,09,85,305 6,06,23,797 2,22,88,309
1,06,33,78,770
1,30,74,47,313
1,59,43,27,328
1,67,00,63,047
Increase/(-) Decrease in stock
4,73,09,343 2,64,66,726 7,03,74,213 5,32,86,174
1,11,06,88,113
1,28,09,80,587
1,66,47,01,541
1,72,33,49,221
EXPENDITURE
Materials Consumed (include trading items)
50,70,94,583
54,13,33,115
80,19,28,343
77,53,83,439
Other Expenditure 55,19,82,573
61,35,25,868
73,44,42,910
79,97,99,905
Depreciation 36,05,016 35,77,430 39,69,038 49,82,474
1,06,26,82,573
1,15,85,36,413
1,54,03,40,291
1,58,01,65,818
Operating Profit/Loss 4,80,05,540 12,24,44,174
12,43,61,250
14,31,83,402
Less: Interest and Finance charges
46,08,734 45,08,734 72,76,261 82,97,546
PROFIT BEFORE TAX 4,33,57,146 11,79,35,440
11,70,89,988
13,48,85,857
Less: Provision
for Taxation
Current Tax 52,00,000 1,80,00,000 1,85,00,000 4,80,00,000
Fringe Benefit Tax 23,01,452 70,98,690 21,28,828 -
Deferred Tax Asset 3,21,46,548 2,03,58,318 89,30,375
Dividend Tax 45,96,941 - 87,04,083
PROFIT AFTER TAX 3,58,55,694 8,82,39,809 11,68,14,478
9,31,12,149
Prior period income/(-) Expenditure
66,40,886 1,40,78,609 14,41,082
Proposed dividend 2,70,48,785 - 1,59,11,050
Tax of earlier year 2,20,99,794 1,37,30,643 - -
2,03,96,797 12,17,55,748
13,08,93,087
7,57,60,017
Profit/loss brought forward previous year
(53,26,504) 1,50,70,293 13,68,26,041
26,77,19,129
Profit/loss Carried to Balance sheet
1,50,70,293 13,68,26,041
26,77,19,129
34,34,79,146
![Presentation1 1 [repaired]](https://img.pdfslide.us/doc/110x75/588869671a28abad0d8b641f/presentation1-1-repaired.jpg)


![Blank jeopardy template[1] [repaired]](https://img.pdfslide.us/doc/110x75/548824e7b47959ce0c8b5626/blank-jeopardy-template1-repaired.jpg)

![BANKING_BASICSMini[1] (Repaired).doc](https://img.pdfslide.us/doc/110x75/577cdf0b1a28ab9e78b05cb2/bankingbasicsmini1-repaireddoc.jpg)
![Tripddy htbas 1 [repaired]](https://img.pdfslide.us/doc/110x75/55c28657bb61eb7d608b45b1/tripddy-htbas-1-repaired.jpg)