Embed Size (px)
Citation preview

«KROK» UNIVERSITY
Qualification Scientific work
based on the manuscript rights
ASARE JOSEPH
UDC 005.8:519.246.2:334.72
DISSERTATION
Fuzzy estimating of the risks of financing business projects of small and medium
enterprises based on provisions of behavioral economy
Field of study 07 Management and business administration
Major 073 Management
Educational Program “Project and Program Management”
Program Focus “Administration and Financing of Business Projects”
Submitted to obtain the degree of Doctor of Philosophy of "KROK" University.
The dissertation contains the results of own research. The use of the ideas, results and
texts of other authors is followed by appropriate citation.
__________________ J. Asare
Supervisors Rach Valentyn, DrSc, Professor
Medvedieva Olena, DrSc, Professor
Kyiv- 2019

2
TABLE OF CONTENT
CHAPTER ONE. UNDERSTANDING THE RESEARCH PROJECT 5 1.1 Introduction ……………………………………………………………. 5 1.1.1 The Overview of Financing Small and Medium Enterprises Business-
Project ………………………………………………………………….. 6
1.1.2 The Overview of Business Project Financing Risk …………………….. 9 1.1.3 The Current State of SMEs Business Projects Financing in Developing
Economies …………………………………………………………….. 11
1.2 Background to the Problem ……………………………………………. 12 1.2.1 Profile of the National Youth Employment Program – Ghana ………… 14 1.2.2 The Financing Risks of Ghana Youth Employment Program ………….. 16 1.3 Statement of the Problem ………………………………………………. 18 1.4 Research question ……………………………………………………… 20 1.5 Aims and Objectives of the Study ……………………………………… 21 1.6 Proposition ……………………………………………………………... 21 1.7 Rationalization for the Study …………………………………………… 22 1.8 Scope, Object and Subject of the Study ………………………………… 23 1.9 The Research Methodology ……………………………………………. 23 1.9.1 Limitation of the Study ………………………………………………… 24 1.9.2 Organization of the Report ……………………………………………... 24 1.9.3 Summary ……………………………………………………………….. 25 1.9.4 Task for Next Chapter ……………………………….............................. 25 Conclusions ……………………………………………………………………… 26 CHAPTER TWO. LITERATURE REVIEW: UNDERSTANDING THE RISK OF FINANCING BUSINESS-ROJECTS IN DEVELOPING ECONOMIES IN TERMS OF BEHAVIORAL ECONOMICS: USING INTEGRAL ESTIMATION AND FUZZY LOGIC RULE ……………………………………
27
2.1 Introduction ……………………………………………………………. 27 2.2 Small and Medium Enterprises (SMES) in Behavioral Economics
Context ………………………………………………………………… 28
2.3 The Finance Framework and Financing of SMEs Business-Project ……. 30 2.3.1 Finance Functions and Financial management …………………………. 33 2.3.2 Acquisition of Suitable and Sufficient Funds for Business project ……... 38 2.3.3 Estimating Business Project Profitability and Value maximization ……. 41 2.4 Overview of Global Business-Project Financing ………………………. 48 2.5 Business Projects Financing Risk ……………………………………… 66

3
2.5.1 Project Cost Estimation ………………………………………………… 68 2.5.2 Project Finance Feasibility ……………………………………………... 73 2.5.3 Project Risks Analysis …………………………………………………. 80 Conclusions ……………………………………………………………………… 83 CHAPTER THREE. RESEARCH METHODOLOGY FOR INVESTIGATING THE RISK OF FINANCING SMES BUSINESS-PROJECTS …………………..
85
3.1 Introduction ……………………………………………………………. 85 3.2 Methodology …………………………………………………………… 86 3.2.1 Research Philosophy …………………………………………………… 86 3.2.1.1 The Research Ontology ………………………………………………… 87 3.2.1.2 The Research Epistemology and Approach ……………………………. 89 3.2.1.3 The Research Axiology ………………………………………………… 91 3.3 The Research Strategy and Data Collection ……………………………. 92 3.4 Sample Type and Size ………………………………………………….. 94 3.5 Data Analysis and The Research Period ……………………………….. 95 Conclusions ……………………………………………………………………… 95 CHAPTER FOUR. ESTIMATING OF THE RISK OF FINANCING SMES BUSINESS-PROJECTS IN TERMS OF BEHAVIORAL ECONOMICS: SUING FUZZY LOGIC RULE AND INTEGRAL ESTIMATION METHOD …
97
4.1 Introduction of Youth Employability Programs Models ……………….. 97 4.2 Demographic Profile of the Respondents ………………………………. 100 4.3 Identification of the Risk of Financing SMEs Business Projects ……….. 102 4.3.1 Coding Risk Indicators and Factors ……………………………………. 108 4.3.2 Validation of Risk Indicator and Factors ……………………………….. 111 4.4 Hypothesis Test ………………………………………………………... 116 4.4.1 Testing the Degree of Truthiness or Falsehood ………………………… 120 4.4.2 The Five Golden Rule of Estimating Business-project Risk ……………. 125 Conclusions ……………………………………………………………………… 132 CHAPTER FIVE. FINDINGS AND RECOMMENDATIONS ………………… 133 5.1 Introduction ……………………………………………………………. 133 5.2 The Main Result of the Research ……………………………………….. 134 5.3 Main Findings ………………………………………………………….. 137 5.4 The Novelty of the Findings and its Advantages in Helping to Solve
Current Problems ………………………………………………………. 139
5.5 Recommendations ……………………………………………………... 140

4
REFERENCES ………………………………………………………………….. 142 APPENDIX ……………………………………………………………………… 182 Appendix A. SMES Business–Project Template ………………………………… 183 Appendix B. Risk Factor Coded …………………………………………………. 196 Appendix C. Simulation of Risk Factors Frequency Points ……………………… 208 Appendix D. Figures …………………………………………………………….. 209 Appendix E. Tables ……………………………………………………………… 228

5
CHAPTER ONE
UNDERSTANDING THE RESEARCH PROJECT
1.1 Introduction
This study investigates the risks of financing small and medium enterprises (SMEs)
business-projects in terms of behavioral economics: using the integral estimation method
and fuzzy rule. The purpose is to determine the most influential (most essential) financing
risks indicators that developing economies, business-project sponsors / investors and
managers face when financing business-projects in a knowledge economy. In recent years,
project financing has become an important part of national development; this result of the
changing nature of project administration and financing can be attributed to the
advancement in technology and the complex competitive global marketplace. Every
project requires a substantial amount of capital outlay from individuals, sponsors /
investors, organizations and or governments. This therefore calls for the development of
a methodology, models or tools to aid the estimation of the risk of financing business-
project in other to guarantee the delivery of value for money.
Developing Economies are faced with unprecedented challenges in the current
knowledge economy, as they strive to attain sustainable development through the
implementation of short and long term business-projects. These challenges have been
caused by the current knowledge economy, currently defined: a knowledge economy is
characterized with the generation and adoption of new knowledge created by scientific
research, technological development, investments in intangible assets, adoption of best
practices, and openness to socio-economic, and cultural innovations [1]. This
characteristics of Knowledge economy has caused new and a more complex risks to
manifest itself in business-projects finance. Most small and medium enterprises in
developing economies are face with the challenge of insufficient funding, poor financial
management, weak administration processes and procedures, lack of quality materials,
lack of skilled personnel needed to run business-projects and legal and political concerns.
6
These challenges not only cause poor business-project quality and less output but it also
impact negatively on achieving national, economic and global development. Developing
economies implementing business-projects through SMEs support need finance to meet
their requirements in the current knowledge economy. Also, any kind of business-project
activity depends on finance. Hence, finance is the lifeblood of every business-project.
Whether the business-project’s concerns are big or small, they need finance to fulfill all
activities involved.
1.1.1The Overview of Financing Small and Medium Enterprises Business-
Project
Small and Medium Enterprises need finance to meet their business projects financing
requirements in the current knowledge economy. It must be noted that any kind of
business project activity depends on finance. Therefore, finance is seen as the lifeblood of
business-project activities in every economy, particularly in developing economies which
have very limited access to funding. The entire developing economy’s business-project
activities are directly related to attaining sustainable development. Research has shown
that the concept of finance is thought to include capital, funds, money, and amount. But
each of these words is thought to have a unique meaning. According to Khan and Jain,
“Finance is the art and science of managing money”. Also, the Oxford dictionary defines
finance as ‘management of money’. Whereas, Webster’s Ninth New Collegiate Dictionary
defines finance as “the Science on study of the management of funds’ and the management
of fund as the system that includes the circulation of money, the granting of credit, the
making of investments, and the provision of banking facilities. Studying and
understanding the concept of financing business-projects have become an important part
in developing economies. One common means to fund business-projects is through project
finance. Project finance is very good at funding specific investments in certain industries.
Typically, majority of project finance is used for capital-intensive infrastructure
investments that employ established technology and generate stable returns, preferably
7
returns that are denominated in or can be easily converted to hard currencies. Also,
empirical studies have shown that one comparative advantages of project finance is that
it allows for the allocation of specific project risks (that is completion and operating risk,
revenue and price risk, and the risk of political interference or expropriation) to those
parties who are able to manage them [2].
Project finance have been defined in a variety of ways and there is no universally
acceptable definition. However, some author’s define project finance as: “the raising of
finance on a limited recourse basis, for the purposes of developing a large capital-
intensive infrastructure project, where the borrower is a special purpose vehicle and
repayment of the financing by the borrower will be dependent on the internally generated
cash flows of the project”. This definition has introduced certain key words which require
answers to the following questions: What is ‘Limited Recourse’? Why is Project Finance
use for developing large capital intensive infrastructure projects? Why the borrower is
called a special purpose vehicle (SPV) in project financing? Research has shown that the
terms ‘Project Finance’ and ‘Limited Recourse Finance’ are normally used
interchangeably and should be considered to mean the same. David G. and James W.
have made a strong argument that: to what extent can a financing where the lenders have
significant collateral with (or other form of contractual remedy against) the project
shareholders of the borrower can be truly regarded as a project financing? They further
indicated that ‘limited’ alternative that financiers have to a project’s shareholders in a true
project financing is a major motivation for institutions adopting this approach to
infrastructure investment. They additionally pointed out that Project financing is largely
an exercise in the equitable allocation of a project’s risks between the various stakeholders
of the project [3].
History has it that the genesis of project financing can be traced to when the Roman
and Greek merchants used project financing techniques in order to share the risks inherent
to maritime trading [4]. Also, project financing (PF) is believed was first used on a large
scale to develop the North Sea oil fields during the 1970s, where the scale and risk of the

8
investment required far exceeded the capabilities of any single petroleum company, or
even any single consortium of companies. Following the success of the North Sea
developments, PF have been used extensively to develop natural resource, electric power,
transportation, and numerous other ventures around the world. PF have been associated
with many financial and operating success stories. These include the Teeside Power
project in the UK, the Ras Laffan LNG project in Qatar, the Hopewell Partners Guangzhou
Highway in southern China, and the Petrozuata heavy oil project in Venezuela [5, 6]. In
the 21st century project financing has grown very rapidly. Available data indicates $328
billion funding went into project financing in 2006, while $165 billion was recorded in
2003. The year 2006 recorded $217 billion in financing above the previous year 2001[7].
A key driver of project financing in recent time is the fastest pace in which the world’s
economy is growing. Research has shown that the global GDP has grown at a
compounding annual growth rate of about 5%, while developing countries is estimated
to be around 7% on average, since 2003[8]. Those studies also indicated that this rapid
growth of the World’s economy demands greater investment in business-projects such as
basic infrastructure, games, railways network, bridges, roads, information and
communications networks, electric power generation marketing facilities, airports, water,
waste management facilities and quality healthcare centers. The Organization for
Economic Cooperation and Development (OECD) has envisage that the world will need
to spend about 4% of national and global GDP on infrastructure per year to support the
accelerated growth. This means that nearly $1.6 trillion would be required annually to
boost infrastructural project globally. Sadly, most governments especially those in
developing economies are not well positioned to fund even a fraction of these investments.
Additionally, the 2017 Global Report on project finance have shown that project financing
has suffered a major decline in recent years. This decline is thought to be due to the
uncertainty (risks) surrounding the macro-political events which have dominated news
headlines throughout 2016. The Figure D.1 in appendix D shows the global spending on
project financing by region in 2016 [9]. The report also showed that the Sub-Saharan
9
Africa region is dominated by developing economies which includes Ghana. However,
they are the second least after the Caribbean in terms of global project financing in 2016.
It is worth noting that in financing business-projects, the key players are the sponsors,
thus: national government (state-owned institutions and enterprises); the firms responsible
for the actual busimess-project construction work at the project site; legal professionals
who design the contracts and state the responsibilities of all parties involved; specialists
who are responsible for allocating project risks and assessment, accounting, financial
systems and controls, and who advise all principal actors on the project risks, and
investment analysts who organize and lead the institutions / investors that funds the
business-project loan. Also, financing business-projects in most cases is seen as a
contractual network that revolves around several actors who usually sets up their own
contracts terms that they hope would favor them. However, most business-project gets
financed successfully when all the interests of the parties involved are satisfied at the same
time. In most developing economies the issue of contractual networks is a major
challenge. Thus, actors who are involved in signing the business-project financing
contracts sometimes do not have the strength and the expertise to negotiate for better
terms, do effective costing and risks estimation.
1.1.2 The Overview of Business-Project Financing Risk
Ensuring that adequate and timely risk identification is performed is the responsibility
of the business-project owner, as the owner is the first participant in the business-project
(thus, competency). Studies have shown that the sooner risks are identified, the sooner
plans can be made to mitigate or manage them. Also, assigning the risk identification
process to a contractor or an individual member of the business-project staff is rarely
successful and may be considered a way to achieve the appearance of risk identification
without actually doing it. It is important however that all project management personnel
receive specific training in risk management methodology (this is also talking about
competency). The said training should cover not only risk analysis techniques but also the

10
managerial skills needed to interpret risk assessments [10]. Unfortunately, this is not the
case in developing economies, particularly in Ghana. Most business-projects investors and
managers the competency / skills required to be able to identify risks of financing a
particular business-project. However, the ability to identify and allocate risks is a key
component of business-project financing.
A business-project may be subjected to a number of technical, environmental,
economic and political risks, particularly in developing countries and emerging markets.
Financial institutions and project sponsors may conclude that the risks inherent in a
particular business-project development and operation are unacceptable. Marco S. (2004)
stated that a riskier or more expensive project may require limited recourse
financing secured by a surety from sponsors. Marco added that a complex project finance
structure may incorporate corporate finance, securitization, options
(derivatives), insurance provisions or other types of collateral enhancement to mitigate
unallocated risk [11]. Notably, this behavior of individuals and institution towards risk
and business-project financing can be better understood in terms of behavioral economics.
Behavioral economics is taught to entail the study of the effects
of psychological, cognitive, emotional, cultural and social factors on
the economic decisions of individuals and institutions and how those decisions vary from
those implied by classical theory [12]. This means that the ability to identify and mitigate
risks is influenced by the psychological, cognitive, emotional, cultural and social factors
surrounding the individual or institutions making the business-project financing decisions.
The above attitudes of individuals and institutions towards risk is the result of the
constantly changing global working environment which creates destabilizing factors,
risks, dangers and threats to business-projects in developing economies. Such situations
requires managers to endeavor to implement effective methodological framework that will
ensure business-project activity continuity and economic security as explained in the 3M
pyramid methodological frame work [13]. The issue of financing risk is increasingly
becoming an important subject matter for business-project finanaing in developing
11
economies, most importantly in SMEs business-projects financing. This is due to the
demands for improvement in quality, accountability and organizational effectiveness in
business-projects implementation. Authors such as Morris et al., (2012), Rosacker and
Rosacker (2010), Crawford, L. et al., (2003), Baranskaya (2007) Ama Lawani, (2016),
and Graham, R. J., and Englund, R. L. (2013) have written extensively on the practices of
project management and financing in developing economies [14,15,16,17,18, and 19].
Understanding the word ‘project’ is very crucial in this study. The word ‘project’ is
defined as a temporary endeavor undertaken to create a unique product, service or result
[20]. It must be noted that good project management practices have positive impact on
project success [21]. However, empirical studies have shown that developing countries
are at a juvenile stage in project management and other factors are believe to be the lead
causes of project failures in developing economies[22, 23]. The case in Ghana is not
different, according to Ofori and Deffor (2013) [24]. In recent times financing of business
project by international agencies have placed much emphasis on the importance of well
prepared and executed projects. Unfortunately current happenings in developing
economies reveals: poor project planning and preparation, substandard project design,
faulty appraisal and selection processes, unproductive coordination of project activities,
troubles in startup, activation, and poor project execution, operation and supervision as
common characteristics of projects in developing economies[25]. All the above clearly
shows that the current state of SMEs business-projects are characterized with bottlenecks,
fund shortages and numerous problems which calls for a timely and remedial action to be
taken.
1.1.3 The Current State of Business-Projects Financing in Developing Economies
Typical of most developing countries business-project financing is the shortage of
long term and local currency financing for small and large scale business-projects. Most
business-projects financing in developing economies is impeded by poor local economic
development, insufficient monetary transfers, diminutive own source revenue and lack of

12
creditworthiness make. These challenges at times makes it very difficult for local
investors, financial institutions and government to raise funds adequate enough to fully
fund business-projects locally on their own. When financing business-projects in
developing economies certain important funding and financial issues must be noted.
Financing business-projects in developing economies tend to be expensive compare to
developed economies. Therefore, developing strategies for sourcing funding (both public
and private) to fund business-projects need to be an integral part of every financing
strategy. Research have shown that project finance in developing economies is based on
three sources: Debt, Equity and Grants [26]. Interestingly, most investors that fund
projects in developing economies are very much interest in the term ‘bankability’ [27].
The figure D.2 in appendix D presents a system model of key factors that currently
determines project bankability in developing economies.
1.2 Background to the Business-Project Financing Risk Problems
Governments all over the World are losing huge sums of money through projects as a
result of project failure. Recent study into over 200 projects showed that only one out
eight information and communications technology projects can be considered truly
successful [28, 29]. According to Heeks (2006) almost all World Bank funded Projects
in Africa is either total failure or partial failure [30]. This report is heart breaking. The
question one may ask is: are there no better methods of identifying the prime risks of
financing business-projects in Africa? Some scholars believe that the over dependence
upon developed countries and agencies such as the United Nations and the World Bank
by developing economies to achieve their development objectives are no longer
sustainable, unfortunately developing countries lack resources and have to always resort
to such sources for funds [31, 32]. According to J. Nelson (2014) developing countries
face an annual gap of $2.5 trillion for financing projects in sectors that will be relevant to
achieving sustainable development goals. This study also believe that an effective and
accountable corporate-government engagement can help to leverage financial resources,

13
build the trust and strengthen the governance and delivery capacity that are required to fill
this gap and start more inclusive and resilient growth [33]. It is believed that researches
on business-project failure can be categorized into three groups. The first group takes
general view of project failure [34, 35 and 36]. The second collection focuses on private
sector projects [37] and the final group research into the public or government sector
projects [38, 39]. In pursuit for development developing countries engage in projects and
programs such as youth employability, roads, dams and housing, plants, pipes
constructions etc. Mostly, these projects are normally financed by tax-payers,
International Monetary Fund and or the World Bank. Studies have shown that setbacks
such as abandonment, cost deviation, schedule deviation and stakeholders’ dissatisfaction
are some of the causes of projects failure in developing economies Kaliba et al. (2009),
Ahonen and Savolianen (2010). Also, other studies have shown that projects have been
abandoned in developing countries due to lack or insufficient funding, citing a typical case
as the Chad-Cameroon $4.2 billion dollars pipe-line project which failed because the
World Bank withdrew its financial backing World Bank (2006). However, Ruuska
and Teigland (2009) believe that inadequate resources are a major cause of project failure.
Developing countries in their quest to achieve development undertakes a number of
business-projects which are financed by tax-payers, private investors, local and or
international. However, the inability to effectively estimate the risks of financing such
programs always leads to complete failures. This challenge developing countries face has
created high youth unemployment rate. Studies into youth employability have shown that
developing countries have considerably larger young populations as compared to
developed countries. Also, the issues of youth employment and unemployment in
developing economies will increase in importance as these countries continue to gain
weight within the global economy [40]. According to the International Labor Organization
(ILO, 2016) youth unemployment rate in developing countries is expected to remain
relatively stable at around 9.5 percent in 2016, but in terms of absolute numbers it should
increase by around 0.2 million in 2016 to reach 7.9 million unemployed youth in 2017

14
[41]. The report further stated that youth unemployment rate in sub-Saharan Africa is
expected to continue on its downward trajectory, which began in 2012, reaching
10.9 percent in 2016 and decreasing slightly to 10.8 in the following year. However, the
unemployment outlook for youth in major countries of the region remains quite mixed.
Table E.1 in appendix E shows youth unemployment rate in the Africa region. From table
1.1 in appendix II one would have expected youth unemployment rate to drop.
Unfortunately the case is different; a report by the World Bank on youth unemployment
in Ghana has revealed that about 48 percent of Ghanaian youth between the ages of 15-
24 do not have jobs. The report further indicated that in Ghana, youth are less likely than
adults to be working. In 2012, about 52% of people aged 15-24 were employed (compared
to about 90% for the 25-64 population), a third were in school, 14% were inactive and 4%
were unemployed and actively looking for job. Also, young women in the same age group
are particularly disadvantaged and have much higher inactivity rate than men: 17% of
young female are inactive as opposed to 11% of males [42]. Further, the International
Labor Organization in their 2016 World Employment and Social Outlook report revealed
that 47% of Ghana’s labor force have been left underutilized. In an attempt to solve the
huge youth unemployment problem in Ghana is the brain behind the introduction of the
Youth Employment Program by the Ghana government in 2006. Figure D.3 in appendix
D shows some Ghanaian unemployed youth demonstrating against the Ghana government
in 2017 for lack of jobs.
1.2.1 Profile of the National Youth Employment Program – Ghana
High youth unemployment in Ghana is a major challenging issue confronting the
country. For instance the Ghana Trades Union Congress stated that yearly youth
unemployment in Ghana increases by two hundred and fifty thousand (250,000) [43]. A
situation of this nature demands the Ghana government to undertake developmental
projects that will create jobs for Ghanaian youth. To help solve the high youth
unemployment in Ghana, the government in 2006 introduced the National Youth
15
Employment Program (NYEP). The NYEP which was then known as the National Youth
Job Corps Program (NYJCP) was established in 2006. This special policy initiated was
based on the presidential directive to ensure that all youth including Junior High School
(JHS) and Senior High School (SHS), Technical/Vocational School graduates as well as
school dropouts and illiterate youth, would be actively engaged in some productive
employment. The objective of the program was to help reduce unemployment, under-
employment, satisfy national needs such as food security and equip the youth with some
work experience for permanent employment [44].
During the first phase of the program, from 2006 to 2008 the government spent over
$114 million on the program. [45]. Table E.2 in appendix E shows the Ghana cedi to US
dollar budget spending for the first three years of the NYEP. Also, figure D.5 in appendix
D presents the histogram of the budgeted and actual government spending on the program
from 2006 to 2008. A careful analysis of 2006-2008 NYEP financing data reveals clearly
that the program started facing financing risks right from inception. Only about 60.30%
of the total budget for the program in 2006 was funded. However, the program saw an
improvement in funding in 2007; when it received about 82.85% of funds needed for its
budget. It is worth noting that there was a 42.77% reduction of budget in 2007 compared
to 2006. The program further received 96.92% funding for its budget in 2008, an
improvement of 14.07% funding compared to 2007. Comparatively, there was a 32.22%
reduction in budget funding in 2008 compared to 2006 and an 18.41% budget increase in
2008 compared to 2007. Ideally one would have expected that such important youth
employability program would receive a boost in funding but that was not the case of
Ghana’s National Youth Employment Program. From the above this study can clearly
state the then government failed to identify the risks in the ideas that established the NYEP
Critical observation on the Youth Employment Program in Ghana revealed that the
program faces high political and legal risk. A change of government in 2009 also led the
renaming of the program to Ghana Youth Employment and Entrepreneurial Development
Agency (GYEEDA) in 2012. This was done to restructure the program organization. The

16
restructuring looked into issues such as impact assessment, increasing the models, funding
and payments etc. [46]. The restructuring report indicated that GYEEDA lack governance
framework, lack legal basis for the needed oversight and direction, lack of commitment
of the part of leadership to protect the public purse to ensure value for money and lack
adequate operational and administrative manuals resulting in limited or non-adherence to
relevant policies and this has caused system failure. At the national level the program
appears to be highly politicized [47]. These challenges can be categorized as idea risk,
competency risk and financial / investment risk.
1.2.2 Financing Risks of Ghana Youth Employment Program
Some reports on the program showed that the four year period of GYEEDA saw a lot
of financing and financial management threat. The four (4) year period of the program,
from 2009 to 2012 received whopping sum of GH¢949,661,017 ($604,918,158.48) from
five (5) unauthorized sources. The sources are: the District Assembly Common Fund;
Ghana Education Trust Fund (GetFund); National Health Insurance Scheme, Ministry of
Finance and Economic Planning and Communication Service Tax to fund their
unstipulated and wooly projects and activities [48]. A typical case in 2009 showed that
the total funding of GH¢115,260,000 ($73,418,689.09) grew to GH¢157,341,000
($100,223,581.12), an increment of about 36.51% in 2010. By the year 2011, the figure
had increased to GH¢228,015,437 ($145242013.50), this is a representation of about a
45% increment in funding compared to 2010. Unbelievably, in the election year 2012, the
funding surged to GH¢449,044,580 ($286033874.77), representing a 96.93% increment
of funds for projects. The report also revealed that the GH¢949,661,017
($604,918,158.48) allocated to GYEEDA in 2008-2012 was not the only amount spent on
the program. An unaudited financial statements in June 2013 revealed that GYEEDA also
had an outstanding debt of GH¢259,000,000 ($164978661.06). This revelation brings the
total government spending on GYEEDA in from 2009 to 2012 periods to
GH1¢1,208,661,017 ($769,896,819.54). The report further indicated that a 47% of the
17
GH¢259,000,000 ($164978661.06) alleged debt is thought to be owed. Also the programs
was paying an unbelievable financing cost of about 100% per month or 1,200% per annum
on the above debt. These revelations proves the real existence of high risks of financing
business-projects in developing economies, characterized with ineffective financial
policies and financial misappropriations.
The competency of every management team is very crucial to the success of every
business-project. Some studies have identified lack of senior management commitment,
poor competency and lack of coordination to improve and ensure the quality of NYEP
business-projects as one major challenge confronting NYEP (49]. For instance, the
Director of Finance from 2008 to 2012 hinted that in most cases, he was not aware of the
amount and nature of disbursements that were made to service providers. Unbelievably,
the four-year period, 2008-2012 of the program could not produce financial statements,
budgets, or any financial reports. There appears to be no internal controls and accounts
were never audited. The table E.3 in appendix E and figure D.4 in appendix D shows the
seven (7) year, 2006-2012 period government spending on the program. The NYEP
Agency core duty is to set standards and procedure for the employment and career
development of the youth in the country among others [50]. However, this study believes
that there is a complete failure on the part of the agency in delivering its core function
looking at the rate of youth unemployment in Ghana. This complete failure has to do with
lack of Competence [51]. Some scholars have pointed out in their studies that development
as a function is not only of capital, physical and material resources, but also of their
optimum utilization [52]. Unfortunately, the optimum utilization of capital, physical and
material resources is a major problem facing NYEP

18
1.3 Statement of the Problem
Developing economies in an attempt to attain development engage in many
developmental projects through SMEs business-project support. Traditionally, these
business-projects are normally financed by tax-payer, World Bank and or the International
Monetary Fund. Unfortunately, these projects are faced with several setbacks including
stakeholders’ dissatisfaction, scope and cost divergence; and complete abandonment [53,
54]. The rate of project failure trend around the world has attracted a lot of attention,
particularly developing countries where a lot of business-projects are implemented to help
attain a certain level of development. According to Espiner, 2007; Asay, 2008; and Fabian
& Amir, 2011 governments and business around the globe are losing huge sums of money
through project failure [55, 56]. It is very alarming to mention that only one in eight
information technology projects can be considered to be truly successful [57]. Another
group of study by (Marzouk & El-Rasas, 2013; Heeks, 2006; Sweis et al., 2008) shows
that project failure in developing countries is on the high side [58, 59].
When stating SMEs business-project financing risks faced in developing economies,
there is the need to clearly define what constitutes project failure. According to Abednego
& Ogunlana (2006) project failure is linked to the managerial phase of a project [60].
Another definition by Atkinson (1999) is focused on project constraints also known as the
“Iron Triangle”. Atkinson further suggested that projects should be assessed base on
benefits to organizations, benefits to stakeholder community and information System.
Atkinson explained that the benefits to stakeholder include: contractors’ profits, capital
suppliers, project team, economic impact to surrounding community, satisfied users,
social and environmental impact, personal development, and professional learning [61].
These indicators when analyze carefully are directly linked to Idea risk, Competency risks
and Financial risks.
Projects failure rate in Ghana is also on the high side, with no exception of government
projects. There are several reported case of Ghana government projects failure in the
media (World Bank Reports 2007, 2008 and 2012). Also, a study by Amponsah (2014)

19
indicates that at least one out of every three infrastructural development projects in Ghana
either fail or is not able to achieve one of the objectives [62]. These have prompted most
donor agencies strictness on governments of developing countries including Ghana to
meet certain conditions before funds are given out for projects. One of such conditions is
the competency of the project management team and the administrative process. The
World Bank report (2012) indicated that developing countries such as Ghana’s over
reliance on external sources of resources (especially funding) for their developmental
projects call for the country to develop their skills to be able to identify other funding
source [63]. Also, a study conducted by Isaac et al. (2015) indicates that funding,
management and administration are major factors that contribute to Ghana government
projects failure [64].
One major government project in Ghana that has attracted the attention of both local
and international community is the National Youth Employment Program (NYEP),
currently known as Youth Employment Agency (YEA). This project is known for the
administration and financing challenges it continually face despite every effort by the
government of Ghana to ensure its success. Palmer and Robert (2007) evaluation report
indicated that the program appears to be highly politicized with only the government in
power seeing its relevance in addressing youth unemployment challenges [65]. Also,
Ransford Gyampo (2012) indicated that the NYEP has proven to be woefully inadequate
in sustainably dealing with the huge problems of unemployment among Ghana’s youth
due to the serious setbacks it suffers. The GYEEDA Report, 2013 also indicated that the
greatest problem of Ghana’s NYEP is the absence of an appropriate governance
framework; inadequate financial oversight; poor supervision etc., these challenges are
purely idea risks, competency risks and return on investment risks.
Projects are used in all business and non-business fields as a means of organizing
activities with the aim of achieving desired objectives. However, in spite of the relevance
of projects, the PMI (2013) reports that more than one third of projects fail to reach their
objectives [66]. Also, Daniel L. et al (2012) stated that most developing countries face a

20
shortage of long-term local-currency financing for small-scale infrastructure projects and
this impedes local economic development. Also, inadequate fiscal transfers, little own
source revenue and low creditworthiness make it difficult for local governments to fully
fund projects on their own [67]. To sum it all, Nicholas C. et al. (201) in their studies
found that financial and economic factors were the most likely cause of projects failures
in Ghana [68]. These clearly shows that developing economies, particularly Ghana face a
lot of financing risks and funding challenges in their pursuit to attain development through
SMEs business-projects implementation. This therefore call for a study to be conducted
on “Estimating the Risk of Financing Small and Medium Enterprises (SMES) Business-
Projects in Developing Economies: in Terms of Behavioral Economics – Using the
Integral Estimation and Fuzzy Rule”. This study is believed would help developing
economies to overcome all business-project financing challenges confronting them.
1.4 Research question
The significance of business-project finance in economic development is enormous.
In developing economies governments are expected to implement projects that are
believed would contribute to the attainment of the desire level of development. The actual
contribution of finance to business project success is considered to be more critical than
the project other factors since it aid in shaping the entire project environment to achieve
success. To be able to provide lasting solutions to the identified challenges as indicated in
the problem stamen, this study will try to find answers to the following questions: 1. To
what extent does behavioral economics and fuzzy logic rule ensures the effective
estimations of the risks of financing business-projects? 2. What are the prime risks factors
of financing business-projects? 3. What are the prime risk indicators of financing
business-projects? 4. What is the relationship between risk and financing of business-
projects in developing economies? 5. What financing risk model is the most effective in
identifying and controlling the risks of financing business-projects?
21
1.5 Aims and Objectives of the Study
The aim of this research is to identify the prime risks of financing SMEs business-
project in developing economies, particularly in Ghana. As well as to develop a model
and golden principle that will facility effective and quick identification and control of
those risks indicators. Also, among this study’s objective is to further develop models that
will guarantee higher returns on investments in business-projects. While the relationship
between risks of financing business-projects and return on investment in business-projects
seem to be clearly important, this study seeks to extend this understanding in terms of
behavioral economics; using integral estimation and the fuzzy rule as the basis to develop
effective model and or principle of estimating and controlling the prime risks of financing
business-projects. This study was guided by the following objectives:
i.To investigate how effective some of the old approached to estimate the risks of
financing business-projects have been.
ii. To determine the critical financing risks indicators that causes business-projects
failures in developing economies.
iii. To understand the risks of financing business-projects in terms of behavioral
economics, using integral estimation and fuzzy rule. Iv. To develop the most effective
models and or principles to estimate the risks of financing business-projects in developing
economies. V. To prove that the developed model by this study is the most effective to be
used to estimate the risks of financing business-projects in developing economies.
1.6 Proposition
This study hold the proposition that: i. Effective estimating of the risks of financing
business-projects in developing economies would guarantee higher return on investment.
Ii. The approach to estimating the risks of financing business-project risks have a
significant impact on attracting both local and external funding to those projects. Iii.
Business-projects success has positive correlation with the effective estimation of the risks
of financing those projects. Iv. Idea risk, Competency risk and Return on Investment risk

22
is equal to business-project financing risks (Ir, Cr, ROIr = BPFR). V. High risk business-
project does not mean no or less return on investment.
1.7 Rationalization for the Study
Business-projects initiated in developing economies might not be able to solve the
unemployment problems facing the economy. However, if such business projects undergo
effective financing risk estimations and appropriate financing models are used to ensure
activity continuity, issues of business-project failure will become a thing of the past. This
study has developed model and a guiding principle that would ensure the effective
estimation of the risk of financing business-projects. It is hoped that this model would
guarantee business-projects success and higher return on investment. The developed
model also highlights the correlation between risk of financing business-project and the
integral estimation and Fuzzy rule. The rate of business projects failure is high in
developing economies; this research also highlights the factors that constitute the prime
risks of financing business projects and offers solutions. Further, there appear to be a
missing link between the estimations of the risks of financing business projects and
business-project financing in developing economies to the extent that some researchers
have indicated in their studies that “getting funds released from donor partners and
agencies are very difficult, couple with administration challenges; while others have also
indicated that developing economies lack project development capacity [69, 70]. This
study also believe that not much study have been conducted into the estimation of the risk
of financing business-projects in developing economies. Therefore, this study will
contribute to the body of knowledge in the field of finance, especially when estimating
the risk of financing business-projects in developing economy in general. This study will
be of much importance and interest to scholars, students and policy makers. On a personal
level, it will assist the researcher to attain a higher qualification in finance and
management of business-projects and will broaden the researcher’s knowledge and
understanding of Finance and risks of financing business-projects.

23
1.8 Scope, Object and Subject of the Study
The scope of the study covers the estimations of the risk of financing business-projects
in developing economies, focusing on the National Youth Employment Program (NYEP)
in Ghana. The Youth Employment program of Ghana was chosen as the setting of this
study because the programs has existed for quite some time now (over 10 years) and it has
a lot of data that will support this study. Also, NYEP has registered a lot of risks in terms
of financing and financial management. That makes it more prudent for this study to be
conducted to support such important national program. Further, the program share similar
characteristics with most business-projects implemented in developing economies, and
this would mean that the findings of this study would be applicable to, if not all, most
business-project.
Object: the object of this study is the prime risks of financing business-projects. This
is what frames the research question, articulates all claims, formulates and generate
information, facilitates techniques that will produce new knowledge, models and
information through the research.
Subject: the subject of this research is the human beings the study targeted for
observation by the researcher. The subject includes NYEP program coordinators; project
/ model managers and participants
1.9 The Research Methodology
This study is a scientific social research which reveals what the situation of the object
and subject is and what it ought to be. The study uses quantitative, qualitative and
conceptual research methods. Data was collected through questionnaires, face-face and
phone interviews, direct observations and e-mails. Data collected were analyzed through
the use of SPSS and Excel software.

24
1.9.1 Limitation of the Study
The importance of this study to developing economies, Ghana in particular, NYEP
beneficiaries and policymakers cannot be exaggerated as stated. However, the desire to
do conscientious work should see some degree of limitation because the study used
closed-ended questions which restricted respondents from expressing own views on
certain issues outside the study. Also, participants of NYEP are scattered all over Ghana
and contacting all to get adequate information was awkward. However, maximum efforts
were made to cover the established sample size that guarantees the quality and accuracy
of the research findings.
1.9.2 Organization of the Report
The study is grouped into five chapters. The chapter one presents the overview of the
risk of financing business-project in developing economies, the history of NYEP and its
financing risks and other challenges and problems, the problem statement, the research
questions, objectives, the rational of the study, limitations as well as the organization of
chapters, summary and conclusion. Chapter two presents relevant literature on the
concept and theories of risk of financing business-project in terms of behavioral
economics; using the integral estimation method and the Fuzzy rule to answer the different
questions posed in this study. It also looks at the risk of financing business-projects.
Chapter three also present the research methodology, including methods of gathering the
data and statistical measurements; and also gives a short profile of the study area and the
kind of data required. Chapter four provides detail analysis on data, discusses and provides
meaningful presentation of data collected on both subject and object. Lastly, the chapter
five discusses the main findings of the study; draws generalize conclusions and offers
useful recommendations.

25
1.9.3 Summary
This chapter of the study presents what this study sought to do and presents the
research topic as “estimating the risk of financing small and medium enterprises business-
projects in developing economies: in terms of behavioral economics – using integral
estimation method and fuzzy rule,” with the focus on determining the prime risks of
financing business-projects in developing economies. The study also highlight that
developing Economies are facing unprecedented challenges in the current knowledge
economy, as they strive to attain sustainable development through the implementation of
short and long term economic development projects. This chapter also sought to prove the
essence of estimating the risks of financing business-project as a way of guaranteeing
higher returns on investment in business-projects. It also presents information on project
finance, its essence and the sources of project finance. Further this chapter provides an
overview of project finance. Furthermore, it clearly defines the object and subject of the
study. Additionally, it provided detail background of the case study and clearly defines
the problem statement, justifying the rational for the study to be conducted, and also state
the research goals, questions and objectives.
1.9.4 Task for Next Chapter
This study accept as true that projects are used in all business and non-business fields
as a means of organizing activities with the aim of achieving desired objectives.
However, in spite of the relevance of projects, more than one third of projects fail to reach
their objectives (PMBOK, 213). Therefore, the next chapter of this study will focus of
reviewing related literatures on the risks of financing business-projects to justify the
knowledge gap that this study sought to fill. Also, the next chapter will seek to establish
the rational for considering the risks of financing SMEs business projects in the context
of behavioral economics. It will also prove the relevance for suing the integral estimation
method and the fuzzy rule as the scientific base of this study. Further, the next chapter

26
will establish the need to proceed to choose the research methodology to aid data
collection and analysis.
Conclusions
Developing Economies are facing unprecedented challenges in the current knowledge
economy, as they strive to attain sustainable development through the implementation of
short and long term business-projects. However, most of these projects in developing
economies face the challenge of insufficient funding, poor financial management, weak
administration processes and procedures, lack of quality materials, lack of skilled
personnel needed to run the projects and legal and political concerns. These challenges
not only causes poor project quality and less output or impact but it also impact negatively
on achieving national, economic and global development. The above challenges when
analyzed critically can be termed as Risks of financing business- projects.
The National Youth Employment Program (NYEP is noted for the risks of financing
its business-project. The program continually face numerous challenges despite every
effort by the government of Ghana to ensure its success. Analysis of available reports on
the program indicated that the program appears to be facing high financing risks, with
only the government in power seeing its relevance in addressing youth unemployment
challenges. The programs has also proven to be woefully inadequate in sustainably
dealing with the huge problems of unemployment among Ghana’s youth due to the serious
setbacks it suffers which are purely financial issues. The above identified challenges of
NYEP and the existing knowledge gap in the scholarly world on the subject matter forms
the logic for this study to be conducted on “Estimation of the Risks of Financing Business-
projects in Developing Economies: in terms of Behavioral Economics –Using the Integral
Estimation Method and Fuzzy Rule”.

27
CHAPTER TWO
LITERATURE REVIEW: UNDERSTANDING THE RISK OF FINANCING
BUSINESS-PROJECTS IN DEVELOPING ECONOMIES IN TERMS OF
BEHAVIORAL ECONOMICS: USING INTEGRAL ESTIMATION AND FUZZY
LOGIC RULE
2.1 Introduction
The crucial role of finance in business-project implementation is enormous. However,
finance is seen as the major challenge confronting all business-projects implemented in
most developing economies; particularly in Ghana. This chapter analyzes the existing
body of literature on the prime risks of financing business-projects in terms of behavioral
economics, using integral estimation method and fuzzy rule as a foundation for the
successful estimation of the prime risks of financing business-projects in developing
economies. Also, this chapter presents analyses on behavioral economics theories, integral
estimation method and fuzzy rule to prove its effectiveness in analyzing the prime risks
of financing business-projects in developing economies.
A review of related literature was undertaken in so as to establish the perspectives of
scholars on estimating the prime risks of financing business-projects. In addition,
literature on SMEs and behavioral economics provided the basis to review various
perspectives of integral estimation methods and fuzzy logic rule usefulness in risks
estimation. Recent studies have shown that companies and governments all over the
World are losing huge sums of money through project failure (Espiner, 2007, Asay, 2008,
and Maylor et al., 2006). However, Isaac S.D., (2015) studies prompted the need to look
into risks of financing business projects.

28
2.2. Analysis of Small and Medium Enterprises (SMES) in the context of
Behavioral Economics
Despite the huge contributions of SMEs to economic growth such as jobs and market
creation and income generation, there is no universally accepted definition of SMEs [71].
The differences in SME definition extend in three sides: definitions by international
institutions, definitions by national laws and by industry definitions. Finding a universal
standard poses a piercing and acute critic to institutionalists, economists, academics and
industrialists [72]. Some research have shown that small and medium enterprises are
sometimes being defined by adjectives such as size. Most economists for instance define
SMEs by dividing them into classes according to some quantitative measurable indicators.
However, the most common decisive factor to distinguish between large and small
businesses is the number of employees [73]. It is thought to be true that the Bolton Report,
1971 is one of the first attempts to provide a definition of SMEs [74]. This report suggests
two approaches to define SMEs: quantitative approach and qualitative approach.
However, most international institutions, academics, statistical agencies and
policymakers, most often apply the quantitative criteria in defining SMEs. The European
Commission defines small enterprise as having 10 to 50 employees and medium enterprise
as having 51 to 250 employees, with an annual €10 million and €50 million respectively
[75]. However, in Ghana the Registrar General Department define Small enterprises as
those employing between 6 and 29 employees and with fixed assets of up to one hundred
thousand dollars ($100,000), whilst medium enterprises as those employing between 30
and 99 employees with fixed assets of up to one million dollars ($1,000,000) [76].
Most importantly, major SMEs operations entails activities which can be best escribe
as business-project. Wretchedly, in spite of the billions of dollars spent on economic
development assistance each year, there is still very little known about the actual impacts
of those interventions in the SME sector. This study believe that the success of every
business-project start from the ‘idea conception stage” (idea risks). To logic behind the
idea risks introduced in this study can be linked to the ‘Noisy’ Selection Theory, which

29
states that one key factor to consider when analyzing the success of a firm is its start-up
and operating costs [77]. Saburo K. (2001) believes that finance as fundamental to SMEs
growth, and describes it as tool for SME development [78]. But the big question is: what
is the guarantee that the invested fund will yield the most expected results? (Thus, return
on investment risks). However, Najib H. (2002) revealed that the principal factors
impeding firm growth are lack of access to qualified workers and managers; government
policies such; domestic price volatility among others [79]. Also, Pajarinen et al. (2015)
stated that entrepreneurs with higher academic background are more innovative and will
use modern techniques and models to do business. Schumpeter (1934) indicated that an
entrepreneur needs to be innovative, creative, and should be able to take risk. Further,
Barringer and Bluedorn (1999) described entrepreneurs as individuals who can explore
the environment, discover the opportunities, and exploit them after proper evaluation [80,
81, and 82]. These characteristics as stated above when analyze carefully are linked
competency (Competency Risks). The competency risk is more affirmed through a careful
analysis of the Chaos theory [83].
To better gain more insight on the rationale behind most SMEs choices of business-
project and decision making, this study would like to explore some knowledge on
behavioral economics. Understanding the effects of psychological, cognitive, emotional,
cultural and social factors on the economic decisions of individuals and institutions and
how those decisions vary from those implied by classical theory is very crucial when
estimating the risk of financing business projects [84]. It must be noted that humans make
95% of their decisions using mental shortcuts or rules of thumb. Humans’ frame their idea
base on the collection of anecdotes and stereotypes that make up the mental filters
individuals rely on to understand and respond to events. However, one must note that
market inefficiencies exist and these include mispricing and non-rational decision making
[85]. Also, when individuals make decisions, their rationality is limited by the tractability
of the decision problem, their cognitive limitations and the time available. Therefore,
decision makers in this view act as satisfiers, seeking a satisfactory solution rather than an

30
optimal one. It must be noted that the idea that humans generate take shortcuts that may
lead to suboptimal decision-making [86, 87, and 88]. From these points, the estimation of
the risk of financing SMEs business-project must go beyond just looking at financial
indicators but should also look at the psychological state of the persons initiating /
managing the business idea or requesting for funding. These constitutes what this study
identify as an IDEA RISK.
2.3 The Finance Framework and Business-Project Financing.
The origin on the word ‘finance’ is thought to come from the Latin word “finis” which
means end or finish. Some scholars believe that the implications of finance affect
individuals and businesses, organizations and states and it has to do with obtaining and
using of money or money management [89]. The fact is that every type of business activity
depends on finance, irrespective of whether it is big or small, finance is needed to fulfill
all such activities [90]. Typical of most business-project activities is its profit making
nature, job creation and economic development and all these activities combined some
form of factors of production. The economics concept of factors of production includes:
rent; wages and salaries, interest given to sponsors and shareholders and these factors
requires finance to meet the above requirements. Also, the term finance may be called as
capital, investment, fund etc. but each of these term is having different meanings and
unique characters. In simple term, finance may be defined as the art and science of
managing money and includes financial service and financial instruments [91]. Also,
Paish F.W., (1982), John J. H., (1989), and Howard and Upton (1953) have provided
detail definitions to finance. These definitions includes: the position of money at the time
it is wanted (time bound); the flows of money through an organization, whether it will be
a corporation, school, bank or government agency; and that administrative area or set of
administrative functions in an organization which relates with the arrangement of each
and credit so that the organization may have the means to carry out the objectives as
satisfactorily as possible [92, 93, and 94]. After, critical examinations of the various

31
definitions of finance given by scholars, this study also define finance as: “the
administrative function of identifying, contacting, negotiating terms, obtaining and
managing monetary resources from individuals, financial and nonfinancial institutions or
government to fulfill the financing needs of business-projects in an organization”. That
is, the art of raising and managing monetary resources to found business-projects
It is an indisputable fact that finance is required for investment purposes as well as to
meet substantial capital expenditure projects [95]. Also, according to
BusinessDictionary.com financing is the “act of providing money for a project” [96]. All
the above various definitions of finance makes it clear that there is a strong connection
between finance and business-projects. That is, the later depends on the forma for its
implementation. Also, the definitions shows that every business-project requires funding.
This therefore, has created a strong need to look at the art of financing business-projects.
Also, every business activities require finance and every business is a process of acquiring
and disposing assets, that is, real assets (tangible and intangible) and financial assets with
the objectives to grow wealth or to use wealth (assets) in the best way to meet economic
needs [97]. Similarly, very SMEs business-project require a substantial amount of capital
outlay to run its activities. It is however impossible to conduct such business activities
without injection of money from time to time. It is for this reason why an in-depth
understanding of business-project financing is very crucial to this study.
Further, Finance is thought to mean an amount of capital or the sum of money
provided to an organization with the expectation to repay, and organizations are liable to
pay back the capital amount along with a certain percentage of interest [98]. The important
questions to ask is: how would the entity providing the capital be sure that the receiving
entity will be able to repay the capital amount and interest? This is why there is the need
for this study to be conducted on the estimation of the risk of financing such entities.
Financing play a pivotal role in the start of a business and ramp it up to profitability. There
are several sources to consider when looking for start-up financing. But first, there is the
need to consider how much money is need and when it will be need. The financial needs

32
of every business-project will vary according to the type and size of the business.
However, debt and equity are considered to be the two major sources of financing. Equity
financing means exchanging a portion of the ownership of the business for a financial
investment in the business, whereas debt financing involves borrowing funds from
creditors with the stipulation of repaying the borrowed funds plus interest at a specified
future time [99].
SMEs are essential agents in innovation and technology advancements as well as an
important part of the supply chain for large multi-national companies. Unfortunately, there
appears to be a knowledge gap about how to estimate the risks of financing SMEs
business-projects, the range of funding options available to SMEs and the acceptance level
of risks of financing SMEs business-projects. This revelation is a contrary to the
predictions of the Financial Growth Life Cycle model because the external sources of
financing SMEs exceed internal sources. However, the most crucial factors for the
survival in each stage of the development process and for smooth transition from one stage
to another are the entity’s ability to fund its operation [100]. In The aftermath of the 2008-
09 global financial crises, bank credit constraints experienced by SMEs in many countries
have further highlighted the vulnerability of the SME sector to changing conditions in
bank lending. Traditional debt finance such as bank loans, overdrafts, credit lines and the
use of credit cards is the most common source of external finance for many SMEs and
entrepreneurs [101]. Sadly, traditional banks have become more concern about SMEs
credit worthiness. Existing literatures reviewed shows that estimating SMEs credit
worthiness can be done base on Hard Quantitative Data, and Relationship Lending [102
and 103]. However, specific challenges limit traditional banks lending to SMEs. These
are largely related to the greater difficulties that lenders encounter in assessing and
monitoring SMEs relative to large firms [104 and 105]. These also called the development
of an effective financing system that can supply financial resources to a broad range of
SMEs in varying circumstances. Also, channeling financial wealth from different sources
to SMEs business-project investments would be required to help grow the SME sector.
33
The above stated points when analyze carefully reveal the need to consider the risks
involve financing SMEs business-project. That is Financing Risks indicators.
2.3.1 Finance Functions Versus Financial management
One of the most important functions of finance is ensuring the efficient utilization of
funds. Eugene F. B. et al. (2013) stated that finance function is the most important
function of all business activities. That is, raising money alone is not important but the
efficient management of finances [106]. This means that all SMEs must develop the
ability to raise funds from multi sources, keeping in mind the implications in particular
and risks attached. The functions of financial management are better understood in its
definition. That is, financial Management deals with procurement of funds and their
effective utilization in the business [107]. The effective utilizations of funds meant for
business-projects implementation requires that managers endeavor to put in place proper
control measures that will guarantee value for money. Also, Solomon E. (1963) indicated
that financial Management is concerned with the efficient use of an important economic
resource, namely capital funds [108]. Further, the European Commission, (2017) maintain
that resource efficiency means using the Earth’s limited resources in a sustainable manner
while minimizing impacts on the environment. It is believe this will promote the creation
of more with less and to deliver greater value with less input [109]. Also, financial
management is concerned with the acquisition, financing and Management of assets with
some overall goal in mind [110]. Further, financial management includes the processes
of acquiring and managing the financial resources for the project. That is, project financial
management is more concerned with revenue sources and monitoring net cash flows for
the construction project than with managing day-to-day costs [111].
One key function of financial management is financial planning – the process of
establishing a budget based on information about expenses and income [112].This means
that effective financial planning in business-project development and implementation
would enable sponsors and implementers to predict its profitability and liquidity.

34
Financial planning also helps to know the net worth of the business-project by making a
list of all assets as well as liabilities involved in the project. Net worth = Total assets –
Total liabilities. It further helps to: i. Create a budget for the project; ii. Set the project
financial goals; iii. Know stakeholders risks tolerance level; iv. Develop and implement
financial plan and v. Review and adjust the financial plan. Authors such as Paul M.
(2013), RIM Society (2012), Laury H. (2003), and Matt W. et al. have all written
extensively on financial planning [113, 114, 115, and 116]. The figure D.6 in appendix D
illustrates the six key steps involved in business-project financial planning.
Another key function is financial Control – financial control is thought to have a wide
meaning in some organizations and a narrow meaning in others. The wide meaning
follows the meaning of internal controls except that it refers to controls, which have a
specific financial component. The narrower meaning follows the narrower meaning of
financial controller and refers to the specific review of the conformity of transactions with
regulations and procedures described in ex-ante financial control [117]. However,
financial control are those measures that is put in place to ensure that financial related
assets or properties of an 34tilization34 are safeguarded, either from externals or
employees of an 34tilization34 from any threat whatsoever, whether by theft, loss or
misappropriation (intentional or otherwise). Thus financial controls are those policies,
procedures practices and organizational structures which are implemented to reduce
financial risk to the organization [118]. The success of every financial control system
depends largely on the internal control system of the organization. An internal control
system is the whole system of control, financial or otherwise, established by the
management in order to carry on the business of the enterprises in an orderly and efficient
manner, adherence to management’s policies, safeguard the asset and secure as far as
possible the completeness and accuracy of the records [119]. The objectives of internal
control system are: Operational control, administrative control and internal accounting
control. These objectives have been researched on extensively by theses authors in their
studies [120,121,122, and 123].

35
i.Features of an Internal Control System
An internal control system is the process designed, implemented and maintained by
those charged with governance, management and other personnel to provide reasonable
assurance about the achievement of an entity’s objectives with regard to reliability of
financial reporting, effectiveness and efficiency of operations, and compliance with
applicable laws and regulations [124]. Also, Kan (2013) stated that internal control
includes all the policies and procedures adopted by the directors and management of an
entity in order to achieve their goals of ensuring, as far as practicable, the orderly and
efficient conduct of its business, including: adherence to management policies;
safeguarding of assets; prevention and detection of fraud and error; ensuring the accuracy
and completeness of the accounting records; and timely preparation of reliable financial
statements [125]. The Figure D.7 in appendix D developed by this study illustrates the
functions of financial management in business-project development and implementation.
Philippe Z., et al (2011) stated in their study that management control is an approach that
is pursued over time. The approach to management control is therefore progressive, which
is why researchers describe it as the control process [126, 127]. Also, Monitoring- One
key purpose of monitoring is not simply to “observe” whether targets have been reached
or not. Monitoring is an essential part of control to ensure the achievement of objectives.
Monitoring is not supposed to be done at the end of the timeframe, but rather during the
implementation of action plans, to give manager the chance to take corrective actions
before the final result [128]. Also, Organizational Control – the process by which an
organization influences its subunits and members to behave in ways that leads to the
attainment of organizational goals and objectives [129]. Further, Supervision Control –
supervision as a site-visit have a central function as a means for collecting data, but also
as an arena for negotiation and persuasion between inspectors and those being inspected
[130]. The primary goals of supervision include: serve as a guarantee that minimum
standards are maintained; contribute to raising the level of standards; and, lead to clients
and citizens trusting the inspected operations and the democratic system [131].
36
Additionally, Eva Hämberg (2013) highlight a broad spectrum of control systems which
is divided into what can be described as the four ideal types: oversight, competition,
mutuality and contrived randomness. [132].
As part of the control measures, physical controls are considered as measures and
procedures put in place to protect physical assets against theft or unauthorized access and
use [133]. Physical (Environmental) security addresses the implementation, maintenance,
threats, and vulnerabilities controls that can be utilized to physically protect an
enterprise’s resources and sensitive information of an organization [134, 135]. Also, table
E.4 in appendix E illustrates clues to help detect when control systems are needed [136].
Another major challenge of business-project financing is authorisation and approval
control – Many a times there is conflict of interest between project team as to who qualifies
to authorize and or approve funds and other resources to be spent on projects. Astrid A.
(2010) stated that approval is the confirmation or sanction of employee decisions, events
or transactions, based on an independent review. Approval requirements should be
documented to ensure that employees obtain approvals in all situations where
management has decided they are necessary [137]. Authorization and approval controls
can prevent loss of resources, including capital assets, inventory, proprietary information,
and cash. Also helps to ensure compliance with applicable laws and regulations. However,
periodic audits against the control guidelines can ensure that a process in control stays in
control [138]. Also, personnel control – is one important measure when it comes to
financing business-projects. The function of personnel management helps in planning,
organizing, directing, and controlling of the performance of those operative functions
[139, 140]. Arithmetical and accounting control – according to O’Leary et al., (2006)
internal control structure can be summarized into three, mainly: the control environment,
the accounting information system and control policies and procedures. Where, the control
environment covers management philosophy and operating style, organizational structure,
assignment of authority and responsibility, internal audit, use of the information
technology, human resources and audit committee. Also, the accounting information

37
system component includes database contents, data input-processing-output and inclusion
in the financial report, segregation of duties, authorization procedures, adequate
documentation, independent checks, physical controls and records [141, 142]. Table E.5
in appendix E represents types of accounting controls the can be put in place to control
the risk financing business-projects.
ii.Nature of Financial Administration of Business-Projects
Financial administration as an important aspect of business-project financing and it is
also an essential function performed by all managers globally. Financial administration is
the process of managing financial tasks for a company or organization (Cambridge
English Dictionary). The term Financial Administration consists of two words;
Finance and Administration. Financial Administration is also the set of activities which
are related to making available money to the various branches of an office, or an
organization to enable it to carrying out its objectives [143]. Also, financial administration
involves all the activities of finance and taxation [144]. Further, financial administration
is concerned with all the aspects of financial management of the State. The above
definitions shows that to be able to carry out the functions of financial administration
successfully business-project managers must be competent in estimation of financing
risks. Studies have shown that the nature of financial administration consists of two
views: traditional and modern views. The traditional view conceives financial
administration as a sum total of activities undertaken in pursuit of generation,
regulation and distribution of monetary resources needed for the sustenance and growth
of public organizations. The modem view considers financial administration as an
integral part of the overall management process of public organizations rather than one of
raising and disbursing public funds [145]. This research is of the view that all projects
involve a substantial amount of capital outlay in a form of “project finance”. Also,
governments and the private sector generally benefit from exchanges of human and
financial resources through project finance. Therefore, the estimation of the risk of

38
financing business-projects can also be considered to be an integral aspect of the financial
administration function.
Also, Vignesh G (2015) maintained that financial administration falls into five well-
defined divisions namely: preparation of budget, execution of the budget, treasury
management, rendering of the accounts by the executive and the audit of these accounts
[146]. Additionally, some studies have suggested that the system of financial
administration has strong connections in governance; however, there appear to be weak
financial administration among governments in developing economies. The concept of
financial administration appears to also vary from system to system or it is determined by
the geographical, political or economic condition of the State [147].
2.3.2 The Acquisition of Suitable and Sufficient Funds for Business-project
One major challenge this study sought to address is how to estimate the risk of
financing SMEs business-project. Isaac S. D. et. Al. (2015) in their study indicated delays
in payments and release of funds as among the top ten caused of government projects
failures in Ghana. Also, other studies have shown that not only SMEs in developing
economies have difficulties in acquiring suitable and sufficient funds for business-
projects. Joseph C. et. Al (2011) mentioned that most public infrastructure projects does
not have adequate commercial opportunities to be fully self-funding. And further stated
that government now needs to develop new models for funding projects. To succeed, these
models must be appropriate to both the individual project circumstances and government’s
prevailing investment objective. Joseph et al. further indicated that such models should
consist of those which enable government to: leverage private sector investment in
infrastructure assets; earn a potential return and recycle government capital; reduce the
costs of financing new infrastructure and share in future recovery of financial markets;
address demand risk for economic infrastructure. An important aspect of models is that it
serve as a sensitivity analysis to determine the financial impact of different funding levels
and the resultant need for special levies/assessments [108, 109]. The impact of the global
39
economic downturn which started in 2008 gave birth to the New Funding Model to
improve funding for projects globally [150]. Empirical researches have shown that a
growing number of project finance will involve innovative structures with capital from an
increasingly sophisticated investor source. To achieve a successful financing
arrangement, a financing structure must be designed – and that structure must be
embodied in a set of contracts – which will enable each of the parties to gain from the
arrangement. At different times, different capital markets may provide funds on the most
attractive terms [151, 152].
i.Sources of Business Project-Finance
There are several sources to consider when looking for financing. It is important to
note that there is the need to first consider how much money is need and when it will be
needed. The financial needs of a business will vary according to the type and size of the
business [153]. Figure D.9 in appendix D illustrates a model for acquiring sufficient and
suitable funding for business projects. The funding options under internal sources is as
follows: i. Owner’s funds / Capital – financing own business-project is the most
fundamental aspect of its management. When commencing a new business-project, very
often the initial monies invested will come from the individual’s personal savings. The
tendency of business start-ups to approach relatives and friends to help finance the venture
is also a widespread practice [154]. Ii. Selling Assets – According to Richard B. et al
(2015) sale of asset may be in a form of shares or real assets. An asset sale offers the buyer
more control to specify which assets are being acquired and, in effect, enables the buyer
to “cherry pick” those assets and liabilities (if any) that it wishes to acquire [155]. Iii.
Retained Earnings – Retained earnings or retained surplus refer to the portion of a
company’s profits that is kept for reinvestment into the business or for debt payments,
instead of being paid out rather as dividends to shareholders [156]. However, Burgstahler
and Dichev (1997) noted that, due to the fact that few options are available for raising
capital, most executives generally prefers cash from operations as a major source of
capital for re-investment and firms’ growth [57]. Iv. Bank Loan: term loans are credits
40
extended to business concerns serves to differentiate them from many other types of loans,
also having terms of more than one year that are made by commercial banks, insurance
companies and other financial institutions [158]. Bank loans and advances are found to be
convenient as far as its repayment is concerned. Banks generally do not interfere with the
use, management and control of the borrowed money [159]. However, high interest rates
continue to a major challenge in developing economies. Notably among them are policy
rate, interbank rate(s), government securities rates and banks’ lending and deposit rates
which do not promote business growth in developing economies [160]. V. Grants – grants
are a form of financial assistance given by government, independent foundations,
philanthropists and private sector companies where there is no expectation or requirement
that you repay the money. [161].
ii.Secrets to Successful Business Project Financing
Globalization has increase capital needs of businesses. Finance experts estimate that
the business financing market exceeds $170 billion a year. However, this is still not
enough to satisfy the capital needs of SMEs entrepreneurs and their funding requirements.
When searching for capital to launch businesses-projects, entrepreneurs must remember
the following secrets to successful financing: i. choosing the right sources of capital for a
business. Ii. The money is out there; the key is knowing where to look. Iii. Raising money
takes time and effort. Iv. Creativity counts. V. The World Wide Web puts at entrepreneurs’
fingertips vast resources of information that can lead to financing; use it. Knowing these
secrete is very important in business project financing because too many entrepreneurs
get into financial deals because they needed the money to keep their businesses growing,
only to discover that their plans do not match those of their financial partners [162]. These
secrete as revealed clearly shows that securing sufficient and sustainable funding for
business-projects requires much competencies. Basing on the above, one key indicators
of estimating the risk of financing business-project in is competency risk.

41
2.3.3 Estimating Business Project Profitability and Value maximization
Currently, most investors and sponsors in most cases would provide financing to
business-project on the guarantee that the funds would yield profits or lead to the
maximization of the investment value. Monica T. (2014) accepted that the term
profitability may be defined as the ability of a given investment to earn a return from its
use. Monica T. continued to state that profitability is a relative concept whereas profit is
an absolute connotation. Despite being closely related to and mutually interdependent,
profit and profitability are two different concepts. In other words, in spite of their generic
nature, each one of them has a distinct role in business. As an absolute term, profit has no
relevance to compare the efficiency of a business organization. It must be noted that a
very high profit does not always indicate sound organizational efficiency and low
profitability is not always a sign of organizational sickness. Therefore, it can be said that
profit is not the prime variable on the basis of which the operational efficiency and
financial efficiency of an organization can be compared. To measure the productivity of
capital employed and to measure operational efficiency, profitability analysis is
considered as one of the best techniques [163]. Further, some empirical studies have also
shown that there are several ways to measure a firm’s profits other than just looking at
their bank account statement which, to tell the truth, do not tell much about profitability.
Those studies recommended three methods of analyzing how well a firm is doing: Margin
(or profitability) ratios; Break-even analysis (based on revenues and on units sold) and
Return on assets and on investment [164].
Profitability Ratios: according to Ľubica L., (2007) Profitability ratios reveal the
company´s ability to earn a satisfactory profit and return on investment. L’ubica further
stated that the ratios are an indicator of good financial health and how effectively the
company in managing its assets [165]. The profitability of a firm is what will enable that
firm to attract potential investment. The following are some profitability ratios [166].
Profitability Sustainability Ratios are:
Sales Growth = Current Period – Previous Period Sales / Previous Period Sales
42
Reliance on Revenue = Revenue Source / Total Revenue
Operating Self-Sufficiency = Business Revenue / Total Expenses
Gross Profit Margin = Gross Profit / Total Sales
Net Profit Margin = Net Profit / Sales
Return on Total Assets = Net profit after taxes / Total assets
Return on Equity = Net profit / Average shareholder equity
The use of financial ratios provides indisputably valuable information on the activities
of a firm and its financial position. However, care must be taken when using ratios [177].
This statement is a clear indication that ratios is not a perfect tool for estimating financing
risks.
i.SMEs Business-project Value Maximization
Every firm exists to maximize stakeholder’s value. This is true according to the
shareholder theory which states that the primary purpose of a firm is usually defined as
value maximization for shareholders [168]. Additionally, the maximization of a firm’s
equity is the present value of expected benefits always takes a form of cash flows that
shareholders can expect from the firm. This definition also indicates that a firm’s value
can be maximized only when expected benefits are maximized over a long period. By this
we should keep in mind that value maximization (of equity) is not equivalent to profit
maximization. Profits are an accounting category and represent the historical performance
of a firm; however, they are not the best proxy of what investors can benefit from a firm.
Thus, from the perspective of the shareholder value maximization, expected future (free)
cash flows are a far more important measure of a firm’s performance [169].
Several studies have sought to help provide better understanding of stakeholder’s
value maximizations. Scholars as Rose and Mejer (2003) believe that the stakeholder
orientation implies that a firm should be managed in the interest of all its stakeholders,
not just in the interests of shareholders [170]. Is it also important to note that while
advocating for the protection of the shareholders’ rights there is also the need to promote

43
active cooperation between organizations and other stakeholders in order to create wealth,
jobs and sustainability of financially stable firms [171]. According to Primož D., et. Al, if
a firm does not follow the principle of value maximization in a long-run, it may be found
in a situation, when it could not gather adequate financial resources for its investments.
Also, Aswath D. (2011) offered some basic principles that would help to maximize firm’s
value by stating that firms must: Invest in projects that yield a return greater than the
minimum acceptable hurdle rate, choose a financing mix that minimizes the hurdle rate
and matches the assets being financed. And if there are not enough investments that earn
the hurdle rate, return the cash to the owners of the firm (if public, these would be
stockholders) [172]. This study finds it very hard to accept the last recommendation made
by Aswath. The current global economy has proved that there are very limited funds for
large number of SMEs business-projects, therefore, any decision to return funds back to
owners would block all future funding opportunities from the fund providers. Also, such
decision would be seen as financial management incompetency and risk averse attitude.
That is why this study has identified competency as one a key indicator for estimating the
risk of financing business-project [173].
Further, some scholars also believe that efficient market provide enough information
needed to make sound investment decision that maximizes value. The notion that markets
are efficient was first stated by Fama E. F. (1965). According to Fama an efficient market,
on the average, competition will cause the full effects of new information on intrinsic
values to be reflected “instantaneously” in actual prices [174]. Also, Clarke, J., et al.
(2001) stated that many investors try to identify securities that are undervalued, and are
expected to increase in value in the future, and particularly those that will increase more
than others. Obviously, any edge that an investor possesses can be translated into
substantial profits [175]. Figure D.10 in appendix D illustrates the functional objectives
that firms must set to be able to maximize its value.

44
ii.Investment decision and Allocation of Funds to business projects. Investor are searching for value to exchange with their funds, therefore, to attract
funding for business-projects there is the need to prove that the proposed business-project
can offer the highest value to investors. The decision to invest resources is one of the
significant drivers of the business financial system. A well planned strategies supported
by sound investments are very crucial in creating shareholders value. In real business
project situation some investment decisions that confront managers include: the
acquisition or investing in a financial instrument, a research and development project,
marketing program, introducing additional working capital, and putting resources to new
facilities. In either case, analyzing the positive and negative consequences to ensure a
sound cash flow is very crucial. According to Harcourt, G.C. et al. (1967) investments can
be replacement investments, where a physical asset is replaced; or investments can be net
investments when, to the existing assets, new ones are added. And the decision whether
to make investment or not depends on the investor’s profit expectation [176]. Also, Virlics
A., (2013) shows that investment decisions are made after a complete analysis of the
investment project. Virlics A. further stated that one of the basic factors that influence the
decision is the risk factor of the investment. This risk exists because it is uncertain that
the cost of the investment will be recovered and a profit will be gained [177]. One major
challenge associated with investment decision making is risks and uncertainty. Toma S.V.
et al. (2012) stated that to better understand the concept of risk, it is necessary to make a
clear distinction between risk and uncertainty. Risk refers to situations in which
probabilities targets can be identified for possible results. In other words it can be
quantified. Instead, uncertainty refers to situations or events about which there is sufficient
information to identify objective probabilities. Therefore, when the information necessary
for understanding and anticipating developments or changes that may occur in a particular
context is either insufficient or unavailable, the situation is defined as uncertain. The key-
element in making the distinction between risk and uncertainty is probability [178].
45
iii.The Investment Decision Process According to Bierman and Smidt (2012) capital investment involves commitments of
resources made in the hope of realizing benefits that are expected to occur in future periods
[179].Also, Brealey et al. (2011) stated that a capital investment is an investment in a real
asset expected to generate some future return [180]. Further, the Big Society Capital
(2016) stated that effective investment decision entails eight principal steps: planning;
screening; analysis; due diligence; investment decision making; investment deal-making;
monitoring and evaluation; and reporting [181]. The figure D.11 in appendix D shows the
pyramidal model of business project investment decision process according to this study.
Planning: according to Todd L., (2013) planning refers to the process of deciding what
to do and how to do it. Further, Todd L. indicated that effective planning takes into account
diverse perspectives and impacts, allowing decision-makers to identify and implement the
most effective ways to achieve goals. And also, the principle of good planning is that
individual, short-term decisions should support strategic, long-term goals [182]. On the
other hand investment planning involves deciding how best to put money or capital to
work to achieve financial goals. Individuals and organizations fortunate enough to have
money left over after paying the costs of living and or operations may be able to make
that extra money to investing it to earn a financial return. The following basic steps are
recommended for investment planning: 1. Setting investment goals. 2. Understanding
your investment personality. 3. Designing an investment portfolio. 4. Selecting specific
investments. 5. Managing and monitoring the portfolio and 6. Rebalancing or redesigning
the portfolio, if needed [183]. Therefore, successful investment in SMEs business project
must commence with effective planning.
Another task is Screening: The importance of investment is enormous, but not all
investments must be positive. An investment can bring high-value returns for the
company, but it can also happen that its implementation involves not recouping the
investments and, therefore, the investment result is negative. Also, there are several
models of valuation of investments to assist in the decision whether or not to undertake

46
investment. These models are divided into two main groups: static and dynamic. The
difference between these two groups lies in the consideration of the time value of money.
Whereas the dynamic group considers this factor, the static one does not take it into
account. This is a great advantage for dynamic methods since they are more closely
adapted to reality [184]. Screening is the surest way for investors to be clear about their
core purpose and conditions for investment. Effective screening should answer the
following: Is there an effective and well-designed mission? Does the proposed investment
support the organization and its generation of impact? Does the organization show good
governance? Is there regular and transparent reporting on both impact and financial
performance? Is there assurance that the use of profits and assets will be in line with the
mission? (Big Society Capital, 2016) If the answers to the above questions are positive
then one proceed to the next step to conduct investment analysis.
Also, analysis: entails two basic forms of investment, that is, direct or indirect type of
investing. Direct investing is realized using financial markets and indirect investing
involves financial intermediaries and this can be an investment in financial assets or
physical assets. Financial assets are divisible, whereas most physical assets are not. An
asset is divisible if investor can buy or sell small portion of it. In real investment analysis
one should consider the following: Marketability (or Liquidity), Holding period for
investments, Information availability, Investment management process, and Investment
policy. Further, investment analysis applicable tools are: benchmark, technical analysis,
where the fundamental analysis in its simplest form is focused on the evaluation of
intrinsic value of the financial asset. This valuation is based on the assumption that
intrinsic value is the present value of future flows from particular investment [185]. Due
Diligence: according to Hal Nelson et al. (2004) diligence strategy of a firm establishes
the criteria for screening and evaluating potential investment proposals. And that the
strategy outlines the types of investments that are consistent with the firm’s investment
philosophy [186]. Investment comes with so much uncertainties therefore the need for
proper due diligence. Also, Todd R. T., (2008) mentioned that investment due diligence

47
is what separates professional investors from novices. And that the primary objective of
any due diligence checklist is to answer four basic questions: What are the expected
investment return characteristics? What is the investment risk profile? Are the people
competent? And are the people honest? The difficulty in knowing exact outcome of every
investment is what has necessitated the need for every investor to exercise due diligence
[187].
Additionally, investment Decision: in Theoretical Economics investment is define as
the production of capital goods. That is goods which are not consumed but instead used
in future production. Also, to Finance Term, investment means buying of Assets [188].
There are three main forms of investment; this study believes that knowing them would
facilities sound business project investment decision: Physical investment, Financial
Investment and Security Investment. Figure D.12 in appendix D illustrates the three forms
of investment which SMEs entrepreneurs can venture into. To Mintzberg et al. (1976)
decision making consist of three phases, namely: identification, development and
selection. Although these phases do not need to occur sequentially, however it can be
affected by dynamic factors [189]. However, Cyert and March (1963) believe decision
making process follows four concepts: Organizational learning, Uncertainty avoidance,
Quasi-resolution of conflict and Problematic search [190]. These studies show that
competency very key in making sound investment decision. The figure D.13 shown in
appendix D illustrates investment characteristics which this study believes investors must
pay critical attention to before they venture into any form of business project. From the
above there is no doubt that investment decision require a holistic approach and analysis
of all factors that can in one way or the other affect the investment returns. The above
literature also reveals the relevance of financial management in risk estimation. According
to Usman A. A., (2017) good financial management will help organizations to: Make
effective and efficient use of resources; achieve objectives and fulfill commitments
to stakeholders; become more accountable to donors and other stakeholders; gain the
respect and confidence of funding agencies, partners and beneficiaries; gain advantage in

48
competition for increasingly scarce resources; and prepare for long-term financial
sustainability [191].
2.4 Overview of Global Business-Project Financing Businesses undertake series of activities which are either in a form of short term of
long term business projects. The term project finance which according to Bruce C. (1996)
is used loosely by academics, bankers and journalists to describe a range of financing
arrangements. Also, the term in trade journals and industry conferences is described as a
new financing technique; however this is actually a centuries-old financing method that
predates corporate finance [192]. Project financing techniques is believed can be traced
back to 1299A.D. when the English Crown financed the exploration and the development
of the Devon silver mines by repaying the Florentine merchant bank, Frescobaldi, with
output from the mines where bankers held a one-year lease and mining concession and
they were entitled to as much silver as they could mine during the year [193]. Another
study revealed that project finance can be traced to the Roman and Greek merchants who
used project financing techniques in order to share the risks inherent to maritime trading.
However, modern project financing terminology is largely an exercise in the equitable
allocation of a project’s risks between the various stakeholders of the project. This means
that the origin of the project financing technique can be traced back to this principle [194].
Also, Rickard W. (2008) affirms the origin of project finance can be trace to the Romans
and the Greeks. Rickard stated that project finance has been used by the Romans and
Greeks as solutions to raise funds to export goods to other parts of the known world [195].
On the other hand, Dentons et al. account that project finance started in the UK in the 70’s
where limited recourse lending in the UK took off in the early 1970s when lenders started
making project finance available for the development of some of the early oil and gas
fields in the UK continental shelf [196].
One common feature is that early projects that were financed were relatively few and
far below as there was a relatively small pool of lenders prepared to finance projects.

49
Project finance typically entails borrowing money through bonds, loans, or other financing
mechanisms. Project finance is typically used for large capital projects in cases in which
using “pay-as-you-go” does not make good planning and programming sense, because the
project’s capital needs would consume most, if not all, available funding and still often
fall short of being fully funded [197]. Also, project finance involves creation of a legally
independent project company financed with nonrecourse debt (and equity from
sponsoring firms) to finance investment in single-purpose capital asset e.g. power plant,
oil or gas pipeline system, school [ 198]. Clearly, the above definition revealed that raising
funds for any kind of business project should not focused on one particular or single
sponsor. Further, Project finance is generally used to refer to a non-recourse or limited
recourse financing structure in which debt, equity and credit enhancement are combined
for the construction and operation, or the refinancing, of a particular facility in a capital-
intensive industry [199]. Additionally, project finance has been defined as the process of
financing a specific economic unit that the sponsors create, in which creditors share much
of the venture’s business risk and funding is obtained strictly for the project itself.
Also, project finance creates value by reducing the costs of funding, maintaining the
sponsors financial flexibility, increasing the leverage ratios, avoiding contamination risk,
reducing corporate taxes, improving risk management, and reducing the costs associated
with market imperfections [200]. According to Rashi A. S., project finance is the long
term financing of infrastructure and industrial projects based upon the projected cash
flows of the project rather than the balance sheets of the project sponsors. It involves non-
recourse financing of the development and construction of a particular project in which
lenders looks to the revenue expected to be generated by the project for repayment of its
loans and to the assets of the project as collateral for its loan rather than to the general
credit of the project sponsor [201]. Undoubtedly, most business projects require stable,
continuous, sufficient and long-term finance due to the fact that typical project will begin
to generate cash after its completion.

50
i.Types of Project Finance To facilitate the financing of projects different types of projects will require different
forms of financing in a developing economy setting. Therefore, this study believes that
there is the need to identify the various types of financing designed especially for
financing projects in developing economies. The Public-Private Partnership Manual
(PPPM), (2004) indicates that the finance types available for project implementation
include: public finance, corporate finance and project finance [202]. The figure D.14 in
appendix D shows the finance types available for projects implementation.
a) Public Finance: The term public finance is made up two key works ‘public’ and
‘finance’. The exact shade often depends upon the substantive qualified, and in some
expressions more than one sense is vaguely present; in others the usage is traditional, and
it is difficult to determine in what sense precisely the thing in question was originally
called public [203]. Also public relating to or involving people in general, rather than
being limited to a particular group of people [204]. Finance on the other hand according
to George W. B. (2008) is an academic and a professional discipline devoted to the study
and practice of making “investments. An investment is anything owned or controlled and
that has the potential to increase future consumption at the expense of current consumption
[205]. The above definitions: public finance is an investment in a business project where
funding is raised from the general public to facilitate consumption by the general public.
Also, Public finance is a type of finance in which the government funds the project through
its own equity or through borrowed funds [206]. On the other hand public finance is a
study of collection of revenue from the public by the government and spending it for the
welfare of society. Although an important part of economics, public finance, as a science
is older than economics itself [207].
One major of developing economies is internal revenue mobilization; this can be
attributed to a number of reasons including: mismanagement of funds and lack of quality
of projects funded with public fund. Hugh Dalton (1922) stated that public finance is
concerned with income & expenditure of public authorities and with the adjustment of
51
one with the other [208]. Also, Carl P. (1921) stated that public finance is the science
which deals with the activity of statesman in obtaining and applying the material means
necessary for fulfilling the proper functions of the State [209]. Indisputably, all the above
scholars have proved that it is possible for developing economies to raise resources from
the public to implement development projects. However, one common critique about all
the above definitions is that the authors did not provide any tool to estimate the risks in
funding such projects to guarantee return on investments. Figure D.15 in appendix D
represents the scope of public finance. The scope of public finance covers: Financial
Administration – aims to control processes and operations of public revenue, public
expenditure and public debt [210]. Public Revenue which is concern about all those
sources from which the government derives its revenues [211]. Public Expenditure – is
thought to be the beginning and end of the collection of revenues by the government [212].
Public Debt – is circumstances when public revenue is not able to fully cover public
expenditure, the only option for the government is to borrow from the public to meet the
financing gap. Huge public debt affects production, consumption, income distribution and
economy growth. Research has shown that developing countries have distinct debt
dynamics from that of developed ones. However, successful debt reduction requires fiscal
consolidation and a policy mix that supports growth; fiscal consolidation aiming to reform
structural weaknesses preferred over myopic measures; and realizing the fact that debt
reduction is bound to be time consuming [213].
b) Corporate Finance: Corporate finance is the kind of financing in which a private
company borrows funds to construct a project which is very likely not too capital intensive
and repays borrowed money from operating income. Corporate finance entails: Capital
Budgeting – the process of planning and managing a firm’s long-term investments is
called capital budgeting. In capital budgeting, the financial manager tries to identify
investment opportunities that are worth more to the firm than they cost to acquire. Capital
Structure – a firm’s capital structure (or financial structure) is the specific mixture of long-
term debt and equity the firm uses to finance its operations. The financial manager has
52
two concerns in this area. That is: how much should the firm borrow? In other words,
what mixture of debt and equity is best? The mixture chosen will affect both the risk and
the value of the firm. Second, what are the least expensive sources of funds for the firm?
Firms have a great deal of flexibility in choosing a financial structure. Working Capital
Management – The term working capital refers to a firm’s short-term assets, such as
inventory, and its short-term liabilities, such as money owed to suppliers. Managing a
project’s working capital is a day-to-day activity that ensures that there are sufficient
resources to ensure the activity continuity and to avoid costly interruptions and
unnecessary delays of the project [214]. Also, according to Edward M. E. (2013) corporate
finance is a specific area of finance that analyzes the financial decisions of corporations.
That is, investment or capital budgeting decisions, financing decision and day-to-day
operations [215]. The structure corporate finance has been presented in figure D.16 in
appendix D.
The success of every project not only depends on finance but also the adherence to
investment principles also plays a crucial role. Aswath D. (2001) offers some basic
investment principle to guide the use of corporate finance to fund projects. Aswath
believes that in corporate finance investors should invest in projects that yield a return
greater than the minimum acceptable hurdle rate. This shows that corporate finance for
project is suitable for projects that can offer higher returns than normal investments. The
hurdle rate should be higher for riskier projects and reflect the financing mix used, that is
owners’ funds (equity) or borrowed money (debt). Also, the returns on projects should be
measured based on cash flows generated and the timing of these cash flows; they should
also consider both positive and negative side effects of these projects. Aswath also
maintained that managers must choose a financing mix that minimizes the hurdle rate and
matches the assets being financed. And suggested that if there are not enough investments
that earn the hurdle rate, return the cash to stockholders [216].
One key personnel in project finance is the financial manager whose duty among
others is to raise funds for the project and to also control the inflow and outflow of funds

53
from the project. Financial manager is also expected to put in place financial controls
measures that will neutralize all investment risks and guarantee higher returns. Therefore,
the last suggestion to this study is seen as an easy way to avoid taking risk. The basic
principle in finance assures us that ‘the higher the risk, the higher the returns on the
investment’. However, it must be noted that the “return” will depend on the stockholders
characteristics; such as the ability to properly estimate risks and be fully prepared to face
those risks. Therefore using corporate finance to fund project require project financial
mangers to become high risk takers with the objective to maximize the value of the
investment. The primary objective of corporate finance is the maximization of shareholder
value through the application of short-term and long-term strategies that assist in obtaining
new funds either from equity or debt sources. Secondly, corporate finance is concentrated
on the investment decisions made by a company in order to achieve the maximum
potential return among a set of new ventures and projects. A well-structured capital
budgeting strategy will successfully allocate the company’s funds and resources and will
gradually grow the wealth of the shareholders through time [217].
According to Gyanendra K. S. (2017) corporate finance is the area of finance that
deals with the sources of funding and the capital of corporations and the actions that
managers take to increase the value of the firm to the shareholders, as well as the tools
and analysis used to allocate financial resources [218]. The above definition clearly shows
that corporate finance is the sum-total of project finance. In theory there seem to be
common views expressed by scholars on corporate finance. According to Copeland &
Weston (2013), the most important theme of corporate finance is that the objective of the
firm is to maximize the wealth of its stockholders [219]. Also, Brigham and Gapenski
(1988) in their book stated that we operate on the assumption that the management’s
primary goal is stockholder wealth maximization which translates into maximizing the
price of the common stock [220]. Additionally, Van Horne (2004) also indicated that the
objective of the firm is to maximize its value to its stockholders [221]. Further, Brealey &
Myers (1980), explain in detail by stating that success is usually judged by value;

54
shareholders are made better off by any decision which increases the value of their stake
in the firm and that the secret of success in financial management is to increase value
[222]. Above all, Gyanendra (2017) presented what this study term as the interaction of
corporate finance managers’ functions which when followed would support project
financing. This is shown as figurer D.16 in appendix D
ii.Project Finance from 1980 – 2016 Since creation, humans have endeavored to create value and improve their
surroundings through designing and execution of business projects. These developments
are consistently and exceeding becoming the breakthrough of what technically,
organizationally and financially been impossible. Modern history provides abundant
examples of most impressive landmarks of business projects such as the Burj Khalifa
skyscraper, the EURO-Tunnel, the Hong Kong-Zhuhai Bridge, the Ichthys oil field and
offshore of Australia. In 2015 alone, a total of 275 billion USD loans were invested in
PFs. Many of these projects were implemented in high-risk environments, such as the
Chad-Cameroon oil pipeline and the Petrozuata oil field in Venezuela [223]. The origins
of modern project finance can be traced date back to the middle ages when the British
Crown financed silver mines through non-recourse loans from Italian merchant banks
[224]. However, project finance started gaining roots and became a common wide-spread
practice until the early twentieth century oil field exploration in the United States. The
spread of project finance is believed is the result of the global financial crisis in 2008
[225]. However, with the exception of the project bonds mar ket, project finance lending
has proven remarkably resilient to financial market turmoil. By 2013 project finance loans
recovered from 249.3 billion USD in 2009, to a pre-crisis level of 415 billion USD
(Müllner J., (2017).
According to S&P Global Market Intelligence report on project finance default and
recovery study from 1980-2014, the annual default rate increased from 0.9% in 2013 to
1.3% in 2014. However, after ten (10) years of project finance origination, marginal
default rates become more consistent with investment grade. On the other hand project

55
finance loan recovery rates average 77% with a median of 92%. While restructuring
represents the most used strategy and resulted in the strongest recovery rate outcome of
all loan remediation strategies, averaging 91% [226].
There are quite a number of consequences relating to the financing of business-
projects in developing economies ranging from technical, managerial, financial, economic
and political risks. One key point to note in project finance is that there is the need to
clearly separate each project being financed into a financially and organizationally
independent project to allow researchers to observe managerial strategies and their
outcomes more clearly, and without the empirical distortions emanating from multiple
investments within a corporate balance sheet [227, 228]. It is believed that from 1980 to
2014, over 7000 projects originated globally out of which 80% of projects were believed
to have originated on or before 2009. In 2014 alone, there were over 300 new projects
reported representing a 31% increase over past years (Arnold S. G et al, 2016). Table E.6
and table E.7 in appendix E represents Cohort Age by Region (years) and the Cohort Age
by industry (years). The table 2.3 shows that African and Middle East combined
represented only 8.3% of projects origination from 1980 to 2014. This revelation is no
satisfying because the two continents are dominated developing economies which require
more project finance.
Also, one interesting revelation is that 38% of global project finance went into the
power industry, while 28.9% went into infrastructure. However, these are projects that
required highly and specialized skilled labor force which most developing economies are
known to lack. This means that developed economies that have abundance of such skills
are always at advantage. This trend reveals what this study term as “project sponsors
dominion”, where sponsors are seeking to invest in sectors that they are assured of having
full control and influence. As a result developing economies efforts of creating jobs
through business projects implementation continue to yield not positive impact. Figure
D.17a and figure D.17b represents regional and industry cohort projects originated
56
globally from 1980 to 2014 and the project finance distributions by regions as shown in
appendix D.
A careful study into project finance from 2015 showed that the Global Project Finance
recorded a total ofUS$230.9 billion going into 765 deals in 2016. This represents a
decrease of 16.8% from. The Power sector saw the most growth in market share with 9.5%
increase, representing 48% of the global market and generated US$110.9 billion in
proceeds from 471 transactions. Additionally, the fourth quarter was the most active
period, reporting 30.3% of the annual volume at US$16.9 billion. However, the largest
deal in the year was the US$2.8 billion Cheneire Energy deal. Additionally, a total of
US$123.3 billion from 387deals went into EMEA project for the full year 2016,
representing an increase of 12.7%. Also, the power sector recorded a 6.5% upward trend
in 2015, with 222 deals valuing US$47 billion. Becoming the fourth largest deal globally
is the Borealis Swedish Electricity transaction deal [229]. This study observed as
unfortunate once again that developing economies which lack most developmental project
in areas of infrastructure, energy and the like was underrepresented in terms of the largest
projects financed globally in year 2016.
Although there was a 12.7% increase in Europe, the Middle East, and Africa (EMEA)
in project finance but this is not encouraging because EMEA is much dominated by
developing economies. What this study believed what constituted to this trend is the high
risks associated with financing business projects in developing economies. Figure D.18 in
appendix D represents the regional project finance breakdown from January to December
2016. From figure, the power sector attracted the largest funding; representing 48% of
the total global project finance. This revelation is raises the following questions from this
study: What is the rational for investing nearly half of the global project finance in one
sector? Has all investors lost interest to invest in other sectors and are now competing for
majority ownership in power sector? Finance strategy of spreading risks through
investment in multiple portfolio been ignored by experts? What would happen to future
global projects finance, should the power sector fail? And finally, does the estimation of

57
the risks of financing power business projects entail a holistic scientific approach? This
study provides scientific base answers to these questions. Table E.8 in appendix E
illustrates top project finance deals signed in 2016. The first concern of this study is that
majority of the funded project were implement in the developed world leaving most
developing economies in their struggles to raise funding for their projects. Secondly, all
the huge project finance deals signed favored the power sector. Once again this trend
raises the following questions: Can a nation attain the desire state of development by
investing nearly half of its resources in the power sector? What lessons can nations which
do not have power resources learn from this trend of global investment? The proceeds
from investments in various sectors from 2015 to 2016 are represented in table E.9 in
appendix E. Table E.9 shows that 2016 year recorded 16.8% decline compare to 2015
proceeds, re US$46,545 million in value. Sadly, proceeds for project finance in Sub-
Saharan African which includes project finance proceeds from Ghana recorded a huge
downward trend of 48.3%. This is a worrying situation as most of these countries;
especially Ghana has huge project finance needs. However, table E.10 and table E.11 in
appendix E reveal the top five project finance deals that were signed in 2016 by EMEA
and the corresponding proceeds by sector.
The up and down trend in global project finance can be attributed to the key pressures
on projects finance which is a typical issues relating to sponsors’ expertise, currency
unavailability or shortage, local currency convertibility issues, regulatory complexities
and the environmental and social issues in a given sector [230]. These observations
constitute risks of financing business projects which must be estimated properly to
guarantee higher return on investments. Also, figure D.19 in appendix D illustrates a bar
graph of EMEA top five deals in 2016. From the bar graph there was an increase in project
finance in all the five sectors which dominate EMEA project finance. Even though
proceeds from Ghana project finance for the periods 2015-2016 according to table E.13
in appendix E saw an upward trend, the impact of those projects on fighting youth
58
unemployment was not much felt since those projects required specialized skills that most
Ghanaian youth do not have.
iii. Project Finance from 2016 – 2017 Global project finance registered a 19.4% decline from the first quarter of 2016, to
total US$43.3 billion from 162 deals in first quarter of 2017. The Power sector accounted
for 63.4% of market activity, with US$27.5 billion in proceeds from 123 transactions.
EMEA Project Finance totaled US$17.0 billion from 60 deals for the first quarter of 2017,
down 45.9% year-on-year. The Power sector saw a 23.4% downturn from the same period
in 2016, with 43 deals at US$8.5 billion. Asia Pacific and Japan Project Finance in the
first quarter of 2017 totaled US$15.9 billion from 62 issues, increased 55.9% compared
to the same period last year. The US$3.4 billion facility for Indonesian PT Bhumi Jati
Power was the biggest deal globally [231]. One may wonder where such huge financing
could come from. However, private companies could play a major role in investing in the
sector. Such companies in most cases offer long-term financing solutions for developing
countries with flexible structuring. Figure D.20 in appendix D illustrates project finance
breakdown by region for the first quarter of 2017. The graph shows that EMEA tops the
most project financed region in 2015 and 2016.
However, this trend appears to change in 2017 with Asia-pacific and Japan regions
equalizing. Also, global project finance saw a totaled of US$112.6 billion from 332 deals
in the first half of 2017, showing a 11.5% decline compared to same period last year. It is
the lowest first half volumes since 2013. Asia Pacific and Japan is the only region that
showed growth, recording the highest half year volume since 2012. Also, the EMEA
Project Finance totaled US$43.6 billion from 135 deals for the first half of 2017, shows a
45% decline for the year. For the first time he Power sector showed a 21.2% downturn
compared to 2016, with 88 deals at US$18.9 billion. Comparatively, the decline in the
half of 2017 saw a 7.9% an increase in project finance compare to the first quarter of the
same year [232]. The figure D.21 in appendix D represents project finance breakdown for
the first half of 2017. Further, available data indicates that global project finance loans

59
reached US$157.3 billion from 528 deals in the first nine months of 2017, representing a
2.9% decrease from the same period last year. Once again, the Power sector saw an
increase of 8.8% compared to 2016. The data also shows that the power sector was the
main driver of market activity, with US$85.3 billion from 360 deals, with the US$1.6
billion loan of TPF II being the largest loan completed in the third quarter globally.
Unfortunately, EMEA Project Finance loans totaled US$61.5 billion from 209 deals
in the first nine months of 2017, representing a 42.1% decrease compared to 2016. On the
other hand the Power sector recorded a 32.2% decrease in activity from the same period
in 2016, with 130 deals at US$25.8 billion [333]. The figure D.22 in appendix D shows
the breakdown of project finance by region for the first nine months of 2017. The above
information clearly shows that the only major project finance recorded in African recently
was undertaken in Mozambique. The project amounted to amounted to $4879.5 million
US dollars. Clearly, this study wonder the kind of impact such huge project finance could
have on the fight against youth unemployment in Mozambique. Typical oil and gas project
involves the usage and application of complex and complicated equipment that require
highly skilled personnel that most developing economies do not have. The position of
this study on the said project has been affirmed in the project company’s own press
release. According to Eni 2017 the project construction was led by the Floating Liquefied
Natural Gas (FLNG) unit, a symbol of engineering expertise, with a capacity of around
3.4 MTPA (million tons per year) and it is believe to be the first FLNG in Africa and only
the third globally [234]. This feature of the project alone tells you that not up to 10%
Mozambicans will form part of the project team. Once again, the root of this can be link
to ‘competency’ which is one of the indicators used in this study to measure business
project financing risks. The table E.14 in appendix E illustrates top global project finance
deals signed in 2017. Also, table E.15 illustrates the proceeds from project arrangers in
2017 as shown in appendix E.
The above information on global project finance reveals a worrying situation which
calls of the development of an effective way to estimate the risks of financing projects

60
especially in developing economies. In a situation in which more than half of global
project finance goes into one particular sector is seen as an act of ‘increasing business
project financing risks’ since diversification is one major tool for reducing investment
risks. It is worth noting that spreading your money across a range of investments is one of
the best ways to reduce risk and protect against sudden falls in any particular market,
sector, or individual investment. With a diversified portfolio of investments, returns from
better performing investments can help offset those that under perform. Although,
diversification alone does not ensure you will make a profit, nor protect you fully against
losses in a declining market. But it can reduce the risk of experiencing a serious loss of
wealth as the result of being over-committed to a single investment [235].Also, the level
of risk associated with a particular investment or asset class typically correlates with the
level of return the investment might achieve. The rationale behind this relationship is that
investors willing to take on risky investments and potentially lose money should be
rewarded for their risk. Further, if investor a particular investor puts all of the money to
invest into a promising young company, it could make a great deal of money if the
company succeed or could lose everything if the company fails to get off the ground. By
contrast, if investor another investor puts money into a diversified venture, it may not
make a fortune, but also far less likely to end up losing everything. In the context of
investing, reward is the possibility of higher returns [236]. This study wonders if higher
risks always yield higher returns. This is why there is the need to effectively estimate the
risks of financing every singly business project, which is why this study is being
conducted. Table E.16 illustrates EMEAs project finance proceeds for 2017 as shown in
appendix E. The table unfortunately shows that project finance proceeds suffered a
downward growth in all the developing economies with the exception Nigeria. Strangely
Ghana was not represented in the 2017 project finance proceeds recorded as at the time of
this study. The absence of Ghana in the table E.16 in appendix E tells the challenges
surrounding project financing in the Ghanaian economy.

61
The JP Labuschagne (2017) report makes us understand that the government is the
largest owner of most business projects. That is, governments own between 57% and 90%
of tracked projects per region, showing the importance of their role in promoting SMEs
Business project financing. Unfortunately, it is believed that nine out of 10 global
megaprojects (projects with a value of at least US$1bn) are either over budget or over
time, while overruns are not limited to those projects most of which are located in African.
However, this study believes that with proper estimation of the risk of financing such
projects the above challenges would be overcome. Globally, over 900 project finance
deals reached financial close in the year ending 2015. However, Africa saw a total of 31
transactions worth about US$7.5 billion in 2015. A large portion of these were in the
renewable and power sectors. Available data shows that the infrastructure spend in Sub-
Saharan Africa could reach US$180 billion per year by 2025, with a focus on transport
and power, and private sector financing will be vital for achieving growth. However, the
region continues to face challenges in the areas of project bankability, access to and
availability of funds, political instability and a regulatory framework that remains under
development [237]. If the infrastructure spending alone on Sub-Saharan Africa could
reach US$180 by 2025 as projected, then there is the need for the development of effective
model that would help to estimate the risk of financing such project in developing
economies. Administration and finance structures to be put in place to administer those
projects. Also, Project finance adds layers of complexity to a transaction relative to
balance sheet financing. This complexity often requires significant coordination of parties.
This coordination can often cause delays. The upfront investment in both time and
resources for a project finance transaction tend to be higher [238].
iv. Project Finance Background and Characteristics Project financing can be traced way back to at least 1299 A.D [239]. A considerable
cost associated with the project is the cost of capital or the costs of obtaining the financial
resources to implement the project, this therefore calls for an effective model to help
estimate the risk in funding such capital and financial resources. There is no singular

62
definition of project finance [240]. However, this does not prevent this study from settling
on some of the definitions that have been accepted by scholars. Project finance is a means
of financing a company created for the specific purpose of owning, constructing and
operating a project with limited or no recourse to that company’s shareholders, in a way
that enables financing from multiple sources of capital, or multiple investors, against
repayment from the company’s future cash flows. Similarly, project finance is also known
as limited or non-recourse financing. (Mohamed Badissy, 2013). Also, Gatti (2008)
defined project finance as the structured financing of a specific economic unit that the
sponsors create by means of share capital, and for which the financier considers cash flows
as the source of loan reimbursement, whereas project assets only represent collateral.
Further, Nevitt and Fabozzi, 2001) define project finance as the process of financing a
particular economic unit in which a lender is satisfied to look initially to the cash flows
and earnings of that economic unit as the source of funds from which a loan will be repaid
and to the assets of the economic unit as collateral for the loan [241]. Additionally, Larry
W., (1980), World Bank (1994) and David G. and James W., (2014) have all provided
some definition on project finance [242,243, 244].
a) Characteristics of Business-Project Financing The Features of project finance are important to understanding project financing
because there is no consensus definition of project finance, even among the most
successful project finance providers in the world. Thus it is the features of project
finance and characteristics of project finance that define the industry or, at the very least
provide a framework. However, the characteristics of project finance are mainly in most
definitions provided by scholars. However, Gordon M. B., and Bruce C., (1998) believe
most projects share the following characteristics: Independent entity with a finite life,
Capital-intensive, Non-recourse or limited recourse financing, Highly leveraged with debt
accounting for usually 65% to 80% of capital in relatively normal cases, tends to be Long
term, Controlled dividend policy, has many participants and tends to be characterized with
the allocated risk, and costly. Also because many risks are present in such project
63
financing, often the crucial element required to make the project go forward is the proper
allocation of risk. However, it will be completely impossible to achieve success allocation
of risks if those risks are not properly estimated.
On the other hand João M. P. (2017) believes project financing characteristics falls
into five distinctive features. That is: 1. The debtor is a project company (special purpose
vehicle – SPV). 2. Financiers have only limited or no recourse to the sponsors. 3. Project
risks are allocated to those parties that are best able to manage them. 4. Cash flow
generated by the project must be sufficient to cover operating cash flows and service the
debt in terms of interest and debt repayment, and lastly, 5. Collateral is given by sponsors
to financiers as security for cash inflows and assets tied up in managing the project. What
distinguish Joao’s view from Gordon and Bruce is that while the later is looking at the
general features of project finance, the former is much concern about the financial actors
and activities that goes into project finance. However, Corielli et al. (2010) maintain that
the primary characteristics of project finance is the existence of a network of nonfinancial
contracts organized by the Special Purpose Vehicle with third parties, often involving the
sponsoring firms as well [245]. The figure D.23 in appendix D illustrates the principal
characteristics of project financing identified by this study. The figure shows the
following as the characteristics: Stakeholders, financial resources, nonfinancial resources,
and value creation. Authors such as Caselli S., and Gatti S. (2005) [246], Marco S., (2004)
[247] Argenti, P., (1998) [248], Phillips (2003) [249], Jensen, M., (2002) [250], Ulas
Akkucuk U. (2015) [251] and the EconomicPoint [252] provides extensive studies on
these characteristics. Also, Gilbert E., (2005) [253], Dey (2004) [254], Chen S. (1995)
[255], Moutinho and Lopes (2010) [256], the National Australia Bank Limited et al. [257],
Miceli T. J., (1997) [258], Kiyoshi K., Toshihiko O., and Masamitsu O., (2006) [259],
Posner R. and Rosenfield A. (1977) [260] and Lepak D.P. et al [261] and in their studies
have also talked much about these characteristics.
However, Haddadia A., et al (2015) and (2016) [262, 263] believe that value creation
in projects such as construction depends on three main roles that should be assessed. The
64
figure D.24 in appendix D illustrates the role of the key stakeholders in project value
creation. On the other hand, Womack and Jones (1996) believe that value can only be
defined by the ultimate customer. And it is only meaningful when expressed in terms of a
specific product (a good or a service, and often both at once) which meets the customer’s
need at a specific price at a specific time [264]. Also, Sánchez and Iniesta (2007) [265],
Holbrook (1999) [266], Sødal et al. (2014) [267] have contributed various knowledge on
value creation to customers and investors. All the studies when analyze critically proves
that “value creation starts at project designing / developing state. Therefore, any failure at
this stage would me a failure to properly estimate the idea risk. Available researches have
shown that value Maximization is one of the core objectives of all projects. Where value
management in project portfolios has centered on the maximization of commercial value
and identification of future business prospects [268]. Rappaport (1985) also stated that
creating shareholder value is seen as the centre of all strategic actions [269]. However,
since most projects are expected to generate enough cash flow to be able to pay back all
investments and interests; the concept of value maximization has been focusing on the net
present value of the project. This concept has resulted in a lot of scholars such as Baroum
et al. (1999), Yang et al. (1992), Padman and Smith-Daniels (1993), Icmeli and Erengüç
(1996), and Özdamar et al. (1994) have all devoted time to throw more light on value
maximization in terms of net present value and cash flow [270, 271, 272, 273, 274].
However, Jeff B. (2007) questions what good is a project that is on time, on budget
and ends up providing your organization with no bottom-line results whatsoever? Jeff
further stated that beyond the project meeting time and budget, creating value also play a
crucial role in ensuring a project success. A project that does not truly deliver value is
worthless at best [275]. This study is of the view that value maximization follow through
from start to the end of the project value creation process in project life cycle as stated by
Max W. R., (2009) in the model developed the Business Case Life Cycle – Need for a
Project model. The figure D.25 in appendix D presents the business case life cycle – need
for a project to show how the value creation process leads to value maximization [276].

65
Also, it must be noted that this model is has a direct link with return on investment risk
indicator identified by this study. This study is convinced that the estimating the risk of
financing SMEs business projects in developing economies poses a great challenge to
current and potential investors. As a result, this study looks critically at the project
feasibility and risk analysis using the Net Present Value (NPV), Cash Flow analysis, and
Internal Rate of Return (IRR) management theory to prove the need to assure investors of
effectively estimating the risks on investments returns [277, 278].
Also, understanding the structure of typical project finance would assist in the
effective estimation of project financing risks. Project finance is characterized by several
long-term contracts which include supply, construction, concession agreement, and also a
range of partnership structures that are applied to align incentives and prevent any
opportunistic actions by any party involved in the project. This study has now established
that the motive of project financing is to spread risk among several investors. However,
this study believe that with proper risk estimations analysis through the application of
finance tools most project finance risks can be avoided completely or reduce to reasonable
level. This study also holds the notion that effective monitoring of managerial actions and
ensuring a coordinated effort by all project-related parties can only be achieve through
proper management. The figure D.26 in appendix D presents project finance structure.
The fact is that in project financing, large-scale projects might be too big for any single
company to finance on its own. Therefore, widely fragmented equity or debt financing in
the capital markets would help to diversify risks among a larger investors base. However,
this might make it difficult to control managerial discretion in the allocation of free cash
flows and avoiding wasteful expenditures. Unfortunately, analysis of 2015 – 2017 global
project finance report showed otherwise. There were several instances where major
national projects with high risks are being financed by one major investor. Also, the use
of non-recourse debt in project finance further contributes to limiting managerial
discretion by tying project revenues to large debt repayments, which reduces the amount
of free cash flows. Moreover, non-recourse debt and separate incorporation of the project

66
company make it possible to achieve much higher leverage ratios than sponsors could
otherwise sustain on their own balance sheets [279].
2.5 Business Projects Financing Risks The core of project finance is the analysis of project risks, namely: Construction risk,
Operating risk, Market risk, Regulatory risk, Insurance risk and Currency. Most
importantly, project financing also focuses on striking a balance between the need for
sharing the risk of sizeable investments among multiple investors and, at the same time,
the importance of effectively monitoring managerial actions and ensuring a coordinated
effort by all project-related parties [280]. This is an indication that what all investors seek
to do through project finance is to spread the risks associated with investments. The above
stated risks when analyze carefully can be grouped into: 1. Idea Risks (IR) – where the
risk estimation forms part of the idea to invest in a particular sector. 2. Competency Risks
(CR) – here we are talking about the ability to properly estimate, allocate and manage all
identified risks. According to Gatti (2008) project finance is characterized by the
following risks: activity planning risk, technological risk and construction risk or
completion risks. Also, supply risk, operating risk, and demand risk and interest rate risk,
exchange risk, inflation risk, environmental risk, regulatory risk, political risk, country
risk, legal risk as well as credit risk or counterparty risk. And all these risks are allocated
contractually to the parties who are believed to be in position to best manage them. When
analyzed carefully the above project risks are also closely linked to Return on Investment
Risks (RIS).
Project finance is a relatively new financial discipline that has developed rapidly over
the last 20 years. However, each year billions of dollars of investments are made in
projects around the world using project finance techniques. It must be noted that project
finance is not the same thing as financing projects, because projects may be financed in
many different ways. Traditionally, large scale public sector projects in developed
countries were financed by public-sector debt, while private sector projects were financed

67
by large companies raising corporate loans. In developing countries, projects were
financed by the government borrowing from the international banking market, multilateral
institutions such as the World Bank, or through export credits (Yescombe E. R. (2002).
The National Australia Bank Limited et al. stated that the meaning of risk can vary. For
some it may mean the possibility of losing a portion of their investment due to market
movements or a poor decision. For others it may mean not enough income is produced
from the investment. Another measure of risk is the variability of returns over time known
as volatility. Generally, risk can be viewed as the chance of failure in achieving objectives
or goals. Risk is part of investing but it can be measured and managed within an
investment portfolio. Taking on some risk is necessary for higher returns. Also, taking on
greater short-term risks may be necessary to receive the long-term returns needed to
achieve a lifestyle goals and objectives. However, taking on too much may prove to be a
mistake. Taking on too little may cause regret and failure to achieve the returns needed to
meet a lifestyle goal [281]. This attitude of risk is what makes very complex to estimate
and manage. However, this study combined both practical and theoretical techniques to
provide an effective way to estimate SMEs business project financing risks.
According to Miceli, T.J. (1997) the problem of risk sharing is recognized as that who
should bear a loss when a risk occurs [282]. Also, Posner et al. proposed that one of the
major problems that arise in risk sharing in the contract law is that which party would bear
a loss if they could have foreseen that contingency [283]. In other words, the problems in
project finance contract are: Which party can thwart or have power over the foreseen risk
more efficiently? And if the risk cannot be prevented or controlled, which party is in a
better position to protect themselves against the loss? These questions prove the
knowledge gaps that exist in project financing which this study sought to fulfill. However,
Kiyoshi K. et al. (2006) stated the following as risk sharing principles: The party who can
assess and control the risk should bear it, and calls it the first principle. If none of the
parties cannot assess or control the risk, the party who can bears it easier or procure the
insurance from market should bear it, and calls it the second principle. They further

68
indicated that in the case that the principal is a public sector, it has usually more capability
for bearing the risk and is expected to play the role as a deep pocket under the second
principle [284]. These reveal the amount of risks that are involve in financing SMEs
business project and the complexity of those risks.
2.5.1 Project Cost Estimation The ability to accurately estimate the cost of a particular project plays a crucial role in
estimating the risk of financing such projects. According to Project InterLinc (2004) the
reliability of project cost estimates at every stage in the project development process is
necessary for responsible fiscal management. Also, unreliable cost estimates result in
severe problems in programming, budgeting, and planning and ultimately results in loss
of credibility. Project cost estimation is not an exact science; however, estimators are
expected to prepare reasonable project cost estimates that represent the cost to complete
the project. Therefore, project alternatives and their associated cost estimates must be
thoroughly compiled by diligently using all of the available data, modifying that data with
good judgment and using past cost estimating experience so that the cost estimates can be
used with confidence. It must be noted that cost estimates, in a sense, are never completed.
They are not static, but have to be reviewed continually to keep them current [285].
Also, Doit (2018) indicated that project underestimation of resources and costs are one
of the most common contributors to project failure. As such, project managers should be
knowledgeable of and consider the various industry techniques and tools in the definition
and execution of project cost estimation [286]. However, the PMBOK define project cost
estimation as the iterative process of developing an approximation of the monetary
resources needed to complete project activities. Project teams should estimate costs for
all resources that will be charged to the project the PMBOK explained further that cost
estimates are a prediction that is based on the information known at a given point in time.
And includes the identification and consideration of costing alternatives to initiate and
complete the project [287]. By far this explanation of project cost estimation point to the

69
fact of the critical role the estimations of the risk of financing business project play in
project success. Therefore, cost estimates should be reviewed and refined during the
course of the project to reflect all changes that are happening due to internal or external
environmental factors which poses high risks to the project. The accuracy of a project
estimate will increase as the project progresses through the project life cycle to ensure that
the project succeeds. The figure D.27 in appendix D illustrates cost estimates at each stage
of a project.
The estimates include Input, tools and techniques, and output: this is very subjective
depending on the context that it is being used. According to Jim P. et al. (2013) input is
the raw materials that provide a basis for security and justice programs and this can include
money, technical expertise, relationships and personnel [288]. Also, input in project
management is any particular item, product, or mechanism, that is; an internal or external
device that can be used for the purposes of triggering the progression of a particular
process [289]. The input cost estimation include the following activities: Cost
Management plan - the process of ensuring the project meets objectives in terms of
financial performance and placing responsibility on those in charge of any aspect of
project scope (managers, designers, contractors) to perform within established budgets
and take appropriate management action [290, 291]. The figure D.28 in appendix D shows
the model of project cost management. Human resource (HR) plan – the human resources
plan is a roadmap that describes how an organization will meet its current and future
human resource needs based on the strategic plans of the organization [292]. Also, Brian
J. S., et al. stated that human resource planning is the formal process of linking business
strategy with human resource practices [293]. This study believes that administration and
control play a pivotal role in project cost management through budget preparation. The
fact is that it entails the process of systematically arranging and coordinating the human
and material resources available to any organization for the main purpose of achieving
stipulated goals of that organization [294].
70
i.Tools and Technics
In project cost estimating there is the need for the applications of effective and
appropriate tools and techniques to ensure that there is no over or under cost estimating.
Therefore, an estimate as a quantitative assessment of a future endeavor likely cost or
outcome. However, Luigi B., stated that the four major types of estimation techniques
regularly used today in industry practice as expert judgment, analogy, decomposition, and
statistical (or parametric) methods. Where, Expert judgment is based on the brainstorming
of one or more experts who have experience with similar projects; a consensus mechanism
then produces the estimate. Analogy estimation is based on comparing previous, similar
activities, analyzing the most relevant project and service attributes, and trying to figure
out the new project’s effort and cost values through estimator experience. And
Decomposition is a top-down estimation technique that tries to make a granular list of
initially planned tasks [295]. On the other hand, the PMBOK (1999) mentioned the
following: Analogous estimating, Parametric modeling, Bottom-up estimating and
Computerized tools as project cost estimating tools and techniques. The figure D.29 in
appendix D presents the four major project cost estimating tools and techniques.
Output – the result of processing one or more inputs is by the application of tools or
techniques. This applies to project management processes used to manage the work of the
project. In project management the output may be in the form of a tangible component or
product, a document, or an intangible service or result. Therefore: Outputs are created by
a process. It is worth noting that most outputs are inputs to successor processes. However,
most project management outputs are used within the project to manage the work [296].
In other words the output of a project should create value for both the investor and other
stakeholders. Output also forms part of the sequence of events to bring about benefits or
change over time in a project However, this can only be achieved if all risks are properly
estimated and controlled. It should be noted that in project cost estimating there is the
need for assessment or problem analysis process, combined with a review of critical
stakeholders to help the project team or operational unit to identify the outputs and

71
outcomes that must be achieved in order to reach the project ultimate strategic objective.
Typically, a project team can identify a large number of relevant outputs and outcomes.
However an important task in developing an expected output is to reach a consensus on a
small core set of critical outcomes. Outputs and outcomes represent those causal links in
the results chain that bridge the gap between the current status and the desired high-level
results. Starting with the end strategic objective(s), practitioners can backtrack to outline
project logic with immediate and intermediate outcomes [297, 298]. The figure D.30 in
appendix D illustrates the results of an output.
ii. Project management The term project management is very essential in project feasibility analysis.
Historically, the word “project” was first used in or around the sixteenth century and it’s
derived from the Latin projicere (= throw forward). The Latin root thus suggests
movement, a trajectory, a certain relationship with space and time. The implied process
involves: a point of departure used as a base, from which one throws oneself forward
towards a goal. It is believed that the word and concept were first used by architects. In
the fifteenth century, Filippo Brunelleschi made two innovations in the architectural
practice of his time [299]. The Oxford English Dictionary defines “project” as “An
individual or collaborative enterprise that is carefully planned and designed to achieve a
particular aim, (Exp. A youth employability project). However, the Project Management
Institute define project as being temporary in that it has a defined beginning and end in
time, and therefore defined scope and resources. Also, a project is unique in that it is not
a routine operation, but a specific set of operations designed to accomplish a singular goal.
So a project team often includes people who don’t usually work together sometimes from
different organizations and across multiple geographies (PMBOK).
On the other hand, the Chartered Body for the Project Professionals also stated that a
project is a unique, transient endeavor, undertaken to achieve planned objectives, which
could be defined in terms of outputs, outcomes or benefits. A project is usually deemed to
be a success if it achieves the objectives according to their acceptance criteria, within an

72
agreed timescale and budget [300]. Also, other scholars as Avraham S. et al. (2005) and
Duncan W.R., (1996) have all provided various definitions to the term ‘project’ and its
life cycle [301, 302]. The figure D.32 in appendix D also illustrates typical project life
cycle. As typical of all human undertaking, projects are performed and delivered under
certain environmental settings which exert some forms of constraints and risks.
Conventionally, these constraints according to the PMI are scope, time, cost and quality.
Typically, projects are time bound. In most cases certain outputs and value are expected
to be delivered at a given time. Also, the scope of work to be done is always clearly define.
Further, cost constitutes a greater part of every project implementation. Lastly, all project
stakeholders want value maximization; therefore, quality in project is very crucial to all
stakeholders.
Time in project is very crucial and can be categorized as Elapsed and lead time. Project
Elapsed Time is the total number of calendar days (excluding holidays and other non-
working days) that have been consumed for performing the project or its certain part
(phase, task, activity and job. It is calculated by the following formula [303]:
Total Effort x Number of Working Days / Number of Hours Worked Per Day x Number of People
Where:
Total Effort refers to the amount of work that human resources can produce
in one workday.
Number of Working Day is usually 5 (from Monday through Friday).
Number of Hours Worker per Day shows how many hours an employee has
consumed to make effort in one workday.
Number of People means the total number of workers involved in the project.
Also, in project management lead time is the time it takes to complete a task or a set
of interdependent tasks. The lead of the entire project mostly is the overall duration of
the critical path for the project. Lead time is also the saved time by starting an activity
before its predecessor is completed. Per the Project Management Institute’s definition
73
PMI (2008), lead is a dependency between two activities. However, Avraham S. et al.,
(2005) in their studies believed that despite each project having a unique set of goals, there
is enough commonality at a generic level to permit the development of a unified
framework for planning and control. On the other hand, Kolltveit B. J., et al. (2004)
believe the two key factors are of importance and can have the greatest impact on project
early phase, they are; uncertainty and the influence of project stakeholders. [304].
iii.Project management core components The Association for Project Management (APM, 2018) identifies the following as
project management core components: defining the reason why a project is necessary;
capturing project requirements, specifying quality of the deliverables, estimating
resources and timescales; preparing a business case to justify the investment; securing
corporate agreement and funding; developing and implementing a management plan for
the project; leading and motivating the project delivery team; managing the risks, issues
and changes on the project; monitoring progress against plan; managing the project
budget; maintaining communications with stakeholders and the project 73tilization73;
provider management; and closing the project in a controlled fashion when appropriate.
Also, Till J. et al. (2009) stated the following as the characteristics of a project: consists
of temporary activities that have predetermined start and end dates; uses restricted
resources; it has a single goal or a set of goals; all events are to be realized to develop a
single and new output; usually has a budget; usually a project manager is responsible for
co-coordinating all activities [305]. Therefore, project managers must convince
themselves of having adequate understanding of the above project components and
characteristics to guarantee effective feasibility study.

74
2.5.2 Project Finance Feasibility Financing of projects may take the form of either corporate project finance structures
where lenders derive security for repayment. Mostly, project financing will involve a
Special Purpose Vehicle (SPV), an independent legal entity established for the purpose of
undertaking the project into which lenders and project sponsors contribute debt and equity
to fund project costs [306]. However, financing high-profile infrastructure projects not
only requires lenders to commit for long maturities, but also makes them particularly
exposed to the risk of political interference by host governments. Therefore, project
lenders are making increasing use of political risk guarantees, especially in emerging
economies. The understanding of the term feasibility would help to appreciate its
importance in project financing. Feasibility is the process of investigating a need, problem,
and solutions in sufficient detail to determine if a solution is economically viable and
worth developing. The feasibility process includes consideration of alternative solutions
and the benefits and economic viability of each [307]. However, feasibility study defines
the problem, possibilities of its solution, and at the same time evaluates if these solutions
are feasible from technical, economic, social and political point of view [308]. Also, Tan
A.A.L., (2000) stated that feasibility study involves market research and data collection,
preliminary site investigations, checking with authority requirements, political,
environmental, economic and social (PEST) analysis, strengths, weaknesses,
opportunities and threats (SWOT) analysis, the project risks analysis and management,
return on investment, cash-flow projections, architectural and town planning schematics
sketches and preliminary engineering studies (geo- technical, infrastructures, traffic,
transportation, etc) [309].
However, Tim Bryce maintained that feasibility Study represents a definition of a
problem or opportunity to be studied, an analysis of the current mode of operation, a
definition of requirements, an evaluation of alternatives, and an agreed upon course of
action. [310]. The Figure D.31 in appendix D illustrates project feasibility analysis cycle.
A careful analysis of the activities involved in project feasibility analysis revealed that

75
they are inter-connected; in that one activity leads to the other. Also, a break in either of
the activities could render the entire process useless. These activities are: Evaluation –
examining the cost effectiveness of the approach selected. Review – examination to ensure
that all of the preceding elements are then assembled into a feasibility Study and a formal
review is conducted with all parties involved. Project Scope – use to define the business
problem and/or opportunity to be addressed. Current Analysis – require to defining and
understanding the current method of implementation, such as a system, a product, etc.
Requirements – must be defined and this depends on the object of the project’s attention.
Lastly, the Approach – represents the recommended solution or course of action to satisfy
the requirements (Tim B., 2012).
i.Project Feasibility Analysis Methods Predicting and analyzing the prospective financial performance of SMEs business
projects is done using feasibility analysis tools and or techniques. Sanghoon A. et al.
(2008) in their “General Guidelines for Preliminary Feasibility Studies” offered these as
among the reliable methods for project feasibility analysis: Economic Feasibility
Evaluation, Social Discount Rate, and Financial Feasibility.
a) Economic Feasibility Evaluation- they indicated that the economic feasibility
analysis basically depends on cost-benefit analysis. A Benefit-Cost Ratio (BCR) is first
calculated to evaluate economic feasibility. A BCR is the ratio of benefits to costs where
both benefits and costs are expressed as discounted present values. They maintained that
the costs and benefits to occur in the future are converted into present values, and the
present value of benefits is divided by that of costs. Their work revealed that a project is
generally economically feasible if the BCR is at least 1.0. This ratio could vary depending
on the country; for instance in the U.S. The special standards for public investment
analysis suggested by the U.S. Office of Management and Budget (OMB) explain that the
BCR should be at least 1.25 for a project to be economically feasible in consideration of
the excess burden resulting from tax distortion and the like. Below is the BCR formula:
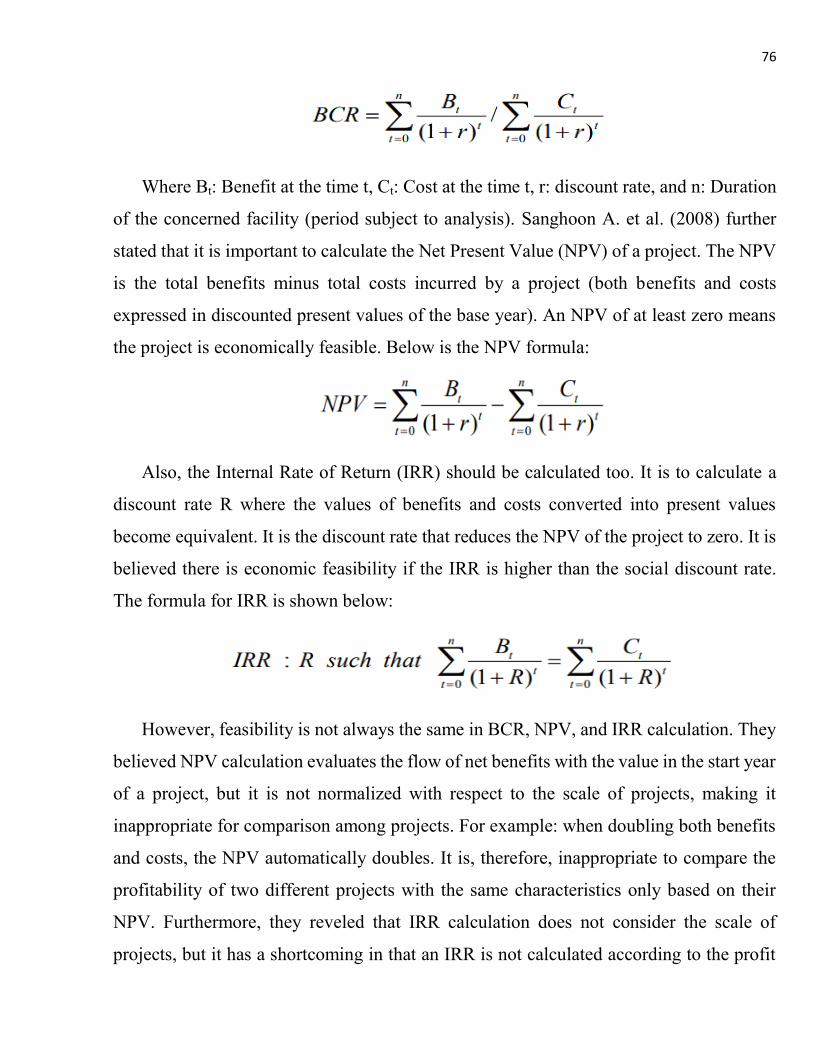
76
Where Bt: Benefit at the time t, Ct: Cost at the time t, r: discount rate, and n: Duration
of the concerned facility (period subject to analysis). Sanghoon A. et al. (2008) further
stated that it is important to calculate the Net Present Value (NPV) of a project. The NPV
is the total benefits minus total costs incurred by a project (both benefits and costs
expressed in discounted present values of the base year). An NPV of at least zero means
the project is economically feasible. Below is the NPV formula:
Also, the Internal Rate of Return (IRR) should be calculated too. It is to calculate a
discount rate R where the values of benefits and costs converted into present values
become equivalent. It is the discount rate that reduces the NPV of the project to zero. It is
believed there is economic feasibility if the IRR is higher than the social discount rate.
The formula for IRR is shown below:
However, feasibility is not always the same in BCR, NPV, and IRR calculation. They
believed NPV calculation evaluates the flow of net benefits with the value in the start year
of a project, but it is not normalized with respect to the scale of projects, making it
inappropriate for comparison among projects. For example: when doubling both benefits
and costs, the NPV automatically doubles. It is, therefore, inappropriate to compare the
profitability of two different projects with the same characteristics only based on their
NPV. Furthermore, they reveled that IRR calculation does not consider the scale of
projects, but it has a shortcoming in that an IRR is not calculated according to the profit

77
generation structure. They also seem not to trust the BCR by stating that BCR value differs
according to which items are classified as benefits or costs, but this is the one that is
generally used as an investment evaluation standard [311].
b. Social Discount Rate – according to Sanghoon A. et al. one of the most important
parameters used in the economic feasibility evaluation of government-financed projects
is the social discount rate. In this method the discounted benefit and cost values are
determined by the social discount rate, and as a result, the BCR. In their 3rd edition of the
“General Guidelines” the social discount rate based on a real rate of 7.5% was applied to
all projects except water resources projects, and a 6.0% real rate was applied to water
resources projects as they should be considered for a longer term than other projects. They
offered that to estimate an appropriate social discount rate, a basic interest rate, and social
time preference rate (STPR), financial discount rate and such were considered. Below is
the formula for the STPR:
STPR = ρ + µ.g
Where: ρ refers to a discount rate of future consumption under the assumption that
per-capita consumption does not change. G: is an annual per- capita consumption increase
rate, and µ: is the elasticity of marginal utility of consumption. In the end, µ × g is to
reflect the diminishing effect of marginal utility due to consumption change [312, 313].
c. Financial Feasibility Analysis – the financial feasibility analysis according to
Sanghoon A. et al. (2008) is conducted for projects of which feasibility in terms of law
and policy is recognized at the first-step of checklist evaluation and that can be pursued
as Build To Order (BTO) projects, or for those proposed as BTO projects in the project
plan submitted by the responsible department. The most commonly used financial analysis
tool is the discounted cash flow methods. Where the discounted cash flow methods
estimate future cash flows and calculate present values discounted by the opportunity cost
of capital (e.g. weighted average cost of capital). They also stated that the discounted cash
flow methods include the Net Present Value (NPV), Internal Rate of Return (IRR),
Profitability Index (PI) methods, and more. The NPV method is the sum of expected cash

78
flows, both incoming and outgoing, that are discounted by the weighted average cost of
capital. Below is the formula as presented:
Where: Rt: refers to the incoming cash flow of period t, and Ct:to the outgoing flow
of period t.
Also, the profitability index (PI) method which is the ratio of the net value of incoming
cash flows divided by that of outgoing cash flows (cash flows occurring from investment)
is used. They held the view that if the PI is higher than 1, the project is judged to be
financially feasible. That is while the NPV method measures the financial feasibility of
an investment proposal as an absolute amount, the PI method measures the ratio of cost
verses profit in a proposal as a relative ratio. Below is the formula as presented.
d. Financial Discount Rate Calculation- in this method the calculation of the present
value of cash flows expected from the concerned project and estimated cash flows should
be discounted by an appropriate financial discount rate. Sanghoon A. et al. (2008)
believes that the appropriate rate here is the weighted average cost of capital, which is the
capital cost of each source of financing (equity capital and debt capital) average-weighted
by its component ratio. Below is the formula:
Ro: Weighted average cost of capital
rb: Cost of debt capital (capital cost of debt)

79
rs: Cost of equity capital (capital cost of equity)
T: Corporate tax rate
L: Debt ratio (=debt/equity capital)
On the other hand, Lenka T. et al. (2004) believes that project feasibility study can be
best done through Reflection method (ReMe). They define the reflection as a careful
thought and as a sign of critical considering of all processes which make impacts on
organization’s results as well as on individual’s performance. Reflection is characterized
by learning from reflecting on past results and experiences. It is based on critical thinking
which can be define as crucial skill to manage any activity in the organization and contains
problem – solving, predicting and searching for a new opportunities. They stated the four
fundamental elements of critical thinking as: Targeted and objectives based management
approach; Decision – making based on evidence, data not on guessing; and Managing and
leading of all processes is based on logical principals. Approaches are implemented to
match and balance the problems occurred by human character. The ReMe is a general tool
to perform a quantitative and qualitative assessment and evaluation of any processes
[314].
However, the PMBOK (2013) offered these as project feasibility analysis techniques:
Desktop research – this method requires that a thorough research via Internet, specialized
publications and books be conducted to identify stakeholders and provide baseline
information for the feasibility analysis. Expert consultation – this technique advice that
technical, economic or legal advisors be consulted to offer expert advice and support to
the project. The Modeling techniques – the techniques entails What-If Scenario Analysis;
a process of evaluating scenarios in order to predict their effect, positively or negatively,
on project objectives. Mostly the outcome of the what-if scenario analysis can be used to
assess the feasibility of the project schedule under adverse conditions, and in preparing
contingency and response plans to overcome or mitigate the impact of unexpected
situations (PMBOK Guide, 2013).
80
Also, Kenneth K.H. (2005) offers another simple but effect method; Cost
Engineering for conducting project feasibility analysis. This method focuses on
ascertaining project profitability during the early phase. This method aim is to determine
whether any project or investment is financially desirable [315, 316]. Kenneth K.H
presented the four unique criteria for profitability aside what has been discus above as:
Pay-out time – the time required to recover the original investment in depreciable facilities
from profit and depreciation. Pay-out time with interest – the time required to recover the
varying investment in depreciable facilities from profit, depreciation and interest charge.
Return on original investment (ROI) – the benefit of an investment divided by the cost of
the investment and the result is interpreted as a percentage or a ratio. Where:
ROI = (benefit from investment –cost of investment) / cost of investment.
Return on average investment (RAI) – the benefit of an investment is divided by
average outstanding investment and the result is interpreted as a percentage or a ratio.
Where,
RAI = (benefit from investment – cost of investment) / Average outstanding
investment.
In all the above techniques, some common conclusions are that they are all geared
towards measuring the project profitability, economic viability, cash flow, and providing
assurances to investors and other stakeholders.
2.5.3 Project Risks Analysis One of the key demands of project financing analysis is to identify real and potential
risks that have the propensity of negatively impacting the progress and success of the
project. As João M. Pinto, (2017) put it; the core of project finance is the analysis of
project risks, namely construction risk, operating risk, market risk, regulatory risk,
insurance risk, and currency risk. It is very important to note that the meaning of risk can
vary. For some it may mean the possibility of losing a portion of their investment due to
market movements or a poor decision. For others it may mean not enough income is

81
produced from the investment. Another measure of risk is the variability of returns over
time known as volatility. However, that risk can be viewed as the chance of failure in
achieving objectives or goals. Noting that, risk is part of investing and it can be measured
and managed within an investment portfolio. Taking on some risk is necessary for higher
returns, but the challenge is how to determine the appropriate level of risk. Also, taking
on greater short-term risks may be necessary to receive the long-term returns needed to
achieve a lifestyle goals and objectives. While, taking on too much may prove to be a
mistake. And taking on too little may cause regret and failure to achieve the returns
needed to meet lifestyle goals [317].
A careful analysis of the above statement reveals the following: there is no investment
without risks, there is the need to effectively estimate the risks associated with every
investment undertaking, also, know your risk tolerance level and venture accordingly
would help to minimize the impact on risk on expected returns. In recent times, most
project managers would agree that the treatment of risk is the main element in project
finance decision making. According to Franco M. et al. (1973) the key current questions
regarding risks are: how risk should be measured, and how the required return associated
with a given risk level is determined? [318].The above questions raised by Franco M.
reveals a dissatisfaction of in Harry M. (1952) suggested simple approach for dealing with
risk [319]. Risk is a most slippery and elusive concept. It is hard for investors, let alone
economists to agree on a precise definition. Risk is the possibility of suffering harm or
loss [320]. However, Fama E. F., et al. (1972) are of the view that if risk is the chance of
loss or achieving returns less than expected, it would seem to be logical to measure risk
by the dispersion of the possible returns below the expected value. However, risk
measures based on below-the-mean variability are difficult to work with, and furthermore
are unnecessary as long as the distribution of future return is reasonably symmetric about
its expected values [325].
The Modern portfolio theory begins with the premise that all investors are risk averse.
The theory educates investors how to combine stocks in their portfolios to give them the

82
least risk possible, consistent with the return they seek. The theory believes that
diversification is a sensible strategy for individuals who like to reduce their risks and
presents three forms of risks that confronts investors as; total risk: which is the summation
of all other risks. Systematic risk: arising from the basic variability of stock prices in
general and the tendency for all stocks to go along with the general market. However,
systematic risk cannot be eliminated by diversification. And unsystematic risks: the
variability in stock prices (and, therefore, in returns from stocks) that results from factors
peculiar to an individual company. Examples: a strike, the discovery of a new product etc
[322]. The truth is that investors have to receive higher rates of return on investment
bearing greater risk. As Burton G.M., (1981) put it ‘all investors are like my wife, they are
risk-averse. But they want high returns and guaranteed outcomes’ [323]. What project
investors must take note of is the positive relationship between risk and return.
Every SMEs business project undertaken in developing economies has a substantial
degree of risk associated with it that must be properly estimated. Robert D., (2016) defines
project risk management as the process involved with identifying, analyzing, and
responding to risk. Risk is part of every project we undertake and the objective is always
that to maximize the results of positive risk whilst minimizing the impact and
consequences of negative events [324]. Also, the works of Gatti S. (2008) identifies risks
associated to projects as the pre-completion phase risks: activity planning risk,
technological risk, and construction risk. Completion risk, risks related to the post-
completion phase: supply risk, operating risk, and demand risk; and risks related to both
phases: interest rate risk, exchange risk, inflation risk, environmental risk, regulatory risk,
political risk, country risk, legal risk, and credit risk or counterparty risk [325]. These risks
are very critical since they can affect the project progress and output in diverse ways.
SMEs must know that business projects and offerings are sensitive to developments and
more complex risks have been brought about by the current knowledge economy.
However, business project setbacks can be reduced substantially by embracing the correct
risk estimations methodology as an integral part of project planning. One key fact to note

83
is that planning and controlling project risk is a vital activity that would secure high-
quality project outcomes.
Risk in project is inevitable and risk is an uncertainty that matters which can affect
project objectives negatively or positively. Pieplow B., et al. (2012) believes that
identifying, communicating, and managing project risks require a risk management
culture. However, the required attributes needed for successful project risk management
are: Risk decision‐making based on balancing project values such as cost, schedule, and
quality; stewardship; efficiency; teamwork; joint ownership of risks and responsibilities
and accountability. Also, all approaches to project risk management strive to maximize
both efficiency and effectiveness. Although the details of risk processes may differ
depending on the project, risk management has three important parts: identification,
analysis, and action [326]. Understanding project risks enables project teams to more
effectively fulfill public service expectations. Assessing project risk and uncertainty
informs decision making in project development and delivery mission. These decisions
contribute to public safety and clarify project expectations. Informed project risk
management adds value on many levels to every project delivered [327, 328].
Conclusions Financing is seen as the major challenge confronting all business projects
implemented in most developing economies; particularly in Ghana. As a result, this
chapter analyzes the existing body of literature on the risk of financing SMEs business
projects, behavioral economics, integral estimation method and fuzzy rule as the
foundation for the successful designing, implementation and completion of business
projects in developing economies. Also, this chapter does analyses on behavioral
economics theories, integral estimation method and fuzzy rule to prove its effectiveness
in estimating risks of financing SMEs business projects in developing economies. For the
purpose of this study, this study define finance as: “the administrative function of
identifying, contacting, negotiating and fulfilling terms and conditions, obtaining and

84
managing monetary resources from individuals, financial and or nonfinancial institutions
or government to fulfill the financing needs of business-projects in an organization”.
One of the most important functions of finance is ensuring the efficient 84tilization of
funds. This means that all SMEs owners must develop the ability to raise funds from multi
sources, keeping in relation the implications in particular, risk attached. However, before
developing any funding model there is the need to establish its purpose. Some funding
model purpose includes: to determine the level of unfunded liability; make informed
decisions about the allocation of resources; to have full knowledge of the risks of
underfunding or overfunding; to avoid/mitigate against controllable risk; to assist in
making decisions about appropriate reinvestment levels; and to find an level
of equilibrium for the owners. Currently, most investors and sponsors would in most case
provide funds for business project only on the guarantee that their funds would yield
profits or lead to the maximization of their investment value. Empirical studies have
shown that there are several ways to measure a firm’s profits other than just looking at
their bank account statement which, to tell the truth, do not tell much about profitability.
Most studies recommend three methods of analyzing how well a firm is doing: Margin
(or profitability) ratios; Break-even analysis (based on revenues and on units sold) and
Return on assets and on investment. This is so because businesses undertake series of
activities which are either in a form of short term of long term business projects. It must
be noted that the core of project finance is the analysis of project risks, namely:
Construction risk, Operating risk, Market risk, Regulatory risk, Insurance risk and
Currency. Most importantly, project financing focuses on striking a balance between the
need for sharing the risk of sizeable investments among multiple investors at the same
time. However, the reliability of project cost estimates at every stage in the project
development process is necessary for responsible fiscal management. Also, unreliable cost
estimates result in severe problems in programming, budgeting, and planning and
ultimately results in loss of credibility.

85
Further, financing of business projects may take the form of either corporate project
finance structures where lenders derive security for repayment. But one the key demands
of project financing analysis is to identify real and potential risks that have the propensity
of negatively impacting the progress and success of the project. It is very important to
note that the meaning of risk can vary. However, the relevance of estimation of the risk of
financing business project cannot be over emphasized, as it contribute to the effectiveness
of the entire project team in fulfill the project goals and all stakeholders expectations. In
light of these the next chapter of this research would focus on settling on the most effective
research methods that would enable this study to achieve its goals and objectives.
86
CHAPTER THREE
RESEARCH METHODOLOGY FOR INVESTIGATING THE RISK OF
FINANCING SMES BUSINESS-PROJECTS
3.1 Introduction
This chapter discusses the research methodology used to investigate how the risk of
financing SMEs business projects impacts the return on investments in SMEs business
projects implemented in developing economies; focusing on Ghana government’s youth
entrepreneurial and employability program as its setting. According to Hussey et al.
(1997) an effective research methodology should addresses the following elements in a
research study [329]: i. The rationale behind a research initiative for collecting certain
information? Ii. How the information will be collected? Iii. What information will be
collected? Iv. Where the information will be collected? V. How the information will be
analyzed? It is important to state that a research is all about addressing an issue or asking
and answering a question or solving a problem. Therefore, every research starts with
identifying an issue, question, or problem; talking with people who want or need the study;
find out what’s already known about it; talking with experts and/or reading their reviews
and the original research on the topic; planning and costing the study accordingly, and
finally writing it up and submitting it for assessment [330]. However, no researcher will
carry out all these activities involved in research without an ‘aim’ to achieve. In line with
this, the aim of this study is to: Establish the relationship between the risk of financing
SMEs business projects and the return on investment in those projects in developing
economies; Identify the main the three main SMEs business projects financing risk factors
that cause business projects success and or failures in developing economies, and Come
up with conceptual model that will guarantee higher return on investment in SMEs
business projects in developing economies and Ghana in particular.

87
3.2 Methodology According to Saunders et al. (2009) research methodology involves the theoretical
frameworks and learning of the various techniques that can be used in the conduct of
research and the conduct of tests, experiments, surveys and critical studies. Saunders et
al. further stated that both qualitative and quantitative methods may be used appropriately
with any research paradigm. However, Guba and Lincoln (1994) indicated that questions
of method are secondary to questions of paradigm which Saunders et al. define as the
basic belief system or world view that guides the investigation, not only in choices of
method but in ontologically and epistemologically fundamental way [331, 332]. The
methodology of this research is based on the research onion model (Saunders et al., 2009).
This model usefulness lies in its adaptability for almost any type of research methodology
and can be used in a variety of contexts [333].
3.2.1 Research Philosophy Understanding the term philosophy is very crucial in this study since it will help to
explore new range of possibilities in this research. According to Russ P.W. (2015)
philosophy is all of rational inquiry except for science. A better understanding of
philosophy can be found by considering what sorts of things other than scientific issues
humans might inquire into [334]. However, Marilyn M.A., (1988) believes that
Philosophy is thinking really hard about the most important questions and trying to bring
analytic clarity both to the questions and the answers [335]. But according to Adamson P.
(2016) philosophy is the study of the costs and benefits that accrue when you take up a
certain position [336]. One would have taught Adamson’s definition could end the
knowledge gap in defining the term ‘philosophy’ but here is what Buchanan A. (2014)
also said in defining philosophy: ‘I don’t think it is any one thing, but I think generally it
involves being critical and reflective about things that most people take for granted”
[337]. This study believes that most researchers have taken for granted the crucial need
develop a conceptual model to effectively estimate the risks of financing SMEs business

88
projects, hence, the need to conduct this study. Most importantly, the primary value of
philosophy is that it loosens the grip of uncritically held opinion and opens the mind to a
liberating range of new possibilities to explore [338]. Therefore, this study would open
the mind of other researchers and also liberate a range of new possibilities to explore in
financing of SMEs business projects in developing economies.
According to May T., (2011) stated that the choice of research philosophy is defined
by the type of knowledge being investigated in the research project [339]. However,
Goddard & Melville, (2004) believes that research philosophies can differ on the goals of
research and on the best way that might be used to achieve these goals [340]. On the other
hand Bryman, (2012) is of the view that the set of beliefs concerning the nature of the
reality being investigated defines a research philosophy. Above all, Saunders et al., (2009)
provided the three major ways of thinking about research philosophy as: ontology,
epistemology and axiology. This research holds the philosophical beliefs that: 1. There is
high correlation between the risk of financing SMEs business project and the return on
investment in SMEs business projects. 2. Accurate estimation of the risks of financing
SMEs business projects will guarantee the expected returns on investments in SMEs
business projects. 3. A conceptual model would effectively help to identify and control
the risk of financing SMEs business projects and guarantee expected returns on
investments.
3.2.1.1 The Research Ontology
According to Uschold and King (1995) ontology is a set of terms and their associated
definition, intended to describe the world in question [341]. Also, Zajicek (2005) stated
that ontology is concerned with what our surroundings (nature) actually are [342].
However, Tsoukas and Chia (2002) distinguishes two distinct ontologies. That is, “being”
which locates reality in substances, things and events; and “becoming” which approaches
reality through flux, flow and continuity [343]. Making it clear, Elkjaer and Simpson
(2011) are of the view that each research study has its own ontology. That is Ontology

89
says something specific about different areas of reality [344]. Therefore, this research
study sought to establish how SMEs projects financing risks factors impacts expected
return on investment and which conceptual models would guarantee SMEs business
project success? In other to establish this ontology there is the need to identify the
indicators that constitutes the risk of financing SME business projects. This exercise can
be termed as “a process” [345]. Estimation of the risk of financing SMEs business projects
is in a state of instability, flow and permanence and this demands critical interventions.
Also, there are multiple forms of reality that exist, this also bring to mind the theme of
reasonableness in identifying those risks indicators [346] This research is based on the
views that multiple players underscores the philosophy of “multiple forms of reality” in
estimation of the risks of financing SMEs business. In light of this, an inductive approach
was used to solicit the in-depth views and opinions of SMEs business projects financing
in order to build the concepts of estimation of the risk of financing SMEs business project
in developing economies. Also, this research uses narrative data and structural methods
of analysis. This is because studies have shown that it is possible to build better process
theory and better explanations in general through the use of narrative data and structural
methods of analysis [347, 348]. To further make the findings of this study more realistic
the deductive approach was also used to enable the researcher arrive at a reasoned
conclusion by logical generalization of a known fact. Also this study developed a
hypothesis (or hypotheses) based on existing theory, and then designing a research
strategy to test the hypothesis [349, 350]. Additionally, this study applied the deductive
approach of reasoning from the particular to the general and further applied using a causal
relationship and or link that seems to be implied by a particular theory or case example
that might be true in many cases. Furthermore, this study tested to see if this relationship
or link did obtain on more general circumstances [351]. This research seeks to establish
the correlation among indicators of the risk of financing SMEs business-projects.

90
3.2.1.2The Research Epistemology and Approach
Epistemology is concerned with the nature of human knowledge and understanding
that can be acquired through different types of enquiry and alternative methods of
investigation [352]. In this regard this study applies positivist, realism and interpretivist
positions to develop its knowledge [353]. This study adopted the philosophical stance of
the natural scientist. That is, working with an observable social reality to form
generalizations similar to those produced by the physical and natural scientists. This
approach was used to allow for the use of existing theories to develop hypotheses which
will be tested and confirmed, in whole or part, or refuted, leading to the further
development of theories which may then be tested by further research. The study also used
highly structured methodology in order to facilitate replication [354]. Also, this study
applied realism to show that reality is the truth in this study and that objects have existence
independent of the human mind and to also opposed idealism theory that only exist in the
mind. The truth is that, this assumption underpins the collection of data and the
understanding of those data. According to Dobson (2002) a critical realist’s position is
that our knowledge of reality is a result of social conditioning [355]. This is exactly the
position of this research. Additionally, this study used the interpretivism prove the
understanding of the differences between humans in our role as social actors and objects.
In the same way this study interprets the everyday social roles played by humans in terms
of the risks of financing SMEs business projects in accordance with the meaning given to
those roles in line with risks and financing. Studies have shown that certain tools used in
a study depend on the nature of knowledge and this determines how we conceive of our
surroundings and which tools we apply. The two basic tools to study our surroundings
are: quantitative and qualitative research, where each is appropriate to different type of
research problems. This was affirmed by Wand et al. (1993) when they indicated that
observers gain their knowledge of the world by experiencing it and that for qualitative
research, it is generally possible to investigate the world without influencing it or the

91
meaning of phenomena that is inherent to the phenomena and can be experienced by
interacting with it [356].
According to Flick U. (2011) the quantitative approach is concerned with quantitative
data [357]. Also, Bryman A. et al. (2011) held the view that qualitative approach is drawn
from the constructivist paradigm. And the aim is to investigate how the respondent
interprets their own reality [358]. However, Banister et al., (2011) indicated that the
qualitative approach requires the researcher to avoid imposing their own perception of the
meaning of social phenomena upon the respondent [359]. But some scholars believe this
approach presents the challenge of creating a methodology that is framed by the
respondent rather than by the researcher [360]. On the other hand Feilzer M. (2010) offers
solution to this challenge by stating that an effective means by which to use the qualitative
research approach is through interviews, or texts, where the response to a question can be
open [361]. This approach was supported by Goddard and Melville (2004) who believe
that this approach holds a number of accepted statistical standards for the validity of the
approach, such as the number of respondents that are required to establish a statistically
significant result [362]. However, May T. (2011) believe that the quantitative approach
can be most effectively used for situations where there are a large number of respondents
available, where the data can be effectively measured using quantitative techniques, and
where statistical methods of analysis can be used. According to Nwankwo et al. (2010)
quantitative research approach is underpinned by an epistemological standpoint, because
it advocates that more emphasis be placed on actors interpretations [363]. More so, Hunt
C., (1998) stated that qualitative methods such as case studies commonly follow realistic
modes of inquiry, as their main objectives are to discover new relationships of realities
and build new understandings of the meanings of experiences rather than verify
predetermined hypotheses [364].
This research uses the qualitative approach to generate new knowledge and to identify
the key indicators of the risk of financing SMEs business project in developing economies.
Through this approach the study primarily explore to gain an understanding of underlying
92
reasons, opinions, and motivations of all actors involved in the financing of SMEs
business projects. This approach was used to enable the researcher to gain insights into
the problem and to develop ideas or hypotheses for the quantitative aspect of this research.
The qualitative approach was also used to uncover trends in thoughts and opinions, and
dive deeper into the problem. This study is a social research and represents an attempt to
understand human behavior [365]. Further, the study also employed quantitative approach
to enable the researchers to ascertain quantitative answers, analyze numerical change
accurately, predict scores on SMEs business financing risk factors or variables that
influence return on SMEs business projects investments and test the study hypotheses.
The study also uses the quantitative approach to collect numerical data and analyze it
using mathematically based methods such as the Return on Investment to explain the
success rate of projects in developing economies. According to Creswell (1994)
quantitative research as a type of research that is explaining phenomena by collecting
numerical data that are analyzed using mathematically based methods [366]. Also, Cohen
(1980) stated that quantitative research is social research that employs empirical methods
and empirical statements. Cohen added that an empirical statement is a descriptive
statement about what “is” the case in the “real world” rather than what “ought” to be the
case [367]. Therefore, through this approach this research makes empirical statements
about the “real” state of the risk of financing SMEs business projects in developing
economies rather than what “ought” to be the case. Typically, this study expresses those
empirical statements in numerical terms. Therefore, this study uses the quantitative
approach to conduct empirical evaluations to determine the degree to which SMEs
business projects achieve the expected returns.
3.2.1.3 The Research Axiology
This study uses axiology to guide the values that affect how the research is conducted
and what is valued in the results of the research since epistemology does not really reflect
upon our values [368]. However, Klenke (2008) believe that these beliefs and values are

93
made explicit by the researcher so that respondents and consumers of the research are
aware of the context in which the research was conducted and have been exposed to
critical examination. But Klenke further stated that the traditional scientific approach
seeks research that is value free and unbiased [369]. Contrary the above, Cederblom and
Paulsen (2001) stated that all research is value laden and biased [370]. One unique quality
of this study is that it accommodated the values, opinions and beliefs of the researcher.
This allowed the researcher to analyze the contributions of all participants leading to the
production of basic subject matter which were generated numerically but were the
understanding of the responses from the point of view of the researcher. Based on that,
this study makes certain conclusions and offer recommendations based on the information
provided by respondents.
3.3 The Research Strategy and Data Collection Gathering and disseminating sound research backed by evidence is the best way of
estimating the risk of financing SMEs business projects. This research employs strategies
that make its findings useful to those it is intended for and need it most or may come
across it coincidentally. Studies have shown that research strategy can be either
quantitative or qualitative (Bryman and Bell, 2011). Also, research strategy is a general
orientation to the conduct of business research. Several research methodologies have been
identified by scholars such as Galliers (1991) who listed listing fourteen methodologies.
On the other hand Alavi and Carlson (1992) used a hierarchical classification of three
levels and eighteen categories. This study uses field experiments into real SMEs business
project financing and their real life situations to enable the study achieve greater realism
and diminishing the extent to which situations can be criticized as contrived. This study
accept that using this method in practice is difficult when it comes to identifying which
project to experiment on and how to achieve sufficient control to make replication viable.
Also, the study uses surveys to obtain data about practices, situations and views at one

94
point in time through questionnaires and interviews through qualitative analysis. Further,
the quantitative analytical techniques were used to draw inferences from data.
This study further examines the correlation indicators of the risk of financing SMEs
business projects and has taken steps to ensure that no single relevant behaviors are
manipulated. This study also employ interviews, evidences have shown that interviews
can be used to explore and contrast patterns and to confirm or disapprove the patterns of
behavior identified in earlier interviews [371]. Also, cultural and physical artifacts were
observed in this study because it is believed enables direct observation of the events being
studied and interviews with the persons involved in the events [372]. As a result, this study
used in-depth interviews, observations and both primary and secondary documents were
used to unravel the issues involved in the risk of financing SMEs business project in
developing economies. The quantitative data of this study was collected through
questionnaires and interviews: telephone and face-to-face interviews as well as mail and
survey questions. Other, secondary data such as reports, articles, magazines and papers
also form part of the quantitative data.
It must be noted that this is a scientific study which uses well-structured survey to
describes the state of affairs as it prevails at the time of study, and analytic. That is, uses
the already available facts and information and analyze them to make a critical evaluation
of the subject [373]. The questionnaires to this research were given to a selected sample
from a specific population of Ghana Youth Employment program staff, sponsors and
participants (SMEs owners). The term ‘survey’ as applied to this research is a
methodology designed to collect data from a specific population, or a sample from that
population and typically utilizes a questionnaire and or an interview as the survey
instrument [374]. Also, a quantitative questionnaire was used to obtain data from
individual respondents about themselves, their work and financing risk indicators.
Further, some of the respondents were interviewed to allow for probing questions, the
number of interviews conducted were less because the distinct advantages in using a
questionnaire versus an interview [375].
95
Scientific research studies have discovered that mislaid data and chaotic mistakes in
data collection are often the leading causes of error in a survey [376]. To prevent this
mistake, the primary data of this study was gathered by means of observation, interviews
and questionnaire and involve quantitative and qualitative techniques. In other to increase
the validity of this study, observation was [377, 378]. Justifying why observation was used
in this study, Yin (2009) stated that observational evidence is often useful in providing
additional information about a topic being studied [379]. Additionally, interview and
questionnaires were administered through face-to-face, e-mails, field visit and telephone
calls and on the social media. Importantly, the quantitative aspect of the study consists of
numerical data.
3.4 Sample Type and Size This study applied an expediency sampling based on available information from the
database of Youth Employment Program SMEs projects in Ghana. A non-random
sampling technique, where participants are specifically targeted was used to allow for
maximum understanding of the underlying phenomenon of interest [380]. Also, purposive
sampling to identify respondents who can enlighten the phenomenon of interest and can
communicate their experiences was also applied [381]. In this regard the Youth
Employment Program was chosen on the basis of having been in existence for over twelve
(12) years; it was felt that the program have experienced several risks of financing
business projects that would assist this study to achieve its objectives. This will also
enable the study to generalize its findings since the programs share similar characteristics
with other business projects implemented in developing countries.
Using Youth Employment Authority as this study’s setting, the sample population was
put into stratified sampling by dividing the population into strata; this was done to ensure
that no population element is excluded [382]. A total of one hundred (100) sample size
was drawn from each stratum using simple random sampling methods [383]. Further, a
random number of each group was then selected to allow for the categorization population

96
according to particular features and characteristics such as the managerial staff, non-
managerial staff and Participants. A total of 25 respondents were drawn from those in
managerial position, another 25 were also drawn from those in non-managerial position,
and a further 50 were also drawn from those participating in the program, to ensure that
all participants are fully represented in this study.
3.5 Data Analysis and The Research Period This study used content analysis to analyze the data collected from the observations
and interviews made during the study. Further, the content analysis was used as a
mechanism for determining key ideas and themes in publications and for measuring
comparative positions and trends in reporting [384]. Additionally, data collected was
analyzed using mathematically based methods of collecting and analyzing data. All
relevant data were analysed using models, charts, tables, Microsoft excel and Statistical
Package for Social Sciences (SPS) [385]. Furthermore, every single data collected from
each population is presented separately to enable the study attain the desired results and
level of importance.
This research was carried out from June 2016 to June 2019. The study used the Youth
Employment Authority institution in Ghana as its setting. The main participants were the
managerial staff, non-managerial staff and the program participants in Ghana as the case
study.
Conclusions A research is all about addressing an issue or asking and answering a question or
solving a problem. Therefore, every research starts with identifying an issue, question, or
problem; talking with people who want or need the study; find out what’s already known
about it; talking with experts and/or reading their reviews and the original research on the
topic; planning and costing the study accordingly, and finally writing it up and submitting
it for assessment. This research uses qualitative approach to generate new knowledge on
estimation of the risk of financing SMEs business project in developing economies.

97
Through this approach the study primarily explore to gain an understanding of underlying
reasons, opinions, and motivations of all actors involved in the administration and finance
of projects in developing economies. Also, the study also employed quantitative approach
to enable the researchers to ascertain quantitative answers, analyze numerical change
accurately, predict scores on SMEs business projects financing risks indicators and factors
that influence return on investment, and test the study hypotheses.
Through these approaches this research makes empirical statements about the “real”
state of the risk of financing SMEs business projects in developing economies rather than
what “ought” to be the case. Typically, this study expresses those empirical statements in
numerical, qualitative and conceptual terms. The study also examines the correlation
between the indicators of the risk of financing SMEs business projects and has taken steps
to ensure that no single relevant behaviors are manipulated. However, it must be noted
that this is a scientific study which uses well-structured survey to describe the state of
affairs as it prevails at the time of study, and analytic. That is, uses the already available
facts and information and analyze them to make a critical evaluation of the subject.

98
CHAPTER FOUR ESTIMATING OF THE RISK OF FINANCING SMES BUSINESS-PROJECTS IN TERMS OF BEHAVIORAL ECONOMICS: SUING FUZZY LOGIC RULE
AND INTEGRAL ESTIMATION METHOD
4.1 Introduction of Youth Employability Programs Models Introdution This chapter presents the analysis of all relevant data collected from the various groups
of the study and covered “Estimation of the Risk of Financing SMEs Business-Projects in
Developing Economies in Terms of Behavioral Economics: suing Fuzzy Logic and
Integral Estimation Method”. Data collected from each group and participants are
presented separately to enable the research attain the desired level of importance. The
analysis of relevant data was done using Excel software, models, tables and charts for the
qualitative and quantitative analysis of the results. And covers data collected through
questionnaire, reports, interviews, observations and records on the Youth Employment
Agency programs in Ghana.
This study’s data gathered revealed that the Youth Employment Agency (YEA) was
established under the Youth Employment Act 2015 (Act 887) of Ghana to empower young
people of Ghana to contribute meaningfully to the socio-economic and sustainable
development of the Ghanaian. The objective of the program is to support youth between
the ages of 15 to 35 years through skills training and internship modules to move from the
state of being unemployment to that of employment. Since the sustainability of every
program is very crucial, YEA was changed in 2009 from the traditional modules which
had pay roll challenges to self-employment modules such as Trades and Vocation modules
through public-private partnership. This was hopped would reduce the burden on payment
of stipend for the paid internship module. In 2011, the program attracted international
acclaim, with the British Broadcasting Corporation (BBC) ranking YEA as the best Youth
Employment Program in Africa. Available data collected by this study indicated as of
December 2012, the program had about sixty thousand (60,000) beneficiaries. In 2017,
YEA beneficiaries rose to over eighty thousand (80,000). Unfortunately, YEA suspended

99
payments of allowances in April 2017 when it discovered that some two thousand nine
hundred and ninety nine (2,999) beneficiaries were actually not at post but were being
paid. A further eighteen thousand (18000) none-existing beneficiaries names were
identified. This was costing the government of Ghana to lose about eight hundred and
forty thousand US dollars ($840,000). Available data gathered also showed that the YEA
introduced new modules and some of the existing modules such as Youth in Security
Services and Trades and Vocation have been reviewed and expanded to meet the growing
demand for youth employment in the country. Currently, the program has ten models as
presented in figure 4.1 and table 4.1 below.
Figure 4.1 – YEA Program Modules, 2018
Source: Developed by the author

100
Table 4.1 – below presents a description of each module shown above.
Modules Description Youth in Agriculture and Forestation
Seeks to create employment opportunities for the youth through agriculture and its related businesses in order to contribute towards the nation’s food security while they earn a living
Youth in Sanitation and Coastal Assistants
This module creates employment opportunities for the youth through maintenance of environmental cleanliness with special emphasis on our coastal belt
Youth in Community Service and Security
Offers employment opportunities for the youth by augmenting the human resource capacity of Ghana’s security services within beneficiaries cited communities.
Youth in Community and Health Assistants
The module seeks to create employment opportunities for the youth by adding up to the staff strength of the Ghana Health Service while assisting in basic health care delivery to hard to reach communities
Community Teaching Assistants
Creates employment opportunity for the youth by adding up to the staff strength of Ghana Education Service in delivering pre basic and basic level teaching to communities with low teacher supply
Youth in Trades and Vocation
Seeks to equip the youth with skill sets to make them employable for the labor market and enable them become self-employed
Youth in Entrepreneurship
The objective of this module is to equip the youth with Entrepreneurial skills in order to create new crop of small business owners who will intend offer employment opportunities to others.
Youth in Apparel and Textiles
This module is to train the youth in the art of textile and garment making to make them employable with garment manufacturing companies or to set up their own businesses.
Industrial Attachment
Offers employment opportunities for graduates to gain hands on experience to boost their employability
Youth in Information Communication Technology
The target is to equip the youth with information technology skills set to make them employable for the labor market

101
4.2 Demographic Profile of the Respondents
It is very important to justify that the quality of a study is often better with sampling
than with a census. This study used a simple random sampling to select 100 respondents,
consisting of five (5) top management staff, twenty-five (25) non-management staff that
facilitates implementation of the entire Youth Employment Program. Also, the
demographic profile covers seventy (70) youth who are direct beneficiaries of the program
most of whom have established their own small or medium enterprises under the program.
In this study the beneficiaries covers those that participated in the program and have been
able to establish successful businesses as well as those who also participated in the
program but failed to establish successful businesses. The table 4.2 below represents the
demographic characteristics of all the respondents.
Table 4.2 – Demographic profile of the Youth Employability Program in Ghana
Profile Category Number % Freq. Male 65 65
Gender Female 35 35 Total 100 100.0
Age(years) Less than 20yrs 0 00.0 20-34yrs 50 50 35-49yrs 37 37 50yrs and above 13 13 Total 100 100.0
Position
Top Mgt. 5 5 Staff 25 25 Beneficiaries / SMEs Owners 70 70 Total 100 100 Less than 3years 56 56 4-6years 34 34
Tenure of Involvement 7-10years 10 10 11years and above 0 0
Total 100 100.0 Educational Level No Education 0 00.0
Certificate / Diploma 43 43
Degree 37 37 Master/PhD 20 20
Total 100 100.
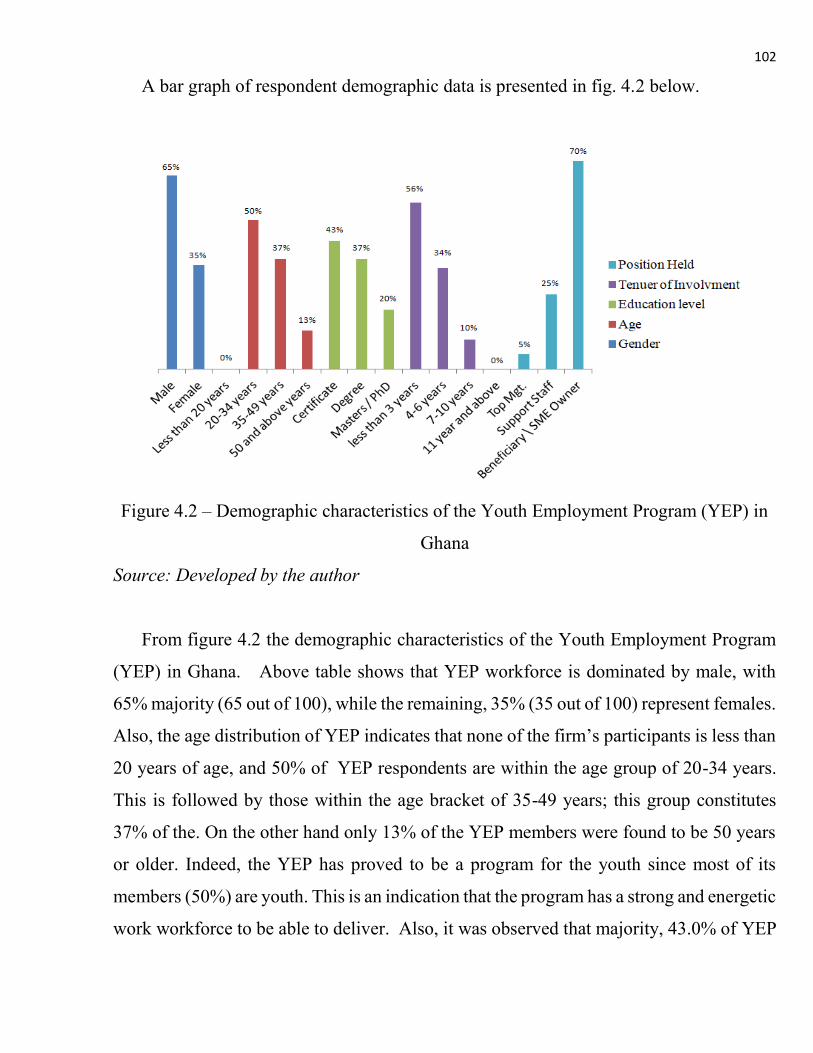
102
A bar graph of respondent demographic data is presented in fig. 4.2 below.
Figure 4.2 – Demographic characteristics of the Youth Employment Program (YEP) in
Ghana
Source: Developed by the author
From figure 4.2 the demographic characteristics of the Youth Employment Program
(YEP) in Ghana. Above table shows that YEP workforce is dominated by male, with
65% majority (65 out of 100), while the remaining, 35% (35 out of 100) represent females.
Also, the age distribution of YEP indicates that none of the firm’s participants is less than
20 years of age, and 50% of YEP respondents are within the age group of 20-34 years.
This is followed by those within the age bracket of 35-49 years; this group constitutes
37% of the. On the other hand only 13% of the YEP members were found to be 50 years
or older. Indeed, the YEP has proved to be a program for the youth since most of its
members (50%) are youth. This is an indication that the program has a strong and energetic
work workforce to be able to deliver. Also, it was observed that majority, 43.0% of YEP

103
members have attained at least Certificate or Diploma qualifications, this show that
majority of the program members have attained formal education. This is followed by
37% with a First Degree / Professional certificate, while 20% of the respondents hold
Masters or Advanced degree. Furthermore, the result showed that 560% of YEP members
have worked within the program for less than 3 years. Those with more than 4-6 years
involvement with the program constituted 34%, while those with 7-10 years involvement
in the program constituted 10%, while 0% has had 11 years or more involvement in the
program.
4.3 Identification of the Risk of Financing SMEs Business Projects As stated earlier, the focus of this study is to estimate the risk of financing SMEs
business projects. Therefore, this research is concerted on the Youth in Entrepreneurship
module of YEA. Data gathered revealed that one of the key modules of the program which
has produced reasonable number of small and medium enterprises (SME) is the Youth in
Entrepreneurship. However, the same module came up as the one through which the
government and other investors have lost huge sums of money through investment in
business projects. A careful analysis of data gathered brought to the fore numerous factors
as the major causes of such huge losses for investing in business projects under the
module. The figure 4.3 below shows how the risk of financing those business projects
emerges in three folds.
From the above, this study observed that the risk of financing SMEs business projects
emanate from the entrepreneur after investors have been convinced by their business
model. To logic behind the Idea Risks introduced in this study can be linked to the
Behavioral Economics and Noisy Selection Theory. The noisy selection theory states that
one key factor to consider when analyzing the success of a firm is its start-up and operating
costs [386]. To better gain more insight on the rationale behind most SMEs choices of
business project and decision making, this study draws on behavioral economics.
Understanding the effect of psychological, cognitive, emotional, cultural and social
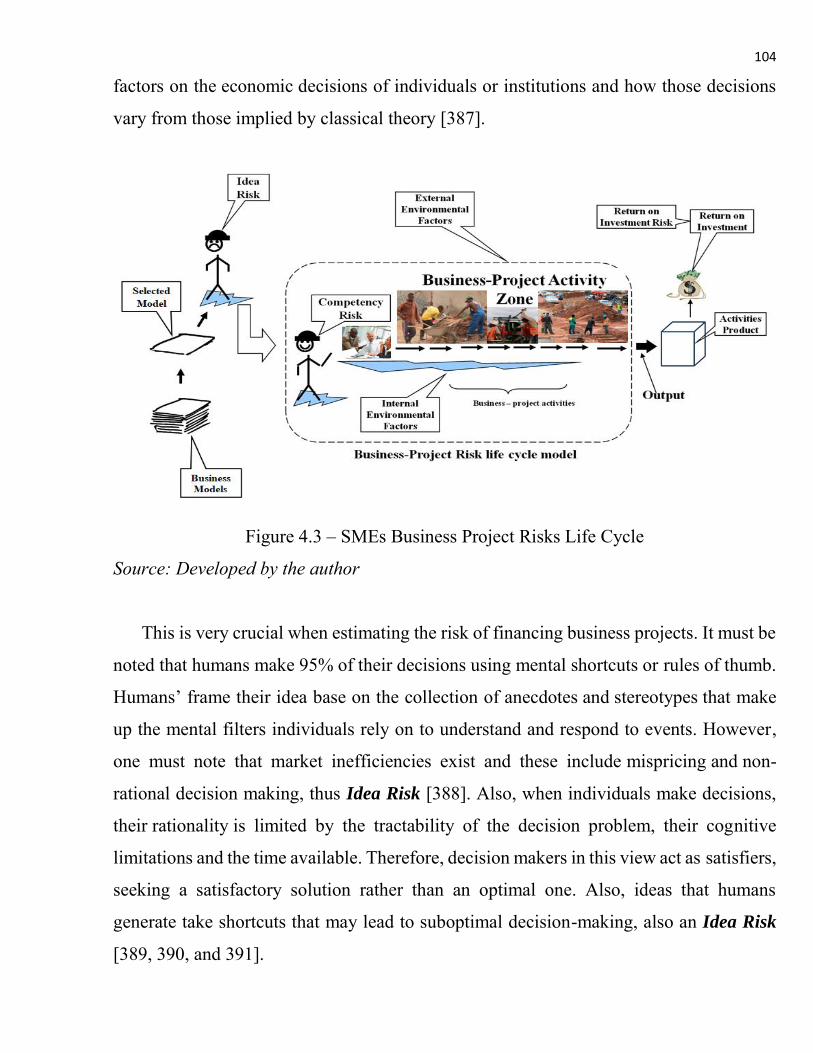
104
factors on the economic decisions of individuals or institutions and how those decisions
vary from those implied by classical theory [387].
Figure 4.3 – SMEs Business Project Risks Life Cycle
Source: Developed by the author
This is very crucial when estimating the risk of financing business projects. It must be
noted that humans make 95% of their decisions using mental shortcuts or rules of thumb.
Humans’ frame their idea base on the collection of anecdotes and stereotypes that make
up the mental filters individuals rely on to understand and respond to events. However,
one must note that market inefficiencies exist and these include mispricing and non-
rational decision making, thus Idea Risk [388]. Also, when individuals make decisions,
their rationality is limited by the tractability of the decision problem, their cognitive
limitations and the time available. Therefore, decision makers in this view act as satisfiers,
seeking a satisfactory solution rather than an optimal one. Also, ideas that humans
generate take shortcuts that may lead to suboptimal decision-making, also an Idea Risk
[389, 390, and 391].

105
Also, Najib H. (2002) revealed that the principal factors impeding firm growth are
lack of access to qualified workers and managers; government policies such; domestic
price volatility among others, thus Competency Risk [392]. Also, Pajarinen et al. (2015)
stated that entrepreneurs with higher academic background are more innovative and will
use modern techniques and models to do business. Schumpeter (1934) indicated that an
entrepreneur needs to be innovative, creative, and should be able to take risk. Further,
Barringer and Bluedorn (1999) described entrepreneurs as individuals who can explore
the environment, discover the opportunities, and exploit them after proper evaluation
[393, 394, and 395]. These characteristics that constitute a successful SMEs ownership
when analyzed carefully are linked competency, thus Competency Risks. The competency
risk is more affirmed through a careful analysis of the Chaos theory [396]. Form these
points, the estimation of the risk of financing SMEs project must go beyond just looking
at financial indicators but should also look at the psychological state of the personality
initiating the business idea or requesting for funding. Virlics A., (2013) shows that
investment decisions are made after a complete analysis of the investment project. Virlics
A. further stated that one of the basic factors that influence the decision is the risk factor
of the investment. This risk exists because it is uncertain that the cost of the investment
will be recovered and a profit will be made, thus Return on Investment Risk [397]. One
major challenge associated with investment decision making is risks and uncertainty.
Toma S.V. et al. (2012) also stated that to better understand the concept of risk, it is
necessary to make a clear distinction between risk and uncertainty [398].
This study believes that to better understand the risk of financing SMEs business
projects, there is the need to identify those common factors that form the basis of risks in
all SMEs business projects. Analysis of this research data revealed what this study term
as the Dodecagon Risks of Financing SMEs Business Projects.

106
Table 4.3 – Risks of financing SMEs business projects
BUSINESS PROJECT FINANCE RISKS (BPFR) = R BUSINESS IDEA RISKS (BIS) = r1
Innovation /
Uniqueness Risks (OU)
Acceptability /
Adoptability Risk
(AA)
Technology Risks
(TI)
Set-up / Operation
Risks
(OP)
Self-generated. Effectiveness. Cohesiveness. Practicality. Tactical Real (authentic) Safety net (backup) Tacit
Universalism. Integrated. Modernity. Flexibility. Likability. Ambiguity. Functionality. Capacity.
Knowledge flow. Machinery. Diffusion of idea. Global focus. Operation mode Differentiation R and D
Pre-requisites Redundancy Idea chaos Productiveness. Competitiveness. Sustainability
COMPETENCY RISKS (CR) = r2
Technical / Creativity
Risks (TC)
Management Risks
(M)
Comprehension
Risks I
Social / Environment
Risks (SE)
Innovativeness. Leadership. Competitive intelligence. Strategic alliances. Knowledge creation. Connectivity. Assertiveness.
Environment. Unique skills Motivation. Commitment Self-control. Openness. Deliverables.
Human Capital Expectancy. Results orientation. Efficiency. Consultation. Education level. Crisis management Trustworthiness.
Experience Demographic index Civil integration Perceptions. Benefit / Value Elasticity Availability of information Factors linkage
RETURN ON INVESTMENT RISKS (RIR) = r3
Financial Risk (FR) Economic Risk
(ER)
Political and Legal
Risks (PLR)
Culture and
Tradition Risks
(CTR)
Project cost. NPV Financing structure. Securing other financing. Liquidity ratio Financing cost. Cash flow projection Financial mgt. plan. Credit history. Reliance on revenue source. Operating self-sufficiency. Funding participants.
Inflation. Interest rate Competition. Market share / size Market prices. Availability of suppliers. Minimum wage. Cost of material. Tax law. Industry-specific economic growth. Demand Income level Spending pattern
Political stability. Economic policies. Legal requirements. Corruption. Degree of freedom. Leadership The project and politics. Security. Bureaucracy.
Customs Beliefs Ethnocentrism Entrepreneurship background. Ethics. Life style. Attitude towards work.
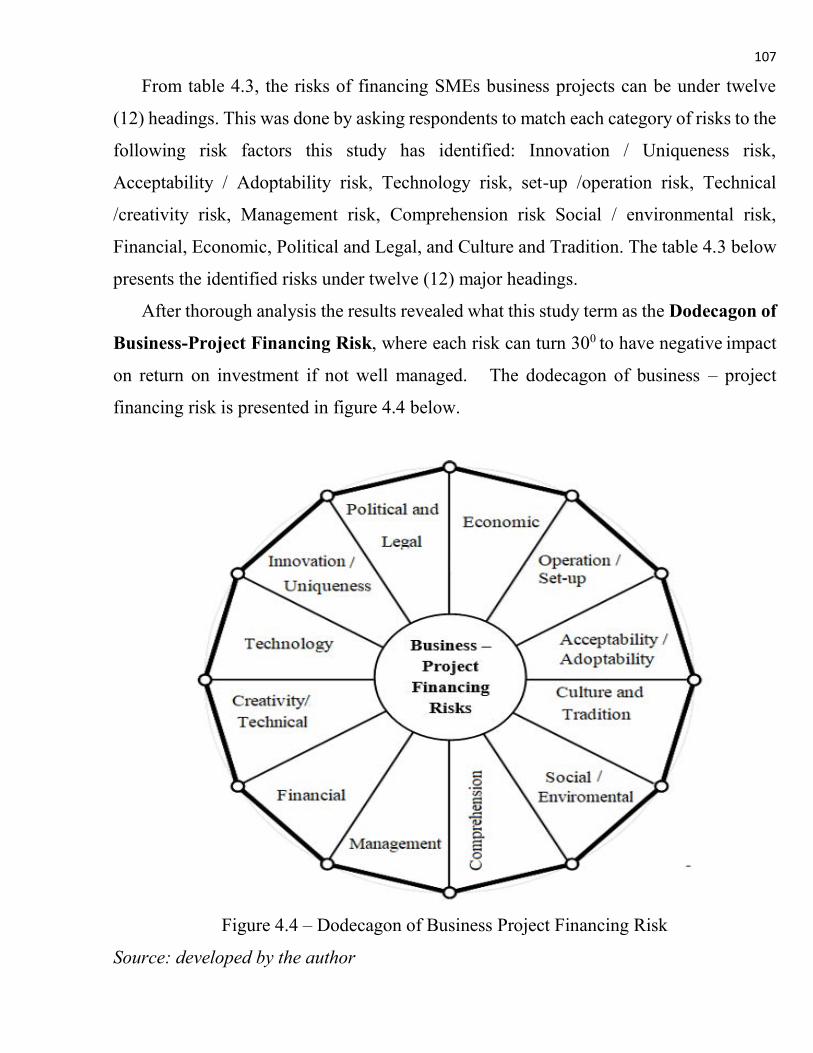
107
From table 4.3, the risks of financing SMEs business projects can be under twelve
(12) headings. This was done by asking respondents to match each category of risks to the
following risk factors this study has identified: Innovation / Uniqueness risk,
Acceptability / Adoptability risk, Technology risk, set-up /operation risk, Technical
/creativity risk, Management risk, Comprehension risk Social / environmental risk,
Financial, Economic, Political and Legal, and Culture and Tradition. The table 4.3 below
presents the identified risks under twelve (12) major headings.
After thorough analysis the results revealed what this study term as the Dodecagon of
Business-Project Financing Risk, where each risk can turn 300 to have negative impact
on return on investment if not well managed. The dodecagon of business – project
financing risk is presented in figure 4.4 below.
Figure 4.4 – Dodecagon of Business Project Financing Risk
Source: developed by the author
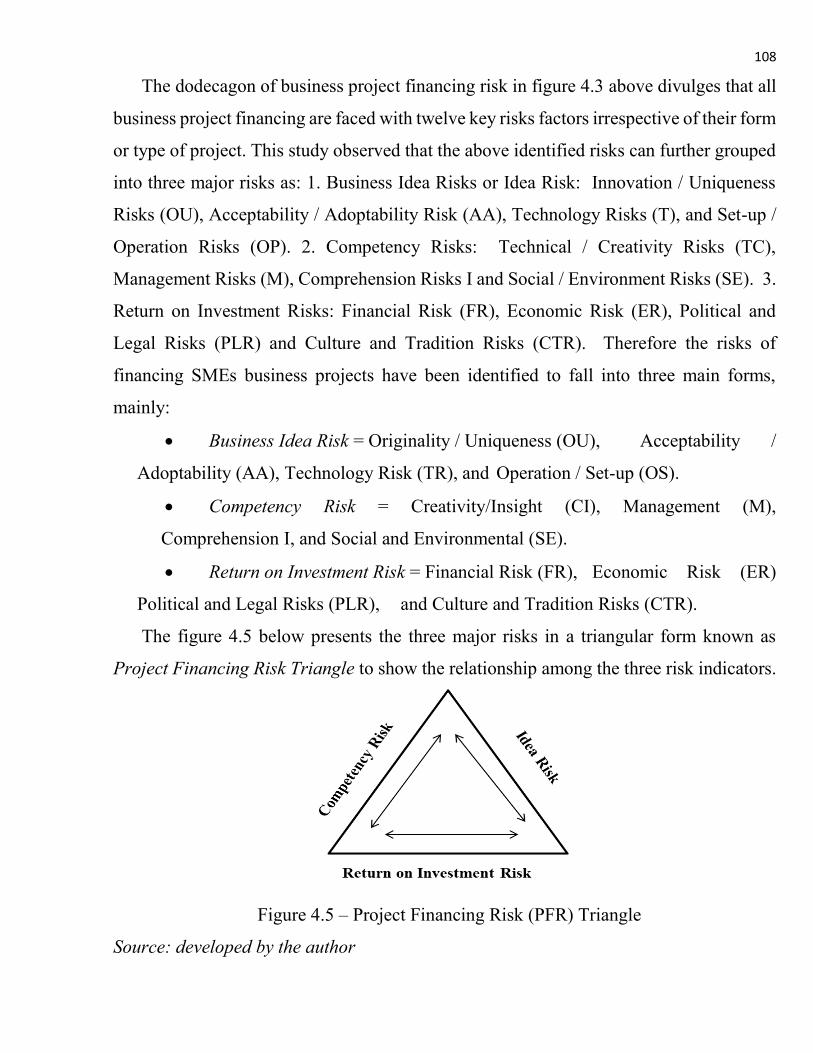
108
The dodecagon of business project financing risk in figure 4.3 above divulges that all
business project financing are faced with twelve key risks factors irrespective of their form
or type of project. This study observed that the above identified risks can further grouped
into three major risks as: 1. Business Idea Risks or Idea Risk: Innovation / Uniqueness
Risks (OU), Acceptability / Adoptability Risk (AA), Technology Risks (T), and Set-up /
Operation Risks (OP). 2. Competency Risks: Technical / Creativity Risks (TC),
Management Risks (M), Comprehension Risks I and Social / Environment Risks (SE). 3.
Return on Investment Risks: Financial Risk (FR), Economic Risk (ER), Political and
Legal Risks (PLR) and Culture and Tradition Risks (CTR). Therefore the risks of
financing SMEs business projects have been identified to fall into three main forms,
mainly:
Business Idea Risk = Originality / Uniqueness (OU), Acceptability /
Adoptability (AA), Technology Risk (TR), and Operation / Set-up (OS).
Competency Risk = Creativity/Insight (CI), Management (M),
Comprehension I, and Social and Environmental (SE).
Return on Investment Risk = Financial Risk (FR), Economic Risk (ER)
Political and Legal Risks (PLR), and Culture and Tradition Risks (CTR).
The figure 4.5 below presents the three major risks in a triangular form known as
Project Financing Risk Triangle to show the relationship among the three risk indicators.
Figure 4.5 – Project Financing Risk (PFR) Triangle
Source: developed by the author

109
The BPFR triangle above indicates that idea risk could impact competency risk
hugely if not managed well. Thus, SMEs owners with low competency are more likely to
generate very risky business project ideas. Further, high competency risk would
automatically have influence on return on investment (ROI). It is worth noting that ROI
depends highly on creative ideas and high competent team in other to yield the desire or
expected returns.
4.3.1 Coding Risk Indicators and Factors This study is as scientific research conducted to test the potency of all the identified
risks indicators and factors that constitutes the risks of financing business projects. As a
result this study has developed a business plan template as in appendix I.a. The business
plan template was given to respondents to match each item in the business plan template
to the identified risk indicator’s factors. The results is shown in appendix I.b. The study
further counted the number of times each code what recorded against each factor by
respondents. This was to enable this research to record the frequency / points / weight of
impact each risk factor has on financing of business projects in developing economies.
Figure in Appendix C shows the business project risk blocks resulting from the
frequencies / points / weight of each risk factor. Detail is show in appendix Ic.
The figure Appendix C shows the risk indicators has varying accumulated risk potency
points. This can be expressed as
1. Accumulated frequency points of Competency Risks:
R2A+R2B+R2C+R2D = 149 + 143 + 133 + 125 = 550
Ranked 1st as having very high risk potency.
2. Accumulated frequency points of Business Idea Risks:
R1A+RAB+R1C+R1D = 132 + 112 + 92 + 138 = 474
Ranked 2nd as having high risk potency.
3. Accumulated frequency points of Return on Investment Risks: R
3A+R3B+R3C+R3D = 125 + 101 + 75 + 89 = 390
Rank 3rd as having moderate risk potency.

110
It is not surprising competency risk had the highest score of 550 points and also ranked
first in this study. This is because humans are the manager of every business project,
therefore, higher competencies will result in less idea and return on investment risk and
vise versa.
As Pajarinen et al. (2015) puts it entrepreneurs with higher academic background are
more innovative and will use modern techniques and models to do business. This is an
indication that high competency risk can affect the entire business project success. Also,
idea risk came second with a score of 474 points. The works of Lin Tom C. W., (2012)
affirms this by stating that understanding the effects of psychological, cognitive,
emotional, cultural and social factors on the economic decisions of individuals or
institutions and how those decisions vary from those implied by classical theory. Lastly,
return on investment came third, scoring 390 points. Virlics A., (2013) studies throws
more light on this score by stating that investment decisions are made after a complete
analysis of the investment project. This shows that the score points of return on investment
risk is dependent of the first two risks indicators. Therefore, it is not surprising that it had
the least score of 390 points. Thus, when competency and idea risks are handled well,
there will be less impact of return on investment risks. Table 4.4 below is a summary of
accumulated points of risks factors
A further analysis on the accumulated points for risk indicators was done to equate to
all the individual scores to one (1). This was done allow for possible of further analysis of
this study in SPSS and excel. As well as the application of fuzzy logic rule. The table 4.5
below is the accumulated points for risk indicators equated to one (1) point.

111
Table 4.4 – The Summary of accumulated points of risks factors RISK INDICATORS RISK FACTORS POINTS EQUATING TO
ONE HUNDRED POINTS
Business Idea (R1)
Originality / Uniqueness 132 9.34 Operation / Set-up 112 7.92 Technology 92 6.51 Acceptability
/Adaptability 138 9.76
Total 474 33.52
Competency (R2)
Technical / Creativity 149 10.54 Management 143 10.11 Comprehension 133 9.41 Social / Environment 125 8.84 Total 550 38.90
Return on Investment (R3)
Financial 125 8.84 Economic 101 7.14 Cultural 75 5.30 Political / Legal 89 6.29 Total 390 27.58 Grand Weight Total 1414 100 or 1
Table 4.5 – The accumulated points for risk indicators RISK INDICATORS EQUATING TO ONE
HUNDRED EQUATING RISK POINTS
TO ONE Idea Risk 33.52 0.3352 = 0.33 Competency Risk 38.90 0.3890 = 0.4 Return on Investment Risk 27.58 0.2758 = 0.27
Total 100 1
4.3.2 Validation of Risk Indicator and Factors i. The Relationship of Risk Factors Impact on Risk Indicators This study believes that it is very important to analyze the rate of impact each of the
identified factors contribute to activate the three key risk indicator. The pie chart below in
figure 4.7 shows the rate of each risk factor’s contribution. The pie chart in figure 4.6
below revealed that political and legal factors contribute greatly to the three key risks of
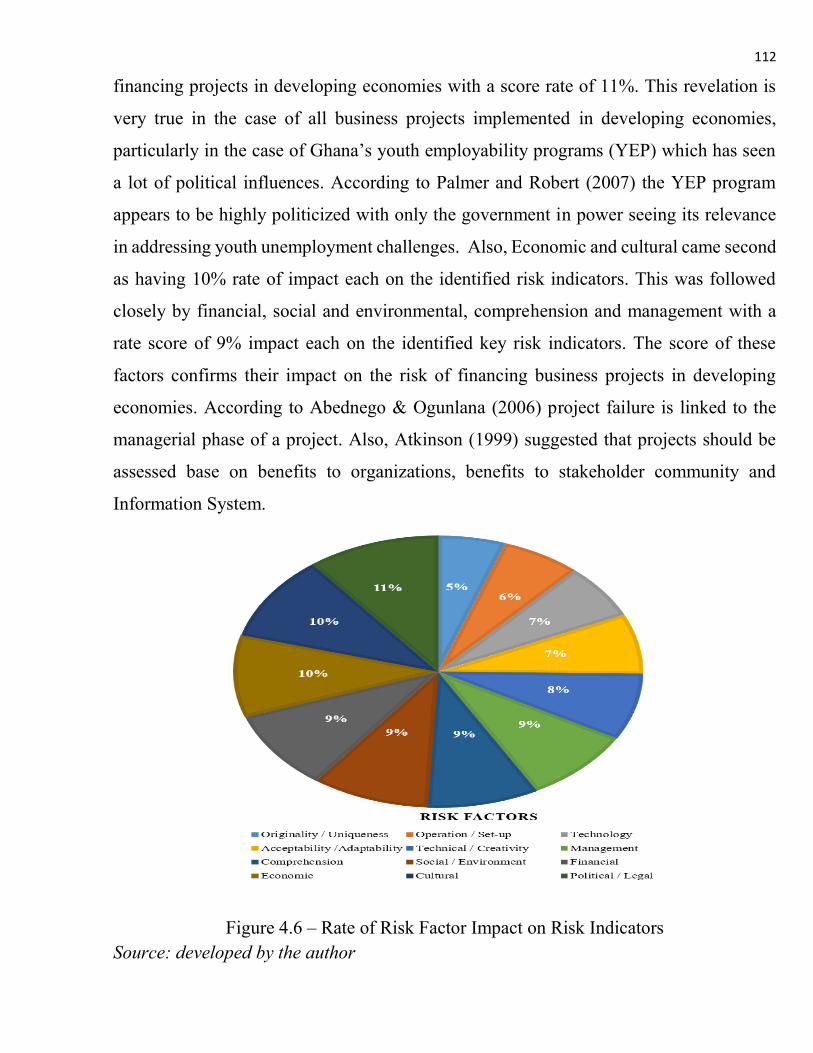
112
financing projects in developing economies with a score rate of 11%. This revelation is
very true in the case of all business projects implemented in developing economies,
particularly in the case of Ghana’s youth employability programs (YEP) which has seen
a lot of political influences. According to Palmer and Robert (2007) the YEP program
appears to be highly politicized with only the government in power seeing its relevance
in addressing youth unemployment challenges. Also, Economic and cultural came second
as having 10% rate of impact each on the identified risk indicators. This was followed
closely by financial, social and environmental, comprehension and management with a
rate score of 9% impact each on the identified key risk indicators. The score of these
factors confirms their impact on the risk of financing business projects in developing
economies. According to Abednego & Ogunlana (2006) project failure is linked to the
managerial phase of a project. Also, Atkinson (1999) suggested that projects should be
assessed base on benefits to organizations, benefits to stakeholder community and
Information System.
Figure 4.6 – Rate of Risk Factor Impact on Risk Indicators Source: developed by the author

113
Atkinson explained that the benefits to stakeholder include: contractors’ profits,
capital suppliers, project team, economic impact to surrounding community, satisfied
users, social and environmental impact, personal development, and professional learning.
The benefits to organization should include: organizational-leaning improves efficiency,
meets strategic goals, reduce waste, effectiveness and increase profitability. All these
studies justifies the finding of this research. Further, these was recorded for the following
factors: originality / Uniqueness – 5%, operation / set-up – 6%, technology -7%, technical
/ creativity – 7%, acceptability and adaptability -8% rate scores. The findings of this study
has further been affirmed by the World Bank, 2012 Report which indicates that
developing countries such as Ghana’s over reliance on external sources of resources
(especially funding) for their developmental projects call for the country to develop the
skills to look for other funding source. Also, a study conducted by Isaac et al. (2015)
indicates funding and management as major factors that contribute to Ghana government
projects failure. The GYEEDA Report, 2013 also indicated that the greatest problem of
Ghana’s YEP is the absence of an appropriate governance framework; inadequate
financial oversight; poor supervision etc., these challenges are purely administration and
finance issues. Also, data gathered revealed a bar graph of risk factors of financing
business projects. Figure 4.7 below present the bar graph. The bar graph brought to the
fore that the impact of the risk factors of financing business projects rises and fall at and
increasingly high rate. The R-squared value is 0.92 which is approximately 1, a revelation
that the line fit the data perfectly.
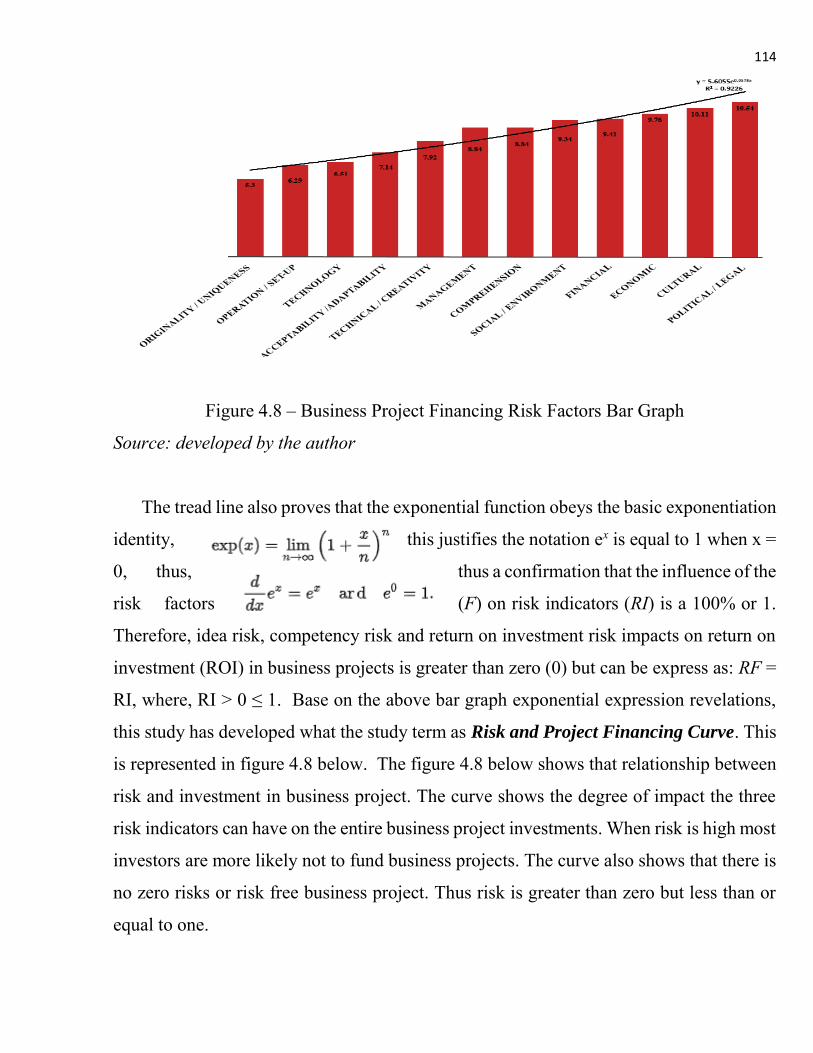
114
Figure 4.8 – Business Project Financing Risk Factors Bar Graph
Source: developed by the author
The tread line also proves that the exponential function obeys the basic exponentiation
identity, this justifies the notation ex is equal to 1 when x =
0, thus, thus a confirmation that the influence of the
risk factors (F) on risk indicators (RI) is a 100% or 1.
Therefore, idea risk, competency risk and return on investment risk impacts on return on
investment (ROI) in business projects is greater than zero (0) but can be express as: RF =
RI, where, RI ˃ 0 ≤ 1. Base on the above bar graph exponential expression revelations,
this study has developed what the study term as Risk and Project Financing Curve. This
is represented in figure 4.8 below. The figure 4.8 below shows that relationship between
risk and investment in business project. The curve shows the degree of impact the three
risk indicators can have on the entire business project investments. When risk is high most
investors are more likely not to fund business projects. The curve also shows that there is
no zero risks or risk free business project. Thus risk is greater than zero but less than or
equal to one.

115
Figure 4.8 – Business Project Financing Curve
Source: developed by the author
Further, the curve reveal that as risk reduces investors are more likely to put in more
funds for business project. This also indicate that as risk reduces more project and or
activities will be undertaken. Additionally, idea risk zone is below the investment line and
risk line, this means that investors losses nothing and no funds is lost or required when
there is no intention to implement a business idea. Once the intention to convert business
idea into action is born, competency and return on investment risk becomes active.
Competency risk and return on investment risk is above the investment line because
acquiring high competent team to aid good management and higher return comes at a cost,
thus, the two factors (competency risk and return risk) increases as risk also increase. The
intersection point of the risk line and investment line is termed as the Stability point, thus,
at that point there is no loss nor gain from investment. This point also mean that the project
has the potential of generating enough revenue to cover all capital invested. However, the
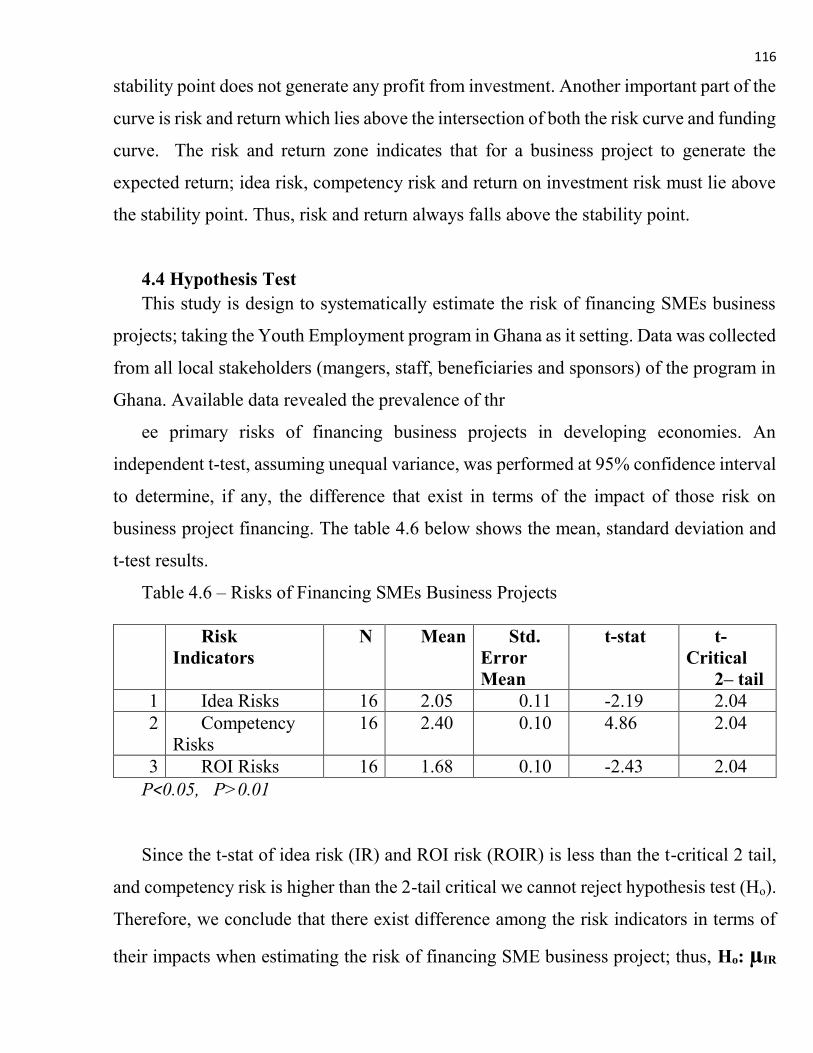
116
stability point does not generate any profit from investment. Another important part of the
curve is risk and return which lies above the intersection of both the risk curve and funding
curve. The risk and return zone indicates that for a business project to generate the
expected return; idea risk, competency risk and return on investment risk must lie above
the stability point. Thus, risk and return always falls above the stability point.
4.4 Hypothesis Test This study is design to systematically estimate the risk of financing SMEs business
projects; taking the Youth Employment program in Ghana as it setting. Data was collected
from all local stakeholders (mangers, staff, beneficiaries and sponsors) of the program in
Ghana. Available data revealed the prevalence of thr
ee primary risks of financing business projects in developing economies. An
independent t-test, assuming unequal variance, was performed at 95% confidence interval
to determine, if any, the difference that exist in terms of the impact of those risk on
business project financing. The table 4.6 below shows the mean, standard deviation and
t-test results.
Table 4.6 – Risks of Financing SMEs Business Projects
Risk Indicators
N Mean Std. Error Mean
t-stat t- Critical
2– tail 1 Idea Risks 16 2.05 0.11 -2.19 2.04 2 Competency
Risks 16 2.40 0.10 4.86 2.04
3 ROI Risks 16 1.68 0.10 -2.43 2.04 P˂0.05, P˃0.01
Since the t-stat of idea risk (IR) and ROI risk (ROIR) is less than the t-critical 2 tail,
and competency risk is higher than the 2-tail critical we cannot reject hypothesis test (Ho).
Therefore, we conclude that there exist difference among the risk indicators in terms of
their impacts when estimating the risk of financing SME business project; thus, Ho: µIR

117
≠ µROIR ≠ µCR. Also, the alternative hypothesis (Ha) shows that there is at least one
inequalities; thus, Ha: ALOI among the risk indicators. Therefore, the study accept Ho,
thus competency risk, idea risk and ROI risk are the key risks indicators when estimating
the risk of financing SMEs business projects. The T-values are significant at 0.01 levels
for business idea risks, competency risks (CR) and ROI risks, an indication that when
those risks are estimated effective it will help to avoid putting money into highly risky
business-projects. Also, the T-value of business idea risk, competency risk and ROI risk
of financing SMEs business-project are significant at 0.05 levels. The result of T-tests
shows these risks have substantial effect on SMEs business project financing. Also, table
4.7below shows the sum squares, mean squares and degree of frequency. The table 478
also measures the risk indicators of SMEs business-project financing using integral
estimation. The measure reveals a positive significant correlation between the total scores
of the risk indictors (P ˂ 0. 05).
Table 4.7 – Predictor of Risk of Financing SMEs Business-project
Model Sum of Squares
Df Mean Squares
F Sig
Regression 4.00 2 2.00 11.02 0.000 Residual 8.19 45 0.18 Total 12.19 47
Additionally, the results in Table 4.7 shows a significant P-value =0.000 (less than
0.05) for estimating the relation between the indicators and SMEs business-project
financing. Further, table 4.8 below confirms the occurrence of a predicting relation
between the indicators used to estimate the risk of financing SMEs business-projects.
Table 4.8 – Dependent Variable: SMEs Business-project Financing
Un-standardized Coefficient
Standardized Coefficients t stat Sig
B Std Error Beta Risk Indicators 0.95 0.81 0.512 8.61 0.01

118
A major point drawn among the relationships of the risk indicators is shown in the
above table 4.8 with the help of the values of intercept (0.95) and slope for SME business-
project financing regression line (0.880). This suggests that using the three indicators can
help to estimate the risk of financing SMEs business-projects; irrespective of the volume
funds provide and location of the project significantly by 0.95 (95%). Thus, the chances
the particular project in question will succeed or fail largely would depend on how well
these indicators are estimated. Additionally, a slope of 0.512 for SME business-project
financing risk indicators is formed when the test applies standardized independent and
dependent variables. The table 4.7 below shows fit the risk factors are in the estimation of
the risk of financing SME business-project.
From table 4.8 above, could be seen the presence of well-built positive relationship
among the risk indicators of financing SMEs business-projects. This attests that the
decision to finance or not to finance SMEs business-project can be estimated; after a
careful analysis of the three key risk indicators with regard to information contain in the
business-project plan. The result above in addition revealed an ‘R’ value of 0.88,
indicating that 88% of the inconsistency in deciding whether to finance or not to finance
SMEs business-project can be overcome by paying critical attention to those three
determinants stated in this study. The figure 4.9 below shows the risk factors and business-
project financing rating.
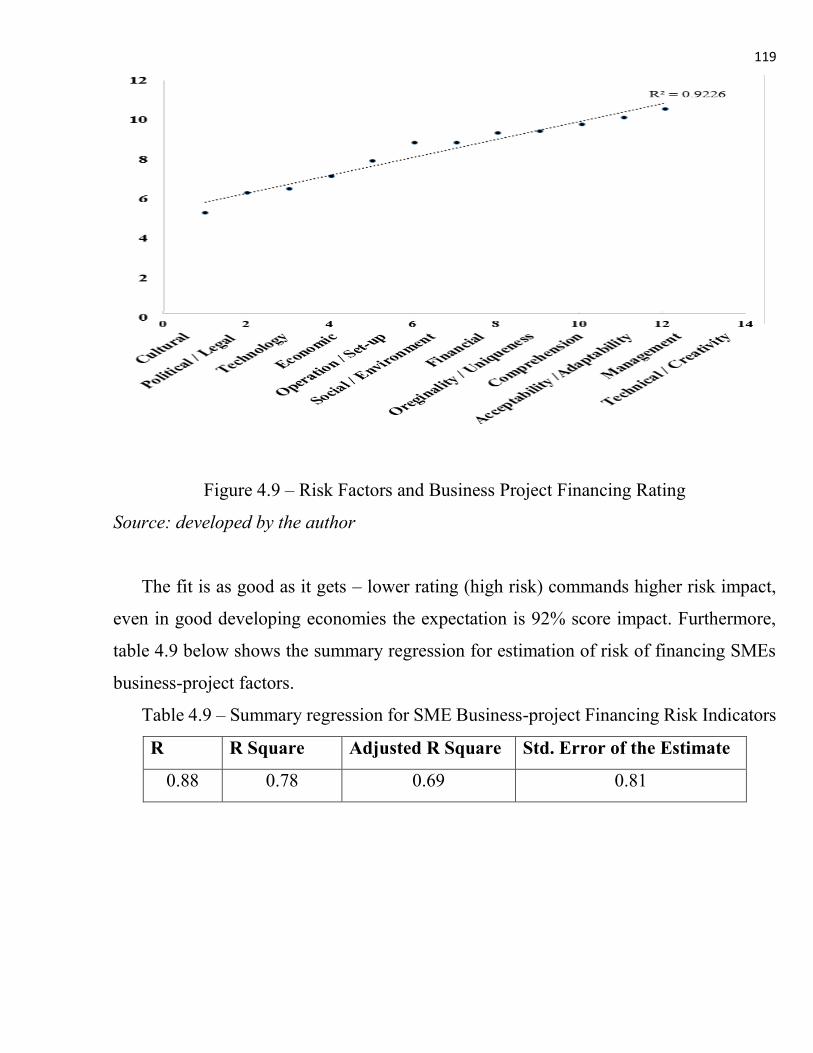
119
Figure 4.9 – Risk Factors and Business Project Financing Rating
Source: developed by the author
The fit is as good as it gets – lower rating (high risk) commands higher risk impact,
even in good developing economies the expectation is 92% score impact. Furthermore,
table 4.9 below shows the summary regression for estimation of risk of financing SMEs
business-project factors.
Table 4.9 – Summary regression for SME Business-project Financing Risk Indicators
R R Square Adjusted R Square Std. Error of the Estimate
0.88 0.78 0.69 0.81
120
4.4.1 Testing the Degree of Truthiness or Falsehood One of the objectives of this study is to develop a system model for the estimation of
the risk of financing SMEs business-project. From the above analysis, the three key risks
indicators have one hundred (100) percent or in summation one (1) potency to impact the
expected returns on business-project. The figure 4.10 below shows the interconnections
among the risk indicators in a form of a system.
Using fuzzy logic model this study further proves the actuality of the identified risk
indicators impact on business-project financing. The risk associated with any activity is
made up of two components: that is the chances of the occurrence of the negative event
and the degree of impact of the negative event [339, 400]. Base on risk mapping model
which maps low likelihood and high impact into the upper left quadrant, this study has
also map all the categories of risks into risk matrix [401]. In this study the chance and
degree of impact are sored according to their influence on the risk and the risk matrix
aggregates those scores and put them into an overall risk score [402]. The figure 4.11
below shows the reformatted risk –based grid However, the risk-based grid in figure 4.11
below involves crunchy values, but in practice, the chance and degree of impact inputs
often involve inaccurate values. Therefore to solve this problem, this study reformulated
what it term as the fuzzy risk matrix by replacing the crunchy inputs and output with fuzzy
inputs and output [403].

121
Figure 4.10 Reformulated Fuzzy Risk Matrix
Source: reformatted by the author based on [403]
The matrix in figure 4.10 above have been reformatted to make it suitable for
estimating the risk of financing business-project by this study (fig. 4.11).

122
Figu
re 4
.11
– B
usin
ess p
roje
ct F
inan
cing
Ris
ks M
odel
ling
– Ph
ase
1
Sour
ces:
dev
elop
ed b
y th
e au
thor

123
The reformulated fuzzy matrix in figure 4.11 shows that a risk estimate with a
score from 0.1 to 0.25 is an indication of a very low risk the accumulation of all the risks
will be 100% chance thus, idea risk, competency risk and return on investment risk of
occurring in the course of the business project life cycle. However, an estimated score
from 0.75 and above is an indication of a very high risk which also has a 100%, chance in
the case of idea risk, competency risk and return on investment risk occurrence in the
course of the business-project life cycle. Also, the figure 4.12 below show the degree of
impact associated with each chances score of the three risks indicators.
Figure 4.12 – Chance of Risk Occurring
Source: developed by the author
Further, the below figure 4.13 revealed that the degree of impact in an event of
any of the three key risk indicators occurring could range from: insignificant, average,
serious, extreme or catastrophic. This show how important to accurately estimate each of

124
the three identified risks indicators before funding any business-project. Further, this study
has reformulated the fuzzy logic to demonstrate how the chances and degree of impact
could represent the description of the three risk indicators.
Figure 4.13 – Degree of Risk Scores Impact
Source: developed by the author
Further, figure 4.14 below confirms the chance, degree of impact and risk scores,
as well as that the three risk indicators can fall in either of the following categories: very
low, low, normal, high or very high.
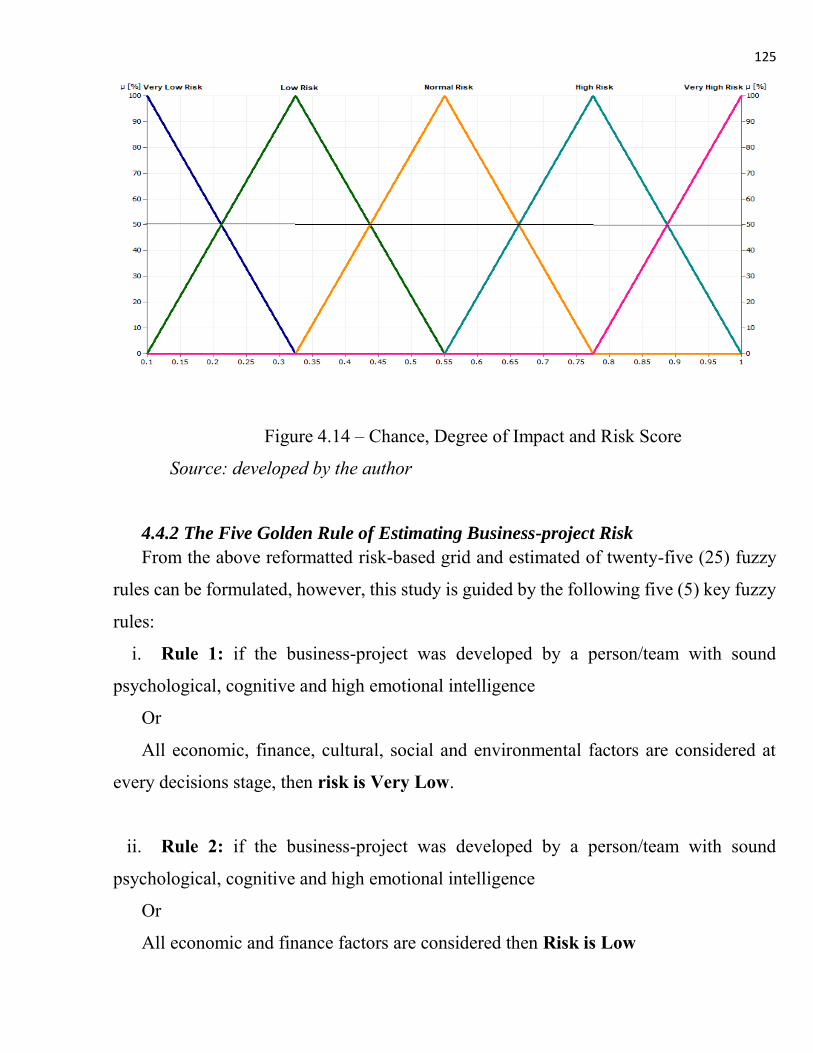
125
Figure 4.14 – Chance, Degree of Impact and Risk Score
Source: developed by the author
4.4.2 The Five Golden Rule of Estimating Business-project Risk
From the above reformatted risk-based grid and estimated of twenty-five (25) fuzzy
rules can be formulated, however, this study is guided by the following five (5) key fuzzy
rules:
i. Rule 1: if the business-project was developed by a person/team with sound
psychological, cognitive and high emotional intelligence
Or
All economic, finance, cultural, social and environmental factors are considered at
every decisions stage, then risk is Very Low.
ii. Rule 2: if the business-project was developed by a person/team with sound
psychological, cognitive and high emotional intelligence
Or
All economic and finance factors are considered then Risk is Low

126
iii. Rule 3: if the business-project was developed and is being managed by highly
educated, experienced and well-informed person / team
Or
Incorporates modern technology in its operation, then Risk is Average
iv. Rule 4: if the business-project was developed by a person/team with poor
psychological, cognitive and high emotional intelligence
Or
Ignores most economic / finance factors in decision making, then Risk is High
v. Rule 5: if business-project was developed by a person / team with little or no
finance and economics knowledge
Or
Being managed by low or uneducated, inexperience and ill-informed person / team,
and does incorporate modern technology in its operation, then Risk is Very high.
Basing on the above five-point rules, the inter-connections among the risks are shown
in figure 4.15 blow to their fast center area of risk categories. The figure 4.16 below
reveals very important connections among the various categories of risks. The figure
shows that any of the three risk indicator with a score from 0.83 and above is in very high
risk category and will require management to set-up control measures and operation
efficiency by 80% or more to be able to reduce its impact to a high risk, then afterwards a
further 67% step-p control measures would bring it to normal risk. Also, any score from
0.65 is in a high risk category. Also, a risk score of 0.55 is an indication of a normal risk,
while a score of 0.40 and 0.275 indicates low and very low risks respectively. However,
a 67% step-up in control measures and operation efficiency is expected to reduce a normal
risk to very low risk, while a 50% step-up will reduce a normal risk to low risk.

127
Figure 4.15 – Center Area of Risk Categories
Source: developed by the author
Also, the figure 4.16 below illustrates the holistic business-project financing curve
based on the results of Fuzzy risk matrix.
Figure 4.16 – Business Project Financing Curve
Source: developed by author
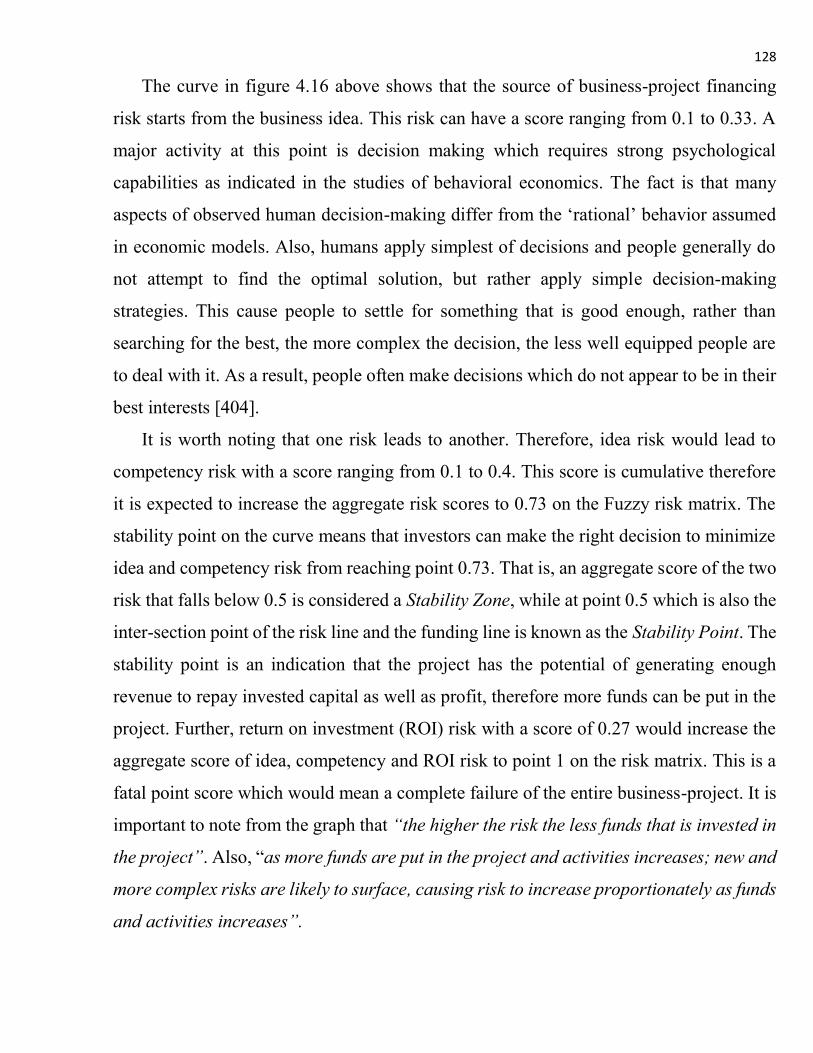
128
The curve in figure 4.16 above shows that the source of business-project financing
risk starts from the business idea. This risk can have a score ranging from 0.1 to 0.33. A
major activity at this point is decision making which requires strong psychological
capabilities as indicated in the studies of behavioral economics. The fact is that many
aspects of observed human decision-making differ from the ‘rational’ behavior assumed
in economic models. Also, humans apply simplest of decisions and people generally do
not attempt to find the optimal solution, but rather apply simple decision-making
strategies. This cause people to settle for something that is good enough, rather than
searching for the best, the more complex the decision, the less well equipped people are
to deal with it. As a result, people often make decisions which do not appear to be in their
best interests [404].
It is worth noting that one risk leads to another. Therefore, idea risk would lead to
competency risk with a score ranging from 0.1 to 0.4. This score is cumulative therefore
it is expected to increase the aggregate risk scores to 0.73 on the Fuzzy risk matrix. The
stability point on the curve means that investors can make the right decision to minimize
idea and competency risk from reaching point 0.73. That is, an aggregate score of the two
risk that falls below 0.5 is considered a Stability Zone, while at point 0.5 which is also the
inter-section point of the risk line and the funding line is known as the Stability Point. The
stability point is an indication that the project has the potential of generating enough
revenue to repay invested capital as well as profit, therefore more funds can be put in the
project. Further, return on investment (ROI) risk with a score of 0.27 would increase the
aggregate score of idea, competency and ROI risk to point 1 on the risk matrix. This is a
fatal point score which would mean a complete failure of the entire business-project. It is
important to note from the graph that “the higher the risk the less funds that is invested in
the project”. Also, “as more funds are put in the project and activities increases; new and
more complex risks are likely to surface, causing risk to increase proportionately as funds
and activities increases”.

129
Every business-project is made up sets of systems which coordinates to achieve a sets
goals to deliver value. Therefore, this study has developed business-project The financing
risk system model as show in figure 4.17 below.
Figure 4.17 – Business Project Financing Risk System Model
Source: developed by the author
Developed system model would ensure that the aggregate scores of the three risks do
not go beyond the stability point. Thus, to resist the soaring of risks scores and impacts
on business-projects. Estimating risk is the stepping-stone to control all risks. It is the core
of managing any business-project; it is an important responsibility for project managers
130
and investors to consider doing it with highly experienced risk analysts rather than just
delegating to mere employees. The system model shows that managing risk is about
making the tactical and strategic decisions to manage risk which is at the core of business-
project financing. Such function is too important a responsibility for a firm to delegate.
Further, managing risk is about making the tactical and strategic decisions to control
those risks that should be controlled and to exploit those opportunities that can be
exploited through effective coordination and analysis of all risk factors and indicators in
the system. The model above also shows that although the quantitative aspect of risk
estimation is highly important, it also requires the application of tools and activities which
generally involves in reality and risk management such as managing and analyzing people,
processes, technology, social and environmental factors, knowledge etc. to know how
these factors coordinates with the risk indicators to cause threats or opportunities are
equally important.
It is highly important for this study to state the three primary functions of the above
risk system model shown in figure 4.17. The functions are as follows:
i. It helps to discover known and unknown risks involved in business-projects – that
is the above model would aid in identifying and understanding risks through careful
study and analysis. These risks or similar risks have been experienced in the past in many
business-projects and this justifies their inter-connectedness and degree of its occurrence.
ii. It also make the known risks stress-free to comprehend, realize, and associate with
particular business-projects to facilitate quick decision making.
iii. It further boost efforts to understand and uncover the unknown or unanticipated
risks – because it captures risks that most business-project managers and investors have
not experienced before and offers control risk control measure
Testing the how these risks also apply to other earlier developed models, this study
has further developed the business case life cycle – need for a project model. This is shown
in fig. 4.18 below. The figure reveals that the first phase of every project is dominated by
idea risk. The ability to reduce / control this risk is highly dependent on the competency
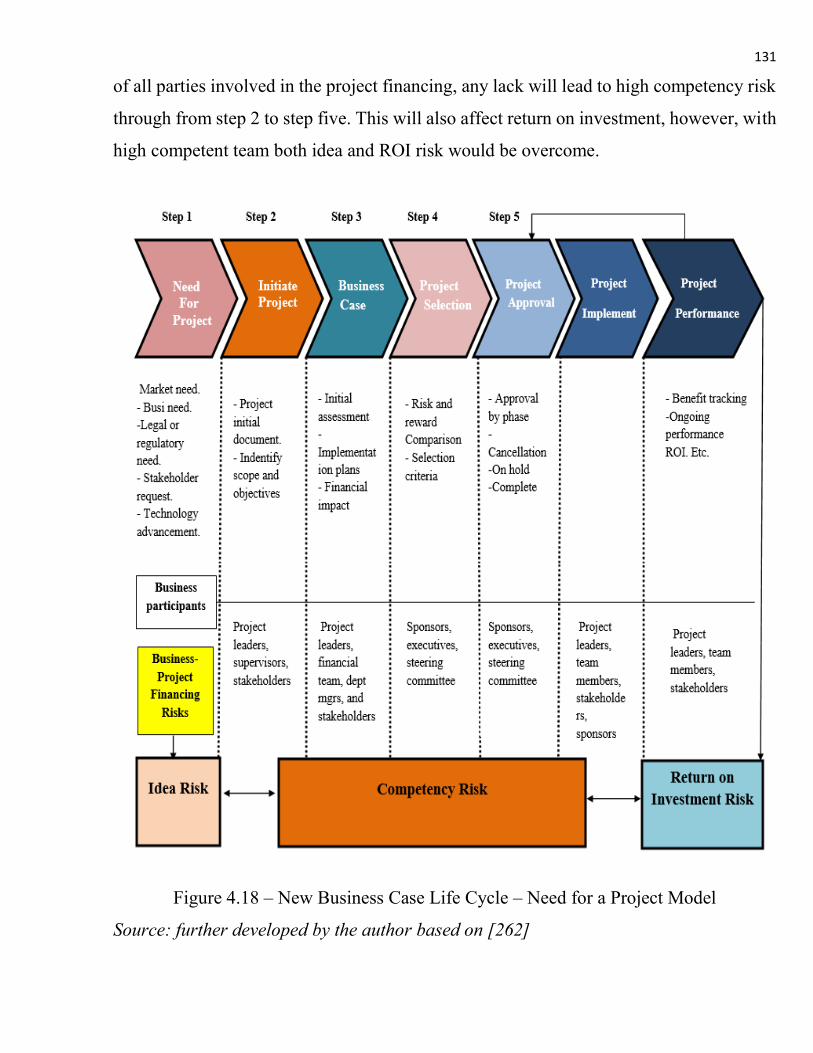
131
of all parties involved in the project financing, any lack will lead to high competency risk
through from step 2 to step five. This will also affect return on investment, however, with
high competent team both idea and ROI risk would be overcome.
Figure 4.18 – New Business Case Life Cycle – Need for a Project Model
Source: further developed by the author based on [262]

132
Conclusions
Managing risk is about making the tactical and strategic decisions to control those
risks that should be controlled and to exploit those opportunities that can be exploited
through effective coordination and analysis of all risk factors and indicators in the system.
The models developed in this study shows that although the quantitative aspect of risk
estimation is highly important, it also requires the application of tools and activities which
generally involves in reality and risk management such as managing and analyzing people,
processes, technology, social and environmental factors, knowledge etc. to know how
these factors coordinates with the risk indicators to cause threats or opportunities are
equally important.

133
CHAPTER FIVE FINDINGS AND RECOMMENDATIONS
5.1 Introduction
Small and Medium Enterprises need finance to meet their business-projects financing
requirements in the current knowledge economy. Therefore, finance is seen as the
lifeblood of business-project activities in every economy; particularly in developing
economies which have very limited access to funding. Project finance is very good at
funding specific investments in certain industries. Typically, majority of project finance
is used for capital-intensive infrastructure investments that employ established technology
and generate stable returns, preferably returns that are denominated in or can be easily
converted to hard currencies. Empirical studies have shown that one comparative
advantages of project finance is that it allows the allocation of specific project risks (that
is completion and operating risk, revenue and price risk, and the risk of political
interference or expropriation) to those parties who are able to manage them. Major
business-projects such as oil and gas, infrastructure, manufacturing and information
technology are in most cases being organized within small, medium and large individual
organizations. Business-projects are unique undertakings which involve a high degree of
uncertainty due to the constantly changing nature of the global business environment
caused by advancement in technology. The high rate of uncertainty that characterizes
business-projects causes the actual outcome of a particular business-projects event or
activity to likely deviate from the estimate or forecast value. This makes decision making
become more difficult as uncertainty grows. However, the availability of relevant
information to aid risk estimation and increases the predictability all potential risks and
reduces uncertainty. This means that business-project value delivery and profitability
largely depend on successful estimation of all associated risks and effective control of all
such known and unknown risks of financing the project.

134
5.2 The Main Result of the Research This study through literature review, data collection and analysis have produced the
following results:
i. Have identified the twelve (12) primary risks factors that could create threats or
opportunities when estimating the risks of financing business-projects are: innovation /
uniqueness risks; acceptability / adoptability risk; technology risks; set-up / operation
risks; technical / creativity risks; management risks; comprehension risks; social /
environment risk; financial risk; economic risk, political and legal risks; and culture /
tradition risks.
ii. Base on the above identified twelve (12) risk factors, the study has developed the
dodecagon model of business-project financing risks.
iii. Also, the study results also showed that the identified twelve (12) risk factors can
be further grouped into three main risk indicators as: idea risk, competency risk and return
on investment risk.
iv. The results also proved that the three risk indicators constitute what can be termed
as business-project financing risk triangle.
v. Further, the study revealed that there is no zero risk (risk free) business-project /
investment.
vi. Suing Fuzzy logic matrix scale from 0.1 to 1, idea risk had a score of 0.33;
competency risk scored 0.4; while ROI risk also scored 0.27. This give an aggregate total
risk score of 1 or 100%.
vii. The study also resulted in the developed of business-project financing risk graph.
The graph also produces the following: the risk curve, financing curve, stability point,
stability zone, and risk and return zone.
viii. The graph shows that high risk means less funds will be invested, but above the
stability point some investors may invest more funds regardless of the risk score.
ix. This study results also proved that there is a strong connection among the three
identified risks indicators.

135
x. Also, the study resulted in the development of a comprehensive system model that
represent the three risk indicators. And a further development of the need for a project
model
It is very important to also state that this study is mainly about the estimation of the
risk of financing small and medium enterprises (SMEs) business-projects in terms of
behavioral economics: using the integral estimation method and fuzzy rule; to determine
the most influential (most essential) financing risks factors that developing economies,
project sponsors and managers must know in other to achieve business-projects success
in the current knowledge economy. One key driver of project financing in recent time this
study also identified is the fastest pace in which the world’s economy is growing.
However, project financing has suffered a major decline in recent years due to the
uncertainty (risks) surrounding macro-political events which have dominated news
headlines throughout the world. The study observed that a business-project may be subject
to a number of technical, environmental, economic and political risks, particularly in
developing countries and emerging markets. This may cause financial institutions and
project sponsors to conclude that the risks inherent in business-project development and
operation are unacceptable.
Also, this study observed that developing countries face huge annual business-project
financing gap in most sectors relevant to achieve sustainable development. However, an
effective and accountable corporate-government engagement can help to pull resources,
build the trust and strengthen the capacities that are required to fill this gap. Unfortunately,
this study observed that the Ghana Youth Employment program lack the capacity to fill
the financing gap the program face. Additionally, a critical observation about the program
in Ghana revealed high political and legal risk. The program has seen a lot of financing
and financial management threat which is similar to the famous Enron case. Frankly,
projects failure rate in Ghana is on the high side, with no exception of Ghana government
projects where several reported case of Ghana government projects failure have been
recorded over the past years. At least one out of every three infrastructural development

136
projects in Ghana either fails or is not able to achieve one of the objectives. This can be
attributed to inadequate or poor funding mechanism and poor management and
administration practices as major factors that contribute to Ghana government projects
failure. The study further observed that there appear to be a missing link between the
estimations of the risks of financing business projects and business-project financing in
developing economies. This has led to much difficulty in getting funds released from
donor partners and agencies; while some investors have stated that developing economies
lack project development capacity.
This study results also proves the need to emphasize that all investments in business-
projects are associated with risk, ranging from very low to very high risk. Therefore, all
investors should be prepared for a situation where an investment business project would
result in a loss or higher profitability. Also, individual business-projects risk can be
controlled up to 80-90 per cent. Such control measures will motivate investors to make
larger investments and increases potential high returns. Further, the control will make
known all risks related to the investment through proper estimation of all financing risks.
Additionally, it must be noted that all business-projects involve in operating in a
competitive environment together with a number of other complex players and actors.
Therefore, the demand for or the pricing of any business-project value before completion
is impossible. Further, there is always a chance that the new and complex risks may pop
up before, during and after completion of the business-project. For example: new
legislation or regulations may be proposed and passed which can impact the business
project and may require that a substantial changes be made to the economic lifetime and
earnings potential the project. More so, the success of most individual business-projects
will often depend on the fund manager's in identifying sound investment ventures.
However, changing key project team members may affect the business-project ability
attract adequate funds or negatively impact the project’s ability to generate the expected
earnings. Most importantly, this study discovered that one major risk of business-projects
financing is that the project manager / team members may lack the competency require to

137
make the right decisions about the investments and realizations in the project that later
turn out to be poor relative to the prediction, and which will affect investment yield
negatively.
5.3 Main Findings This study showed that the psychological state of the entrepreneur or the project team
as well as their competency and the level of knowledge on economic factors is the
foundation to building an effective risk estimation measures to ensure the sound financing
of business-project. It also came to light that the three major risk confronting all business-
projects in developing economies, particularly the Ghana youth employment program are
idea risk, competency risk and return on investment risk. Also, there exist difference
among the risk indicators in terms of their impacts when estimating the risk of financing
SME business-project and these risks have substantial impact on SMEs business-project
financing in developing economies. Additionally, the study measure reveals a positive
significant correlation between the total scores of the risk indictors and this would aid the
prediction of the relation between the indicators used to estimate the risk of financing
SMEs business-projects. Also, the study finding showed that using the three indicators
can help to estimate the risk of financing SMEs business-projects; irrespective of the
volume funds provide and location of the project significantly. Further, the study also
revealed that there is the presence of well-built positive relationship among the risk
indicators of financing SMEs business-projects. This attests that the decision to finance
or not to finance SMEs business-project can be estimated; after a careful analysis of the
three key risk indicators with regard to information contain in the business-project plan.
The study further revealed that financing of business-projects in developing
economies, particularly the Ghana youth employment program is prone to idea risk,
competency risk and return on investment risk. The study also revealed that the degree of
impact in the event of any of the three key risk indicators occurring could range from:
insignificant, average, serious, extreme or catastrophic. This shows how important to

138
accurately estimate each of the three identified risks indicators before funding any
business-project. Qualitatively, the study further discovered the following guiding rules
of estimating the risk of financing business-projects.
vi. Rule 1: if the business-project was developed by a person/team with sound
psychological, cognitive and high emotional intelligence
Or
All economic, finance, cultural, social and environmental factors are considered at
every decisions stage, then risk is Very Low.
vii. Rule 2: if the business-project was developed by a person/team with sound
psychological, cognitive and high emotional intelligence
Or
All economic and finance factors are considered then Risk is Low
viii. Rule 3: if the business-project was developed and is being managed by highly
educated, experienced and well-informed person / team
Or
Incorporates modern technology in its operation, then Risk is Average
ix. Rule 4: if the business-project was developed by a person/team with poor
psychological, cognitive and high emotional intelligence
Or
Ignores most economic / finance factors in decision making, then Risk is High
x. Rule 5: if business-project was developed by a person / team with little or no
finance and economics knowledge
Or
Being managed by low or uneducated, inexperience and ill-informed person / team,
and does incorporate modern technology in its operation, then Risk is Very high.
The study further discovered quantitatively that any of the three risk indicator with a
score from 0.83 and above is in very high risk category and will require management to
set-up control measures and operation efficiency by 80% or more to be able to reduce its

139
impact to a high risk, then afterwards a further 67% step-p control measures would bring
it to normal risk. Also, any score from 0.65 is in a high risk category. Also, a risk score of
0.55 is an indication of a normal risk, while a score of 0.40 and 0.275 indicates low and
very low risks respectively. However, a 67% step-up in control measures and operation
efficiency is expected to reduce a normal risk to very low risk, while a further 50% step-
up will reduce a normal risk to low risk. It is worth noting that one risk leads to another.
Therefore, idea risk would lead to competency risk with a score ranging from 0.1 to 0.4.
This score is cumulative, therefore it is expected to increase the aggregate risk scores to
0.73 on the Fuzzy risk matrix. The stability point on the curve means that investors can
make the right decision to minimize idea and competency risk from reaching point 0.73.
That is, an aggregate score of the two risk that falls below 0.5 is considered a Stability
Zone, while at point 0.5 which is also the inter-section point of the risk line and the funding
line is known as the Stability Point.
5.4 The Novelty of the Findings and its Advantages in Helping to Solve Current Problems
The current situation surrounding business-financing is unfavorable as economic,
social and technology advancement continues to place more pressure on profit margins
and the industry’s competitive forces continue to intensify. Therefore, financing business-
project in developing economies, particularly the Ghana youth employment program will
requires effective tools to carefully estimate the risk of financing such project to guarantee
and attract sufficient funding and ensure a continuous future inflow of funds, delivery of
high quality value and profitability. In view of this the study can conclude that effective
estimation of the risk of financing business-project would play a major role in attracting
funding as well as guaranteeing higher return on investment in business-projects. Further,
the study have developed four scientifically-based models, these are: Dodecagon of
business-project financing risk; Business-project financing risk triangle; Business-project
risk block; Business-project financing curve, and the Business-project financing risk

140
system model. After systematic applications of all the developed models to estimate the
risk of financing business-project, this study can conclude that these models are the most
effective instrument that can effectively estimate the risk of financing business-projects.
Further, these models are applicable in all business-project financing risk estimation and
should be adapted by all individuals, organizations/entities, project developer/investors as
well as all stakeholders who are involved in business-project financing and management.
5.5 Recommendations Based on the research findings and data analyzed the following recommendations are
made to ensure the effective estimation of the risk of financing business-project,
particularly the Ghana youth employment program.
i. All stakeholders involved in financing business-project should pay critical
attention to the twelve (12) identified risk factors and the three identified risk indicators
to ensure sound business-project investment decision making.
ii. The Ghana Youth Employment Agency and all business-project actors should
follow the systematic approach applied in this study to estimate the risk of financing all
business-project. This will help to identify new and more complex risks that may pop up
in the course of the project implementation.
iii. Also, all business-project financing should incorporate fully all the developed
models at every stage of estimating risks.
iv. Further, critical attention must be paid to the psychological and cognitive state
of all persons seeking funding to execute business-projects and those who will manage
the funds, thus the project team.
v. Additionally, the competency of the entrepreneur/ project team members must to
thoroughly analyze before committing any funds into the project.
vi. Also, governments must ensure sound economic policies and serene business
environment to guarantee the security and safety all business-project undertaken, all
persons involved as well as higher return.

141
vii. More so, Business-project investors must know their risk tolerance level so as to
avoid fatalities.
viii. Furthermore, all parties involved in the implementation of business-project must
assume financing risk responsibilities in proportion to the value or benefit they will enjoy.
ix. Additionally, investors must consider investing in multiple business-project
portfolios to help spread financing risk.
x. In furtherance, continuous risk assessment must be carried out throughout the
entire business-project life cycle.
xi. Also, effective risk control systems must also be put in place to facilitate the early
detection of all potential risks.
xii. Further, entrepreneurs seeking funding for business-projects must ensure they
apply for the right funding type, and should not settle for unfavorable lending terms.
In supposition, this study recommend that all business-project financing actors
undertaking systematic estimation of business-projects business-project financing risks by
applying the appropriate model(s) developed by this study before putting funds in any
such venture. It is therefore, a sound decision to invest in business-projects after thorough
financing risk estimation because business-projects implementation constitutes the
backbone of every strong economy, and has the potential to generate higher profitability,
particularly in developing economies.
142
REFERENCE 1. Joseph A. (2015) Multi-Metric Definition of Knowledge Economy. Project
Management and Development of the Collection of Scientific Papers Journal, UDC
005.94:005.22. Available at:
http://www.pmdp.org.ua/images/Journal/53/9%20text_Asare.pdf.
2. Habib, M. A., and Johnsen, D. B. (1999). The financing and redeployment of specific
assets. Journal of Finance, 2, 96–131.
3. David Gardner and James Wright, “Project Finance,” in HSBC. Available at:
http://www.hsbcnet.com/gbm/attachments/productsservices/financing/project-
finance.pdf
4. John W. Kensinger and John D. Martin. “Project Finance: Raising Money the Old-
Fashioned Way,” in Donald H. Chew, Jr., ed. 1993. The New Corporate Finance: Where
Theory Meets Practice. New York: McGraw-Hill, p. 326.
5. Stefanie K. and William L. M., (2002). An Empirical Analysis of Limited Recourse
Project Finance. Maastricht: METEOR, Maastricht University School of Business and
Economics, 2002. (METEOR research memorandum; No. 066. Research
output: Professional Working paper
6. Esty B. C. and Mathew M. M., (1998). Petrolera Zuata, Petrozuata C.A. Harvard case
number 299-012. Publisher: Harvard Business School Press.
7. Esty, B. C., and Sesia, A. (2007). An overview of project finance and infrastructure
Wnance—2006 update. Cambridge, MA: Harvard Business School Teaching Note 9-207-
107
8. Stefano Gatti (2008) Project Finance in Theory and Practice, Designing, Structuring,
and Financing Private and Public Projects. Academic Press is an imprint of Elsevier 30
Corporate Drive, Suite 400, Burlington, MA 01803, USA 525 B Street, Suite 1900, San
Diego, California 92101-4495, USA. ISBN 13: 978-0-12-373699-4

143
9. Latham, Watkins & Co. (2017). Project Finance Report 2017. International Financial
Law Revie, Available at: https://www.lw.com/admin/Upload/Documents/IFLR-PF2017-
Full-Guide.pdf
10. National Research Council. 2005. The Owner's Role in Project Risk Management.
Washington, DC: The National Academies Press. https://doi.org/10.17226/11183.
11. Marco S., (2004). The nature of credit risk in project finance. BIS Quarterly Review,
December 2004.
12. Lin Tom C. W., (2011). A Behavioral Framework for Securities Risk. 34 Seattle
University Law Review 325 (2011) . Available at
SSRN: https://ssrn.com/abstract=2040946
13. Rach V, Rach D.(2014). Risk management in project implemented in transitional
economy: Financial products for the real sector in Ukraine. Proc. of International
Conference. Kyiv. 2014;25-26.
14. Morris P.W.G., Pinto, J.K., Soderlund, J. (Eds.), (2012). The Oxford Handbook of
Project Management. Oxford University Press, Oxford, UK.
15. Rosacker K.M and Rosacker E.R., (2010). Information technology project
management within public sector organizations", Journal of Enterprise Information
Management, Vol. 23 Issue: 5, pp.587-594, https://doi.org/10.1108/17410391011083047
16. Crawford L, Costello K., Pollack J., and Bentley L., (2003). Managing Soft Change
Projects in the Public Sector. International Journal of Project Management. 21. 443-448.
10.1016/S0263-7863(02)00099-6.
17. Baranskaya A., (2007). Project Management in Public Administration of Transitional
Countries. Moscow State University, School of Public Administration, Russia
18. Ama Lawani, (2016) Project Management Practices in Government Organizations of
Developing Countries: A Systematic Review. The International Journal of Business &
Management, ISSN 2321–8916, Vol4. Issue 9
19. Graham, R. J., and Englund, R. L. (2013). Creating an environment for successful
projects. Publisher: John Wiley & Sons

144
20. Project Management Institute, (2013). A Guide to the Project Management Body of
Knowledge (PMBOK Guide). 5th edition. Publisher: Project Management Institute, Inc.
ISBN: 978-1-935589-67-9
21. Milosevic, D., and Iewwongcharoen, B. (2004). Management tools and techniques:
The contingency use and their impacts on project success. Proceedings of the 3rd PMI
Research Conference, London, England.
22. Rwelamila, P., and Purushottam, N. (2012). Project management trilogy challenges in
Africa—Where to from here? Project Management Journal, 43(4), 513.
23. Abbasi, G. Y., and AlMharmah, H. (2000). Project management practice by the public
sector in a developing country. International Journal of Project Management, 18(2),
105109.
24. Ofori, D., and Deffor, E. W. (2013). Assessing project management maturity in
Africa: A Ghanaian perspective. International Journal of Business Administration, 4(6),
41.
25. Rondinelli, D. A. (1976). Why development projects fail: problems of project
management in developing countries. Project Management Quarterly, 7(1), 10—15.
26. Mandri-Perrott, X. C. (2009). Optimising project finance solutions in the water sector:
suggestions for enhanced public private partnership Groningen: s.n.
27. Bhattacharyay, B. (2008). Infrastructure and Regional Cooperation Concept Paper for
ADB/ADBI Flagship Study.
28. McManus, J. & Wood-Harper, T. (2008). A study in project failure. Available at:
http://www.bcs.org/server.php?show=ConWebDoc.19584
29. Asay, M. (2008). The UK has wasted over $4 billion on failed IT projects since 2000.
Available at: http://news.cnet.com/8301-13505_3-9840497- 16.html
30. Heeks, R. (2002). Failure, Success and Improvisation of Information System Projects
in Developing Countries. Development Informatics Working Paper Series, No.11/2002.
Manchester, UK: Institute for Development Policy and Management

145
31. Cannon, J., (1994) Why IT applications succeed or fail: The intersection of technical
and organisational factors. Industrial and commercial training, 26 (1), 10-15
32. Kam Jugdev; Ralf Müller (2005) A retrospective look at our evolving understanding
of project success. Project Management Journal; 36, 4; ABI/INFORM Globa pg. 19
33. Jane Nelson (2014). Innovative Platforms for Public Private Dialogue. Session1i: How
can Multinationals Engage with Governments to Support Economic Development? 2014
Brookings Blum Roundtable. Available at: https://www.brookings.edu/wp-
content/uploads/2014/08/Session-1-Dialogue-Nelson_FINAL.pdf
34. Amid, A., Moalagh, M. & Ravasan, A. Z. (2012). Identification and classification
of ERP critical failure factors in Iranian Industries. Journal of Information Systems, Vol.
37, No. 3; pg.227-237
35. Ahsan, K. & Gunawan, I. (2010). Analysis of cost and schedule performance of
international developmental projects. International Journal of Project management,
Vol. 28, No. 1; pg. 68–78
36. Kaliba, C., Muya, M. & Mumba, K. (2009). Cost escalation and schedule delays
in road construction projects in Zambia. International Journal of Project
Management, Vol.27, No. 5; pg.522–531
37. Mangione, C. (2003). Software Project Failure: The Reasons, The Costs.
Available at: www.cioupdate.com/reports/article.php/1563701/Software-
38. Patanakul, P. (2014). Managing large-scale IS/IT projects in the public sector:
Problems and causes leading to poor performance. Journal of High Technology
Management Research, Vol.25, No.1; pg. 21-35
39. Kumar, R. & Best, M. L. (2006). Impact and Sustainability of E-Governement
Services in Developing Countries: Lessons Learned from Tamil Nadu, India. The
Information Society, Vol.22, pg. 1-12
40. Kahraman, Berna (2011). Youth Employment and Unemployment in Developing
Countries: Macro Challenges with Micro Perspectives. Graduate Doctoral Dissertations.
Paper 36. Available at: http://scholarworks.umb.edu/doctoral_dissertations

146
41. World Employment and Social Outlook 2016: Trends for youth. International Labour
Office – Geneva: ILO, 2016. ISBN 978-92-2-131277-2
42. O‘Higgins N., (2001). Youth Unemployment and Employment Policy - A Global
Perspective, ILO, Geneva, Switzerland.
43. World Bank (2008). Republic of Ghana Joint IDA-IMF Staff Advisory Note on the
Poverty Reduction Strategy Paper, Annual Progress Report, Report No. 42865-
GH,http://siteresources.worldbank.org/INTPRS1/Resources/383606-
1165869436599/Ghana1stAPRandJSAN.pdf
44. Ransford Gyampo, (2012). Youth Participation in Youth Programmes: The Case of
Ghana’s National Youth Employment Programme. Published in: The Journal of Pan
African Studies, vol.5, no.5, 2012.
45. Bank of Ghana, (2006-2012). Average Annual Exchange Rates (US$). Available at:
http://www.ghanatrade.gov.gh/Trade-Data/average-annual-exchange-rates-us-2006-
2012.html
46. Ministry of Youth and Sports Report, (2013). Ministerial Impact Assessment &
Review Committee on Ghana Youth Employment and Entrepreneurial agency
(GYEEDA)
47. Palmer, P and Robert. C. (2007). Skills Development, the Enabling Environment and
Informal Micro-Enterprise in Ghana, The University of Edinburgh,
http://www.era.lib.ed.ac.uk/bitstream/1842/1698/1/Palmer%2520R%2520thesis%25200
7.pdf
48. Seth K. S., (2013). The GYEEDA Report for the Busy Citizen. Available at:
http://www.ghanaweb.com/GhanaHomePage/features/The-GYEEDA-Report-for-the-
Busy-Citizen-281405
49. Ofori D. and Deffor E.W., (2013). Assessing Project Management Maturity in Africa:
A Ghanaian Perspective. International Journal of Business Administration Vol. 4, No. 6;
2013.
147
50. The Eight Hundred and Eighty-Seventh ACT of the Parliament of the Republic of
Ghana. Entitled youth Employment Agency ACT 2015. Available at:
https://www.yea.gov.gh/index.php/en/about-us/the-act
51. Abu Mubarik (2016). Unemployment in Ghana. 48% of Ghanaian youth jobless -
World Bank report (2016). Published: Pulse News, 12.05.2016 , Refreshed: 13.05.2016.
Available at: http://www.pulse.com.gh/business/unemployment-in-ghana-48-of-
ghanaian-youth-jobless-world-bank-report-id5026856.html?-1987560862.1500048477
52. Karam Pal, (Lesson No: 01). Management Concepts and Organizational Behaviour.
Subject Code: MC-101. Available at:
https://www.google.com.gh/search?rct=j&q=It+is+believed+that+that+development+is+
the+function+not+only+of+capital,+physical+and+material+resources,+but+also+of+th
eir+optimum+utilization+(Karam+Pal)&gws_rd=cr&ei=v8yNWb7vKqTNgAbowZrgB
Q
53. Kumar, R. & Best, M. L. (2006). Impact and Sustainability of E-Governement
Services in Developing Countries: Lessons Learned from Tamil Nadu, India. The
Information Society, Vol.22,
54. Kaliba, C., Muya, M. & Mumba, K. (2009). Cost escalation and schedule delays in
road construction projects in Zambia. International Journal of Project Management,
Vol.27, No. 5
55. Espiner T. (2007). Seven in 10 governments IT projects fail. Available at:
www.silicon.com/management/public-sector/2007/05/18/failed-sevenout-of-10-gov-it-
projects-39167189/
56. Asay, M. (2008). The UK has wasted over $4 billion on failed IT projects since
2000. Available at: http://news.cnet.com/8301-13505_3-9840497-16.html-
57. McManus, J. & Wood-Harper, T. (2008). Available at:
http://www.bcs.org/server.php?show=ConWebDoc.19584

148
58. Marzouk, M. M. and El-Rasas, T. I. (2013). Analyzing delay causes in Egyptian
construction projects. Journal of Advanced Research,
http://dx.doi.org/10.1016/j.jare.2012.11.005.
59. Sweis, G. Hammad, A. A. and Shboul, A. (2008). Delays in construction projects:
The case of Jordan. International Journal of Project Management, Vol. 26, No.6
60. Abednego, M. P. and Ogunlana, S. O. (2006). Good project governance for proper
risk allocation in public–private partnerships in Indonesia Original Research Article.
International Journal of Project Management, Vol. 24.
61. Atkinson, R. (1999). Project management: cost, time and quality, two best guesses
and a phenomenon, it’s time to accept other success criteria. International Journal of
Project Management, Vol.17, No.6
62. Amponsah, R. (2014). Critical Success Factors Influencing Projects in the Ghanaian
Public Sector. The international journal of Business and Management, Vol.2, No.5
63. World Bank (2012). Ghana Projects & Programs. Available at:
http://www.worldbank.org/en/country/ghana/projects
64. Isaac S. D., Cynthia A., Yusra M., (2015). Causes of government project failure in
developing countries – Focus on Ghana. The BAM2015 Conference Proceedings.
Available at: https://www.researchgate.net/publication/299537426
65. Palmer, P and Robert. C. (2007). Skills Development, the Enabling Environment and
Informal Micro-Enterprise in Ghana, The University of Edinburgh,
http://www.era.lib.ed.ac.uk/bitstream/1842/1698/1/Palmer%2520R%2520thesis%25200
7
66. Project Management Institute (2013). Pulse of the Profession In-Depth Report: �
The Impact of PMOs on Strategy Implementation
67. Daniel L. B., Daniel P., & Magnus M (2012). Financing small-scale infrastructure
investments in developing countries. DESA Working Paper No. 114.
ST/ESA/2012/DWP/114

149
68. Nicholas C., Adwoa B., and Yirenkyi‐Fianko., (2012) An evaluation of risk factors
impacting construction projects in Ghana. Journal of Engineering, Design and
Technology, Vol. 10 Issue: 3, pp.306-329, https://doi.org/10.1108/17260531211274693
69. Sambasivan M., and Soon Y. W., (2007). Causes and effects of delays in Malaysian
construction industry. International Journal of Project Management, 25(5), 517-526.
70. Isaac S. D. (2015). In investigation into the causes and effects of project failure in
government projects in developing countries: Ghana as a case study. A thesis submitted
in partial fulfilment of the requirements of Liverpool John Moores University for the
degree of Doctor of Philosophy. Available at:
http://researchonline.ljmu.ac.uk/4513/1/158244_2015%20Isaac%20Sakyi%20Damoah%
20PhD.pdf
71. Asare J. (2017). Approach to Assess and Select Small and Medium Enterprises
(SMEs) for Incubation on the Base of Angel Model – a Case on Developing Economies
and ENGINE Program. British Journal of Economics, Management & Trade. 17(3): 1-
28, 2017; Article no.BJEMT.31399 ISSN: 2278-098X.
72. Gentrit B. and Justina S. P., (2015). Defining Small and Medium Enterprises: a
critical review. Academic Journal of Business, Administration, Law and Social
Sciences. Vol 1, No 1. IIPCCL Publishing, Tirana-Albania. ISSN 2410-3918.
73. Hatten T.S. (2011).Small Business Management: Entrepreneurship and Beyond . 5th
ed. Mason: South-Western Cengage Learning.
74. Carter, S and Jones-Evans, D. (2006).Enterprise and Small Business: Principles,
Practice and Policy (2nd ed.).Harlow: Prentice Hall.
75. European Commission. (2005).The new SME definition: user guide and model
declaration section. Brussels: Office for Official Publications of the European
Communities.
76. Sam M. (2004). A review of SME financing schemes in Ghana, Presented at the
UNIDO Regional Workshop of Financing Small and Medium Scale Enterprises, Accra,
Ghana.

150
77. Boyan Jovanovic. (1982). Selection and the Evolution of Industry, Econometrica,
vol. 50, Issue 3, Publishere: Econometric Society.
78. Saburo K. et al. (200). Model for SME sector development."Proceedings of the 19th
International Conference of the System Dynamics Society. Vol. 13.
79. Najib Harabi. (2002). Determinants of Firm Growth: An Empirical Analysis from
Morocco, Solothurn University of Applied Sciences, Northwestern Switzerland
file:///C:/Users/Joseph/Downloads/Firmgrowth_Morocco%20(1).pdf
80. Pajarinen M., Petri R., and Hyytinen A., (2015). Does innovativeness reduce startup
survival rates? Journal of Business Venturing. Volume 30, Issue 4, July 2015, Pages 564-
581
81. Schumpeter, J. (1934), The Theory of Economic Development. Cambridge, MA:
Harvard University Press.
82. Barringer R. B and Bluedorn A. C., (1999). The Relationship Between Corporate
Entrepreneurship and Strategic Management. Strategic Management Journal. 20.
10.1002/(SICI)1097-0266(199905)20:5<421::AID-SMJ30>3.0.CO;2-O.
83. Baumol, W. and J. Benhabib. (1989). 'Chaos: Significance, mechanism, and
economic applications.
84. Lin Tom C. W., (2012). A Behavioral Framework for Securities Risk. 34 Seattle
University Law Review 325 (2011). Available at
SSRN: https://ssrn.com/abstract=2040946
85. Shefrin H., (2002). Behavioral decision making, forecasting, game theory, and role-
play. International Journal of Forecasting. 18: 375–382.
86. Gigerenzer G. and Selten R., (2002). Bounded Rationality: The Adaptive Toolbox.
MIT Press. ISBN 0-262-57164-1.
87. Thaler R.H. and Sunstein C.R. (2008). Nudge: Improving Decisions about Health,
Wealth, and Happiness. Yale University Press. ISBN 978-0-14-311526-
7. OCLC 791403664.
151
88. Thaler R.H., Sunstein C.R. and Balz J.P., (2010). Choice
Architecture. Doi:10.2139/ssrn.1583509. SSRN 1583509.
89. Ivan Thompson (2014). Definition of Finance. Available at:
http://www.managementguru.net/meaning-and-definition-of-finance/
90. Khan M.Y. & Jain P. K.,(2005). Basic Financial Management. 2nd Edition Published
by Tata McGraw-Hill Education Pvt. Ltd. SBN 10: 0070599432.
91. Paramasivan C. and Subramanian T. (2009). Financial Management. Publisher: New
Age International Publishing Limited. New Delhi, India.
92. Paish F.W., (1982) Business Finance. Publisher: Financial Times Prentice Hall; 6th
edition (April 1, 1982) ISBN-10: 0273017683.
93. John J.H. (1989) Financial Decision Making: Concepts, Problems, and Cases (4th
Edition) 4th Edition. ISBN 0133152502 (ISBN13: 9780133152500)
94. Howard M. & Upton B. B., (1953). Introduction to Business Finance. Publisher:
McGraw-Hill, ISBN-10: 007030534X
95. Banaras Hindu University (1975). Paper – VI : financial management unit – I, lesson
– 1 Finance – an introduction. Financial Management - Financial Management
Introduction - Notes - Finance, Study notes for Business Administration. Available at:
http://www.pondiuni.edu.in/storage/dde/downloads/mbaii_fm.pdf
96. BusinessDictionary. Available at:
http://www.businessdictionary.com/definition/financing.html
97. Wang J. (2006). Introduction to Finance. Lecture Notes 15.401. Chapter 1. Available
at: http://people.hss.caltech.edu/~jlr/courses/BEM103/Readings/JWCh01.pdf
98. Hira W. (2015). Difference between Funding and Financing. DifferenceBetween.net.
Avialble at: http://www.differencebetween.net/business/difference-between-funding-
and-financing
99. Hofstrand D. (2013). Types and Sources of Financing for Start-up Businesses. File
C5-92. Ag Decision Maker. IOWA State University College, Extension and Outreach.

152
100. Sarieddine Y. (2016). Types and Sources of Financing for Start-up and SME
Businesses. Available at:
http://website.aub.edu.lb/fafs/fafs_home/NewsEvents/Documents/2017News/Types%20
and%20Sources%20of%20Financing%20for%20Start-Up.pdf
101. Lucia C. and Miriam K., OECD, (2015). New Approaches to SME and
Entrepreneurship Financing: Broadening the Range of Instruments. Report transmitted to
G20 Finance Ministers and Central Bank Governors at their meeting on 9-10 February
2015 in Istanbul.
102. Berger A.N. and Udell G.F. (2002). Small business credit availability and
relationship lending: The importance of bank organizational structure. Economic Journal
112, F32-F35
103. Uchida H., Udell, G. F. and Yamori N., (2006). SME financing and the choice of
lending technology. RIETI Discussion Paper Series 06-E-025, the Research Institute of
Economy, Trade, and Industry.
104. OECD, (2006). The SME Financing Gap. Theory and Evidence, Volume I, OECD,
OECD Publishing.
105. OECD, (2013). Alternative Financing Instruments for SMEs and entrepreneurs: The
case of Mezzanine Finance, OECD, Paris, CFE/SME(2012)9/FINAL
106. Eugene F. B. and Joel F. H., (2013). Fundamentals of Financial Management.
Concise 8th Edition. Library of Congress, Control Number: 2013952744. Student Edition
ISBN 13: 978-1-285-06514-4
107. Kuchhal S. C., (1971). Financial Management: An Analytical and Conceptual
Approach. Chaitanya Publishing House,
108. Solomon E., (1963). The Theory of Financial Management. Columbia University
Press.
109. European Commission (2017). Resource Efficiency. Available at:
http://ec.europa.eu/environment/resource_efficiency/index_en.htm

153
110. James C. VanHorne, (2009) Fundamentals of Financial Management (13th edition).
Pearson Education Limied. ISBN-13: 978-0273713630, ISBN-10: 0273713639
111. Abadir H. Y., (2011). Project Management Maturity in the Construction Industry of
Developing Countries (the Case of Ethiopian Contractors). Publisher: University of
Maryland.
112. Host Analytics Support, (2017). What Is Financial Planning and Analysis?
Available at: https://www.hostanalytics.com/enterprise-performance/what-is-financial-
planning-and-analysis#
113. Paul Mckinney, (2013). Financial Goal: Definition & Examples. Chapter 9,
Lesson3. Available at: http://study.com/academy/lesson/financial-goal-definition-
examples-quiz.html
114. Risk and Insurance Management Society, (2012). Exploring Risk Appetite and
Risk Tolerance. Available at:
https://www.rims.org/resources/ERM/Documents/RIMS_Exploring_Risk_Appetite_Ris
k_Tolerance_0412.pdf
115. Laury Hales, (2003). Financial Planning in Project Management. Chapter 10,
Lesson 26. Available at: http://study.com/academy/lesson/financial-planning-in-project-
management.html
116. Matt Ward, with Carl Kammermeier, Ray Nieuwenhuizen and Eric Spitz, Project
Financial Planning: Closing the Visibility Gap on Projects, Finances, and Assets.
Accessed: 11/11/2017. Available at: http://pelotongroup.com/clients-and-
insights/insights/project-financial-planning-closing-the-visibility-gap-on-projects-
finances-and-assets
117. Republic of Macedonia, (2010). Manual for Financial Management and Control.
Public Internal Financial Control Department Central Harmonisation Unit for Financial
Management and Control.
118. Jokomba H. D. Financial Control Measures. BRATIM Training, Nigeria. Accessed:
12/11/2017. Available at:

154
https://viden.io/knowledge/563/attachments/3002?name=viden-clip-K520-
Bratim_Fianancial+Control+Measure.pdf
119. Peter M. and Nicholas T., (1997). The Handbook of International Financial Terms
Publisher: Oxford University Press. Print ISBN-13: 9780198294818, Online:
ISBN: 9780191727245
120. State of North Carolina, Operational Control, Model 5, Quality Enhancement Unit
Marshall Dobson. Accessed: 12/12/2017. Available at:
https://www.ncdot.gov/programs/environment/download/Mod5_EMS.pdf
121. Hardwin S., (2012). Administrative efficiency in theory and practice. At PT.
Sarandi. University of Twente.
122. Robbins P., (1980). The Administrative Process: Englewood Cliffs: New Jersey,
Prentice- hall.
123. COSO, (2012). Internal Control — Integrated Framework: Internal Control over
Financial Reporting: A Compendium of Approaches and Examples.
124. Chan H. L., (2013). Internal Control Systems (PAPAMOSS). Topic: Education.
Area of discussion: Auditing. Available at:
http://hoileongchan.blogspot.com/2013/12/internal-control-systems-papamoss.html
125. Kan, E., 2013. Audit and assurance – principles and practices in Singapore. 3rd ed.
Singapore: CCH.
126. Philippe Z., Olivier S., Marie-Anne L., François F., and Jeremy M., (2011).
Fundamentals of Management Control – Françoise Giraud. Pearson Education France.
127. Time Management Guide.com (2002).What is planning and why you need to plan.
Available at: http://www.time-management-guide.com/planning.html
128. Yumi S. & Susan B., (2007). Monitoring and Evaluation. Social Development
Department - The World Bank. Available at: www.worldbank.org/smallgrantsprogram
129. Mason C., Talya B., and Berrin E., (2010) The Principles of Management. Chapter
15. Available at:
155
http://cms.cerritos.edu/uploads/jramos/ba115%20carpenter/carpenter%20ppt%20chapter
%2015%20fill-in.pdf
130. Downe, James & Martin, Steve, (2007). Regulation inside government: processes
and impacts of inspection of local public services. Policy and Politics, 35 (2): 215-232.
131. Power and Michael, (1999) The audit society: rituals of verification, Oxford, Oxford
Univ. Press.
132. Eva Hämberg (2013). Supervision as control system: the design of supervision as a
regulatory instrument in the social services sector in Sweden. Scandinavian Journal of
Public Administration 17(3): 45-64. ISSN: 2001-7405 E-ISSN: 2001-7413.
133. Kaplan Financial Knowledge Bank, (2012). Internal control systems. Available at:
http://kfknowledgebank.kaplan.co.uk/KFKB/Wiki%20Pages/Internal%20control%20sys
tems.aspx
134. San Jose State University, (2015). Standard: Physical Security. Available at:
http://its.sjsu.edu/docs/security/Standard_Physical_Security.pdf
135. Samuel Labi and Fred Moavenzadeh, (2007). Project Control. Lecture 15.
Department of Civil and Environmental Engineering, Massachusetts Institute of
Technology. 1.040/1.401/ESD.018, Project Management, Spring 2007.
136. Jack R. M., and Samuel J. M., (2006). Project Management: A Managerial Approach.
Edition 6, Publisher: Wiley. ISBN 0471742775, 9780471742777.
137. Astrid Apoutou, (2010). Control activities: authorization and approval. Internal
Controls Bulletin. Volume 2, Issue 4. Publisher: Minnesota Management & Budget.
138. Standard of Internal Controls, (2007). Issued April 2007. Available at:
http://www.asu.edu/fs/documents/standards_of_internal_controls.pdf
139. Edwin B. Flippo, (1976). Principles of Personnel Management. Edition 4th.
Publisher: McGraw-Hill series in management Tax and Estate Planning Series.
140. Jucius M. J. (1971). Personnel Management. Publisher: Richard D.Irwin, Inc.
ASIN: B0006DYP7A

156
141. O‟Leary C, Iselin E, Sharma D (2006). The Relative Effects of Elements of Internal
Control on Auditors‟ Evaluations of Internal Control. Pac. Account. Rev. 18(2):69-96
142. Achim Blume, (2014) Accounting and Administrative Controls Participants’
Handbook. The United Republic of Tanzania. Support to Local Governance Processes
(SULGO) in Tanzania Project: Strengthening internal controls at sub-national level
Summary Guide Part B.
143. Rai Technology University, Engineering Minds. Principles of Financial
Administration, Syllabus. Date Accessed: 10th January, 2018. Available at:
http://164.100.133.129:81/eCONTENT/Uploads/Principles_of_Financial_Administratio
n.pdf
144. United States Census Bureau. State & Local Government Finance, Definitions:
Financial Administration. Accessed: 10th January, 2.18: Available at:
https://www.census.gov/govs/local/definitions.html
145. Lall, G.S., (1976). Public Finance and Financial Administration
in India, Kapoor:New Delh
146. Vignesh G., (2015). Financial Administration. Importance of Finance to
Administration. Description: Financial Administration notes. Brunel University. Lecture
Notes: Department: Political science. United Kingdom. Accessed: 12th January, 2018.
Available at: https://www.docsity.com/en/financial-administration-notes/557758/
147. Soviet Financial System, (1966). Moscow Financial Institute Publisher: Progress
Publishers, Moscow, USSR, 1966
148. Asset Insights, (2013). Funding Models. Accessed: 13th January,2018. Available at:
http://www.assetinsights.net/Glossary/G_Funding_Model.html
149. Joseph C., and Chris B., (2011) Funding Infrastructure: Time for a new approach?
PricewaterhouseCoopers. “PwC” 2011. Australia.
150. Independent Observer of the Global Fund, (2014). Understanding the New Funding
Model - An Aidspan Guide. Nairobi, Kenya.

157
151. Finnerty, J. (1996). Project Financing – Asset-based financial engineering, Wiley,
Inc: New York
152. Björn H., and Karin L., (2002). Project Finance - Finding the right sources of
funding. Ekonomiska Institutionen 581 83 LINKÖPING. Available at: http://www.diva-
portal.org/smash/get/diva2:17042/FULLTEXT01.pdf
153. Don Hofstrand, (2013). Types and Sources of Financing for Start-up Businesses. File
C5-92. Ag Decision Maker. IOWA state University. Extension and Outreach.
154. Haines Watts, (2015). Sources of Finance. Available at:
https://www.hwca.com/app/uploads/2015/02/Sources_of_Finance.pdf
155. Richard B., Jenny R., Graham J., & Bethany S., (2015). Selling your business – assets
or shares? Stevens & Bolton LLP. Wey House, Farnham Road, Guildford, Surrey GU1
4YD.
156. Chasan, E. (2012). Mid-Size Firms Tap Retained Earnings to Fund Growth. The Wall
Street Journal.
157. Michael Godfrey Thuranira, (2014). The effect of retained earnings on the returns of
firms listed at the Nairobi securities exchange. Available at:
http://chss.uonbi.ac.ke/sites/default/files/chss/MICHAEL%20GODFREY%20THURAN
IRA.pdf
158. Neil H. J., and Raymond J. S., (1942). Definition of a Term Loan. Publisher: NBER
.ISBN: 0-870-14129-5 Volume available at: http://www.nber.org/books/jaco42-1
159. S.R.N Adarsh College. A study on Loans and Advances, Introduction On Loans and
advances. State Bank of India. Available at:
https://bbmprojects.files.wordpress.com/2014/05/a-study-on-loans-and-advances-by-
rohit-r.pdf
160. Kwakye J. K., (2010). High Interest Rates In Ghana, A Critical Analysis. Institute of
Economic Affairs. No. 29. ISBN: 9988-584-01-6. ISSN: 0855-3238.
161. Ministry of Local Government and Provincial Councils (2008). Grant Management
and Donor Relations. Financial Management Training Module 3 of 4. Sri Lanka.
158
Available:
http://smartcity.sngpweb.com/wpcontent/uploads/2017/06/GrantManagementDonorRela
tions.pdf
162. Utah System of Higher education (USHE). Sources of Financing: Debt and Equity.
Section IV, Putting the Business Plan to Work: Sources of Funds. Accessed: 13th January,
2018. Available at: http://www.usheproduction.com/design/8020/downloads/4a.pdf
163. Monica T., (2014). Profitability Analysis (A comparative study of SAIL & TATA
Steel). IOSR Journal of Economics and Finance (IOSR-JEF) e-ISSN: 2321-5933, p-ISSN:
2321-5925.Volume 3, Issue 2. Ver. I (Mar. - Apr. 2014), PP 19-22.
164. Utah and Idaho. How to Analyze Profitability. Business Builder 7. Zions Business
resource center. Accessed: 14dth January, 2018. At:
https://www.zionsbank.com/pdfs/biz_resources_book-7.pdf
165. Ľubica L., (2007). Uses and Limitations of Profitability Ratio Analysis in Managerial
Practice. 5th International Conference on Management, Enterprise and Benchmarking
June 1-2, 2007 � Budapest, Hungary.
166. Julie P., Bryn S. and Irene G., (2013). Financial Ratio Analysis. A Guide to Useful
Ratios for Understanding Your Social Enterprise’s Financial Performance. Demonstrating
Value Initiative at Vancity Community Foundation. www.demonstratingvalue.org
167. Mihaela G., Advantages and Limitations of the Financial Ratios Used in the
Financial Diagnosis of the Enterprise. Scientific Bulletin – Economic Sciences, Volume
13/ Issue 2. Faculty of Economics, University of Piteşti. JEL Classification Codes: G11,
G12, L21.
168. Boatright, J. R. 1994. ‘Fiduciary Duties and the Shareholder-Management Relation:
Or, what’s so Special about Shareholders?’ Business Ethics Quarterly 4 (4): 393–407.
169. Primož D., Igor S., Suzana L., What is the Objective of a Firm? Overview of
Theoretical Perspectives. Accessed on: 17th January, 2018. Available at:
http://www.hippocampus.si/ISBN/978-961-6832-32-8/papers/dolenc.pdf

159
170. Rose, C., and C. Mejer. 2003. ‘The Danish Corporate Governance System: From
Stakeholder Orientation Towards Shareholder Value.’ Corporate Governance: An
International Review 11 (4): 335–344.
171. OECD. 1999. OECD Principles of Corporate Governance. Paris: OECD.
172. Aswath D., (2001). Applied Corporate Finance: A User's Manual. Edition: 3rd.
Publisher: New York, NY, USA : John Wiley & Sons, 2011.
173. Noah G., Kelly R., and Martin L., The Correct Way to Terminate an Employee.
Accessed: 17th January, 2018. Available at:
http://www.humanresources4u.com/cms_files/original/How_to_Terminate_an_Employe
e1.pdf
174. Fama, E.F., (1998). Market Efficiency, Long-term Returns, and Behavioral Finance.
Journal of Financial Economics.
175. Clarke, J., Jandik, T. and Mandelker, G. (2001). The efficient markets
hypothesis. Expert Financial Planning: Advice from Industry Leaders, pp.126-141
176. Harcourt, G.C., Kamel P. H., and Wallace R. H., (1967) Economic Activity.
Cambridge: Cambridge University Press,
177. Virlics, A., (2013). Investment Decision Making and Risk. Procedia Economics and
Finance. 6. 169–177. 10.1016/S2212-5671(13)00129-9.
178. Toma S.V., Chirita M., & Şarpe D., (2012). Risk and Uncertainty. Procedia
Economics and Finance. 3. 9 . DOI: 10.1016/S2212-5671(12)00260-2
179. Bierman, H. Jr. and Smidt, S., (2012). The Capital Budgeting Decision. Economic
analysis of investment projects. 9th ed., Routledge Taylor & Francis Group.
180. Brealey, R. A., Myers, S. C., Allen, F. (2011). Principles of Corporate Finance. 10th
ed. McGraw-Hill.
181. Big Society Capital, (2016). Transforming Social Investment. Social Impact Tools,
Best practices for Investors. Investing For Good. 40 Bermondsey Street. London. SE1
3UD. Accessed on 17th January, 2018. Available at:

160
https://www.bigsocietycapital.com/what-we-do/champion/social-impact-tools/step-1-
planning
182. Todd L., (2013). Planning Principles and Practices. Victoria Transport Policy
Institute. Available at: http://www.vtpi.org/planning.pdf
183. Broadridge Investor Communication Solutions, Inc. and Gate City Bank, (2013).
Introduction to Investment Planning.
184. Marcos M. C. and Vicent A. M., (2015). investment Selection Criteria: Considerating
Risk and Social Impact Throught the Sroi (social return on investment). Univasitat Jaume.
Spain. Accessed at:
http://repositori.uji.es/xmlui/bitstream/handle/10234/131921/TFG_Mart%C3%ADnez%
20Celades_Marcos.pdf?sequence=1
185. Leonardo Da Vinci Kristina L., (2010). Investment Analysis and Portfolio
Management. Development and Approbation of Applied Courses Based on the Transfer
of Teaching Innovations in Finance and Management for Further Education of
Entrepreneurs and Specialists in Latvia, Lithuania and Bulgaria. Leonardo da Vinci
programme project. Vytautas Magnus University Kaunas, Lithuania.
186. Hal Nelson, Fred Wainwrigh, Colin Blaydon, (2004). Note on Due Diligence in
Venture Capital. Case # 5-0014. Trustees of Dartmouth College. Tuck School of Business
at Dartmouth College.
187. . Investment Due Diligence, 101 Tutorial Guide. Financial Monitor. Available at:
https://financialmentor.com/about-us/todd-r-tresidder
188. Hiriyappa B. (2007). Investment Management: Securities and Portfolio
Management. Edition: 1st. Publisher: New Age International. ISBN: 978-81-224-2256-6.
189. Cyert R. M. and March J. G. (1963). A behavioral theory of the firm. Prentice-Hall
Inc, Englewood Cliffs New Jersey.
190. Mintzberg H., Raisinghani D., and Théoret, A. (1976). The Structure of the
Unstructured Decision Processes. Administrative Science Quarterly 21(2): 246-275.

161
191. Usman Ali Ahmed, (2017). Financial Management in Construction Project.
Available at:
https://www.academia.edu/22632384/FINANCIAL_MANAGEMENT_IN_CONSTRU
CTION_PROJECT
192. Bruce C., Gordon B., and Tom P., (1996). Project Finance Teaching Note 1. FNCE
208/731. The Wharton School. Under the guidance of Princeton Pacific Group.
193. John W. Kensinger and John D. Martin. Project Finance: Raising Money the Old-
Fashioned Way,” in Donald H.
194. ). What is Project Finance? Available at: http://www.corality.com Chew, Jr., ed.
1993. The New Corporate Finance: Where Theory Meets Practice. New York: McGraw-
Hill.
195. David G., and James W., (2014). Project Finance. Chapter 12. HSBC. Document
Date: 2014-05-30 03:55:12. Available at:
https://www.hsbcnet.com/gbm/attachments/products-services/financing/project-
finance.pdf
196. Rickard Wärnelid, (2008/training/campus/post/september-2008/what-is-project-
finance
197. Neil Cuthbert, (2016). A Guide to Project Finance. By: Dentons & Co.
198. U.S. Department of Transportation, (2010). Project Finance Primer. Federal
Highway Administration. FHWA-OIPD-10-005.
199. Esty, Benjamin C. and Aldo Sesia, Jr., (2007). An overview of project Finance &
Infrastructure Finance - 2009 update, Harvard Business School.
200. Andrew Fight, (2006). Introduction to Project Finance. Library of Congress
Cataloguing in Publication Data Control Number: 2005923901 ISBN-13: 978-0-7506-
5905-5 ISBN-10: 0-7506-5905-X.
201. João M. Pinto, (2017). What is project finance? Investment Management and
Financial Innovations, Volume 14, Issue 1.

162
202. Rashi Anand Suri. Project Finance. SNG & Partners, India. Date accessed: 21st
February, 2018. At:
https://www.wegweiser.de/sites/default/files/project_financing_in_india.pdf
203. Government of South Africa, National Treasury / Public-Private Partnership
Manual. (2004). Project Finance. Introductory Manual on Project Finance for Managers
of PPP Projects. Accessed: 21st February, 2018. At: www.treasury.gov.za.
204. Brendan Martin, (2004). What is Public about Public Services? Public World.
Making Services Work for Poor People. Commissioned by the World Bank as a
background paper for the World Development Report, 2004.
205. Cambridge English Dictionary.
https://dictionary.cambridge.org/dictionary/english/public
206. George W. B. 2008. Introduction to Finance. Available at:
http://www.sfu.ca/~blazenko/one.pdf
207. Ramniranjan Anandilal Podar College of Commerce and Economics (RAPCCE),
(2015). Definitions of Public Finance. Department of Economics and Foundation
Course, R.A.P.C.C.E. Lecture 1.
208. Chand S.N., (2008). Public Finance. Volume 1. Publisher: Atlantic Publishers &
Dist. ISBN: 8126908009, 9788126908004
209. Hugh Dalton, (1922). Principles of Public Finance, Volume 1. Publisher:
Allied Publishers. ISBN: 8170231337, 9788170231332.
210. Carl Plehn, (1921). Introduction to Public Finance. The Economic Journal. Vol.
31, No. 123 (Sep., 1921), pp. 371-373
211. Renaissance College of Commerce and Management, 2015. Public Finance:
Meaning, Nature and importance. Unit I. B.Com 5th Sem. Available at:
http://rccmindore.com/wp-content/uploads/2015/06/Public-Finance.pdf
212. Zhou G. and Madhikeni A., (2013). Systems, Processes and Challenges of Public
Revenue Collection in Zimbabwe. American International Journal of Contemporary
Research Vol. 3 No. 2.

163
213. Allen R. and Daniel T. (2001). Managing Public Expenditure A Reference Book
for Transition Countries, SIGMA, OECD. Publisher: OECD Publications, 2, Rue Andre-
Pascal, 75775 Paris CEDEX 16. ISBN 92-64-18653-0 N. 51753 2001.
214. Umar Z. M. (2013). Public Debt. Pakistan Economic Survey 2012-13. Chapter 9.
Available at: http://www.finance.gov.pk/survey/chapters_13/09-Public%20Debt.pdf
215. David W., (2002). Fundamentals of Corporate Finance. Volume 1. Publisher:
McGraw−Hill Primis ISBN: 0−390−31999−6
216. Edward M. E., (2013). Introduction to Corporate Finance. University of Aruba.
Available at: file:///C:/Users/Joseph/Downloads/corporatefinance-
guestlecturembaclassfordl-130116095406-phpapp01.pdf
217. Aswath D. (2001). Corporate Finance: Theory and Practice 2nd Edition. Publisher:
Von Hoffmann Press. SBN-13: 978-0471283324. ISBN-10: 0471283320
218. Alexander C., (2018). Corporate Finance: Objectives and Functions. Available at:
http://alexanderchristodoulakis.org/corporate-finance-objectives-functions/
219. Gyanendra K. S., (2017). Meaning, Importance, scope and objectives of Corporate
Finance. Modul 1. Asst. Professor Utkal University. Available at:
https://corporatefinace.blogspot.com/2017/06/meaning-importance-scope-and-
objectives.html
220. Weston F. J. and Copeland E., (2013). Financial Theory and Corporate Policy.
Edition: 4th. Publisher: Pearson New International. ISBN-13: 978-0321127211.
221. Brigham F. E. and Gapenski C.L., (1988) Financial Management: Theory and
Practice, Volume 2. Edition, 5, illustrated. Publisher: Dryden Press. ISBN, 0030125391,
9780030125393.
222. VanHorne J. C., (2004). Fundamentals of Financial Management. Publisher: Prentice
Hall. ISBN: 0273685988, ISBN13: 9780273685982.
223. Brealey R.A., Myers S. and Franklin A., (1980). Principles of Corporate Finance.
Edition: 12th. Publisher: McGraw-Hill/Irwin. ISBN: 978-1259144387

164
224. Müllner J., (2017). International project finance: review and implications for
international finance and international business. Management Review Quaterly. Volume
67, Issue 2, pp 97–133. DOI: https://doi.org/10.1007/s11301-017-0125-3. Publisher:
Springer Berlin Heidelberg. Print ISSN2198-1620. Online ISSN2198-1639
225. Kensinger J.W. and Martin J.D., (1988). Project finance: raising money the old-
fashioned way. Volume1, Issue3. Available at: https://doi.org/10.1111/j.1745-
6622.1988.tb00474.x
226. Esty B. C., (2004) Modern project finance: a casebook. Wiley, New York, NY (Wile
internat. ed. ed.). Available at:
http://scholar.google.com/scholar_lookup?title=Modern%20project%20finance%3A%2
0a%20casebook&author=BC.%20Esty&publ
227. Arnold S. G. and Michael C. B., (2016). Annual Global Project Finance Default and
Recovery Study, 1980-2014. Project and Infrastructure Finance. Publisher: S&P Global
Market Intelligence. Available at:
https://marketintelligence.spglobal.com/documents/our-thinking/research-
reports/2015%20Annual%20PF%20Default%20and%20Recovery%20Study_final.pdf
228. Gatti S., Kleimeier S., Megginson W. L., and Steffanoni A., (2013) Arranger
certification in project finance. Finance Management 42(1):1–40. Available at:
https://doi.org/10.1111/j.1755-053X.2012.01210.x
229. Yescombe E. R., (2002). Principles Project Finance. Publisher: Academic Press.
ISBN: 0127708510
230. Amir Cohen and Thomson Reuters, (2016). Global Project Finance Review.
Managing Underwriters, Full Year 2016. Available at:
http://dmi.thomsonreuters.com/Content/Files/4Q2016_Global_Project_Finance_Review.
231. Adesegun AO., (2017). Project Finance Report 2017. New path for African
financing. International Financial Law Review. Page 9.
165
232. Regis Duvignau and Thomson Reuters, (2017). Global Project Finance Review.
Managing Underwriters, First quarter 201. Available at:
http://www.pfie.com/Journals/2017/04/20/y/m/d/PFI-Financial-League-Tables-Q1-
2017.pdf
233. John Vizcaino and Thomson Reuters, (2017). Global Project Finance Review.
Managing Underwriters, First quarter 2017. Available at:
http://dmi.thomsonreuters.com/Content/Files/1H2017_Global_Project_Finance_Review.
234. Edgard Garrido and Thomson Reuters, (2017). Global Project Finance Review.
Managing Underwriters, First Nine Months, 2017. Available at:
http://www.pfie.com/Journals/2017/10/12/s/k/w/3Q2017_Global_Project_Finance_Revi
ew.pdf
235. Eni, (2017). Eni launches Coral South project in Mozambique. Press Release.
Available at: https://www.eni.com/docs/en_IT/enicom/media/press-
release/2017/06/PR_Eni_Coral.pdf
236. Vanguard Asset Management Limited, (2015). Investment fundamentals: An
introduction to the basic concepts of investing. UK
237. FINRA Foundation, (2016). Key Investing Concepts. Publisher: Lightbulb Press,
Inc.
238. J-P Labuschagne, (2017). Africa Construction Trends Report 2017. Deloitte
239. Mohamed Badissy,(2013). Understanding Power Project Financing . Version 1.1
Published Under the Creative Commons Attribution-Noncommercial-Share Alike 4.0.
International License (cc by no SA).
240. Kensinger J.W and Martin J.D. (1988). Project finance: raising money the old‐
fashioned way. Publisher: Journal of Applied Corporate Finance. Volume 1, Issue 3.
https://doi.org/10.1111/j.1745-6622.1988.tb00474.x
241. Gordon M. B., and Bruce C., (1998). Project Finance Teaching Note. FNCE 208/73.
Available at: http://finance.wharton.upenn.edu/~bodnarg/ml/projfinance.pdf

166
242. Nevitt, P., and F. Fabozzi. (2001). Project Financing. London: Euromoney, 7th
Edition.
243. Larry W., (1980). Essential elements of project financing. Harvard Business Review.
p. 166
244. World Bank, (1994). World Development Report 1994. New York: Oxford
University Press, p. 94
245. Scott S., (2016). Project Finance Features Overview. Publisher: Global Trade
Funding. Available at: https://globaltradefunding.com/project-finance/features-of-
project-finance/
246. Caselli, S., and S. Gatti. (2005). Structured Finance: Techniques, Products and
Market. Springer: Berlin.
247. Marco S., (2004). The nature of credit risk in project finance. BIS Quarterly Review,
December 2004.
248. Argenti, P., (1998). Corporate Communication. New York: McGraw-Hill.
249. Phillips, R., (1997). Stakeholder Theory and a Principle of Fairness. Business Ethics
Quarterly, 51-67.
250. Jensen, M., (2002). Value Maximization, Stakeholder Theory, and the Corporate
Objective Function. Business Ethics Quarterly, 12 (2): 235-256.
251. Ulas Akkucuk U. (2015). Handbook of Research on Developing Sustainable Value
in Economics, Finance, and Marketing. Beykent University, Turkey), Ümit Hacıoğlu
(Beykent University, Turkey) and Fatma Beyaztaş (Beykent University, Turkey.
ISBN13: 9781466666351|ISBN10: 1466666358|EISBN13: 9781466666368|DOI: 10.40
18/978-1-4666-6635-1
252. The EconomicPoint.com. Financial Resources. Available
at: http://economicpoint.com/financial-resources. Access on: 17th April, 2018.
253. Gilbert E., (2005). Capital budgeting: A case study analysis of the role of formal
evaluation techniques in the decision making process. South African Journal of
Accounting Research, Vol. 13(4), pp. 379-400

167
254. Dey P.K., (2004). Analytic hierarchy process helps evaluate project in Indian
pipelines industry. International Journal of Operations & Production Management, Vol.
24(6), pp. 588-604
255. Chen S. (1995). An Empirical Examination of Capital Budgeting Techniques: Impact
of Investment Types and Firm Characteristics.
256. Mohamed S. and McCowan A., (2001). Modelling Project Investment Decisions
Under Uncertainty Using Possibility Theory. International Journal of Project
Management, Vol. 19(4), pp. 231-241
257. National Australia Bank Limited et al. Understanding investment concepts. Version
5.3. Publisher: published by GWM Adviser Services Limited AFSL. Available at:
https://www.mlc.com.au/understandingseries/understanding_investment_concepts.pdf
258. Miceli, T.J., (1997). Economics of the Law: Torts, Contracts, Property, Litigation.
Publisher: Oxford University Pres.
259. Posner R. and Rosenfield A. (1977). Impossibility and related doctrines in contract
law: An economics analysis, Journal of Legal Studies, Vol.6, pp.83-118, 1977.
260. Kiyoshi K., Toshihiko O., and Masamitsu O., (2006). Risk-Sharing Rule in Project
Contracts. ISARC2006. Kyoto University. Japan.
261. Lepak D.P., Smith K.G., and M.S. Taylor M.S., (200). Introduction to Special Topic
Forum: Value Creation and Value Capture: A Multilevel Perspective. The Academy of
Management Review. 32(1): p. 180-194.
262. Haddadi, A., Alenka T-S., Margrethe F., Ole J. K.,(2015). Concept of Value for
Owners and Users of Buildings- A literature study of value in different contexts, in IPMA
world congress: Panama.
263. Haddadia A., Johansenb A., Andersenc B., (2016). Conference on ENTERprise
Information Systems / International Conference on Project MANagement / Conference on
Health and Social Care Information Systems and Technologies, CENTERIS / ProjMAN /
HCist 2016.
168
264. Womack, J. P., and Jones, D. T., (1996). Lean Thinking: Banish Waste and Create
Wealth in Your Corporation: Touchstone.
265. Sánchez-Fernández R., and Iniesta-Bonillo M. Á., (2007). The concept of perceived
value: a systematic review of the research. Marketing Theory, 7(4), 427-451.
doi:10.1177/1470593107083165
266. Holbrook M. B., (1999). Consumer value: a framework for analysis and research:
Psychology Press.
267. Sodal A. H., Ladre O., Svalstuen F., and Lohne J., (2014). Early Contractor
Involvement: Advantages and Disadvantages for the Design Team.
268. Miia M. and Catherine P. K., (2014). Value Management in Project Portfolios:
Identifying and Assessing Strategic Value. Publisher: Project Management Journal.
https://doi.org/10.1002/pmj.21452
269. Rappaport A., (1986). Creating Shareholder Value, The New Standard for Business
Performance, New York: Free Press.
270. Baroum S.M. and Patterson J.H., (1999). An exact solution procedure for
maximizing the net present value of cash flows in a network. In: Weglarz J. (Ed.),
Handbook on Recent Advances in Project Scheduling, Kluwer Academic Publishers,
Chapter 5, 107-134
271. Yang K.K., Talbot F.B. and Patterson J.H., (1992). Scheduling a project to
maximize its net present value: An integer programming approach. European Journal of
Operational Research, 64, 188-198.
272. Padman R., and Smith-Daniels D.E., (1993). Early-tardy cost trade-offs in resource
constrained projects with cash flows: An optimization-guided heuristic approach.
European Journal of Operational Research, 64, 295-311.
273. Icmeli O. and Erengüç, S.S., (1996). A branch-and-bound procedure for the resource-
constrained project scheduling problem with discounted cash flows. Management
Science, 42, 1395-1408.

169
274. Özdamar L., Ulusoy G. and Bayyigit M., (1994). A heuristic treatment of tardiness
and net present value criteria in resource-constrained project scheduling. Working Paper,
Department of Industrial Engineering, Marmara University.
275. Berman J., (2007). Maximizing Project Value, AMACOM, New York.
276. Max W. R., (2009). A Book Review on: Maximizing Project Value: Defining,
Managing, and Measuring for Optimal Return. By: Jeff Berman (2007). AEW Services,
Vancouver. Available at: http://maxwideman.com/papers/max_value/max_value.pdf
277. Kristina Levišauskait, (2010). Investment Analysis and Portfolio Management.
Leonardo da Vinci programme project. Development and Approbation of Applied
Courses Based on the Transfer of Teaching Innovations in Finance and Management for
Further Education of Entrepreneurs and Specialists in Latvia, Lithuania and Bulgaria.
Vytautas Magnus University Kaunas, Lithuania.
278. Daniel A. W., Authur G. B., and John D. B., (2002). The foundations of Henri
Fayol’s administrative theory. Management Decision 40/9 [2002] 906±918. MCB UP
Limited. ISSN: 0025-1747. DOI 10.1108/0025174021044110 8.
279. Marco S., (2004). The nature of credit risk in project finance. BIS Quarterly Review.
JEL classification: F34, G12, G28, G32.
280. Caselli, S., and S. Gatti. (2005). Structured Finance: Techniques, Products and
Market. Springer: Berlin.
281. Mohamed S. and McCowan A., (2001). Modelling Project Investment Decisions
Under Uncertainty Using Possibility Theory. International Journal of Project
Management, Vol. 19(4), pp. 231-241
282. National Australia Bank Limited et al. Understanding investment concepts. Version
5.3. Publisher: published by GWM Adviser Services Limited AFSL. Available at:
https://www.mlc.com.au/understandingseries/understanding_investment_concepts.pdf
283. Miceli, T.J., (1997). Economics of the Law: Torts, Contracts, Property, Litigation.
Publisher: Oxford University Pres.
170
284. Posner R. and Rosenfield A. (1977). Impossibility and related doctrines in contract
law: An economics analysis, Journal of Legal Studies, Vol.6, pp.83-118, 1977.
285. Marco S., (2004). The nature of credit risk in project finance. BIS Quarterly Review.
JEL classification: F34, G12, G28, G32.
286. Project InterLinc, (2004). Cost Estimating General Principles and Procedures.
GP&P - A Web Page Resource for Project Management November 9, 2004. Page 1 of.
Available at: http://lincoln.ne.gov/city/pworks/engine/dconst/gpp/pdf/costest.pdf
287. Department of Information Technology (Doit) – Maryland, (2018). Cost Estimating.
Available at: http://doit.maryland.gov/SDLC/Documents/Cost_Estimating.pdf
288. Project Management Institute, (2013). A Guide to the Project Management Body of
Knowledge (PMBOK Guide). 5th edition. Publisher: Project Management Institute, Inc.
ISBN: 978-1-935589-67-9
289. Jim P., Caitlin G., Monica T., (2013). Indicators of Inputs, Activities, Outputs,
Outcomes and Impacts in Security and Justice Programming. Vera Institute of Justice.
UKaid Department of International Development.
290. Project Management Institute, (2008). A Guide to the Project Management Body of
Knowledge (PMBOK Guide). 4th edition. Publisher: Project Management Institute, Inc.
ISBN:978-1-93389051-7
291. Project Management Institute, (1999). Project Cost Management. A Guide to the
Project Management Body of Knowledge (PMBOK Guide). 130 South State Road, Upper
Darby, PA 19082 USA
292. Martin G., (2014). Project Cost Management. ICSC European Retail Property
School. the Scandic Berlin - Potsdamer Platz.
293. HR Council. (2013). HR Planning. Available at:
http://hrcouncil.ca/docs/standards/HRM-Standards-Theme61.pdf
294. Brian J. S., John W. B., and George E. D., (1992). Human resource planning.
Publisher: Wiley Online Library. Volume31, Issue1‐2. Special Issue: Exemplary Practices
Spring ‐ Summer 1992. Pages 81-93

171
295. Amadi E., (2008). Introduction to Educational Administration: A Module.
Publisher: Harey Publication, Port Harcourt Isbn 978 – 48654 – 4 – 9
296. Luigi B., and Christof E., (2011). Estimation Tools and Techniques. Publisher: IEEE
Computer Society. Available at:
https://pdfs.semanticscholar.org/7369/653121b683f3dd82fbf55b6d72c90e9e614f.pdf
297. Mosaic White Paper (WP1042). Project Terminology. Available at:
http://www.mosaicprojects.com.au/WhitePapers/WP1026_EEF_OPA.pdf
298. Dawn R., and Nidhi K., (2012). Designing a Results Framework for Achieving
Results: A How-to Guide. The World Bank. Independent Evaluation Group Strategy,
Learning, and Communication. ISBN-13: 978-1-60244-220-7 and ISBN-10: 1-60244-
220-7.
299. Tim B., (2012). The Elements of a Good Feasibility Study. Publisher: Project Smart.
www.projectsmart.co.uk. Available at: https://www.projectsmart.co.uk/pdf/elements-of-
a-good-feasibility-study.pdf
300. Bernard A., Rui G., and Dirk de V., (2000). Project Management T-kit. Council of
Europe and European Commission. Publisher: Council of Europe publishing, F-67075
Strasbourg Cedex.
301. Chartered Body for the Project Professionals, (2018). What is Project Management.
Association for Project Management (APM). Available at:
https://www.apm.org.uk/resources/what-is-project-management/
302. Avraham S. Jonathan F.B., and Shlomo G., (2005). Project Management: Processes,
Methodologies, and Economics. Edition: 2nd. Upper Saddle River: Prentice Hall
303. Duncan W.R., (1996). A guide to the project management body of knowledge. Upper
Darby, PA. Library of Congress Cataloging-in-publication. HD69.P75G845, Available
at: http://www2.fiit.stuba.sk/~bielik/courses/msi-slov/reporty/pmbok.pdf
304. Task Management guide, (2018). What is Project Elapse time? Accessed:
05/05/2018. Available at: http://www.taskmanagementguide.com/glossary/what-is-
project-elapsed-time-.php

172
305. Kolltveit B. J., and Grønhaug K. (2004). The importance of the early phase: the case
of construction and building projects. International Journal of Project Management, 22(7),
545-551. doi:10.1016/j.ijproman.2004.03.0
306. European Commission (2013). Results and Indicators. EuropeAid– DEVCO 06 –
Quality and Results. Available at:
https://ec.europa.eu/europeaid/sites/devco/files/19.%20results-and-indicators-
10122013_en.pdf
307. Yescombe E. R., (2002). Principles of Project Finance. Edition: 1st. eBook
ISBN: 9780080514826 Imprint: Academic Press
308. Nicholas J.M., and Steyn H., (2008). Project Management for Business,
Engineering, and Technology. Edition: 3rd. Oxford: Elsevier,
309. Theodoulides L., and Kormancová, G., (2014). Project Feasibility Evaluation Based
on Reflection. Conference paper: Management of Organizations in Real and Virtual
Environment: Opportunities and Challenges VI., At Banská Bystrica, Slovakia. Available
at:
https://www.researchgate.net/publication/277015835_Project_Feasibility_Evaluation_B
ased_on_Reflection
310. Tan, A.A.L., (2000). The need for Feasibility Study, Kuala Lumpur: The New Straits
Times Press,
311. Till J. and Jan M., (2009). Project Management. Publisher: Olaf Passenheim and
Ventus Publishing Aps. ISBN: 978-87-7681-487-8
312. Sanghoon A. et al. (2008) General Guidelines for Preliminary Feasibility Studies
(Fifth Edition). Korea Development Institute (KDI). Public and Private Infrastructure
Investment Management Center (PIMAC).
313. Weitzman M.L., (1998). Why the Far Distant Future Should Be Discounted at Its
Lowest Possible Rate. Publisher: Journal of Environmental Economics and Management,
Vol. 36, pp.201-208.

173
314. Gollier C., (2002). Discounting an Uncertain Future. Publiser: Journal of Public
Economics, Vol.85, pp.149- 166.
315. Lenka T., and Gabriela K., (2004). Project Feasibility Evaluation Based on
Reflection. Conference Paper. Matej Bel University. Faculty of Economics Department
of Corporate Economics and Management. Tajovskeho 10 975 90. Banská Bystrica,
Slovakia.
316. Kenneth K.H., (2005). Project and cost engineers’ handbook. Edition: 4th. New
York: Marcel Dekkeer.
317. Hafliði R. J., (2012). Feasibility Analysis Procedures for Public Projects in Iceland.
Thesis submitted to the School of Science and Engineering. Reykjavík University.
318. National Wealth Holding Limited (NWHL), Australia. Understanding investment
concepts. Publisher: GWM Adviser Services Limited AFSL 230692. Registered address:
105-153 Miller St North Sydney. Available at:
https://www.mlc.com.au/understandingseries/understanding_investment_concepts.pdf
319. Franco M. and Gerald A. P., (1974). An Introduction to Risk and Return Concepts
and Evidence. Part One. Publisher: Financial Analysts Journal. Volume 30 Issue 2.
doi/citedby/10.2469/faj.v30.n2.68
320. Markowitz H.M., (1952). Portfolio Selection. Journal of Finance, VII, pp. 77-91.
321. Fama E. F., and James D. M-B., (1972). Risk Return and Equilibrium: Empirical
Tests. Unpublished Working Paper No. 7237, University of Chicago, Graduate School of
Business.
322. Burton G. M., (1982). Risk and Return: A New Look. Publisher: University of
Chicago Press. Volume ISBN: 0-226-26342-8. (pp. 27 - 46).
323. Franco M. and Gerald A. P., (1974). An Introduction to Risk and Return Concepts
and Evidence. Part Two. Publisher: Financial Analysts Journal. Volume 30, No. 3:69-86.
doi.org/10.2469/faj.v30.n3.69
324. Burton G.M., (1981). Risk and Return: A New Look. NBER Working Paper No. 700
(Also Reprint No. r0291). National Bureau of Economic Research. 1050, Massachusetts.

174
325. Robert D., (2016). Project Risk Management. Semanticscholar.org. Available at:
https://pdfs.semanticscholar.org/presentation/02bf/fa85ee01b3a81ac839913f8dfbee5d8b
d9e4.pdf
326. Gatti S., (2008). Project Finance in Theory and Practice – Designing, Structuring,
and Financing Private and Public Projects. Academic Press Advanced Finance Series.
327. Pieplow B., et al. (2012). Project Risk Management Handbook: A Scalable
Approach. Version 1. Available at:
http://www.dot.ca.gov/projmgmt/documents/Project_Risk_Management_Handbook.pdf
328. Washington State Department of Transport (2014). Project Risk Management Guide.
Available at:
http://www.wsdot.wa.gov/publications/fulltext/cevp/projectriskmanagement.pdf
329. Hussey J., and Hussey R., (1997). Business Research: A practical guide for
undergraduate and postgraduate students. Publisher: Macmillan Press, London.
330. Hopkins W.G., (2002). Dimensions of research. Sportscience 6. Sport and Recreation
AUT University Auckland. NZ. sportsci.org/2002 Available at:
http://www.sportsci.org/jour/0201/What_is_research.pdf
331. Saunders M.N.K., Adrian T., and Philip L., (2009). Research Methods for Business
Students. Edition: 5th. Publisher: Pearson Education Limited. ISBN-13: 978-0273716860.
ISBN-10: 0273716867
332. Guba, E. G., & Lincoln, Y. S. (1994). Competing paradigms in qualitative research.
In N. K. Denzin & Y. S. Lincoln (Eds.), Handbook of qualitative research (pp. 105-117).
Thousand Oaks, CA, US: Sage Publications, Inc.
333. Bryman A., (2012). Social Research Methods. Publisher: Oxford University Press.
Edition: 4th. ISBN: 978 0 19 9588053
334. Russ P. W., (2015). An Introduction to Philosophy. Bellevue College. Copyright (cc
by nc 4.0). Available at: https://s.bellevuecollege.edu/wp/sites/41/2015/03/Intro-to-Phil-
full-text.pdf

175
335. Marilyn M.A., (1988). Problem of Evel (Oxford Readings in Philosophy). Edition:
1ST. ISBN-13: 978-0198248668. ISBN-10: 0198248660. DOI:
10.5840/faithphil19885219
336. Adamson P., (2016). Philosophy in the Islamic World: A History of Philosophy
Without Any Gaps, Volume 3. Publisher:Oxford University Press, Incorporated.
ISBN:0199577498. ISBN13:9780199577491
337. Buchanan A., (2014). Interview by Simon Cushing. Journal of Cognition and
Neuroethics (Philosophical Profiles): 1–21.
338. Russell B. (1945). History of Western philosophy. Publishers: Simon & Schuster
(US) and George Allen & Unwin Ltd (UK). ISBN 0-415-32505-6
339. May T., (2011). Social research: Issues, methods and research. London: McGraw-
Hill International.
340. Goddard W. and Melville S., (2004). Research Methodology: An Introduction.
Edition: 2nd. . Publisher: Oxford: Blackwell Publishing.
341. Uschold M. and King M., (1995). Towards a methodology for building Ontology.
Presented at a workshop on basic ontological issues in knowledge sharing, Artificial.
Intelligence Applications Institute, University of Edinburgh (United Kingdom).
342. Zajicek, G. (2005) Metaphysics, epistemology and ontology: New kind of science.
Available at:http://forum.wolframscience.com/showthread.php?s=&threadid=855
343. Tsoukas H. and Chia R., (2002). On Organizational Becoming: Rethinking
Organizational Change. Organization Science 13(5):567-582. DOI:
http://dx.doi.org/10.1287/orsc.13.5.567.7810
344. Elkjaer B. and Simpson B., (2011).Pragmatism: A lived and living philosophy, what
can it offer to contemporary organization Theory. Philosophy and Organisational Theory:
Research in the Sociology of Organizations, 32, 55-86.
345. Moon B., (1999). Editor’s introduction and situating the appraisal of rationality.
Journal of Management History, 5(1), 3 - 16.
346. Bartlett, R.& Baber, W., (2005).Deliberate environmental politics, democracy
176
and ecological rationality.Cambridge, MA. MIT Press.
347. Pentland B. T., (1999). Building process theory with narrative description to
explanation. Academy of Management Review, 24(4), 711-724.
348. Spens, K. M.,& Kovacs, G., (2006).A content analysis of research approaches in
logistics research. International Journal of Physical Distribution and Logistics
Management, 36(5),374-390.
349. Sekaran U., (2003). Research Methods for Business: A skill building approach, (4th
Edition: 4th. Publisher: John Wiley & Sons. USA
350. Wilson J., (2010). Essentials of Business Research: A Guide to Doing Your Research
Project. Publisher: SAGE Publications, p.7
351. Gulati P.M., (2009). Research Management: Fundamental and Applied Research,
Publisher: Global India Publications, p.42
352. Hirschheim R., Klein H. and Lyytiten, (1996). Exploring the intellectual structures
of Information Systems Development: A social action theoretic analysis. Accounting,
Management and Information Technologies (AMIT), 6(1/2)1-64.
353. Remenyi D., Williams B., Money A. and Swartz E. (1998). Doing Research in
Business and Management: An Introduction to Process and Method. Publisher: Sage
Publication, London.
354. Gill J. and Johnson P., (2002). Research Methods for Managers. Edition: 3rd
Publisher: Sage Publications, London.
355. Dobson P. J., (2002). Critical realism and information systems research: why bother
with philosophy? Publisher: Information Research. Volume 7, No.2. available at:
http://www.informationr.net/ir/7-2/paper124.html
356. Wand Y. & Weber R., (1993).On the ontological expressiveness of Information
System analysis and design grammars. Publisher: Information Systems Journal. Vol.
13(4) 217-237.
357. Flick U. (2011). Introducing research methodology: A beginner's guide to doing a
research project. Publisher: Sage Publication, London.

177
358. Bryman A., and Bell E., (2011). Business Research Methods. Edition: 3rd. Publisher:
Oxford University Press.
359. Banister P., Bunn G., Burman E., and Daniels J., (2011). Qualitative Methods In
Psychology: A Research Guide. Publisher: McGraw-Hill International.
360. Essays, UK. (2013). Research Onion - Explanation of the Concept. Retrieved from
https://www.ukessays.com/essays/psychology/explanation-of-the-concept-of-research-
onion-psychology-essay.php?vref=1
361. Feilzer M. Y., (2010). Doing mixed methods research pragmatically: Implications
for the rediscovery of pragmatism as a research paradigm. Journal of Mixed Methods
Research, 4(1), pp.6-16.
362. Tonderai N., (2014). Strategy Implementation for Survival and Growth among Small
to Medium-sized Enterprises (SMES) in Zimbabwe. Thesis submitted in the Fulfillment
of the Requirements for the Degree of Doctor Philosophy in the Business Management.
Department of Business Management. Faculty of Commerce. Midlands State University
363. Nwankwo S., Akumuri J. and Madichia N. O., (2010). Supporting black businesses:
Narratives of support providers in London. International Journal of Entrepreneurial
Behaviours and Research,16(6),561-580
364. Perry C., (1998). Process of a Case Study Methodology for Postgraduate Research
in Marketing. European Journal of Market. DOI: 10.1108/03090569810232237.
365. Onwuegbuzie A. J., and Leech N. L., (2006). Linking Research Questions to Mixed
Methods Data Analysis Procedures 1. The Qualitative Report, 11(3), 474-498. Available
at: http://nsuworks.nova.edu/tqr/vol11/iss3/3
366. Creswell J.W., (1994). Research Design: Qualitative & Quantitative Approaches.
Publisher: SAGE Publications, London.
367. Cohen L. and Manion L., (1980). Research Methods in Education. Publisher: Groom
Helm Ltd, London.

178
368. Rebecca J. H., (2013). Conference Paper: Epistemological Foundations of
Educational Design Research. AACE eLearn 2013 – World Conference on e-Learning.
Las Vegas, NV, USA.
369. Klenke K., (2008).Qualitative research in the study of Leadership. Publisher:
Emerald Group Publishing Limited, Bingley.
370. Cederblom J. and Paulsen D., (2001). Critical Reasoning. Edition: 7th. Publisher:
Wadsworth Publishing. ISBN-13: 978-0495808787. ISBN-10: 0495808784
371. Zach L., (2006). Using multiple case studies design to investigate the information
seeking behaviour of arts administrators. Library Trends, Vol. 55, No. 1,
372. Yin R. K., (2009). Case Study Research. Design and Methods. Publisher: Sage
Publications, Thousand Oaks. Edition: 4th.
373. Kothari CR. (2009). Research methodology-methods and techniques, New Wiley
Eastern ltd., Delhi.
374. Robson C., (1993). Real World Research: A Resource for Social Scientists and
Practitioners-Researchers, Blackwell, Oxford.
375. Mark R. L., (1990). Introduction to Behavioral Research Methods, Edition 4th
Research Edition. Published July 7th 2003 by Allyn & Bacon, ISBN
0205396763 (ISBN13: 9780205396764)
376. Deming W.E., (1960). Sample Design in Business Research. New York: John Wiley
& Sons
377. Cooper D. R., and Schindler P. S., (2003). Business research methods. Edition: 8th.
Boston: McGraw Hill.
378. Suominen K., and Mantere S., (2010). Consuming strategy: The art and practice of
managers’ everyday strategy usage. Advances in Strategic Management, 27, 211-245
379. Yin R.K., (2009). Case Study Research Design and Methods. Edition: 2nd. Applied
Social Research Methods Series. Volume 2. Publications: SAGE. International
Educational and Professional Publisher Thousand Oaks London New Deihl.

179
380. Kardzejewska R., Tudros R., and Baxter D., (2012). A descriptive study on the
barriers to implementation of the NSW (Australia) healthy schools canteen. Health
Education Journal, 0(0), 1-10 doi: 10.1177/0017896912437288.
381. Klenke, K. (2008). Qualitative research in the study of Leadership.Bingley;Emerald
Group Publishing Limited.
382. Särndal Carl-Erik; et al. (2003). Stratified Sampling Model Assisted Survey
Sampling. New York: Springer. pp. 100–109. ISBN 0-387-40620-4.
383. Yates D. S., David S. M., and Daren S. S., (2008). The Practice of Statistics, Edition:
3rd. Publisher: Freeman. ISBN 978-0-7167-7309-2.
384. Spens K. M., and Kovacs G., (2006). A content analysis of research approaches in
logistics research. International Journal of Physical Distribution and Logistics
Management, 36(5), 374-390.
385. Ben F., (2018). What is SPSS and How Does it Benefit Survey Data Analysis?
Available at: https://www.surveygizmo.com/resources/blog/what-is-spss/
386. Boyan Jovanovic. (1982). Selection and the Evolution of Industry, Econometrica,
vol. 50, Issue 3, Publishere: Econometric Society.
387. Lin Tom C. W., (2012). A Behavioral Framework for Securities Risk. 34 Seattle
University Law Review 325 (2011). Available at
SSRN: https://ssrn.com/abstract=2040946
388. Shefrin H., (2002). Behavioral decision making, forecasting, game theory, and role-
play. International Journal of Forecasting. 18: 375–382.
389. Gigerenzer G. and Selten R., (2002). Bounded Rationality: The Adaptive Toolbox.
MIT Press. ISBN 0-262-57164-1.
390. Thaler R.H. and Sunstein C.R. (2008). Nudge: Improving Decisions about Health,
Wealth, and Happiness. Yale University Press. ISBN 978-0-14-311526-
7. OCLC 791403664.
391. Thaler R.H., Sunstein C.R. and Balz J.P., (2010). Choice
Architecture. Doi:10.2139/ssrn.1583509. SSRN 1583509.

180
392. Najib Harabi. (2002). Determinants of Firm Growth: An Empirical Analysis from
Morocco, Solothurn University of Applied Sciences, Northwestern Switzerland
file:///C:/Users/Joseph/Downloads/Firmgrowth_Morocco%20(1).pdf
393. Pajarinen M., Petri R., and Hyytinen A., (2015). Does innovativeness reduce startup
survival rates? Journal of Business Venturing. Volume 30, Issue 4, July 2015, Pages 564-
581
394. Schumpeter, J. (1934), The Theory of Economic Development. Cambridge, MA:
Harvard University Press.
395. Barringer R. B and Bluedorn A. C., (1999). The Relationship Between Corporate
Entrepreneurship and Strategic Management. Strategic Management Journal. 20.
10.1002/(SICI)1097-0266(199905)20:5<421::AID-SMJ30>3.0.CO;2-O.
396. Baumol W. and J. Benhabib. (1989). 'Chaos: Significance, mechanism, and
economic applications.
397. Virlics A., (2013). Investment Decision Making and Risk. Procedia Economics and
Finance. 6. 169–177. 10.1016/S2212-5671(13)00129-9.
398. Toma S.V., Chirita M., & Şarpe D., (2012). Risk and Uncertainty. Procedia
Economics and Finance. 3. 9 . DOI: 10.1016/S2212-5671(12)00260-2
399. Hopkin P. (2010) Fundamentals of Risk Management: Understanding, evaluating
and implementing effective risk management, Kogan Page Limited
400. Segal S. (2011) Corporate Value of Enterprise Risk Management: The Next Step in
Business Management, Wiley Corporate F&A
401. Institute of Management Accountant, (2007). Enterprise Risk Management: Tools
and Techniques for Effective Implementation, Montvale, NJ: Institute of Management
Accountants
402. Arnold F. S., Marie-Claire K. (2015). Risk Assessment Applications of Fuzzy Logic.
Casualty Actuarial Society, Canadian Institute of Actuaries, Society of Actuaries.

181
403. Wu W., Cheng G., Hu H., and Zhou Q. (2013) Risk analysis of corrosion failures of
equipment in refining and petrochemical plants based on fuzzy set theory, Engineering
Failure Analysis.
404. Reeson A. and Dunstall S. (2009). Behavioural Economics and Complex Decision-
Making. Implications for the Australian Tax and Transfer System. Confidential Report
prepared for Treasury. CMIS Report Number 09/110.

182
APPENDIXES

183
APPENDIX A SMEs Business–Project Template
[INSERT YOUR BUSINESS LOGO] if any
[Your Name and Title] [Business Name]
[Business Address]
Business Plan
[Prepared: ........................................................]
[Date ..................................]
Contents Business Plan Summary:
I. The Business II.The Market III.The Way Forward IV.The Finances V.Any supporting documents
I.The Business: Business details Registration details (if any) Business premises / location Management structure Ownership Background of key persons Nature of business Innovation / technology incorporated Identified Risks and risks management plans Legalities Mode of operations Financial Sustainability plan
II.The Market: Market and market risks Target customers Environmental /industry risks analysis S.W.O.T. analysis marketing strategies
III.The Way forward: Vision and Mission Goals and objectives
IV.Finances:

184
Key financing and financial indicators analysis Assumptions (personal) Cost of Business project Cash flow projection Profit or loss analysis Investment recovery plan (repayment of external / internal financing when fall due)
V.Supporting documentation:
Part I Business Plan Summary [The business summary should be no longer than one page and should focus on how the business is going to be successful. The answers should briefly summarise in more detail throughout the plan.]
Part II 1.The Business Code No. Business name: [Enter the business name as
registered. If not registered , add the proposed business name.]
R1A1, R1B1, R1D1, R2D2, R2C1, R2D1, R3C1, R3D1
1.1
R1A2, R1B2, R1C1, R1D2, R1A1, R2B2, R2C2, R2D2, R3A1, R3B1, R3C2, R3D2
1.2 Business type: [Sole trader, partnership, company.]
R1D3, R2B3, R2D3, R3A2, R3B2, R3A4, R3B3, R3C3, R3D3
1.3 Business location: [Main business location].
R1B3, R2A3, R2B4, R2C3, R3A3, 1.4 Date established: [The date tarted or intended to trading.]
R1D1, R2B1, R2C4, R2D4, R3C4, R2A2, R2C4, R2D4
1.5 Management structure: [ show how the business would be managed]
R1D1, R1A1, R2B1, R2C1, R2D1, R3A3, R3C1,
1.6 Ownership: [List all of the business owners.]
R1A1, R1D2, R2B2, R2C2, R2D2, R2A4, R3A2, R3C2, R3D1, R3B4
1.7 Background of key persons: [Briefly outline the experience and/or years in the industry and any major achievements/]
R1A2, R1B1, R1C3, R1D3, R2A1, R3D2, R2B3,R2C3, R2D3, R3B1, R3A3, R3C3
1.8 Nature of business: [What products/services will be produce or provide ?]
R1B2, R1A3, R1C4,R1D4, R2A2, R2B4, R2C4, R2D4, R3B2, R3A4, R3C4, R3D3
1.9 Innovation: [ what is unique about the product or service and kind of technology applied]
R1C1, R1A4, R1B3, R2B1, R2C1, R2D1, R2A3, R3A1, R3C1, R3B3, R3D4
1.1.1 Mode of operation: [ how would activities be undertaken, centralized, decentralized, branches etc.]
R1A1, R1C2, R1D2, R1B4, R2B2, R2C2, R2A4, R3A2, R3C2, R3D1, R3B4,
1.1.2 Identified risk and contingency palns: [ talk about key idea, competency and financing risks identified or anticipated and how those risks would be dealt with]

185
R1A2, R1B1, R1C3, R2B3, R2C3, R2D3, R3B1, R3D2, R3A3, R3C3,
1.1.3 Legalities: [ talk about all legal requirements that have been met and the difficult ones that await the future?]
R1B2, R1A3, R1C4, R1D4,R2A2, R2B4, R2C4, R2D4, R3B2, R3D3
1.1.4 Financial stability plans: [ talk about all fianacial plans and measures put in plance to ensure activitity continuity]
2.Market Code No. Target customers: [Who are the potential
buyers? Why would they buy the products/services over others?]
R1C1, R1A4, R1B3, R2B1, R2C1R2D1, R2A3, R3A1, R3C1, R3B3
2.1
R1A1, R1C2, R1D2, R1B4, R2A1, R2B2, R2C2, R2D2, R2A4, R3B1, R3D1, R3D4
2.2 Market risks and Marketing strategy: [planned strategy to enter the market and attract customers? How and why will this work? What are the identitied risks and how will those risks be overcome]
R1A2, R1B1, R1D3, R2B3, R2C3, R3B1, R3D1, R3A3, R3C3
2.3 Evironmental / industry risk: [state clearly the kind of impact the business would have on the environment? What risks exist in the environment? Strategies to deal with these issues].
R1B2, R1A3, R1C3, R1D4, R2A2, R2B4, R2C4, R2D3, R3B2, R3D2, R3A4, R3C4,
2.4 S.W.O.T: [Provide detailed and systemtic S.W.O.T analysis ]
3.The Way forward Code No. Vision statement: [The vision statement
should briefly outline future plan for the business. It should state clearly what the overall goals for the business are.]
R1A1, R1B3, R1C4, R2B1, R2C1, R3A4,
3.1
R1A2, R1C1, R1D2, R1B3, R2B2, R2A4, R3A2, R3C1, R3B4, R3B3, R3D4
3.2 Goals/objectives: [ This should also state clearly what the short & long term goalsare ? What activities will be undertake to meet them and ensure activity contituet?]
4.The Finances Code No Financing : [Briefly outline all key financing
and financial indicators that can impact the business. What financial assumptions to behold for the business? Details constituent of the total cost. Cash flow projections, how much profit you intend on making in a particular timeframe. How much money will be need up-front? Where will any additional funds come from? How much of the fund will come from own sourcess? How much funds will come from other members if any?]
R1A3, R1B4, R1C2, R2A1, R2C3, R2D4, R2D3, R3A1, R3A3, R3B4,
4.1

186
5.Supporting documents Code No. Legal / other documents: [Attach any other
relevant comment that shows your ability to commence a successful entrepreneurship. Eg. Business registration documents, permits, proof of bank account, workshops attended, business clinic courses, personal CV etc.]
R1B1, R1A4, R1C3, R1D4, R2A2, R2A3,
5.1
Part III
6.Organisation Chart Code No. Organizational Chart: [Outline the
management structure of the business in a char form.]
R1B2, R3A1, 6.1
SMEs Business Project Hierarchical Organizational Chart with Pictures
7.Details of owners and team members
COMPANY COMPILED BY DATE COMPLETED

187
Code No. Names of owners: [List all of the business owners.] R1A2, R2B3, 7.1 R1C1, R1D2, R1A3, R1B3, R2A3, R2C4,
7.2 Details of management: [As the owner(s), will you be running the business or it someone be running the business on your behalf? What will be your involvement? If it is a partnership briefly outline % share, role in the business, the strengths of each partner and whether you have a partnership agreement/contract in place?]
R1A4, R1B4, R2C1, R3A3,
7.3 Experience: [What experience do the business owner(s) have? How many years have you owned or run a business? List any previous businesses owned/managed. List any major achievements/awards. What other relevant experience do you have? Don’t forget to attach your resume(s) to the back of your plan.]
8.Key personnel: Code No. Current staff: [List all current staff in the table
below.] R2A1, R2B1 8.1 Job Title Name Expected staff
turnover Skills or strengths
No.
1 [e.g. Manager]
[Dr Asare Joseph ]
[8-20 months] [Relevant qualifications in eg. Sales/Marketing. At least 5 years experience in the industry. Award in marketing excellence.]
2 3 4
Code No. Required staff: [List all required staff in needed to
run a successful business in the table below.] R1B1, R2B2, R3A4 8.2 Job Title Number Expected staff
turnover Skills necessary Date required
No.
1 [eg. Risk manager]
[Relevant qualifications in risk analysis and aanagement. At least 24years experience.]
[Month/Year]
2 3 4
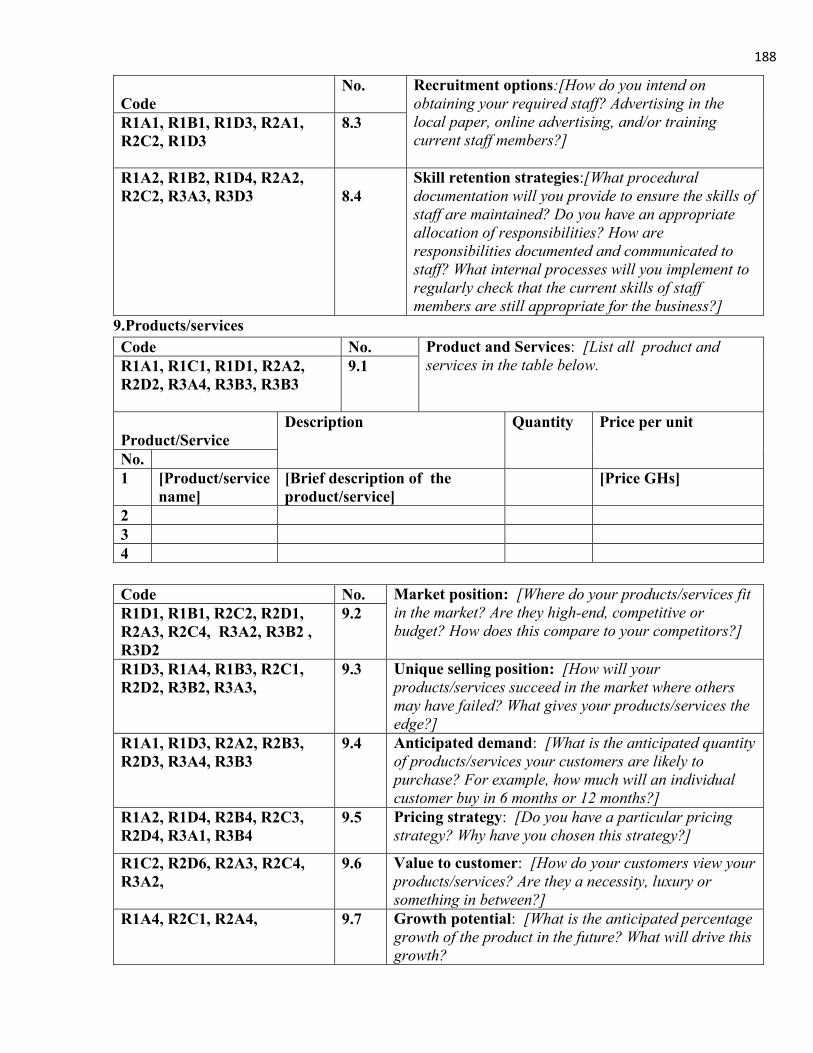
188
Code
No. Recruitment options:[How do you intend on obtaining your required staff? Advertising in the local paper, online advertising, and/or training current staff members?]
R1A1, R1B1, R1D3, R2A1, R2C2, R1D3
8.3
R1A2, R1B2, R1D4, R2A2, R2C2, R3A3, R3D3
8.4
Skill retention strategies:[What procedural documentation will you provide to ensure the skills of staff are maintained? Do you have an appropriate allocation of responsibilities? How are responsibilities documented and communicated to staff? What internal processes will you implement to regularly check that the current skills of staff members are still appropriate for the business?]
9.Products/services Code No. Product and Services: [List all product and
services in the table below. R1A1, R1C1, R1D1, R2A2, R2D2, R3A4, R3B3, R3B3
9.1
Product/Service
Description Quantity Price per unit
No. 1 [Product/service
name] [Brief description of the product/service]
[Price GHs]
2 3 4
Code No. Market position: [Where do your products/services fit
in the market? Are they high-end, competitive or budget? How does this compare to your competitors?]
R1D1, R1B1, R2C2, R2D1, R2A3, R2C4, R3A2, R3B2 , R3D2
9.2
R1D3, R1A4, R1B3, R2C1, R2D2, R3B2, R3A3,
9.3 Unique selling position: [How will your products/services succeed in the market where others may have failed? What gives your products/services the edge?]
R1A1, R1D3, R2A2, R2B3, R2D3, R3A4, R3B3
9.4 Anticipated demand: [What is the anticipated quantity of products/services your customers are likely to purchase? For example, how much will an individual customer buy in 6 months or 12 months?]
R1A2, R1D4, R2B4, R2C3, R2D4, R3A1, R3B4
9.5 Pricing strategy: [Do you have a particular pricing strategy? Why have you chosen this strategy?]
R1C2, R2D6, R2A3, R2C4, R3A2,
9.6 Value to customer: [How do your customers view your products/services? Are they a necessity, luxury or something in between?]
R1A4, R2C1, R2A4, 9.7 Growth potential: [What is the anticipated percentage growth of the product in the future? What will drive this growth?
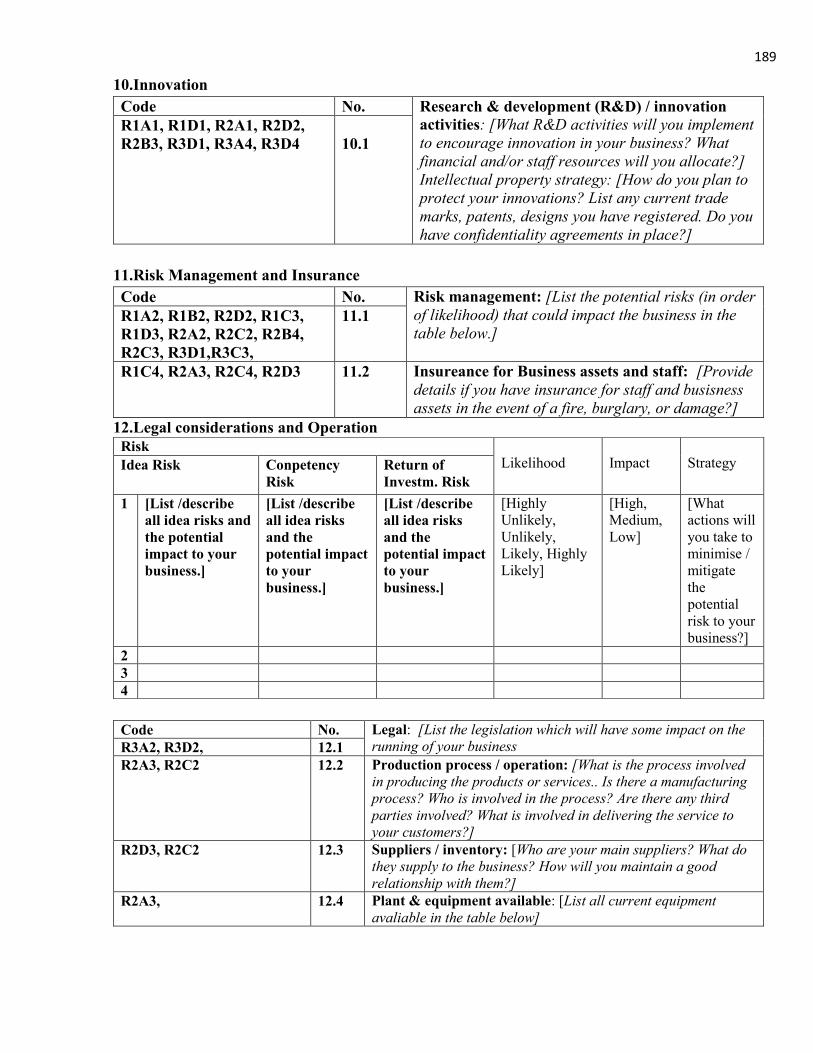
189
10.Innovation Code No. Research & development (R&D) / innovation
activities: [What R&D activities will you implement to encourage innovation in your business? What financial and/or staff resources will you allocate?] Intellectual property strategy: [How do you plan to protect your innovations? List any current trade marks, patents, designs you have registered. Do you have confidentiality agreements in place?]
R1A1, R1D1, R2A1, R2D2, R2B3, R3D1, R3A4, R3D4
10.1
11.Risk Management and Insurance Code No. Risk management: [List the potential risks (in order
of likelihood) that could impact the business in the table below.]
R1A2, R1B2, R2D2, R1C3, R1D3, R2A2, R2C2, R2B4, R2C3, R3D1,R3C3,
11.1
R1C4, R2A3, R2C4, R2D3 11.2 Insureance for Business assets and staff: [Provide details if you have insurance for staff and busisness assets in the event of a fire, burglary, or damage?]
12.Legal considerations and Operation
Code No. Legal: [List the legislation which will have some impact on the
running of your business R3A2, R3D2, 12.1 R2A3, R2C2 12.2 Production process / operation: [What is the process involved
in producing the products or services.. Is there a manufacturing process? Who is involved in the process? Are there any third parties involved? What is involved in delivering the service to your customers?]
R2D3, R2C2 12.3 Suppliers / inventory: [Who are your main suppliers? What do they supply to the business? How will you maintain a good relationship with them?]
R2A3, 12.4 Plant & equipment available: [List all current equipment avaliable in the table below]
Risk Likelihood
Impact
Strategy Idea Risk Conpetency
Risk Return of Investm. Risk
1 [List /describe all idea risks and the potential impact to your business.]
[List /describe all idea risks and the potential impact to your business.]
[List /describe all idea risks and the potential impact to your business.]
[Highly Unlikely, Unlikely, Likely, Highly Likely]
[High, Medium, Low]
[What actions will you take to minimise / mitigate the potential risk to your business?]
2 3 4

190
Production process / operation [ List all production cost in the table below], No.
Equipment Purchase date Purchase price Running cost
1 [e.g Fax Maxhine] [eg. 11/06/2018] [e.g GHs1000] [e.g GHs20 a month]
2 3 4
Plant & equipment required: [List all equipment needed to be purchase in the table below] No.
Equipment Purchase date Purchase price Running cost
1 [e.g Fax Maxhine] [eg. 11/06/2018] [e.g GHs1000] [e.g GHs20 a month]
2 3 4
Inventory: [List current inventory items in the table below. If you have a substantial inventory, you may prefer to attach a full inventory list to the back of this business plan.] No.
Inventory item Unit price Quantity in stock
Total cost
1 [Eg. Rice ] [e.g GHs15 / kg] [e.g 100k ilograms]
[e.g 100kg x GHs15 = GHs 1500]
2 3
Inventory: [List inventory items to be purchase in the table below. If you have to purchase substantial inventory, you may prefer to attach a full inventory list to the back of this business plan.] No.
Inventory item Unit price Quantity in stock
Total cost
1 [Eg. Rice ] [e.g GHs15 / kg] [e.g 100k ilograms]
[e.g 100kg x GHs15 = GHs 1500]
2 3 4
13.Technology Code No. Technology: [List all technology applied or to be
appliy in the business] R1D1, R1A4, R2C1, R1A4, R2D4
13.1

191
14.Sustainability Plan Code No. Technology (Software): [What technology do you
require? For example: website, point of sale software or accounting package? What will be the main purpose for each? What is the estimated cost of each technology solution?]
R1A1, R1D2, R1B3, R2A1, R2B1, R2C2, R3A1,
14.1
R1A2, R1D3, R2B2, R2C2, R2D1, R2A4, R3C2
14.2 Communication channels: [How can your customers get in contact with you? These channels can include: telephone (landline/mobile), post box, shopfront, email, fax, internet blog or social media channel.]
R2A2, R3B3, R2D1, R2B3, R2C4, R3A1, R3B1, R3C4
14.3
Payment types accepted: [What payment types will you accept. cash, credit, cheque, etc]
R1C1, R1B4, R1D4 , R2B4, R3A2, R3B2, R3D3
14.4 Credit policy: [What is your credit policy for customers/suppliers? How long is the credit period? What are your collection strategies/procedures? What credit does your business receive? What are the terms?]
R1B1, R1D1, R2B1, R2D2, R2A3, R2C3, R3A3,
14.5 Quality control: [Describe your quality control process. What checks or balances do you have in place to ensure the product or service you offer is produced to the same standard of quality? What steps do you take to meet product safety standards?]
R1D2, R2A4, R2D3, R3C1, R3A4, R3B3
14.6 Memberships & affiliations: [ Is your business a member of any particular industry association or club? Do you have any affiliations with any other organisation?]
R1B2, R1A4, R1D3, R2B2, R2D4, R3A1, R3D1, R3B4,
14.7 Environmental/resource impacts: [Describe the impact your business could potentially have on the environment. E.g. a particular manufacturing process may contribute negatively on the local water supply.]
R1C3, R1D4, R2A1, R2B3, R3D2
14.8 Community impact & engagement: [How does your environmental impact affect the local community? How can you engage the community in minimising your impact?]
R1A1, R1D1, R1C4, R1D3, R2A2, R2D1, R2B4, R3B1, R3A3, R3C4, R3D3
14.9 Risks/constraints: [List any risks/constraints to your business resulting from this environmental impact?]
R1A2, R1C1, R1D2, R2A3, R3A3,
14.1.1 Strategies: [What strategies will you implement to minimise/mitigate your environmental impact and any risks to your business? Will you conduct an environmental audit?]
R1C2 14.1.2 Action plan: [List your key sustainability/environmental milestones in the table below?]
No. Sustainability milestone Target Target date 1 [eg. Reduce waste generation] [40% reduction] [Month/Year] 2 3 4

192
15.S.W.O.T. Analysis Code No. S.W.O.T analysis: [List each of your businesses
strengths, weaknesses, opportunities or threats in the table below and then outline how you plan to address each of the weaknesses/threats.]
R1C1, R1B1, R1D4, R1A1, R2A1, R2B2, R2D2, R2C3, R3A1, R3B2, R3C3, R3D4
15.1
Strengths Weaknesses [e.g Efficiencylocation] [e.g High electricity costs]
Opportunities Threats [e.g customer loyalty]
[e.g High labour turnover]
16.Your competitors Code No. Copetitors: [How do you rate against your competitors? How
can your business improve on what they offer?] Competitor details: [List at least 6 key competitors in the table below.]
R1D1, R2A2, R2B3, R2D3, R3A2, R3B3
16.1
Competitor
Established date
Size Market share (%)
Value to customers
Strengths Weaknesses
1 [Competitor name]
[When were they established?]
[Number of staff and/or turnover]
[Estimated % of market share]
[Unique value to customers. E.g. quality, price or service?]
[ Competitor's main strengths?]
[Competitor's main weaknesses?]
2 3 4 5 6

193
17.Sales Code No. Promotional strateg: [What strategies do you have for
promoting and advertising your products/services in the next 12 months?]
R1D2, R3A3 17.1
Planned promotion type Expected business improvement Cost
(GHs) Target date
[eg. Print media advertising, online advertising, social media campaign or event. Etc.]
[How do you expect it will improve your business success?]
[GHs00]
[Month/Year]
Code No. Sales & marketing objectives: [Who makes up your
sales team? What sales techniques will they use? What tools/material will they use to help sell your products/services? What sales goals/targets will they meet?]
R1A4, R1B3, R1C4, R2C4, R2D4, R3B1, R3A4
17.2
R1A1, R1D4, R2B1, R2C1, R2A4, R3A1, R3B2
17.3 Unique selling position: [Why do you have an advantage over your competitors? How will your products/services succeed in the market where others may have failed?]
R1D1, R2A1, R2C2, R2D1, R3B3,
17.4 Salling & distribution channels: [e.g. Shopfront, internet, direct mail, export or wholesale]
Channel type Products/servic
es Percentage of sales (%)
Advantages Disadvantages
[e.g. Shopfront, internet, direct mail, export or wholesale]
[List all the products/services sold via this channel]
[What percentage of overall sales do you expect to sell via this channel?]
[What advantages are there of using this channel for these products?]
[What challenges do you expect to face using this channel? How will you overcome them?]

194
18.The Future Code No. Vision statement: [What is your business' vision
statement? It should briefly outline your future plan for the business and include your overall goals.]
R1D2, R2A2, R2B4R2C3, R3C1, R3A3, R3B4, R3D4
18.1
R1A2, R1D3, R2A4, R2A3, R2C4, R2D3, R3D1, R3A4
18.2 Mission statement: [What is your business' mission statement? I.e. how will you achieve your vision?]
R1B4, R1D4, R2B2, R2C1, R3A1, R3B2, R3D1,
18.3 Goals/objectives: [What are your short & long term goals? What activities will you undertake to meet them?]
R1D1, R2A1, R2C2, R2D2, R3A2, R3B3
18.4 Action plan: [write the action plan in the table below]
Milestone Date of
expected completion
Person responsible
[What are the business milestones that you need to complete starting from today?]
[When do you expect to complete them?]
[Who is responsible for delivering this milestone?]
19.The Finances Code No. Required staff: [List all required staff in needed to run a
successful business in the table below.] R1B4, R2B4, R2C4, R2D3
19.1
20.Supporting documentation Code No. Financial objectives: [List your key financial objectives.
These can be in the form of sales or profit targets. You could also list your main financial management goals such as cost reduction targets.]
R1D2, R2D1, R2B3, R3A3,
20.1
R1A4, R2A2, R3A4 20.2 Finance required: [How much money up-front do you need? Where will you obtain the funds? What portion will you be seeking from loans, investors, business partners, friends or relatives, venture capital or government funding? How much of your own money are you contributing towards the business?]
R2B4 20.3 Assumptions: [List your financial assumptions. These can include seasonal adjustments, drought or interest rates etc.]
R1C1, R1D4, R3A1 20.4 Start-up costs for the 1st year: [attach your own start up costing sheet at the back of this business plan.]

195
R2A4, R3A2 20.5 Profit and loss forecast: [Attach your own profit or loss sheet at the back of this business plan]
R1A1, R2A1, R3A3, R3B4,
\20.6 Expected cash flow: [Attach your own cash flow projections sheet at the back of this business plan]
R1C2, R3D2, R3A4
20.7
Any other Supporting Documents: Attached is my supporting documentation in relation to this business plan. The attached documents include: [List all of your attachments here. These may include resumes, inventory list, survey/questionnaire and/or financial documents.].
Reference: Austrilai governement business plan guide

20.6 17.3 14.9 14.1 10.1 9.4 9.1 8.3 6.7 3.1 2.2 1.1.2 1.7 1.1
18.2 14.1.1 14.2 11.1 9.5 8.4 7.1 3.2 2.3 1.1.3 1.8 1.2
15.1 10.4 14.5 9.5 8.3 8.2 5.1 2.3 1.1.3 1.8 1.1
14.7 11.1 8.4 6.1 2.4 1.1.4 1.9 1.2
20.4 14.1.1 14.4 9.1 7.2 3.2 2.1 1.1.1 1.2
20.7 14.1.2 14.7 9.6 4.1 2.2 1.1.2 1.3
18.4 17.4 16.1 14.9 14.5 13.1 10.1 9.2 9.1 7.1 3.1 2.1 1.1.1 1.6 1.5 1.1
20.1 18.1 17.1 14.1.1 14.6 14.1 11.1 9.3 7.2 3.2 2.2 1.1.2 1.7 1.2
1.7 1.1.2 2.2 4.1 7.3 9.1 14.4 18.3 15.1 19.1
1.4 1.9 1.1.4 2.4 5.1 8.4 9.5 12.1 14.4 14.8 15.1 17.3 18.3 20.4
1.6 1.1.1 2.1 5.1 7.3 9.3 9.7 13.1 14.7 17.2 20.2 15.1
1.5 1.9 1.1.4 2.4 4.1 7.2 9.2 9.6 11.2 14.3 15.1 18.3
1.4 1.1.1 2.1 3.1 3.2 7.2 9.3 14.1 17.2
1.9 1.1.4 3.1 7.4 11.2 14.9 17.2
1.8 1.1.3 2.4 5.1 11.1 14.8 15.1 14.9
1.3 1.8 1.1.3 2.3 4.1 8.3 9.4 11.2 14.2 14.7 12.2 18.2 20.3 14.9
Originality / Uniqueness Risks
(R1A) R1A3
R1A2
Operation / Set-up Risk (R1B)
R1B3 R1B4
R1B2 R1B1
Technology Risks (R1C)
R1C3 R1C4
R1C1 R1C2 Acceptability / Adaptability Risks (R1D)
R1D1
R1D3
R1D2
R1D4
Business Idea Risk (R1)
R1A1
R1A4
Business Idea Risk (R1)
APPENDIX B
Risk Factors Coded
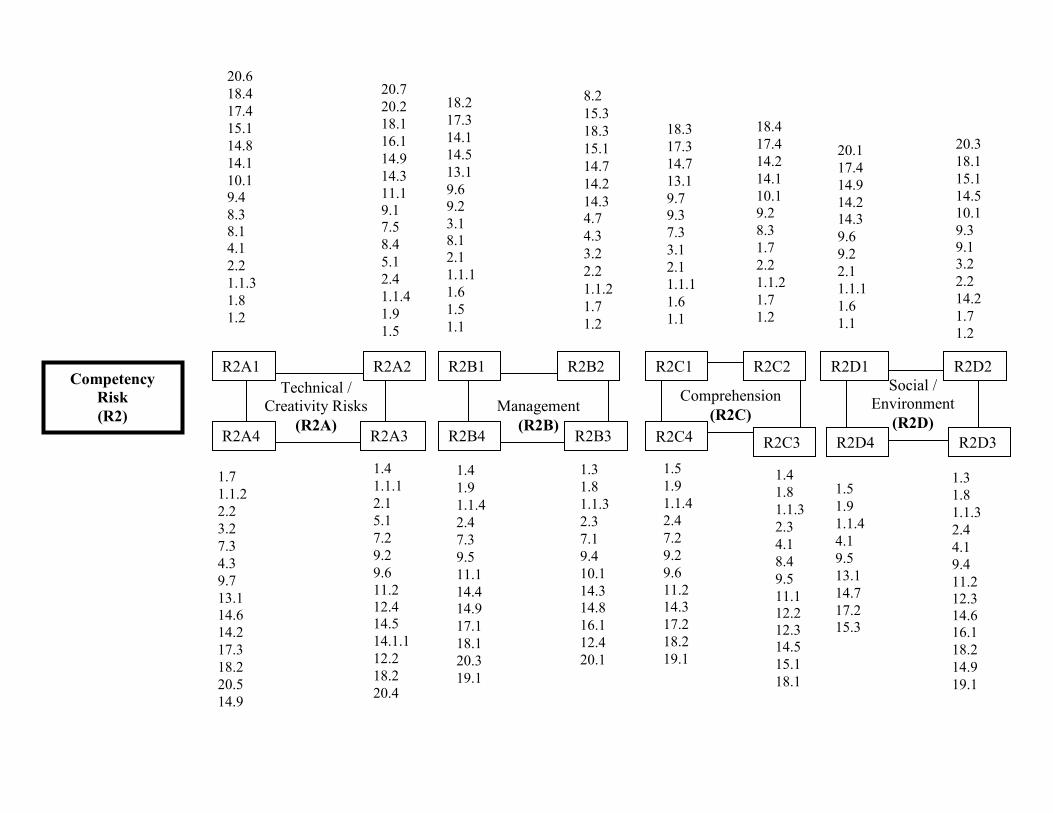
20.7 20.2 18.1 16.1 14.9 14.3 11.1 9.1 7.5 8.4 5.1 2.4 1.1.4 1.9 1.5
8.2 15.3 18.3 15.1 14.7 14.2 14.3 4.7 4.3 3.2 2.2 1.1.2 1.7 1.2
18.3 17.3 14.7 13.1 9.7 9.3 7.3 3.1 2.1 1.1.1 1.6 1.1
18.4 17.4 14.2 14.1 10.1 9.2 8.3 1.7 2.2 1.1.2 1.7 1.2
20.1 17.4 14.9 14.2 14.3 9.6 9.2 2.1 1.1.1 1.6 1.1
20.3 18.1 15.1 14.5 10.1 9.3 9.1 3.2 2.2 14.2 1.7 1.2
18.2 17.3 14.1 14.5 13.1 9.6 9.2 3.1 8.1 2.1 1.1.1 1.6 1.5 1.1
20.6 18.4 17.4 15.1 14.8 14.1 10.1 9.4 8.3 8.1 4.1 2.2 1.1.3 1.8 1.2
1.5 1.9 1.1.4 4.1 9.5 13.1 14.7 17.2 15.3
1.3 1.8 1.1.3 2.4 4.1 9.4 11.2 12.3 14.6 16.1 18.2 14.9 19.1
1.7 1.1.2 2.2 3.2 7.3 4.3 9.7 13.1 14.6 14.2 17.3 18.2 20.5 14.9
1.4 1.1.1 2.1 5.1 7.2 9.2 9.6 11.2 12.4 14.5 14.1.1 12.2 18.2 20.4
1.4 1.9 1.1.4 2.4 7.3 9.5 11.1 14.4 14.9 17.1 18.1 20.3 19.1
1.3 1.8 1.1.3 2.3 7.1 9.4 10.1 14.3 14.8 16.1 12.4 20.1
1.5 1.9 1.1.4 2.4 7.2 9.2 9.6 11.2 14.3 17.2 18.2 19.1
1.4 1.8 1.1.3 2.3 4.1 8.4 9.5 11.1 12.2 12.3 14.5 15.1 18.1
Technical / Creativity Risks
(R2A) R2A3
R2A2
Management (R2B)
R2B3 R2B4
R2B2 R2B1
Comprehension (R2C)
R2C3 R2C4
R2C1 R2C2 Social /
Environment (R2D)
R2D1
R2D3
R2D2
R2D4
R2A1
R2A4
Competency Risk (R2)

18.1 14.6 3.2 2.1 1.1.1 1.6 1.1
20.5 18.4 12.4 16.1 14.4 12.1 9.6 9.2 7.2 3.2 2.2 1.1.2 1.7 1.3
20.4 18.3 17.3 15.1 14.7 14.3 14.1 9.5 8.4 6.1 4.1 2.1 1.1.1 1.6 1.2
18.2 17.2 14.9 14.3 9.2 2.3 1.1.3 1.8 1.2
18.3 17.3 15.1 14.4 9.3 2.4 1.1.4 1.9 1.3
15.1 14.2 10.1 2.2 1.1.2 1.7 1.2
11.1 20.7 14.8 12.1 9.2 5.1 2.4 1.1.3 1.8 1.2
18.3 14.7 11.1 10.1 2.3 1.1.2 1.7 1.1
1.3 1.9 19.4 2.4 3.1 8.2 9.1 9.4 10.1 14.1 14.6 1.1.2 17.2 18.2 20.2 20.7
1.4 1.8 1.1.3 2.3 4.1 7.3 9.3 8.7 13.1 14.5 14.9 14.1.1 17.1 18.1 20.1 20.6
1.7 1.1.2 3.2 4.1 9.5 14.7 18.1 20.6
1.3 1.1.1 2.1 3.2 9.1 9.4 14.6 16.1 17.4 18.4 14.9
1.5 1.9 1.1.4 2.4 14.3 14.9
1.3 1.8 1.1.3 2.3 11.1 14.8
1.3 1.1.1 2.2 3.2 10.1 14.6 15.1 18.1
1.3 1.9 1.1.4 3.1 7.1 8.4 9.1 14.4 14.9
Financial Risks
(R3A) R3A3
R3A2
Economic Risks (R3B)
R3B3 R3B4
R3B2 R3B1
Cultural Risks (R3C)
R3C3 R3C4
R3C1 R3C2
Political / Legal Risks (R3D)
R3D1
R3D3
R3D2
R3D4
R3A1
R3A4
Return on Investment Risk
(R3)

PART II
Summary of Risk Factors Codes
R1A1 R1A2 R1A3 R1A4 R1B1 R1B2 R1B3 R1B4 R1C1 R1C2 R1C3 R1C4 R1D1 R1D2 R1D3 R1D420.6 18.2 1.5 1.6 0.4 14.7 1.4 1.7 20.4 20.7 1.8 1.9 18.4 20.1 1.3 1.417.3 14.1.1 1.9 1.1.1 14.5 11.1 1.1.1 1.1.2 14.1.1 14.1.2 1.1.3 1.1.4 17.4 18.1 1.8 1.914.9 14.2 1.1.4 2.1 9.5 8.4 2.1 2.2 14.4 14.7 2.4 3.1 16.1 17.1 1.1.3 1.1.414.1 11.1 2.4 5.1 8.3 6.1 3.1 4.1 7.2 9.6 5.1 7.4 14.9 14.1.1 2.3 2.410.1 9.5 4.1 7.3 5.1 2.4 3.2 7.3 3.2 4.1 11.1 11.2 14.5 14.6 4.1 5.19.4 8.4 7.2 9.3 2.3 1.1.4 7.2 9.1 2.1 2.2 14.8 14.9 13.1 14.1 8.3 8.48.3 7.1 9.2 9.7 1.1.3 1.9 9.3 14.4 1.1.1 1.1.2 15.1 17.2 10.1 11.1 9.4 9.56.7 3.2 9.6 13.1 1.8 1.2 14.1 18.3 1.2 1.3 9.2 9.3 11.2 12.13.1 2.3 11.2 14.7 1.1 17.2 7.1 7.2 14.2 14.42.2 1.1.3 14.3 17.2 3.1 3.2 14.7 14.8
1.1.2 1.8 15.1 20.2 2.1 2.2 12.2 15.11.7 1.2 18.3 1.1.1 1.1.2 18.2 17.31.1 1.6 1.7 20.3 18.3
1.5 1.2 20.41.1
Originality / Uniqueness Risk (R1A) Technology Risks (R1B) Operation / Set-Up Risk (R1C) Acceptability / Adaptability R1D
CODES OF BUSINESS IDEA RISK (R1) FACTORS

R2A1 R2A2 R3A3 R2A4 R2B1 R2B2 R2B3 R2B4 R2C1 R2C2 R2C3 R2C4 R2D1 R2D2 R2D3 R2D420.6 20.7 1.4 1.7 18.2 15.3 1.3 1.4 18.3 18.4 1.4 1.5 20.1 20.3 1.3 1.518.4 20.2 1.1.1 1.1.2 17.3 18.3 1.8 1.9 17.3 17.4 1.8 1.9 17.4 18.1 1.8 1.917.4 18.1 2.1 2.2 14.1 15.1 1.1.3 1.1.4 14.7 14.2 1.1.3 1.1.4 14.9 15.1 1.1.3 1.1.415.1 16.1 5.1 3.2 14.5 14.7 2.3 2.4 13.1 14.1 2.3 2.4 14.2 14.5 2.4 4.114.8 14.9 7.2 7.3 13.1 14.2 7.1 7.3 9.7 10.1 4.1 7.2 14.3 10.1 4.1 9.514.1 14.3 9.2 4.3 9.6 14.3 9.4 9.5 9.3 9.2 8.4 9.2 9.6 9.3 9.4 13.110.1 11.1 9.6 9.7 9.2 4.7 10.1 11.1 7.3 8.3 9.5 9.6 9.2 3.2 11.2 14.79.4 7.5 11.2 13.1 3.1 4.3 14.3 14.4 3.1 1.7 11.1 11.2 2.1 2.2 14.6 17.28.3 8.4 14.5 14.6 2.1 3.2 14.8 14.9 2.1 2.2 14.5 14.3 1.1.1 14.2 16.1 15.34.1 5.1 14.1.1 14.2 1.1.1 2.2 16.1 17.1 1.1.1 1.1.2 15.1 17.2 1.6 1.7 18.22.2 2.4 12.2 17.3 1.6 1.1.2 12.4 18.1 1.6 1.7 18.1 18.2 1.1 1.2
14.3 1.1.4 18.2 18.2 1.5 1.7 20.1 20.3 1.1 1.21.8 1.9 20.4 20.5 1.1 1.21.2 1.5
CODES OF COMPETENCY RISK (R2) FACTORS
Technical and Creativity (R2A) Management (R2B) Comprehension (R2C) Social / Evironment

R3A1 R3A2 R3A3 R3A4 R3B1 R3B2 R3B3 R3B4 R3C1 R3C2 R3C3 R3C4 R3D1 R3D2 R3D3 R3D420.4 20.5 1.4 1.3 18.2 18.3 1.3 1.7 18.1 14.2 1.3 1.5 18.3 20.7 1.3 1.318.3 18.4 1.8 1.9 17.2 17.3 1.1.1 1.1.2 14.6 10.1 1.8 1.9 14.7 14.8 1.9 1.1.117.3 12.4 1.1.3 19.4 14.9 15.1 2.1 3.2 3.2 2.2 1.1.3 1.1.4 11.1 12.1 1.1.4 2.215.1 16.1 2.3 2.4 14.3 14.4 3.2 4.1 2.1 1.1.2 2.3 2.4 1.7 9.2 3.1 3.214.7 14.7 4.1 3.1 9.2 9.3 9.4 9.5 1.1.1 1.7 11.1 14.3 2.3 5.1 7.1 10.114.3 14.4 7.3 8.2 2.3 2.4 14.6 14.7 1.6 1.2 14.8 14.9 1.1.2 2.4 8.4 14.611.1 12.1 9.3 9.4 1.1.3 1.1.4 16.1 18.1 1.1 1.7 1.1.3 14.4 15.19.5 9.6 8.7 10.1 1.8 1.9 17.4 20.6 1.1 1.8 14.9 18.18.4 9.2 13.1 14.1 1.2 1.3 18.4 1.26.1 7.2 14.5 14.64.1 3.2 14.1.1 1.1.22.1 2.2 17.1 17.2
1.1.1 1.1.2 18.1 18.21.6 1.7 20.1 20.21.2 1.3 20.6 20.7
Financial Risks Economic Risk Cultural Risks Political ad Legal Risks
CODES OF RETUR ON INVESTMENT RISKS (R3) FACTORS

15.1 3
10.4 1
14.5 2
9.5 3
8.3 3
8.2 1
5.1 3
2.3 3
1.1.3 4
1.8 4
1.1 3
20.4 2
14.1.1 3
14.4 3
9.1 4
7.2 4
3.2 3
2.1 4
1.1.1 4
1.2 4
20.7 1
14.1.2 1
14.7 4
9.6 2
4.1 4
2.2 4
1.1.2 4
1.3 2
18.4 1
17.4 1
16.1 1
14.9 3
14.5 2
13.1 2
10.1 2
9.2 1
9.1 4
7.1 2
3.1 3
2.1 4
1.1.1 4
1.6 2
1.5 2
1.1 3
20.1 1
18.1 1
17.1 1
14.1.1 3
14.6 1
14.1 3
11.1 4
9.3 2
7.2 4
3.2 4
2.2 4
1.1.2 4
1.7 3
1.2 4
20.6 1
17.3 2
14.9 3
14.1 3
10.1 2
9.4 2
9.1 4
8.3 3
6.7 1
3.1 3
2.2 4
1.1.2 4
1.7 3
1.1 3
18.2 2
14.1.1 3
14.2 2
11.1 4
9.5 3
8.4 3
7.1 2
3.2 4
2.3 3
1.1.3 4
1.8 4
1.2 4
14.7 4
11.1 4
8.4 3
6.1 1
2.4 3
1.1.4 4
1.9 4
1.2 4
1.4 1
1.9 4
1.1.4 4
2.4 1
5.1 3
8.4 3
9.5 3
12.1 1
14.4 3
14.8 2
15.1 2
17.3 2
18.3 3
20.4 2
1.9 4
1.1.4 1
3.1 3
7.4 1
11.2 2
14.9 3
17.2 2
1.6 2
1.1.1 4
2.1 2
5.1 3
7.3 2
9.3 2
9.7 1
13.1 2
14.7 4
17.2 2
20.2 1
1.5 2
1.9 4
2.4 3
4.1 4
7.2 4
9.2 1
9.6 2
11.2 2
14.3 3
15.1 3
18.3 3
1.7 3
1.1.2 4
2.2 4
4.1 4
7.3 2
9.1 4
14.4 3
18.3 3
15.1 3
19.1 1
1.4 1
1.1.1 4
2.1 4
3.1 1
3.2 4
7.2 4
9.3 1
14.1 3
17.2 2
1.3 2
1.8 4
1.1. 4
2.3 3
4.1 4
8.3 3
9.4 2
11.2 2
14.2 2
14.7 4
12.2 1
18.2 2
20.3
1.8 4
1.1.3 4
2.4 3
5.1 3
11.1 4
14.8 2
15.1 2
14.9 1
R1A
R1A3
R1A2
R1B
R1B3 R1B4
R1B2 R1B1
R1C
R1C3 R1C4
R1C1 R1C2
R1D
R1D1
R1D3
R1D2
R1D4
Business Idea Risk (R1)
R1A1
R1A4
R1
PART III RISK FACTORS CODES AND FREQUENCIES

20.1 1
17.4 2
14.9 3
14.2 3
14.3 4
9.6 4
9.2 4
2.1 4
1.1.1 4
1.6 3
1.1 3
20.6 1
18.4 1
17.4 2
15.1 3
14.8 2
14.1 3
10.1 4
9.4 3
8.3 8.1
2
2
4.1 3
2.2 4
1.1.3 4
1.8 3
1.2 4
20.7 1
20.2 1
18.1 3
16.1 3
14.9 3
14.3 4
11.1 9.1
4
2
7.5 1
8.4 1
5.1 2
2.4 3
1.1.4 3
1.9 4
1.5 4
18.2 4
17.3 3
14.1 3
14.5 4
13.1 3
9.6 4
9.2 4
3.1 8.1
2
2
2.1 4
1.1.1 4
1.6 3
1.5 4
1.1 3
20.3 2
18.1 3
15.1 3
14.5 4
10.1 4
9.3 9.1
2
2
3.2 3
2.2 4
14.2 3
1.7 4
1.2 4
18.4 1
17.4 2
14.2 3
14.1 3
10.1 4
9.2 4
8.3 2
2.2 4
1.1.2 3
1.7 4
1.2 4
18.3 2
17.3 3
14.7 3
13.1 3
9.7 2
9.3 2
7.3 3
3.1 2
2.1 4
1.1.1 4
1.6 3
1.1 3
8.2 1
15.3 1
18.3 2
15.1 3
14.7 3
14.2 2
14.3 4
4.7 1
4.3 2
3.2 3
2.2 4
1.1.2 3
1.7 4
1.2 4
1.4 3
1.8 3
1.1.3 4
2.3 2
4.1 3
8.4 1
9.5 1
11.1 12.2
2
1
14.5 4
15.1 1
18.1 1
1.5 4
1.9 4
1.1.4 1
4.1 3
9.5 2
13.1 3
14.7 3
17.2 1
15.3 1
1.3 2
1.8 3
1.1.3 4
2.4 1
4.2 1
9.4 3
11.2 12.3
2
1
14.6 2
16.1 3
18.2 4
14.9 1
19.1 3
1.4 3
1.1.1 1
2.1 4
5.1 2
7.2 2
9.2 4
9.6 4
11.2 12.4
2
2
14.5 4
14.1.1 1
12.2 1
18.2 4
20.4 1
1.4 3
1.9 4
1.1.4 3
2.4 3
7.3 3
9.5 2
11.1 1
14.4 1
14.9 3
17.1 1
18.1 3
20.3 2
19.1 3
1.3 2
1.8 3
1.1.3 4
2.3 2
7.1 1
9.4 3
10.1 4
14.3 4
14.8 2
16.1 3
12.4 2
20.1
1.5 4
1.9 4
1.1.4 3
2.4 3
7.2 2
9.2 1
9.6 4
11.2 2
14.3 4
17.2 1
18.2 4
19.1 3
1.7 4
1.1.2 3
2.3 1
3.2 3
7.3 3
4.3 2
9.7 2
13.1 3
14.6 2
14.2 3
17.3 3
18.2 4
20.5 1
R2A
R2A3
R2A2
R2B
R2B3 R2B4
R2B2 R2B1
R2C
R2C3 R2C4
R2C1 R2C2
R2D
R2D1
R2D3
R2D2
R2D4
R2A1
R2A4
R2
RISK FACTORS CODES AND FREQUENCIES

20.4 1
18.3 3
17.3 2
15.1 4
14.7 1
14.3 1
14.1 2
9.5 2
8.4 2
6.1 1
4.1 2
2.1 3
1.1.1 4
1.6 2
1.2 4
20.7 2
14.8 2
12.1 2
9.2 3
5.1 1
2.4 3
1.1.3 3
1.8 3
1.2 4
20.5 1
18.4 2
17.4 2
16.1 2
14.4 3
12.1 2
9.6 1
9.2 3
7.2 1
3.2 4
2.2 3
1.1.2 4
1.7 4
1.3 4
18.2 2
17.2 2
14.9 4
14.3 2
9.2 3
2.3 3
1.1.3 3
1.8 3
1.2 4
18.3 3
17.3 2
15.1 4
14.4 3
9.3 2
2.4 3
1.1.4 3
1.9 3
18.3 3
14.7 1
10.1 3
2.3 3
1.1.2 4
1.7 4
1.1 2
18.1 3
14.6 4
3.2 3
2.1 3
1.1.1 4
1.6 1
1.1 2
15.1 4
14.2 1
10.1 3
2.2 3
1.1.2 4
1.7 4
1.2 4
1.9 3
19.4 1
2.4 3
3.1 1
8.2 9.1
1
3
9.4 2
10.1 3
14.1 2
14.6 4
17.2 2
18.2 2
20.2 1
20.7 2
1.7 4
1.1.2 4
3.2 4
4.1 2
9.5 2
14.7 1
18.1 3
20.6 2
1.3 4
1.1.1 4
2.2 3
3.2 4
14.6 4
15.1 4
18.1 3
1.9 3
1.1.4 3
3.1 1
7.1 1
8.4 9.1
2
3
14.4 3
14.9 4
1.4 1
1.8 1
1.1.3 3
2.3 2
7.3 1
9.3 2
8.7 1
13.1 1
14.5 14.9
1
4
14.1.1 1
17.1 1
18.1 3
20.1 1
20.6 2
1.3 4
1.1.1 4
2.1 3
3.2 9.1
4
3
9.4 2
14.6 4
16.1 2
17.4 2
18.4 2
1.5 1
1.9 3
1.1.4 3
2.4 3
14.3 2
14.9 4
1.3 4
1.8 3
1.1.3 1
2.3 2
11.1 4
14.8 2
R3A
R3A3
R3A2
R3B
R3B3 R3B4
R3B2 R3B1
R3C
R3C3 R3C4
R3C1 R3C2
R3D
R3D1
R3D3
R3D2
R3D4
R3A1
R3A4
R3
RISK FACTORS CODES AND FREQUENCIES

PART IV
SUMMARY OF RISK FACTORS FREQUENCIES
R1A1 R1A2 R1A3 R1A4 R1B1 R1B2 R1B3 R1B4 R1C1 R1C2 R1C3 R1C4 R1D1 R1D2 R1D3 R1D41 2 2 2 3 4 1 3 2 1 4 4 1 1 2 12 3 4 4 1 4 4 4 3 1 4 1 1 1 4 43 2 3 2 2 3 4 4 3 4 3 3 1 1 4 43 4 4 3 3 1 1 4 4 2 3 1 3 3 3 12 3 4 2 3 3 4 2 4 4 4 2 2 1 4 32 3 1 2 1 4 4 4 3 4 2 3 2 3 3 34 2 2 1 3 4 1 3 4 4 2 2 2 4 2 33 4 2 2 3 4 3 3 4 2 1 1 2 2 11 3 3 4 4 2 3 4 4 4 2 33 4 3 2 4 1 2 4 4 24 4 3 1 3 3 4 1 24 4 4 4 2 23 4 3 33 2 4 2
23
Ʃƒr 38 38 31 25 30 27 24 31 31 22 23 16 32 39 33 34
Originality / Uniqueness Risk (R1A) Technology Risks (R1B) Operation / Set-Up Risk (R1C) Acceptability / Adaptability R1D
FREQUENCIES OF BUSINESS IDEA RISK (R1) FACTORS CODES

R2A1 R2A2 R3A3 R2A4 R2B1 R2B2 R2B3 R2B4 R2C1 R2C2 R2C3 R2C4 R2D1 R2D2 R2D3 R2D41 1 3 4 4 1 2 3 2 1 3 4 1 2 2 41 1 1 3 3 1 3 4 3 2 3 4 2 3 3 42 3 4 1 3 2 4 3 3 3 4 3 3 3 4 13 3 2 3 4 3 2 3 3 3 2 3 3 4 1 32 3 2 3 3 3 1 3 2 4 3 2 4 4 1 23 4 4 2 4 2 3 2 2 4 1 1 4 2 3 34 4 4 2 4 4 4 1 3 2 1 4 4 2 2 33 2 2 3 2 1 4 1 2 4 2 2 4 3 1 12 1 2 2 2 2 2 3 4 3 1 4 4 4 2 12 1 4 3 4 3 3 1 4 4 4 1 3 3 33 2 1 3 4 4 2 3 3 4 1 4 3 4 44 3 1 4 3 3 2 3 1 3 4 14 3 4 1 4 4 3 33 4 1 3 44 4
Ʃƒr 41 39 35 34 47 37 30 32 34 34 26 35 35 38 30 22
FREQUENCIES OF OF COMPETENCY RISK (R2) FACTORS CODES
Technical and Creativity (R2A) Management (R2B) Comprehension (R2C) Social / Evironment

R3A1 R3A2 R3A3 R3A4 R3B1 R3B2 R3B3 R3B4 R3C1 R3C2 R3C3 R3C4 R3D1 R3D2 R3D3 R3D41 1 1 3 2 3 4 4 3 4 4 1 3 2 3 43 2 1 1 2 2 4 4 4 1 3 3 1 2 3 42 2 3 3 4 4 3 4 3 3 1 3 3 2 1 34 2 2 1 2 3 4 2 3 3 2 3 3 3 1 41 3 1 1 3 2 3 2 4 4 4 2 4 1 2 41 2 2 3 3 3 2 1 1 4 2 4 4 3 3 42 1 1 2 3 3 4 3 2 4 2 3 3 32 3 1 3 3 3 2 2 3 42 1 1 2 4 2 41 4 4 4 22 3 1 23 4 1 24 4 3 12 4 1 24 2
Ʃƒr 34 36 25 30 26 23 30 22 20 23 16 16 20 23 20 26
Financial Risks Economic Risk Cultural Risks Political ad Legal Risks
FREQUENCIES OF RETUR ON INVESTMENT RISKS (R3) FACTORS CODES
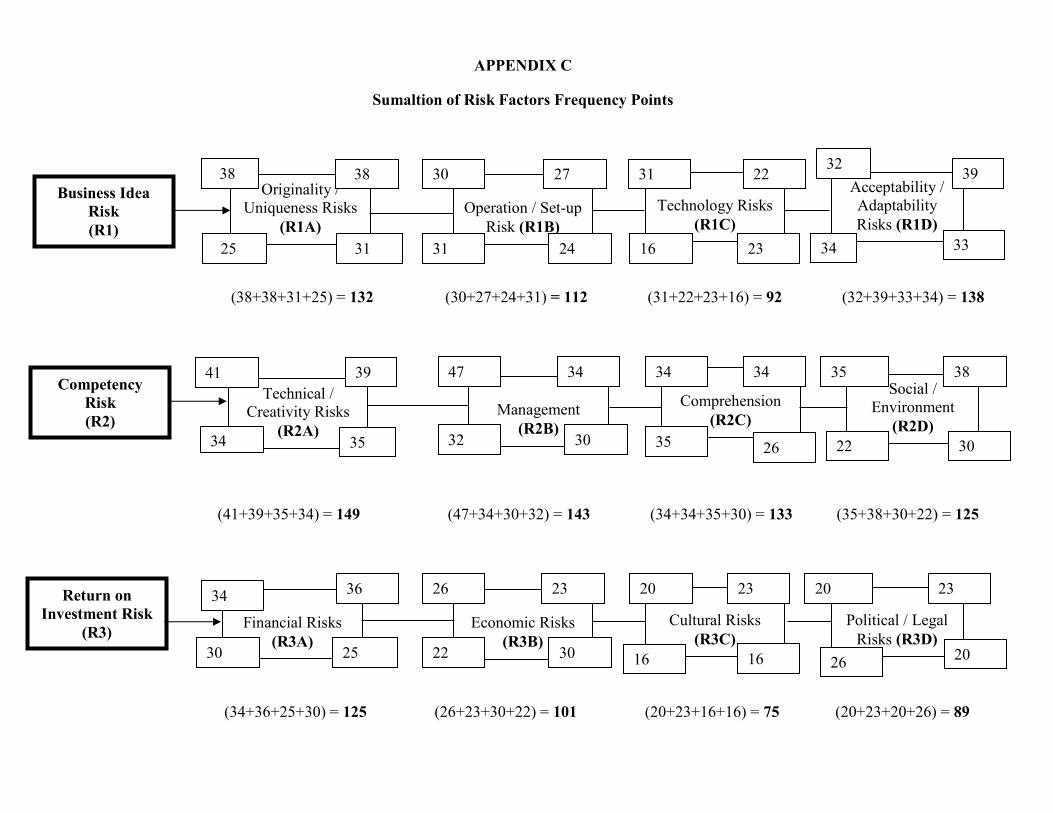
APPENDIX C
Sumaltion of Risk Factors Frequency Points
(38+38+31+25) = 132 (30+27+24+31) = 112 (31+22+23+16) = 92 (32+39+33+34) = 138
(41+39+35+34) = 149 (47+34+30+32) = 143 (34+34+35+30) = 133 (35+38+30+22) = 125
(34+36+25+30) = 125 (26+23+30+22) = 101 (20+23+16+16) = 75 (20+23+20+26) = 89
Originality / Uniqueness Risks
(R1A) 31
38
Operation / Set-up Risk (R1B)
24 31
27 30
Technology Risks (R1C)
23 16
31 22 Acceptability / Adaptability Risks (R1D)
32
33
39
34
Business Idea Risk (R1)
38
25
Technical / Creativity Risks
(R2A) 35
39
Management (R2B)
30 32
34 47 Comprehension
(R2C)
26 35
34 34 Social /
Environment (R2D)
35
30
38
22
41
34
Competency Risk (R2)
Financial Risks
(R3A) 25
36
Economic Risks (R3B)
30 22
23 26
Cultural Risks (R3C)
16
20 23
Political / Legal Risks (R3D)
20 23
30
Return on Investment Risk
(R3)
34
20 26 16
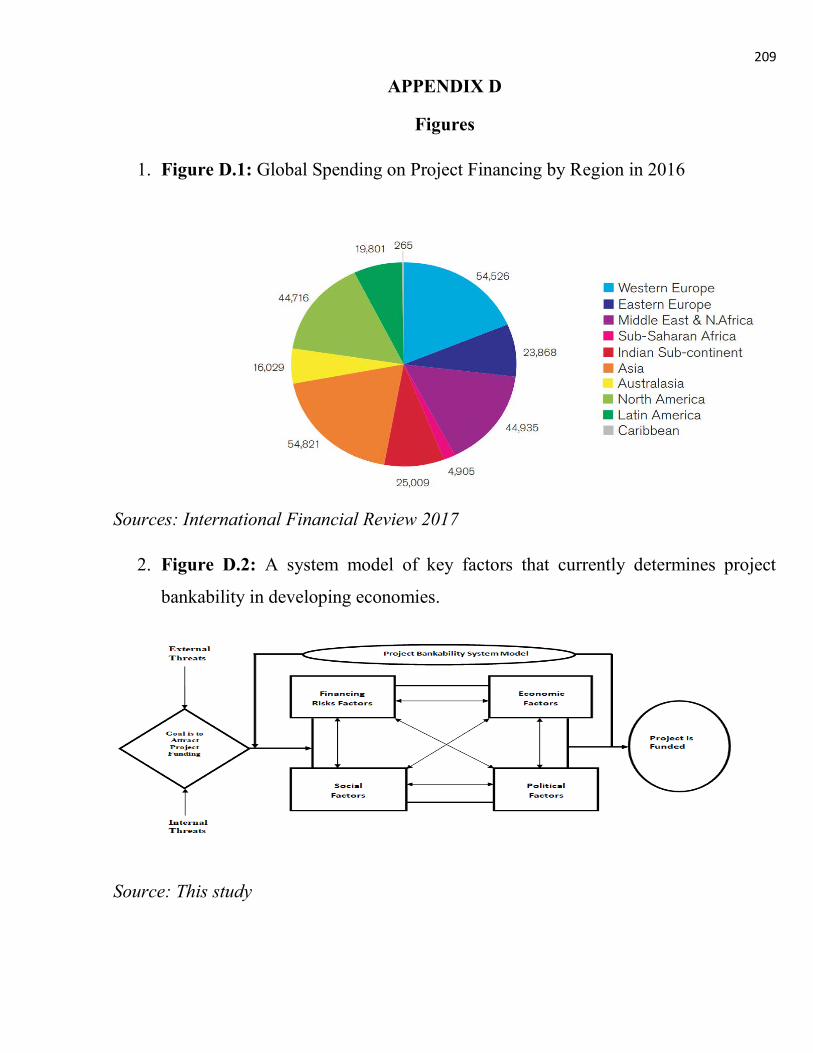
209
APPENDIX D
Figures
1. Figure D.1: Global Spending on Project Financing by Region in 2016
Sources: International Financial Review 2017
2. Figure D.2: A system model of key factors that currently determines project
bankability in developing economies.
Source: This study
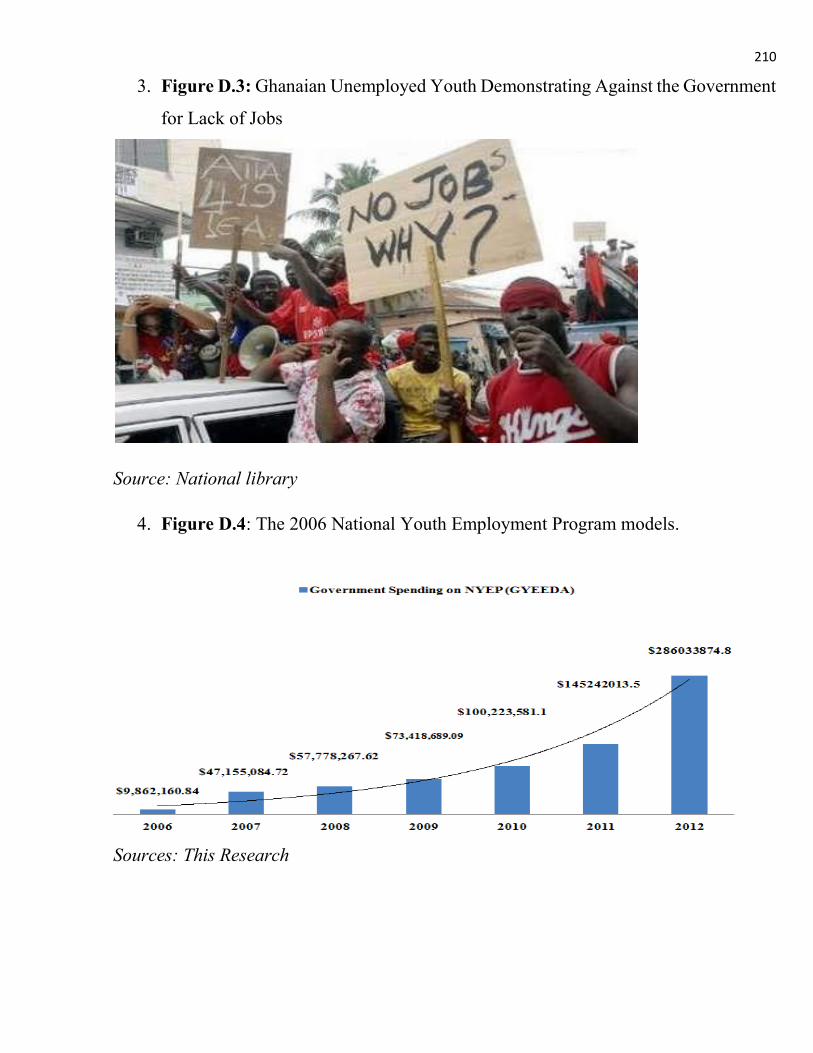
210
3. Figure D.3: Ghanaian Unemployed Youth Demonstrating Against the Government
for Lack of Jobs
Source: National library
4. Figure D.4: The 2006 National Youth Employment Program models.
Sources: This Research

211
5. Figure D.5: Government Spending on Ghana Youth Employability and
Entrepreneurship Development Agency Programs
Source: The research data.
6. Figure D.6 Project Financial Planning
Source: This study

212
7. Figure D.7: Functions of Financial Management in Project Development and Implementation
Source: This study
8. Figure D.8a: Simple Management Controls System.
Adopted from: Fundamentals of Management Control – Françoise Giraud. Pearson Education France)

213
9. Figure D.8b: The Four Basic Steps Involved in Organizational Control
Source: Mason C., Talya B., and Berrin E., (2010)
10. Figure D.8c: Project Monitoring and Control Cycle
Sources: Samuel Labi and Fred Moavenzadeh, (2007).
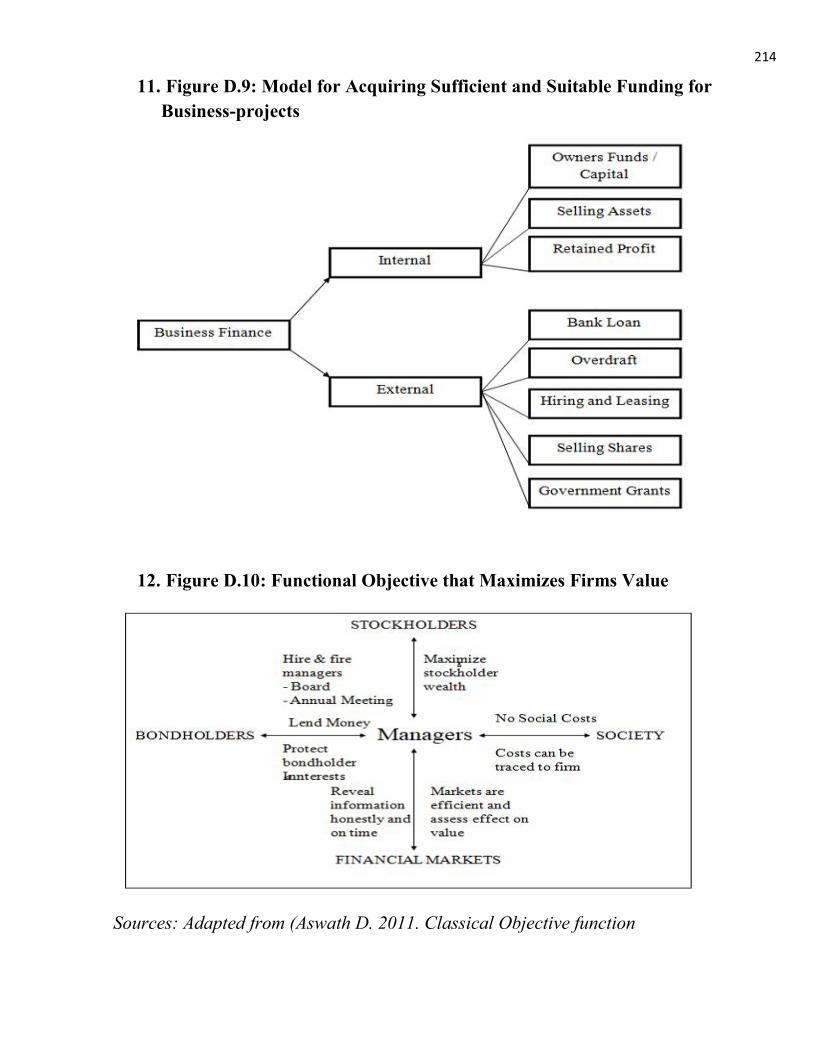
214
11. Figure D.9: Model for Acquiring Sufficient and Suitable Funding for Business-projects
12. Figure D.10: Functional Objective that Maximizes Firms Value
Sources: Adapted from (Aswath D. 2011. Classical Objective function

215
13. Figure D.11: The Pyramidal Model of Business-project Financing Decision Process
Sources: This study
14. Figure D.12: The Three Forms of Business-project Investment which SMEs Entrepreneurs Can Venture

216
15. Figure D.13: Investment characteristics which this study believes investors must pay critical attention to before they venture into any form of business project.
Sources: This study
16. Figure D.14 Finance types available for projects implementation
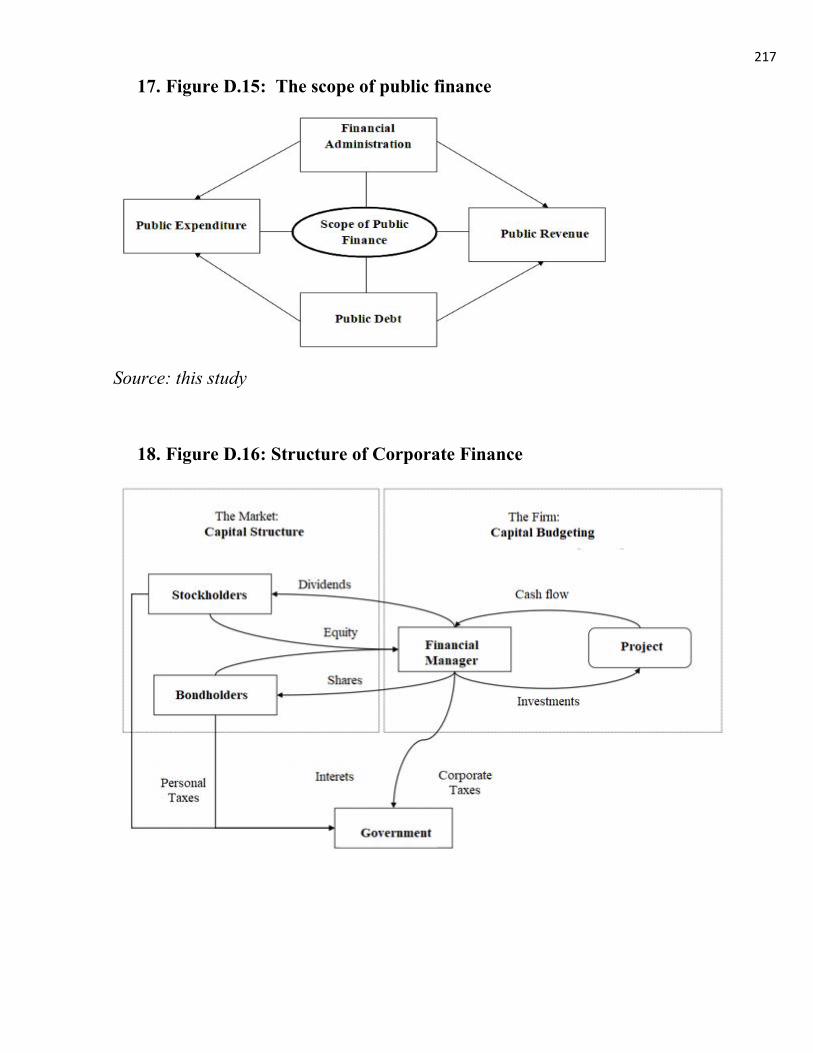
217
17. Figure D.15: The scope of public finance
Source: this study
18. Figure D.16: Structure of Corporate Finance

218
19. Figure D.17a Regional and Industry Cohort Projects Originated Globally From 1980 to 2014
Sources: Annual Global Project Finance Default and Recovery Study, December 2015
20. Figure D.17b: Project Finance Distribution by Region from 1980 – 2014

219
21. Figure D.18a Regional Project Finance Breakdown
22. Figure D.18b regional project finance breakdown pie chart

220
23. Figure D.19: EMEA top five deals in 2016
24. Figure D.20: Region project finance breakdown 1st quarter of 2017

221
25. Figure D.21: Region project finance fist-half of 2017
26. Figure D.22: region project finance for 1st nine month of 2017
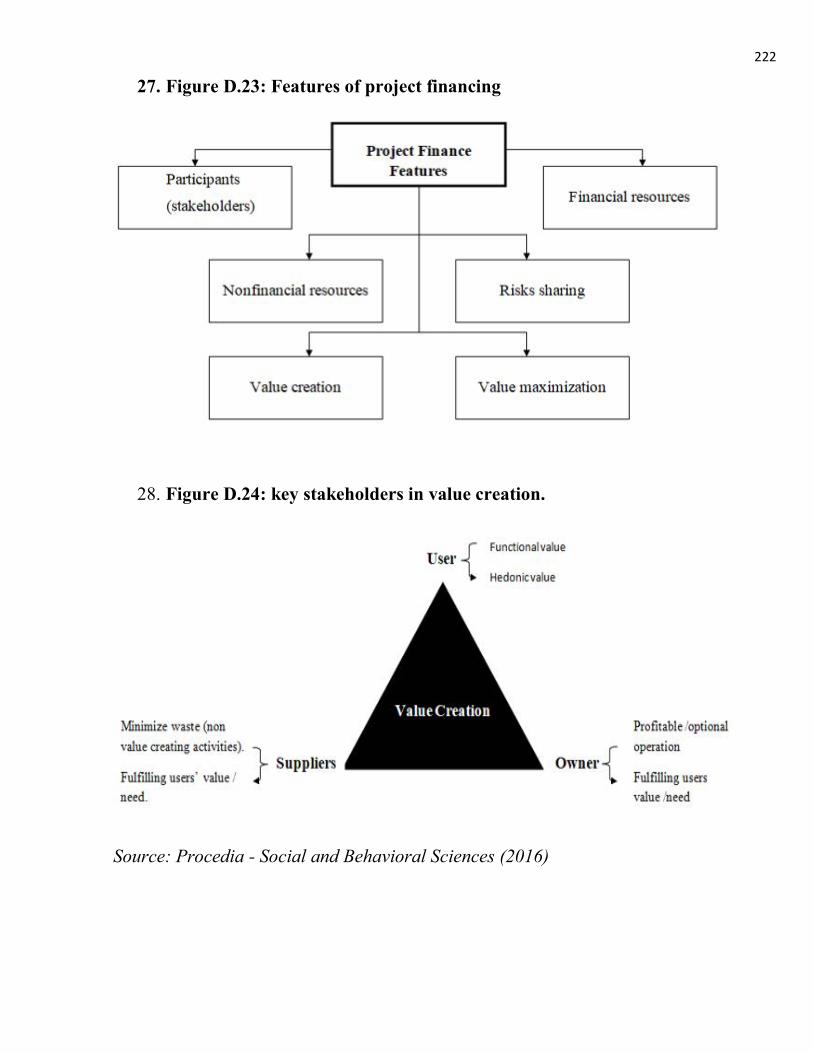
222
27. Figure D.23: Features of project financing
28. Figure D.24: key stakeholders in value creation.
Source: Procedia - Social and Behavioral Sciences (2016)

223
29. Figure D.25: Business case life cycle
30. Figure D.26: Project finance structure.

224
31. Figure D.27: Project Cost Estimate Inputs , Tools &Techniques and Outputs
Source: PMBOK
32. Figure D.28: Project cost management model
Source: Adapted from the PMBOK (2013).
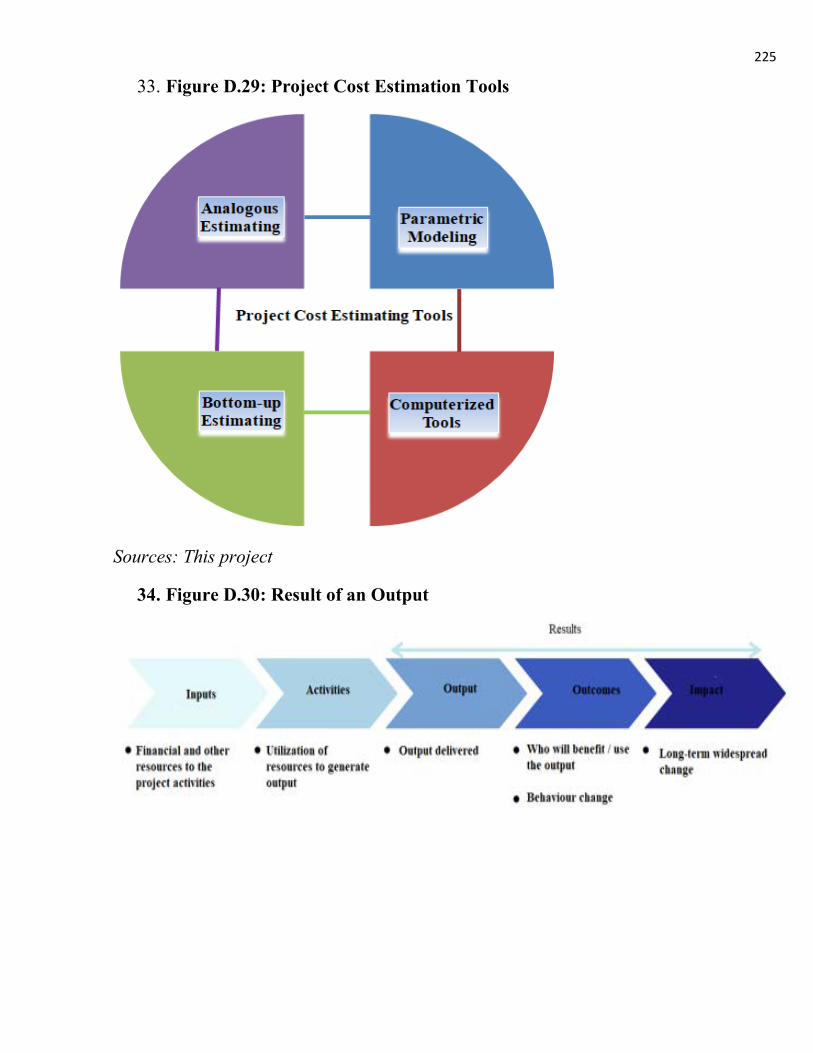
225
33. Figure D.29: Project Cost Estimation Tools
Sources: This project
34. Figure D.30: Result of an Output
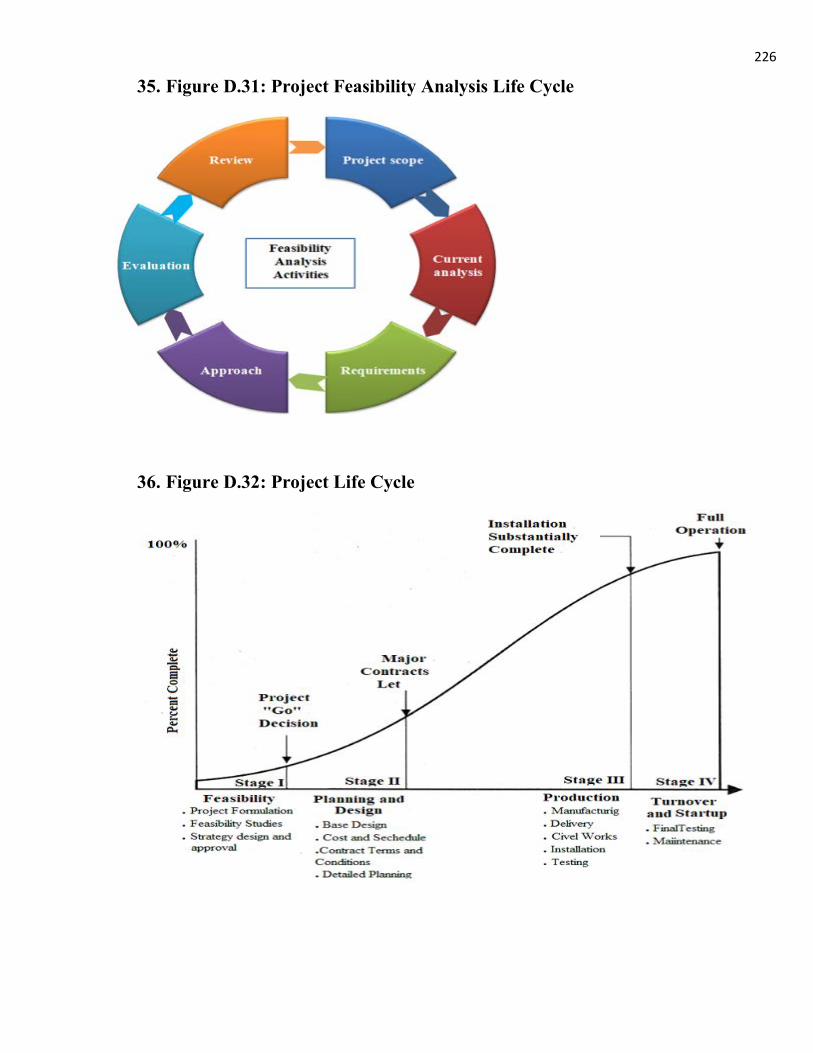
226
35. Figure D.31: Project Feasibility Analysis Life Cycle
36. Figure D.32: Project Life Cycle

227
37. Figure D.33: Risk Management Process

228
APPENDIX E Tables
1. Table E.1: Youth Unemployment rate in the Africa Region 2015-2017 Region
Unemployed Youth 2015 – 2017 ( Millions) 2015 2016 2017
Northern Africa 3.7 3.7 3.7 Sub-Saharan Africa 11.1 11.3 11.6
Sources: International Labor Office (2016) 2. Table E.2: The Ghana cedi to US dollar budget spending on the first three years of the
NYEP. Year Budgeted Funds Actual Funds Received
GHs US$ GHs US$ 2006 93,055,075.67 101,422,425.80 9,048,532.57 9,862160.84 2007 53,258,724.90 56,918,590.25 44,123,012.77 47,155,084.72 2008 63,065,502.60 59,613,860.10 61,123,629.31 57,778267.62
Source: NYEP Report 2009 3. Table E.3: Seven (7) Year Period Government Spending on NYEP (GYEEDA)
Year Spending by The Program Initiation Government GHs US$ Percentage Change in Funding %
2006 9,048,532.57 9,862160.84 00.0 2007 44,123,012.77 47,155,084.72 387.63
2008 61,123,629.31 57,778267.62 38.53 Spending After Transition of Government in 2009 to 2012 GHs US$ Percentage Change in Funding % 2009 115,260,000 73,418,689.09 88.57
2010 157,341,000 100,223,581.12 36.51 2011 228,015,437 145242013.50 44.92 2012 449,044,580 286033874.77 96.94
Source: This study data
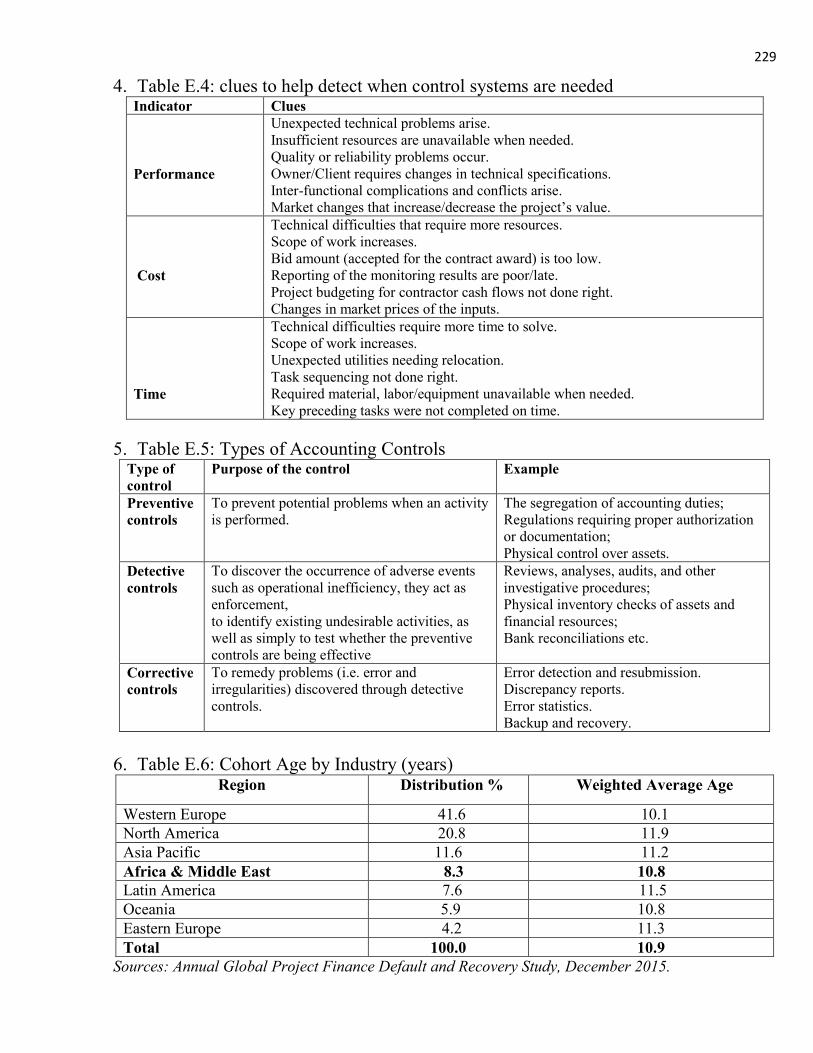
229
4. Table E.4: clues to help detect when control systems are needed Indicator Clues Performance
Unexpected technical problems arise. Insufficient resources are unavailable when needed. Quality or reliability problems occur. Owner/Client requires changes in technical specifications. Inter-functional complications and conflicts arise. Market changes that increase/decrease the project’s value.
Cost
Technical difficulties that require more resources. Scope of work increases. Bid amount (accepted for the contract award) is too low. Reporting of the monitoring results are poor/late. Project budgeting for contractor cash flows not done right. Changes in market prices of the inputs.
Time
Technical difficulties require more time to solve. Scope of work increases. Unexpected utilities needing relocation. Task sequencing not done right. Required material, labor/equipment unavailable when needed. Key preceding tasks were not completed on time.
5. Table E.5: Types of Accounting Controls
Type of control
Purpose of the control Example
Preventive controls
To prevent potential problems when an activity is performed.
The segregation of accounting duties; Regulations requiring proper authorization or documentation; Physical control over assets.
Detective controls
To discover the occurrence of adverse events such as operational inefficiency, they act as enforcement, to identify existing undesirable activities, as well as simply to test whether the preventive controls are being effective
Reviews, analyses, audits, and other investigative procedures; Physical inventory checks of assets and financial resources; Bank reconciliations etc.
Corrective controls
To remedy problems (i.e. error and irregularities) discovered through detective controls.
Error detection and resubmission. Discrepancy reports. Error statistics. Backup and recovery.
6. Table E.6: Cohort Age by Industry (years)
Region Distribution % Weighted Average Age
Western Europe 41.6 10.1 North America 20.8 11.9 Asia Pacific 11.6 11.2 Africa & Middle East 8.3 10.8 Latin America 7.6 11.5 Oceania 5.9 10.8 Eastern Europe 4.2 11.3 Total 100.0 10.9
Sources: Annual Global Project Finance Default and Recovery Study, December 2015.
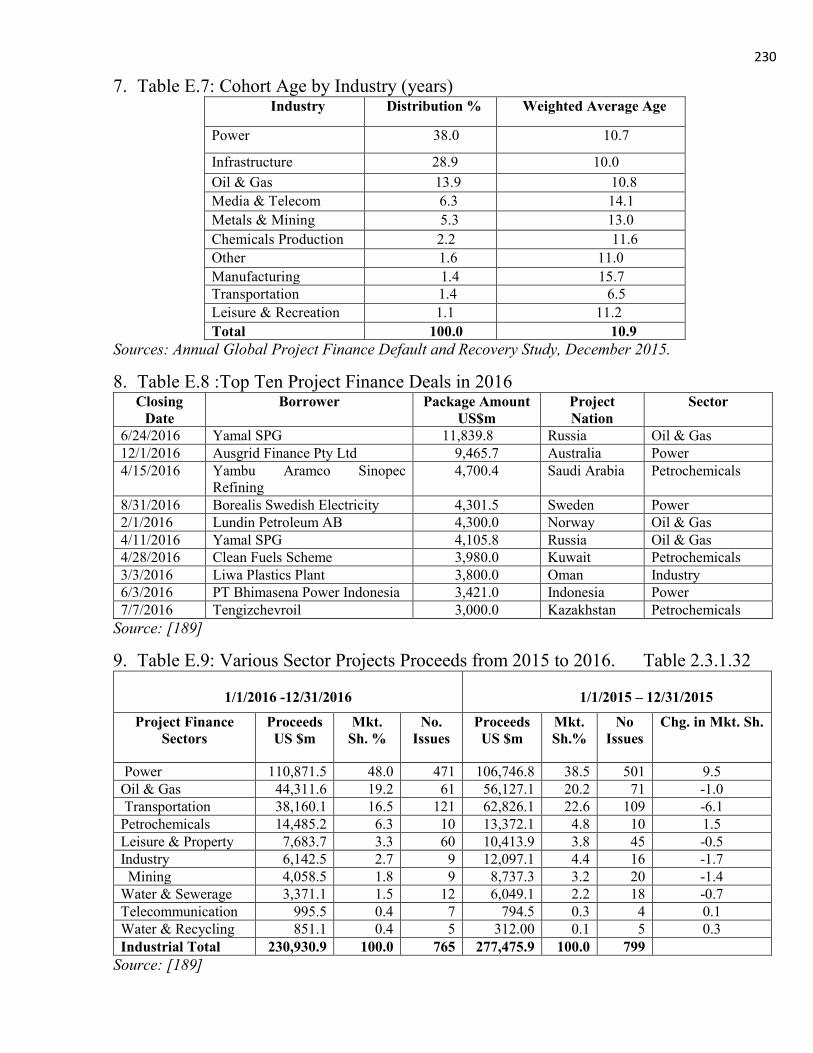
230
7. Table E.7: Cohort Age by Industry (years) Industry Distribution % Weighted Average Age
Power 38.0 10.7
Infrastructure 28.9 10.0 Oil & Gas 13.9 10.8 Media & Telecom 6.3 14.1 Metals & Mining 5.3 13.0 Chemicals Production 2.2 11.6 Other 1.6 11.0 Manufacturing 1.4 15.7 Transportation 1.4 6.5 Leisure & Recreation 1.1 11.2 Total 100.0 10.9
Sources: Annual Global Project Finance Default and Recovery Study, December 2015.
8. Table E.8 :Top Ten Project Finance Deals in 2016 Closing
Date Borrower Package Amount
US$m Project Nation
Sector
6/24/2016 Yamal SPG 11,839.8 Russia Oil & Gas 12/1/2016 Ausgrid Finance Pty Ltd 9,465.7 Australia Power 4/15/2016 Yambu Aramco Sinopec
Refining 4,700.4 Saudi Arabia Petrochemicals
8/31/2016 Borealis Swedish Electricity 4,301.5 Sweden Power 2/1/2016 Lundin Petroleum AB 4,300.0 Norway Oil & Gas 4/11/2016 Yamal SPG 4,105.8 Russia Oil & Gas 4/28/2016 Clean Fuels Scheme 3,980.0 Kuwait Petrochemicals 3/3/2016 Liwa Plastics Plant 3,800.0 Oman Industry 6/3/2016 PT Bhimasena Power Indonesia 3,421.0 Indonesia Power 7/7/2016 Tengizchevroil 3,000.0 Kazakhstan Petrochemicals
Source: [189]
9. Table E.9: Various Sector Projects Proceeds from 2015 to 2016. Table 2.3.1.32
1/1/2016 -12/31/2016
1/1/2015 – 12/31/2015
Project Finance Sectors
Proceeds US $m
Mkt. Sh. %
No. Issues
Proceeds US $m
Mkt. Sh.%
No Issues
Chg. in Mkt. Sh.
Power 110,871.5 48.0 471 106,746.8 38.5 501 9.5 Oil & Gas 44,311.6 19.2 61 56,127.1 20.2 71 -1.0 Transportation 38,160.1 16.5 121 62,826.1 22.6 109 -6.1 Petrochemicals 14,485.2 6.3 10 13,372.1 4.8 10 1.5 Leisure & Property 7,683.7 3.3 60 10,413.9 3.8 45 -0.5 Industry 6,142.5 2.7 9 12,097.1 4.4 16 -1.7 Mining 4,058.5 1.8 9 8,737.3 3.2 20 -1.4 Water & Sewerage 3,371.1 1.5 12 6,049.1 2.2 18 -0.7 Telecommunication 995.5 0.4 7 794.5 0.3 4 0.1 Water & Recycling 851.1 0.4 5 312.00 0.1 5 0.3 Industrial Total 230,930.9 100.0 765 277,475.9 100.0 799
Source: [189]
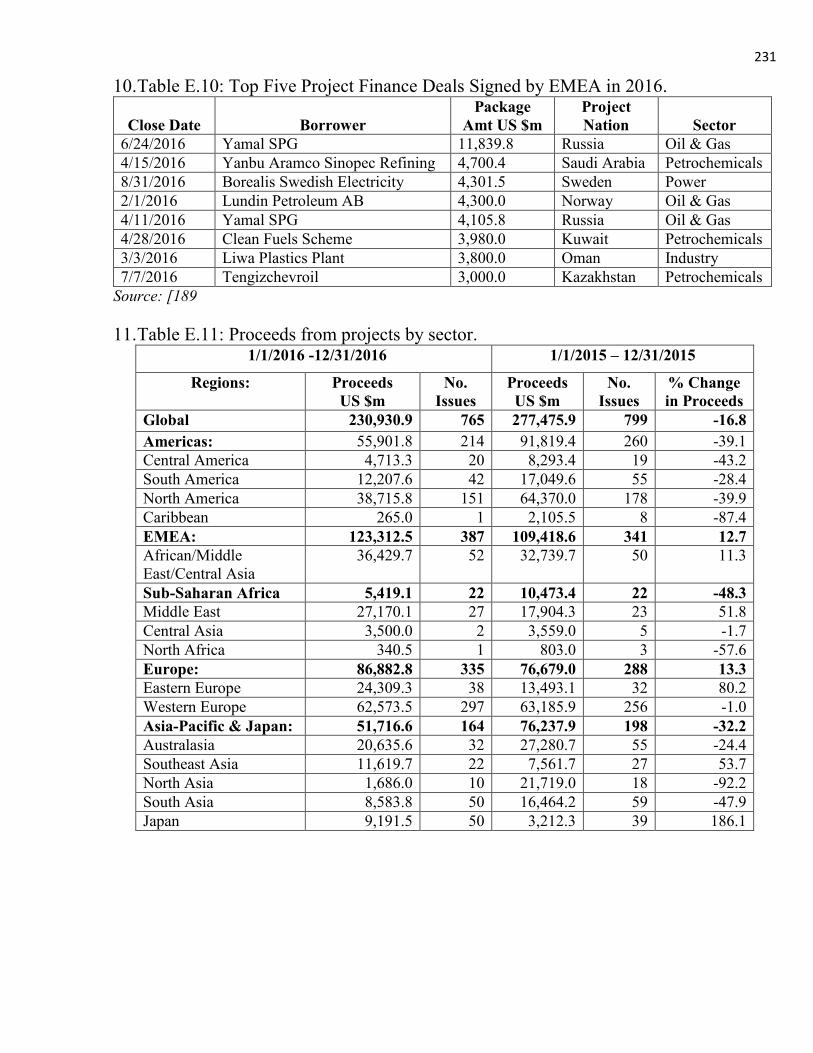
231
10. Table E.10: Top Five Project Finance Deals Signed by EMEA in 2016.
Close Date
Borrower Package
Amt US $m Project Nation
Sector
6/24/2016 Yamal SPG 11,839.8 Russia Oil & Gas 4/15/2016 Yanbu Aramco Sinopec Refining 4,700.4 Saudi Arabia Petrochemicals 8/31/2016 Borealis Swedish Electricity 4,301.5 Sweden Power 2/1/2016 Lundin Petroleum AB 4,300.0 Norway Oil & Gas 4/11/2016 Yamal SPG 4,105.8 Russia Oil & Gas 4/28/2016 Clean Fuels Scheme 3,980.0 Kuwait Petrochemicals 3/3/2016 Liwa Plastics Plant 3,800.0 Oman Industry 7/7/2016 Tengizchevroil 3,000.0 Kazakhstan Petrochemicals
Source: [189 11. Table E.11: Proceeds from projects by sector.
1/1/2016 -12/31/2016 1/1/2015 – 12/31/2015
Regions: Proceeds US $m
No. Issues
Proceeds US $m
No. Issues
% Change in Proceeds
Global 230,930.9 765 277,475.9 799 -16.8 Americas: 55,901.8 214 91,819.4 260 -39.1 Central America 4,713.3 20 8,293.4 19 -43.2 South America 12,207.6 42 17,049.6 55 -28.4 North America 38,715.8 151 64,370.0 178 -39.9 Caribbean 265.0 1 2,105.5 8 -87.4 EMEA: 123,312.5 387 109,418.6 341 12.7 African/Middle East/Central Asia
36,429.7 52 32,739.7 50 11.3
Sub-Saharan Africa 5,419.1 22 10,473.4 22 -48.3 Middle East 27,170.1 27 17,904.3 23 51.8 Central Asia 3,500.0 2 3,559.0 5 -1.7 North Africa 340.5 1 803.0 3 -57.6 Europe: 86,882.8 335 76,679.0 288 13.3 Eastern Europe 24,309.3 38 13,493.1 32 80.2 Western Europe 62,573.5 297 63,185.9 256 -1.0 Asia-Pacific & Japan: 51,716.6 164 76,237.9 198 -32.2 Australasia 20,635.6 32 27,280.7 55 -24.4 Southeast Asia 11,619.7 22 7,561.7 27 53.7 North Asia 1,686.0 10 21,719.0 18 -92.2 South Asia 8,583.8 50 16,464.2 59 -47.9 Japan 9,191.5 50 3,212.3 39 186.1

232
12. Table E.12: EMEA Project Finance Proceeds from 2015 – 2016 1/1/2016 -
12/31/2016 1/1/2015 – 12/31/2015
Proceeds US $m
No. Issue
Proceeds US $m
No. Issue
% Change in Proceeds
EMEA 123,312.5 387 109,418.6 341 12.7 Western Europe 62,573.5 297 63,185.9 256 -1.018
United Kingdom 18,141.4 72 19,636.7 56 -7.6 France 6,919.0 57 10,112.7 56 -31.6 Sweden 6,369.8 9 5,803.5 3 9.8 Spain 6,002.4 36 7,471.5 44 -19.7 Italy 5,006.3 35 2,226.4 32 124.9 Norway 4,948.7 7 125.5 1 3,843.2 Germany 4,049.4 21 8,331.2 15 -51.4 Netherlands 3,968.7 16 2,249.0 8 76.5 Belgium 3,113.5 8 1,068.9 7 191.3 Republic of Ireland 1,458.3 16 1,040.2 11 40.2 Finland 951.9 5 1,853.8 8 -48.7 Portugal 600.1 5 1,257.8 5 -52.3 Austria 432.1 3 657.1 4 -34.2 Greece 204.1 3 35.6 1 473.3 Iceland 191.5 2 68.0 1 181.6 Guernsey 143.7 1 - - - Denmark 72.7 1 738.9 3 -90.2 Eastern Europe 24,309.3 38 13,493.1 32 80.2 Russian Federation 19,081.2 12 622.9 4 - Turkey 3,446.6 17 10,194.5 13 -66.2 Slovak Republic 1,077.8 1 123.1 1 775.5 Croatia 284.6 1 - - - Georgia 177.0 2 250.0 1 -29.2 Poland 131.8 2 785.5 7 -83.2 Macedonia 69.0 1 - - -

233
13. Table E.13: EMEA Project Finance Proceeds from 2015 – 2016 1/1/2016 -12/31/2016 1/1/2015 – 12/31/2015 Proceeds
US $m No. Issue
Proceeds US $m
No. Issue
% Change in Proceeds
Africa/Middle East/Central Asia 36,429.7 52 32,739.7 53 11.3 Saudi Arabia 7,965.3 3 13,077.5 8 -39.1 Oman 5,919.5 8 1,090.0 5 443.1 Kuwait 3,980.0 1 - - - United Arab Emirates 3,130.2 4 583.0 3 436.9 Kazakhstan 3,000.0 1 260.0 1 1,053.8 Qatar 2,965.0 2 Ghana 2,435.0 3 Bahrain 2,241.1 2 Jordan 968.9 7 Guinea 823.0 1 South Africa 644.3 2 Uzbekistan 500.0 1 161.5 Guinea 823.0 1 - South Africa 644.3 2 2,424.9 Uzbekistan 500.0 1 - Gabon 434.0 2 - Egypt 340.5 1 670.0 Tanzania 258.8 1 - Mali 200.0 1 350.0 Nigeria 180.0 2 4,242.1 Sierra Leone 109.0 1 - Dem Rep of the Congo 105.0 1 - Lesotho 84.0 1 - Senegal 60.7 2 91.0 Uganda 59.3 4 - Cameroon 26.0 1 -
14. Table E.14: Top project finance deals signed in 2017. Date Borrower Package Amt
US $m Project Nation
Sector
5/31/2017 Eni Africa – Coral S FLNG DMCC
4,879.5 Mozambique Oil and Gas
6/1/2017 Kereta Cepat Indonesia China 4,500.00 Indonesia Transportation 6/7/2017 Network Finance Co Pty Ltd 4,472.5 Australia Power 6/16/2017 Kinder Morgan Cochin ULC 4,163.8 Canada Oil and Gas 2/24/2017 PT Bhumi Jati Power 3,355.2 Indonesia Power 6/15/2017 Ichthys LNG Pty Ltd 3,000.0 Australia Oil and Gas 3/21/2017 Nati Grid Gas Distn Ltd 2,235.2 United
Kingdom Oil and Gas
4/28/2017 Gemini Offshore Wind Farm 2,131.9 Netherlands Power 5/26/2107 HPCL Mittal Energy Ltd 2,083.8 India Industry 6/2/2017 Helix Gen Funding LLC 1,850.0 United States Power

234
15. Table E.15: Proceeds per Mandated Arrangers (US$m) Mandated Arrangers 2017
Rank
2016 Rank
Proceeds Mkt Sh%
Mkt Sh Chg
# of Deals
Mkt Sh %
Chg in # of Deals
Mitsubishi UFJ Financial Group
1 2 8,245.2 5.2 -0.9 88 16.7 -26
China Development Bank 2 1 6,590.2 4.2 -3.1 3 0.6 0 Sumitomo Mitsui Finl Group Inc
3 3 6,375.8 4.1 -0.8 74 14.0 -6
State Bannk of India 4 6 6,235.1 4.0 1.5 15 2.8 4 BNP Paribas SA 5 8 5,300.5 3.4 1.2 52 9.8 8 Credit Agricole CIB 6 5 5,022.0 3.2 0.4 54 10.2 2 Industrial & Comm Bank China
7 28 4,647.5 3.0 2.2 21 4.0 9
Societe Generale 8 7 4,095.0 2.6 0.3 48 9.1 -1 ING 9 9 4,064.5 2.6 0.7 55 10.4 13 Mizuho Financial Group 10 4 3,682.7 2.3 -0.9 28 5.3 -16 Santander 11 10 3,660.7 2.3 0.5 44 8.3 -5 Bank of China Limited 12 25 3,232.6 2.1 1.2 13 2.5 2 RBC Capital Markets 13 46 2,869.6 1.8 1.3 18 3.4 8 Natixis 14 11 2,714,3 1.7 0.0 30 5.7 -4 HSBC Holding PLC 15 15 2,328.3 1.5 0.0 19 3.6 -4 Korea Development Bank 16 52 2,295.2 1.5 1.0 20 3.8 10 CIBC World Markets Inc 17 34 2,223.1 1.4 0.6 16 3.0 0 Axis Bank Ltd 18 58 2,221.1 1.4 1.0 9 1.7 -1 Barclays 19 56 1,957.8 1.2 0.8 13 2.5 6 Goldman Sachs & Co 20 68 1,884.9 1.2 0.9 8 1.5 5 Scotiabank 21 27 1,800.4 1.1 0.3 9 1.7 -5 Commonwealth Bank of Australia
22 14 1,716.9 1.1 -0.5 23 4.4 -5
Bank of America Merrill Lynch
23 30 1,693.3 1.1 0.3 13 2.5 3
Development Bank of Japan Inc
24 37 1,692.2 1.1 0.4 11 2.1 5
JP Morgan 25 21 1,560.6 1.0 -0.1 6 1.1 -2 Top Twenty Five Total 88,109.5 56.1 8.3 528 -52 Industry Total 157,294.5 100.0
Source: [193]

235
16. Table E.16: EMEAs project finance proceeds for 2017 1/1/2017 -9/30/2017 1/1/2016 -9/30/2016
Proceeds US$m No .issues Proceeds US$m
No. issues
% chge in proceeds
EMEA 61,512.1 209 106,157.8 288 -42.1
Western Europe 39,738.1 161 52,883.1 225 -24.9 United kingdom 15,608.0 42 14,547.8 60 7.3 Spain 4,857.8 26 4,816.9 27 0.8 Germany 4,381.0 18 5,385.6 14 -18.7
France 3,795.8 29 4,372.2 39 -13.2 Italy 2,750.8 16 4,330.6 25 -36.5 Netherlands 2,509.1 7 3,637.7 14 -31.0 Greece 1,425.9 3 204.1 3 598.6 Belgium 1,157.8 4 1,122.3 4 3.2 Luxembourg 689.7 1 - - - Finland 545.1 2 870.0 3 -37.3 Portugal 525.7 2 600.1 5 -12.4 Sweden 504.0 2 6,157.4 5 -91.8 Switzerland 477.8 1 - - - Norway 231.5 2 4,919.5 6 -95.3 Republic of ireland 213.0 4 1,402.5 14 -84.3 Denmark 65.2 2 72.2 1 -10.3 Eastern Europe 4,256.1 13 21,864.8 28 -80.1 Turkey 2,728.3 6 2,279.2 13 -19.7 Hungary 996.3 1 - - - Poland 262.8 1 131.8 2 99.4 Serbia 240.1 2 - - - Bosnia and Herzegovina 27.2 1 - - - Georgia 14.3 1 155.0 1 -90.8 Africa/middle east/central Asia
17,417.9 35 31,409.3 35 -44.5
Mozambique 4,934.5 2 - - - Israel 2,325.0 3 - - - United Arab Emirates 2,008.4 4 2,904.5 3 -30.9 Jordan 1,582.0 1 72.0 1 2,097.2 Oman 1,368.0 2 5,919.5 8 -76.9 Nigeria 1,000.0 1 180.0 2 455.6 Bahrain 725.8 1 1,500.0 1 -51.6 Saudi Arabia 709.7 2 7,965.3 3 -91.1 Kenya 341.0 1 - - - Azerbaijan 500.0 1 - - - Rwanda 256.0 1 - - -

236
Equatorial guinea 250.0 1 - - - Kazakhstan 184.5 2 3,000.0 1 -93.9 South Africa 172.2 3 644.3 2 -73.3 Madagascar 148.4 1 - - - Egypt 144.5 2 340.5 1 -57.6 Zimbabwe 120.0 1 - - - Kyrgyzstan 110.0 1 - - - Mali 60.0 1 200.0 1 -70.0 Burkina Faso 60.0 1 - - - Armenia 50.0 1 - - - Ivory coast 40.0 1 - - - Tunisia 28.0 1 - - -