Embed Size (px)
Citation preview

Kinetics studies in laboratory lessons as a project-based learning approach in Chemical
Engineering Education
Vicenç Martí 1 Lourdes Roset 2
1 ETSEIB, Av. Diagonal, 647, E-08028, Barcelona 2 EPSEVG , Av. Victor Balaguer s/n, E-08800, Vilanova i la Geltrú
JOTSE, July 13th , 2015, ETSEIB (Barcelona) 1

The goal of this presentation is to show how project-based approach applied to experimental could improve the understanding of key chemical engineering concepts and strength theory
• Presentation of the subject and semester data • Batch results • Continuous results • Comparison batch vs continuous
GOAL AND CONTENTS
2

• Bachelor's degree in Chemical Engineering, ETSEIB , UPC
• Experimental subject “Experimentation in Chemical Engineering II” run the 6th semester in parallel with key subjects as Unit operations, Kinetics and reactions and Fluid mechanics
• Opportunity to strength experimental and theoretical concepts !
INTRODUCTION
3

Three laboratory lessons considered – i) Batch Isothermal – ii) Batch Adiabatic – iii) Continuous Stirred Tank Reactor (CSTR) by using the same reaction: anhydride acetic hydrolysis. The lessons i) and iii) (batch isot. vs continuous) will be compared in the present work
LAB LESSONS CONSIDERED
4

Projects in this subject were performed with the following objectives: • Design the conditions to be performed in the lab lesson • Study-modelize all the experimental data generated in the lab lessons 2 from 4 transversal projects were considered to focus on isothermal batch and continuous reactions mentioned before. The objectivesof these specific projects were:
• to explore the potential effect of several experimental factors over results
• to study the order of the reactions (order 1 or 2) • to obtain kinetic constants (k) • To obtain energy of activation (EA) by using Arrhenius
expression
PROJECTS
5

Course 2014-2015: 1st semester: 18 students, 6 lab groups (3), 4 project groups 2nd semester: 25 students, 8 lab groups (3-4), 4 project groups The students were grouped in lab-groups to perform lab lessons and in project-groups for the project-based approach.
STUDENTS DISTRIBUTION
1
2
2
3
3
4
4
1 2 3 4 5 6 7 8
Proj
ect g
roup
Lab group
Distribution of students 2nd Semester
Batch
Continuous
Other
6
Half of the students Performed batch or continuous approach

Main experimental error in volum titration
Weak acid- strong base titration of acetic acid with NaOH 0,1 M and phenolphthalein formed from: 1) hydrolisis
2) blocking reaction with aniline
GENERAL METHODOLOGY BOTH LAB LESSONS

EXPERIMENTAL PROCESS Batch Reactor Preparation of solution of water
saturated with aniline
Addition distilled water to the reactor isothermal and temperature control.
Addition volume of anhydride acetic reactor
At certain times 6 samples extracted and add them to an Erlenmeyer with aniline.
Extraction a final sample without aniline to calculate CAo
BATCH REACTOR. EXPERIMENTAL PROCESS

9
BATCH REACTOR. REACTION ORDER
Comparative reaction order(n=1,2).
-50
0
50
100
150
200
0 200 400 600 800 1000
1/Co
*(Xa
/(1-
Xa))
ti(s)
n=2
0
0,5
1
1,5
2
2,5
3
0 200 400 600 800 1000 1200 1400
-ln(1
-Xa)
t(s)
n=1
r2(n=1): 0.9832,0.9929, 0.9942 r2(n=2): 0,8024, 0.8917,0.8925
2nd semester
Correlation data is very good for order 1 and better than order 2

10
BATCH REACTOR. K FITTING The processing of data gives us an order reaction n=1 Temperatures(ºC) : 19 <T< 33 r2 : 0.994919
-3,000
-2,500
-2,000
-1,500
-1,000
-0,500
0,000
0,500
0 2 4 6 8 10 12 14 16 18
ln[C
]
t (min)
[AAC]=0,1 M
20 ºC
22 ºC
24 ºC
24(2)ºC25 ºC
28 ºC
y = -6104,2x + 14,258 R² = 0,9898
-6,6
-6,5
-6,4
-6,3
-6,2
-6,1
-6
-5,90,0033 0,00332 0,00334 0,00336 0,00338 0,0034 0,00342
ln(k
)
1/T (1/K)
Ea calculation
2nd semester
Group 6, 2nd semester
Fitting first-order k is good and the trend with T seems to fit well Arrhenius model

FITTING BATCH DATA TO ARRHENIUS (I)
2nd semester
-6,6
-6,4
-6,2
-6
-5,8
-5,6
-5,4
-5,2
-5
0,00315 0,0032 0,00325 0,0033 0,00335 0,0034 0,00345
ln K
1/T (1/K)
ln k Batch
Grup 1
Grup 2
Grup 3
Grup 4
Grup 5
Grup 6
Grup 7
Grup 8
Cummulative effect of titration and T measuremet gives dispersion

30
35
40
45
50
55
60
65
70
75
0 5 10 15 20 25
Ea vs Ln k (min-1) References
FITTING BATCH DATA TO ARRHENIUS (II)
Ea (J/mol) References
Ea (J/mol) Present work
Ln k(min-1) References
Ln k (min-1) Present work
39.5<Ea<53.5 35< Ea<50 7.5<lnk<19.5 7<lnk<13
Present work
Experimental dispersion is similar to some ranges of reference data

METHODOLOGY CONTINOUS SYSTEM SETUP
𝑪𝑪𝑨𝑨𝑨𝑨𝑪𝑪𝑨𝑨
= 𝟏𝟏 + 𝒌𝒌𝒌𝒌
𝑑𝑑(𝐶𝐶𝐴𝐴 · 𝑉𝑉)𝑑𝑑𝑑𝑑 = 𝑣𝑣0 𝐶𝐶𝐴𝐴0 − 𝐶𝐶𝐴𝐴 − 𝑘𝑘.𝐶𝐶𝐴𝐴.𝑉𝑉
13
𝑣𝑣𝑣𝑣 = 𝑄𝑄 + 𝑞𝑞
𝐶𝐶𝐴𝐴𝐴𝐴 = 𝑞𝑞·𝑑𝑑·𝑀𝑀 𝑣𝑣𝐴𝐴
Theoretical
q
Q
Check the steady state of water flow (Q) by measuring it
Dose pure acetic anhydride flow (q) by using a peristaltic pump. d and M density and mol. Weight acetic anhydride
Sample output dissolution each 10 minutes let 10 min more to ensure complete hydrolysis and titrate to determine CAo
When CAo is constant steady state has been reached . Extract 3 samples and block with aniline
Titrate to obtain data to calculate CA, XA and K
Linear models

FITTING CONTINUOUS DATA-CONTROL QUALITY
The comparison of theoretical and experimental initial concentration of anhydride acetic the reactor could be used as a “quality control” of the performance of the session
1st semester
y = 1,0813x R² = 0,9758
0,0000
0,0200
0,0400
0,0600
0,0800
0,1000
0,1200
0,1400
0,0000 0,0200 0,0400 0,0600 0,0800 0,1000 0,1200
CA0 e
xper
imen
tal
CA0
CA0 vs CA0 experimental
2nd semester
14
𝐶𝐶𝐴𝐴𝐴𝐴 = 𝑞𝑞·𝑑𝑑·𝑀𝑀 𝑣𝑣𝐴𝐴
Theoretical
Control and measuremet of vo is a key parameter to get good results

FITTING CONTINUOUS DATA- K CALCULATION
2nd semester K=0,09 min-1=0.0015 s-1
y = 0,0022x + 1,2255 R² = 0,9354
y = 0,0027x + 1 R² = 0,8883
y = 0,0044x + 0,9418 R² = 0,5919
y = 0,0043x + 1 R² = 0,5914
0
0,5
1
1,5
2
2,5
3
3,5
4
0 100 200 300 400 500 600 700
(CAo
/CA)
τ [s]
1st semester K=0,0027-0,0044 s-1
Fittings work quite well , but K are different between semesters
𝐶𝐶𝐴𝐴0𝐶𝐶𝐴𝐴
= 1 + 𝑘𝑘𝑘𝑘
15
Cummulative effect of vo and titration gives dispersion
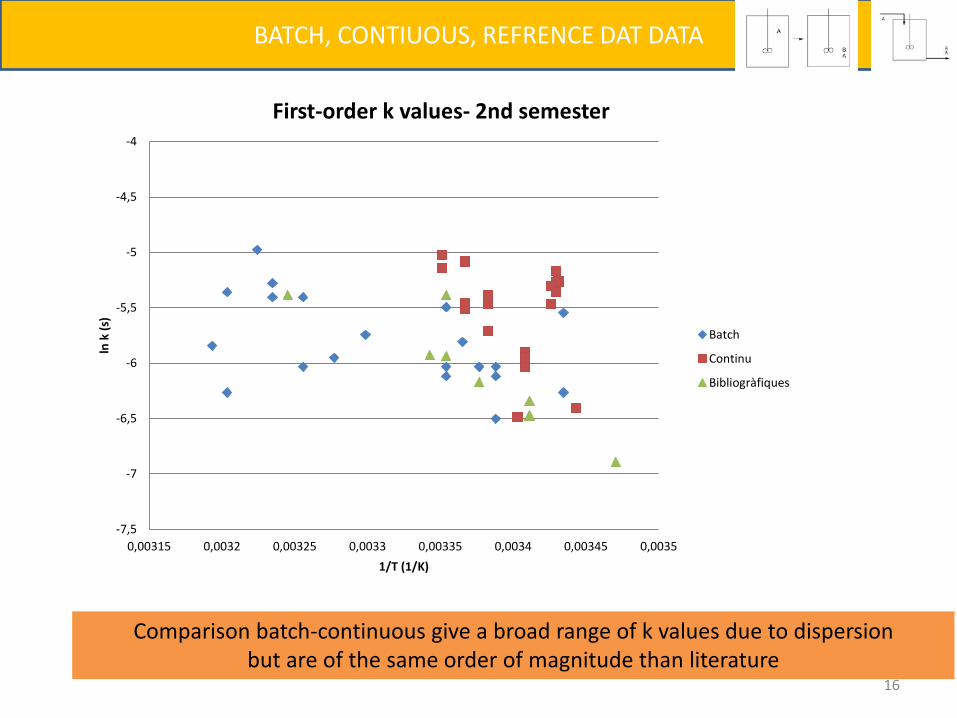
BATCH, CONTIUOUS, REFRENCE DAT DATA
-7,5
-7
-6,5
-6
-5,5
-5
-4,5
-4
0,00315 0,0032 0,00325 0,0033 0,00335 0,0034 0,00345 0,0035
ln k
(s)
1/T (1/K)
First-order k values- 2nd semester
Batch
Continu
Bibliogràfiques
Comparison batch-continuous give a broad range of k values due to dispersion but are of the same order of magnitude than literature
16

• Project-based learning could be implemented easily in experimental subjects
• For batch: Control of titration and sampling time needed to decrease dispersion. Order and K values good.
• Very disperse fitting of Arrhenius. Range of k values batch and continuous.
• For continuous: Control of titration, sampling time and vo needed to decrease dispersion. CAo and K values good to obtain with disperse values.
• Using this experimental approach opens the possibility to learn a methodology based on theoretical and experimental correlation of different subjects and have a unique final vision of the same reaction.
CONCLUSIONS
17

• All the students of the subject “Experimentació Enginyeria
Química, II” in the course 2014-2015
• Dra. Mª Àngels Larrayoz, Dr. Jordi Bou and Dr. Joaquim Casal who prepared the way to develop this work
ACKNOWLEDGEMENTS
18