Embed Size (px)
Citation preview

Lessons from Recent Laboratory and Field Instrumentation Projects
Vellore S. Gopalaratnam, Ph.D., P.E. Visiting Professor, Indian Institute of Technology-Madras Professor of Civil Engineering, University of Missouri-Columbia March 26, 2015 Indian Institute of Science (IISc), Bengaluru
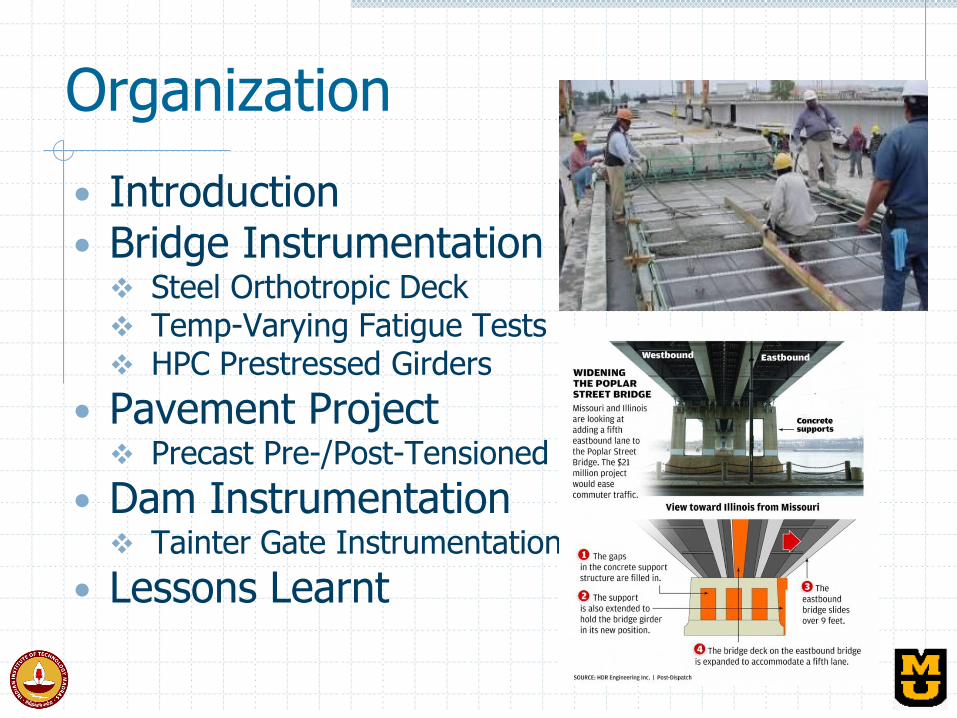
Organization
• Introduction • Bridge Instrumentation Steel Orthotropic Deck Temp-Varying Fatigue Tests HPC Prestressed Girders
• Pavement Project Precast Pre-/Post-Tensioned
• Dam Instrumentation Tainter Gate Instrumentation
• Lessons Learnt

Experimental measurements…

Strain Measurements on Steel Deck
Develop strain time-histories and histograms for laboratory fatigue simulations of steel-wearing surface composite specimens:

Poplar Street Bridge, St. Louis (MO)
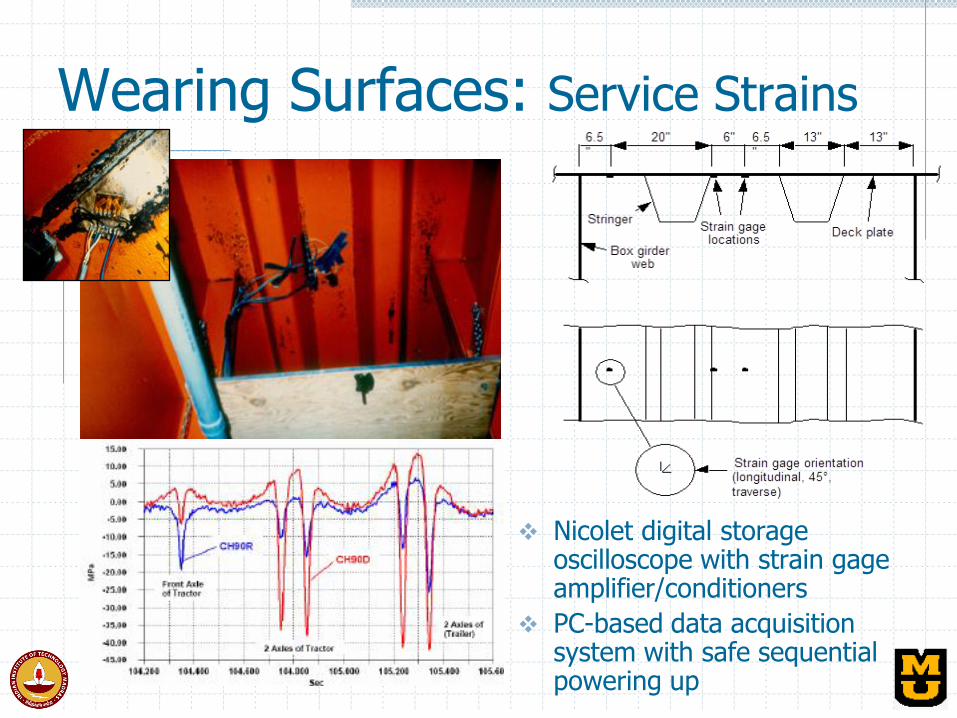
Wearing Surfaces: Service Strains
Nicolet digital storage oscilloscope with strain gage amplifier/conditioners
PC-based data acquisition system with safe sequential powering up
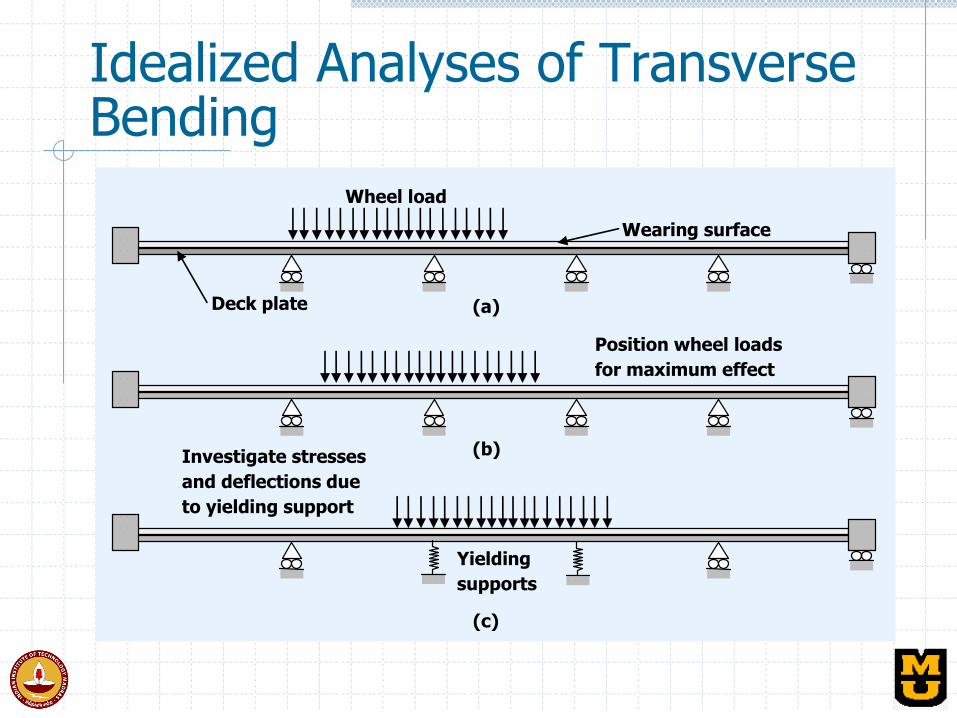
Idealized Analyses of Transverse Bending
Yielding
supports
Position wheel loads
for maximum effect
Investigate stresses
and deflections due
to yielding support
Wheel load
Wearing surface
Deck plate (a)
(b)
(c)
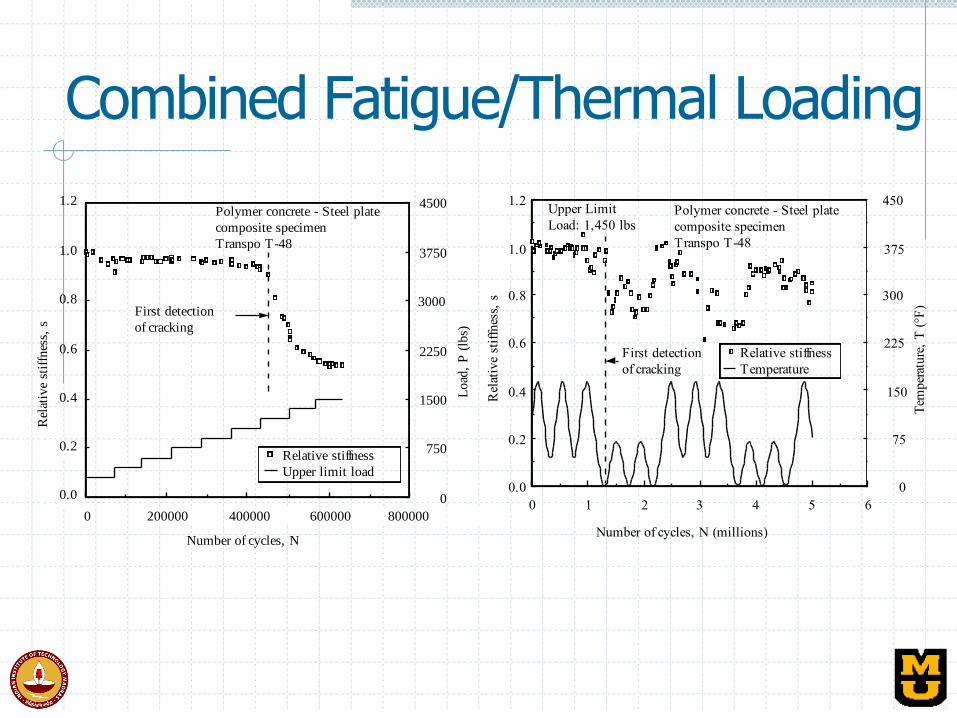
Combined Fatigue/Thermal Loading
8000006000004000002000000
0.0
0.2
0.4
0.6
0.8
1.0
1.2
0
750
1500
2250
3000
3750
4500
Relative stiffness
Upper limit loadL
oad
, P
(lb
s)
Number of cycles, N
Fig. 6 Relative stiffness (stiffness relative to initial stiffness at 0° F) versus the number of fatigue cycles in a cold-temperature fatigue test. Progressively increasing upper limit load is also shown in the figure.
Rel
ativ
e st
iffn
ess,
s
First detection
of cracking
Polymer concrete - Steel plate
composite specimen
Transpo T-48
Tem
per
ature
, T
(°F
)
6543210
0.0
0.2
0.4
0.6
0.8
1.0
1.2
0
75
150
225
300
375
450
Relative stiffness
Temperature
Number of cycles, N (millions)
Fig. 5 Temperature corrected relative stiffness versus the number of fatigue cycles. Thermal loading applied simultaneously with the 5 Hz fatigue loading is also shown in the figure.
Polymer concrete - Steel plate
composite specimen
Transpo T-48
First detection
of cracking
Rel
ativ
e st
iffn
ess,
s
Upper Limit
Load: 1,450 lbs
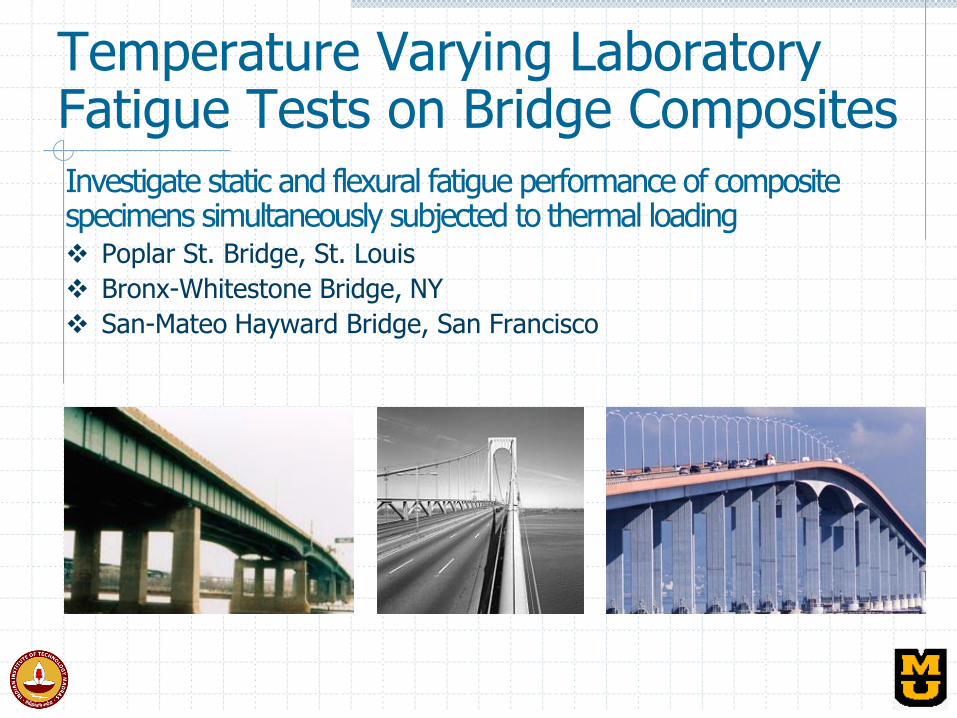
Temperature Varying Laboratory Fatigue Tests on Bridge Composites Investigate static and flexural fatigue performance of composite specimens simultaneously subjected to thermal loading Poplar St. Bridge, St. Louis
Bronx-Whitestone Bridge, NY
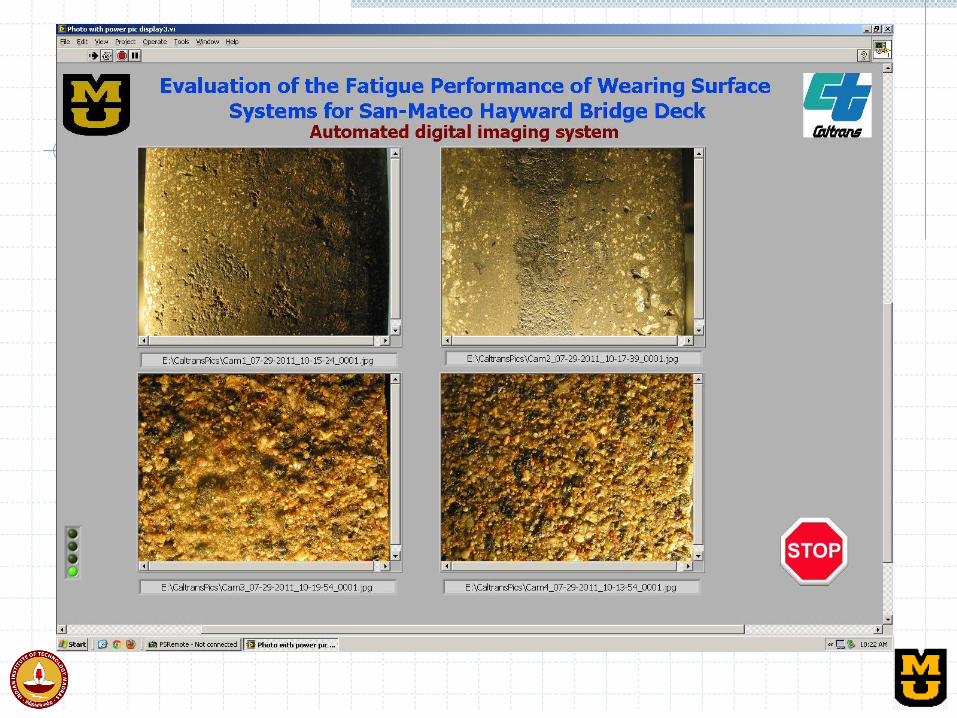
San-Mateo Hayward Bridge, San Francisco
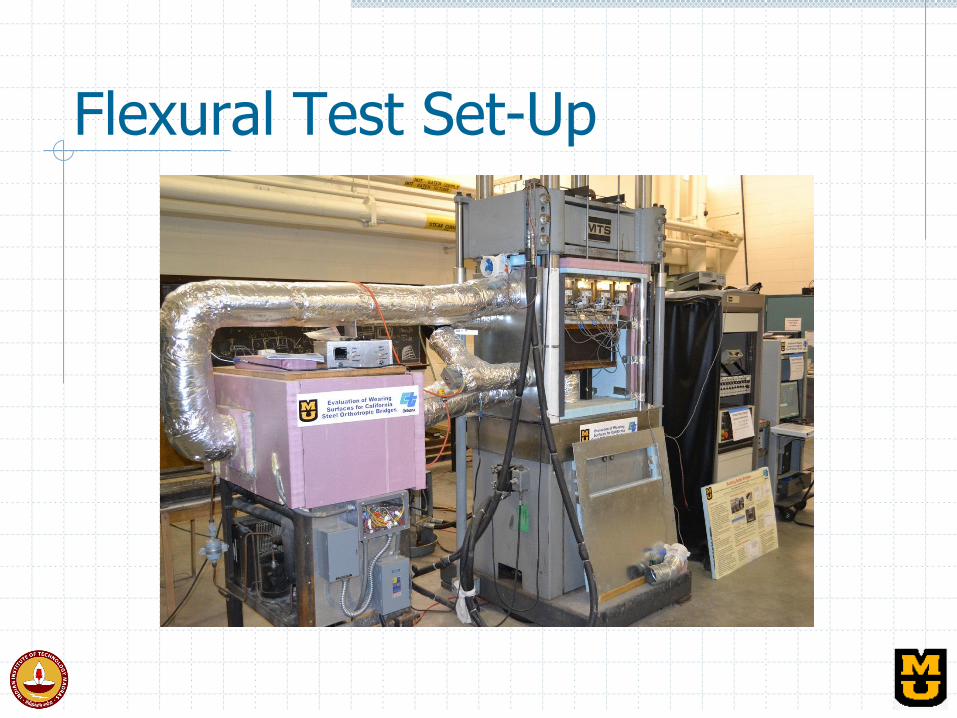
Flexural Test Set-Up
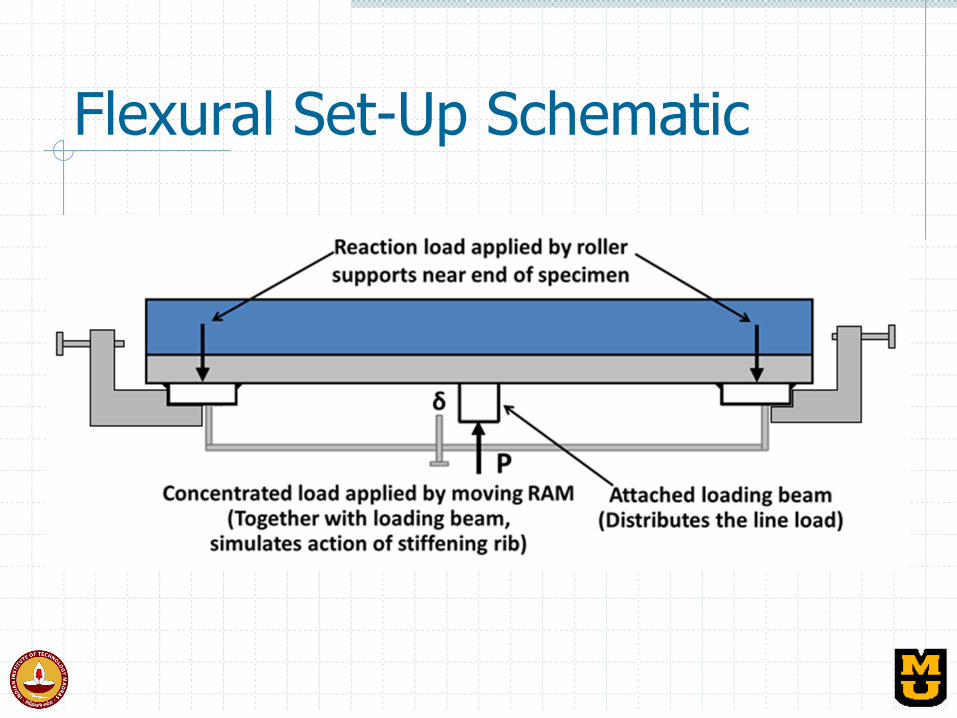
Flexural Set-Up Schematic
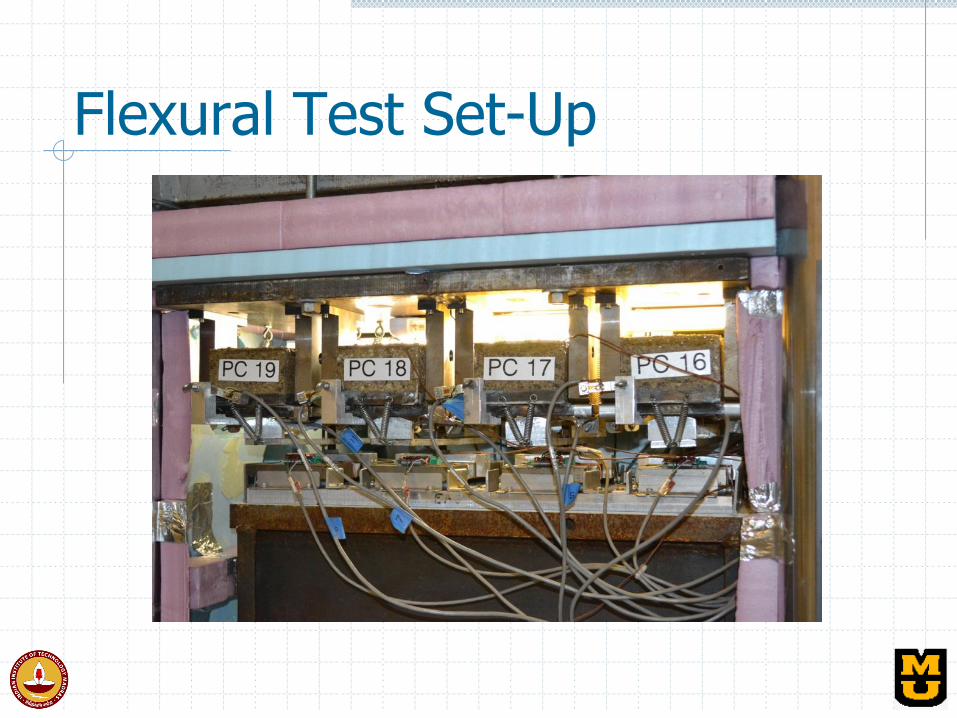
Flexural Test Set-Up
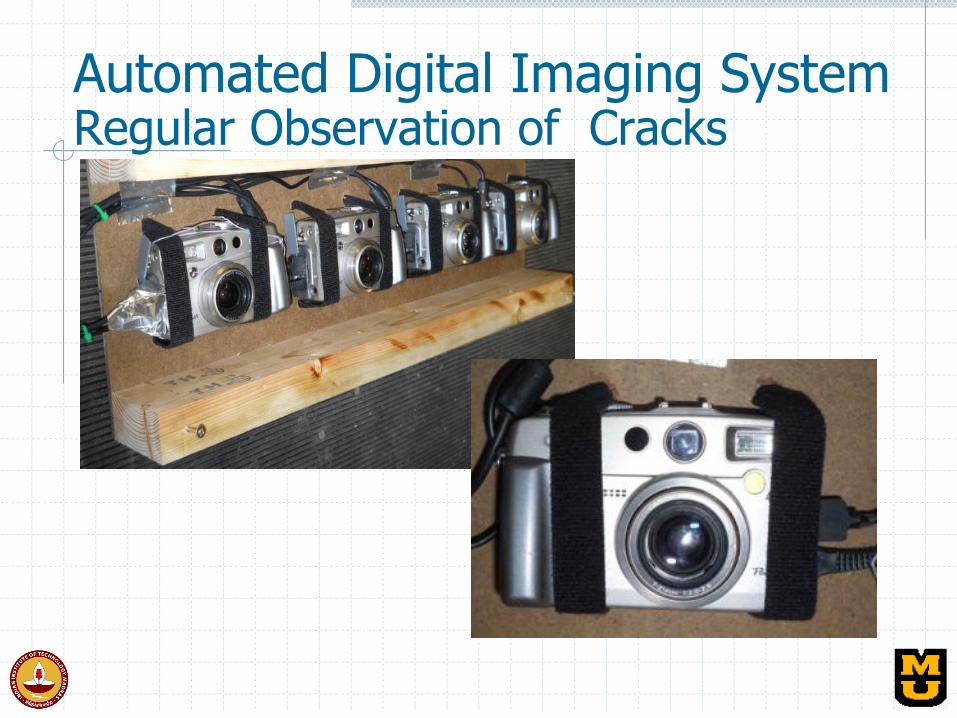
Automated Digital Imaging System Regular Observation of Cracks
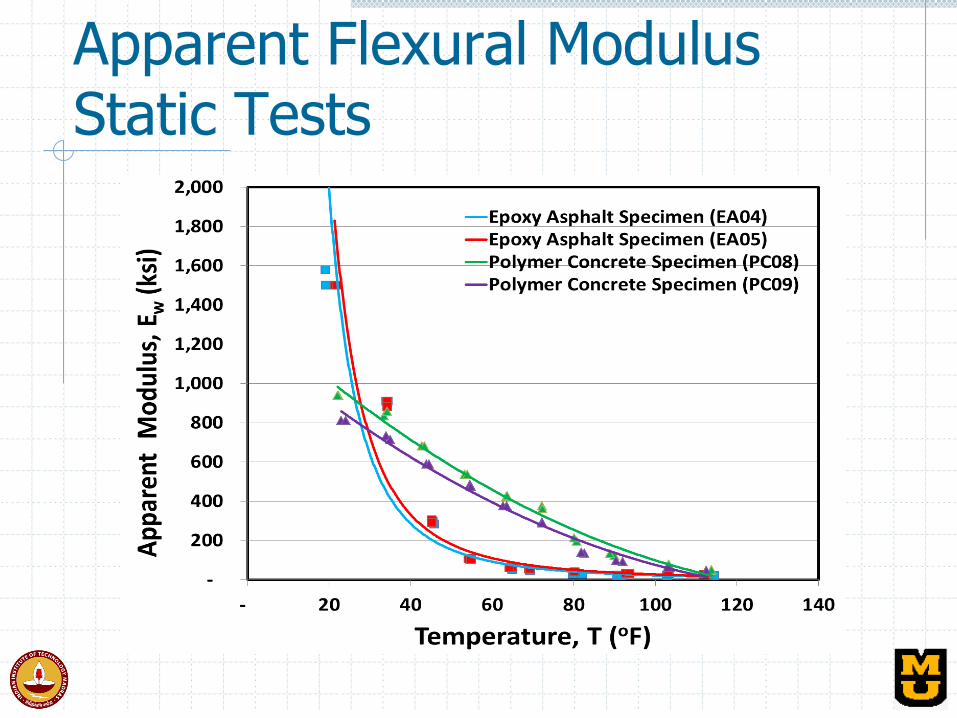
Apparent Flexural Modulus Static Tests
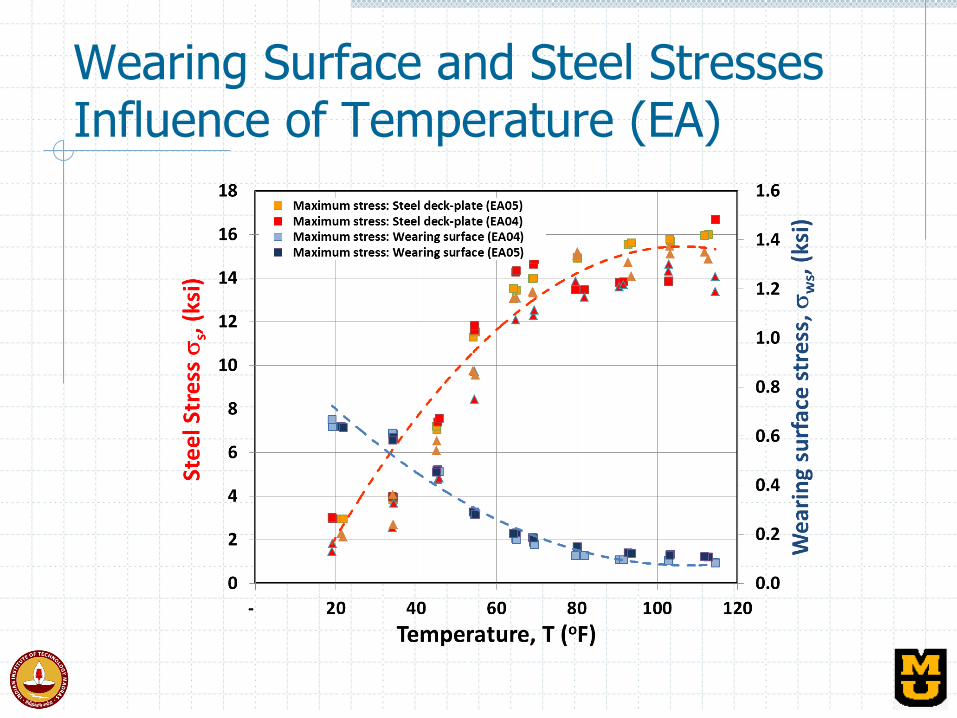
Wearing Surface and Steel Stresses Influence of Temperature (EA)
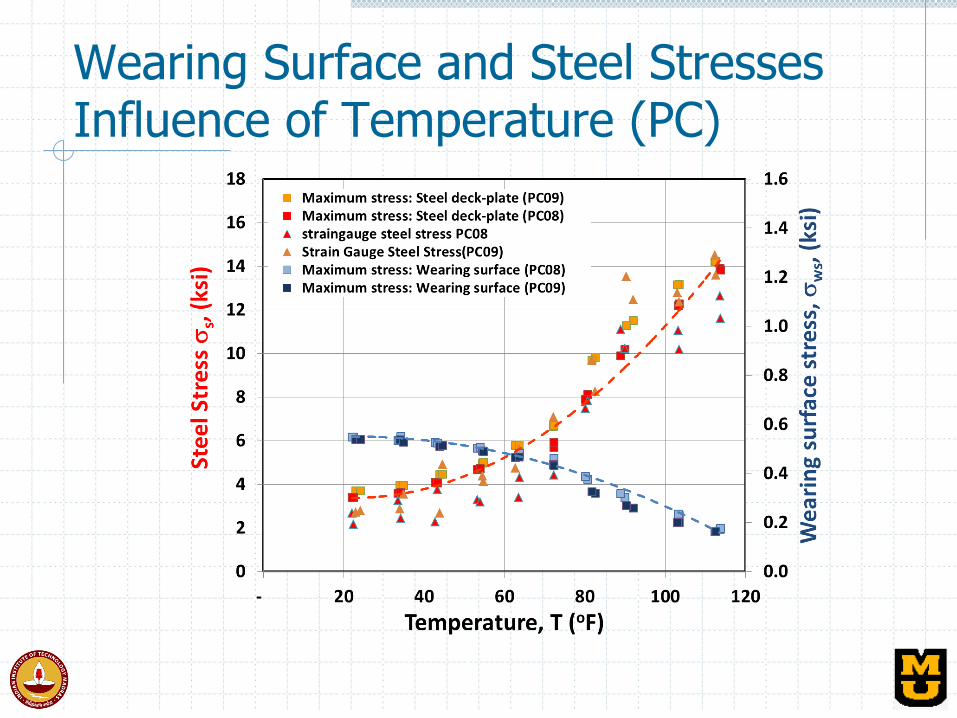
Wearing Surface and Steel Stresses Influence of Temperature (PC)
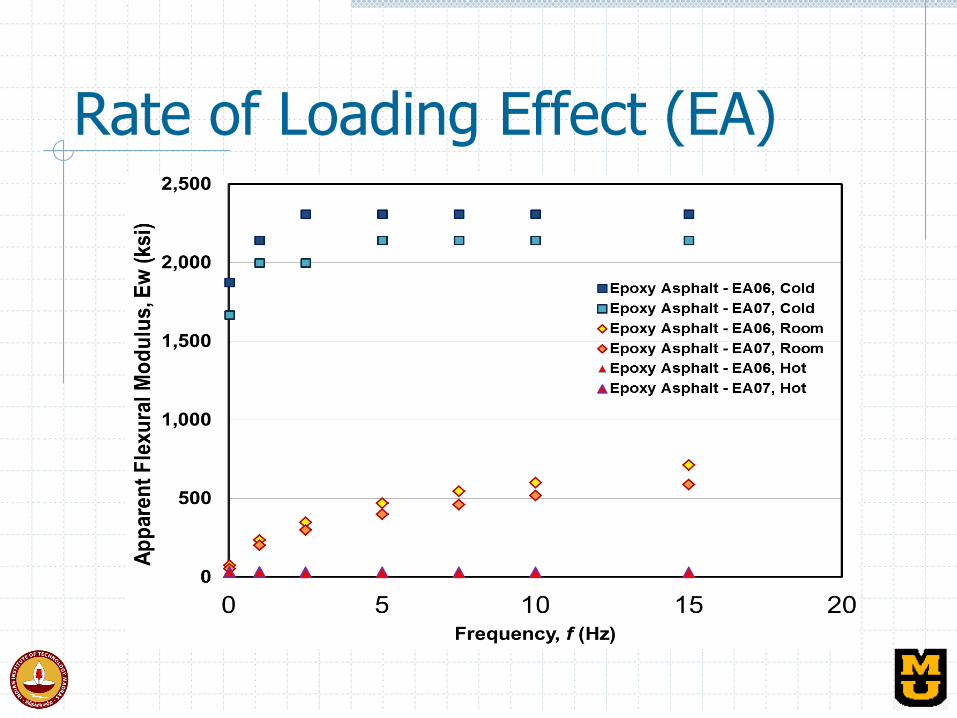
Rate of Loading Effect (EA)
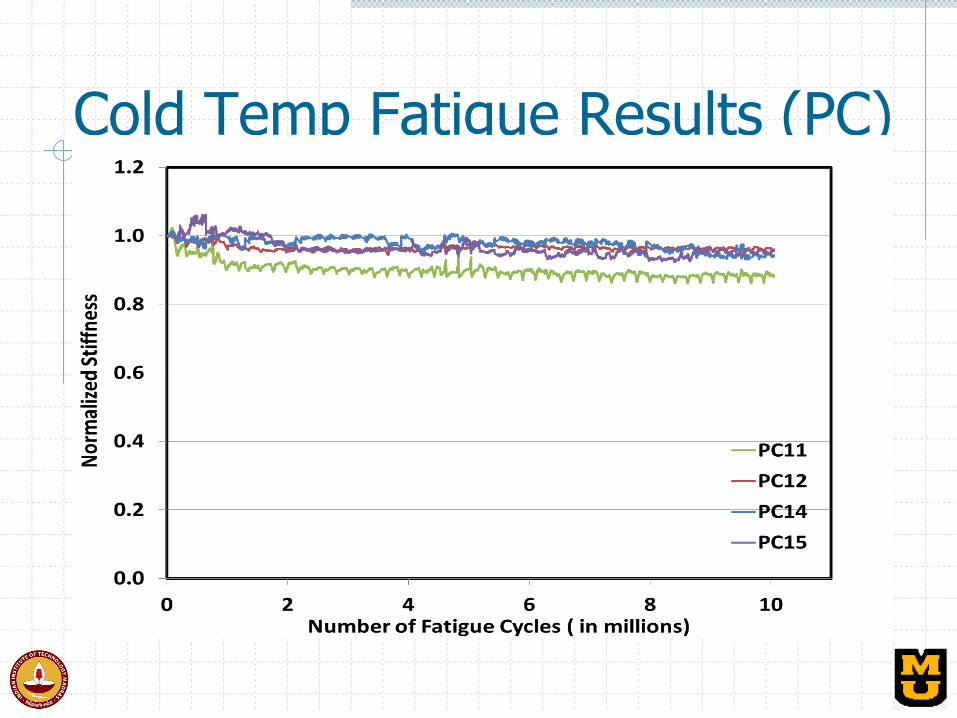
Cold Temp Fatigue Results (PC)
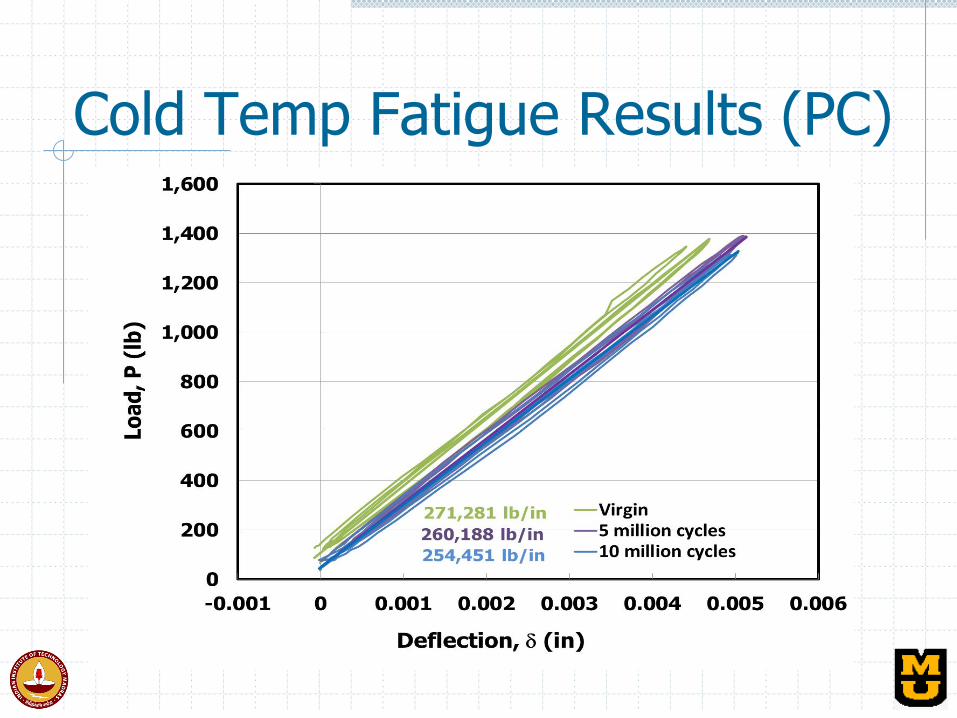
Cold Temp Fatigue Results (PC)
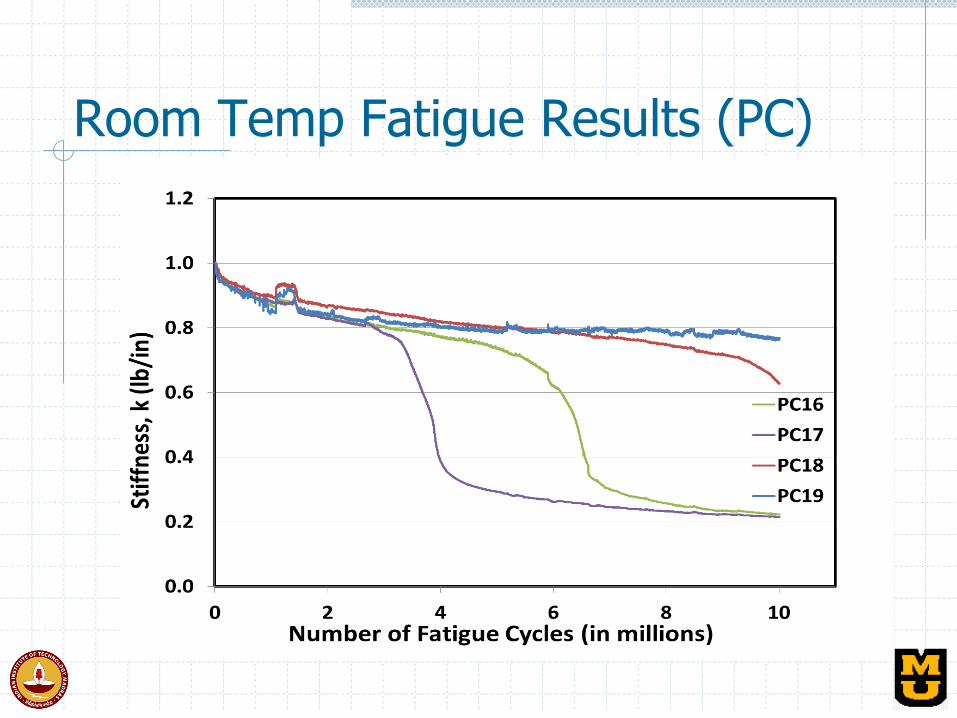
Room Temp Fatigue Results (PC)
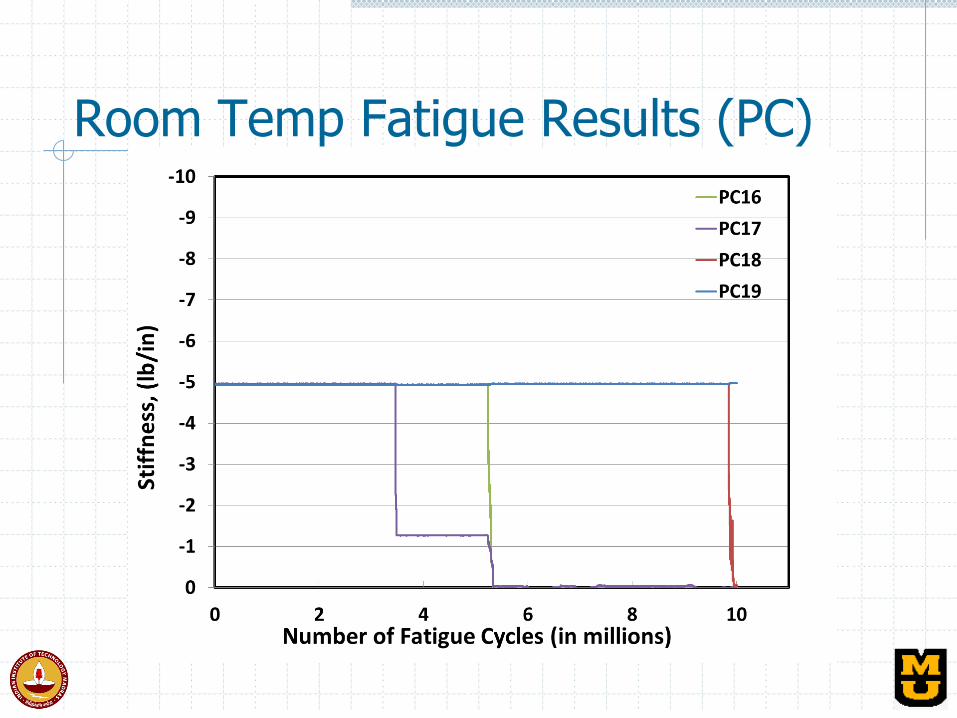
Room Temp Fatigue Results (PC)
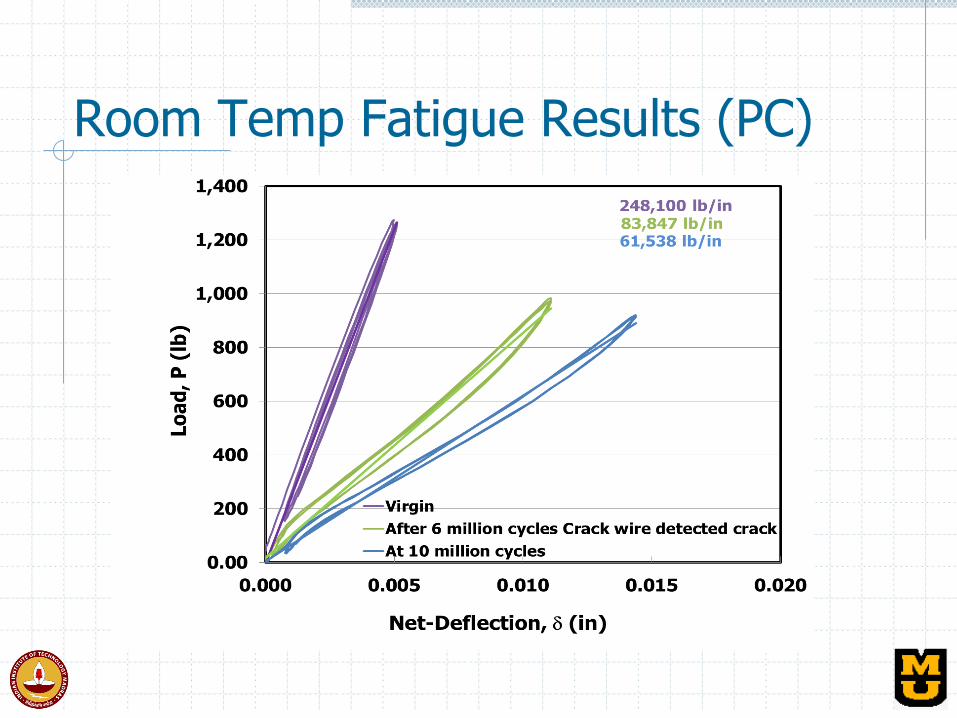
Room Temp Fatigue Results (PC)

Wearing Surfaces: Pull-Out Test
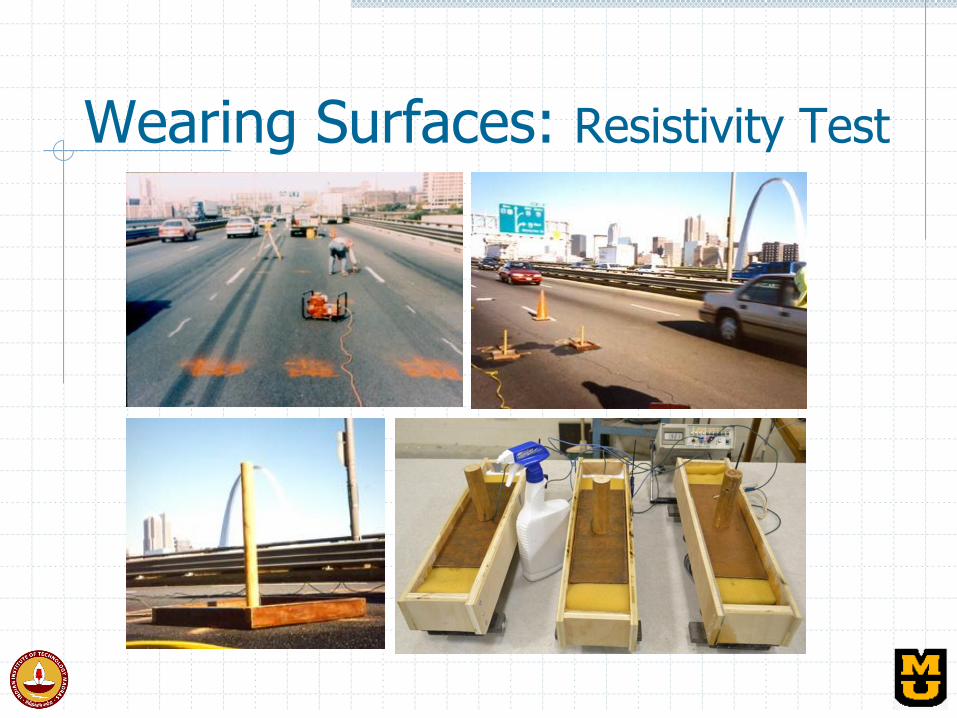
Wearing Surfaces: Resistivity Test

Infrared and Video Images
Patch
Poplar St. Bridge, St. Louis, MO
4”
2”
9 @ 2”
2 @ 2”
4”
2”
9 @ 2”
2 @ 2”
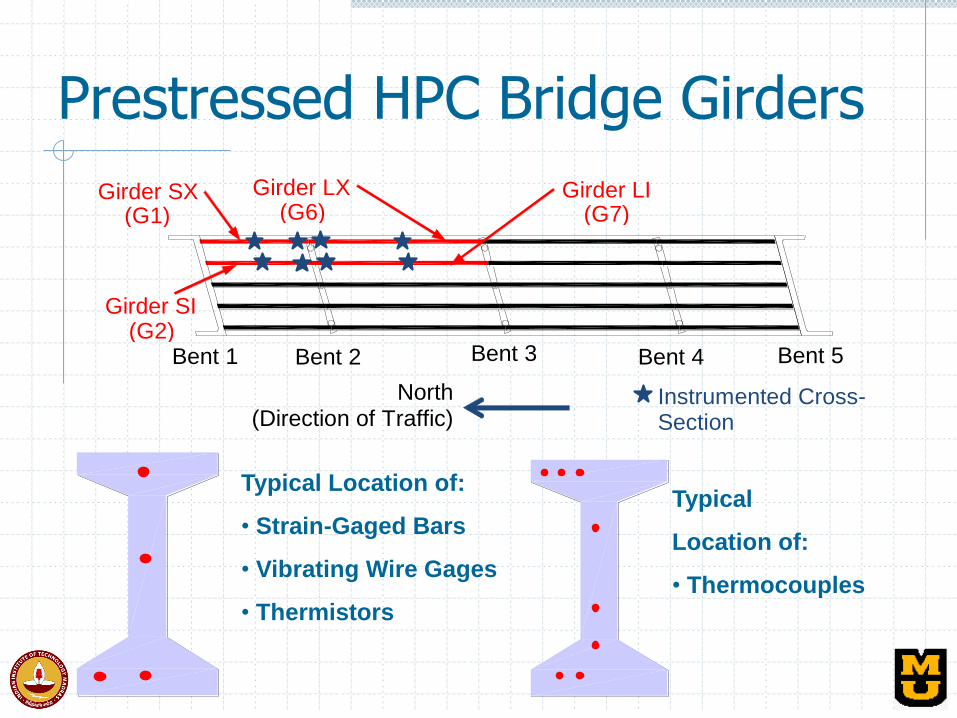
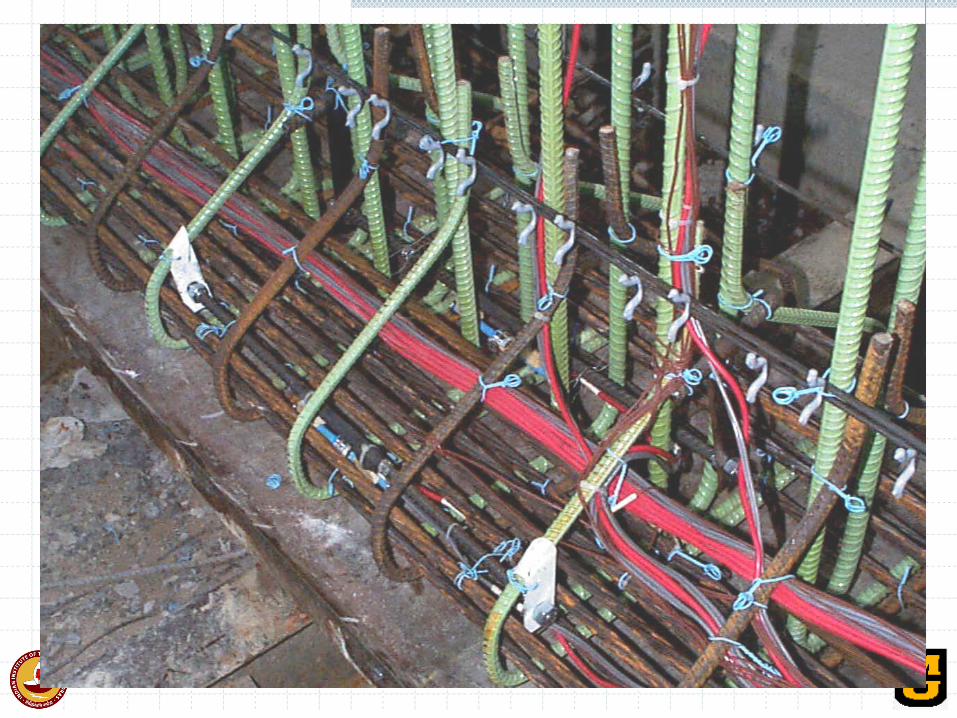
Typical Location of:
• Strain-Gaged Bars
• Vibrating Wire Gages
• Thermistors
Typical
Location of:
• Thermocouples
Bent 1 Bent 2 Bent 3 Bent 4 Bent 5
North (Direction of Traffic)
Girder SI
Girder SX Girder LX Girder LI (G7) (G6) (G1)
(G2)
Instrumented Cross-Section
Prestressed HPC Bridge Girders
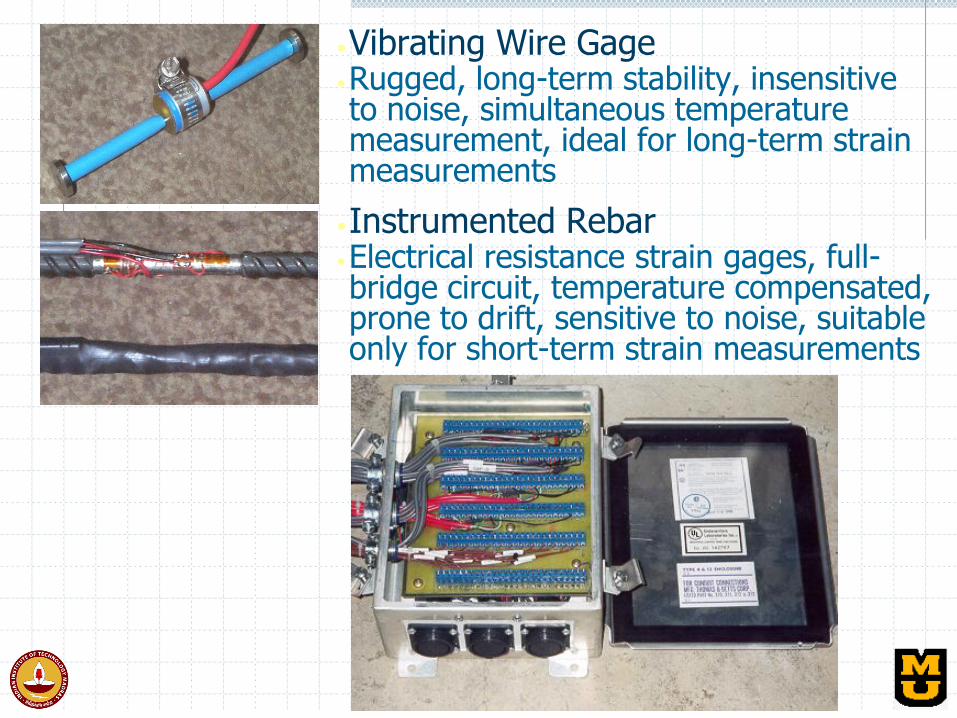
•Vibrating Wire Gage •Rugged, long-term stability, insensitive to noise, simultaneous temperature measurement, ideal for long-term strain measurements
•Instrumented Rebar •Electrical resistance strain gages, full-bridge circuit, temperature compensated, prone to drift, sensitive to noise, suitable only for short-term strain measurements
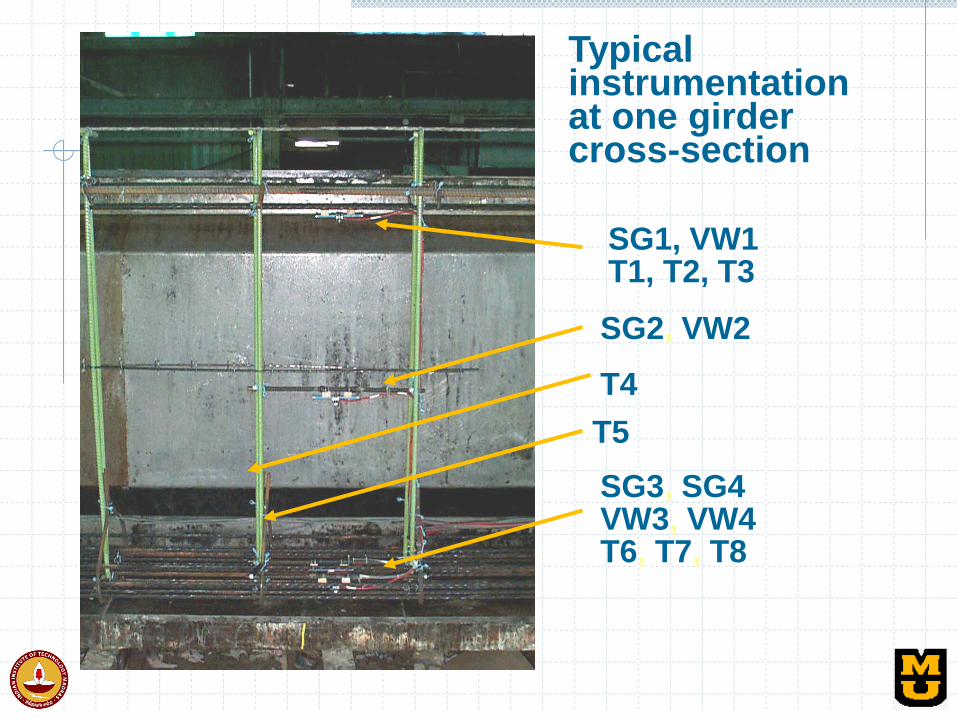
SG1, VW1 T1, T2, T3
SG2, VW2
SG3, SG4 VW3, VW4 T6, T7, T8
T5
T4
Typical instrumentation at one girder cross-section
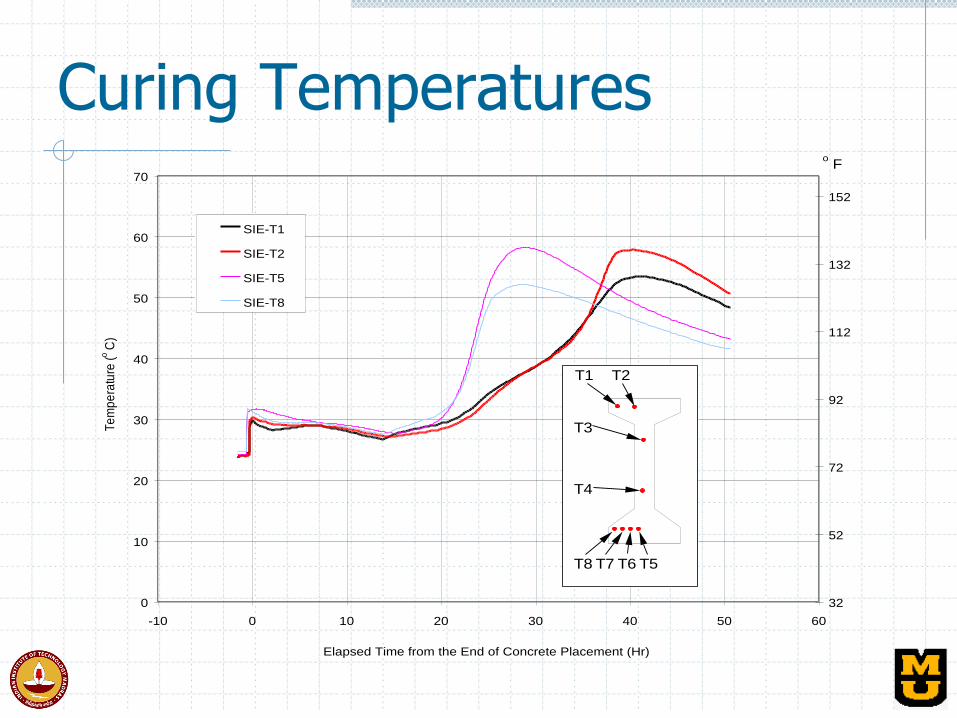
Curing Temperatures
0
10
20
30
40
50
60
70
-10 0 10 20 30 40 50 60
Elapsed Time from the End of Concrete Placement (Hr)
Te
mp
era
ture
(o C
)
32
52
72
92
112
132
152
SIE-T1
SIE-T2
SIE-T5
SIE-T8
o F
T1 T2
T3
T4
T8 T7 T6 T5
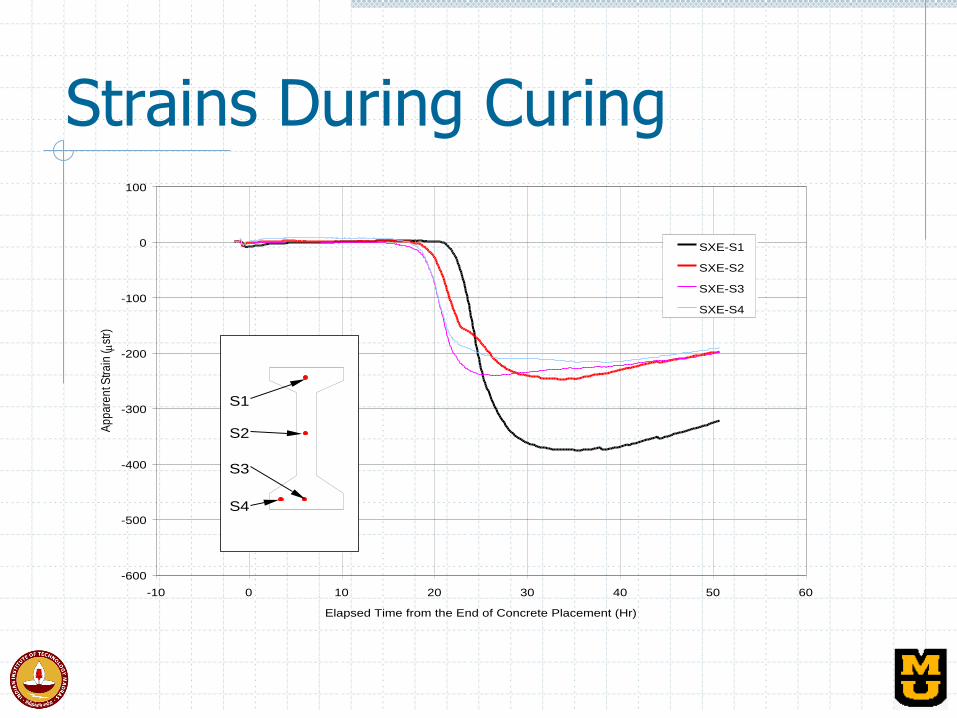
Strains During Curing
-600
-500
-400
-300
-200
-100
0
100
-10 0 10 20 30 40 50 60
Elapsed Time from the End of Concrete Placement (Hr)
Ap
pa
ren
t Str
ain
( st
r)
SXE-S1
SXE-S2
SXE-S3
SXE-S4
S1
S2
S3
S4

PRESTRESS TRANSFER
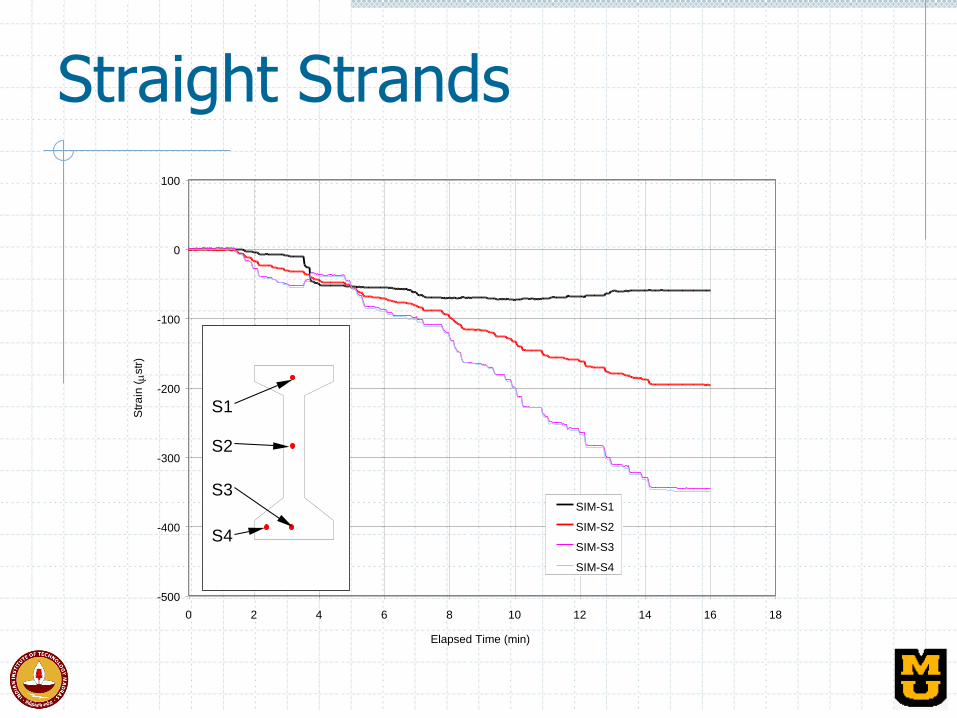
Straight Strands
-500
-400
-300
-200
-100
0
100
0 2 4 6 8 10 12 14 16 18
Elapsed Time (min)
Str
ain
(
str
)
SIM-S1
SIM-S2
SIM-S3
SIM-S4
S1
S2
S3
S4
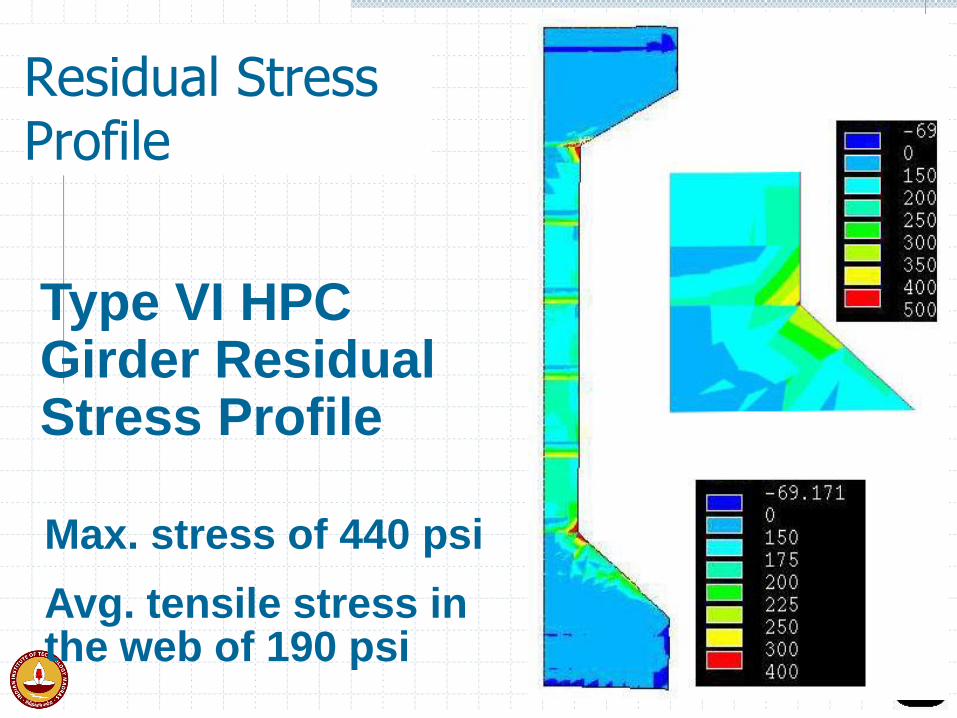
Residual Stress Profile
Max. stress of 440 psi
Avg. tensile stress in the web of 190 psi
Type VI HPC Girder Residual Stress Profile

LOAD TEST
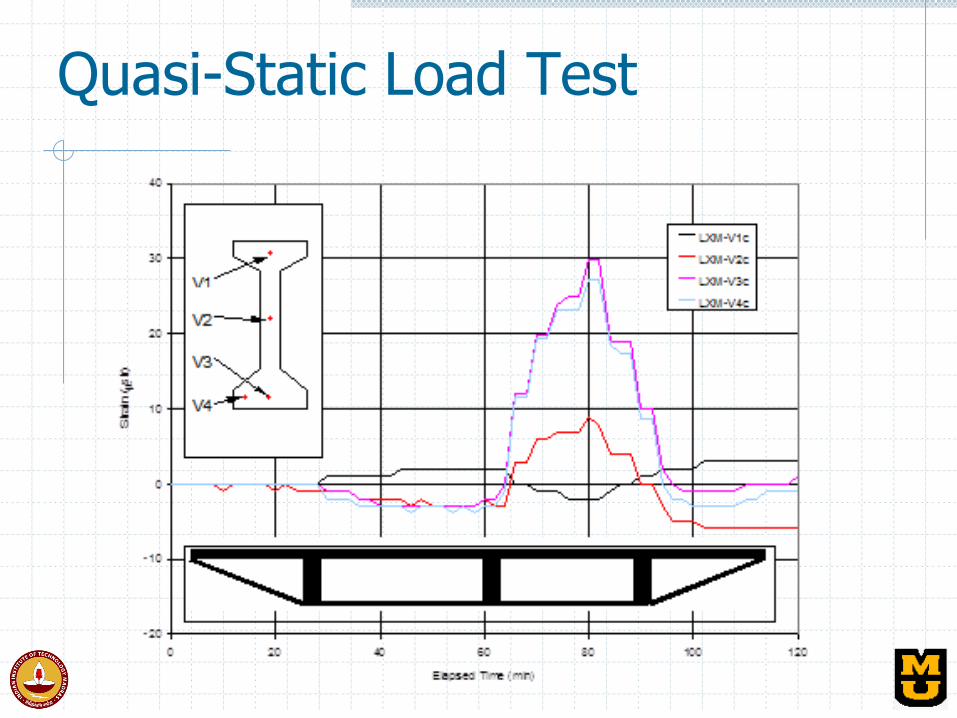
Quasi-Static Load Test
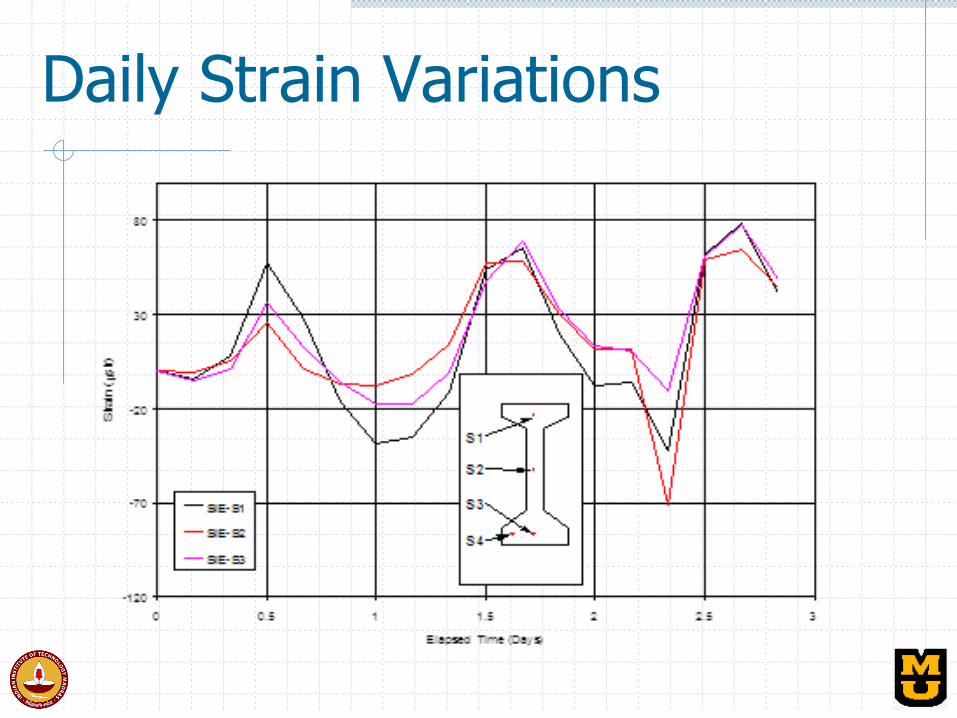
Daily Strain Variations
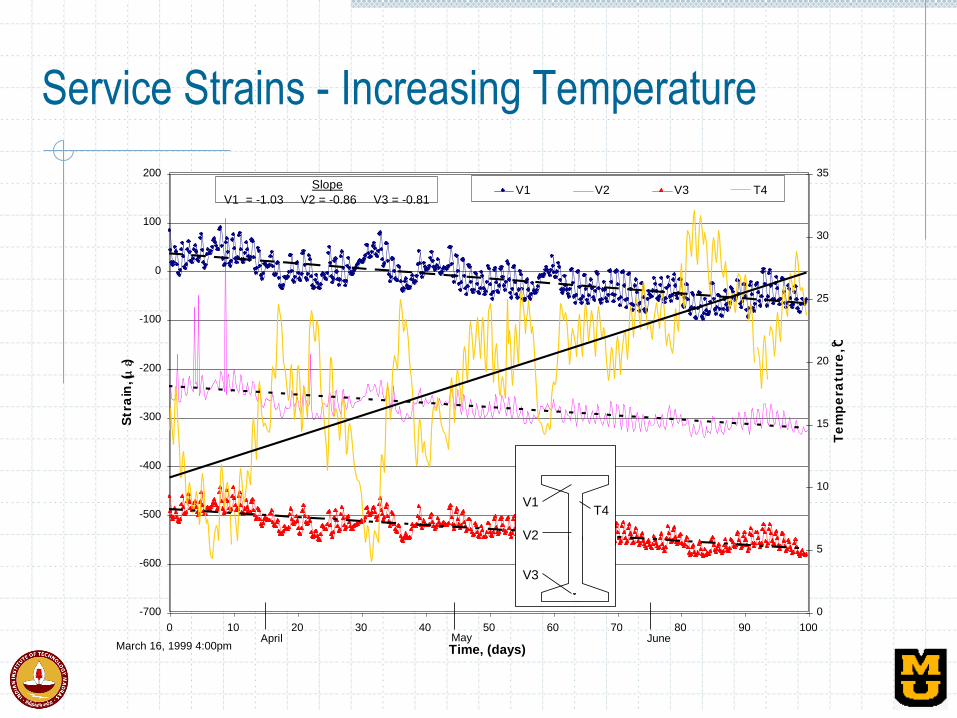
Service Strains - Increasing Temperature
-700
-600
-500
-400
-300
-200
-100
0
100
200
0 10 20 30 40 50 60 70 80 90 100
Time, (days)
Str
ain
, (
)
0
5
10
15
20
25
30
35
Te
mp
era
ture
, Co
V1 V2 V3 T4
March 16, 1999 4:00pmApril May June
Slope
V1 = -1.03 V2 = -0.86 V3 = -0.81
V1
V2
V3
T4
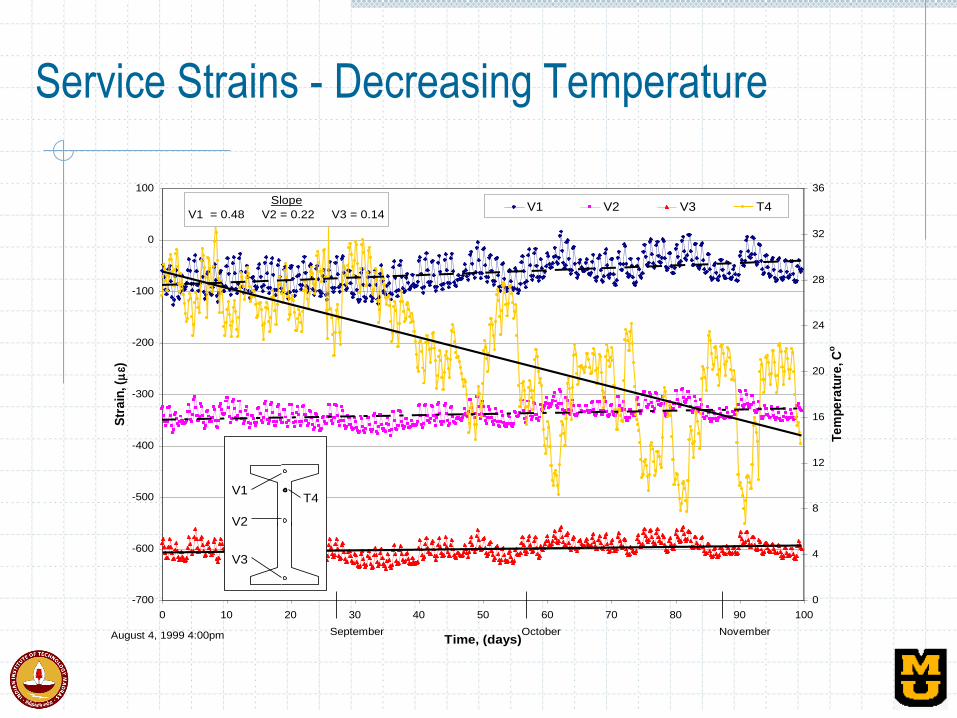
Service Strains - Decreasing Temperature
-700
-600
-500
-400
-300
-200
-100
0
100
0 10 20 30 40 50 60 70 80 90 100
Time, (days)
Str
ain
, (
)
0
4
8
12
16
20
24
28
32
36
Te
mp
era
ture
, Co
V1 V2 V3 T4
August 4, 1999 4:00pm September October November
Slope
V1 = 0.48 V2 = 0.22 V3 = 0.14
V1
V2
V3
T4

Precast Prestressed Pavement
• Evaluate the performance of precast prestressed panels during fabrication, construction and service:
Joint FHWA / MODoT Project
Site – Northbound I-57, existing pavement has been in poor shape for nearly a decade.
1,000’ of precast pavement
Heavy truck traffic
Severe environmental conditions (temperature, deicing, precipitation)
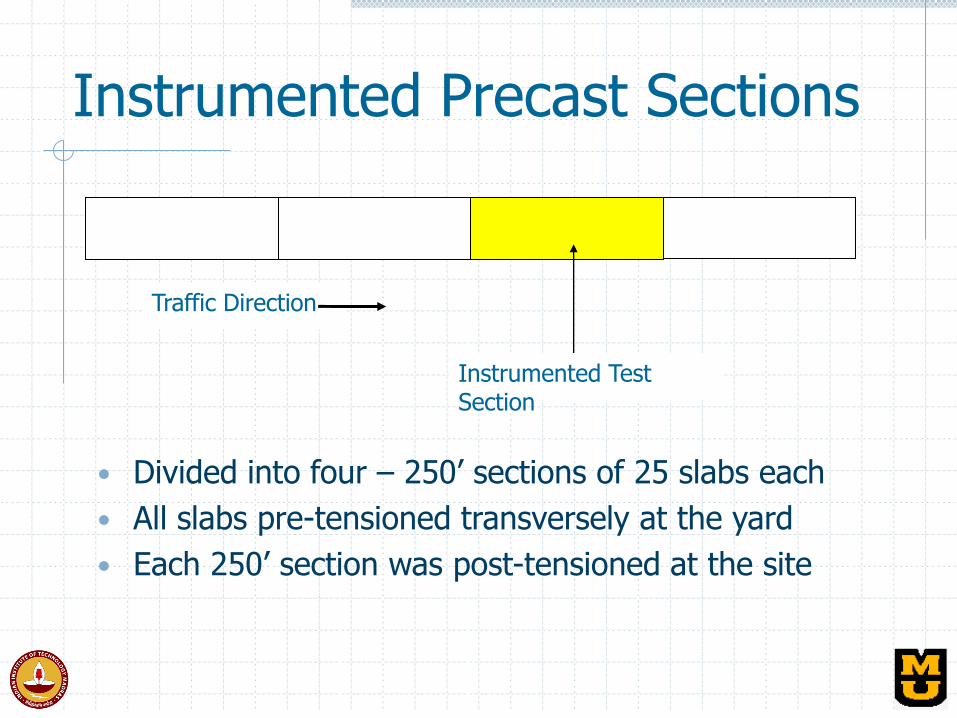
Instrumented Precast Sections
Traffic Direction
Instrumented Test Section
• Divided into four – 250’ sections of 25 slabs each
• All slabs pre-tensioned transversely at the yard
• Each 250’ section was post-tensioned at the site
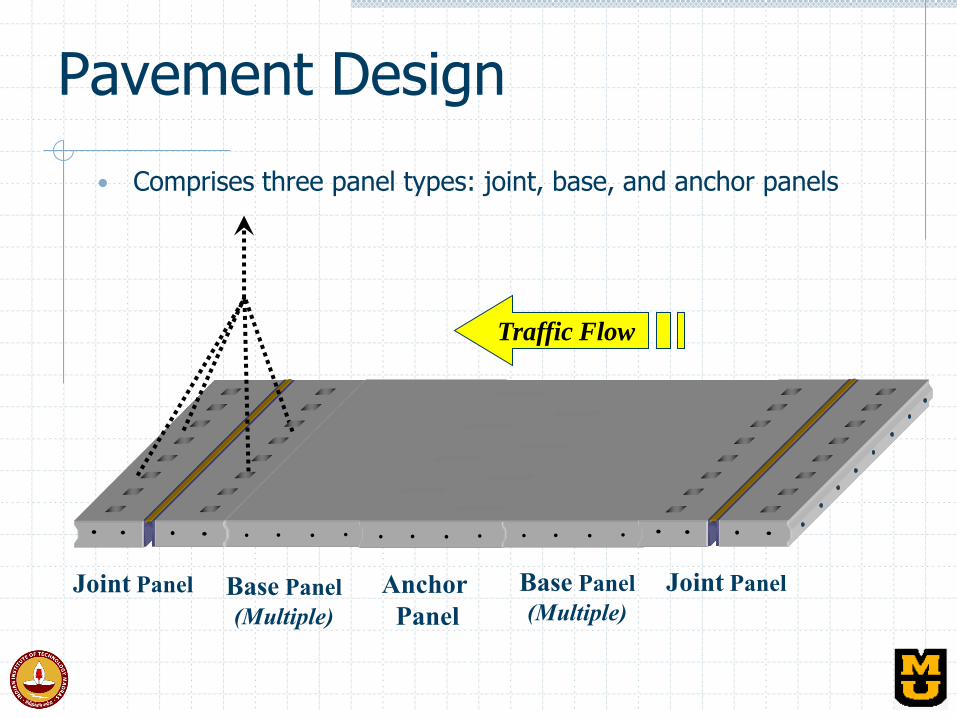
Pavement Design
• Comprises three panel types: joint, base, and anchor panels
Joint Panel Base Panel
(Multiple)
Anchor
Panel Base Panel
(Multiple)
Joint Panel
Traffic Flow
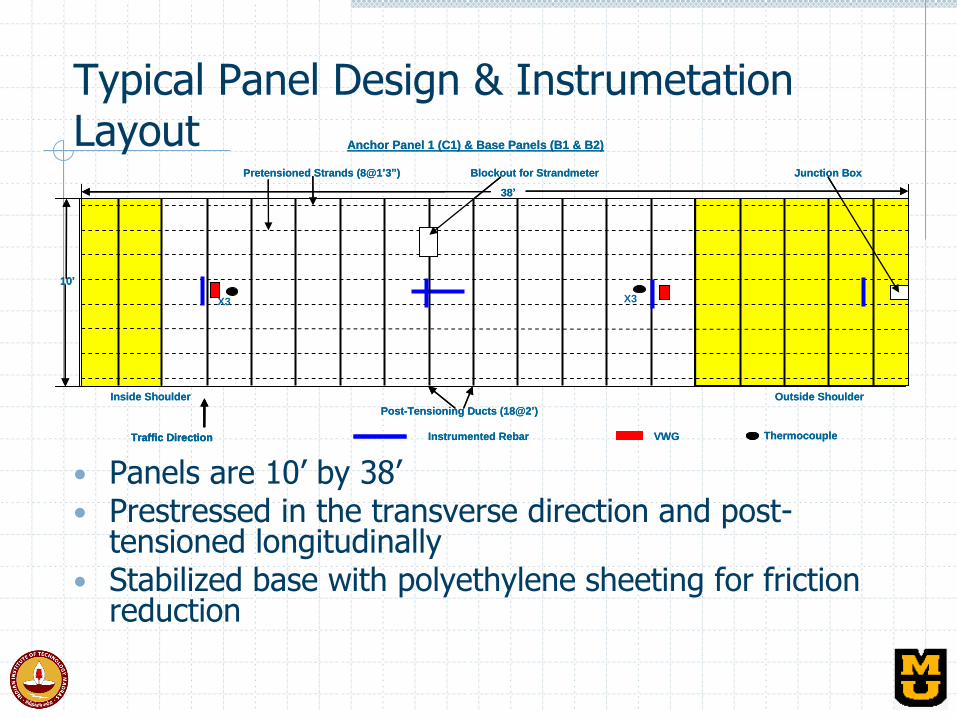
Typical Panel Design & Instrumetation Layout
• Panels are 10’ by 38’ • Prestressed in the transverse direction and post-
tensioned longitudinally • Stabilized base with polyethylene sheeting for friction
reduction
Anchor Panel 1 (C1) & Base Panels (B1 & B2)
VWG ThermocoupleInstrumented Rebar
Inside Shoulder Outside Shoulder
Pretensioned Strands (8@1’3”)
38’
10’
Junction Box
Post-Tensioning Ducts (18@2’)
Blockout for Strandmeter
Traffic Direction
X3 X3
Anchor Panel 1 (C1) & Base Panels (B1 & B2)
VWG ThermocoupleInstrumented Rebar
Inside Shoulder Outside Shoulder
Pretensioned Strands (8@1’3”)
38’
10’
Junction Box
Post-Tensioning Ducts (18@2’)
Blockout for Strandmeter
Traffic DirectionTraffic Direction
X3 X3
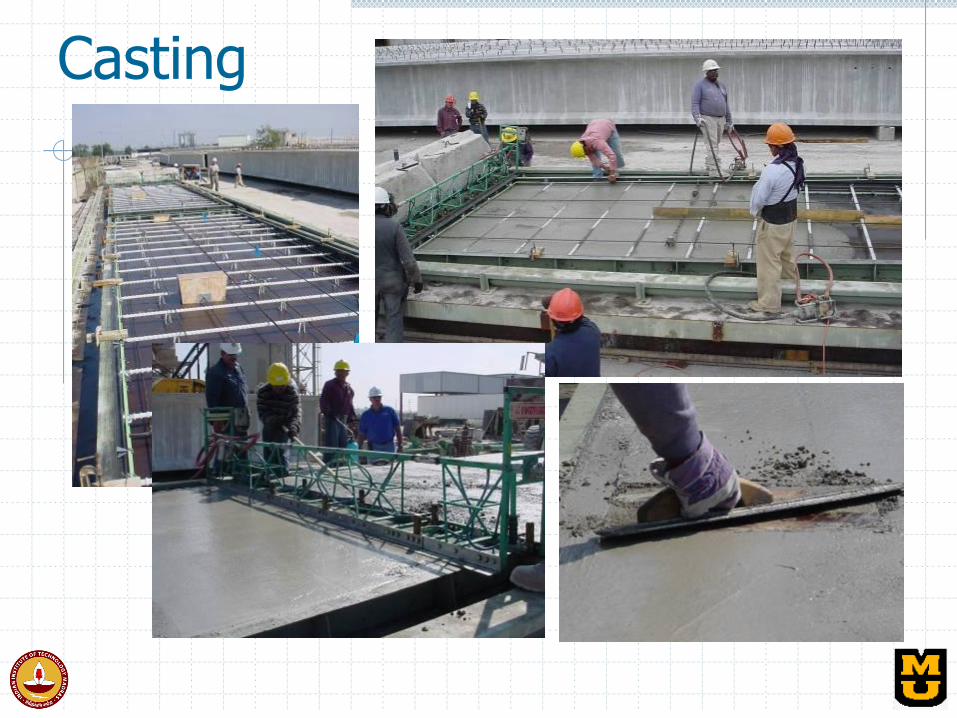
Casting
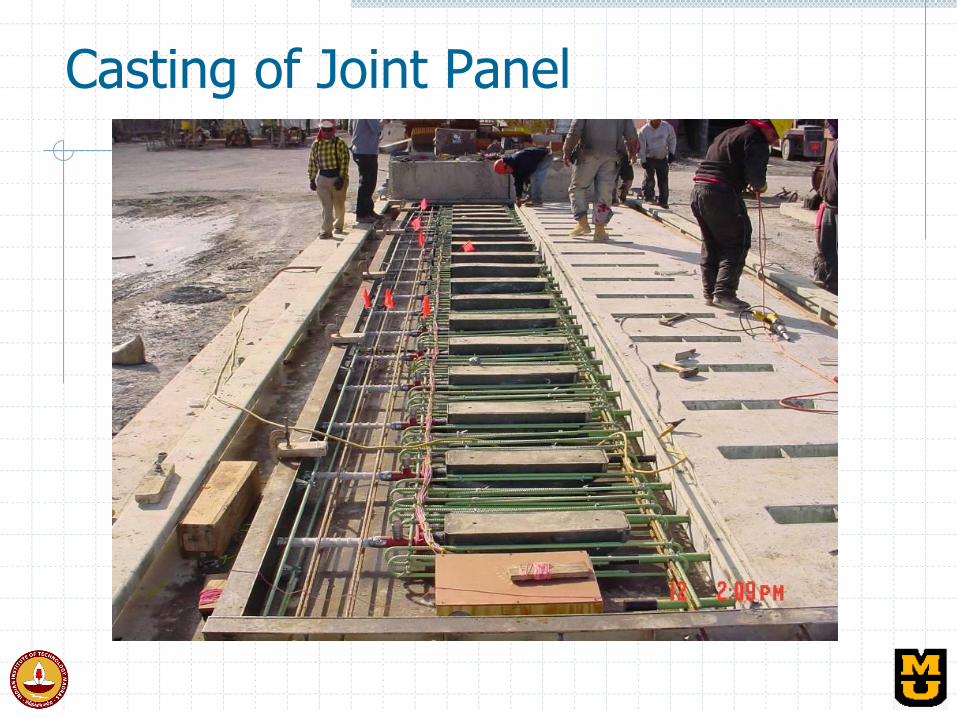
Casting of Joint Panel
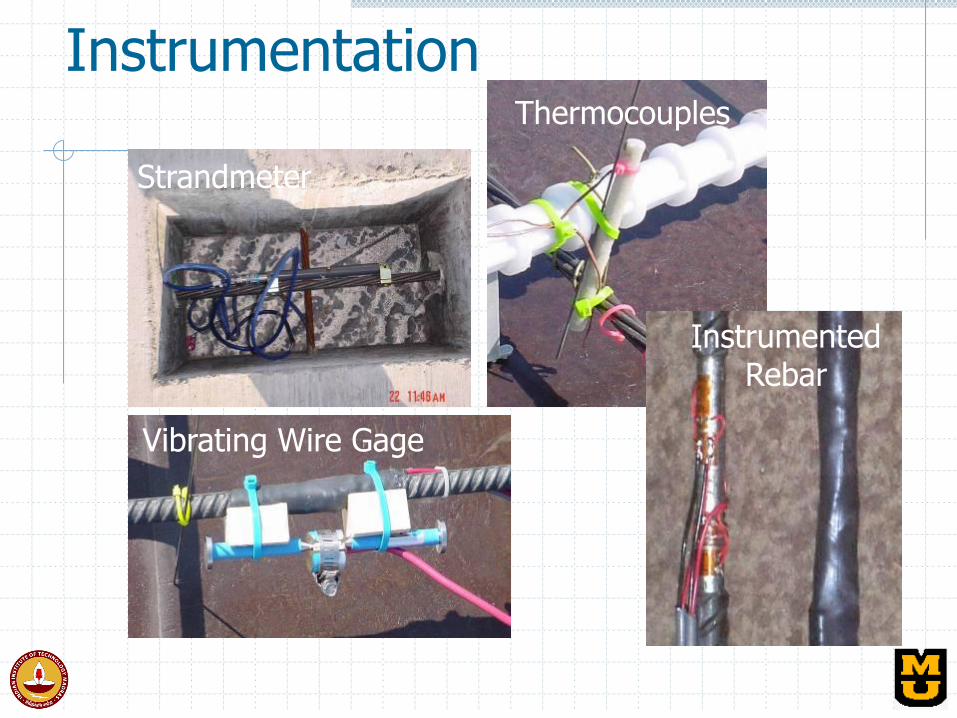
Strandmeter
Instrumentation
Instrumented Rebar
Vibrating Wire Gage
Thermocouples
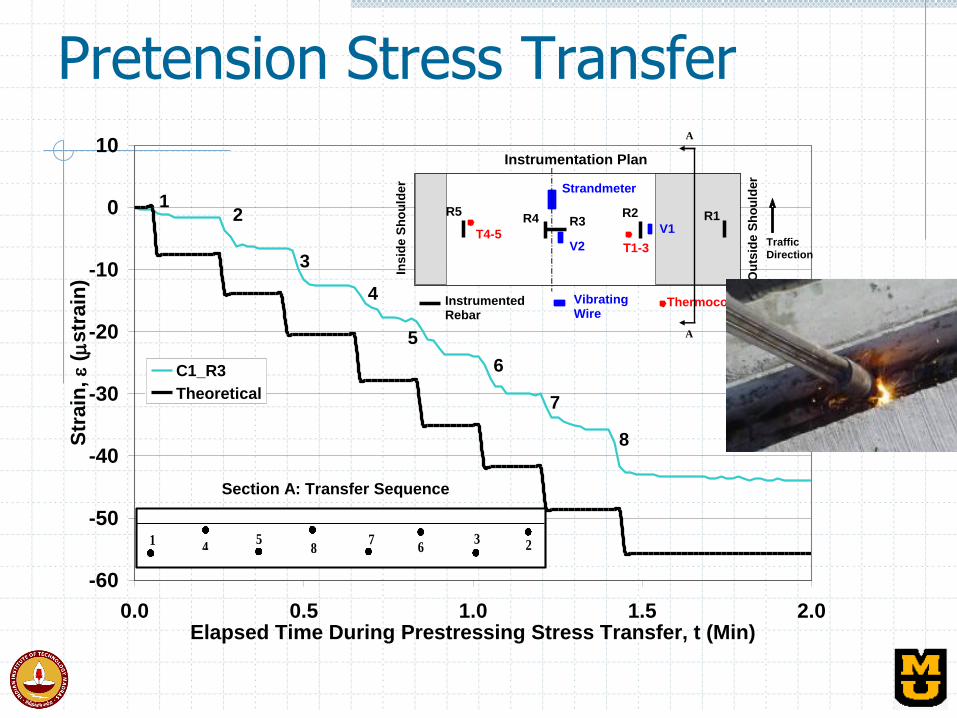
-60
-50
-40
-30
-20
-10
0
10
0.0 0.5 1.0 1.5 2.0Elapsed Time During Prestressing Stress Transfer, t (Min)
Str
ain
,
( str
ain
)
C1_R3
Theoretical
1
4 5
8 7
6 3 2
Vibrating Wire Gage
Instrumentation Plan
Traffic
Direction
Thermocouple Instrumented Rebar
Insid
e S
ho
uld
er
Ou
tsid
e S
ho
uld
er
T4-5 T1-3
R2 R1
Strandmeter
R4 R3
V2
R5
V1
A
A
Section A: Transfer Sequence
12
3
4
5
6
7
8
Pretension Stress Transfer
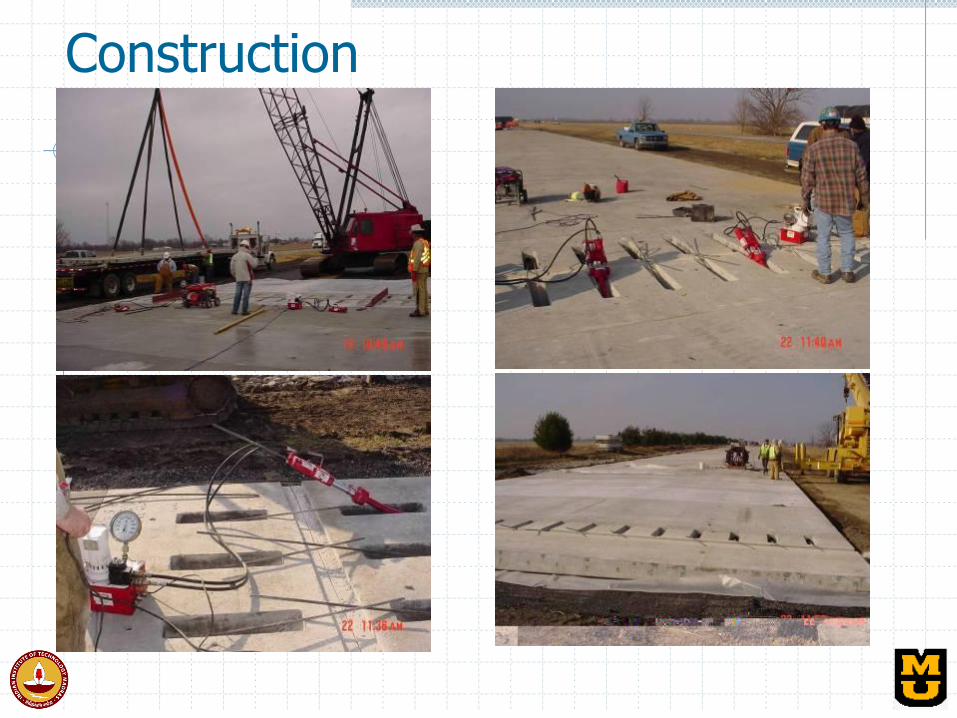
Construction
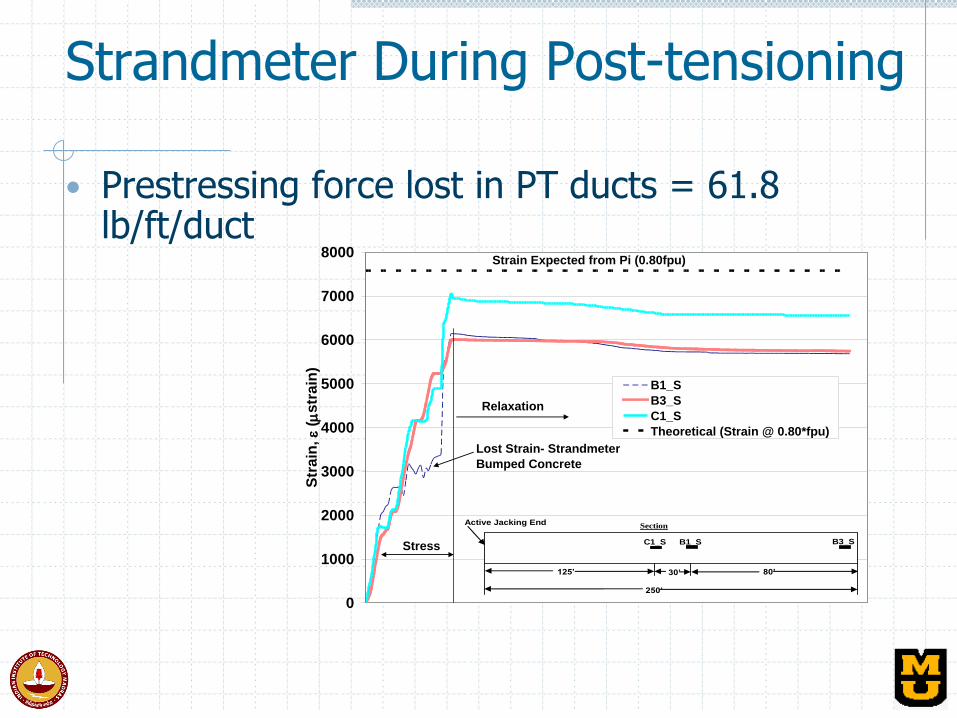
Strandmeter During Post-tensioning
0
1000
2000
3000
4000
5000
6000
7000
8000
Str
ain
,
( str
ain
)
B1_S
B3_S
C1_S
Theoretical (Strain @ 0.80*fpu)
Strain Expected from Pi (0.80fpu)
Relaxation
Stress
ing
Lost Strain- Strandmeter
Bumped Concrete
250’
Active Jacking End
C1_S B1_S
125’ 30’ 80’
B3_S
Section
• Prestressing force lost in PT ducts = 61.8 lb/ft/duct
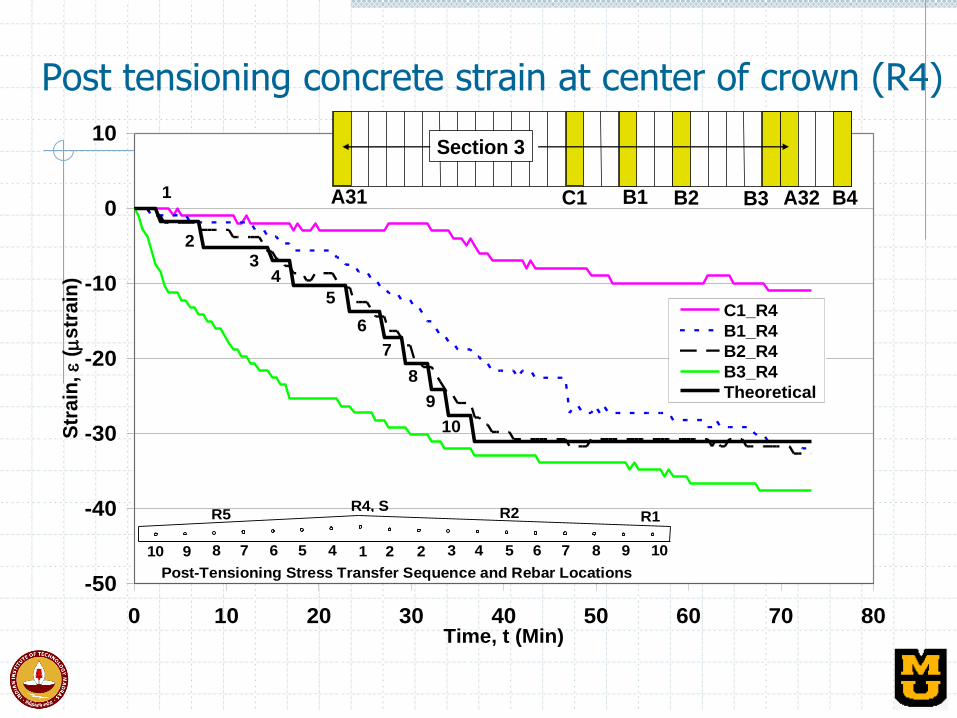
-50
-40
-30
-20
-10
0
10
0 10 20 30 40 50 60 70 80Time, t (Min)
Str
ain
,
( s
tra
in)
C1_R4
B1_R4
B2_R4
B3_R4
Theoretical
A32 B3
Section 3
B4 B2 B1 C1 A31
2 2 3 4 5 6 7 8 9 10 1 4 5 6 7 8 9 10
Post-Tensioning Stress Transfer Sequence and Rebar Locations
R4, S R2 R1 R5
1
23
4
5
6
7
8
9
10
Post tensioning concrete strain at center of crown (R4)
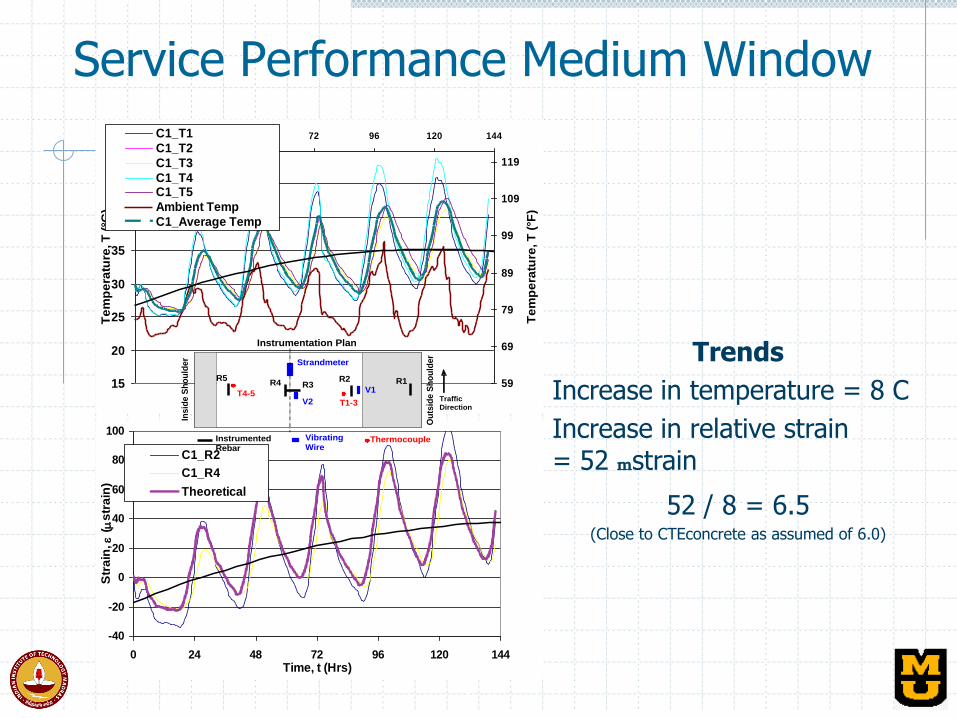
Service Performance Medium Window
Trends
Increase in temperature = 8 C
Increase in relative strain = 52 mstrain
52 / 8 = 6.5 (Close to CTEconcrete as assumed of 6.0)
15
20
25
30
35
40
45
50
0 24 48 72 96 120 144
Te
mp
era
ture
, T
(°C
)
59
69
79
89
99
109
119
Te
mp
era
ture
, T
(°F
)
C1_T1
C1_T2
C1_T3
C1_T4C1_T5
Ambient Temp
C1_Average Temp
-40
-20
0
20
40
60
80
100
0 24 48 72 96 120 144Time, t (Hrs)
Str
ain
,
(
str
ain
)
C1_R2
C1_R4
Theoretical
Vibrating Wire Gage
Instrumentation Plan
Traffic
Direction
Thermocouple Instrumented Rebar
Insid
e S
ho
uld
er
Ou
tsid
e S
ho
uld
er
T4-5 T1-3
R2 R1
Strandmeter
R4 R3
V2
R5
V1
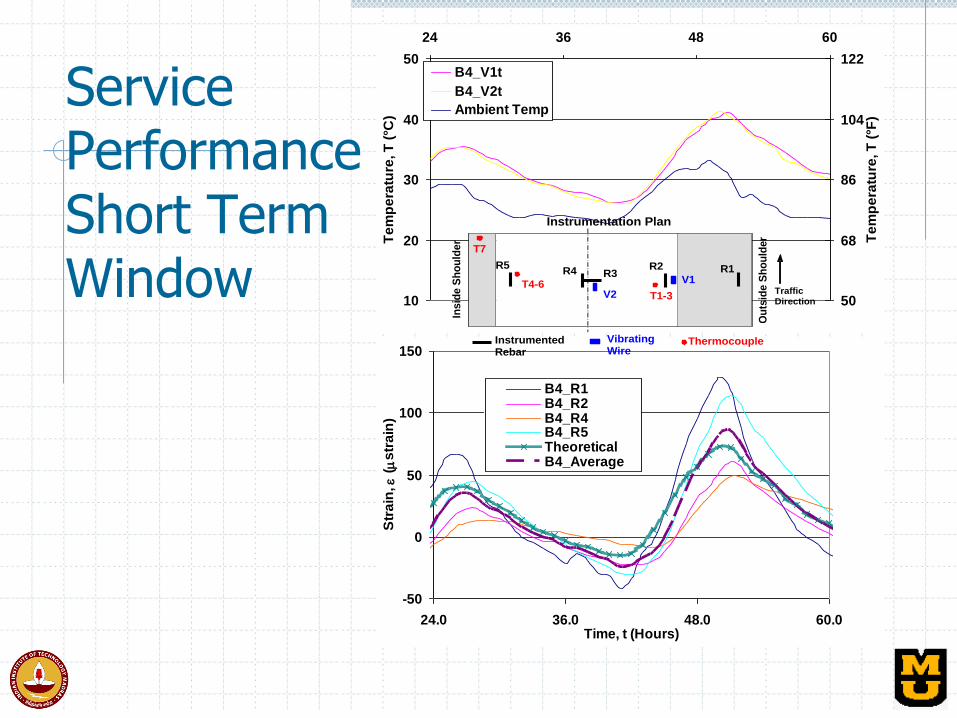
Service Performance Short Term Window
10
20
30
40
50
24 36 48 60
Te
mp
era
ture
, T
(°C
)
50
68
86
104
122
Te
mp
era
ture
, T
(°F
)
B4_V1t
B4_V2t
Ambient Temp
-50
0
50
100
150
24.0 36.0 48.0 60.0Time, t (Hours)
Str
ain
,
(
str
ain
)B4_R1B4_R2B4_R4B4_R5TheoreticalB4_Average
Vibrating Wire Gage
Instrumentation Plan
Traffic
Direction
Thermocouple Instrumented Rebar
Insid
e S
ho
uld
er
Ou
tsid
e S
ho
uld
er
T4-6 T1-3
R2 R1 R4 R3
V2
R5
V1
T7
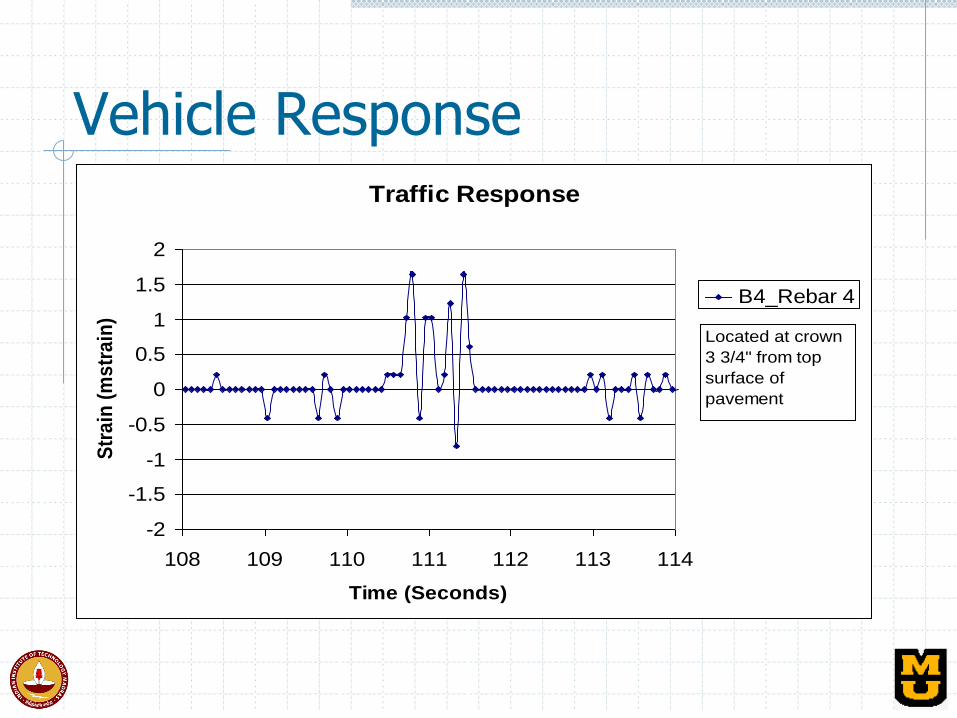
Vehicle Response Traffic Response
-2
-1.5
-1
-0.5
0
0.5
1
1.5
2
108 109 110 111 112 113 114
Time (Seconds)
Str
ain
(m
str
ain
)
B4_Rebar 4
Located at crown
3 3/4" from top
surface of
pavement
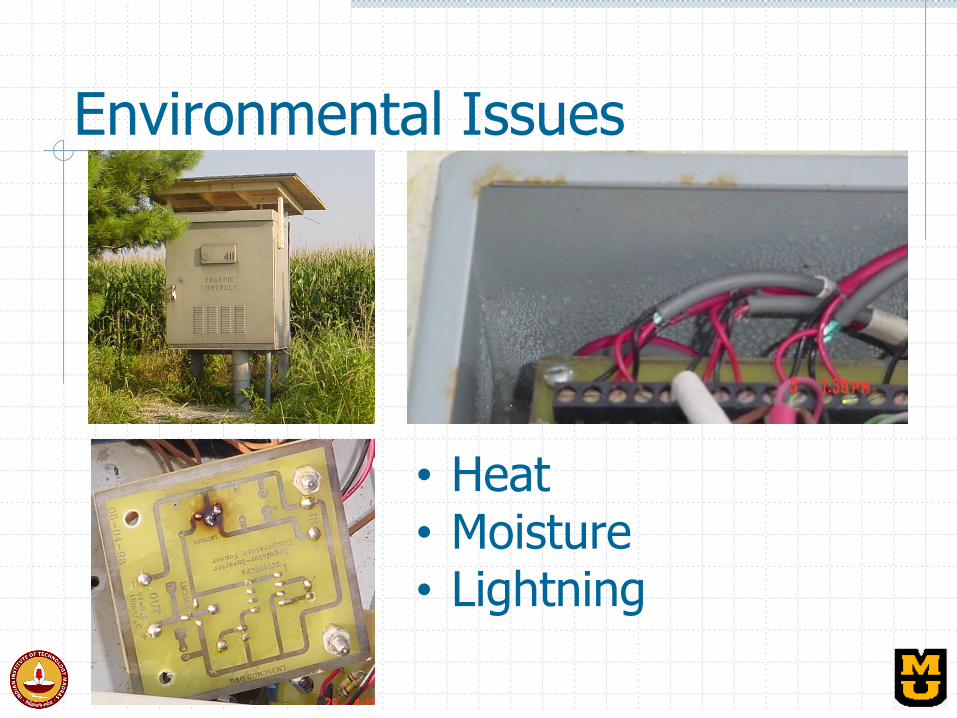
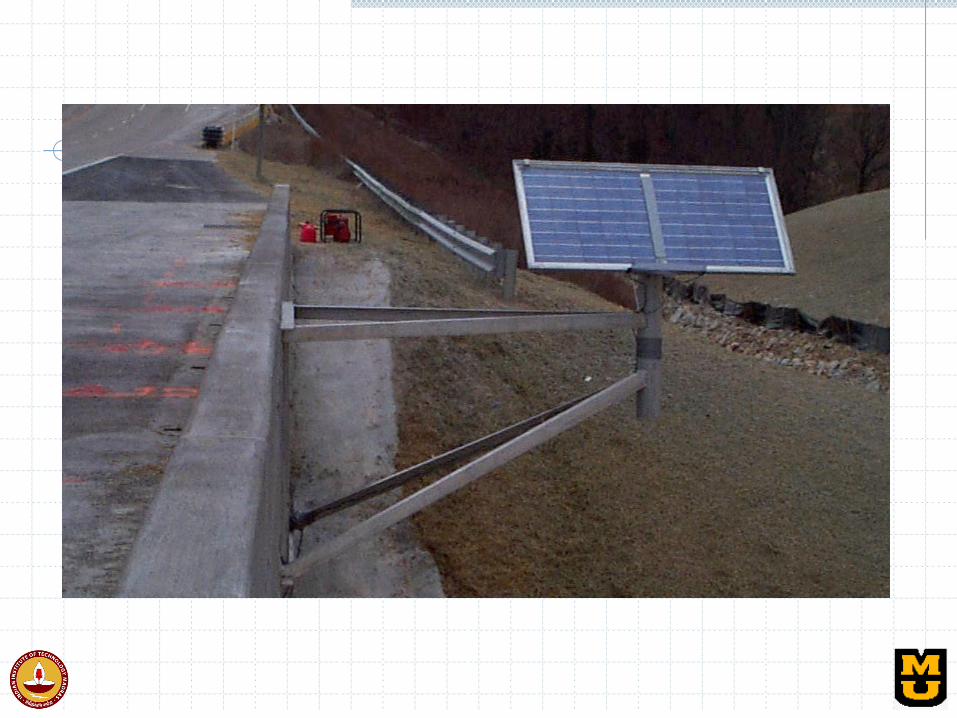
Environmental Issues
• Heat • Moisture • Lightning
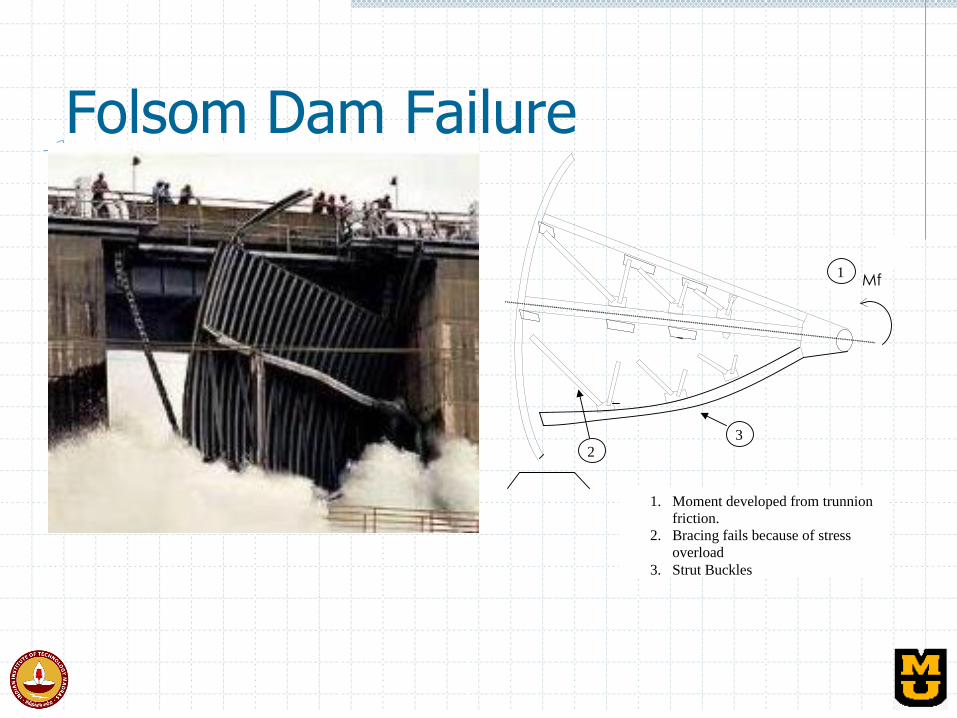
Folsom Dam Failure Tainter Gate Failure
Mf
1
2
3
1. Moment developed from trunnion
friction.
2. Bracing fails because of stress
overload
3. Strut Buckles

Carlyle Lake Dam
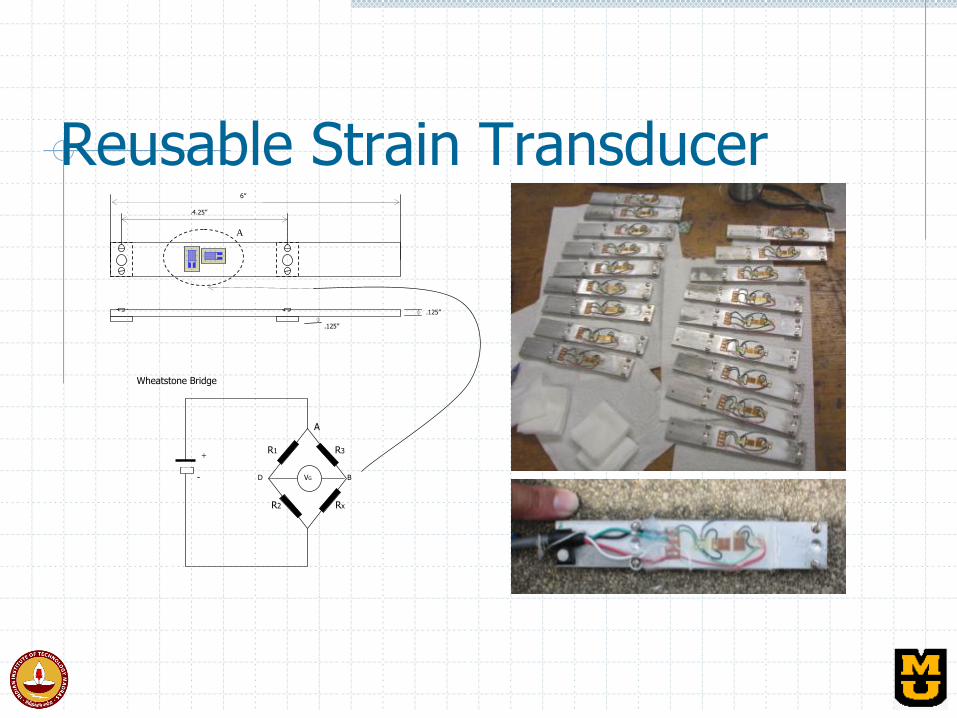
Reusable Strain Transducer .4.25”
6”
.125”
Wheatstone Bridge
A
Detail A
.125”
+
A R1 R3
D VG B
R2 Rx
C
-
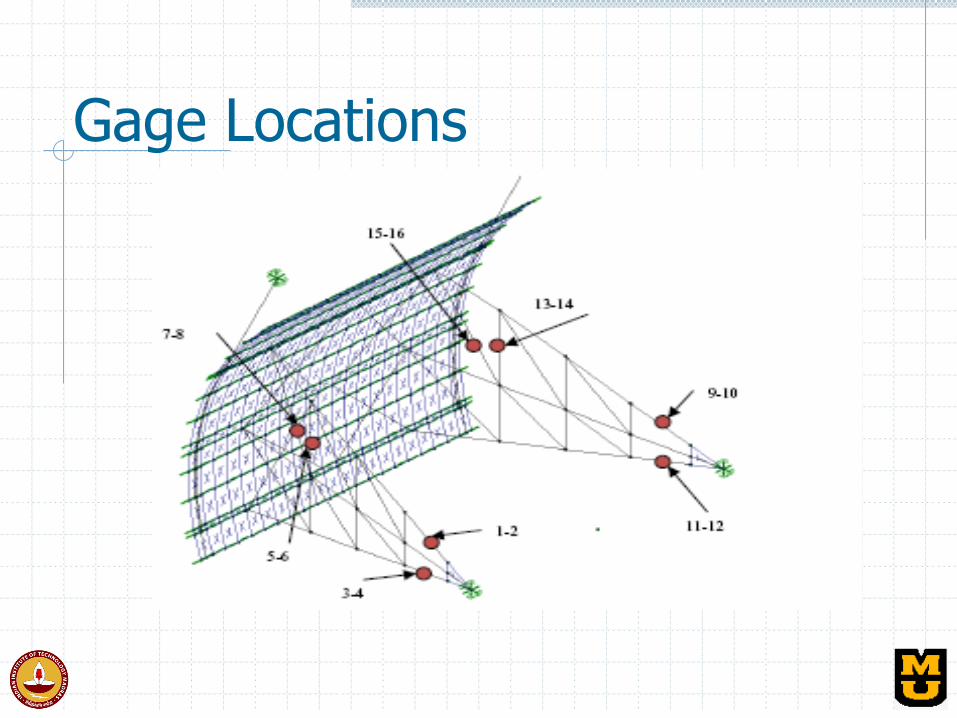
Gage Locations
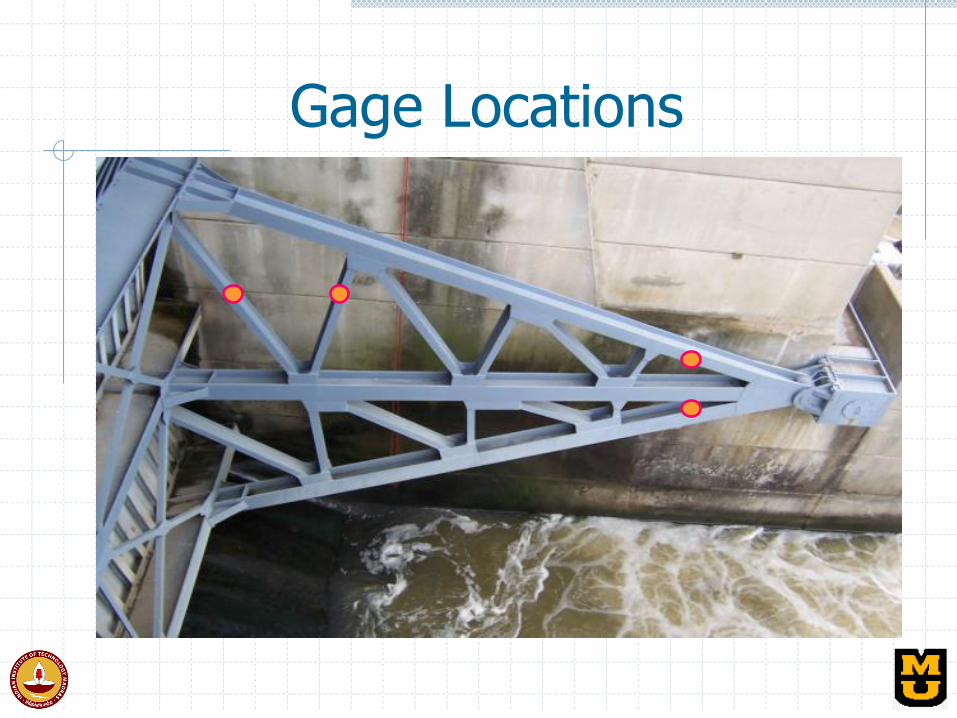
Gage Locations

Installing Strain Gages
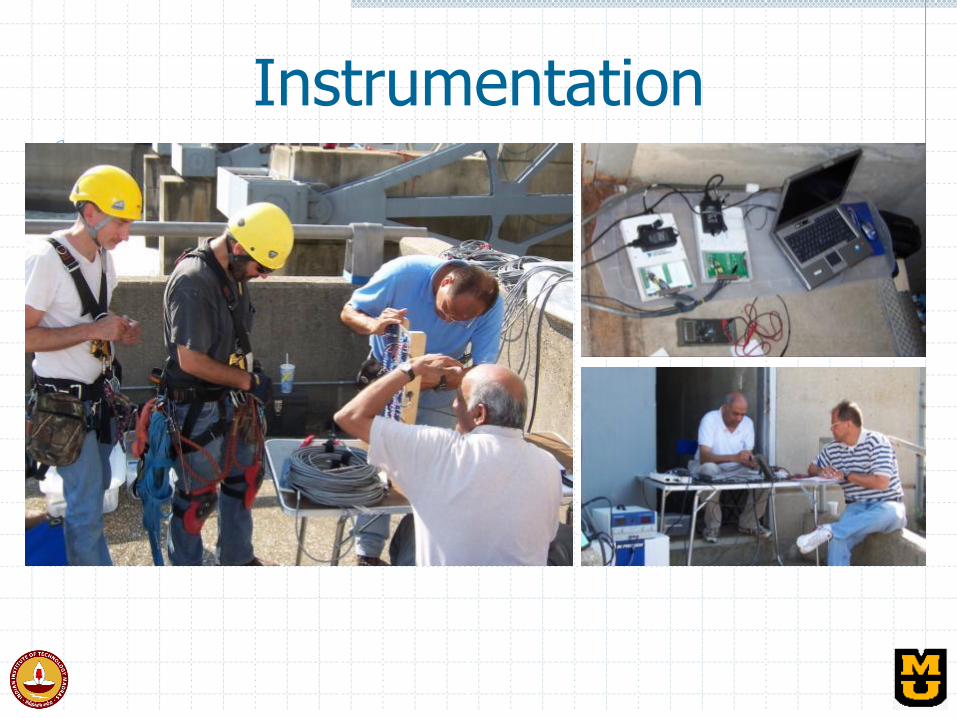
Instrumentation
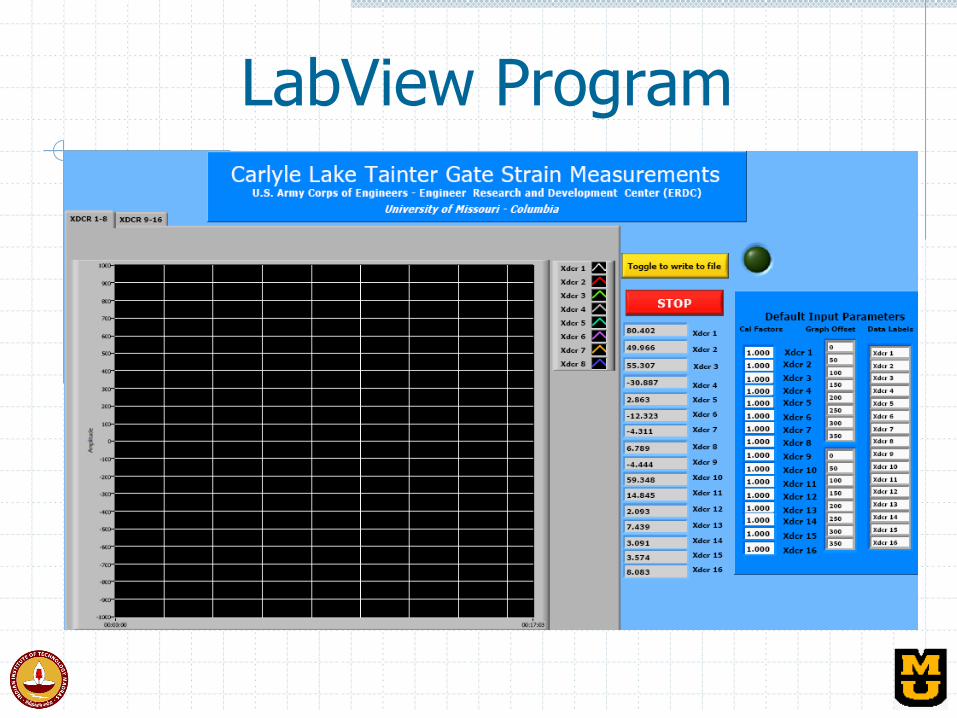
LabView Program
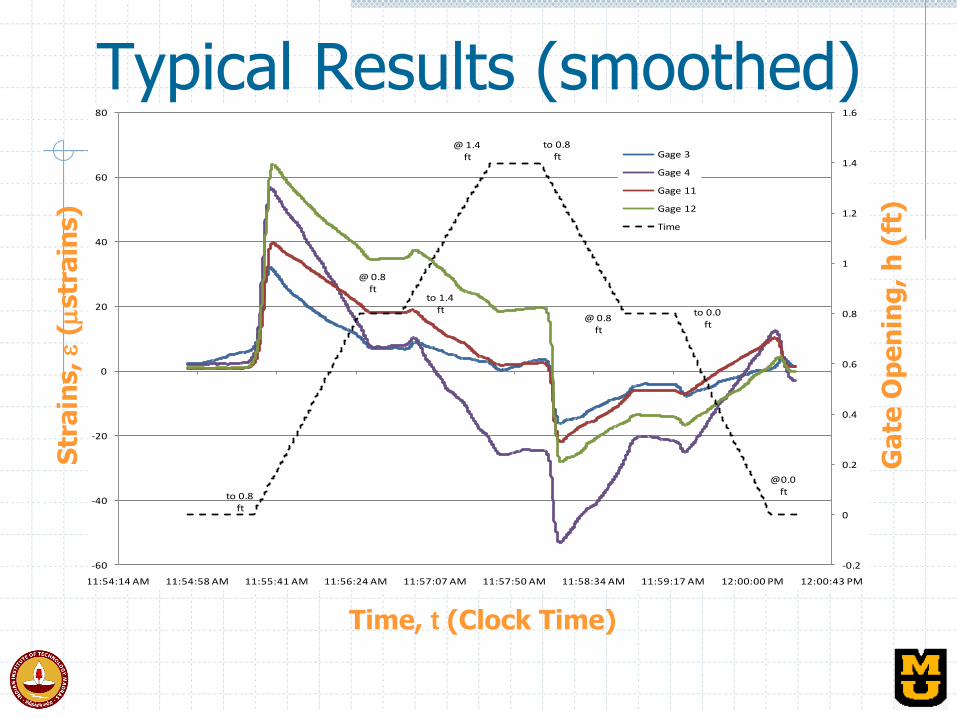
Typical Results (smoothed) S
tra
ins,
(
str
ain
s)
Time, t (Clock Time)
to 0.8ft
@ 0.8ft
to 1.4ft
@ 1.4ft
to 0.8ft
@ 0.8 ft
to 0.0ft
@0.0ft
-0.2
0
0.2
0.4
0.6
0.8
1
1.2
1.4
1.6
-60
-40
-20
0
20
40
60
80
11:54:14 AM 11:54:58 AM 11:55:41 AM 11:56:24 AM 11:57:07 AM 11:57:50 AM 11:58:34 AM 11:59:17 AM 12:00:00 PM 12:00:43 PM
Gage 3
Gage 4
Gage 11
Gage 12
Time
Ga
te O
pe
nin
g,
h (
ft)
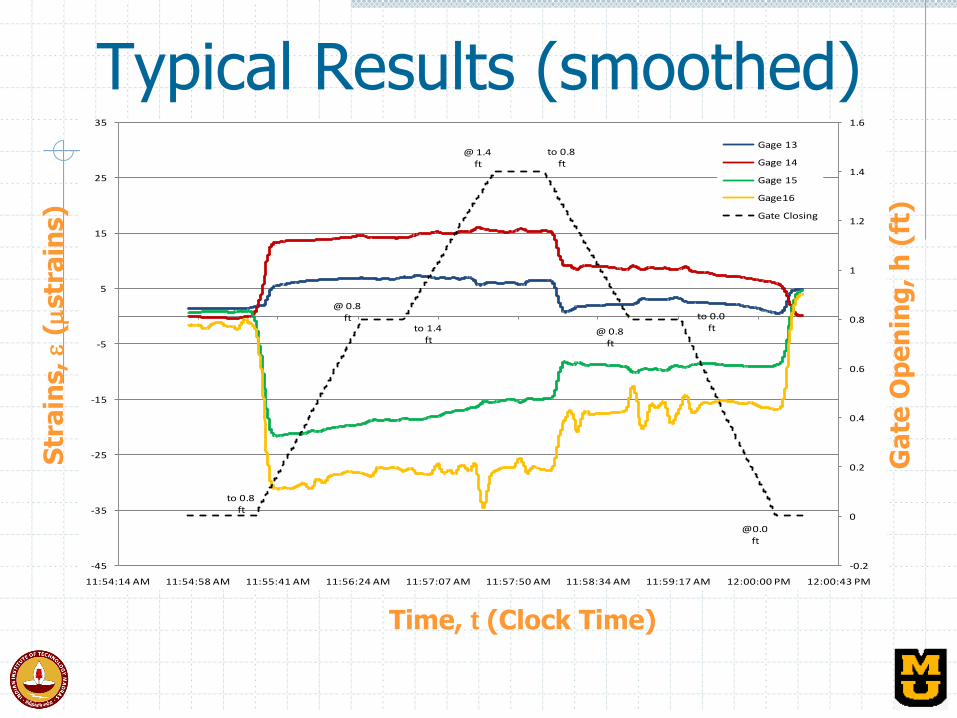
Typical Results (smoothed) S
tra
ins,
(
str
ain
s)
Time, t (Clock Time)
Ga
te O
pe
nin
g,
h (
ft)
to 0.8ft
@ 0.8ft
to 1.4ft
@ 1.4ft
to 0.8ft
@ 0.8 ft
to 0.0ft
@0.0ft
-0.2
0
0.2
0.4
0.6
0.8
1
1.2
1.4
1.6
-45
-35
-25
-15
-5
5
15
25
35
11:54:14 AM 11:54:58 AM 11:55:41 AM 11:56:24 AM 11:57:07 AM 11:57:50 AM 11:58:34 AM 11:59:17 AM 12:00:00 PM 12:00:43 PM
Gage 13
Gage 14
Gage 15
Gage16
Gate Closing
Lessons Learnt Summary Observations (1/2)
• Know signal content – amplitudes, profile histories, and frequency content
• Identify differential and RSE signals • Adequate planning, documentation, calibration
and labeling of channels • Pictures and video with audio commentary • Redundant instrumentation • Power supply and back-up/start-up logistics • Understand ground signals to avoid spurious
loops • Shielding to mitigate electromagnetic noise • Temperature compensation?
Lessons Learnt Summary Observations (2/2)
• Dust protection to secure electronics • Moisture protection – condensate, drains and
desiccants • Fusing to avoid voltage spikes • Grounding for lightning protection • Cooling of electronic circuitry for optimum
performance • Robust graphical visualization software to allow
better data screening and manipulation
Ignorance IS Bliss!?