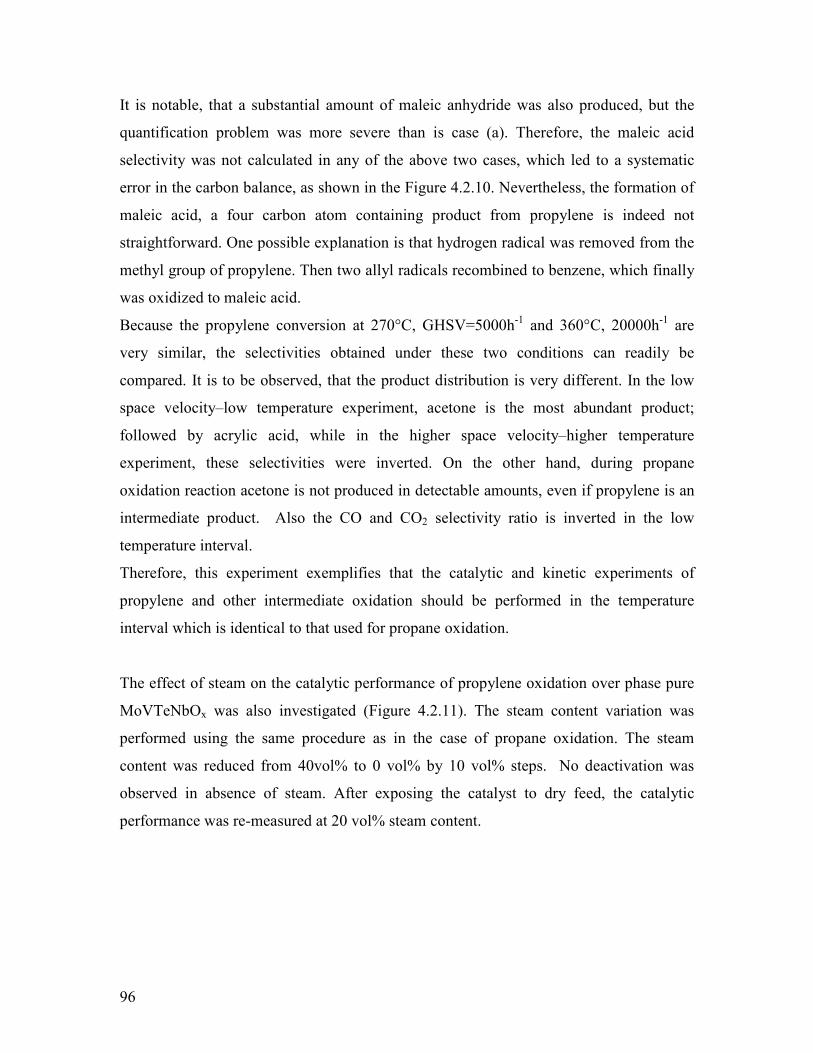
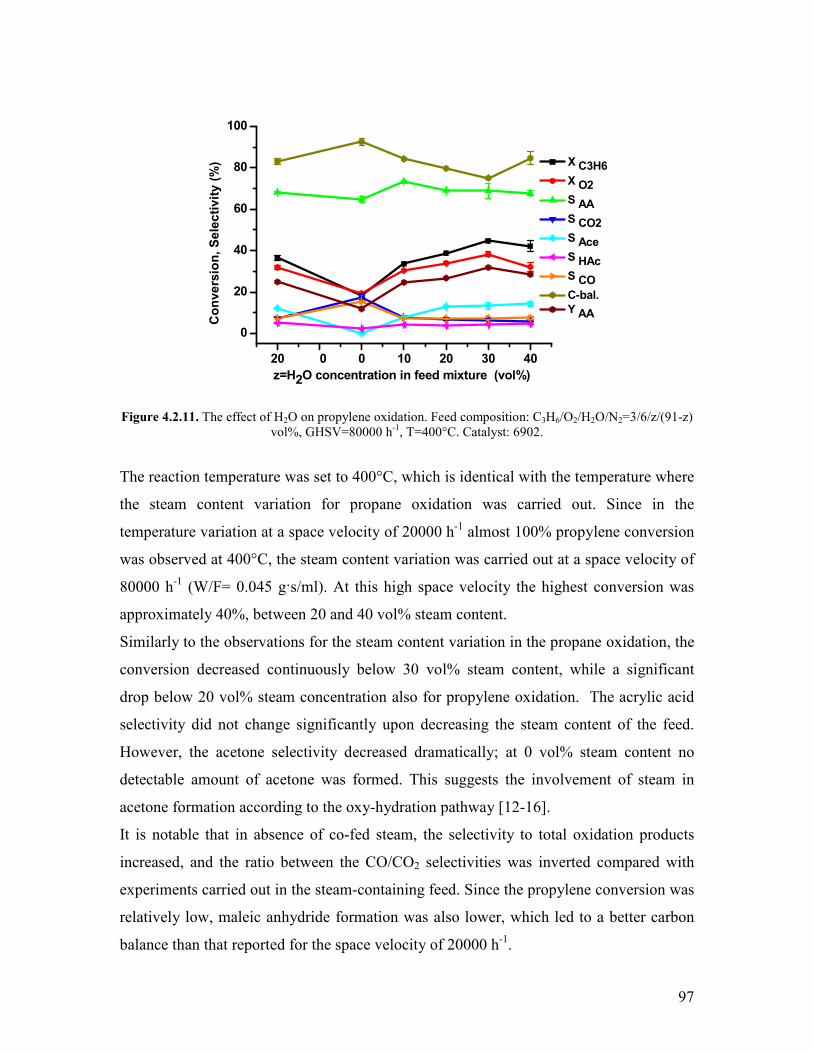
Embed Size (px)
Citation preview
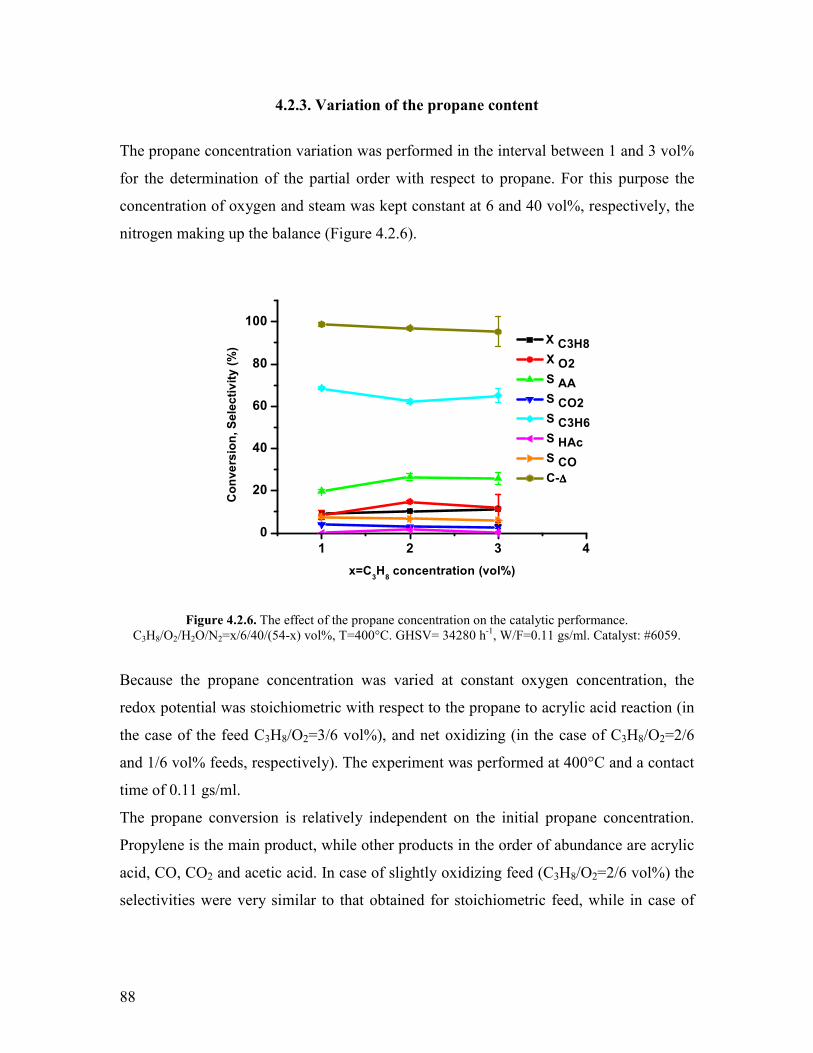
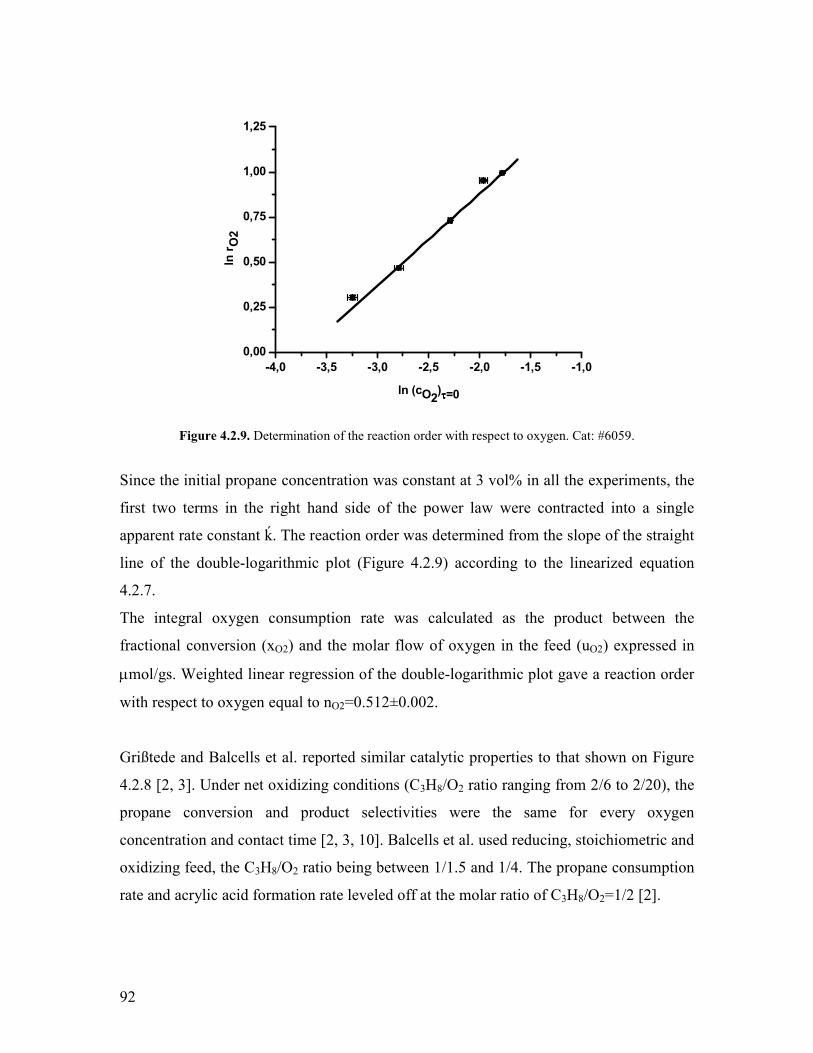
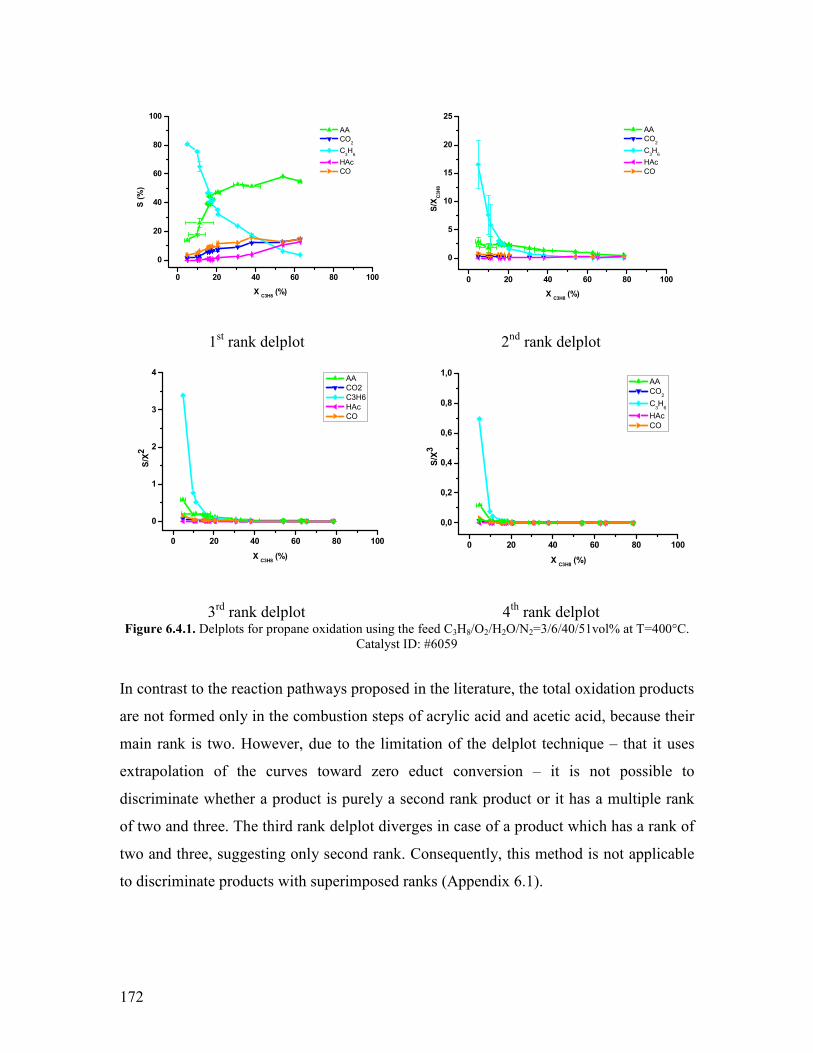
Kinetic studies of propane oxidation on
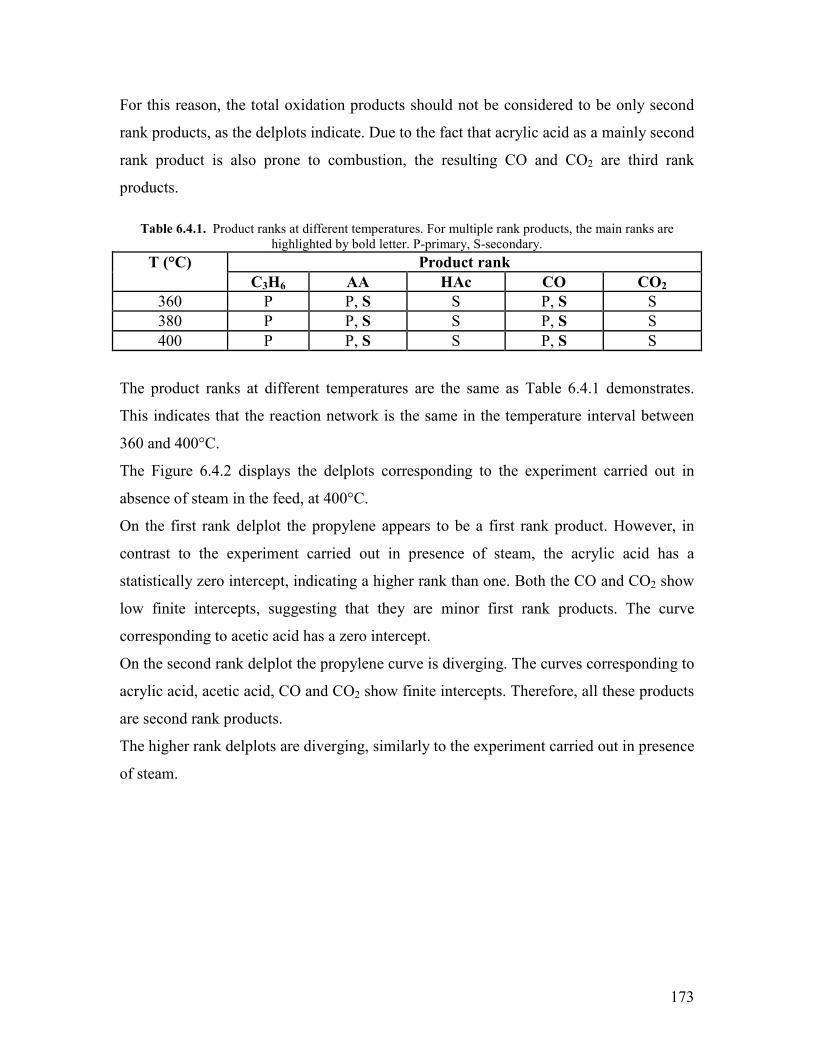
Mo and V based mixed oxide catalysts
vorgelegt von
M Sc Chemiker Leacutenaacuterd-Istvaacuten Csepei
aus ZalauZilahZillenmarkt (Rumaumlnien)
Von der Fakultaumlt II ndash Mathematik und Naturwissenschaften der Technischen Universitaumlt Berlin
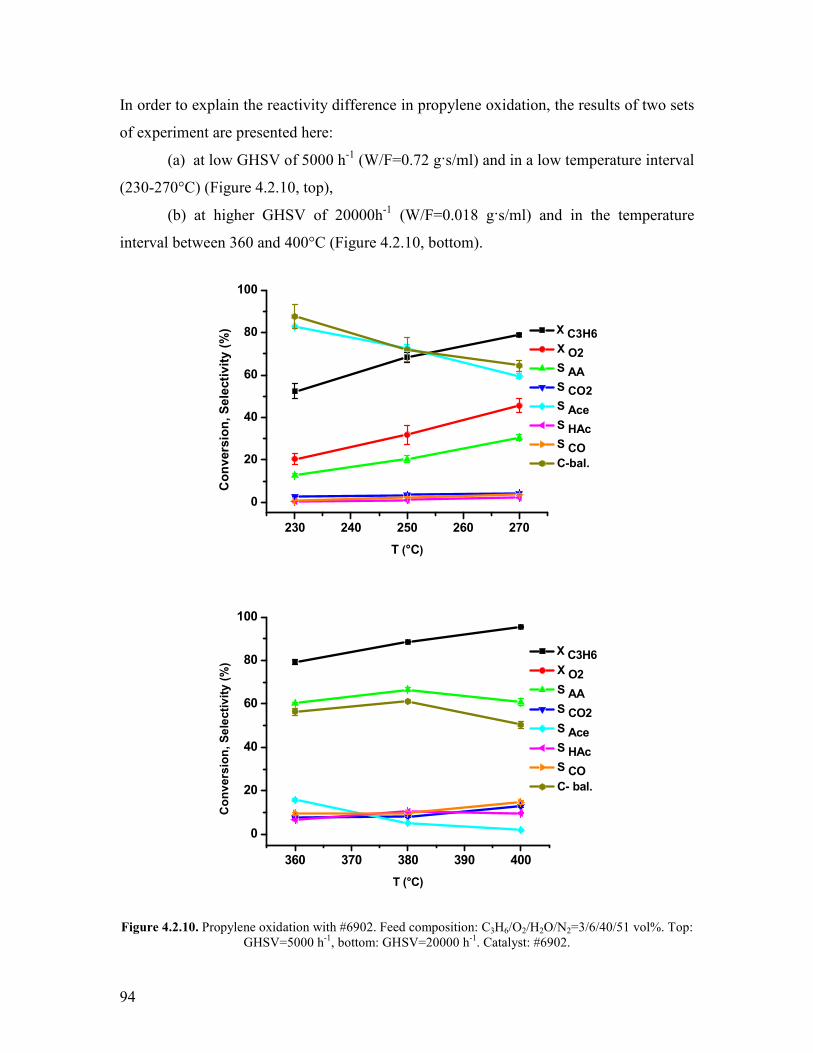
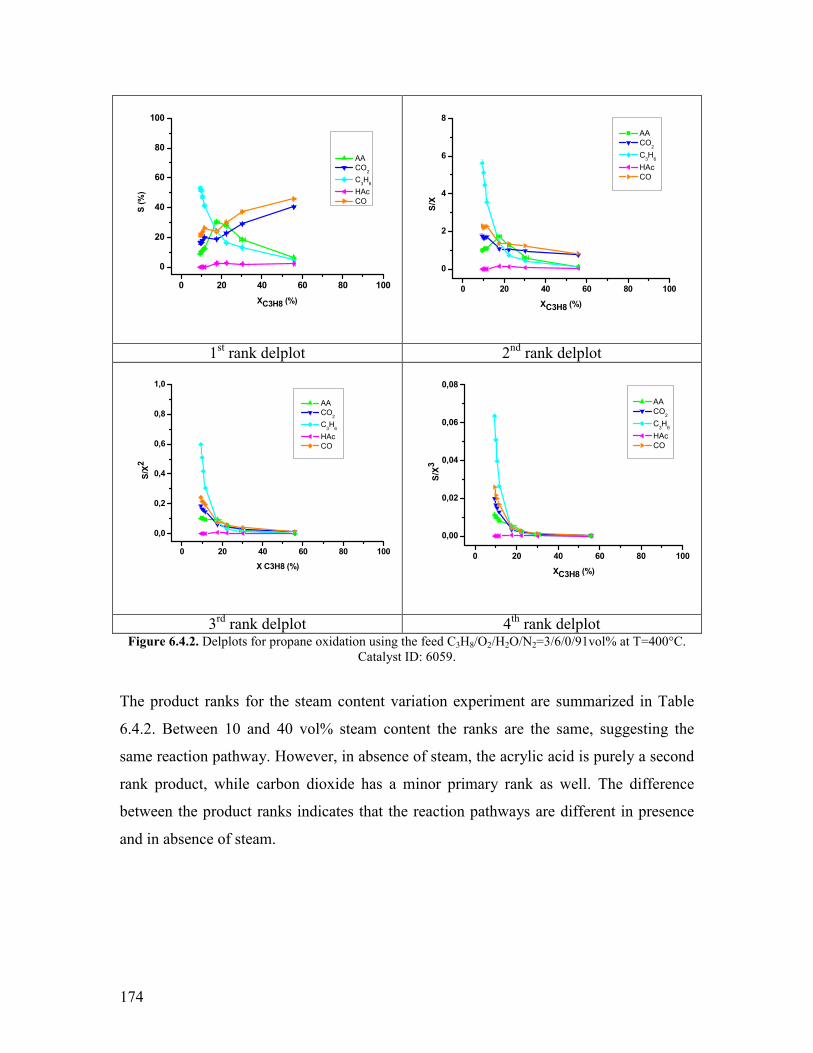
zur Erlangung des akademischen Grades Doktor der Naturwissenschaften
- Dr rer nat -
genehmigte Dissertation
Promotionsausschuss Vorsitzender Prof Dr A Thomas BerichterGutachter Prof Dr R Schomaumlcker BerichterGutachter Prof Dr R Schloumlgl BerichterGutachter Prof Dr M Muhler Tag der wissenschaftliche Aussprache 19 August 2011
Berlin 2011 D 83
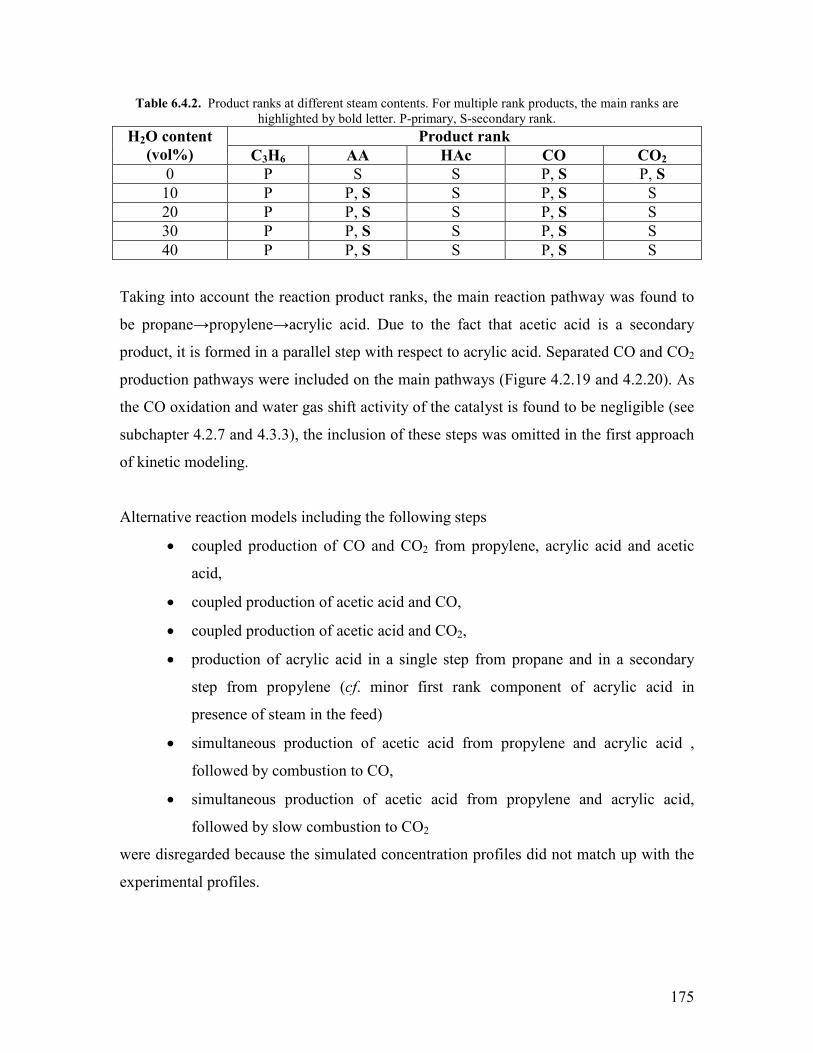
i
AcknowledgementsDanksagung
The work presented in this thesis was carried out in the time interval between February
2007 and June 2011 at the Inorganic Chemistry Department of the Fritz Haber Institute of
the Max Planck Society in Berlin
Foremost I would like to thank to Prof Dr Robert Schloumlgl for giving me the opportunity
to carry out the doctoral studies at this Institute In the same time I would like to express
my gratitude for giving me this interesting topic and the constructive criticism during the
discussions I also would like to thank Dr Annette Trunschke for introducing me in the
topic of the present thesis for the fruitful discussions and new ideas and for contributing
to my professional development
The substantial contributions of the department members to this work are also
acknowledged I thank Yury Kolen`ko Almudena Celaya Sanfiz ZiRong Tang and Olaf
Timpe for catalyst synthesis Gisela Lorenz for the nitrogen physisorption experiments
Gisela Weinberg and Wei Zhang for the SEM-EDX and the STEM measurements Edith
Kitzelmann for the XRD measurements Sabine Wrabetz for the microcalorimetric
experiments Raoul Blume Michael Haumlvecker and Detre Teschner for the XPS
experiments and data analysis Benjamin Frank Kazu Amakawa Peacuteter Schnoumlrch Tom
Cotter Manfred Schuster Anton Nagy and Sylvia Reiche for the helpful discussions
Special thanks are addressed to Siegfried Engelschalt and Raoul Naumann d`Alnoncourt
for their help in setting up the reactor system and to Frank Girgsdies for the in-situ XRD
experiment and data analysis on the effect of steam and the redox potential Finally the
help of all the members of the department and the workshops is acknowledged
Last but not least I would like to express my gratitude to my parents and my former
supervisor Dr Csaba Bolla for encouraging me to undertake the doctoral studies abroad
and for their continuous moral support along these years
ii
To my parents
iii
Eidesstattliche Versicherung Hiermit erklaumlre ich dass ich die Dissertation selbst angefertigt habe Die Arbeit enthaumlltndash auch in Anteilen ndash keine Kopien andere Arbeiten Verwendete Hilfsmittel und Quellen sind vollstaumlndig angegeben Die Namen alle Wissenschaftler die mit mir zusammengearbeiten haben sind in den Anlagen vollstaumlndig genannt
iv
Abstract
The present work concentrates on the systematic kinetic study of the one-step propane
oxidation to acrylic acid over a well defined phase-pure M1 MoVTeNbOx catalyst The
bulk structural stability of the catalyst is a key issue for kinetic studies The stability of
the phase-pure M1 MoVTeNbOx catalyst under various conditions (steam-containing
steam-free net reducing stoichiometric and net oxidizing feed compositions) was
evidenced by an in-situ XRD experiment which suggested that the bulk structure is
homogeneous and constant under reaction conditions Thereby the heterogeneously
catalyzed reactivity is exclusively determined by the surface properties which in turn are
controlled by the chemical potential of the gas phase
A kinetic study on the reaction variables (temperature steam content and redox potential)
was carried out Stable catalytic performance was observed for all the conditions Cycling
experiments showed the reversibility of the conversion and selectivity decrease upon
exposing the catalyst to dry and reducing feed respectively Further catalytic experiments
revealed that the reactivity spans over 5 orders of magnitude in the order of acrolein
oxidationgtgtpropylene oxidationgtpropane oxidationgtgtcarbon monoxide oxidation~water
gas shift reaction The negligible CO oxidation activity suggested that the CO and CO2
are formed via two independent pathways in propane oxidation over M1 The stage-wise
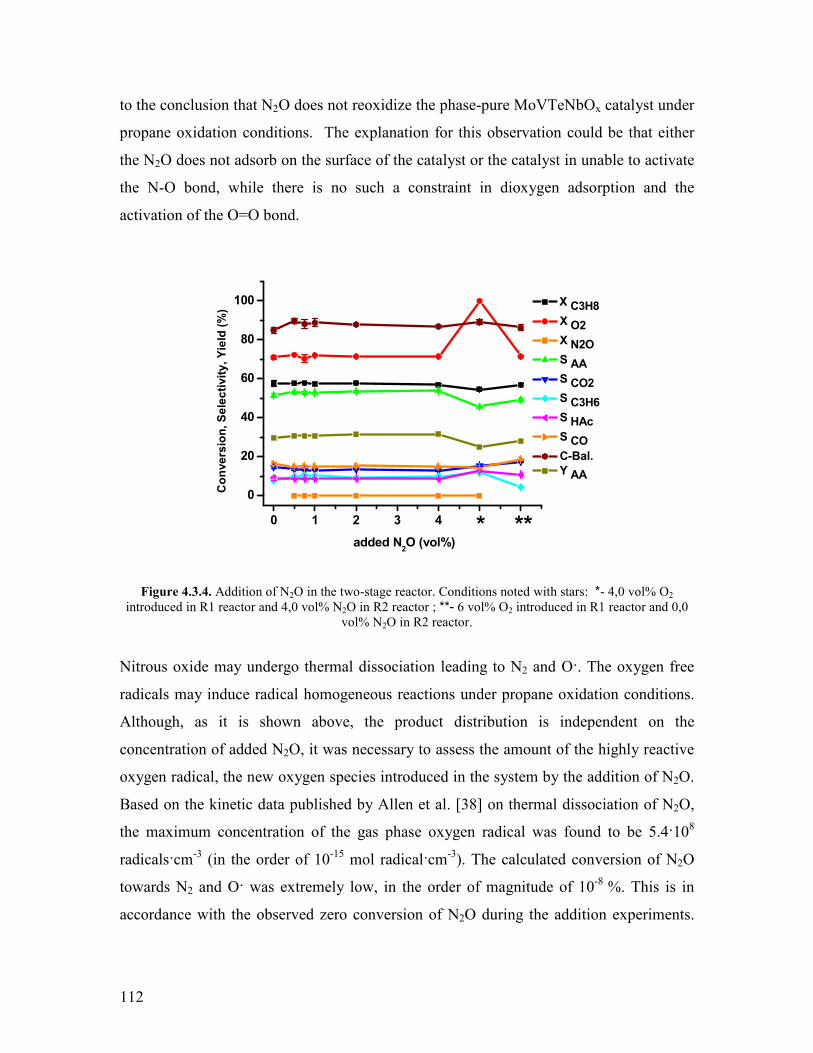
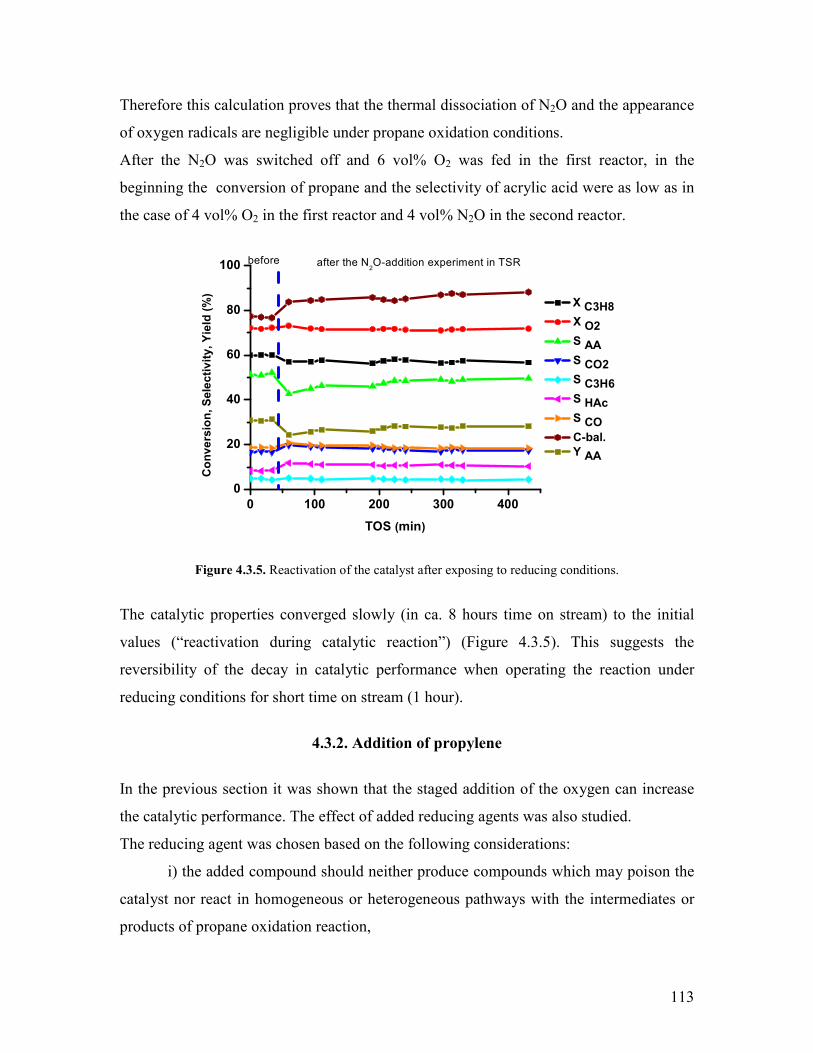
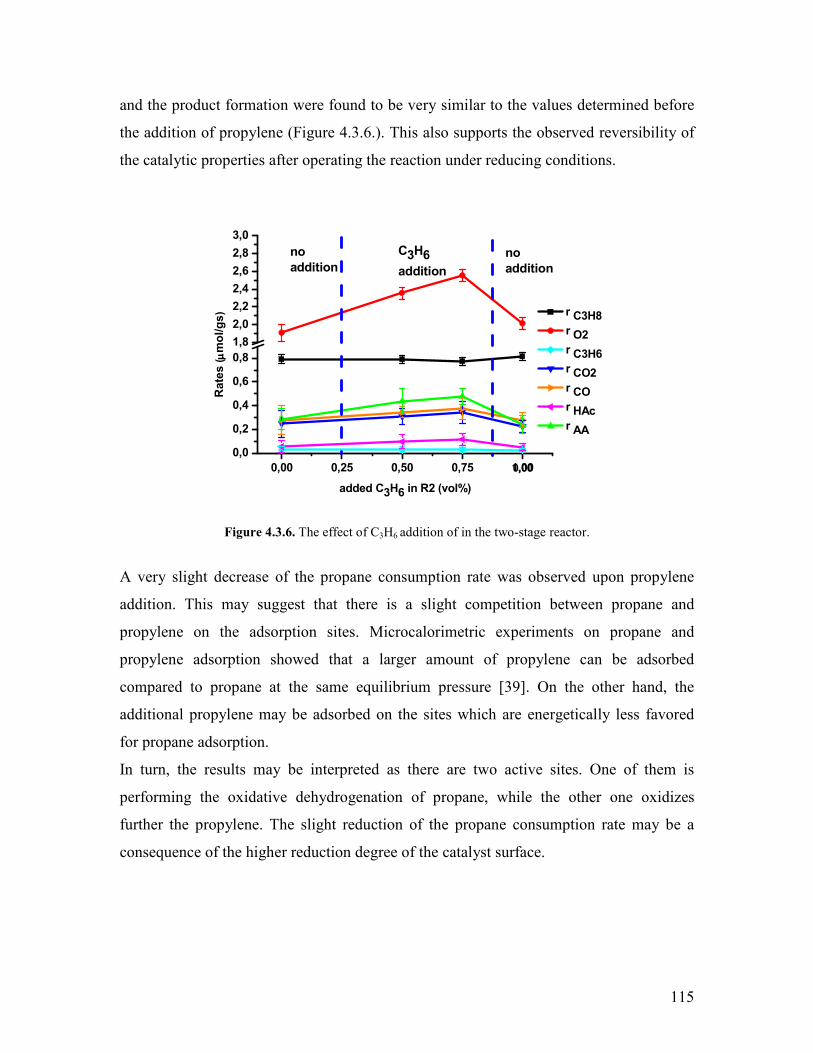
addition of oxygen lead to an improvement of the catalytic performance by 5 compared
to the conventional single-tube reactor Further experiments in the two-stage reactor
revealed that the phase-pure M1 is not reoxidized by N2O The addition of propylene in
the two-stage reactor revealed a slight competitive adsorption on the active sites with
propane which observation was supported by the results of microcalorimetric
experiments On the other hand the addition of CO and CO2 in the two-stage reactor
showed that these products do not adsorb competitively with the educt or intermediates
In the literature much of the kinetic data was reported for ill-defined catalyst surfaces In
contrast to that the present work reports the kinetic study of propane selective oxidation
to acrylic acid on a well defined phase-pure and structurally stable M1 MoVTeNbOx
catalyst This study may contribute to the better kinetic and mechanistic understanding of
the propane selective oxidation reaction
v
Zusammenfassung
Die vorliegende Arbeit enthaumllt systematische kinetische Untersuchungen zur einstufigen
selektiven Oxidation von Propan zu Acrylsaumlure an wohl definierten phasenreinen M1-
MoVTeNbOx-Katalysatoren Die Stabilitaumlt der phasenreinen M1-Katalysatoren unter
verschiedenen Reaktionsbedingungen (in Wasserdampf wasserdampffrei netto-
reduzierende stoumlchiometrische und netto-oxidierende Feed-Zusammensetzung) konnte in
In-situ-XRD-Experimenten bewiesen werden Da die Festkoumlrperstruktur homogen ist und
bestaumlndig unter Reaktionsbedingungen kann die unterschiedliche Reaktivitaumlt des
heterogenen Katalysators allein durch seine Oberflaumlcheneigenschaften bestimmt werden
welche wiederum stark vom chemischen Potential der Gasphase abhaumlngen
Es wurden kinetische Studien zu den Reaktionsparametern Temperatur Wasserdampf-
anteil und Redoxpotential durchgefuumlhrt wobei die Systeme unter allen Bedingungen
stabile Katalysatorleistungen aufwiesen Zyklische Experimente zeigten die Reversibilitaumlt
des Umsatz- und Selektivitaumltsruumlckgangs sowohl unter wasserfreiem als auch
reduzierendem Feed Zudem konnten in den Katalysetests Unterschiede in den
Reaktivitaumlten von bis zu 5 Groumlszligenordnungen ermittelt werden mit Acrolein gtgt Propylen
gt Propan gtgt CO-Oxidation~Wassergas-Shift Die bestimmte Oxidationsaktivitaumlt von CO
war vernachlaumlssigbar klein was die Bildung von CO und CO2 auf zwei voneinander
unabhaumlngigen Reaktionspfaden suggeriert Uumlber eine stufenweise Zufuhr von Sauerstoff
konnte eine Steigerung der katalytischen Aktivitaumlt um 5 im Vergleich zum
konventionellen einstufigen Reaktor erreicht werden Die Versuche im zweistufigen
Reaktor zeigten auch dass der phasenreine M1-Katalysator in N2O nicht reoxidiert
Weiterhin konnte unter Zugabe von Propylen im zweistufigen Reaktor eine teilweise
kompetitive Adsorption zu Propan an die aktiven Zentren des Katalysators beobachtet
werden Im Gegensatz dazu stand die Adsorption von CO und CO2 nicht in Konkurrenz
mit der Adsorption von Edukten oder Zwischenprodukten
Die kinetischen Untersuchungen der im Gegensatz zu den meisten Systemen in der
Literatur wohl definierten strukturstabilen M1-MoVTeNbOx-Katalysatoren koumlnnten
einen entscheidenden Beitrag zum Verstaumlndnis von Kinetik und Reaktionsmechanismus
der Propanoxidation leisten
vi
Table of contents
AcknowledgementsDanksagung helliphelliphelliphelliphelliphelliphelliphelliphelliphelliphelliphelliphelliphelliphelliphelliphelliphellipi Eidesstattliche Versicherunghelliphelliphelliphelliphelliphelliphelliphelliphelliphelliphelliphelliphelliphelliphelliphelliphelliphelliphelliphelliphelliphellipiii Abstract helliphelliphelliphelliphelliphelliphelliphelliphelliphelliphelliphelliphelliphelliphelliphelliphelliphelliphelliphelliphelliphelliphelliphelliphelliphelliphelliphelliphelliphellipiv
Zusammenfassung helliphelliphelliphelliphelliphelliphelliphelliphelliphelliphelliphelliphelliphelliphelliphelliphelliphelliphelliphelliphelliphelliphelliphelliphelliphellipv
Table of contents helliphelliphelliphelliphelliphelliphelliphelliphelliphelliphelliphelliphelliphelliphelliphelliphelliphelliphelliphelliphelliphelliphelliphelliphelliphelliphellipvi
Chapter 1 Introduction and motivation helliphelliphelliphelliphelliphelliphelliphelliphelliphelliphelliphelliphelliphelliphelliphelliphellip1 11 Introduction helliphelliphelliphelliphelliphelliphelliphelliphelliphelliphelliphelliphelliphelliphelliphelliphelliphelliphelliphelliphelliphelliphelliphelliphelliphelliphellip1 12 Overview on the literature results helliphelliphelliphelliphelliphelliphelliphelliphelliphelliphelliphelliphelliphelliphelliphelliphelliphellip3
121 The selective oxidation of propylene helliphelliphelliphelliphelliphelliphelliphelliphelliphelliphelliphelliphellip3 122 Oxidative dehydrogenation of propane helliphelliphelliphelliphelliphelliphelliphelliphelliphelliphelliphelliphellip8 123 The direct oxidation of propane to acrylic acid helliphelliphelliphelliphelliphelliphelliphelliphelliphellip13 1231 Generalities helliphelliphelliphelliphelliphelliphelliphelliphelliphelliphelliphelliphelliphelliphelliphelliphelliphelliphelliphellip13
1232 Identification of propane selective oxidation pathways helliphelliphellip14 1233 Active sites on MoVTeNbOx catalysts helliphelliphelliphelliphelliphelliphelliphellip20 1234 The effect of acid-base character of the catalyst helliphelliphelliphellip hellip24 1235 The effect of steam helliphelliphelliphelliphelliphelliphelliphelliphelliphelliphelliphelliphelliphelliphelliphellip25 1236 The effect of redox potential of gas phase and oxygen specieshellip27
124 Reactor designs operation modes helliphelliphelliphelliphelliphelliphelliphelliphelliphelliphelliphelliphelliphelliphellip31 1241 Conventional laboratory scale reactors helliphelliphelliphelliphelliphelliphelliphelliphelliphellip31 1242 Catalytic membrane- and multi-stage reactor designs helliphelliphelliphellip33
125 Reaction kinetics helliphelliphelliphelliphelliphelliphelliphelliphelliphelliphelliphelliphelliphelliphelliphelliphelliphelliphelliphelliphelliphellip37 13 Motivation helliphelliphelliphelliphelliphelliphelliphelliphelliphelliphelliphelliphelliphelliphelliphelliphelliphelliphelliphelliphelliphelliphelliphelliphelliphelliphelliphellip38 References Chapter 1 helliphelliphelliphelliphelliphelliphelliphelliphelliphelliphelliphelliphelliphelliphelliphelliphelliphelliphelliphelliphelliphelliphelliphelliphelliphellip40
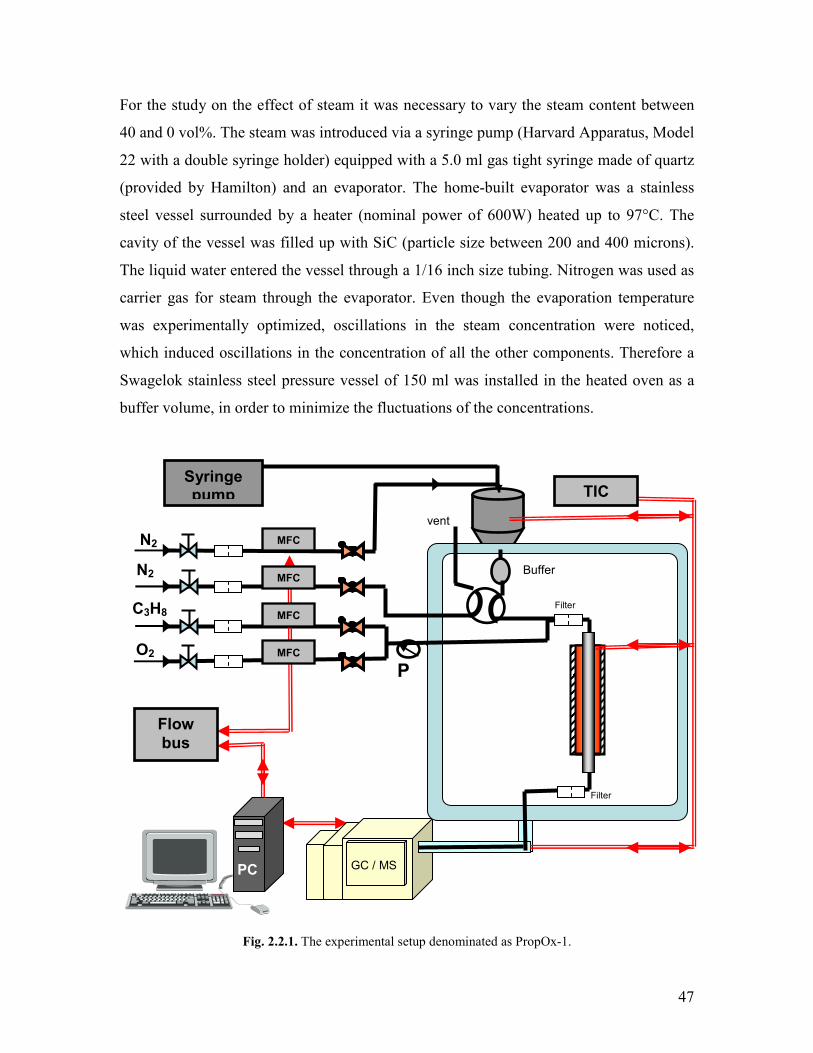
Chapter 2 Experimental methods helliphelliphelliphelliphelliphelliphelliphelliphelliphelliphelliphelliphelliphelliphelliphelliphelliphelliphelliphellip44 21 Physico-chemical characterization of the catalysts helliphelliphelliphelliphelliphelliphelliphelliphelliphelliphelliphelliphellip44
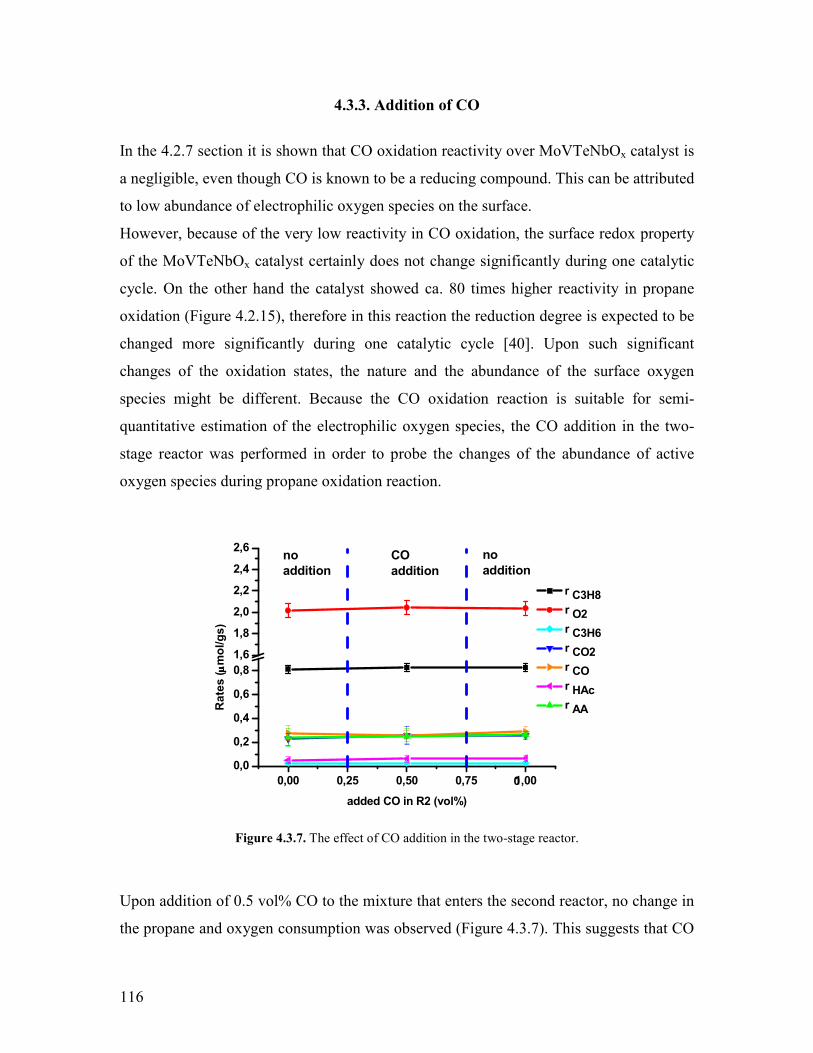
211 Nitrogen physisorption helliphelliphelliphelliphelliphelliphelliphelliphelliphelliphelliphelliphelliphelliphelliphelliphelliphelliphelliphellip44 212 X-Ray Diffraction helliphelliphelliphelliphelliphelliphelliphelliphelliphelliphelliphelliphelliphelliphelliphelliphelliphelliphelliphelliphellip44 213 Scanning Electron Microscopy (SEMEDX) and Scanning Transmission Electron Microscopy (STEM) helliphelliphelliphelliphelliphelliphelliphelliphelliphelliphelliphelliphelliphellip45 214 X-Ray Photoelectron Spectroscopy (XPS) helliphelliphelliphelliphelliphelliphelliphelliphelliphelliphelliphellip45 215 Microcalorimetry helliphelliphelliphelliphelliphelliphelliphelliphelliphelliphelliphelliphelliphelliphelliphelliphelliphelliphelliphelliphelliphellip45
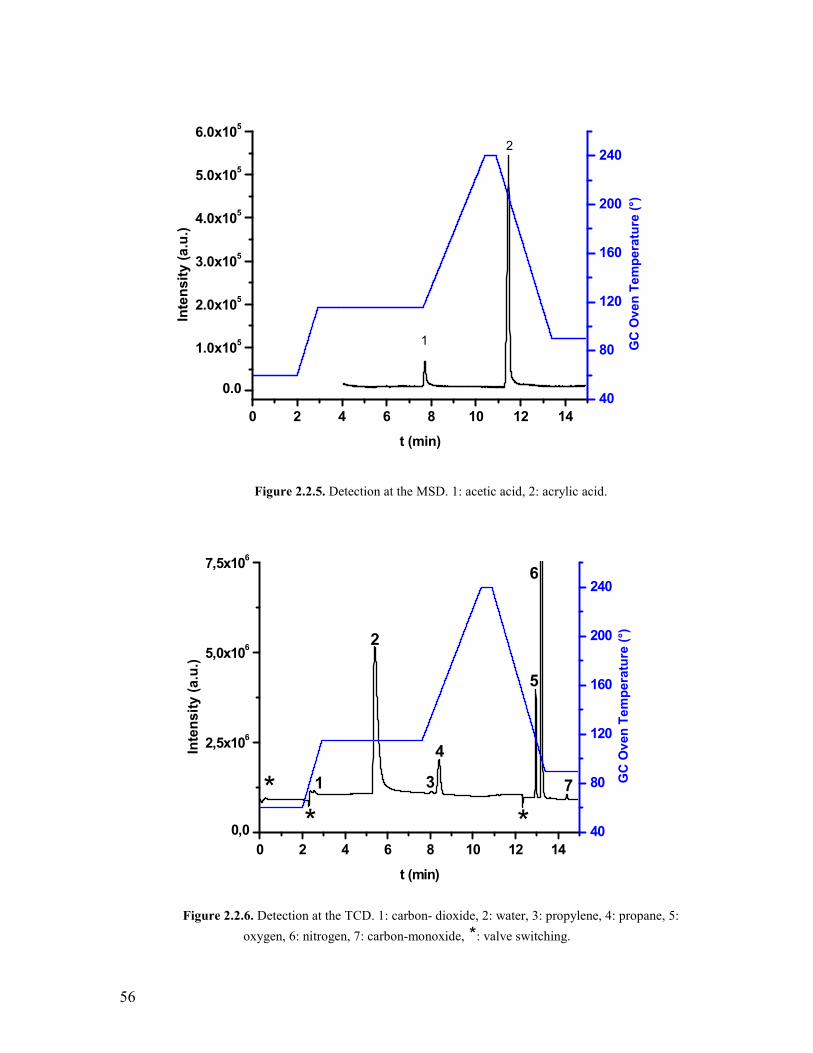
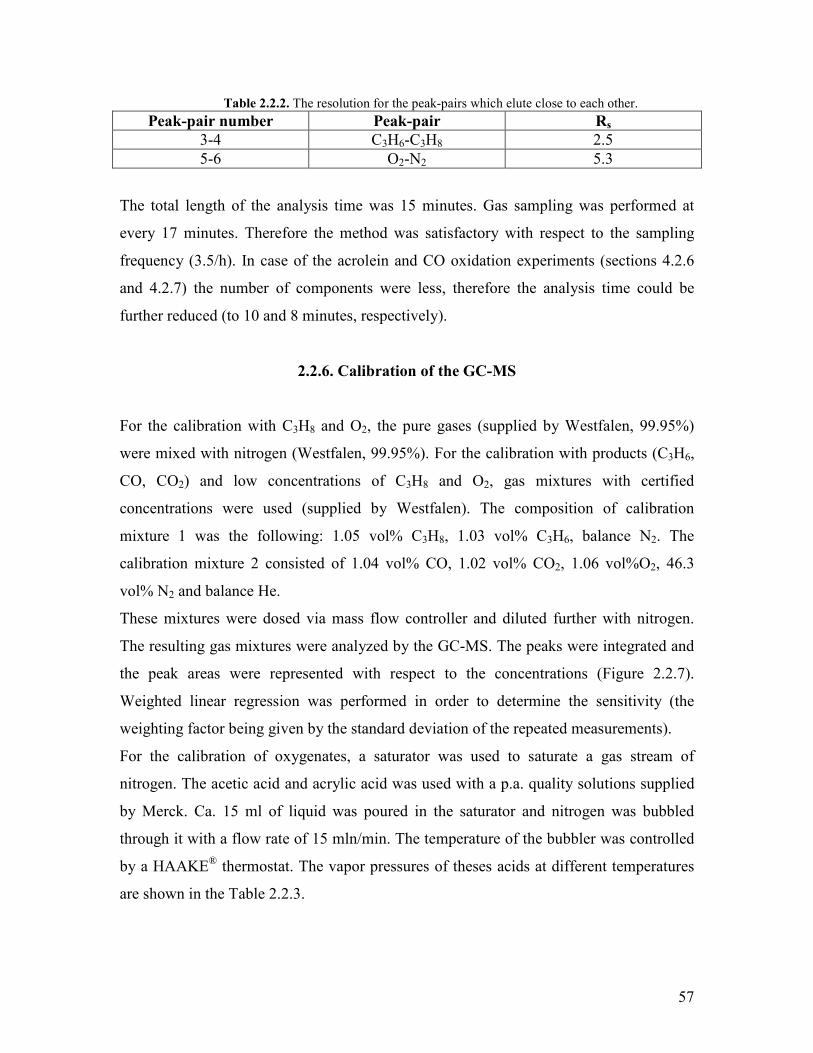
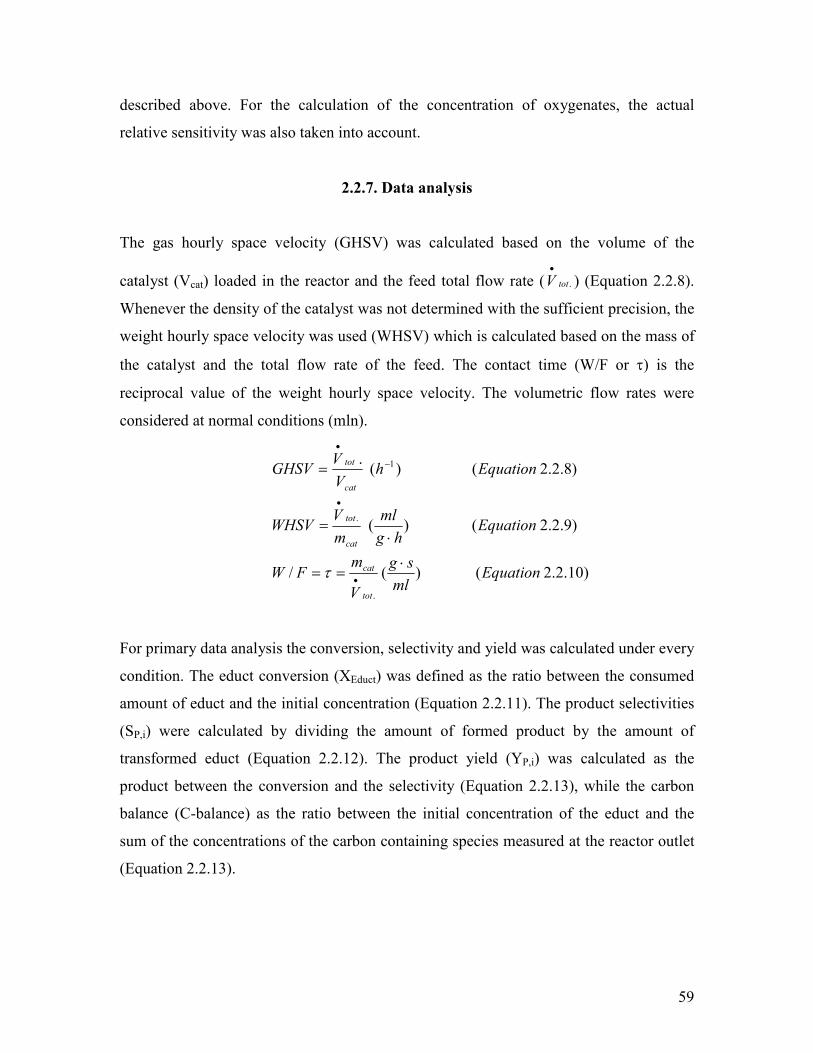
22 The experimental setup for propane oxidation helliphelliphelliphelliphelliphelliphelliphelliphelliphelliphelliphelliphelliphellip46 221 The gas dosing system helliphelliphelliphelliphelliphelliphelliphelliphelliphelliphelliphelliphelliphelliphelliphelliphelliphelliphelliphellip46 222 Reactor tube characteristics helliphelliphelliphelliphelliphelliphelliphelliphelliphelliphelliphelliphelliphelliphelliphelliphelliphellip48 223 Estimation of the Weisz-number the Thiele modulus and the effectiveness factor helliphelliphelliphelliphelliphelliphelliphelliphelliphelliphelliphelliphelliphelliphelliphelliphelliphelliphelliphelliphelliphelliphellip51 224 The two stage reactor system helliphelliphelliphelliphelliphelliphelliphelliphelliphelliphelliphelliphelliphelliphelliphelliphellip52 225 The analytical system helliphelliphelliphelliphelliphelliphelliphelliphelliphelliphelliphelliphelliphelliphelliphelliphelliphelliphelliphellip55 226 Calibration of the GC-MS helliphelliphelliphelliphelliphelliphelliphelliphelliphelliphelliphelliphelliphelliphelliphelliphelliphellip57 227 Data analysis helliphelliphelliphelliphelliphelliphelliphelliphelliphelliphelliphelliphelliphelliphelliphelliphelliphelliphelliphelliphelliphellip59
23 Catalyst synthesis and characterization helliphelliphelliphelliphelliphelliphelliphelliphelliphelliphelliphelliphelliphelliphelliphelliphellip61
vii
231 The synthesis of phase pure M1 MoVTeNbOx catalyst helliphelliphelliphelliphelliphelliphellip61 References Chapter 2 helliphelliphelliphelliphelliphelliphelliphelliphelliphelliphelliphelliphelliphelliphelliphelliphelliphelliphelliphelliphelliphelliphelliphelliphelliphellip63
Chapter 3 Structural stability of the M1 MoVTeNbOx catalyst under
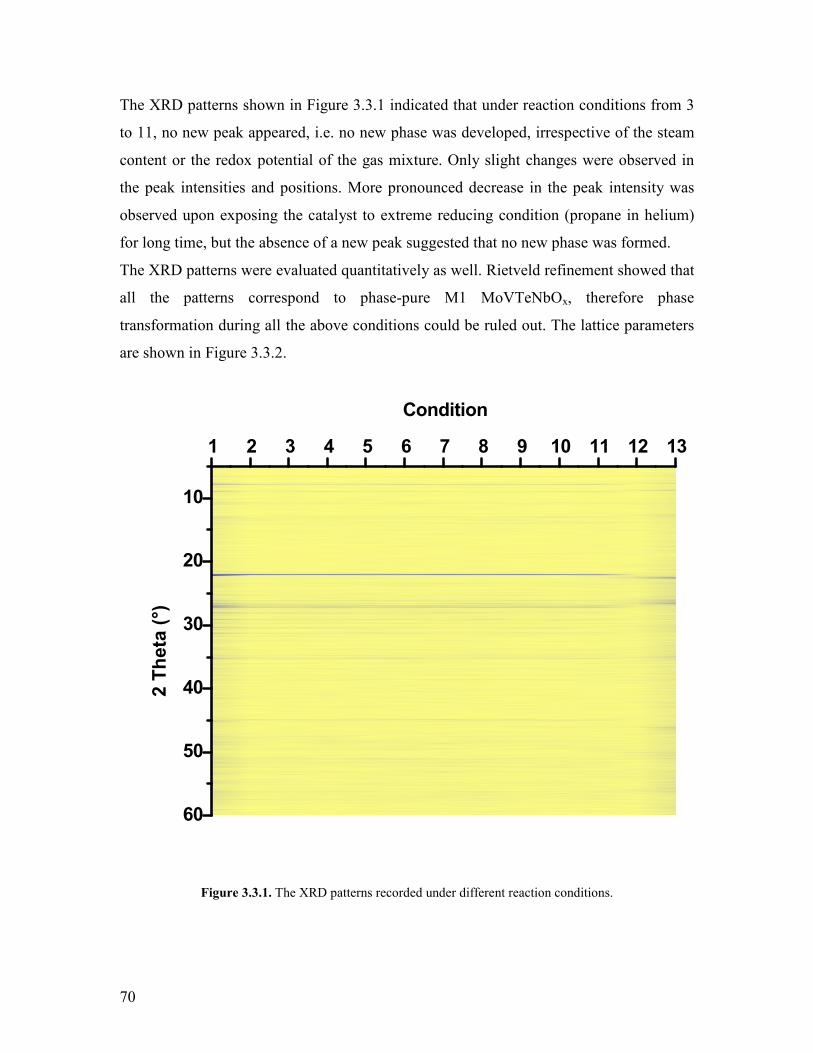
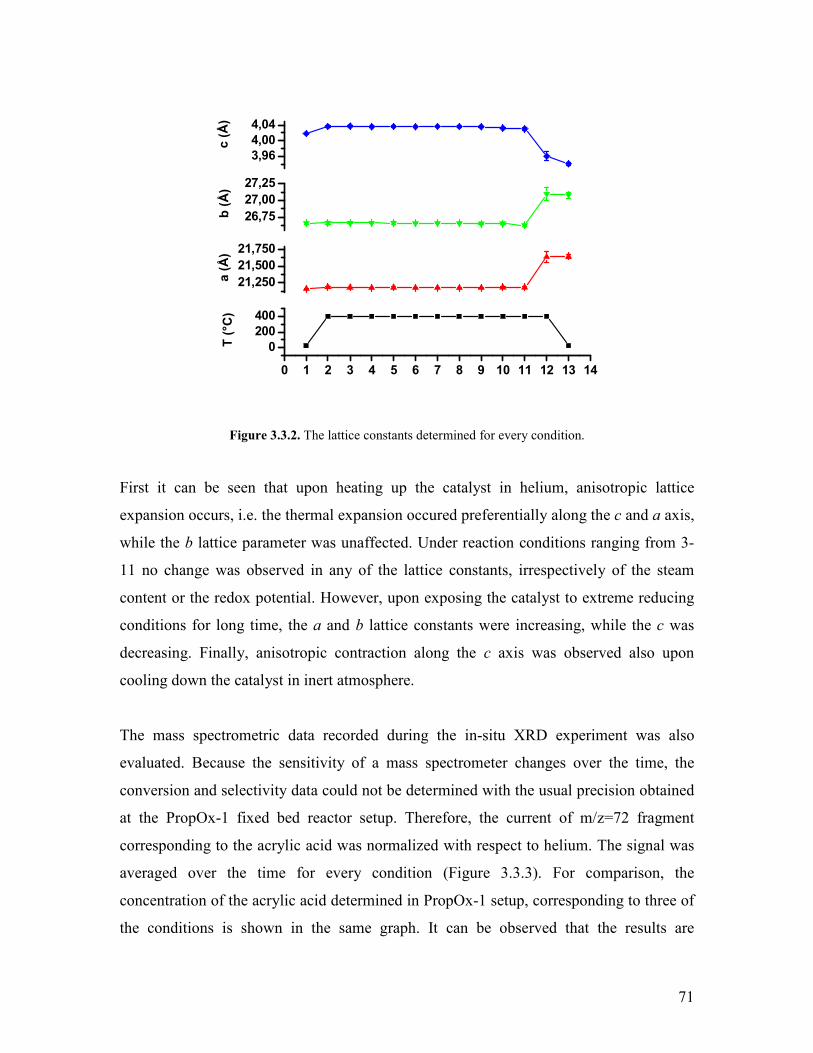
propane oxidation conditions helliphelliphelliphelliphelliphelliphelliphelliphelliphelliphelliphelliphelliphelliphelliphelliphelliphelliphelliphelliphelliphellip65
31 Abstract helliphelliphelliphelliphelliphelliphelliphelliphelliphelliphelliphelliphelliphelliphelliphelliphelliphelliphelliphelliphelliphelliphelliphelliphelliphelliphelliphelliphellip65 32 Introduction helliphelliphelliphelliphelliphelliphelliphelliphelliphelliphelliphelliphelliphelliphelliphelliphelliphelliphelliphelliphelliphelliphelliphelliphelliphelliphelliphellip65 33 In-situ XRD study on the effect of steam and oxygenhelliphelliphelliphelliphelliphelliphelliphelliphelliphelliphellip68 34 STEM analysis of the catalyst before and after the in-situ XRD experiment helliphelliphellip72 35 Conclusions helliphelliphelliphelliphelliphelliphelliphelliphelliphelliphelliphelliphelliphelliphelliphelliphelliphelliphelliphelliphelliphelliphelliphelliphelliphelliphelliphellip75 References Chapter 3 helliphelliphelliphelliphelliphelliphelliphelliphelliphelliphelliphelliphelliphelliphelliphelliphelliphelliphelliphelliphelliphelliphelliphelliphelliphellip76
4 Kinetic studies of propane oxidation to acrylic acid on a phase-pure
MoVTeNbOx catalyst helliphelliphelliphelliphelliphelliphelliphelliphelliphelliphelliphelliphelliphelliphelliphelliphelliphelliphelliphelliphelliphelliphelliphelliphellip77
41 Abstract helliphelliphelliphelliphelliphelliphelliphelliphelliphelliphelliphelliphelliphelliphelliphelliphelliphelliphelliphelliphelliphelliphelliphelliphelliphelliphelliphelliphellip77 42 Kinetic studies on phase-pure M1 MoVTeNbOx helliphelliphelliphelliphelliphelliphelliphelliphelliphelliphelliphelliphellip77
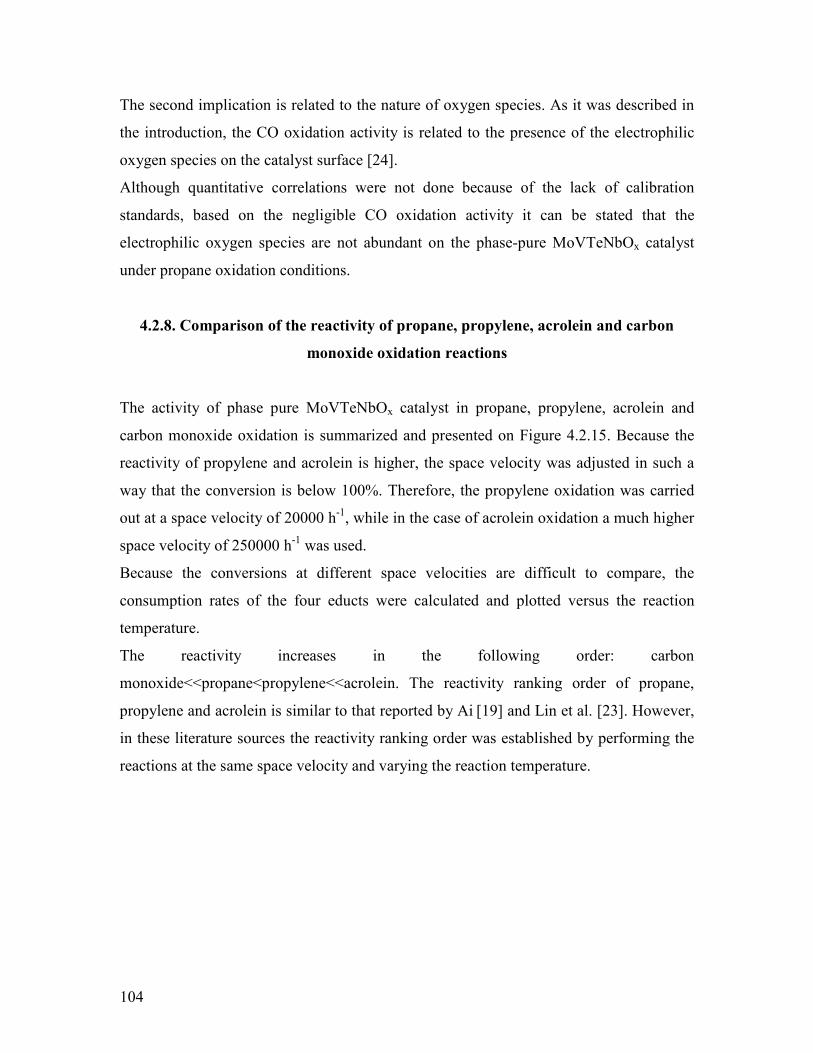
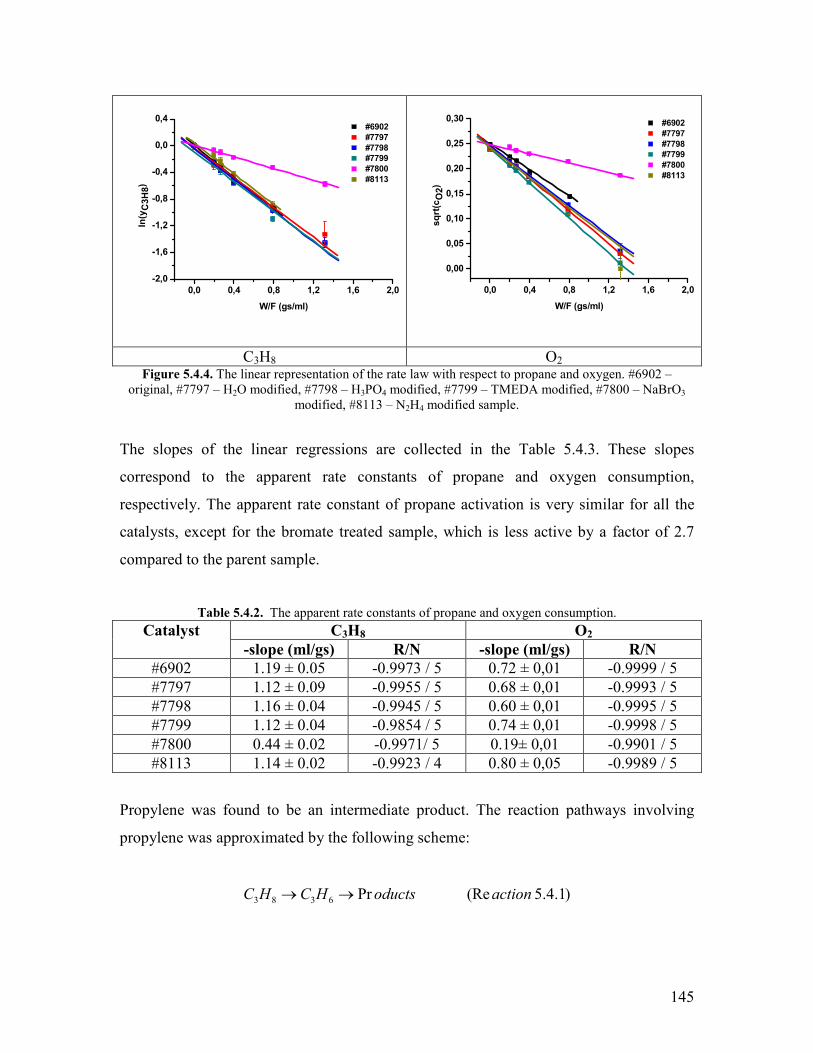
421 Variation of the contact time and temperature helliphelliphelliphelliphelliphelliphelliphelliphelliphelliphellip78 422 Variation of the steam content helliphelliphelliphelliphelliphelliphelliphelliphelliphelliphelliphelliphelliphelliphelliphelliphellip81 423 Variation of the propane content helliphelliphelliphelliphelliphelliphelliphelliphelliphelliphelliphelliphelliphelliphellip88 424 Variation of the oxygen content helliphelliphelliphelliphelliphelliphelliphelliphelliphelliphelliphelliphelliphelliphelliphellip90 425 Propylene oxidation helliphelliphelliphelliphelliphelliphelliphelliphelliphelliphelliphelliphelliphelliphelliphelliphelliphelliphelliphelliphellip93 426 Acrolein oxidation helliphelliphelliphelliphelliphelliphelliphelliphelliphelliphelliphelliphelliphelliphelliphelliphelliphelliphelliphelliphellip98 427 CO oxidation and water gas shift reaction helliphelliphelliphelliphelliphelliphelliphelliphelliphelliphelliphellip100 428 Comparison of the reactivity of propane propylene acrolein and carbon monoxide oxidation reactions helliphelliphelliphelliphelliphelliphelliphelliphelliphelliphelliphelliphelliphelliphelliphellip104
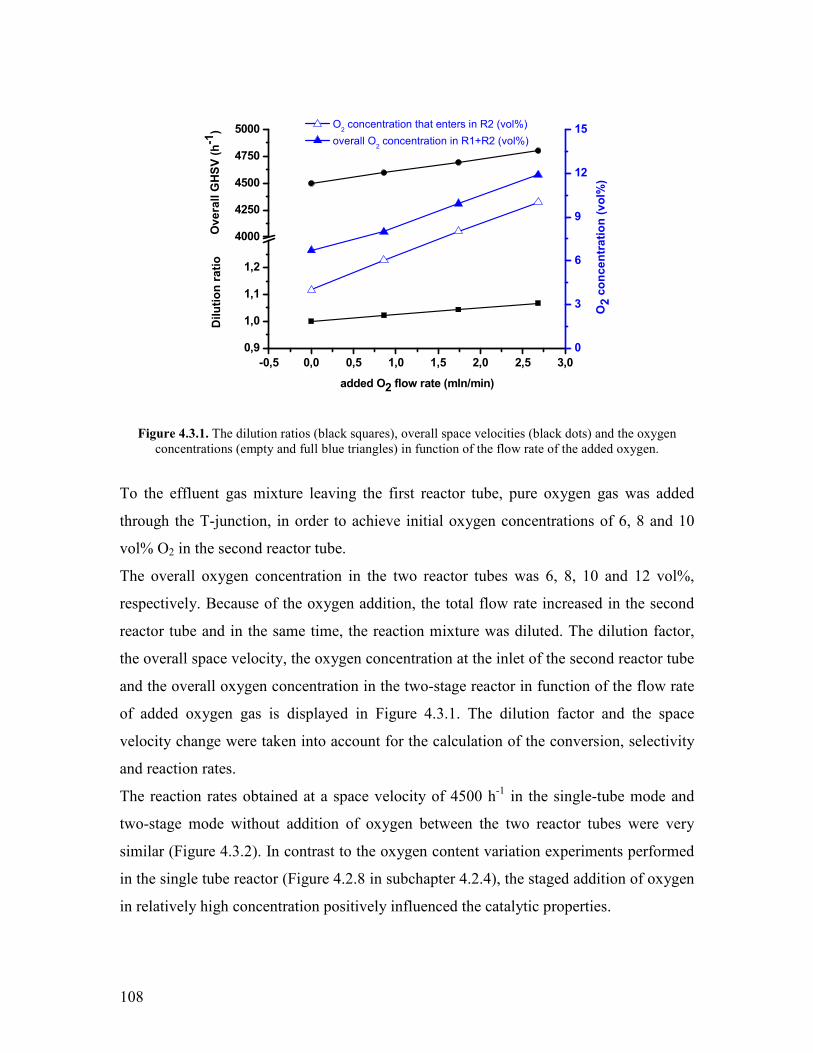
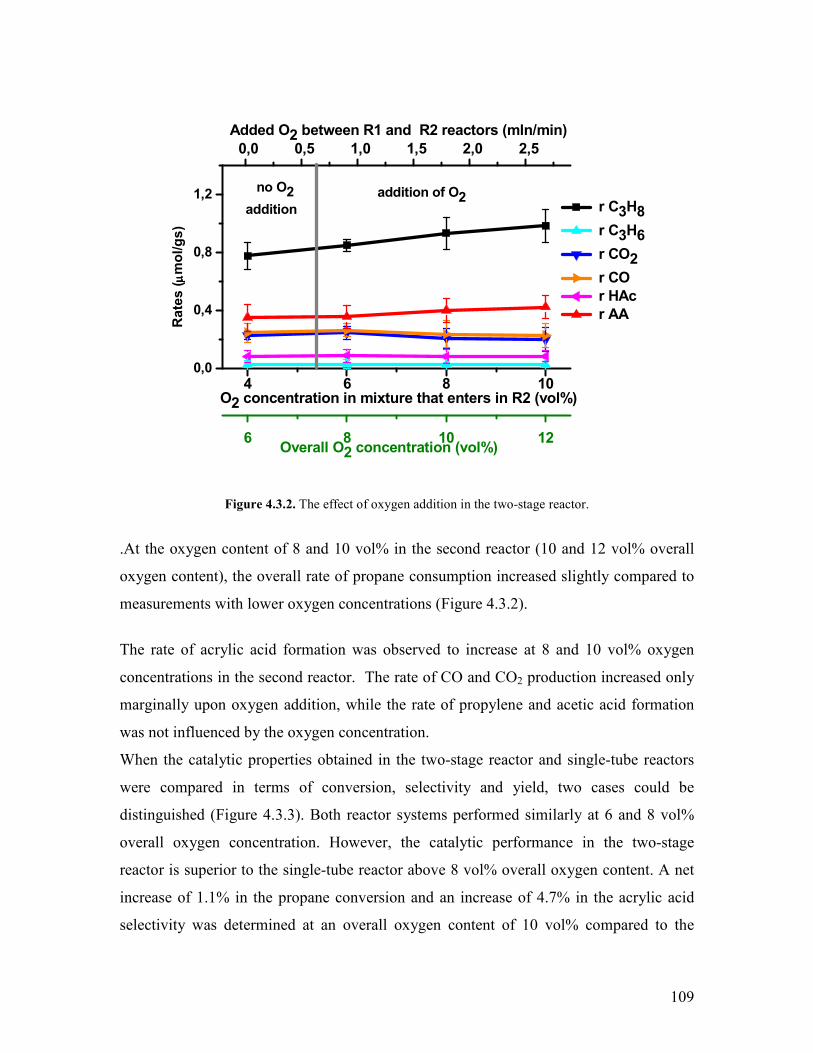
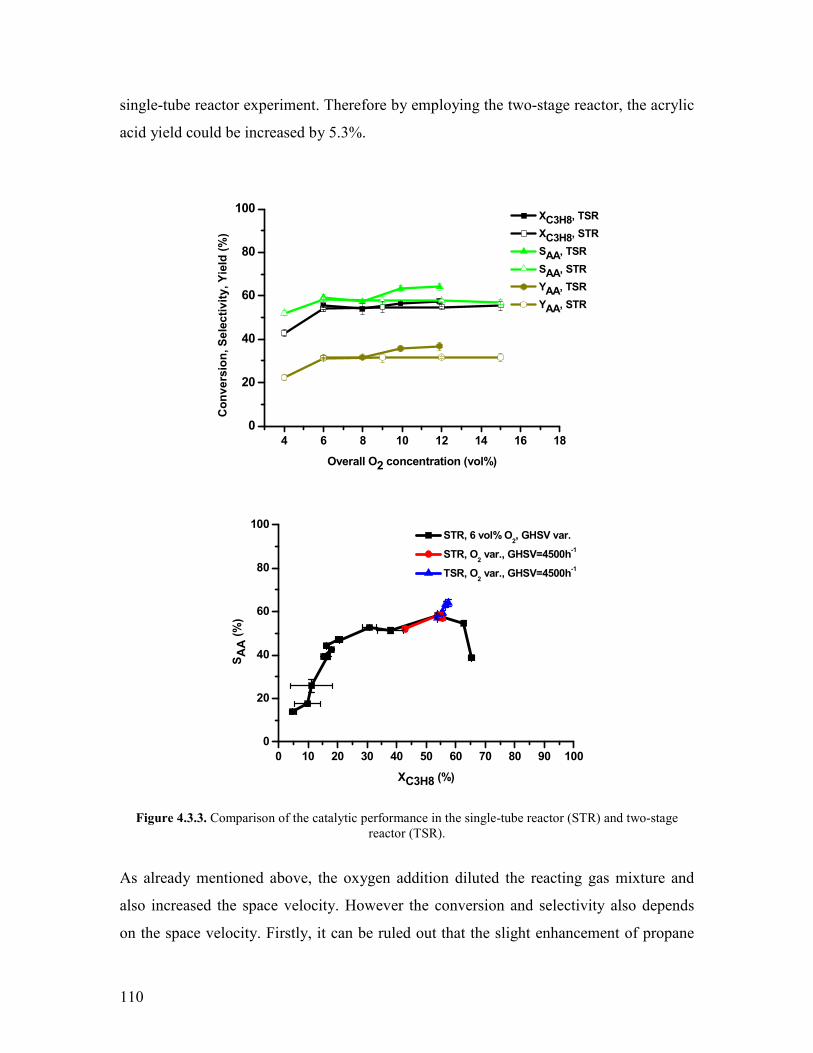
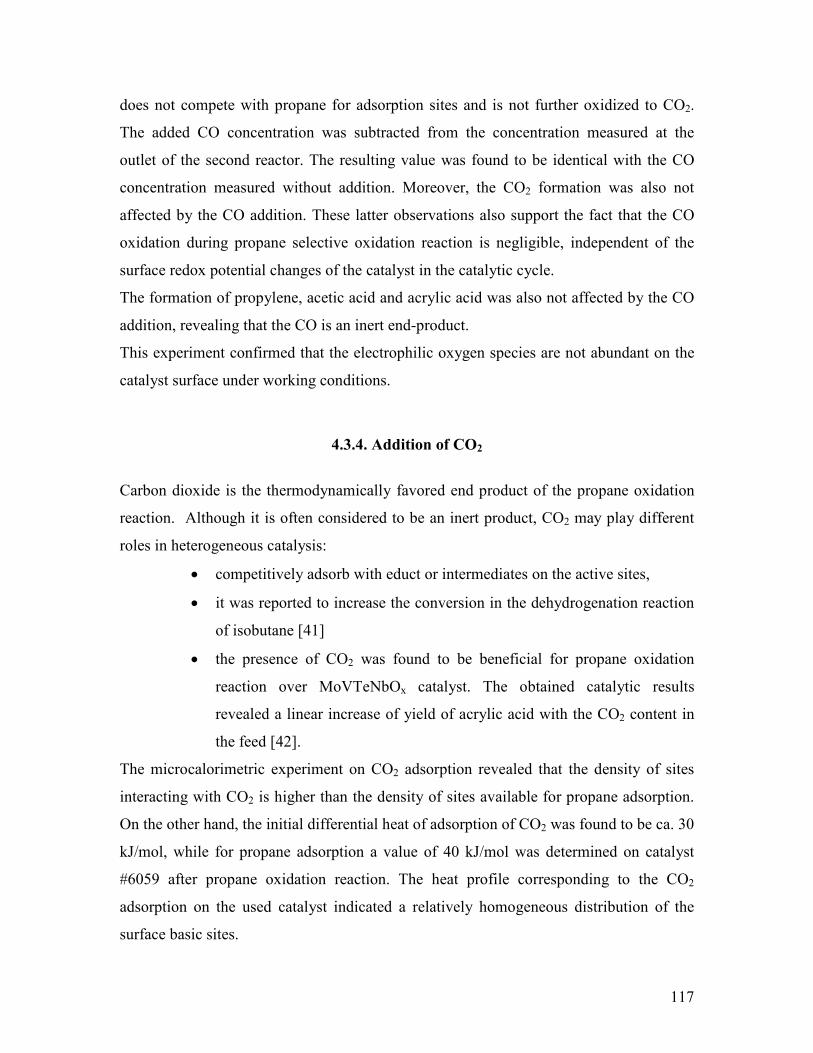
43 Two-stage reactor used as a distributor of oxidizing and reducing gases helliphelliphelliphellip106 431 Addition of O2 and N2O helliphelliphelliphelliphelliphelliphelliphelliphelliphelliphelliphelliphelliphelliphelliphelliphelliphelliphellip107 432 Addition of propylenehelliphelliphelliphelliphelliphelliphelliphelliphelliphelliphelliphelliphelliphelliphelliphelliphelliphelliphellip 113 433 Addition of CO helliphelliphelliphelliphelliphelliphelliphelliphelliphelliphelliphelliphelliphelliphelliphelliphelliphelliphelliphelliphelliphellip116 434 Addition of CO2 helliphelliphelliphelliphelliphelliphelliphelliphelliphelliphelliphelliphelliphelliphelliphelliphelliphelliphelliphelliphelliphellip117
44 Conclusions helliphelliphelliphelliphelliphelliphelliphelliphelliphelliphelliphelliphelliphelliphelliphelliphelliphelliphelliphelliphelliphelliphelliphelliphelliphellip119 References Chapter 4 helliphelliphelliphelliphelliphelliphelliphelliphelliphelliphelliphelliphelliphelliphelliphelliphelliphelliphelliphelliphelliphelliphelliphelliphellip120 Chapter 5 Post synthesis treatment of the phase-pure M1 MoVTeNbOx catalyst122
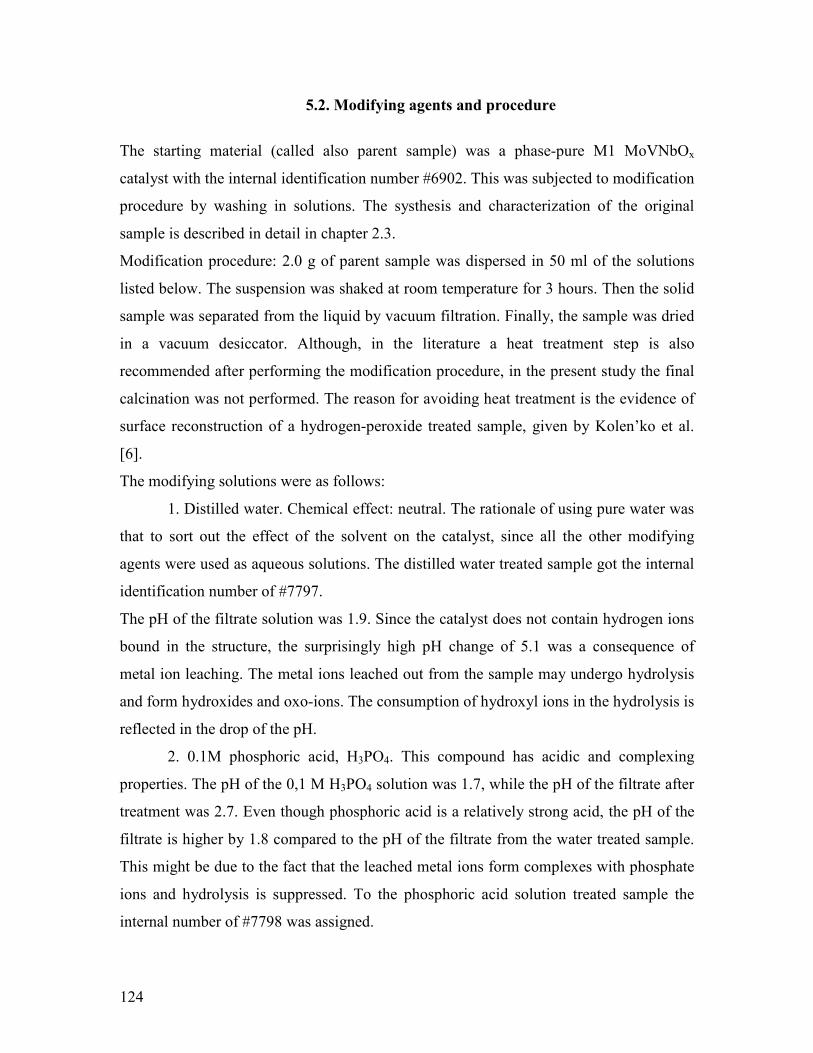
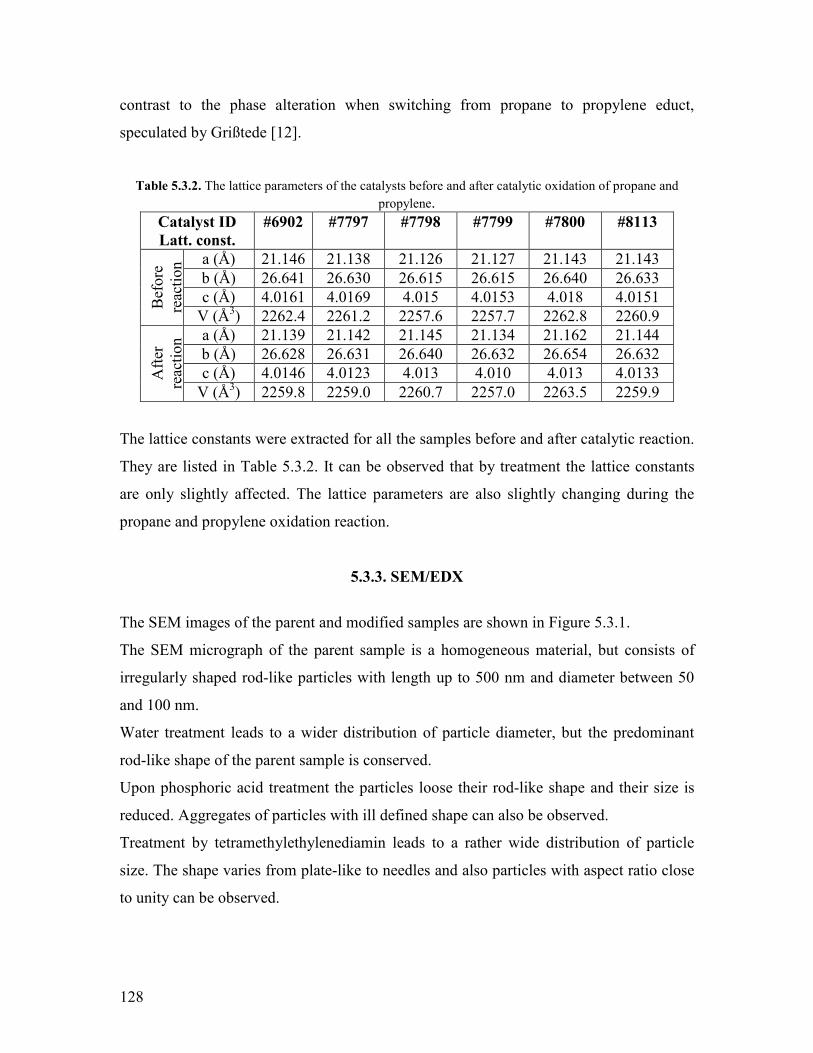
511 Abstract helliphelliphelliphelliphelliphelliphelliphelliphelliphelliphelliphelliphelliphelliphelliphelliphelliphelliphelliphelliphelliphelliphelliphelliphelliphelliphelliphellip122 512 Introduction helliphelliphelliphelliphelliphelliphelliphelliphelliphelliphelliphelliphelliphelliphelliphelliphelliphelliphelliphelliphelliphelliphelliphelliphelliphellip122 52 Modifying agents and procedure helliphelliphelliphelliphelliphelliphelliphelliphelliphelliphelliphelliphelliphelliphelliphelliphelliphelliphellip124 53 Characterization of the modified samples helliphelliphelliphelliphelliphelliphelliphelliphelliphelliphelliphelliphelliphelliphellip127
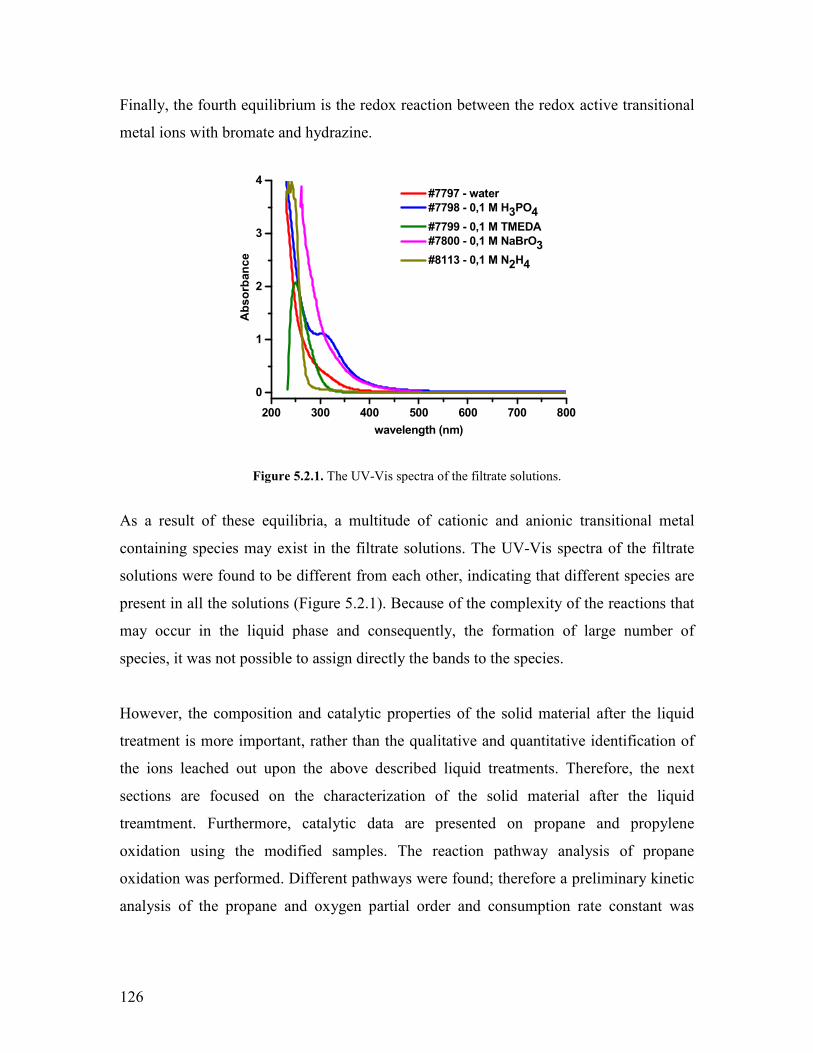
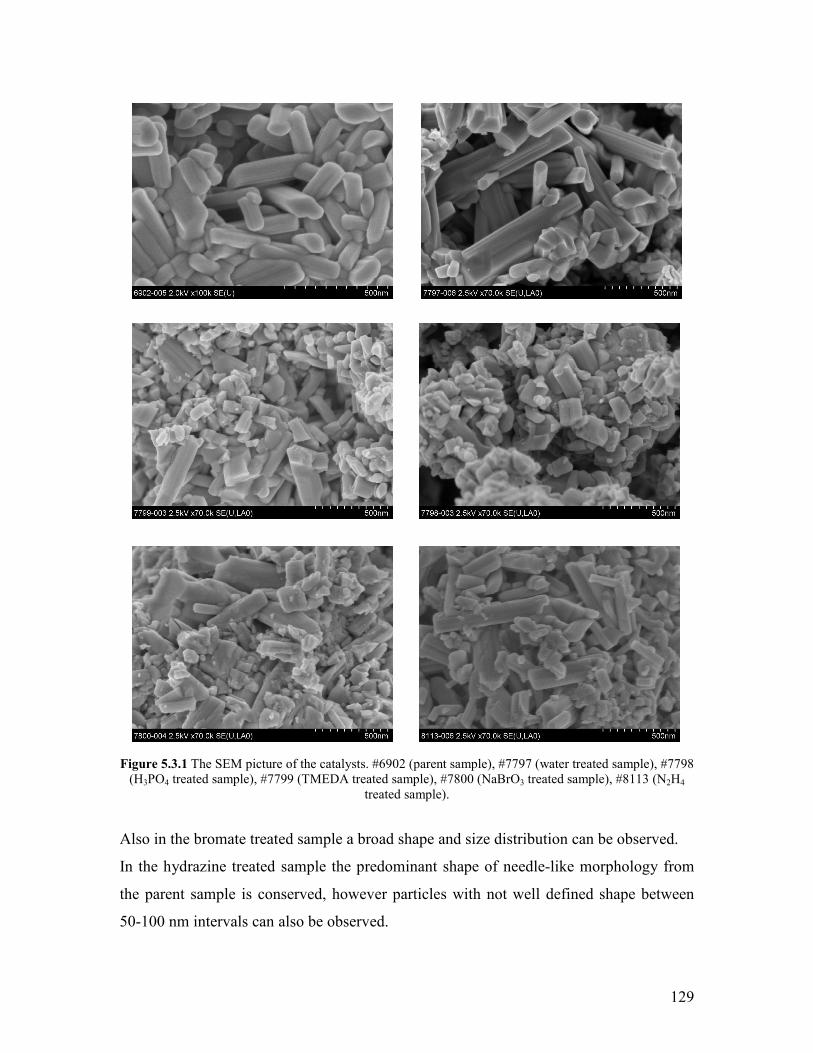
531 N2 physisorption helliphelliphelliphelliphelliphelliphelliphelliphelliphelliphelliphelliphelliphelliphelliphelliphelliphelliphelliphelliphellip127 532 X-ray diffraction helliphelliphelliphelliphelliphelliphelliphelliphelliphelliphelliphelliphelliphelliphelliphelliphelliphelliphelliphelliphellip127 533 SEMEDX helliphelliphelliphelliphelliphelliphelliphelliphelliphelliphelliphelliphelliphelliphelliphelliphelliphelliphelliphelliphelliphelliphelliphellip128 534 XAS and XPS helliphelliphelliphelliphelliphelliphelliphelliphelliphelliphelliphelliphelliphelliphelliphelliphelliphelliphelliphelliphelliphellip131 535 Microcalorimetry helliphelliphelliphelliphelliphelliphelliphelliphelliphelliphelliphelliphelliphelliphelliphelliphelliphelliphelliphelliphellip134
54 Catalytic experiments helliphelliphelliphelliphelliphelliphelliphelliphelliphelliphelliphelliphelliphelliphelliphelliphelliphelliphelliphelliphelliphelliphellip141 541 Propane oxidation helliphelliphelliphelliphelliphelliphelliphelliphelliphelliphelliphelliphelliphelliphelliphelliphelliphelliphelliphelliphellip141 542 Kinetic analysis of propane oxidation over the modified catalysts helliphellip144
viii
543 Propylene oxidation helliphelliphelliphelliphelliphelliphelliphelliphelliphelliphelliphelliphelliphelliphelliphelliphelliphelliphelliphellip148 544 CO oxidation and water gas shift reaction helliphelliphelliphelliphelliphelliphelliphelliphelliphelliphelliphellip150
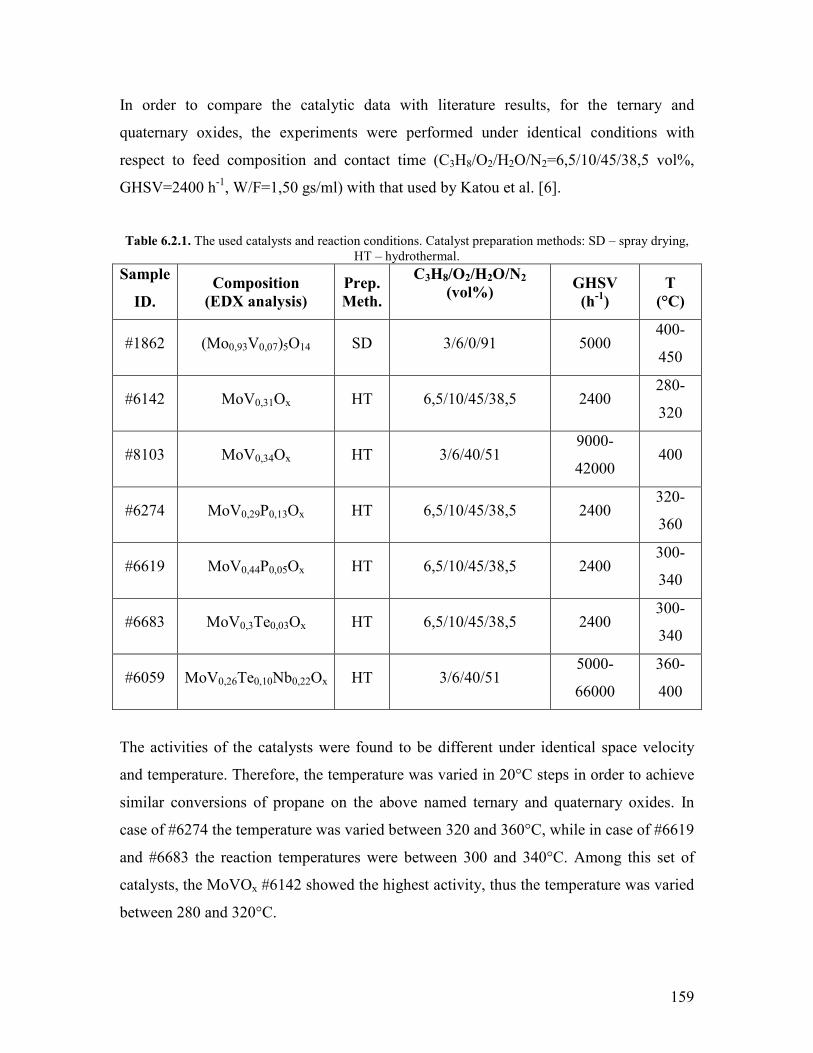
55 Conclusions helliphelliphelliphelliphelliphelliphelliphelliphelliphelliphelliphelliphelliphelliphelliphelliphelliphelliphelliphelliphelliphelliphelliphelliphelliphelliphellip153 References Chapter 5 helliphelliphelliphelliphelliphelliphelliphelliphelliphelliphelliphelliphelliphelliphelliphelliphelliphelliphelliphelliphelliphelliphelliphelliphellip155 Chapter 6 Exploratory experiments helliphelliphelliphelliphelliphelliphelliphelliphelliphelliphelliphelliphelliphelliphelliphelliphelliphellip157
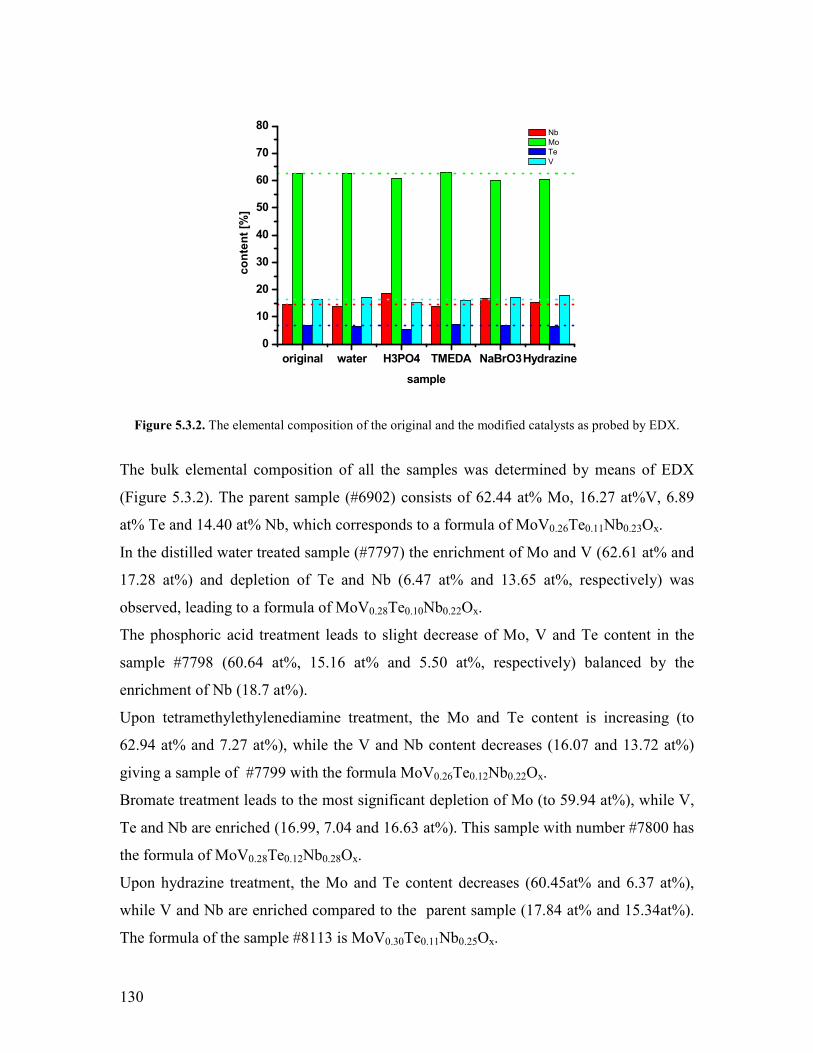
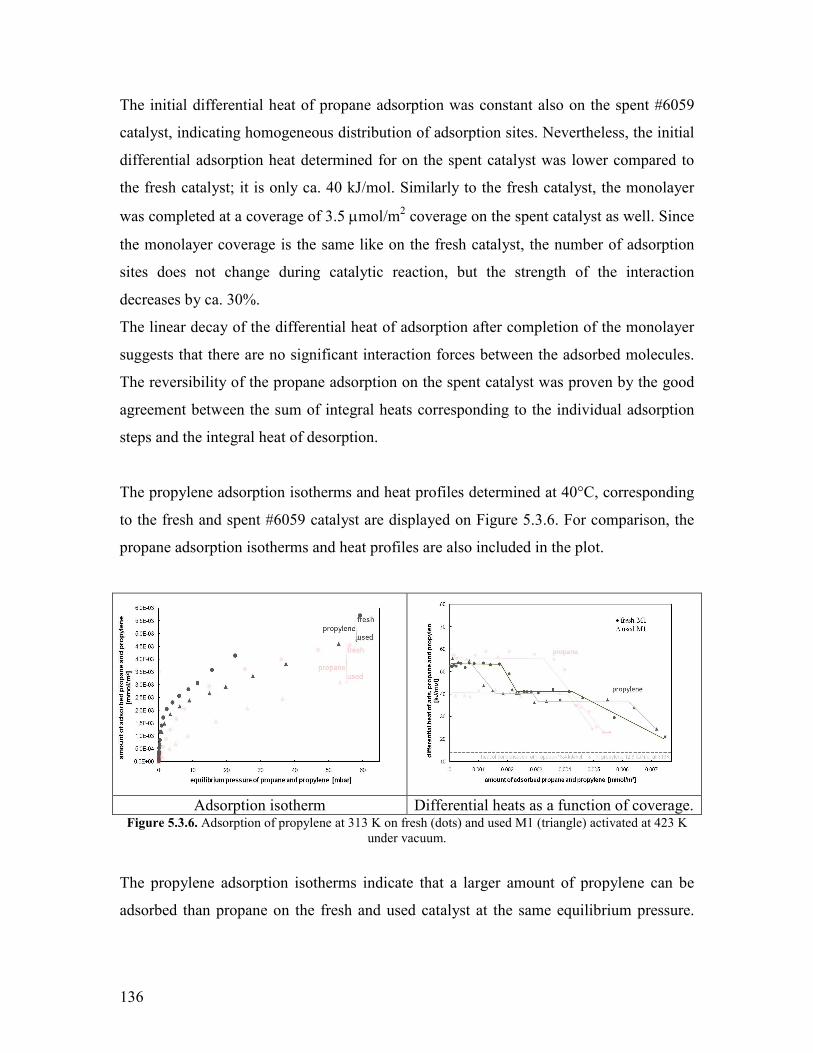
61 Introduction helliphelliphelliphelliphelliphelliphelliphelliphelliphelliphelliphelliphelliphelliphelliphelliphelliphelliphelliphelliphelliphelliphelliphelliphelliphelliphellip157 62 Propane oxidation reactivity on different Mo and V based catalysts helliphelliphelliphelliphellip158 63 Propylene oxidation reactivity on different Mo and V based catalysts helliphelliphelliphellip166 64 Exploratory reaction pathway analysis of propane oxidation on phase-pure M1 catalyst helliphelliphelliphelliphelliphelliphelliphelliphelliphelliphelliphelliphelliphelliphelliphelliphelliphelliphelliphelliphelliphellip169 65 Exploratory kinetic modeling on propane oxidation on phase-pure MoVTeNbOx catalyst helliphelliphelliphelliphelliphelliphelliphelliphelliphelliphelliphelliphelliphelliphelliphelliphelliphelliphelliphelliphelliphelliphellip178
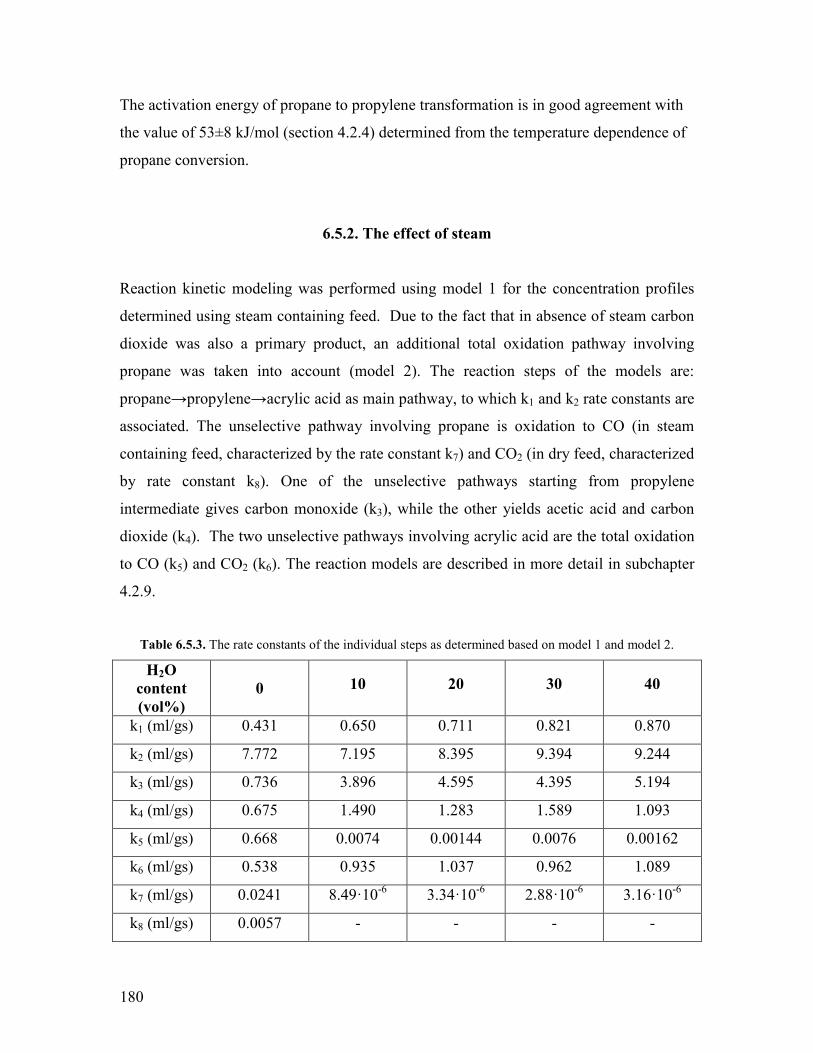
651 The effect of temperature helliphelliphelliphelliphelliphelliphelliphelliphelliphelliphelliphelliphelliphelliphelliphelliphelliphellip178 652 The effect of steam helliphelliphelliphelliphelliphelliphelliphelliphelliphelliphelliphelliphelliphelliphelliphelliphelliphelliphelliphelliphellip180
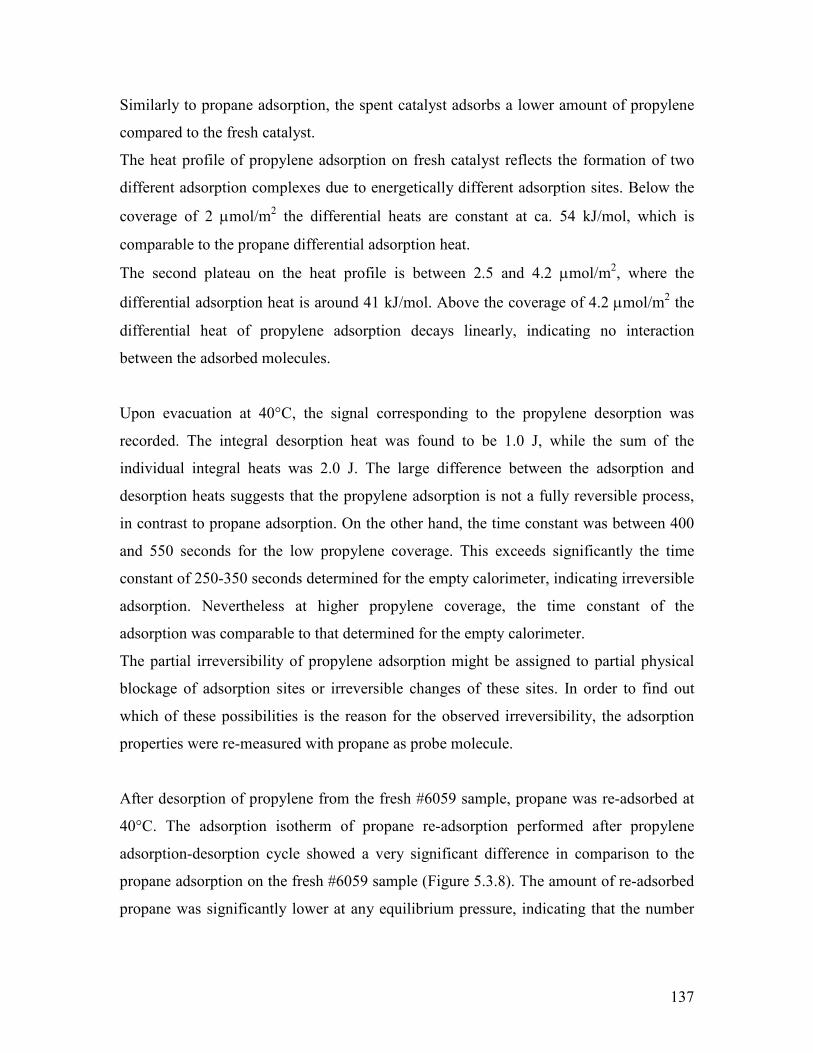
References Chapter 6 helliphelliphelliphelliphelliphelliphelliphelliphelliphelliphelliphelliphelliphelliphelliphelliphelliphelliphelliphelliphelliphelliphelliphelliphellip182 General Conclusions and Outlook helliphelliphelliphelliphelliphelliphelliphelliphelliphelliphelliphelliphelliphelliphelliphelliphelliphelliphellip184
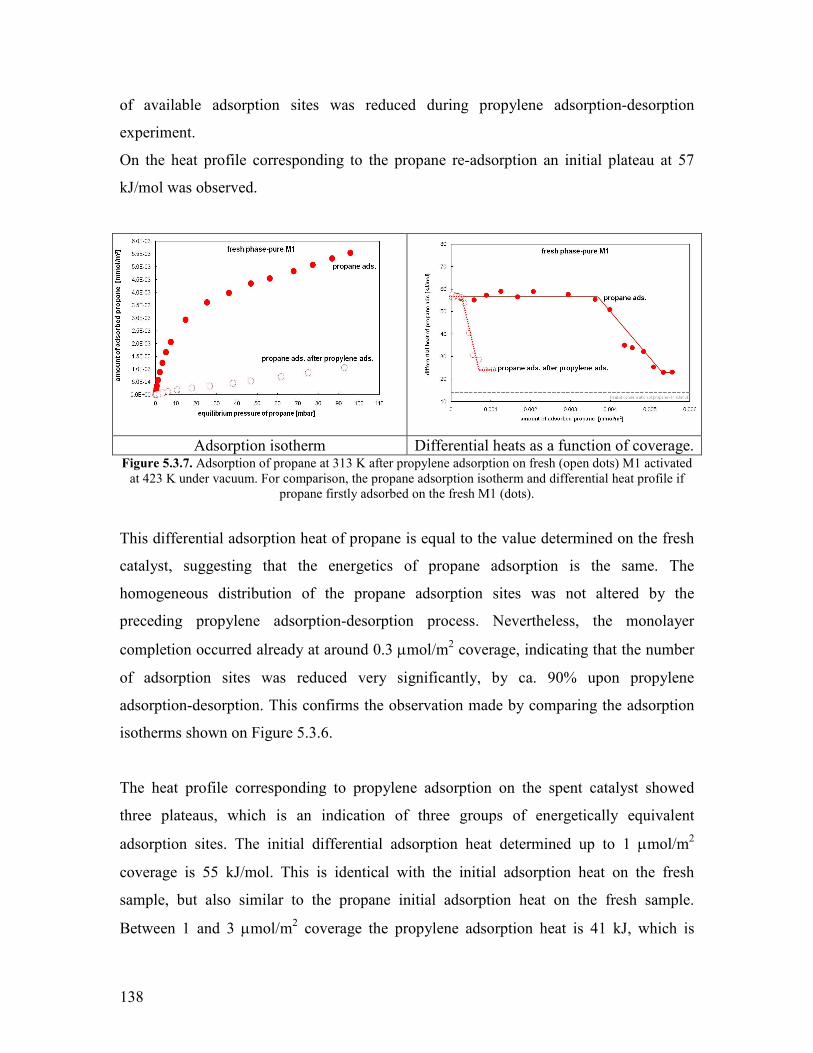
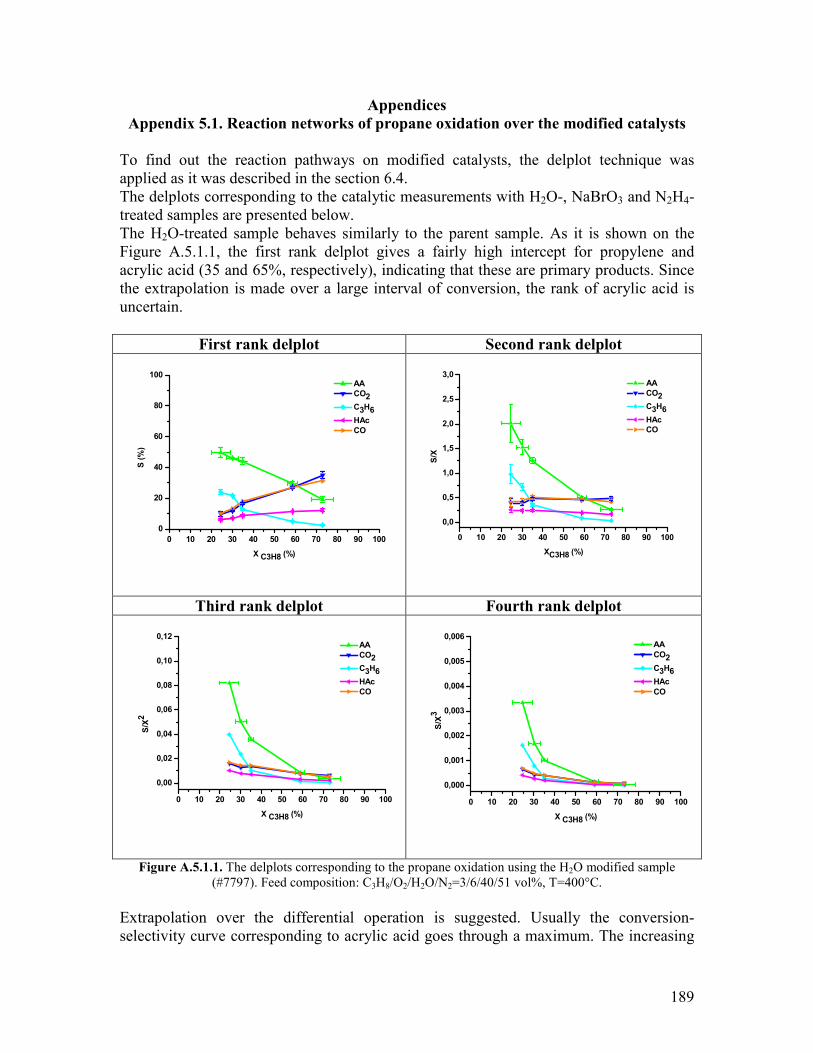
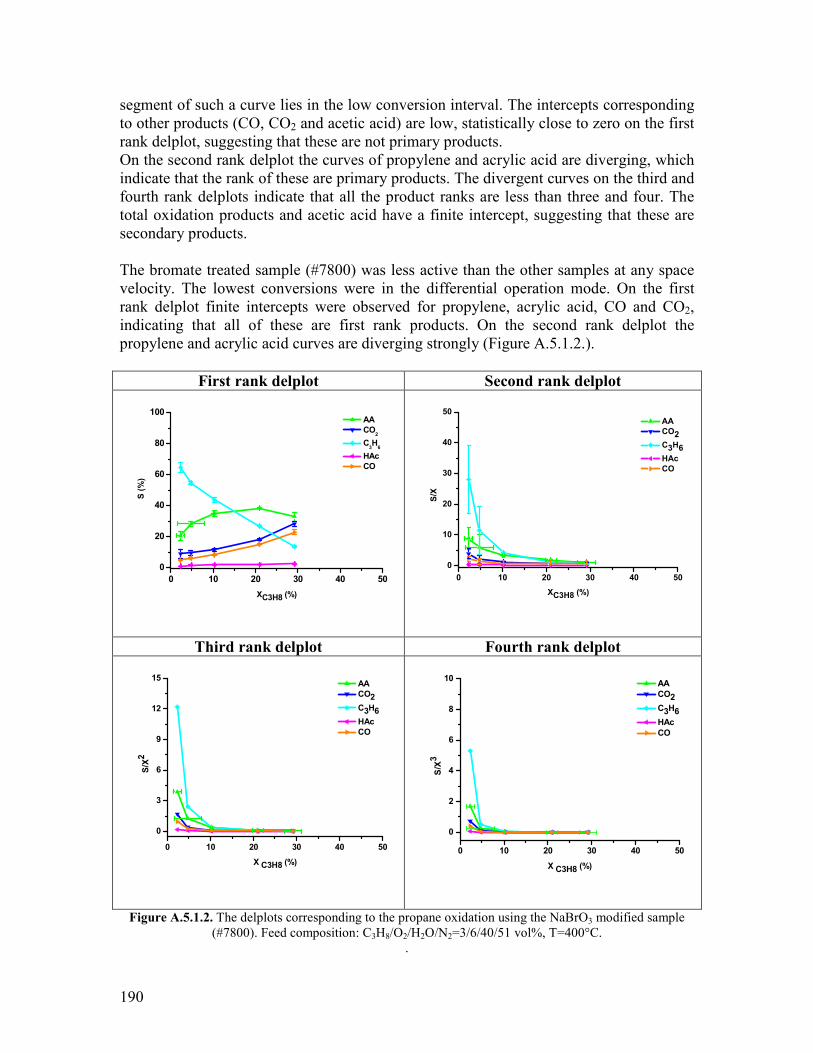
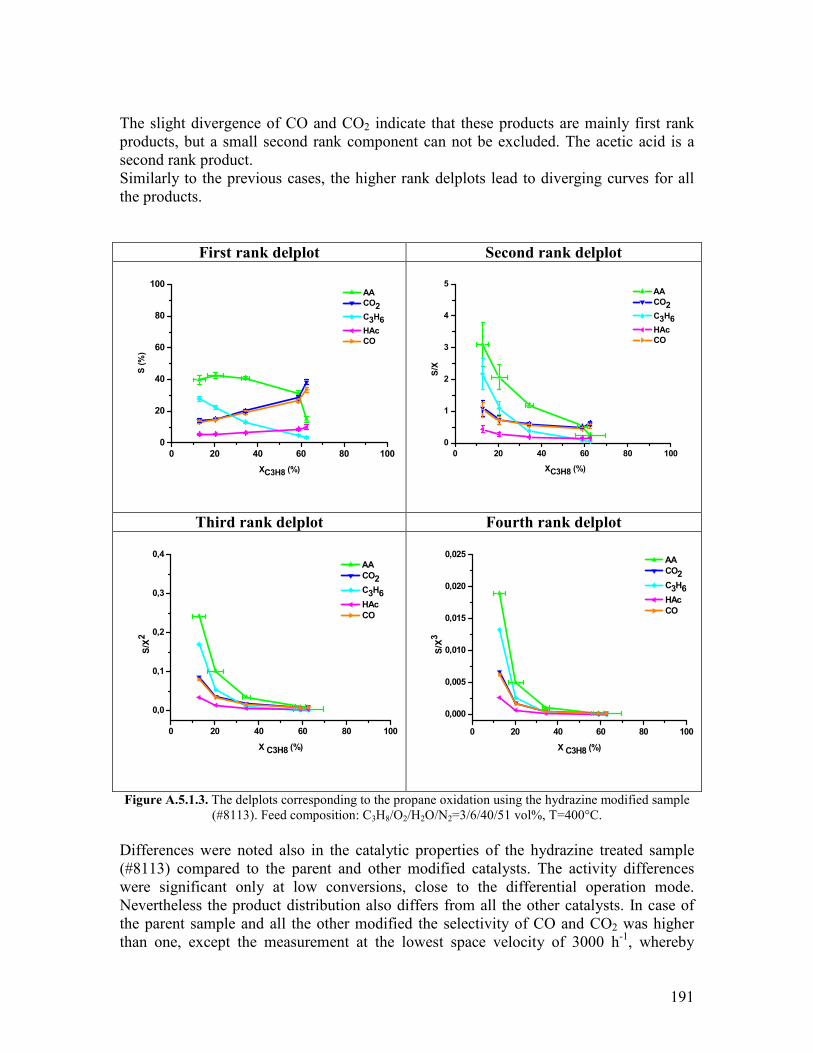
Appendices helliphelliphelliphelliphelliphelliphelliphelliphelliphelliphelliphelliphelliphelliphelliphelliphelliphelliphelliphelliphelliphelliphelliphelliphelliphelliphelliphelliphellip189
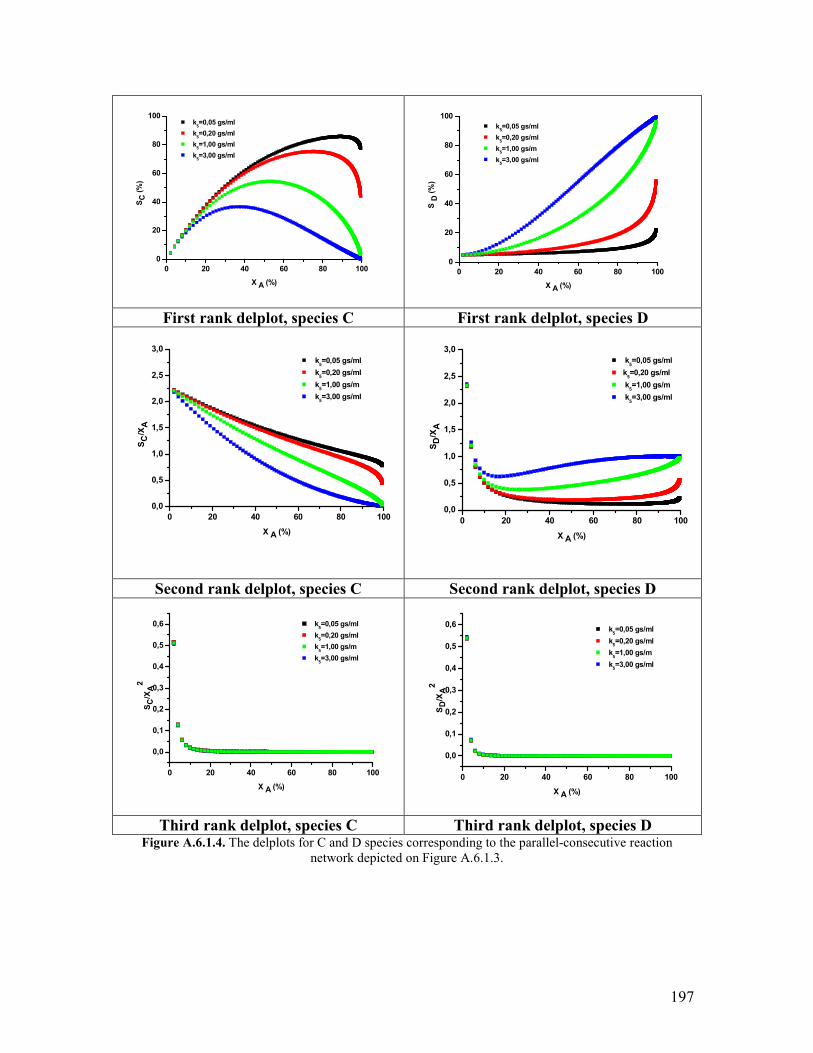
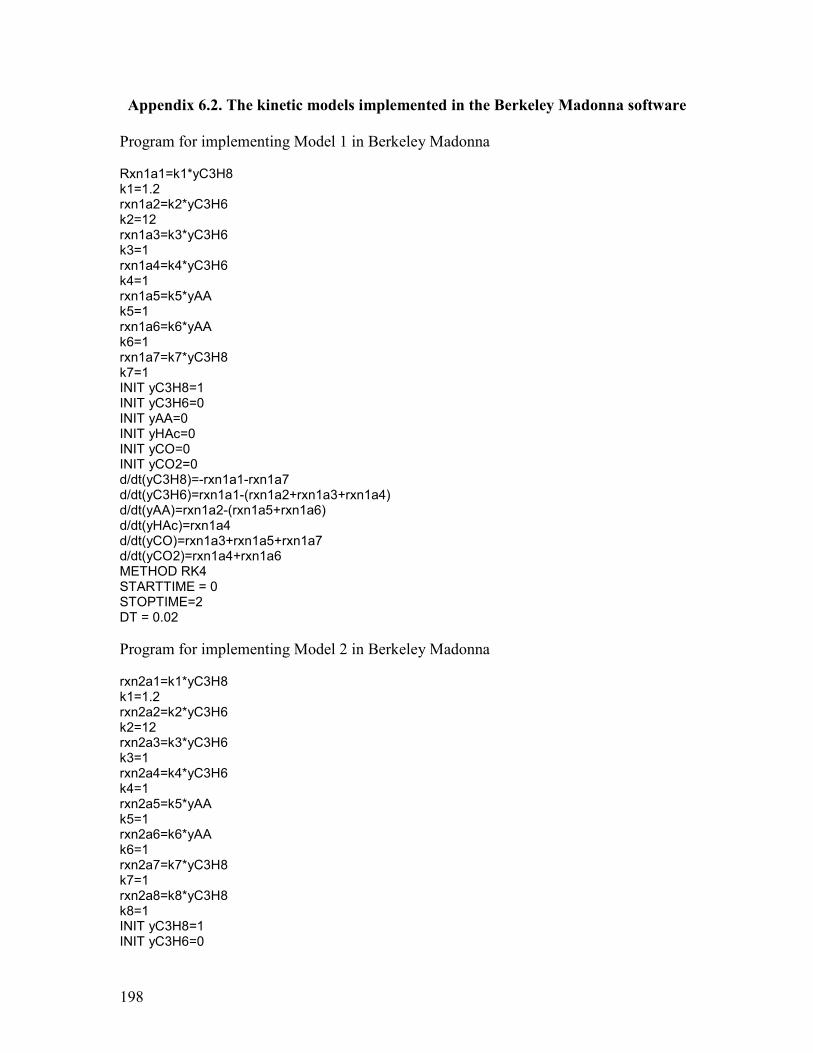
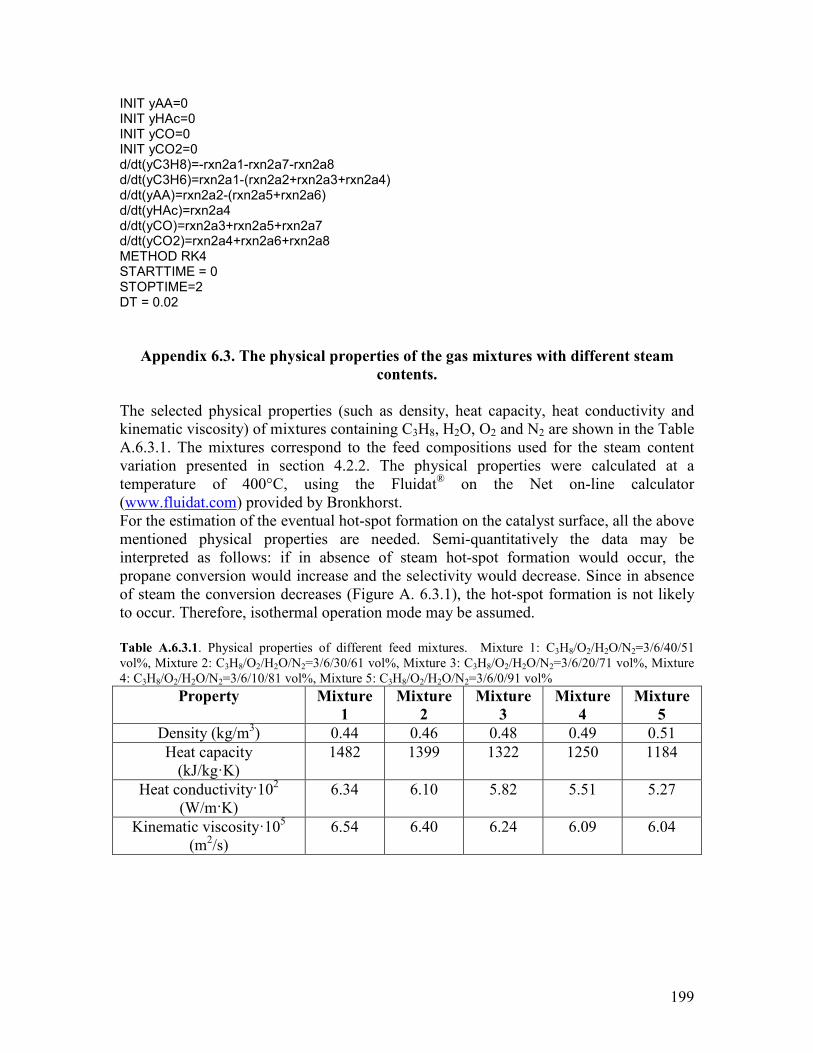
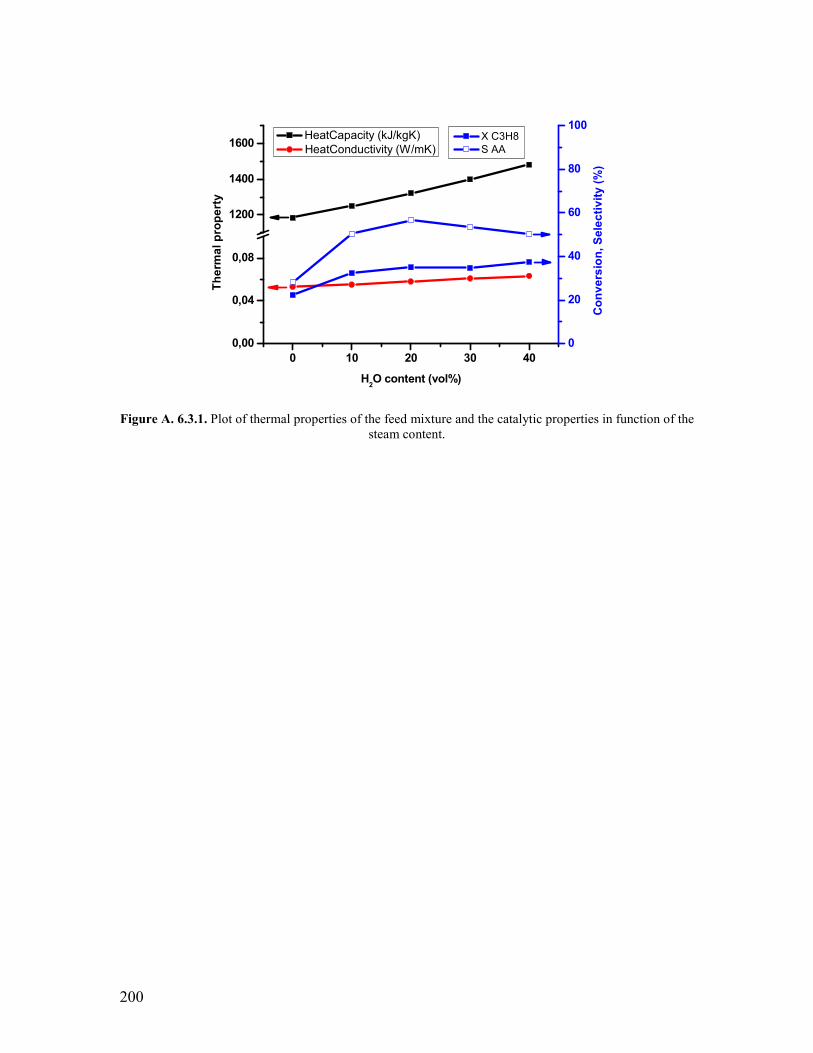
Appendix 51 Reaction networks of propane oxidation over the modified catalystshellip 189 Appendix 61 Modeling the delplots for a reaction pathway that contains multiple rank product helliphelliphelliphelliphelliphelliphelliphelliphelliphelliphelliphelliphelliphelliphelliphelliphelliphelliphellip193 Appendix 62 Program for implementing Model 1 in Berkeley Madonna helliphelliphelliphellip198 Appendix 63 The physical properties of the gas mixtures with different steam contents helliphelliphelliphelliphelliphelliphelliphelliphelliphelliphelliphelliphelliphelliphelliphelliphelliphelliphelliphelliphelliphellip199 Acknowledgements for permission to reprint published materials helliphelliphelliphelliphelliphellip201 List of abbreviations helliphelliphelliphelliphelliphelliphelliphelliphelliphelliphelliphelliphelliphelliphelliphelliphelliphelliphelliphelliphelliphelliphelliphellip202 List of figureshelliphelliphelliphelliphelliphelliphelliphelliphelliphelliphelliphelliphelliphelliphelliphelliphelliphelliphelliphelliphelliphelliphelliphelliphelliphelliphellip204 List of tableshelliphelliphelliphelliphelliphelliphelliphelliphelliphelliphelliphelliphelliphelliphelliphelliphelliphelliphelliphelliphelliphelliphelliphelliphelliphelliphelliphellip207
1
Chapter 1 Introduction and motivation
11 Introduction
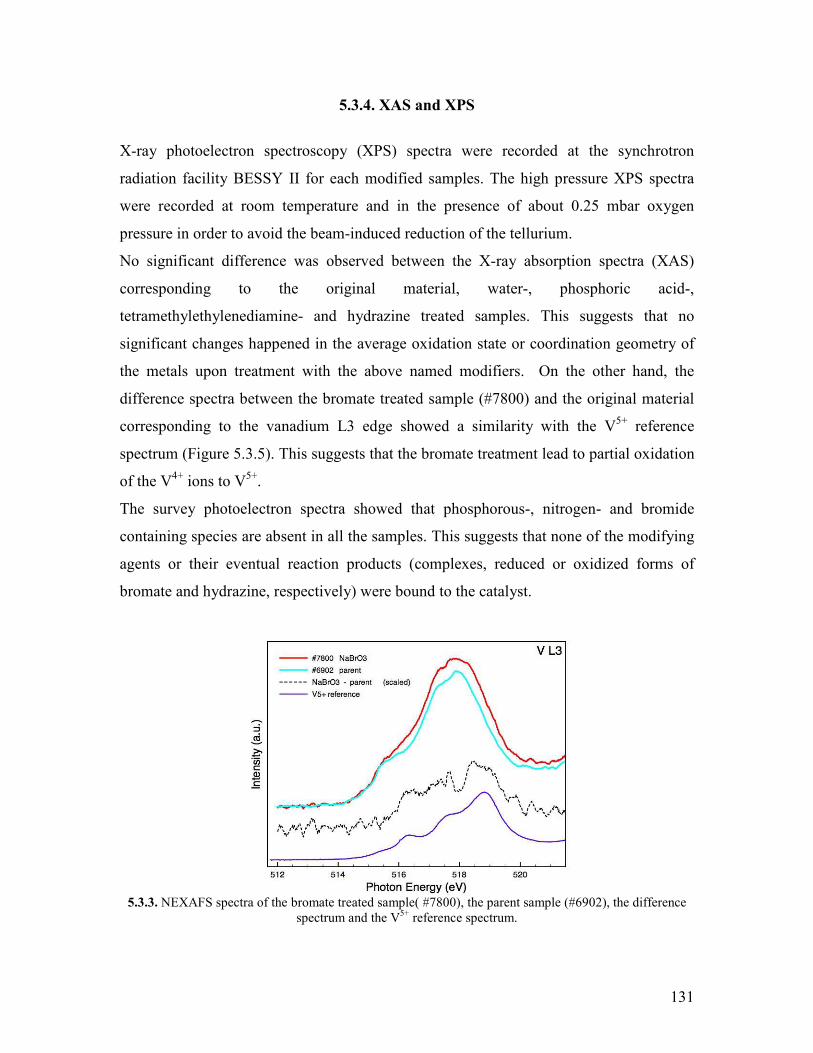
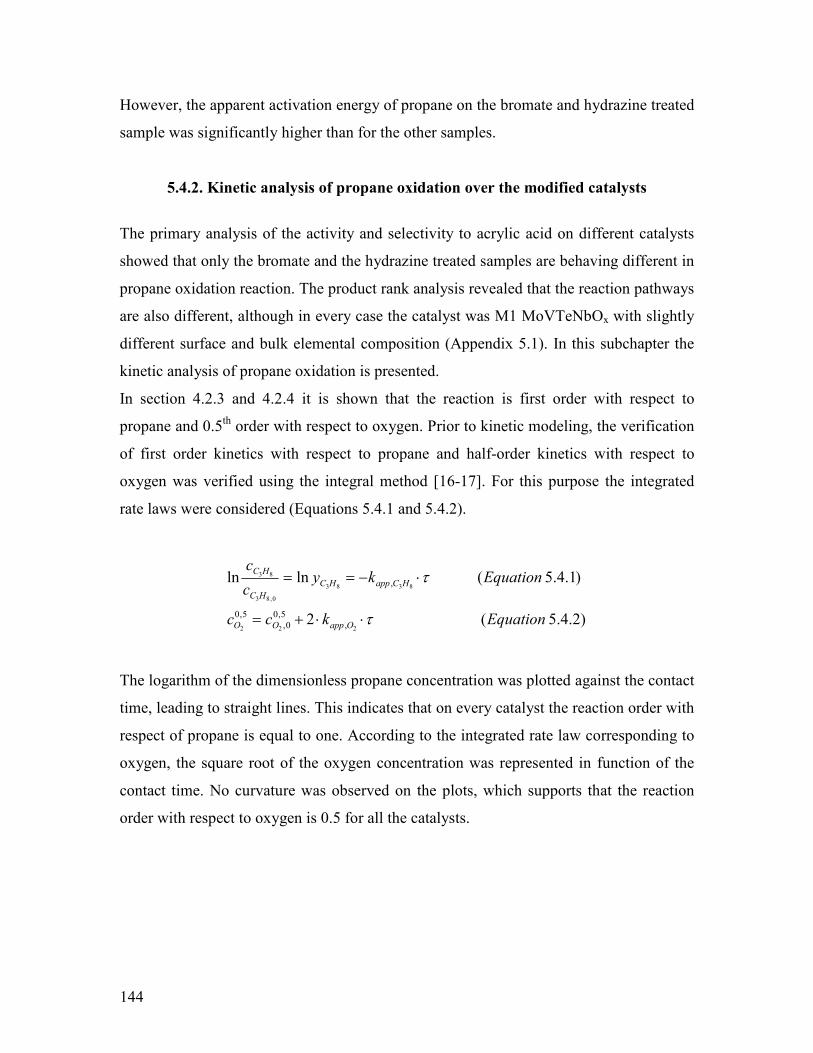
Based on economical and ecological considerations many attempts have been undertaken
during the last decades to replace petroleum by other feedstock for producing chemicals
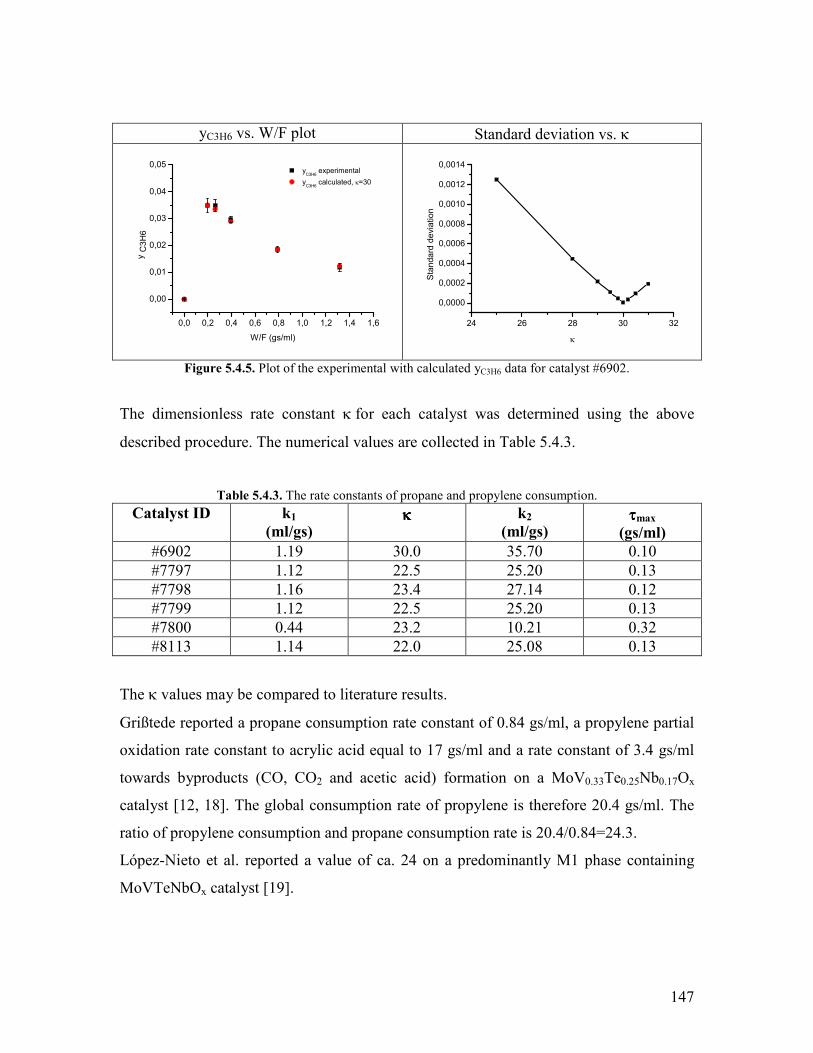
and polymers The use of C2-C4 components of the natural gas for this purpose is one
option [1-3]
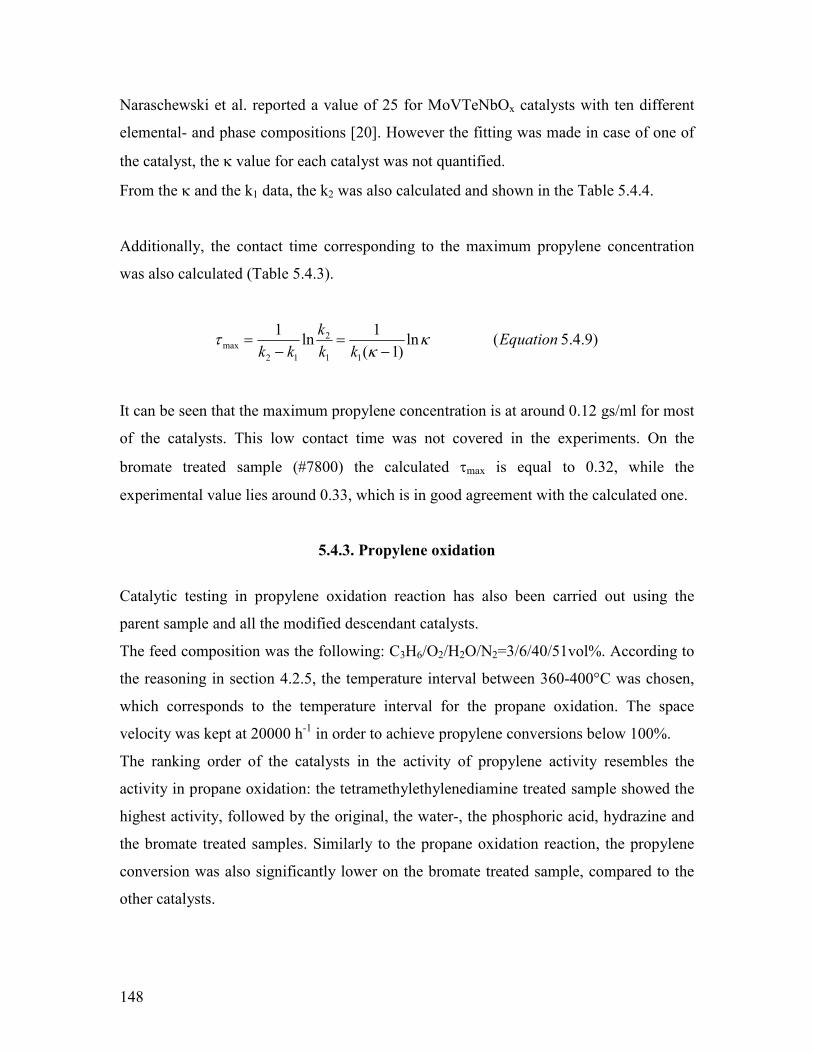
Acrylic acid and acrylonitrile are very important monomers The global crude acrylic
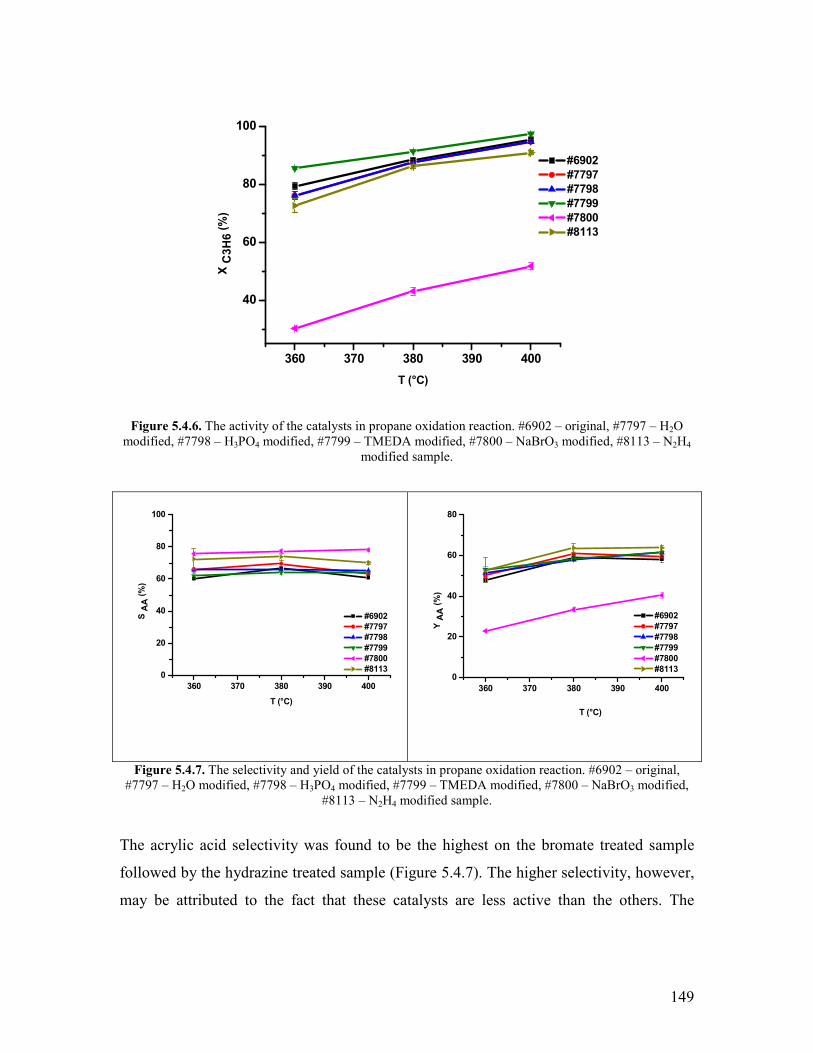
acid market reached around 32 million tons by the end of 2005 and the demand increased
steadily with ca 4year Esterification of crude acrylic acid yields acrylates which are
used to produce various homo- and copolymers by emulsion polymerization with
manifold applications ranging from coatings (ca 44 of the total market) adhesives (ca
19 of the total market) and fibres to textiles (ca 7 of the total market) Acrylic acid
in its glacial form is used to produce polyacrylic acid and polyacrylates for
superabsorbents (ca 11 of the total market) inks detergents and dispersants (ca 8 of
the total market)
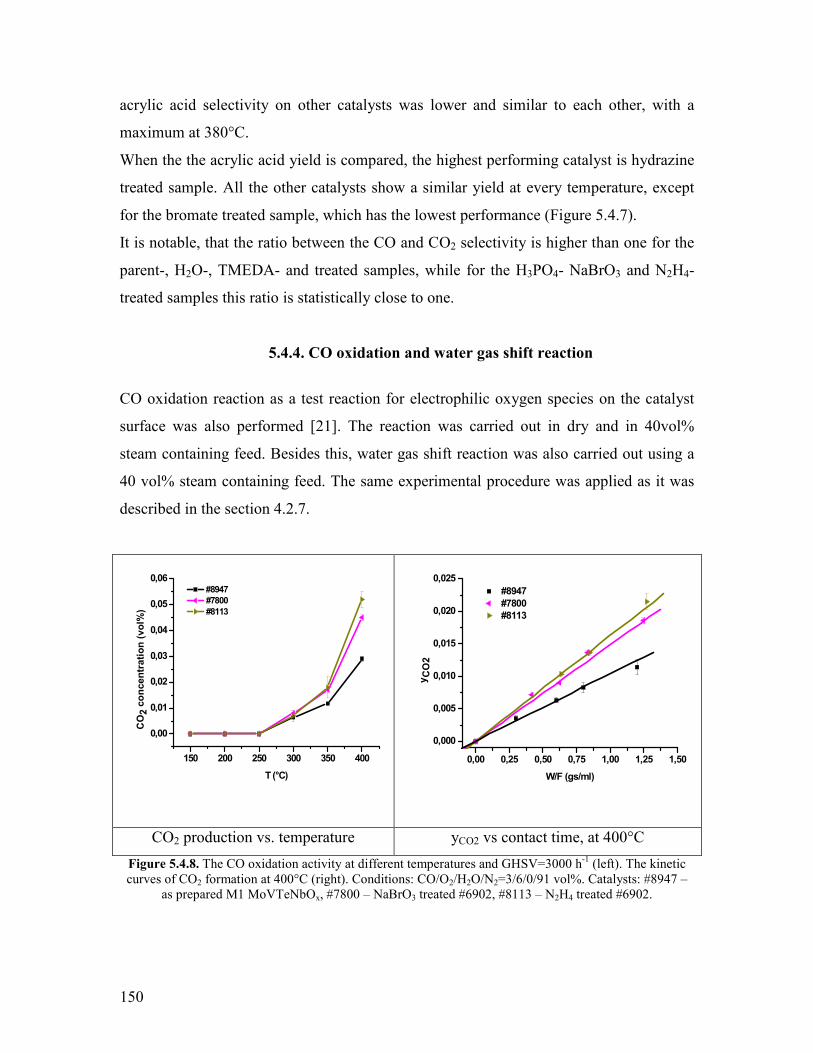
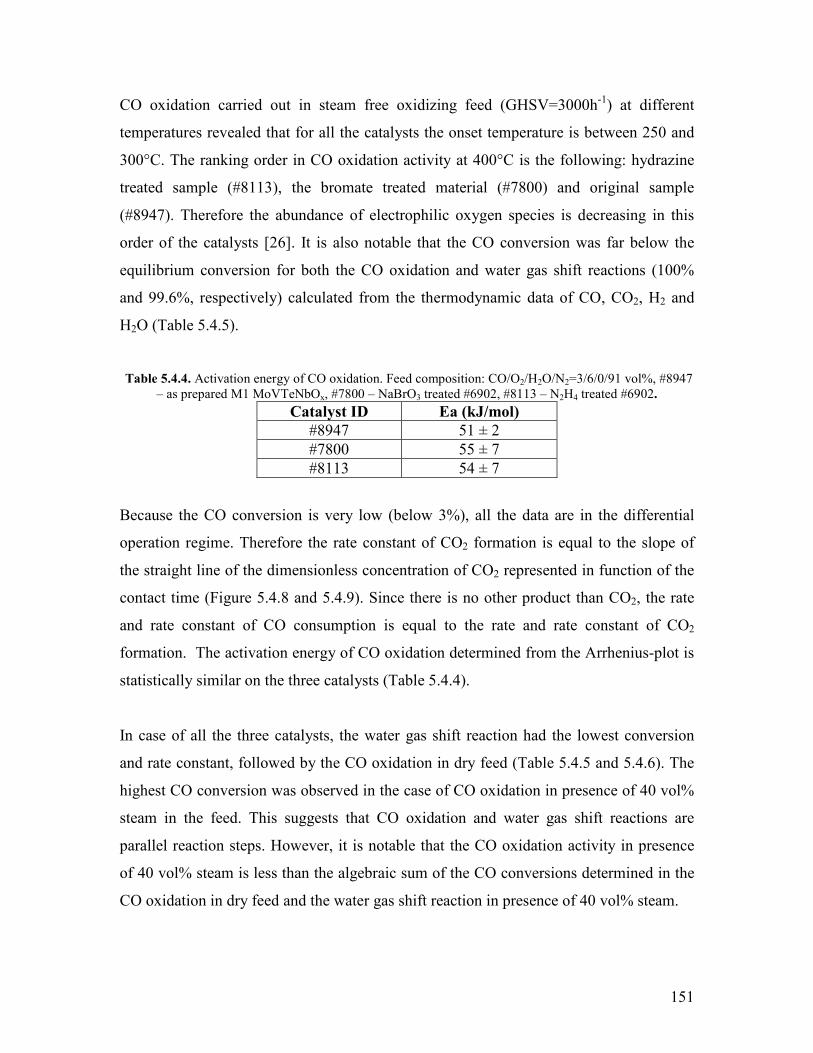
Acrylic acid has been produced in commercial processes starting from acetylene
ethylene or propylene respectively In the last century acrylic acid was mainly
manufactured by means of an acetylene-based process (Reaction 111) developed by
Reppe in the 1930acutes in Germany The process was commercialized by the BASF in
Ludwigshafen Germany in the 1950acutes
HCequivCH + CO + H2O rarr CH2=CHCOOH (Reaction 111)
This process was operated at 200degC and 80 bar applying a catalyst that contains a
carbonyl forming metal such as nickel The plant in Ludwigshafen was closed in the
1990acutes with the start-up of a new propylene-based plant in Antwerp Belgium
The direct oxidation of propylene to acrylic acid was developed by Nippon Shokubai
using catalysts like Mo-W-Te-Sn-Co-O or Nb-W-Co-Ni-Bi-Fe-Mn-Si-Zr-O at 325-350ordmC
with 65 and 75 yield respectively [2-4] The reaction is very exothermic
2
(∆H=minus598kJmol) The process requires maintaining the temperature between 325 and
350degC in order to attain an economically reasonable propylene conversion but under
these conditions significant total oxidation occurs which causes a decrease of selectivity
Moreover the catalyst shows significant deactivation For these reasons the process
turned out to be uneconomic
Nowadays a two stage oxidation process starting from propylene is exclusively used
worldwide In the first step propylene is oxidized to acrolein at 350plusmn50degC over promoted
molybdenum-bismuth systems (Reaction 112)
H2C=CHCH3 + O2 rarr H2C=CHCHO + H2O ∆H = - 3408 kJmol (Reaction 112)
Promoted molybdenum-vanadium systems and temperatures around 210-250degC are used
to oxidize acrolein to acrylic acid (Reaction 113)
H2C=CHCHO + 12O2 rarr H2C=CHCOOH ∆H = - 2541 kJmol (Reaction 113)
Both of these steps are rather exothermic In the first step a yield of 90 acrolein can be
attained During the second step a yield of 97 acrylic acid can be reached The overall
acrylic acid yield is around 87
Upcoming new process developments include
bull biotransformation processes (eg using lactic acid as an intermediate)
bull oxidation of propane via propylene (oxidative dehydrogenation) and acrolein
(three stage process) or
bull direct oxidation of propane to acrylic acid in one step
The price of propylene is 1105 euroton [5] while the price of acrylic acid is currently
1825euroton [6] On the other hand the propane is much cheaper than propylene it costs
ca 345 euroton [6] Because the feedstock cost accounts about 80 of the profited cost the
3
realization of the direct (one step) oxidation of propane to acrylic acid would be
economically very important [1 2]
Due to the apparent attractiveness with respect to potential utilization of the low cost
propane feedstock considerable research activities were initiated in the last two decades
for the selective oxidation of propane to acrylic acid However propane is less reactive
than propylene therefore higher temperatures or more active catalysts are needed to
activate it The increase of temperature causes the increase of conversion but usually also
enhances the formation of side products (propionic and acetic acids) andor total
combustion products (CO and CO2) which results in the decrease of selectivity and yield
of the process Hence the development of an active and selective catalyst for the direct
(one-step) transformation of propane to acrylic acid is still a challenging task [1-3]
Owing to the price difference between propane and propylene and the high performance
of the two-stage propylene oxidation process a yield of 50-60 would be needed for the
one step propane oxidation process in order to replace the actual process
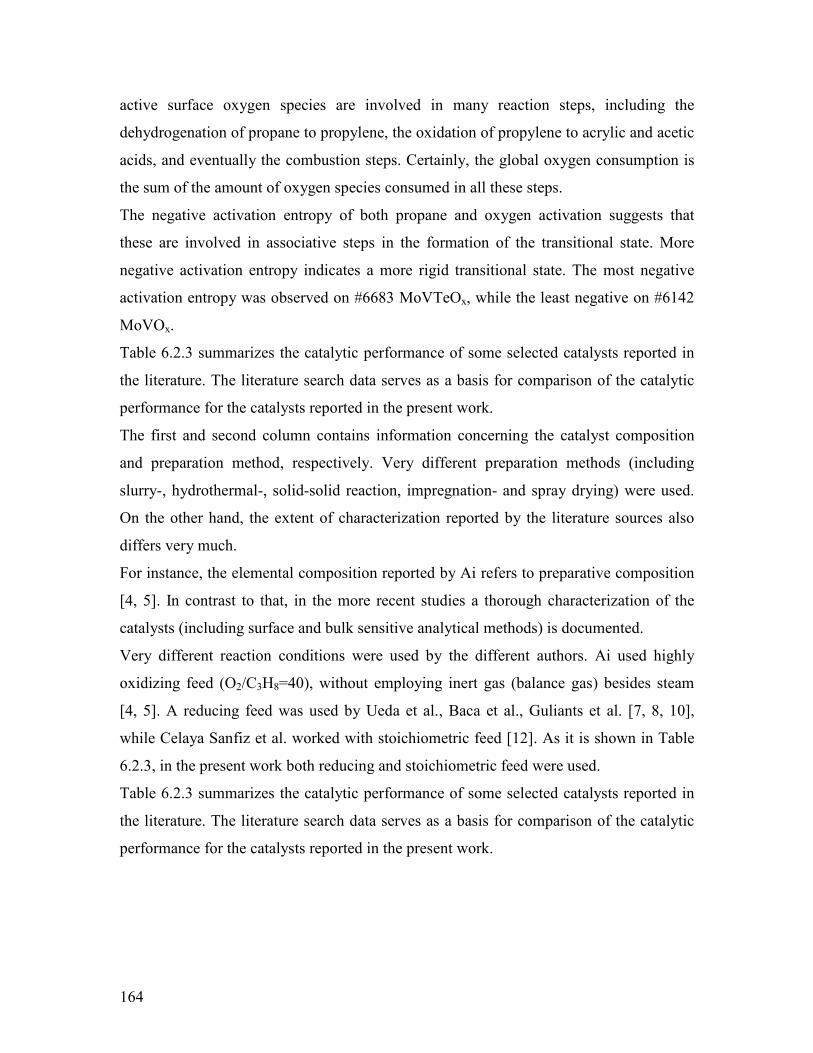
12 Overview on the literature results
The literature overview consists of five main parts In the first part the propylene
selective oxidation is presented which is industrially applied In the second part the main
results concerning propane oxidative dehydrogenation are summarized The third part
concentrates on the one-step propane oxidation reaction Here the current knowledge
from literature about the reaction pathways active sites and effects of the operating
variables (acid-basic properties of the catalyst feed composition) are presented In the
last two parts reactor design and reaction kinetic considerations are summarized The
motivations for the present study are outlined at the end of this chapter
121 The selective oxidation of propylene
The oxidation of propylene to acrolein has been studied on various catalysts mainly on
bismuth molybdates Cu2O and multi-component metal oxides (ie SbSnO CoMoTeO
NiMoTeO VPTeO etc)
4
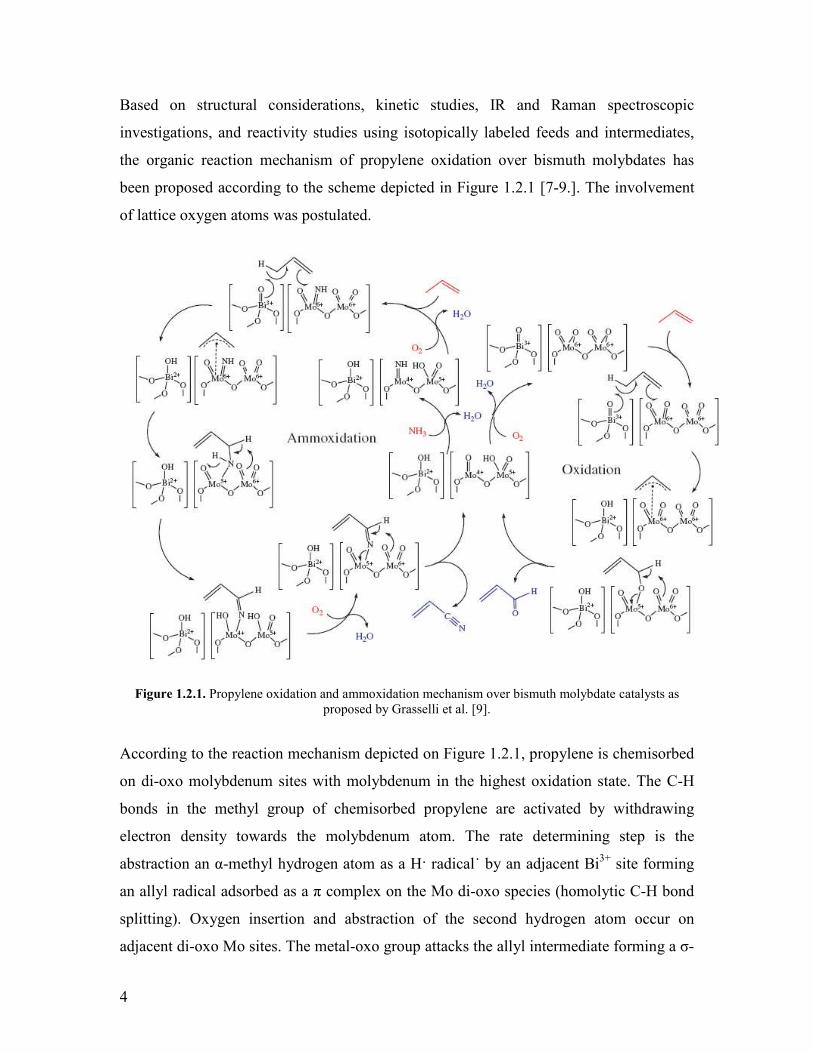
Based on structural considerations kinetic studies IR and Raman spectroscopic
investigations and reactivity studies using isotopically labeled feeds and intermediates
the organic reaction mechanism of propylene oxidation over bismuth molybdates has
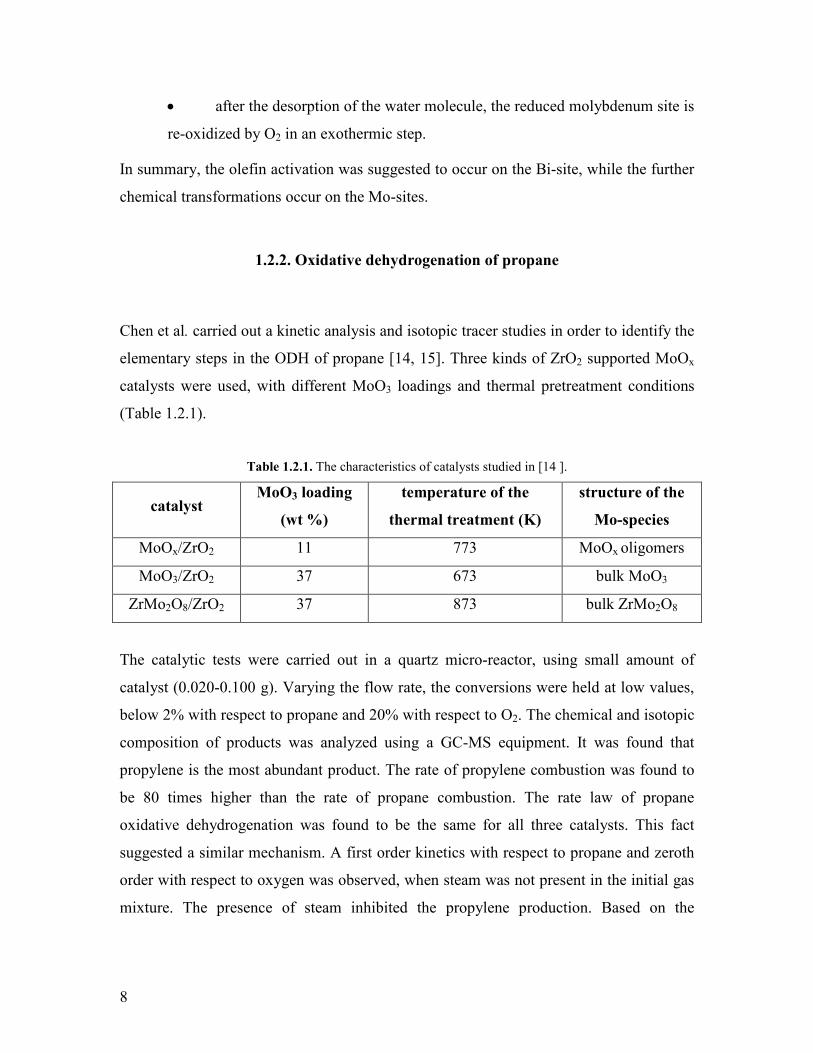
been proposed according to the scheme depicted in Figure 121 [7-9] The involvement
of lattice oxygen atoms was postulated
Figure 121 Propylene oxidation and ammoxidation mechanism over bismuth molybdate catalysts as
proposed by Grasselli et al [9]
According to the reaction mechanism depicted on Figure 121 propylene is chemisorbed
on di-oxo molybdenum sites with molybdenum in the highest oxidation state The C-H
bonds in the methyl group of chemisorbed propylene are activated by withdrawing
electron density towards the molybdenum atom The rate determining step is the
abstraction an α-methyl hydrogen atom as a H radical˙ by an adjacent Bi3+ site forming
an allyl radical adsorbed as a π complex on the Mo di-oxo species (homolytic C-H bond
splitting) Oxygen insertion and abstraction of the second hydrogen atom occur on
adjacent di-oxo Mo sites The metal-oxo group attacks the allyl intermediate forming a σ-
5
bonded allyl species The latter species is transformed to acrolein by abstraction of a
further hydrogen atom The surface OH groups formed by hydrogen abstraction then
react to form water which is desorbed Reoxidation of the reduced molybdenum and
bismuth sites by O2 was suggested to close the catalytic cycle The adsorption and
dissociation of gaseous oxygen was supposed to occur on bismuth sites It was also
claimed that the reoxidation sites should be located in the vicinity of the catalytically
active centers to achieve high activity (this is referred to as ldquophase cooperationrdquo concept)
[10] The proper BiMo stoichiometry exists in the α- and β-phase [9] which are the most
effective phases among the numerous Bi-molybdate phases that exist [11] It was also
claimed that high selectivity requires isolation of the active sites from each other (this is
referred to as ldquosite isolationrdquo concept) [10]
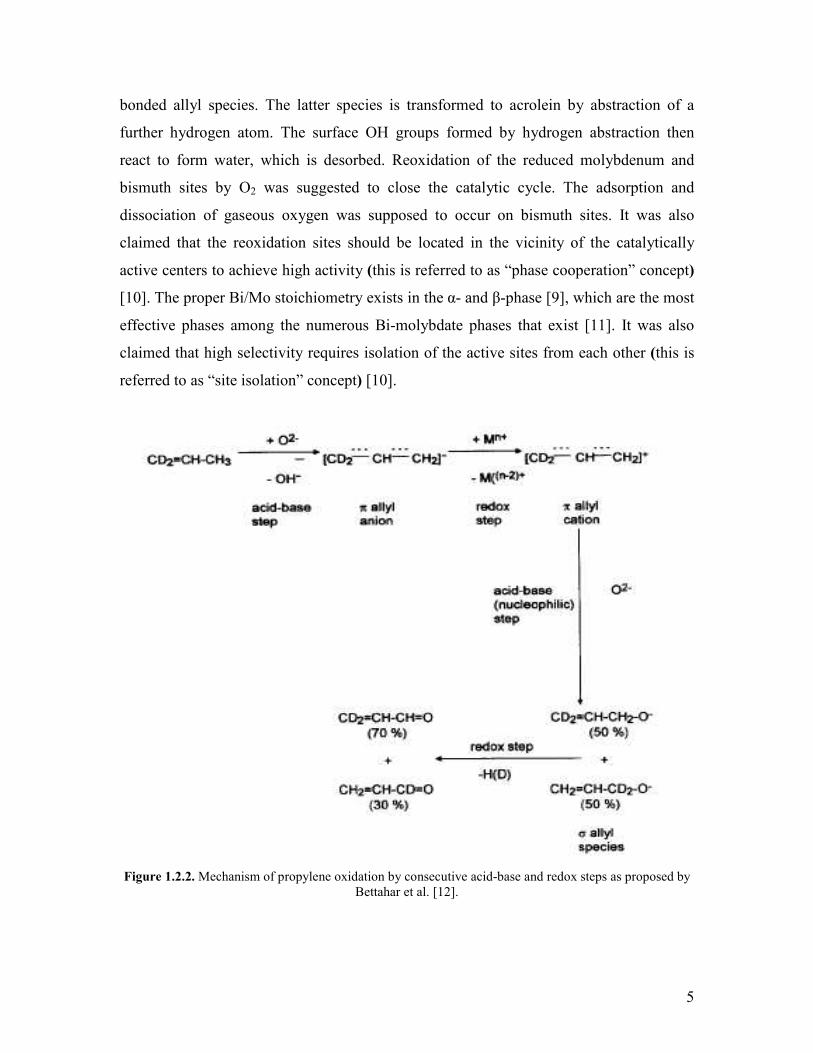
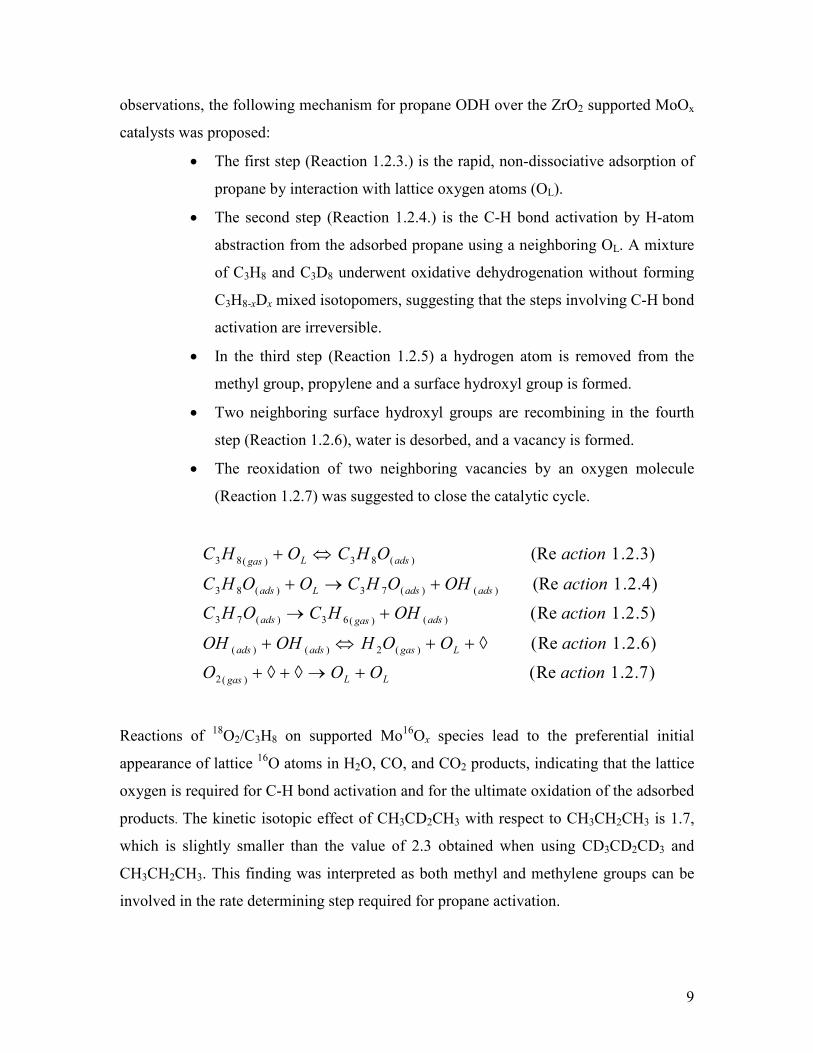
Figure 122 Mechanism of propylene oxidation by consecutive acid-base and redox steps as proposed by
Bettahar et al [12]
6
According to Bettahar et al [12] the reaction scheme demonstrated in Figure 122 may
also be interpreted in terms of proton abstraction on basic Bi-O groups leading to a
symmetric π-allyl anionic intermediate coordinated to the molybdenum di-oxo species
(heterolytic C-H bond splitting) The allyl-anion is subsequently oxidized to a π-allyl
cation on a redox active site Then the nucleophilic Mo-O group attacks the π-allyl cation
and transforms it into σ-allylic alkoxide This unsaturated oxygenated intermediate loses
another H atom in a subsequent redox step and it is transformed into acrolein [12]
It was claimed that
bull The reaction steps are sequential ones not simultaneous concerted steps However
Bettahar et al pointed out that the mechanism may also occur through a SN2 type
mechanism by nucleophilic attack of the O2- anion to the C=C bond concerted with
hydride abstraction from the CH3 group [12]
bull The reaction occurs on a specific ensemble BiMo-site there is no movement
desorptionre-adsorption of the intermediate species
bull The intermediates that appear after the rate determining step are transformed
instantly into other intermediates or desorbed (the surface coverage of adspecies
produced after the rate determining step is negligible)
bull Gaseous O2 dissociates rapidly and re-oxidizes the vacancy without forming
adsorbed oxygen species [3]
The theoretical study on the propylene oxidation mechanism over Bi-Mo catalysts carried
out by Jang et al supported the experimental observations [13] In order to determine the
possible reaction routes the thermodynamic quantities such as C-H bond dissociation
enthalpies and free enthalpies were calculated using the density functional theory (DFT)
The geometry of each considered structure was optimized The vibrational frequencies
were calculated from the Hessian matrices and used for calculation of zero-point energies
and thermodynamic quantities (enthalpy and free enthalpy) of the reaction The
calculations of C-H bond dissociation enthalpies and free enthalpies revealed that the
weakest bond in the propylene molecule is the methylene (Cα-Hα) bond (∆G=+2883
7
kJmol) In order to determine the olefin activating site the α-hydrogen atom abstracting
ability of both Mo3O9 and Bi4O6 clusters was investigated All of the O-atoms in the
Bi4O6 structure are equivalent however in Mo3O9 cluster there are two types of O atoms
bridging (Mo-O-Mo) and terminal ones (M=O) The free enthalpy of Cα-Hα activation on
the two different Mo sites was calculated to be ∆G=+1791 kJmol and ∆G=+1134
kJmol respectively depending on whether the abstracted H-atom is linked to the
terminal oxo-group (M=O) or to the bridging oxygen atom (Mo-O-Mo) respectively
Therefore the bond activation by the terminal M=O group is thermodynamically favored
This is in accordance with the conclusions derived from the experimental observations
However in both cases the H-atom abstraction step is much too endothermic The C-H
bond cleavage on the Bi3+ site is even more endothermic probably because the linking of
hydrogen atom to the bridging O-atom leads to Bi-O cleavage and the resulting structure
is not favorable In turn the dissociative chemisorption of O2 oxidizes the Bi3+ site to Bi5+
(Reaction 121) on which the hydrogen atom abstraction is more favorable (Reaction
122)
[ ] )221 (Re 510
)121 (Re 4154 2
1
22746374
74264
actionmolkJGCHCHCHHOBiHCOBi
actionmolkJGOBiOOBi
+=∆minus=+rarr+
+=∆rarr+
minus
The dissociative chemisorption of O2 was found to be enhanced by the presence of
Fe2+Fe3+ redox couple This is the explanation of the outstanding performance of Mo-Bi-
Co-Fe-O catalyst on which 90 conversion was attained compared to only 20
conversion on binary bismuth-molybdates
Furthermore the calculations revealed that
bull the allyl species is coordinated preferably to the Mo=O group
bull the oxygen insertion occurs at the Mo=O group to which the allyl species
is coordinated
bull the second H-atom abstraction occurs at the adjacent Mo=O group and
subsequently the acrolein formed is desorbed
8
bull after the desorption of the water molecule the reduced molybdenum site is
re-oxidized by O2 in an exothermic step
In summary the olefin activation was suggested to occur on the Bi-site while the further
chemical transformations occur on the Mo-sites
122 Oxidative dehydrogenation of propane
Chen et al carried out a kinetic analysis and isotopic tracer studies in order to identify the
elementary steps in the ODH of propane [14 15] Three kinds of ZrO2 supported MoOx
catalysts were used with different MoO3 loadings and thermal pretreatment conditions
(Table 121)
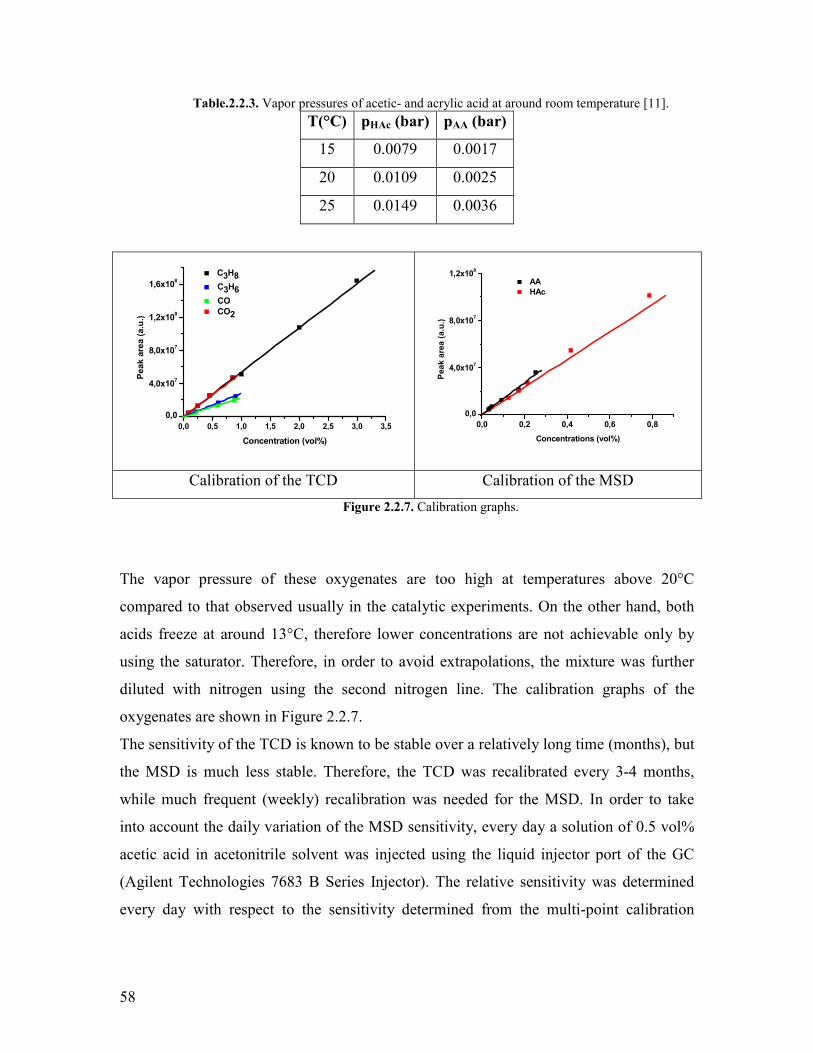
Table 121 The characteristics of catalysts studied in [14 ]
catalyst MoO3 loading
(wt )
temperature of the
thermal treatment (K)
structure of the
Mo-species
MoOxZrO2 11 773 MoOx oligomers
MoO3ZrO2 37 673 bulk MoO3
ZrMo2O8ZrO2 37 873 bulk ZrMo2O8
The catalytic tests were carried out in a quartz micro-reactor using small amount of
catalyst (0020-0100 g) Varying the flow rate the conversions were held at low values
below 2 with respect to propane and 20 with respect to O2 The chemical and isotopic
composition of products was analyzed using a GC-MS equipment It was found that
propylene is the most abundant product The rate of propylene combustion was found to
be 80 times higher than the rate of propane combustion The rate law of propane
oxidative dehydrogenation was found to be the same for all three catalysts This fact
suggested a similar mechanism A first order kinetics with respect to propane and zeroth
order with respect to oxygen was observed when steam was not present in the initial gas
mixture The presence of steam inhibited the propylene production Based on the
9
observations the following mechanism for propane ODH over the ZrO2 supported MoOx
catalysts was proposed
bull The first step (Reaction 123) is the rapid non-dissociative adsorption of
propane by interaction with lattice oxygen atoms (OL)
bull The second step (Reaction 124) is the C-H bond activation by H-atom
abstraction from the adsorbed propane using a neighboring OL A mixture
of C3H8 and C3D8 underwent oxidative dehydrogenation without forming
C3H8-xDx mixed isotopomers suggesting that the steps involving C-H bond
activation are irreversible
bull In the third step (Reaction 125) a hydrogen atom is removed from the
methyl group propylene and a surface hydroxyl group is formed
bull Two neighboring surface hydroxyl groups are recombining in the fourth
step (Reaction 126) water is desorbed and a vacancy is formed
bull The reoxidation of two neighboring vacancies by an oxygen molecule
(Reaction 127) was suggested to close the catalytic cycle
)721 Re(
)621 Re(
)521 Re(
)421 (Re
)321 (Re
)(2
)(2)()(
)()(63)(73
)()(73)(83
)(83)(83
actionOOO
actionOOHOHOH
actionOHHCOHC
actionOHOHCOOHC
actionOHCOHC
LLgas
Lgasadsads
adsgasads
adsadsLads
adsLgas
+rarrloz+loz+
loz++hArr+
+rarr
+rarr+
hArr+
Reactions of 18O2C3H8 on supported Mo16Ox species lead to the preferential initial
appearance of lattice 16O atoms in H2O CO and CO2 products indicating that the lattice
oxygen is required for C-H bond activation and for the ultimate oxidation of the adsorbed
products The kinetic isotopic effect of CH3CD2CH3 with respect to CH3CH2CH3 is 17
which is slightly smaller than the value of 23 obtained when using CD3CD2CD3 and
CH3CH2CH3 This finding was interpreted as both methyl and methylene groups can be
involved in the rate determining step required for propane activation
10
Based on the inhibitory effect of steam on propylene production it was assumed that the
recombination of the two OH-groups (reaction step126) is reversible The isotopic tracer
study supported this assumption as H-D exchange occurs readily between C3H6 and D2O
or C3D6 and H2O suggesting that OH recombination steps are reversible and quasi-
equilibrated
When a mixture of 18O and 16O was used as oxidant the 18O16O mixed isotopomer was
not detected in the gas phase suggesting an irreversible O2 dissociation step for the
reoxidation of the reduced active site However it is notable that the reoxidation of the
reduced site can not occur in a single step because it would require a four electron
transfer from two reduced centers Moreover statistically it is not very probable that
there are two reduced centers (vacancies) within the bond length of the oxygen molecule
Certainly the electron transfer and breaking of the O-O bond should occur in consecutive
steps
Kinetic and isotopic studies of propane ODH over ZrO2 supported VOx catalysts lead to
the same observations described above [14-16] First order kinetics with respect to C3H8
was found on both the supported and bulk catalysts when steam was not present in the
initial gas mixture The presence of water clearly inhibited the propane ODH and
changed the reaction order with respect to propane and oxygen Without H2O in the
initial gas mixture zero order kinetics was observed with respect to O2 In presence of
steam the rate of propylene formation was reduced considerably (by about 30) and the
partial reaction order of O2 was found to be greater than zero in this case The elementary
steps were considered to be identical with those for the ODH of propane over ZrO2
supported MoOx catalyst In this case the lattice oxygen OL was designated for V=O or
V-O-V structures OH(ads) stands for V-O-H terminal hydroxyl group while the vacancy
(loz) corresponding the reduced redox site (V4+ or V3+) [16] Kinetic isotopic effect
measurements demonstrated that the methylene C-H group is activated first
Jibril studied the kinetics of ODH of propane on alumina supported metal-oxides rare
earth metal oxides and metal phosphates [17] The temperature dependence of propane
conversion was investigated activation energies (EA) and logarithm of pre-exponential
11
factors (lnA) were evaluated A compensation effect was noted as significant linear
correlation was found between the EA and lnA within the three groups of studied
catalysts The existence of the compensation effect in reactions catalyzed by similar
catalysts suggests the same mechanism within the three groups of catalysts
Fu et al reported a detailed DFT study on the mechanism of propane activation over
molybdenum oxide catalyst [18] The Mo3O9 cluster was chosen as a model for the
catalyst Two basis sets (6-31G and 6-31G) were tested for geometry optimization
No significant changes were found between the modeled geometries 6 possible ways of
C-H bond activation were considered
bull two kinds of 2+2 pathways which involve the homolytic dissociation of
the C-H bond at a Mo=O group leading to carbide or hydride
bull 3+2 (homolytic dissociation on a O=Mo=O group) and 5+2 (homolytic
dissociation on a O=Mo-O-Mo=O group) paths both of them lead to
hydroxyl- and alkoxy species directly
bull direct O atom insertion by a M=O group in the C-H bond giving an
alcohol
bull the 2+4 pathway involves linking of both the methyl and methylene C-H
bonds simultaneously to the M=O group
bull hydrogen atom abstraction that may occur theoretically either from methyl
or methylene group leading to n-propyl or iso-propyl radical
Figure 123 Some examples of the possible transitional states of hydrogen atom abstraction according
to[18] The numbers on the figures correspond to the calculated bond lengths
12
17 different transitional states were taken into account The free enthalpy of activation for
each case (∆G) was estimated at 688 K and the rate constants were evaluated according
to the Eyring equation In order to compare directly the calculated and the experimental
findings of the isotopic tracer studies reported by Chen et al [15] the kinetic isotopic
effect for each considered reaction pathway was also estimated using the transitional state
theory
The hydrogen abstraction pathways were considered to be one electron processes leading
to radicals The energy barriers for these pathways were found to be the lowest among the
considered ones This indicated that the probability of hydrogen atom abstraction is much
higher than the occurrence of other two-electron processes The propane molecule may
approach the Mo=O group in syn or anti position (Figure 123) Only one of the terminal
Mo=O group is involved in the process the another one is a spectator group
The calculated activation enthalpy values revealed that the anti-modes are favored
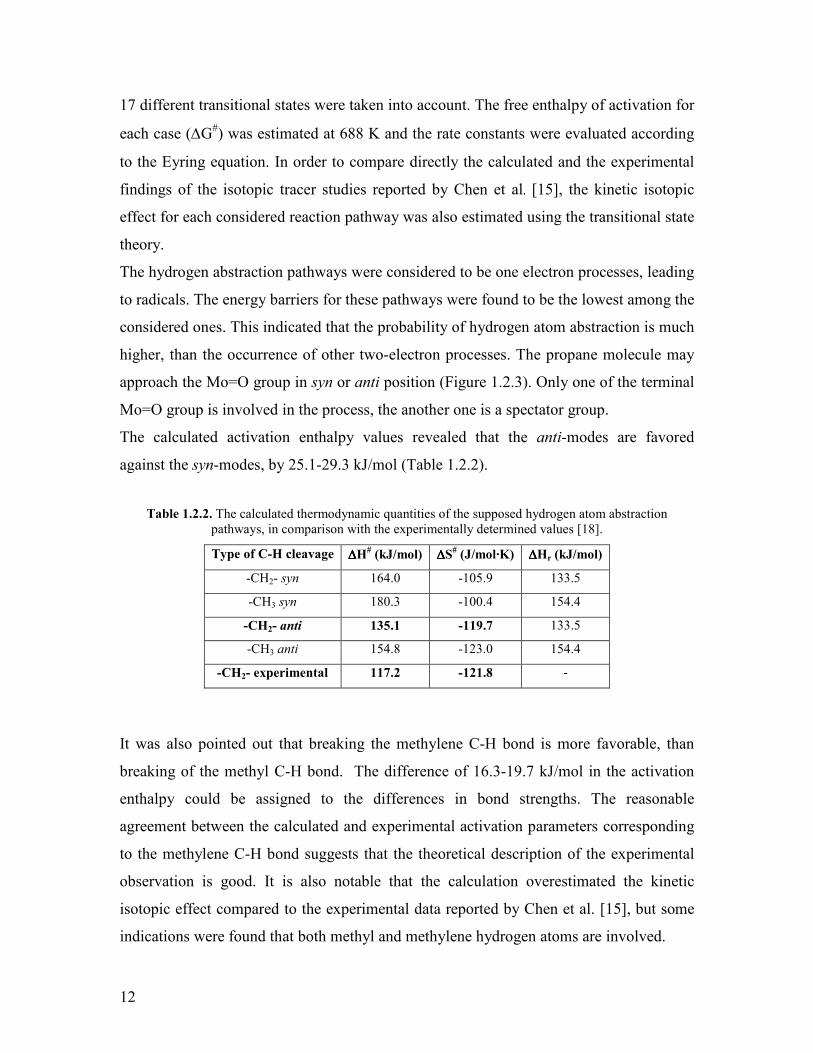
against the syn-modes by 251-293 kJmol (Table 122)
Table 122 The calculated thermodynamic quantities of the supposed hydrogen atom abstraction pathways in comparison with the experimentally determined values [18]
Type of C-H cleavage ∆∆∆∆H (kJmol) ∆∆∆∆S
(JmolmiddotK) ∆∆∆∆Hr (kJmol)
-CH2- syn 1640 -1059 1335
-CH3 syn 1803 -1004 1544
-CH2- anti 1351 -1197 1335
-CH3 anti 1548 -1230 1544
-CH2- experimental 1172 -1218 -
It was also pointed out that breaking the methylene C-H bond is more favorable than
breaking of the methyl C-H bond The difference of 163-197 kJmol in the activation
enthalpy could be assigned to the differences in bond strengths The reasonable
agreement between the calculated and experimental activation parameters corresponding
to the methylene C-H bond suggests that the theoretical description of the experimental
observation is good It is also notable that the calculation overestimated the kinetic
isotopic effect compared to the experimental data reported by Chen et al [15] but some
indications were found that both methyl and methylene hydrogen atoms are involved
13
123 The direct oxidation of propane to acrylic acid
1231 Generalities
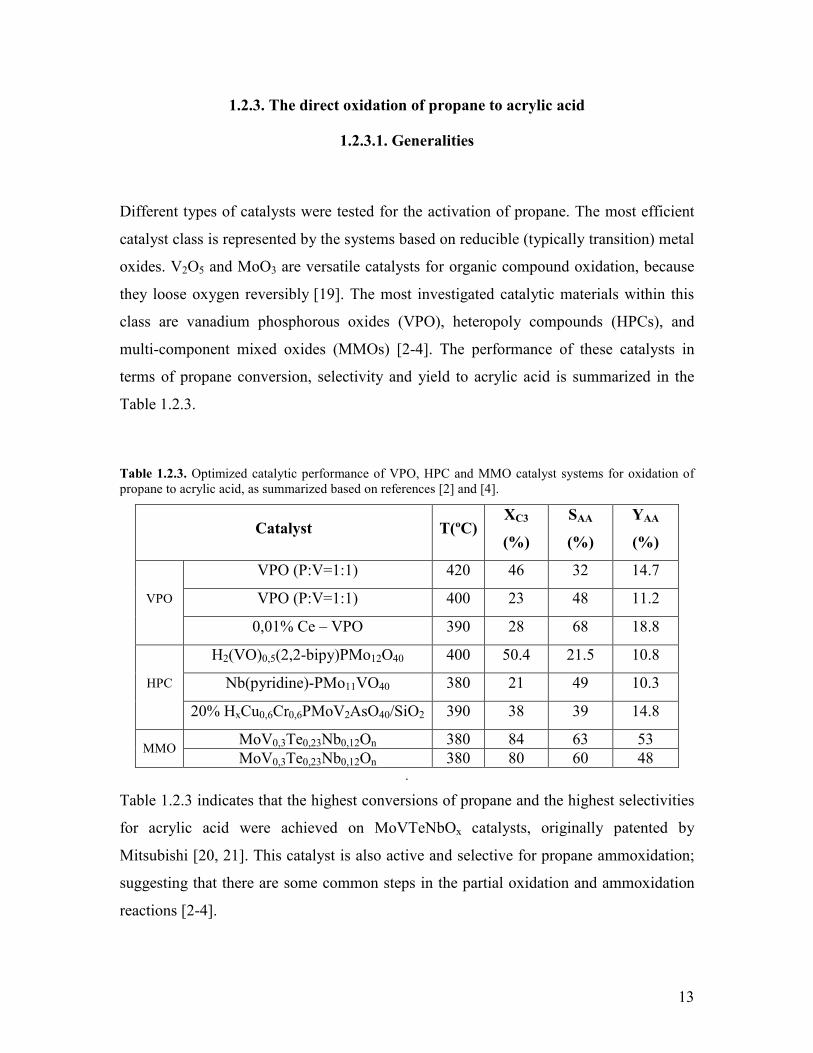
Different types of catalysts were tested for the activation of propane The most efficient
catalyst class is represented by the systems based on reducible (typically transition) metal
oxides V2O5 and MoO3 are versatile catalysts for organic compound oxidation because
they loose oxygen reversibly [19] The most investigated catalytic materials within this
class are vanadium phosphorous oxides (VPO) heteropoly compounds (HPCs) and
multi-component mixed oxides (MMOs) [2-4] The performance of these catalysts in
terms of propane conversion selectivity and yield to acrylic acid is summarized in the
Table 123
Table 123 Optimized catalytic performance of VPO HPC and MMO catalyst systems for oxidation of propane to acrylic acid as summarized based on references [2] and [4]
Catalyst T(ordmC) XC3
()
SAA
()
YAA
()
VPO (PV=11) 420 46 32 147
VPO (PV=11) 400 23 48 112 VPO
001 Ce ndash VPO 390 28 68 188
H2(VO)05(22-bipy)PMo12O40 400 504 215 108
Nb(pyridine)-PMo11VO40 380 21 49 103 HPC
20 HxCu06Cr06PMoV2AsO40SiO2 390 38 39 148
MoV03Te023Nb012On 380 84 63 53 MMO
MoV03Te023Nb012On 380 80 60 48
Table 123 indicates that the highest conversions of propane and the highest selectivities
for acrylic acid were achieved on MoVTeNbOx catalysts originally patented by
Mitsubishi [20 21] This catalyst is also active and selective for propane ammoxidation
suggesting that there are some common steps in the partial oxidation and ammoxidation
reactions [2-4]
14
1232 Identification of propane selective oxidation pathways
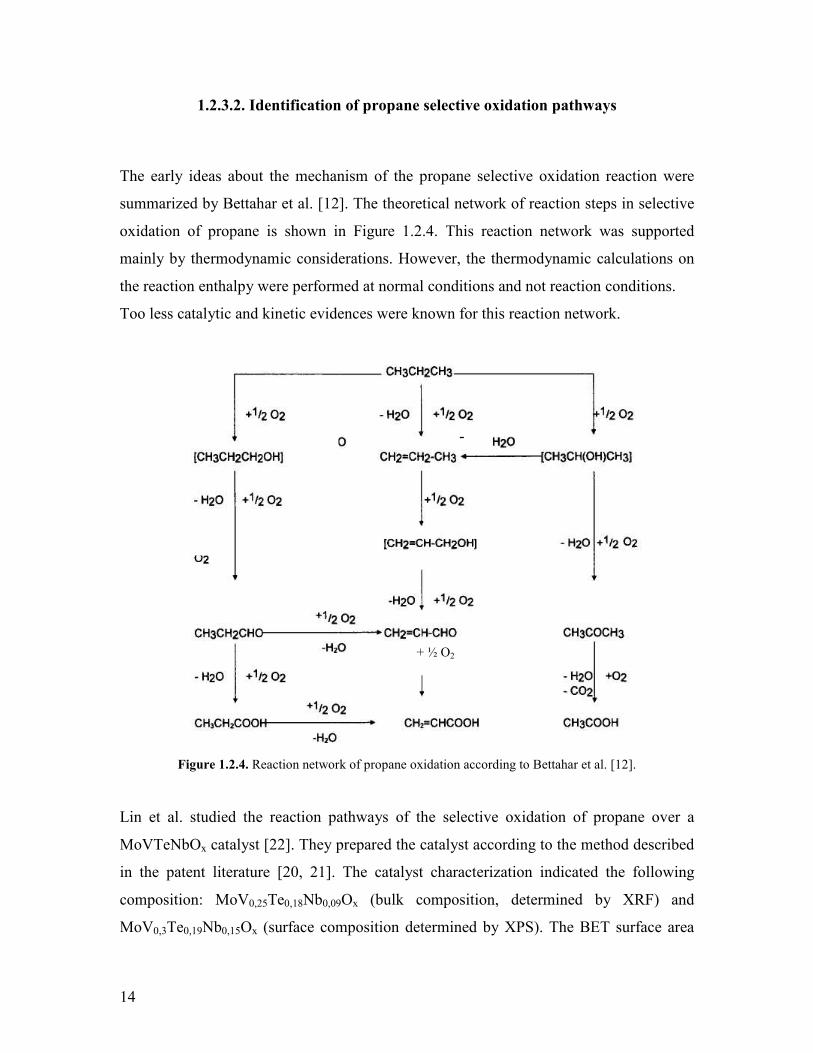
The early ideas about the mechanism of the propane selective oxidation reaction were
summarized by Bettahar et al [12] The theoretical network of reaction steps in selective
oxidation of propane is shown in Figure 124 This reaction network was supported
mainly by thermodynamic considerations However the thermodynamic calculations on
the reaction enthalpy were performed at normal conditions and not reaction conditions
Too less catalytic and kinetic evidences were known for this reaction network
Figure 124 Reaction network of propane oxidation according to Bettahar et al [12]
Lin et al studied the reaction pathways of the selective oxidation of propane over a
MoVTeNbOx catalyst [22] They prepared the catalyst according to the method described
in the patent literature [20 21] The catalyst characterization indicated the following
composition MoV025Te018Nb009Ox (bulk composition determined by XRF) and
MoV03Te019Nb015Ox (surface composition determined by XPS) The BET surface area
-
+ frac12 O2
15
was 36 m2g while the mean pore diameter was found to be 180 Aring The SEM images
revealed primary sub-micron particles and their aggregates XRD peaks were found at
2Θ=224ordm 286ordm 366ordm 454ordm and 504ordm respectively which are in accordance with the
peaks reported by Ushikubo [20 21] The catalytic test was carried out at the reaction
temperature of 391ordmC with initial feed composition C3H8 air H2O = 3 50 47 vol at
GHSV=1200 h-1 Under these conditions 18 propane conversion was attained the
selectivity for acrylic acid was 26 and COx acetic acid and acetone were produced
with 54 8 and 1 selectivity respectively The presence of propylene and acrolein in the
outflow gas mixture was not observed
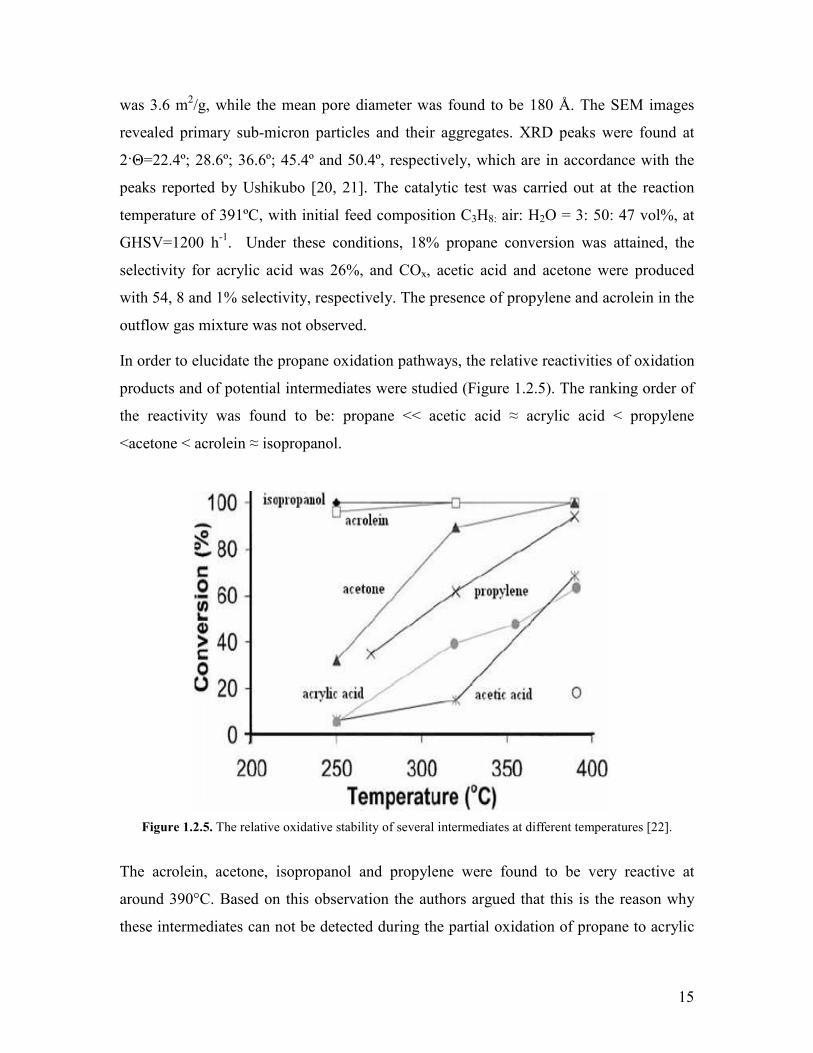
In order to elucidate the propane oxidation pathways the relative reactivities of oxidation
products and of potential intermediates were studied (Figure 125) The ranking order of
the reactivity was found to be propane ltlt acetic acid asymp acrylic acid lt propylene
ltacetone lt acrolein asymp isopropanol
Figure 125 The relative oxidative stability of several intermediates at different temperatures [22]
The acrolein acetone isopropanol and propylene were found to be very reactive at
around 390degC Based on this observation the authors argued that this is the reason why
these intermediates can not be detected during the partial oxidation of propane to acrylic
16
acid It is to be noted that the real reactivity of the isopropanol acrolein and acetone can
not be observed from the above plot because the conversions reach 100 at around
390degC
The product distribution upon oxidation of the above compounds was the following The
acetone oxidation over the catalyst produced acetic acid at lower temperatures and COx at
higher temperatures The oxidation of acrolein produced acrylic acid and COx At higher
temperatures a small amount of acetic acid was also detected The acetic acid was
believed to be a product of the oxidative degradation of acrylic acid
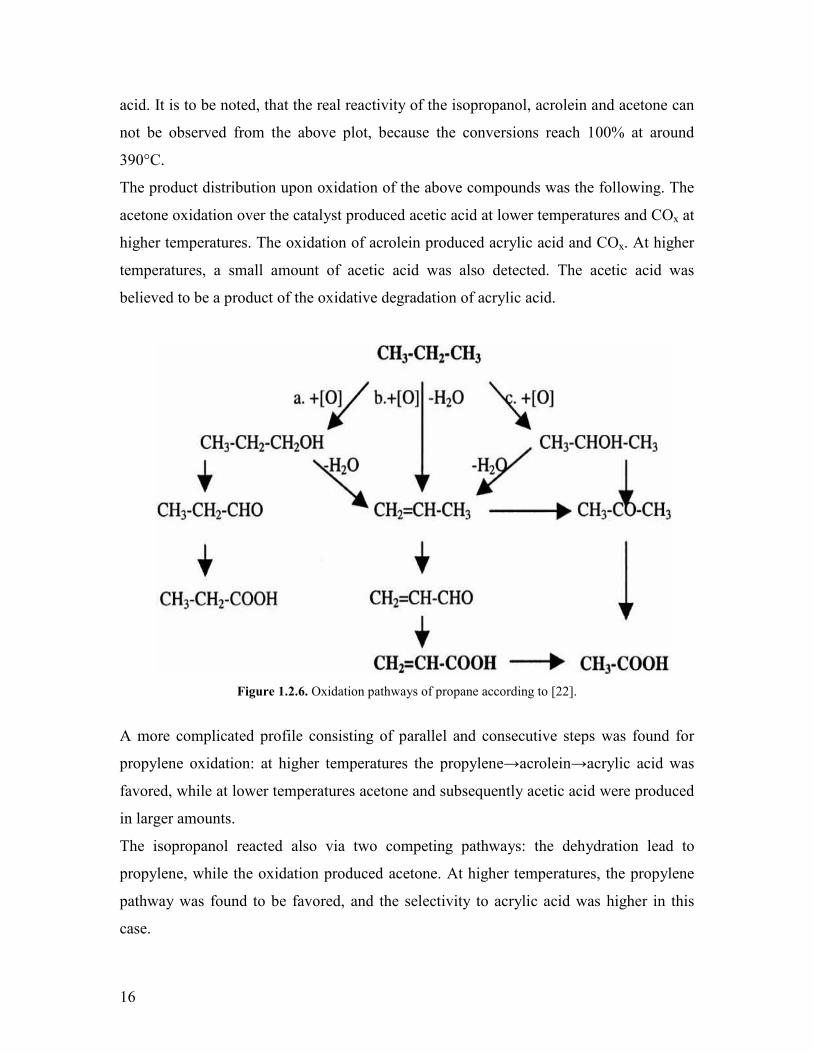
Figure 126 Oxidation pathways of propane according to [22]
A more complicated profile consisting of parallel and consecutive steps was found for
propylene oxidation at higher temperatures the propylenerarracroleinrarracrylic acid was
favored while at lower temperatures acetone and subsequently acetic acid were produced
in larger amounts
The isopropanol reacted also via two competing pathways the dehydration lead to
propylene while the oxidation produced acetone At higher temperatures the propylene
pathway was found to be favored and the selectivity to acrylic acid was higher in this
case
17
The product of oxidative degradation of acrylic acid was found to be acetic acid and COx
as also shown by Vitry et al [23] During the oxidation of acetic acid only carbon oxides
were detected
Based on these observations a reaction scheme of propane oxidation was proposed
(Figure 126) The pathways (a) and (c) leading to n-propanol and isopropanol are in
conflict with the experimental and theoretical findings [12-16] These alcohols were
believed to undergo dehydration to propylene and oxidation to the corresponding
carbonyl compounds and carboxylic acids respectively according to the above scheme
During the catalytic oxidation of propane however n-propanol propionaldehyde and
propionic acid were not detected at all Therefore path (a) was regarded as not to be
probable Path (b) is a direct oxidative dehydrogenation of propane to propylene
followed by oxidation to acrylic acid through acrolein The latter pathway was regarded
to be more likely because the product distribution patterns of propane and propylene
oxidation are similar while that of isopropanol are significantly different
Similar reactivity studies were undertaken by Luo et al including the oxidation of n-
propanol and propanal as potential intermediates [24] Basically the same reaction
pathway was proposed as the one shown above (Figure 126)
Based on gas phase analysis at different residence times the reaction sequence
propanerarrpropenerarracroleinrarracrylic acid has also been proposed on MoVSbNbOx
catalysts [25] The acetic acid obtained on these catalysts was assumed to be formed via
propenerarracetone The main function of water on MoVSbNbOx catalysts was assigned to
its role in preserving the metals in a partially reduced oxidation state [26]
Kinetic studies on the partial oxidation of propane to acrylic acid over egg-shell type
MoV033Te022Nb011Ox catalysts containing 10 to 20 active mass on spherical steatite
have been performed by Balcells et al and Griszligtede [27 28] From the characteristic
shapes of the selectivities vs propane conversion plots propene was considered to be the
only primary product which is in agreement with the previous studies The low
propylene concentrations observed in the gas phase was regarded to be the indication that
18
the oxidative dehydrogenation of propane is the rate determining step A simple system
of differential equations containing first order rate expressions with respect to the organic
compounds was set up However the carbon monoxide carbon dioxide and acetic acid
were considered as three carbon atom containing pseudo-products and merged under the
term ldquobyproductsrdquo Although the calculated results were in a good agreement with the
experimental data the model proposed by Griszligtede seems to be too abstract because it
assumes that the three byproducts are formed in a coupled reaction step
The reaction scheme of propene on the same catalyst was found to be more complex
including acrolein acetone and acetic acid as detectable intermediatesby-products The
model proposed for propylene oxidation was based the same assumption as the model
proposed for propane oxidation The influence of temperature oxygen concentration and
water content on propane oxidation was studied Only a small influence of the oxygen
concentration was observed Concerning the reactor operation a steam content of about
20-30 vol- was recommended
The reaction network of selective oxidation of propene on mixed oxide catalysts
(MoVNbO MoVSbO and MoVTeNbO) was also investigated by Concepcioacuten et al [29]
FTIR measurements of propylene adsorptiondesorption over these catalysts suggested
three different intermediates
bull a symmetric π-allylic species which is formed if α-hydrogen abstraction sites
(ie Sb3+ or Te4+) are present The π-allylic species represent the intermediate in
the selective oxidation of propylene to acrylic acid by a redox mechanism
bull an enolic-type intermediate in the hydrationoxidation of the olefin to form
acetone and acetic acid on Broslashnsted acid sites
bull a π-bonded propylene species interacting with Lewis acid sites which is regarded
as a precursor in the deep oxidation of propylene
Fushimi et al has carried out catalytic studies on MoV03Te023Nb017Ox over a wide range
of temperatures feed compositions and contact times [30] Steady-state (space velocity
19
and temperature variation) and non steady-state experiments (pulse-response temporal
analysis of the products) were carried out The temperature variation experiment was
done by increasing the reaction temperature up to 400degC followed by a controlled
cooling In this temperature programmed reaction complete oxygen conversion was
observed at around 400degC More important a hysteresis phenomenon of the product
yields was observed during the cooling when using stoichiometric and reducing feed
compositions The hysteresis phenomenon was accounted for the effect of nonlinearity of
the kinetics and adsorption-desorption of the intermediates and products However no
hysteresis was observed when using net oxidizing feed The apparent activation energies
of acrylic acid formation were determined to be 73 and 186 kJmol depending on feed
composition and contact time respectively
Based on transient experiments a complicated reaction network was proposed The main
reaction pathway consists of propanerarrpropylenerarracroleinrarracrylic acidrarrCO+CO2
steps The TAP experiments indicated that water reacts with the adsorbed acrolein to
form acrylic acid The unselective pathways corresponding to total oxidation of
propylene allylic intermediate and acrylic acid were proposed for the production of CO
CO2 and acetic acid Since no differentiation was made between the pathways leading to
these products the model has the same restrictions like the one proposed by Griszligtede [27
28]
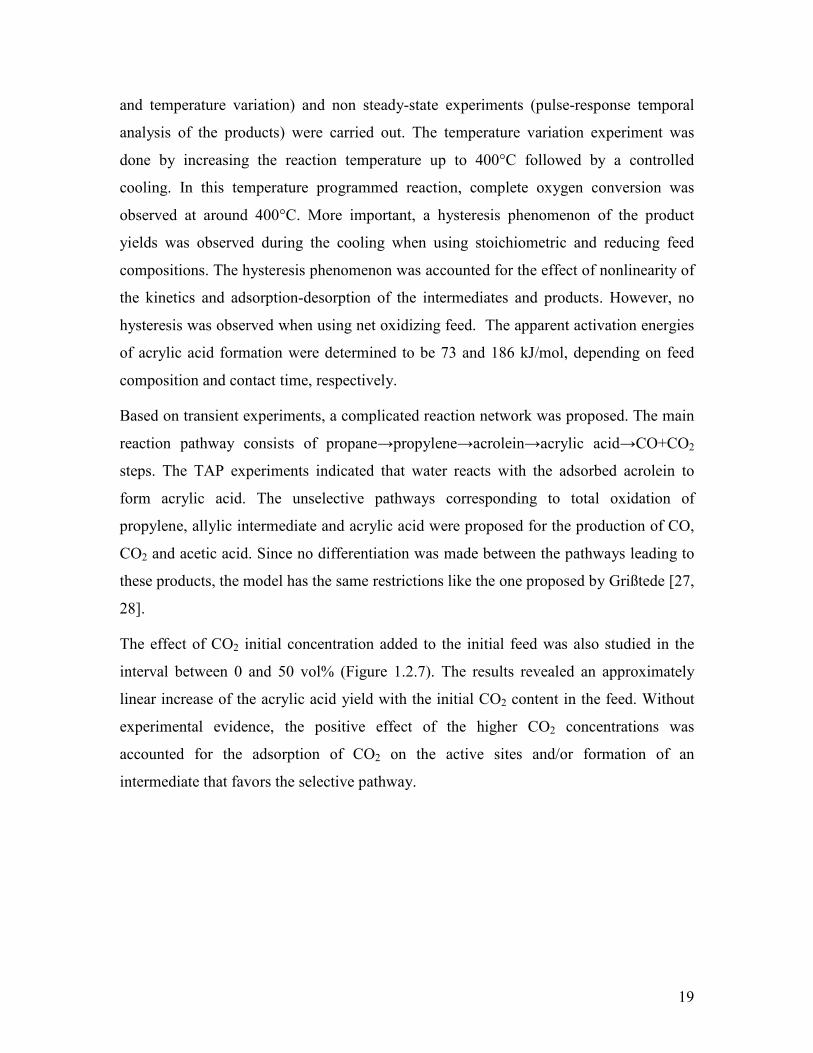
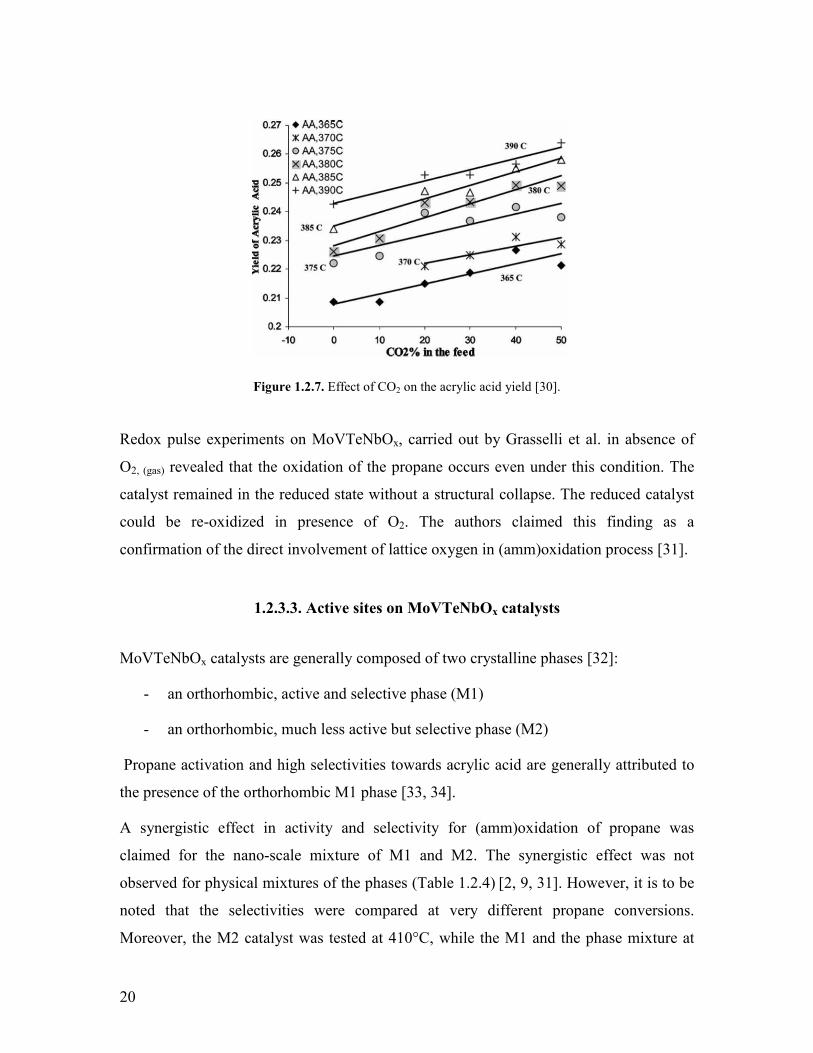
The effect of CO2 initial concentration added to the initial feed was also studied in the
interval between 0 and 50 vol (Figure 127) The results revealed an approximately
linear increase of the acrylic acid yield with the initial CO2 content in the feed Without
experimental evidence the positive effect of the higher CO2 concentrations was
accounted for the adsorption of CO2 on the active sites andor formation of an
intermediate that favors the selective pathway
20
Figure 127 Effect of CO2 on the acrylic acid yield [30]
Redox pulse experiments on MoVTeNbOx carried out by Grasselli et al in absence of
O2 (gas) revealed that the oxidation of the propane occurs even under this condition The
catalyst remained in the reduced state without a structural collapse The reduced catalyst
could be re-oxidized in presence of O2 The authors claimed this finding as a
confirmation of the direct involvement of lattice oxygen in (amm)oxidation process [31]
1233 Active sites on MoVTeNbOx catalysts
MoVTeNbOx catalysts are generally composed of two crystalline phases [32]
- an orthorhombic active and selective phase (M1)
- an orthorhombic much less active but selective phase (M2)
Propane activation and high selectivities towards acrylic acid are generally attributed to
the presence of the orthorhombic M1 phase [33 34]
A synergistic effect in activity and selectivity for (amm)oxidation of propane was
claimed for the nano-scale mixture of M1 and M2 The synergistic effect was not
observed for physical mixtures of the phases (Table 124) [2 9 31] However it is to be
noted that the selectivities were compared at very different propane conversions
Moreover the M2 catalyst was tested at 410degC while the M1 and the phase mixture at
21
380degC It is well known that the selectivity depends on the conversion of propane
Therefore the conclusions concerning the synergistic effect are questionable
Table 124 Catalytic effect of the individual phases of the mixture in the propane partial oxidation [2]
Catalyst T(ordmC) XC3 () SAA ()
M1 380 279 52
M2 410 06 22
M1+M2 380 349 53
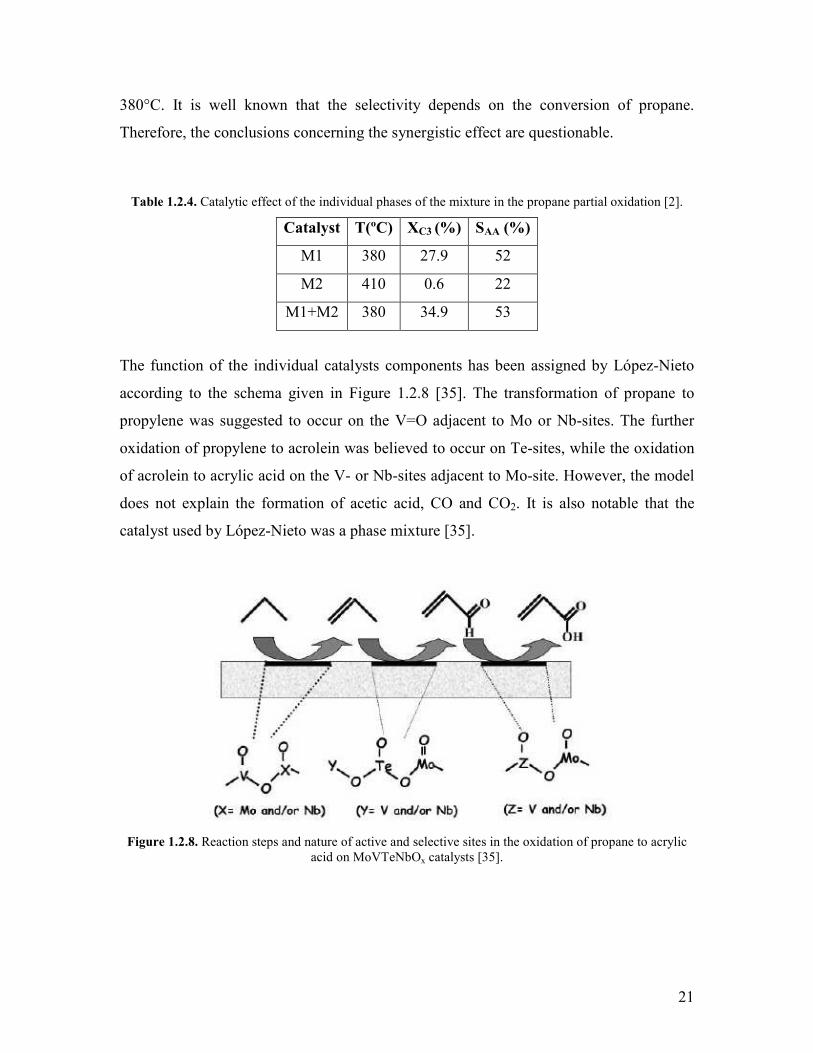
The function of the individual catalysts components has been assigned by Loacutepez-Nieto
according to the schema given in Figure 128 [35] The transformation of propane to
propylene was suggested to occur on the V=O adjacent to Mo or Nb-sites The further
oxidation of propylene to acrolein was believed to occur on Te-sites while the oxidation
of acrolein to acrylic acid on the V- or Nb-sites adjacent to Mo-site However the model
does not explain the formation of acetic acid CO and CO2 It is also notable that the
catalyst used by Loacutepez-Nieto was a phase mixture [35]
Figure 128 Reaction steps and nature of active and selective sites in the oxidation of propane to acrylic acid on MoVTeNbOx catalysts [35]
22
Three single-phase M1 catalysts having different elemental compositions MoVOx
MoVTeOx and MoVTeNbOx have been prepared hydrothermally by Ueda et al [34] On
the basis of the catalytic results in propane oxidation it was concluded that
1 crystallinity seems to be necessary for selective oxidation of propane to acrylic
acid
2 the propane molecule is oxidized to propene over surface active sites composed of
octahedrally coordinated Mo and V units located in the unique heptagonal
arrangement of the M1 structure
3 when Te is incorporated into the network the resulting catalyst becomes selective
for the formation of acrylic acid without changing intrinsic oxidation activity of
Mo and V sites
4 Nb prevents the over-oxidation of acrylic acid by its site isolation effect
Without experimental evidence the propane activating property of the M1 phase was
assigned by Grasselli et al to V5+ centers which favor the radical-type H-atom
abstraction leading to a secondary propyl-radical [9 31] The second H-atom abstraction
occurs on the Te4+-center next to the V5+-center The Nb5+-center stabilizes the primary
active centers and separates them spatially from each other The formed olefin
coordinates to the Mo6+-center where the O or N atom is inserted via another H-atom
abstraction on the adjacent Te4+-center of the M2 phase Therefore the M2 phase is
considered to contribute to the selective olefin conversion toward the desired product
Because V5+ centers are not available in M2 phase it cannot activate propane On the
other hand the excellent performance of propylene conversion of the M2 phase is
accounted for the rather high number of α-H-atom abstracting Te4+-sites However the
presence of active centers is not sufficient the catalytic performance depends in a crucial
manner on the surface geometry of the active sites and the redox properties of the
catalyst
Guliants et al has studied the catalytic performance of a nano-crystalline Mo-V-O M1
phase [36] The original Mo-V-O was practically unselective in propane oxidation
however a significant improvement in selectivity was observed when Te- Nb- and Sb-
oxides were supported on the surface at sub-monolayer coverage Low-energy ion
23
scattering (LEIS) study of the submonolayer coverage indicated that Nb species were
preferentially located at the topmost surface while the subsurface Te- and Sb
concentrations declined gradually into the bulk The highest selectivity was observed
when both Nb and Te (or Sb) oxide species were present at the surface In general the
selectivity was comparable to those observed on bulk MoVMOx catalysts (M=Te Nb or
Sb)
Table 125 Activation energy of propane partial oxidation on different surface-promoted catalysts [36]
Promoter EA (kJmol) Promoter EA (kJmol)
none 74 Nb 72
Te 125 Nb+Te 108
Sb 62 Nb+Sb 79
The effect of temperature and space velocity was studied on the conversion selectivity
and yield The apparent activation energies of propane conversion were determined
(Table 125) Interestingly only the inclusion of Sb led to a descrease while promotion
by Te led to a net increase in the apparent activation energy The niobium barely had any
effect on the activation energy The inclusion of Nb besides Te led to a catalyst on which
the apparent activation energy of propane was still considerably higher than for the
unpromoted and the Nb-modified catalyst Even though Nb and Sb promotion alone
decreased slightly the activation energy the simultaneous presence of Nb and Sb led to a
slight increase of the activation energy
Zhu et al modified selectively the V5+V4+ ratio in the MoVTeO catalyst by adjusting the
acidity of the precursor solution [37] The solutions were evaporated and calcined at 873
K in N2 stream to obtain the catalyst XPS measurements suggested that the number of
surface V5+ were preferentially enhanced by addition of pH adjustors in the precursor
solution The high number of surface V5+ sites (5+V=O groups) was claimed to be
responsible for propane activation while the bulk V4+ was suggested to play a significant
role in promoting electron- and oxygen atom transfer during the reaction The authors
24
claimed that the bulk V5+V4+ ratio is also important as higher number of V4+ sites
facilitate the total oxidation while less V4+ sites resulted in a high selectivity to acrolein
1234 The effect of acid-base character of the catalyst
Besides the redox properties of the transition metal oxide catalysts the aciditybasicity
also plays a significant role in the oxidation reactions The ideal surface structure of an
oxide as generated by cutting the crystal at a specific crystal plane is composed by an
array of cations (Lewis acid site) and lattice oxygen anions (basic site) The acidic
character of the cations and the basicity of lattice oxygen depend on the ionic character of
the metal-oxygen bonds [38]
The metal-oxygen bond in oxides of transitional metals with high oxidation state (Mo6+
V5+) is rather covalent thus they are acidic oxides On the other hand the same elements
in the lower oxidation state have more ionic character and they behave as basic oxides
The acid-base characteristics of the oxide have a major effect on the activation of the
reactants the relative rates of the competitive pathways and the rate of
adsorptiondesorption of the reactants and products The relatively weak Lewis acidity is
a key parameter that determines the oxygenate formation The Broslashnsted acidity is
important in propane activation however strong Broslashnsted acidity favors the hydration of
propylene to isopropanol which may be oxidized to acetone and acetic acid Controlling
the LewisBroslashnsted acidity of the catalyst is also connected with the effect of steam on
the catalyst activity In general it is stated that by blocking Broslashnsted acid sites with water
or ammonia the over-oxidation is reduced and favors acrylic acid formation [2 3]
Many attempts to correlate the catalyst activity with the redox and acid-base properties
were reported in the literature Due to the fact that that the redox and acid-base
characteristics are not independent Novakova et al and Centi pointed out that these
correlations are not generally valid [2 3] A careful study of these characteristics on the
individual reaction steps rather than on the global behavior of the whole reacting system
was recommended [3]
25
1235 The effect of steam
The introduction of steam in the feed mixture inhibits the oxidative dehydrogenation of
propane over ZrO2 supported MoOx and VOx catalysts [14-16]
In contrast to that the presence of steam in the feed was noted to be essential for the
formation of acrylic acid from propane over Mo and V based catalysts [26 27 28 39]
Novakova et al noted that the steam content affects on the kinetics of propane oxidation
over a phase mixture MoVNbSbOx catalyst [26] The rate of acrylic and acetic acid
formation increases strongly in the steam content interval between 0 and 20 vol and
the rates leveled off above 20 vol steam content It was also noted that the presence of
steam influences the apparent activation energy of propane consumption At a steam
content of 25 vol a value of 50 kJmol was determined while in dry feed the apparent
activation energy was found to be 68 kJmol It was observed that in absence of steam an
irreversible phase change occurs accompanied by deactivation of the catalyst upon
addition of steam after performing the experiment in dry feed neither the original phase
composition nor the initial catalytic activity was attained It was noted that the
deactivation was a relatively fast process which completed in ca 50 minutes
Griszligtede has carried out a kinetic study on the steam effect on propane oxidation over
MoV033Te025Nb017Ox catalyst deposited on steatite balls [27 28] It was found that in the
presence of 50 vol steam the rate constant of propane consumption increased by a
factor of 24 while the propylene further oxidation rate constant increased by a factor of
44 compared to the experiment performed in dry feed The selectivity to acrylic acid was
only 50 while the oxidative stability (ie the ratio between the formation and further
oxidation rate constants) of acrylic acid was found to be 13 in dry feed Upon introducing
50 vol steam in the feed the selectivity increased to 80 and the oxidative stability
was also improved to 32 Similarly to the results given by Novakova [26] the conversion
and selectivity increased in the steam concentration interval between 0 and 20 vol and
leveled off at concentrations higher than 20 vol The positive effect of the steam on the
productivity was accounted for the faster desorption rate of the product However no
experimental evidence was given for this assumption On the other hand as a second
26
possibility the modification of the phase composition in presence of steam was
highlighted This possibility was speculated based on the observation that the
pretreatment of the catalyst in the reactor using steam containing a gas mixture (50 vol
H2O and 50 vol N2 at 140degC for 24 hours) lead to a better performances (SAA=80)
compared to the experiment in which the reaction was started without pretreatment
When the catalyst was pretreated with a 10 vol steam containing mixture the highest
acrylic acid selectivity was found to be only 40 However the catalyst was not
characterized by XRD either before or after the pretreatment or catalytic experiment in
order to support the assumption concerning the phase change
Dubois et al patented a method for preparation of acrylic acid by selective oxidation of
propane over MoVTe(Sb)Nb(Ta)SiOx catalysts in fluidized bed without steam in the feed
[40] They noted that the presence of steam favored the formation of acetone acetic acid
and propanoic acid however the latter was produced in very small amounts (below 1)
The catalyst activity was not decreased after 24 h on stream in contrast to the
deactivation phenomenon noted by Novakova et al The conversion was below 30 in
all cases while the highest selectivity toward acrylic acid was about 40
Landi et al studied the effect of water on propane oxidation over (VO)2P2O7 catalyst [41-
43] The catalytic testing was started using dry feed at 430degC the acrylic acid selectivity
was very low When stable catalytic operation was reached the temperature was
decreased to 400degC and 20 vol steam was introduced in the feed The propane
conversion decreased in presence of steam while the acrylic acid selectivity increased
compared to the steam free feed Stable operation in steam containing feed was reached
in about 40 hours time on stream Steady-state and dynamic experiments carried out at
different steam contents revealed that the activity and selectivity changed reversibly with
the steam content but stable operation was reached in 6-12 hours time on stream The
propane conversion decreased monotonically with the steam content while the maximum
acrylic acid selectivity was attained at 15 vol steam content
The characterization of the catalyst lead to the conclusion that the presence of steam
27
enhances the crystallinity promotes the disappearance of V5+ containing phase and
reduces the number and strength of surface acid sites
Based on the literature records the possible effect of steam can be summarized as
follows
Physical interaction of water with the catalyst
bull competitively adsorbs with C3H8 and intermediates on the active sites andor blocks
the Lewis acid sites or modifies the ratio of LewisBroslashnsted acidity [3 39 41-45]
bull enhances the desorption of oxygenates [28 39 46-50]
Chemical interaction of water with the catalyst
bull changes the oxidation statecomposition of the M1 MoVTeNbOx catalyst [51]
bull increases the number of Broslashnsted acid sites [46]
bull increases the number of surface hydroxyl groups [14 15 45 52]
bull induces phase change [26 52 53] enhances the crystallinity [41-43 53]
Chemical interaction of water with the adsorbed reaction intermediates
bull the water could act as both a nucleophilic and oxidizing reactant in the formation of
the acrylic acid from the acrolein [3 30]
bull in presence of water different reaction pathways are possible ie the propylene
intermediate may undergo hydration to 2-propanol on the acid sites followed by
oxidation to acetone and acetic acid [3 54]
1236 The effect of redox potential of gas phase and oxygen species
The redox potential of the gas mixture depends on the propaneoxygen ratio Due to the
stoichiometry of the propane to acrylic acid reaction the ratio of 12 is defined as
stoichiometric When the propaneoxygen ratio is smaller than 12 the gas mixture is
28
rather reducing Finally if this ratio is higher than 12 the feed is net oxidizing In the
literature various feed compositions were used from reducing (C3H8O2=6510) [33 34
36] stoichiometric [20 21 51] to strongly oxidizing (C3H8O2 ratio ranging from
08314 to 26974) [47 48] However only a few studies were concentrated on finding
out the effect the redox potential on the catalytic properties
Griszligtede has carried out a kinetic study on the effect of oxygen using the
MoV033Te025Nb017Ox catalyst Only oxidizing feed compositions were used (C3H8O2
equal to 26 29 and 220 vol respectively) [28] The concentration profiles
conversion and selectivities were found to be the same irrespectively on the oxygen
concentration From this observation it was argued that the reaction is 0th order with
respect to oxygen In connection to the steam effect it was also argued that the steam does
not enhance the reoxidation rate becausee of the 0th order kinetics involving the oxygen
Zheng et al studied the effect of oxygen concentration on propane oxidation over
MoV031Te023Nb012Ox catalyst [39] The C3H8O2 ratio was varied from 11 to 15
therefore reducing stoechiometric and net oxidizing feed compositions were used at a
space velocity of 1800 h-1 and 400degC The conversion was steadily increasing with the
oxygen concentration while the selectivity and consequently the yield passed through a
maximum at the C3H8O2 ratio of 13
The selective partial oxidation of alkanes to oxygenates and the oxidative
dehydrogenation reactions as well imply chemical reaction on saturated hydrocarbon
molecules and oxygen species The hydrocarbon molecules possess a closed shell
electronic structure therefore they are in a singlet state The oxygen species activate of
the C-H bonds or eventually the C-C bonds to form the desired product(s) and the COx
respectively The bonding and electronic structure of oxygen species are reviewed here
The oxygen atom has 8 electrons the electron configuration is the following
1s22s22px22py
12pz1 Upon molecule formation the atomic orbital of two oxygen atoms are
hybridized The oxygen molecule in its ground state has an open-shell electronic
structure There is one unpaired electron on each of the πx and πy degenerated
antibonding orbitals The electronic configuration of the oxygen molecule in the ground-
29
state is KK(σ2s)2(σlowast
2s)2(σ2pz)
2(π2px)2(π2py)
2(πlowast2px)
1(πlowast2py)
1 where K denotes the closed
molecular orbital formed by the 1s atomic orbitals
The presence of the unpaired electrons has two consequences (a) the gas phase oxygen in
the ground state is a triplet diradical noted with the term symbol of 3Σ-g
(b) the oxygen molecule is the only paramagnetic species among the diatomic gases with
even number of electrons
The bond order ndash defined as the half of the difference between the number of electrons in
the bonding orbitals and the numbers of electrons that occupy antibonding orbitals ndash is
equal to two [55 56]
Due to spin constraints no reaction happens between a singlet (eg hydrocarbon) and a
triplet species (eg molecular oxygen in ground state) This explains that there is no
reaction between the alkanes and oxygen at low temperatures and without a catalyst
However there are a number of excited or ionized oxygen species which are much more
reactive
Upon excitation of the ground state O2 by 9472 kJmol energy the spin of one of the
unpaired electron on the antibonding π orbital will be inverted leading to a singlet
species 1∆g However the electron configuration and the bond order of the 1∆g is the same
as in the case of the ground state oxygen molecule When the ground state oxygen
molecule is excited by 15785 kJmol the two unpaired electrons are getting paired on
one antibonding π orbital The resulting species is ldquothe other singletrdquo with the term
symbol of 1Σ+g and the same bond order with the first excited state 1∆g and the ground
state 3Σ-g species However the electronic configuration is different from the 1∆g and
3Σ-g
states KK(σ2s)2(σlowast
2s)2(σ2pz)
2(π2px)2(π2py)
2(πlowast2px)
2
In heterogeneous catalysis however the redox catalysts involve ionic oxygen species
which are the following O- and O2- (oxide anion) O2- (superoxide anion) O2
2- (peroxide
anion)
The O- anion contains one more electron then the oxygen atom The electronic
configuration of 1s22s22px22py
22pz1 shows that this species is a mono-radical anion
Because the total electron spin angular momentum is frac12 the degeneracy is equal to 2
This doublet oxygen species gives a single ESR signal without hyperfine splitting
30
The orbitals of the doubly ionized O2- are fully occupied The electronic configuration of
this species is 1s22s22px22py
22pz2 The total electron spin angular momentum is zero
therefore this ion is a singlet species which does not give a signal in the ESR spectrum
The superoxide ion (O2macr) is formed by monoelectronic ionization of the oxygen molecule
the extra electron being located on one of the antibonding π orbitals The electron
configuration of KK(σ2s)2(σlowast
2s)2(σ2pz)
2(π2px)2(π2py)
2(πlowast2px)
2(πlowast2py)
1 displays a mono-
radical feature As a doublet species the superoxide anion gives a single ESR signal
Because the antibonding orbital is more populated compared to the molecular oxygen the
bond order is reduced from 2 to 15
In the peroxide anion (O22-) both antibonding π orbitals are fully occupied which leads to
a bonding order of one
KK(σ2s)2(σlowast
2s)2(σ2pz)
2(π2px)2(π2py)
2(πlowast2px)
2(πlowast2py)
2
Upon population of the antibonding orbitals with electrons the O-O bond length
increases and the bond energy decreases in the O2 O2- and O2
2- series Similarly to the O2-
anion the peroxide anion is a singlet
Since the formation of all these ionic oxygen species is exothermic they are activated
species Upon ionization however the degeneracy also decreases from triplet to doublet
and singlet respectively The reaction between the hydrocarbon and singlet oxygen anion
on the catalyst surface is not spin forbidden anymore therefore the alkane oxidation
reaction may take place at a reasonable temperature
However the reactivity of these species is different and often controls the selectivity of
the process The electrophilic species are represented by O- O2- and O2
2- respectively
They are electron deficient and react with the electron rich regions of the hydrocarbon
molecule such as C=C bonds The nucleophilic O2- anion is often identified as lattice
oxygen Because its orbitals are fully occupied by electrons this species is expected to
react with electron poor regions of the molecule such as C-H bonds [55 57 58]
The selectivity control also depends on the reaction type In the alkane oxidative
dehydrogenation or oxidation to unsaturated aldehydes or acids the selective pathway is
associated to C-H bond activation The attack of electrophilic species on the C=C bond
leads to peroxo-complexes or epoxides which decompose by C-C bond cleavage and
gives total oxidation products Other examples of nucleophilic oxidation are oxidative
31
dehydroisomerization and dehydrocyclization oxidation of alkylaromatics to aldehydes
without aromatic ring rupture ammoxidation oxidation of aldehydes to acids oxidation
of aromatics to anhydrides
On the other hand in the case of electrophilic oxidation reactions the C=C bond
activation is desired because the C-H bond activation by nucleophilic oxygen leads to
unselective pathways Such reactions are the epoxidation oxidation and oxyhydration of
alkenes to saturated ketones oxidation of aromatics to anhydrides and acids with ring
rupture [57 58]
124 Reactor designs operation modes
1241 Conventional laboratory scale reactors
In heterogeneous catalysis different reactor types and designs are employed [59 60] The
most important and frequently used ones are described here
Based on the operation mode two types can be distinguished batch and continuous
reactors The batch reactor is a closed system with a fixed mass of catalyst and volume
of reactant The volume or density of the reacting mixture may change as the reaction
proceeds while the temperature can be kept constant The concentration of reactants and
products change with the reaction time The reaction rate involving the reactant A can be
easily determined from the change of number of moles divided by the volume of the
reactor (Equation 121) If the volume of the reacting mixture is kept constant the
reaction rate is defined as the first order derivative of the concentration with respect to
reaction time
)121 ( 1
Equationdt
dn
Vr AA sdotminus=
The continuous reactors are open systems These can be further classified based on the
flow characteristics in total backmixing reactors (gradientless or continuous flow stirred
tank reactor CSTR) and plug-flow reactors The CSTR consists of a vessel equipped
with an efficient stirrer The reacting mixture flows in with a continuous rate The
32
concentrations are the same in any volume element and any time of the vessel because of
the stirring Moreover the concentrations at the outlet are the same as in the reactor The
difference between the inlet and outlet concentration resembles a step-function For a
system with constant density the reaction rate can be calculated by dividing the
concentration difference by the mean residence time (minus
t ) (Equation 122) The mean
residence time is defined as the reatio between the volume of the reactor and the
volumetric feed flow rate The most important advantage of a CSTR is indeed the fact
that there are no concentration gradients in the catalyst bed the chemical potential is
equal at any volume element of the reactor
)221 ( Equation
t
c
t
ccr AoutletAinletA
A minusminus
∆=
minusminus=
The plug-flow reactor (PFR) consists of a tube which contains the catalyst in the form of
packing or a fixed bed The reacting mixture passes through the reactor tube Two
constraints are to be fulfilled by this type of reactor
bull No axial mixing (ie in the direction of flow) of fluid in the inside of the tube
bull Complete radial mixing (ie perpendicular to the direction of flow) of fluid in the
reactor tube
When the reactor is operated in steady-state and there is no or negligible change of the
density the reaction rate is the first derivative of the concentration with respect to the
contact time (τ ) (Equation 123)
)321 ( Equationd
dcr AA τ
minus=
The most widely employed reactor type for laboratory-scale experiments in
heterogeneous catalysis is the PFR Using this reactor permits testing for screening the
best performing catalyst in a given series More importantly the study of the effect of
33
operation variables (initial concentration of reactants reaction temperature and contact
time) for kinetic purposes
Two different regimes are distinguished
bull Differential regime when the reactor is operated at low educt conversion This
can be determined experimentally by plotting the conversion of the educt against
the contact time The upper limit of the conversion for the differential regime is
that point where the plot deviates from linearity The educt consumption rate can
be determined from the slope of the concentration ndash contact time plot for the
differential regime
bull Integral regime when the reactor is operated at high conversions The integral
regime extends between the upper conversion limit of the differential regime and
full conversion
For industrial applications the maximum performance is usually attained in the integral
regime For this purpose it is often not enough to carry out experiments only in the
differential regime However strictly speaking the reaction rates can be defined only for
the differential regime Therefore kinetic modeling is needed to fit the curves with
integrated rate equations derived from a proposed reaction network The fitting
parameters are the rate constants which do not depend on the extent of the reaction
1242 Catalytic membrane- and multi-stage reactor designs
In partial oxidation reactions the high yield for the desired product is often difficult to
achieve because the intermediate(s) and the product are thermodynamically less stable
than the educt In those cases when the intermediate(s) and product are oxidatively not
stable over a given catalyst the excess of oxygen in the feed favors the total oxidation
which results in low productivity [39 61] For this reasons different reactor designs
(such as catalytic membrane- and multi-tubular reactors) were applied for the dosing of
the oxidant to avoid high oxygen concentrations and to change the local kinetics along
the reactor tube
34
The catalytic membrane reactor is a tubular reactor but the tube is made of a semi-
permeable membrane instead of quartz or metal The reactant is fed in the tube like in the
case of a conventional fixed bed reactor while the oxidant is fed through the membrane
The membrane acts as a distributor of the oxygen along the catalytic bed Therefore the
local oxygen concentration is lower than in the case of the conventional plug-flow
reactor The local oxygen concentration influences the local reaction rate also the rate of
total combustion By changing the local oxygen concentrations a better performance may
be achieved in the catalytic membrane reactor compared to the conventional reactor
designs [61]
However it is to be noted that complete radial mixing is needed in order to avoid the
radial concentration gradients Otherwise high oxygen concentrations at around the walls
of the reactor which would favor total oxidation while in the middle of the reactor tube
the mixture would be rather reducing
Figure129 The flow rate (left) and concentration distribution of oxygen (right) in the catalytic membrane reactor without reaction taking place The blue and green curves correspond to different reactor geometries
(aspect ratios) The profile corresponding to fixed bed reactor (FBR) is indicated by orange line [61]
In contrast to the plug flow reactors operated in steady-state the feed total flow rate
increases along the catalytic bed (Figure 129) Therefore the space velocity also
increases along the tube Without catalytic reaction taking place the oxygen
concentration also increases along the reactor tube [61]
35
Some examples of applications of such reactor designs are briefly reviewed below
Oyama et al employed a catalytic membrane reactor for the epoxidation of propylene in
presence of hydrogen over AuTS-1 catalyst In this reactor the formation rate of
propylene epoxide could by improved by 100-200 compared to the conventional fixed
bed reactor [62] This is due to the fact that high oxygen concentrations could be used in
the catalytic membrane reactor which are not accessible in a conventional reactor for
safety reasons
Campanelli et al studied the oxidative dehydrogenation of propane over VOxγ-Al2O3
and VOxZSM-5 in catalytic membrane reactor The performance of this reaction was
found to be higher than the conventional fixed bed reactor [63 64]
The reactor system developed by Hamel et al is a combination between the multi-stage
reactors and catalytic membrane reactors Three catalytic membrane reactors were
connected in series In this arrangement increasing decreasing and constant oxygen
concentrations were achievable along the reactor cascade as well as different
temperatures in the different reactor units [61]
Figure 1210 (a) Selectivity of propylene vs propane conversion (b) selectivity of propylene vs temperature Conditions xC3H8
in=1 O2C3H8=1 and WHSV=100 and 400 kgsm3 [61]
36
The ethane and propane oxidative dehydrogenation was performed in this system using
VOxγ-Al2O3 catalyst The catalytic results from the membrane (MR) reactor were better
compared to the experiments carried out in a conventional fixed bed (FB) reactor almost
under any conditions (Figure 1210)
OacuteNeill et al used a dual-bed membrane reactor as oxygen distributor for the oxidation of
propane to acrolein [65] The first bed contained propane oxidative dehydrogenation
catalyst (05 g V2O5MgO at a reaction temperature of 500degC while the second bed
consisted of bismuth-molybdate for the further oxidation of propylene to acrolein
produced in the first reactor tube (20g at a reaction temperature of 475degC)
Catalytic studies were conducted with both catalysts separately then in the dual-bed
configuration In these separated experiments the maximum selectivity to propylene and
acrolein was observed for stoichiometric feed while the selectivity declined in both cases
when oxygen excess was used The dual bed experiments were performed under the
optimal conditions determined in the single-bed separated catalytic membrane reactors
Using the dual bed configuration the selectivity to acrolein could be improved by 21
compared to the experiment when the catalytic membrane reactors were used separated
However it was also found that the separate membrane reactor performance was only
marginally higher (by a few ) compared to the conventional fixed bed reactor
Fang et al used a modified fixed bed reactor design equipped with an oxygen distributor
tube [66] The reactor setup permitted experiments with a single- as well as dual catalytic
bed The reacting mixture was fed at the top of the reactor and in the dual bed operation
mode additional oxygen was supplied through the distributor tube which ended up
between the two catalyst beds NiZrOx catalyst was used for oxidative dehydrogenation
of propane while in the second bed cobalt containing bismuth molybdate catalyst was
used for oxidation of propylene to acrylic acid Both of these catalysts showed low
activity in a single-bed arrangement the conversion over NiZrOx catalyst was below 10
and selectivity around 2 while on the modified bismuth molybdate catalyst the
conversion and acrylic acid selectivity were below 1 at the temperature of 380degC The
37
combination of the catalyst beds lead to a conversion of about 10 while the selectivity
was around 25 The addition of oxygen via the distributor tube increased significantly
the yield of acrylic acid to about 12
Summarizing the advantages of catalytic membrane and multi-tubular reactors it can be
stated that
bull These systems permit the variation of the local concentration of the oxidant The
local concentration has a direct effect on the local kinetics and reaction rate thus
the total oxidation may be prevented
bull Different amounts of catalysts may be loaded in the individual reactor tubes
Therefore different contact times are achievable in the reactor tubes The contact
time in each reactor can also be an operational variable in these systems
bull The temperature of each reactor tube can be set individually which is important if
the product is oxidatively unstable
As shown by the above presented examples the optimization of the additional
operational variables in catalytic membrane and multi-tubular reactors the performance
may be improved compared to the conventional reactor systems used for basic research
125 Reaction kinetics
The heterogeneously catalyzed reactions consist of 7 serial steps as follows [67]
bull Diffusion of the reactant species in the fluid phase towards the surface of the solid
catalyst
bull Internal diffusion of the reactant in the pores of the catalyst particle
bull Adsorption of the reactant molecule on the surface
bull Chemical transformation of the reactant into product
38
bull Desorption of the product
bull Diffusion of the products in the pores of the catalyst
bull Diffusion of the product towards the fluid phase
The first two and the last two steps are transport phenomena and as such physical
phenomena The reaction conditions and operation mode can be chosen in such a way
that the mass transport does not limit the chemical reaction on the surface
The reaction mechanism is ultimately the set of elementary steps which explains how the
bonds are split and formed during the chemical transformation However besides the
description of all elementary reactions the postulated reaction mechanism should contain
information concerning the chemical and electronic structures of the transition state for
each elementary step [75] In applied heterogeneous catalysis such a description is
seldom achieved even though in many literature sources the elucidation of reaction
mechanism is claimed
13 Motivation
Upon reviewing the literature about the selective oxidation of propane to acrylic acid on
Mo and V based mixed oxides it was found that predominantly the studies were
performed using phase mixture catalysts The understanding of the role of the individual
phases and active sites in the propane oxidation reaction is still under debate [2 9 29 34
36 70-72] in spite of the claims given by Grasselli et al [31] and Loacutepez-Nieto et al [35]
Their conclusions were assigned based on disproportionately few catalytic and kinetic
data compared to the structural characterization data
In contrast to this very limited information exists about the catalytic properties of phase-
pure materials in propane oxidation reaction Furthermore the following open questions
and conflicting conclusions were identified
bull The bulk structural stability of the MoVTeNbOx catalyst under various conditions
(dry reducing stoichiometric and oxidizing feed) was not evidenced [27 28] On
the other hand it was reported that the phase composition of the not phase pure
39
MoVSbNbOx catalyst is irreversibly altered when exposing to dry feed
conditions accompanied by the irreversible drop of the catalytic performance
bull The detailed kinetic study of the operational variables (reaction temperature
steam content redox potential) was not described on a phase-pure M1
MoVTeNbOx catalyst
bull The reaction pathways are under debate The early versions were proposed mainly
based on thermodynamic considerations [4 12] and a very limited number of
integral catalytic data [2 12 22 30 47 48] but only very few systematic kinetic
studies were carried out Typically these studies were performed using phase
mixture catalysts [24-28 73 74]
bull The common feature of the proposed pathways is that the total oxidation product
(CO and CO2) formation is either not explained at all [12 24 35] or they are
merged together as COx=CO+CO2 produced by the total oxidation of acrylic and
acetic acids [2 4 22 24 25 47 48 71 74] Lintz et al and Fushimi et al
continued the simplification by merging the CO CO2 and acetic acid under a
three carbon atom containing pseudo-byproduct [27 28 30 71] The mechanism
proposed by Grasselli et al does not explain at all the formation of these
byproducts [9 31 35 70] However a postulated mechanism should contain all
the contributing elementary reactions as well as the description of electronic and
chemical structures of the transition state for each elementary reaction [75]
The experimental work presented this thesis is centered around the kinetic study of
propane selective oxidation to acrylic acid on MoVTeNbOx catalyst Due to the fact that
the role of the individual phases is not yet fully understood a phase-pure MoVTeNbOx
catalyst was used The experiments were designed to answer some of the above outlined
open questions
bull The bulk structural stability of the phase-pure M1 MoVTeNbOx catalyst under
real reaction conditions (T=400degC and GHSV=5000 h-1 whereby maximum
acrylic acid selectivity is attained in fixed bed reactor) was addressed in an in situ
XRD experiment The steam content and redox potential was varied during this
experiment the conditions covered steam containing- dry- stoichiometric-
40
oxidizing- reducing- and strongly reducing (C3H8 in N2) feed compositions
respectively
bull The kinetic study on the temperature steam- and oxygen concentration was
carried out in a conventional fixed bed reactor The oxidation of the intermediates
(propylene and acrolein) was also carried out in the temperature interval
corresponding to the propane oxidation in order to determine the relative
reactivities For unraveling the source of CO2 in the C3H8 and C3H6 and acrolein
oxidation reactions (ie is CO2 produced from the total oxidation of the organics
or the further oxidation of CO) a separate CO oxidation and water gas shift
reaction was envisaged
bull A two-stage reactor design was employed for the stage-wise addition of the
oxidant (O2 and N2O) reducing gases (C3H6 CO) and the thermodynamically
stable end product (CO2) The O2 addition was performed in order to check
whether the multi-stage arrangement improves the catalytic performance similarly
to the literature sources In the literature the nitrous oxide was reported to be an
alternative and more efficient oxidant than molecular oxygen in ODH reactions
[77 78] Therefore the potential applicability of this oxidant was also checked in
the two-stage reactor system The addition of C3H6 CO and CO2 was performed
in order to observe whether these products competitively adsorb on the active
sites of the catalyst or not
bull The product distribution analysis corresponding to the propane oxidation and the
catalytic data obtained for propylene acrolein and CO oxidation reactions in both
the single-tube and the two-stage reactor setups are considered in the proposed
reaction network [76]
References Chapter 1
1 J P Lange Economics of alkane conversion Chapter 3 in E G Derouane et al (Eds) Sustainable strategies for the upgrading of natural gas fundamentals challenges and opportunities Springer 2005 51-83
2 EK Novakova V C Veacutedrine Propane Selective Oxidation to Propene and Oxygenates on Metal Oxides in JLG Fierro Metal Oxides Chemistry and Applications CRC Press 2006 414-455
41
3 G Centi F Cavani F Cavani F Trifiro Selective Oxidation by Heterogeneous Catalysis Kluwer AcademicPlenum Publishers 2001 363-384
4 M M Lin Appl Catal A 207 (2001) 1ndash16 5 wwwiciscom retrieved on 02032011 6 wwwoilnergycom retrieved on 02032011 7 RK Grasselli JD Burrington Adv Catal 30 (1981) 133 8 JD Burrington CT Kartisek RK Grasselli J Catal 81 (1983) 489 9 RK Grasselli JD Burrington DJ Buttrey P DeSanto Jt CG Lugmair AF
Volpe Jr T Weingand Topics in Catal 23 (2003) 5 10 RK Grasselli Topics in Catal 15 (2001) 93 11 M Egishara K Matsuo S Kawaga T Seiyama J Catal 58 (1979) 409 12 M M Bettahar G Costentin L Savary J C Lavalley Appl Catal A 145
(1996) 1-48 13 Y H Jang W A Goddard III J Phys Chem B 106 (2002) 5997-6013 14 K Chen A T Bell and E Iglesia J Phys Chem B 104 (2000) 1292-1299 15 K Chen E Iglesia A T Bell J Phys Chem B 105 (2001) 646-653 16 K Chen A Khodakov J Yang A T Bell E Iglesia J Catal 186 (1999) 325-
333 17 B Y Jibril Int J Chem Kinet 38 (2003) 176-183 18 G Fu X Xu X Lu and H Wan J Phys Chem B 109 (2005) 6416-6421 19 NN Greenwood A Earnshaw Chemistry of the Elements 2nd Edition
Butterworth Heinemann 1997 981-987 1007-1017 20 T Ushikubo H Nakamura Y Koyasu S Wajiki US Patent 5 380 933 (1995) to
Mitsubishi Kasei Corporation 21 T Ushikubo I Sawaki K Oshima K Inumaru S Kobayakawa K Kiyono US
Patent 5 422 328 (1995) to Mitsubishi Kasei Corporation 22 M Lin T B Desai F W Kaiser P D Klugherz Catal Today 61 (2000) 223ndash
229 23 D Vitry Y Morikawa JL Dubois W Ueda Applied Catalysis A General 251
(2003) 411ndash424 24 L Luo JA Labinger ME Davis J Catal 200 (2001) 222ndash231 25 EK Novakova JC Vedrine EG Derouane J Catal 211 (2002) 235-243 26 EK Novakova JC Vedrine EG Derouane Catal Lett 83 (2002) 177 27 E Balcells F Borgmeier I Griszligtede H-G Lintz F Rosowski Appl Catal A
266 (2004) 211-221 28 I Griszligtede Die partielle Oxidation von Propan zu Acrlysaumlure Bestimmung der
Reaktionskinetik und in-situ Charakterisierung des Katalysators unter Betriebsbedingungen Dissertation Universitaumlt Karlsruhe 2004 Universitaumltsverlag Karlsruhe ISBN 3-937300-17-1
29 P Concepcion P Botella J M Lopez Nieto App Catal A 278 (2004) 45ndash56 30 R Fushimi S O Shekhtman A Gaffney S Han G S Yablonsky J T
Gleaves Ind Eng Chem Res 44 (2005) 6310-6319 31 R K Grasselli D J Buttrey J D Burrington A Andersson J Holmberg W
Ueda J Kubo C G Lugmair A F Volpe Top Catal 38 (2006) 7-16 32 P DeSanto D J Buttrey R K Grasselli C G Lugmair A F Volpe Jr B H
Toby T Vogt Z Kristallogr 219 (2004) 152-165
42
33 M Baca A Pigamo JL Dubois and JMM Millet Top Catal 23 (2003) 39-46
34 WUeda DVitry T Katou Catal Today 96 (2004) 235ndash240 35 P Botella J M Loacutepez-Nieto B Solsona A Mifsud and F Maacuterquez J Catal
209 (2002) 445-455 36 V V Guliants R Bhandari B SwaminathanV K Vasudevan J Phys Chem
B 109 (2005) 24046-24055 37 Y Zhu W Lu H Li H Wan J Catal 246 (2007) 382-389 38 G Busca Phys Chem Chem Phys 1 (1999) 723-736 39 W Zheng Z Yu P Zhang H Fu X Zhang Q Sun X Hu J Natural Gas
Chem 17 (2008) 191-194 40 J L Dubois D Garrait A Le Gall G Bazin S Serreau FR patent WO
2006072682 A1 2006 41 G Landi L Lisi J C Volta Chem Commun 9 4 (2003) 492-493 42 G Landi L Lisi J-C Volta J Mol Catal A 222 (2004) 175-181 43 G Landi L Lisi J C Volta Catal Today 91-92 (2004) 275-279 44 TV Andrushkevich CatalRev Sci Eng 35 (1993) 213-259 45 E M Erenburg T V Andrushkevich G Ya Popova A A Davidov V M
Bondareva React Kinet Catal Lett 12 1 (1979) 5-11 46 EM Erenburg T V Andrushkevich V I Bibin Kinet Catal 20 3 (1979) 680 47 M Ai J Catal 101 (1986) 389 48 M Ai Catal Today 42 (1998) 297 49 A C Kaddouri C Mazzochia E Tempesti Appl Catal A 180 (1999) 271 50 J Barrault C Batiot L Magaud M Ganne Stud Surf Sci Catal 110 (1997)
375 51 A C Sanfiz T W Hansen D Teschner P Schnorch F Girgsdies A
Trunschke R Schlogl M H Looi S B A Hamid J Phys Chem C 114 4 (2010) 1912-1921
52 J C Vedrine J M M Millet J C Volta Catal Today 32 1-4 (1996) 115-123 53 R Recknagel Chemische Technik 46 6 (1994) 324-331 54 Moro-oka Appl Catal A General 181 (1999) 323-329 55 Z Sojka E Giamello M C Paganini Radicals in Catalysis ndash Heterogeneous in
I T Horvaacuteth (Ed) Encyclopedia of Catalysis Vol 5 Wiley-Interscience 2003 738-768
56 NN Greenwood A Earnshaw Chemistry of the Elements 2nd Edition Butterworth Heinemann 1997 [13] P Mars D W Krevelen Chem Eng Sci 3 1954 41
57 S T Oyama Factors affecting selectivity in catalytic partial oxidation and combustion reactions in B KWarren S T Oyama (Eds) Heterogeneous Hydrocarbon Oxidation ACS Symposium Series 638 2-20 J Haber Selectivity in heterogeneous catalytic oxidation of hydrocarbons B KWarren S T Oyama (Eds) Heterogeneous Hydrocarbon Oxidation ACS Symposium Series 638 20-36
58 J Haber Selective oxidation ndash Heterogeneous in I T Horvaacuteth (Ed) Encyclopedia of Catalysis Vol 6 Wiley-Interscience 2003 141-187
43
59 R W Missen Ch A Mims B A Saville Introduction to Chemical Reaction Engineering and Kinetics John Wiley and Sons 1999 25-41
60 J M Berty Experiments in catalytic reaction engineering Studies in surface science and catalysis Vol 124 Elsevier 1999 29-45
61 C Hamel Aacute Toacuteta F Klose F Tsotsas A Seidel-Morgenstern Chem Eng Res and Design 86 (2008) 753-764
62 ST Oyama X Zhang J Lu Y Gu T Fujitani J Catal 257 (2008) 1-4 63 A Bottino G Campanelli A Comite J Membr Sci 197 1-2 (2002) 75-88 64 G Campanelli E Carosini F Cavani O Monticelli F Trifiro Chem Eng Sci
51 10 (1996) 1817-1826 65 C Oacute Neill E E Wolf Catal Today 156 (2010) 124-131 66 W Fang Q J Ge J F Yu H Y Xu Ind Eng Chem Res 50 4 (2011) 1962-
1967 67 J B Butt Reaction kinetics and reactor design Chapter 7 Chapter 1 Marcel
Dekker 2000 1-104 457-571 68 R A van Santen J W Niemantsverdriet Chemical kinetics and catalysis
Fundamental and Applied Catalysis Plenum Press 1995 Chapter 2 21-66 69 N A Bhore M T Klein K Bishoff Ind Eng Chem Res 29 (1990) 313-316 70 R K Grasselli C G Lugmair A F Volpe Top Catal 50 (2008) 66-73 71 H-G Lintz S P Muumlller Appl Catal A General 357 (2009) 178-183 72 R Schloumlgl Top Catal 54 (2011) 627-638 73 Lin Luo PhD Thesis California Institute of Technology Pasadena California
2001 74 F N Naraschewski A Jentys J A Lercher Top Catal 54 (2011) 639-649 75 K A Connors Chemical kinetics VCH Publishers 1990 1-10 76 R Naumann d`Alnoncourt L I Csepei Yu V Kolen`ko A Trunschke R
Schloumlgl manuscript in preparation 77 E V Kondratenko M Cherian M Baerns D Su R Schloumlgl X Wang I E
Wachs J Catal 234 (2005) 131ndash142 78 E V Kondratenko A Bruumlckner J Catal 274 (2010) 111ndash116
44
Chapter 2 Experimental methods
21 Physico-chemical characterization of the catalysts
In this section those methods are described which were employed to characterize the
catalyst Routine measurements (determination of the surface area recording the X-ray
diffractogram for checking the phase purity imaging by SEMTEM and elemental
analysis by EDX) were done for each sample while XPS and microcalorimetric
experiments on the adsorption of propane was performed for selected samples
211 Nitrogen physisorption
The nitrogen physisorption was carried out on a Quantachrome 6B setup at -196deg C Prior
to the measurement an outgassing procedure was performed at 150degC for 2 hours The
specific surface area was calculated using the multipoint Brunauer-Emmett-Teller
method applied to the data collected in the relative pressure interval between 005 and 03
of the adsorption isotherms The total pore volume was estimated from the volume of the
physisorbed nitrogen at the relative pressure of 095
212 X-Ray Diffraction
The powder X-ray diffraction patterns were recorded using a Stoe STADI-P transmission
diffractometer and a Bruker D8 ADVANCED diffractometer both equipped with a Cu
Kα1 radiation source
The in-situ XRD study was performed using the Bruker D8 ADVANCED diffractometer
The gas mixture of propane oxygen and helium was supplied by mass flow controllers
and while a bubbler connected to a HAAKEreg thermostat was employed for introducing
the steam Catalytic reaction was carried out at a temperature of 400degC the reaction was
followed by an on-line mass spectrometer
45
213 Scanning Electron Microscopy (SEMEDX) and Scanning Transmission
Electron Microscopy (STEM)
The SEM-EDX analysis was performed using a Hitachi S-4800 scanning electron
microscope operated at 10 kV accelerating voltage The STEM measurement was done in
Titan CS 80-300 TEM setup operated at 300 kV The spatial resolution was ca 13 Aring
214 X-Ray Photoelectron Spectroscopy (XPS)
The XPS experiments were carried out using the monochromatic radiation of the ISISS
(Innovative Station for In Situ Spectroscopy) at the synchrotron facility BESSY II of the
Helmholtz Zentrum Berlin The measurements were carried out at a pressure of 025
mbar oxygen in order to avoid reduction of tellurium The core level spectra of O 1s V
2p Mo 3d Te 3d Nb 3d and C 1s were recorded at 150 eV constant kinetic energy of the
incident photon beam This corresponded to the inelastic mean free path of approximately
06 nm therefore the setup was operated in the surface sensitive mode The
normalization of the spectra was done with respect to the storage ring current and the
incident photon flux determined by using a gold foil The data analysis was done in
CASA software using Shirley baseline subtraction
215 Microcalorimetry
The differential heats of adsorption were determined using an MS70 Calvet Calorimeter
(SETRAM) Details about the experimental setup consisting of the gas dosing system
calorimeter and the custom-designed high-vacuum system were described in detail before
[1] The catalyst sample was investigated in the same sieve fraction as used for the
catalytic experiments (250-355 microm) The pretreatment of the sample prior to the
calorimetric experiment was performed in vacuum (at 310-8 mbar) at 150degC The
propane and propylene adsorption experiment was performed at 40degC The pressure
change and the heat signal were recorded at every dosing step of the probe molecules
The adsorption isotherm was derived from the dosed amount of probe molecule and the
46
equilibrium pressure The signal area was converted into heat by means of the calibration
factor of the calorimeter determined in advance The heat was divided by the number of
molecules adsorbed in the respective dosing step [2]
22 The experimental setup for propane oxidation
For catalytic and kinetic experiments a home built fixed bed reactor system was used
(Figure 221) The propane oxidation setup (denominated as PropOx 1) consisted of
three modules
bull Gas dosing system
bull Reactor system
bull On-line gas analytics
In the following sections the design features and details of the modules are given
221 The gas dosing system
On Figure 221 the scheme of the reactor system is shown The gas dosing system
consisted of 3+2 mass flow controllers (MFC) as follows
bull O2 ( Bronkhorst type EL-FLOW max flow rate 5 mlnmin)
bull C3H8 (Bronkhorst type EL-FLOW max flow rate 25 mlnmin)
bull N2 (Bronkhorst type EL-FLOW max flow rate 70 mlnmin)
bull N2 (Bronkhorst type EL-FLOW max flow rate 100 mlnmin) This was used in
the steam content variation experiment when the feed was switched from steam
containing feed to dry feed Additionally this flow controller was used for the
purging of the second reactor tube with a mixture of N2+H2O when the two-stage
reactor system was operated in a single-tube mode
bull O2 (Bronkhorst type EL-FLOW max flow rate 5 mlnmin not shown on Figure
221) this was used for the addition of oxygen and other gases (C3H6 N2O CO
CO2) in the two-stage reactor system The two-stage reactor system is described
in section 223
47
For the study on the effect of steam it was necessary to vary the steam content between
40 and 0 vol The steam was introduced via a syringe pump (Harvard Apparatus Model
22 with a double syringe holder) equipped with a 50 ml gas tight syringe made of quartz
(provided by Hamilton) and an evaporator The home-built evaporator was a stainless
steel vessel surrounded by a heater (nominal power of 600W) heated up to 97degC The
cavity of the vessel was filled up with SiC (particle size between 200 and 400 microns)
The liquid water entered the vessel through a 116 inch size tubing Nitrogen was used as
carrier gas for steam through the evaporator Even though the evaporation temperature
was experimentally optimized oscillations in the steam concentration were noticed
which induced oscillations in the concentration of all the other components Therefore a
Swagelok stainless steel pressure vessel of 150 ml was installed in the heated oven as a
buffer volume in order to minimize the fluctuations of the concentrations
Fig 221 The experimental setup denominated as PropOx-1
O2
C3H8
N2
N2
PC GC MS
vent
Filter
Filter
Buffer
PI
MFC
MFC
MFC
MFC
Syringe pump TIC
Flow bus
48
A Swagelok four-way valve installed in the heated oven permitted to switch immediately
between a steam containing feed and dry feed and back When the four way valve was in
the position indicated by Figure 221 the N2+steam mixture was added to the C3H8+O2
mixture On the other hand when the valve was turned in the other position pure
nitrogen was added to the C3H8+O2 mixture for the experiments carried out under steam
free conditions The N2+steam mixture was produced continuously but it was purged by
the valve to the vent
For re-measuring the catalytic properties with the steam containing feed the four way
valve was turned back in the position indicated by Figure 221
The necessity of above described arrangement and procedure is due to the fact that the
replacement of the steam containing feed by dry feed by switching off the syringe pump
is not fast enough Both the evaporator and the pressure vessel has a relatively large
volume and it would have taken more than an hour to replace the steam containing feed
by dry feed and vice versa However by using this valve system the time resolution of
the measurement on the steam effect was reduced to the time resolution of the analytical
setup (ca 17 min) permitting to observe if the catalyst is deactivating fast or not in
absence of steam
A Swagelok filter (2 microns) was installed between the T-junction where the N2+steam
and the C3H8+O2 mixtures were unified in order to ensure complete mixing
The 4 way valve buffer volume the reactor tube and the gas lines were housed in a
Heraeus oven heated up to 140degC The transfer line between the oven and the heated oven
and the analytical setup was heated to the same temperature by means of heating tapes
222 Reactor tube characteristics
A quartz tube was used as reactor with an outer diameter of 97 mm and inner diameter of
68 mm The reactor tube was surrounded by a tubular heating cartridge (Figure 221)
and placed in the heated oven The oven was heated up to 140degC in order to avoid
condensation of the steam and reaction products (acrylic acid and acetic acid)
49
For finding out the isothermal zone of the reactor the oven was heated up to 140degC
while the temperature of the reactor heating cartridge was set to 400degC A gas mixture
containing 40 vol steam and 60 vol N2 was flown through the empty reactor with a
flow rate of 50 mlnmin The thermocouple was moved by 05-10 cm along the tube
from bottom towards the top and the temperature was measured at each position The
temperature profile is given in Figure 222 A plateau is observed between 8 and 13 cm
of the reactor length For a better estimation a standard deviation of less than 1degC was
considered as an objective criterion for the length of the isothermal zone
The isothermal zone started at 85 cm and ended at 125 cm therefore the length is 4 cm
Within this zone the average temperature was found to be 4001degC with a standard
deviation of 07degC and a confidence interval of 02degC The absolute difference between
the maximum and minimum temperatures (∆T=Tmax-Tmin) was 15degC within this interval
The difference of Tmax-Taverage was 07degC which is in good agreement with the standard
deviation of the temperature profile curve in the isothermal zone Therefore it can be
stated that the catalytic reaction was carried out under isothermal conditions
An isothermal volume of 145 ml was calculated from the inner diameter of the reactor
tube and the length of the isothermal zone This was the maximum volume of the catalyst
which could be loaded in the isothermal zone
240 260 280 300 320 340 360 380 400 420
0
2
4
6
8
10
12
14
16
d (cm)
T(degC)
Figure 222 The temperature profile of the reactor tube Zero centimeter corresponds to the
bottom of the heating cartridge The delimitation of the isothermal zone is marked by blue lines
50
The catalyst was used as a sieve fraction between dpmin=250 and dpmax=355 microns The
ratio between the reactor diameter (dr) length of the isothermal zone (Lisoth) and the
particle size are given by the equation 221-223 The ratio between the reactor diameter
and particle size should be at least 10 (Equation 221) The length of the isothermal zone
should exceed at least 50 times the particle size (Equation 222) The dimensionless
criterion concerning the reactor geometry is that the length of the isothermal zone should
be at least 5 times larger than the diameter The numerical values of these ratios exceed
the minimum criteria (Equations 221-223) therefore no axial diffusion (back-mixing)
no radial gradient in concentrations temperature and reaction rate occurs [3]
223)(Equation 9586
40
222)(Equation 01602500
40 7112
3550
40
221)(Equation 2272500
86 219
3550
86
min
max
minmax
==
====
====
r
isoth
p
isoth
p
isoth
p
r
p
r
d
L
d
L
d
L
d
d
d
d
In order to avoid hot-spots or temperature gradient formation the catalyst was mixed
with SiC (particle size between 315 and 400 microns) prior to filling in the reactor tube
Usually 025-030 ml catalyst was mixed up with 115-12 ml SiC This corresponds to a
dilution ratio between 38 and 48 The SiC does not only act as a diluent between the
catalyst particles but also improves the reaction heat transfer The heat conductivity of
SiC is 2-3 order of magnitude higher compared to the heat conductivity of molybdenum
and vanadium based oxides (λSiC=12-25 WcmmiddotK [4] λMoVOx=25middot10-3 WcmK [5])
A slightly different SiC sieve fraction was used (315-400 microm) compared to the catalyst
particle size (250-355 microm) in order to facilitate the separation of the catalyst after
catalytic experiment When the loading was taken out from the reactor the solid mixture
was sieved using a 315 micron sieve The catalyst particles between 250 and 315 micron
fell in the collection plate while the catalyst particles and SiC above 315 microns
remained in the sieve The collected catalyst was not always free of small fraction of SiC
51
(less than 1) Therefore sometimes the post-catalytic XRD patterns contained
reflections of SiC as well
The loading of the reactor was performed according to the following procedure a quartz
wool plug was inserted in the tube to the lower end of the isothermal zone Then the
catalyst and SiC physical mixture was poured in the tube using a glass funnel to a level
which was 2 mm below the upper end of the isothermal zone At the end ca 2 mm of
SiC layer was added to the top of the bed The reactor tube was inserted in the heating
cartridge A K-type thermocouple that measured the temperature in the catalytic bed was
fixed in such a way that it touched only the SiC on the top Therefore this arrangement
permitted to avoid cross contamination of one catalytic bed to another by the particles
which eventually might stick to the surface of the thermocouple
For the downstream tubing and transfer line between the reactor and the analytical setup
a PEEK tubing was used which is chemically more inert than stainless steel The
employment of PEEK was necessary in order to minimize the adsorption of products and
polymerization of acrylic acid on the walls of the tubing On the downstream tubing from
the reactor a second filter (Swagelok 2 micron) was installed in order to prevent the
solid particles to enter into the valve system andor columns of the analytical setup
223 Estimation of the Weisz-number and the Thiele modulus and effectiveness
factor
For the estimation of whether mass transport limitation plays a role in the reaction the
Weisz-number (Ψ) and the Thiele modulus (Φ) was calculated according to the
equations
)622 ( tanh
)522 (
)422 ( 2
1
183
083
832
Equation
EquationD
ckL
EquationcD
rnL
eff
n
sHCc
HCeff
catHC
c
Φ
Φ=
sdotsdot=Φ
sdot
sdotsdot
+sdot=Ψ
minus
η
ρ
52
Since the propane oxidation reaction was found to be first order with respect to propane
(n=1 see section 423) the (n+1)2 term becomes equal to one Similarly the term
involving the surface concentration of propane on the (n-1)th power becomes equal to one
in the equation 225 for n=1
The characteristic length (Lc) was calculated from the particle diameter assuming
spherical particles The catalyst density (ρcat) of 112 gml was determined by weighting
10 ml sieve fraction The effective diffusion coefficient of propane (Deff=0018 cm2s)
was taken from [6] The integral reaction rate of propane consumption was calculated at
the highest reaction temperature of 400degC The rate constant of propane consumption
(kC3H8=0870 gsml at 400degC) was determined from the fitting of the rate equation to the
experimental data points (section 65) Finally the effectiveness factor (η) was calculated
according to the equation 226 Because the particle size was between 250 and 355
microns the values were calculated for both extremes (Table 221)
Table221 The Ψ Φ and η dimensionless numbers corresponding to propane oxidation reaction
Dimensionless number dp=250 mm dp=355 mm
Ψ 005 010
Φ 029 041
η 097 095
As it is demonstrated by Table 221 the Weisz-number and Thiele modulus are below
one The effectiveness factor (the ratio between the actual rate and the highest possible
rate) approaches one Therefore it can be concluded that the pore diffusion is negligible
and the reaction rate is kinetically controlled
224 The two stage reactor system
A reactor cascade consisting of two reactor tubes with identical diameter was
constructed These were equipped with the same type of heating cartridge The isothermal
zone was determined also for the second reactor tube according to the previoulsy
described procedure (section 222)
53
The reactor tubes were connected in series according to the Figure 223 In order to
permit experiments in one reactor tube only a six port valve was used for the connection
of the tubes
When the position of the six port valve was according to the left side of Figure 223 the
feed mixture was flowing only through the reactor 1 The gas mixture which was leaving
this reactor is transferred to the analytical setup (indicated by green lines) Therefore this
corresponds to a single-tube reactor operation mode In the meantime the second reactor
was purged continuously with a mixture of steam and nitrogen using the second nitrogen
line and the second syringe of the syringe pump
R1
Feed
mix
GC-
MS
N2
+H2O
vent
R2
O2
R1
Feed
mix
GC-
MS
N2
+H2O
vent
R2
O2
Feed
mix
GC-
MS
N2
+H2O
vent
R1 R2
O2
Feed
mix
GC-
MS
N2
+H2O
vent
R1 R2
O2 Single-tube operation mode Two-stage operation mode
Figure 223 The gas tubing connection of the two stage reactor
The steam and nitrogen mixture which left the second reactor tube was purged to the vent
(indicated by the blue lines) In this configuration the optional oxygen mass flow
controller was not in use
On the other hand when the six port valve was turned in the position indicated by the
right side of Figure 223 the feed mixture went through both reactor tubes and then
analyzed by the GC-MS (green lines) This corresponds to the two-stage operation mode
Addition of oxygen or other gas was possible through the T-junction installed between
54
the six port valve and the second reactor The steam+N2 mixture was continuously
generated but purged to the vent (blue lines)
The addition of gases between the two reactors increased the total flow rate in the second
reactor tube Therefore it influenced slightly both the concentrations and the space
velocity The change of the concentration was corrected by means of the dilution ratio
(ie the ratio between the total flow rates leaving the second and the first reactor tube)
The corrected concentrations were used for the selectivity and rate calculations The
space velocity in the second reactor was calculated based on the loaded amount of
catalyst and the total flow rate
2 4 6 8 10 1209
10
11
12
4000
4250
4500
4750
5000
Overall GHSV (h-1)
Dilution ratio
O2 concentration in mixture that enters in R2 (vol)
Figure 224 The dilution ratio in the second reactor (red dots) and the overall space velocity (black
squares) change upon oxygen addition in the two-stage reactor system
An example for the change of these parameters in function of the added oxygen gas
concentration is shown by Figure 224 For the calculation of rates the corrected
concentrations were divided by the overall contact time Therefore the rate data are more
appropriate for the assessment of the effect of added gases than conversion-selectivity
data which are not corrected with respect to the change of contact time
55
225 The analytical system
For the on-line analysis of the reaction mixture a GC-MS was used This setup consisted
of five columns three valves and two detectors (MSD and TCD respectively) (Agilent
6890 N gas chromatograph Agilent Technologies 6957 B inert MSD)
The configuration of the columns and the detectors are as follows
1 15 m long DB-1 guard-column + 60 m long analytical DB-1 column
connected to the MSD Helium was used as carrier gas at 20 mlmin flow
rate The chromatographic method was developed in such a way to
separate the oxygenates on the DB-1 columns (Figure 225) The MSD
was operated in Solvent Delay mode until 4 minutes in order to protect the
filament and electron-multiplier damage caused by the oxygen and high
steam content of the analyzed gas mixture Therefore the part of the
chromatogram below 4 minutes was not shown on the MSD
2 1 m long HaysepQ guard column + 30 m long Plot Q analytical column +
30 m long Plot Molesieve analytical column The molesieve column could
be bypassed by means of a switching valve in order to avoid that polar
compounds enter in this column The detector was a TCD Helium was
used as carrier gas at 70 mlmin constant flow rate
The method was developed in such a way to enable separation and quatitation of C3H8
C3H6 H2O N2 CO and CO2 (Figure 226) The critical separations were the C3H6-C3H8
and the O2-N2 peak pairs respectively The peak resolution of the critical separations was
calculated based on Equation 227 [7]
)722 ( )(2
1
1Equation
ttR
ii
iRiR
s ωω +
minussdot=
+
+
The criterion for baseline separation is that the resolution is higher than 15 (Rs gt 15)
[7] The resolution of the C3H6-C3H8 and O2-N2 is higher than the limit of 15 (Table
222) Therefore the above method is good with respect to peak resolution
56
0 2 4 6 8 10 12 14
00
10x105
20x105
30x105
40x105
50x105
60x105
40
80
120
160
200
240
Intensity (au)
t (min)
1
2
GC Oven Temperature (deg)
Figure 225 Detection at the MSD 1 acetic acid 2 acrylic acid
0 2 4 6 8 10 12 14
00
25x106
50x106
75x106
40
80
120
160
200
240
Intensity (au)
t (min)
1
2
3
4
5
6
7
GC Oven Temperature (deg)
Figure 226 Detection at the TCD 1 carbon- dioxide 2 water 3 propylene 4 propane 5
oxygen 6 nitrogen 7 carbon-monoxide valve switching
57
Table 222 The resolution for the peak-pairs which elute close to each other
Peak-pair number Peak-pair Rs
3-4 C3H6-C3H8 25 5-6 O2-N2 53
The total length of the analysis time was 15 minutes Gas sampling was performed at
every 17 minutes Therefore the method was satisfactory with respect to the sampling
frequency (35h) In case of the acrolein and CO oxidation experiments (sections 426
and 427) the number of components were less therefore the analysis time could be
further reduced (to 10 and 8 minutes respectively)
226 Calibration of the GC-MS
For the calibration with C3H8 and O2 the pure gases (supplied by Westfalen 9995)
were mixed with nitrogen (Westfalen 9995) For the calibration with products (C3H6
CO CO2) and low concentrations of C3H8 and O2 gas mixtures with certified
concentrations were used (supplied by Westfalen) The composition of calibration
mixture 1 was the following 105 vol C3H8 103 vol C3H6 balance N2 The
calibration mixture 2 consisted of 104 vol CO 102 vol CO2 106 volO2 463
vol N2 and balance He
These mixtures were dosed via mass flow controller and diluted further with nitrogen
The resulting gas mixtures were analyzed by the GC-MS The peaks were integrated and
the peak areas were represented with respect to the concentrations (Figure 227)
Weighted linear regression was performed in order to determine the sensitivity (the
weighting factor being given by the standard deviation of the repeated measurements)
For the calibration of oxygenates a saturator was used to saturate a gas stream of
nitrogen The acetic acid and acrylic acid was used with a pa quality solutions supplied
by Merck Ca 15 ml of liquid was poured in the saturator and nitrogen was bubbled
through it with a flow rate of 15 mlnmin The temperature of the bubbler was controlled
by a HAAKEreg thermostat The vapor pressures of theses acids at different temperatures
are shown in the Table 223
58
Table223 Vapor pressures of acetic- and acrylic acid at around room temperature [11]
T(degC) pHAc (bar) pAA (bar)
15 00079 00017
20 00109 00025
25 00149 00036
00 05 10 15 20 25 30 35
00
40x107
80x107
12x108
16x108 C3H8 C3H6 CO CO2
Peak area (au)
Concentration (vol)
00 02 04 06 0800
40x107
80x107
12x108
AA HAc
Peak area (au)
Concentrations (vol)
Calibration of the TCD Calibration of the MSD
Figure 227 Calibration graphs
The vapor pressure of these oxygenates are too high at temperatures above 20degC
compared to that observed usually in the catalytic experiments On the other hand both
acids freeze at around 13degC therefore lower concentrations are not achievable only by
using the saturator Therefore in order to avoid extrapolations the mixture was further
diluted with nitrogen using the second nitrogen line The calibration graphs of the
oxygenates are shown in Figure 227
The sensitivity of the TCD is known to be stable over a relatively long time (months) but
the MSD is much less stable Therefore the TCD was recalibrated every 3-4 months
while much frequent (weekly) recalibration was needed for the MSD In order to take
into account the daily variation of the MSD sensitivity every day a solution of 05 vol
acetic acid in acetonitrile solvent was injected using the liquid injector port of the GC
(Agilent Technologies 7683 B Series Injector) The relative sensitivity was determined
every day with respect to the sensitivity determined from the multi-point calibration
59
described above For the calculation of the concentration of oxygenates the actual
relative sensitivity was also taken into account
227 Data analysis
The gas hourly space velocity (GHSV) was calculated based on the volume of the
catalyst (Vcat) loaded in the reactor and the feed total flow rate ( totVbull
) (Equation 228)
Whenever the density of the catalyst was not determined with the sufficient precision the
weight hourly space velocity was used (WHSV) which is calculated based on the mass of
the catalyst and the total flow rate of the feed The contact time (WF or τ) is the
reciprocal value of the weight hourly space velocity The volumetric flow rates were
considered at normal conditions (mln)
)1022 ( )(
)922 ( )(
)822 ( )(
1
Equationml
sg
V
mFW
Equationhg
ml
m
VWHSV
EquationhV
VGHSV
tot
cat
cat
tot
cat
tot
sdot==
sdot=
=
bull
bull
minus
bull
τ
For primary data analysis the conversion selectivity and yield was calculated under every
condition The educt conversion (XEduct) was defined as the ratio between the consumed
amount of educt and the initial concentration (Equation 2211) The product selectivities
(SPi) were calculated by dividing the amount of formed product by the amount of
transformed educt (Equation 2212) The product yield (YPi) was calculated as the
product between the conversion and the selectivity (Equation 2213) while the carbon
balance (C-balance) as the ratio between the initial concentration of the educt and the
sum of the concentrations of the carbon containing species measured at the reactor outlet
(Equation 2213)
60
)1422 ( () 100
cn
n
)1322 ( ()
)1222 ( () 100
cn
n
cn
n
S
)1122 ( () 100
0
n
1iP
Educt
iP
n
1iP
Educt
iP
iPEduct
iP
iP
0
0
Equationc
balanceC
EquationSXY
Equation
Equationc
ccX
Educt
i
iPEductiP
i
Educt
EductEduct
Educt
sdot
sdot
=minus
sdot=
sdot
sdot
sdot
=
sdotminus
=
sum
sum
=
=
The consumption and formation reaction rate was determined as
)1522 ( )( 0Equation
sg
molccr
ii
i sdot
minus=
microτ
The apparent activation energy (Ea) and the preexponential factor (lnA) were determined
from the linearized Arrhenius-equation
)2216 ( lnln EquationTR
EAr a
i sdotminus=
The activation enthalpy (∆H) and activation entropy (∆S) were calculated based on the
linearized Eyring-Polanyi equation
)1722 ( lnln EquationTR
H
R
S
h
k
T
r Bi
sdot∆
minus
∆+=
nene
61
23 Catalyst synthesis and characterization
This section describes the preparation of the catalysts which were used for catalytic and
kinetic studies reported in chapter 4 Besides the description of the preparation method
the results of physico-chemical characterization are also reported here
231 The synthesis of phase pure M1 MoVTeNbOx catalyst
The phase-pure M1 MoVTeNbOx catalyst was prepared in a relatively large batch (ca 50
g) according to the procedure developed by detail by Kolen`ko et al [8 ] This method is
adapted from Ushikubo et al [9] which lead to M1+M2 phase mixture The phase-pure
M1 material was obtained by the washing route described by Baca et al [10]
9286 mmol ammonium-heptamolybdate (AHM (NH4)6Mo7O244H2O) and 19500 mmol
NH4VO3 was dissolved in 1500 ml MQ water at 80degC The solution was cooled to 40degC
and 14950 mmol solid Te(OH)6 was added to it and dissolved 8125 mmol
NH4[NbO(C2O4)2]middotxH2O was dissolved in 500 ml MQ water at 40degC The two solutions
were mixed up and diluted to a total volume of 2500 ml by MQ water giving a solution
with a nominal metal ion concentrations normalized to molybdenum equal to
MoVTeNb=10300230125 This solution was stirred for 30 min at 40degC then spray-
dried in a Buumlchi B-191 spray-dryer The resulting solid material was calcined at 275 degC
for 1 h in synthetic air flow of 100 mlnmin followed by annealing in a Xerion rotary
tube furnace 600 degC for 2 hours in Ar flow (100 mlnmin) [2 8] A crystalline phase
mixture was produced (internal identification number 6057) consisting of 63 M1 and
37 M2 phase The BET surface area was found to be 5 m2g while the SEM indicated
large spherical aggregates The M2 phase was dissolved by treatment with 15 H2O2
solution and stirring for 24 hours After washing by distilled water and drying the
remaining solid (internal identification number 6058) was a phase pure M1 material with
a surface area of 19 m2g The SEM revealed rod-like morphology while aggregate
formation was not characteristic to this sample The shape of the ab plane is ill defined
and rather porous Finally the washed sample was activated at 600degC for 2 hours in the
rotary tube furnace under argon flow
62
Table 231 The properties of the phase-pure M1 catalysts 6059 6902 and 8947
6059 6902 8947
BET SA (m2g) 88 75 102
Phase comp M1 M1 M1
Unit cell
parameters (Aring)
Pba2 (no 32)
a=211255(2)
b=266145(2)
c=40137(2)
a=211201(1)
b=266088(2)
c=4015342)
a=211462(2)
b=266312(3)
c=401454(3)
Elem Comp MoV026Te010Nb022Ox MoV023Te010Nb024Ox --
Figure 231 The TEM image of the catalyst 6059
The resulting material (internal identification number 6059) exhibited a BET surface
area of 9 m2g The nitrogen adsorption isotherm is of type III characteristic to a
macroporous material (isotherm not shown) Because there are no meso- or micropores
internal mass transport limitation is not expected to occur In the section 223 it is shown
that the effectiveness factor is above 095 which proves that the internal mass transport
limitation is indeed negligible
63
In the XRD pattern the reflections corresponded to the phase-pure M1 material (ICSD
55097) (Figure 232) The degree of crystallinity was found to be ca 85 using rutile
TiO2 SRM 674b as internal standard The lattice parameters were determined after
Rietveld refinement (Table 231)
The TEM images revealed rod-like morphology (Figure 231)
A second batch activated from sample 6058 got the internal identification number of
8947 This showed very similar XRD pattern and catalytic properties to that of 6059
0 10 20 30 40 50 60
Intensity (au)
2 Θ Θ Θ Θ (deg)
6059 6902 8947
Figure 232 The XRD pattern of 6059 6902 and 8947
A repeated synthesis gave the sample 6902 with a similar physico-chemical and
catalytic properties with the 6059 sample This suggests the reproducibility and
reliability of the relatively large scale synthesis method reported by Kolen`ko et al [8]
References Chapter 2
1 L C Jozefowincz H G Karge E NacuteCoker J Phys Chem 98 (1994) 8053 2 M Haumlvecker S Wrabetz J Kroumlhnert L I Csepei R Naumann dacuteAlnoncourt
Yu V Kolenacuteko F Girgsdies R Schloumlgl A Trunschke J Catal submitted 3 M Baerns et al Technische Chemie Wiley-VCH 2006 145-193 4 E A Burgermeister W von Muench E Pettenpaul J Appl Phys 50 9 (1979)
5790-5794
64
5 M Baerns H Hofmann A Renken Chemische Reaktionstechnik Lehrbuch der Chemie Volume 1 Georg Thieme Verlag 3rd Edition 1999
6 I Griszligtede Die partielle Oxidation von Propan zu Acrlysaumlure Bestimmung der Reaktionskinetik und in-situ Charakterisierung des Katalysators unter Betriebsbedingungen Dissertation Universitaumlt Karlsruhe 2004 Universitaumltsverlag Karlsruhe ISBN 3-937300-17-1
7 R L Grob E F Barry Modern practice of gas chromatography 4th Ed 2004 25-65 A Braithwaite Chromatographic methods 5th Ed Kluwer Acedamic Publishers 1999 17-40
8 Yu V Kolen`ko W Zhang R Naumann d`Alnoncourt F Girgsdies T W Hansen T Wolfram R Schloumlgl A Trunschke submitted ChemCatChem 2011
9 T Ushikubo K Oshima A Kayou M Hatano X Can Li Stud Surf Sci and Catal 112 (1997) 473-480
10 M Baca J M M Millet Appl Catal A General 279 (2005) 67-77 11 wwwfluidatcom
65
Chapter 3 Structural stability of the M1 MoVTeNbOx catalyst
under propane oxidation conditions
31 Abstract
In this section the details and results of the in-situ XRD experiment are described in
which the bulk structural stability of the phase-pure M1 MoVTeNbOx under real reaction
conditions catalyst was addressed XRD diffractograms were recorded during the long
term catalytic experiment on propane oxidation reaction whereby different conditions
(steam containing and steam free net reducing stoichiometric and net oxidizing feed
compositions) The evaluation of the XRD patterns revealed that the catalyst phase purity
was not affected under any of the conditions Therefore the bulk structure of the catalyst
is stable and constant during the propane oxidation reaction
32 Introduction
Upon reviewing the literature of propane oxidation on Mo and V based oxides only a few
studies were found which addressed the question of bulk structural stability of the
catalyst under working conditions However the information concerning structural
stability under reaction conditions is an absolute prerequisite for proper catalytic kinetic
and structure-activity relationship studies
The stability of the catalyst might be influenced by different factors
bull The temperature is one of the most important ones Upon the catalyst formulation
usually the thermal treatment or activation is the last step when the desired
crystal structure is developed The activation is usually carried out at higher
temperature than the reaction temperature Therefore it is not expected that under
reaction conditions the temperature plays a role in the stability provided that the
reaction is carried out isothermally and hot-spots do not form on the catalyst
surface However because the activation is carried out in inert atmosphere (argon
or helium) and it is not evident that the catalyst is stable in presence of feed at
66
reaction conditions even if the reaction temperature is inferior to the activation
temperature
bull The redox potential When a reducing feed is used the catalyst might be reduced
which leads to change in the composition and in severe cases to the
transformation of the crystal structure On the other hand when oxidizing feed is
used and if the constituting metal ions are not in the highest oxidation state these
ions may be oxidized which also may induce phase change if the structure is not
flexible enough Grasselli et al carried out redox pulse experiments using a
phase-pure M1 MoV025Te011Nb012Ox catalyst By applying 120 pulses consisting
of C3H8 and NH3 the catalyst could be reduced as deep as 70 atomic layers of the
lattice and then reoxidized by oxygen without structural collapse [1] This showed
the stability of the catalyst bulk structure under reducing conditions Of course
under reducing conditions the product distribution changed and the propylene
formation prevailed However it was not shown whether the reoxidized catalyst
shows the same conversion and selectivity or not Zenkovets et al has also shown
that the (MoVW)5O14 may be reduced by hydrogen without structural
transformation [2]
bull The presence or absence of steam in the feed Water is a reaction product of
oxidation catalysis However frequently a high steam content (20-40 vol) is
needed to introduce in the feed for optimal catalytic performance Novakova et al
observed that in absence of the steam the catalytic performance of the
MoV03Sb025Nb008Ox (mixture of (MoVNb)5O14 (MoV)5O14 MoNbOx and
SbVOx phases) drops and the phase composition also changes [3] Upon re-
introducing the steam in the feed neither the initial phase composition nor the
catalytic performance was established Griszligtede noted that the pretreatment of the
MoV033Nb017Te025Ox catalyst at 140degC for 24 hours in the reactor using a gas
mixture consisting of 50 vol steam and 50 vol nitrogen is necessary to achieve
high selectivity (69) When the pretreatment was done with a mixture
containing only 10 vol steam the highest selectivity was around 40 Without
evidences from XRD measurements it was assumed that the steam promotes the
formation of the selective phase [4] Recknagel also supposed that the better
67
catalytic performance in acrolein oxidation to acrylic acid is due to phase change
induced by steam [5]
bull Griszligtede noted that when propane was switched to propylene in the feed the
conversion and selectivities reached the steady state only after 72 hours time on
stream Without further experimental evidences (eg XRD) this observation was
also accounted for the altering of the phase composition
bull The formation of the selective VPO phase (documented by XRD study) was
described under propane oxidation conditions by feeding propane and oxygen at
430degC then decreasing the temperature to 400degC and introducing steam [6-8]
As shown in the above enlisted literature sources there is not enough information
concerning to the
bull bulk structural stability of the phase pure Mo and V based oxide catalysts under
various reaction conditions (steam containing and dry feed low and high oxygen
content and switching from propane to propylene as educt)
bull eventual coupling between kinetics of the solid state transformation and the
kinetics of the surface catalyzed reaction
Therefore within this work foremost the above open questions were addressed In order
to find out whether under real reaction conditions phase transformation occurs or not an
in-situ XRD experiment was carried out at different steam contents and oxygen
concentrations In the section 33 the results of this experiment are summarized
For the study of the effect of steam and oxygen content on the stability under reaction
conditions experiments were carried out to vary these parameters in the fixed bed reactor
as well The catalytic performance was found to be constant over the time at any steam
content (including dry feed) and any initial oxygen concentration (sections 422 and
424) The reaction was followed for relatively long time (up to 4 hours at every space
velocity) and neither deactivation in time nor change in the selectivity was observed The
conversion measured in dry feed was found to be lower compared to the steam containing
feed Upon switching back from dry feed to the steam containing feed the catalytic
68
properties were found to be the same as before (section 422) Therefore in contrast to
the finding of Novakova et al [3] reported for the MoVSbNbOx catalyst the catalytic
properties of MoVTeNbOx are reversible when exposing it to dry feed
When the reaction was operated under reducing conditions the propane conversion was
found to be lower than in the case of stoichiometric or net oxidizing feed After
performing the reaction under reducing conditions stoichiometric feed was used again
The conversion and selectivity was comparable to that measured under reducing
conditions but it converged slowly to the value measured before exposing the catalyst to
reducing conditions (section 424 and 431)
33 In-situ XRD study on the effect of steam and oxygen
The experiment was carried out using a STOE Stadi P type diffractometer in a theta-theta
arrangement equipped with a Cu Kα1 radiation source (wavelength=154060 Aring) and a
scintillation detector A mass of 02107 g catalyst was placed in the sample holder of the
XRD setup The feed consisting of steam propane oxygen and balance helium was
supplied via heated stainless steel tubing in order to avoid condensation of the steam For
the introduction of the steam a bubbler attached to a HAAKEreg thermostat was used The
total flow rate was always 176 mlnmin giving a gas hourly space velocity of 5000 h-1
The rationale behind choosing this space velocity is that the maximum productivity in the
fixed bed reactor experiments was observed between 4500 and 9000 h-1 space velocity
(described in detail in sections 421 422) Therefore the bulk structure was envisaged to
be probed by XRD under the highest performance of the catalyst The gas mixture
leaving the XRD cell was analyzed by an OmnistarTM mass spectrometer The following
fragments were monitored in time 12 13 14 16 17 18 28 29 30 31 32 40 41 42
43 44 45 56 60 and 72
69
XRD scans were performed under every condition as follows
1 in helium (100) at room temperature
2 in helium (100) at 400degC
3 C3H8O2H2OHe=362071 vol 400degC
4 C3H8O2H2OHe=33094 vol 400degC
5 C3H8O2H2OHe=3450925 vol 400degC
6 C3H8O2H2OHe=36091 vol 400degC
7 C3H8O2H2OHe=39088 vol 400degC
8 C3H8O2H2OHe=312085 vol 400degC
9 C3H8O2H2OHe=312580 vol 400degC
10 C3H8O2H2OHe=30592 vol 400degC
11 C3H8O2H2OHe=30097 vol 400degC
12 C3H8O2H2OHe=30097 vol 400degC scan performed after long time on
stream (24 hours) under this strongly reducing condition
13 in helium (100) at room temperature
Repeated scans were performed at every condition in order to be able to observe if
eventually slow solid state transformation occurs The second reason for repeated
acquisition of the patterns is that to improve the data quality for the Rietveld refinement
The total length of the experiment was 2 weeks
First scans were made at room temperature and 400degC as well in pure helium (condition
1 and 2) Then a measurement was performed using stoichiometric feed and 20 vol
steam (condition 3) In the next step both the oxygen and steam was changed to 3 and 0
vol respectively (condition 4) In the next four conditions (5 6 7 and 8) the oxygen
content was increased from 45 (reducing) to 6 (stoichiometric) to 9 and 12 (net
oxidizing) in dry feed In the next condition 5 vol steam was introduced while keeping
the initial oxygen concentration at 12 vol The condition 10 corresponds to strongly
reducing feed (0 vol O2) in presence of 5 vol steam while in the last condition (11)
the feeding of steam was also stopped The scanning was continued while exposing the
catalyst to this extreme condition (12) for long time (ca 24 hours) After this the propane
was switched off and the final scans were recorded at room temperature in helium flow
70
The XRD patterns shown in Figure 331 indicated that under reaction conditions from 3
to 11 no new peak appeared ie no new phase was developed irrespective of the steam
content or the redox potential of the gas mixture Only slight changes were observed in
the peak intensities and positions More pronounced decrease in the peak intensity was
observed upon exposing the catalyst to extreme reducing condition (propane in helium)
for long time but the absence of a new peak suggested that no new phase was formed
The XRD patterns were evaluated quantitatively as well Rietveld refinement showed that
all the patterns correspond to phase-pure M1 MoVTeNbOx therefore phase
transformation during all the above conditions could be ruled out The lattice parameters
are shown in Figure 332
1 2 3 4 5 6 7 8 9 10 11 12 13
10
20
30
40
50
60
2 Theta (deg)
Condition
Figure 331 The XRD patterns recorded under different reaction conditions
71
0 1 2 3 4 5 6 7 8 9 10 11 12 13 14
0200400
212502150021750
267527002725
396400404
T (degC
)a (Aring)
b (Aring)
c (Aring)
Figure 332 The lattice constants determined for every condition
First it can be seen that upon heating up the catalyst in helium anisotropic lattice
expansion occurs ie the thermal expansion occured preferentially along the c and a axis
while the b lattice parameter was unaffected Under reaction conditions ranging from 3-
11 no change was observed in any of the lattice constants irrespectively of the steam
content or the redox potential However upon exposing the catalyst to extreme reducing
conditions for long time the a and b lattice constants were increasing while the c was
decreasing Finally anisotropic contraction along the c axis was observed also upon
cooling down the catalyst in inert atmosphere
The mass spectrometric data recorded during the in-situ XRD experiment was also
evaluated Because the sensitivity of a mass spectrometer changes over the time the
conversion and selectivity data could not be determined with the usual precision obtained
at the PropOx-1 fixed bed reactor setup Therefore the current of mz=72 fragment
corresponding to the acrylic acid was normalized with respect to helium The signal was
averaged over the time for every condition (Figure 333) For comparison the
concentration of the acrylic acid determined in PropOx-1 setup corresponding to three of
the conditions is shown in the same graph It can be observed that the results are
72
comparable The differences may be accounted to the fact that the MS data is only semi-
quantitative while the GC-MS data is quantitative (section 22) Furthermore the other
reason might be that the sample holder cell o the in-situ XRD setup has a very different
geometry compared to the PropOx-1 setup described in the section 22
1 2 3 4 5 6 7 8 9 10 11 12 13
0000
0002
0004
00
02
04
06
Norm
alized average intensity m
z=72 (au)
Condition
Concentration of AA Propox1 (vol
)
Figure 333 The normalized average intensity corresponding to acrylic acid during the in-situ XRD
experiment monitored by on-line MS (black squares) The concentration of acrylic acid determined in the PropOx-1 fixed bed reactor (blue dots)
34 STEM analysis of the catalyst before and after
the in-situ XRD experiment
The catalyst sample was analyzed by means of scanning transmission electron
microscopy (STEM) before and after the in-situ XRD experiment The elemental analysis
was performed by EDX at selected spots
The STEM images are shown in Figure 341 It can be observed that the particle size was
not affected by the reaction However the images corresponding to the post-catalytic
sample revealed pitting-like holes on the particles The occurrence of the voids is
statistically distributed and the void size is approximately the same This suggests that the
transformation from the initial to the final state of the catalyst is not a topotactic
transformation (ie no reaction front can be observed)
73
Before reaction
After reaction
Figure 341 STEM images of the catalyst before and after the in-situ XRD experiment
The elemental mapping of the particles before reaction showed homogeneous distribution
of all the constituting elements (Figure 342) In contrast to this the post catalytic sample
showed a very heterogeneous distribution of the oxygen supporting the fact that the
catalyst was indeed reduced Depletion of the tellurium content was also observed in the
spots marked with red crosses in the Figure 343
100 nm100 nm100 nm100 nm100 nm
100 nm 20 nm20 nm20 nm20 nm20 nm
20 nm
50 nm50 nm50 nm50 nm50 nm
100 nm 20 nm20 nm20 nm20 nm20 nm
20 nm
74
Figure 342 The elemental mapping of the catalyst before reaction
Figure 343 The elemental mapping of the catalyst after reaction
O Nb
Te V Mo
Mo V Te
Nb O
75
35 Conclusions
Upon reviewing the literature dealing with selective oxidation of propane to acrylic acid
it was found that the information concerning the structural stability or instability of the
catalyst is seldom reported Novakova et al has shown that the deactivation of the
MoVSbNbOx phase mixture in dry feed is irreversible and it is a consequence of
irreversible change in the phase composition Griszligtede also reported the decay of the
catalytic performance over the MoVTeNbOx catalyst but no information was provided
about the phase composition either before or after the catalytic experiments
The motivation for the work presented in this section is the fact that the structural
stability of a catalyst under various reaction conditions is a criterion for the proper
catalytic and kinetic study
In-situ XRD study was performed on the effect of steam and the oxygen concentration
using a phase-pure MoVTeNbOx catalyst The measurements were done at the space
velocity corresponding to the maximum productivity of the catalyst The steam content
was varied between 20 and 0 vol while the redox potential of the feed between net
oxidizing stoichiometric moderately reducing conditions Neither the XRD patterns nor
the lattice parameters were changing significantly under these conditions suggesting that
the catalyst bulk structure is robust enough to withstand the variation of the parameters in
such a broad interval At the end very strongly reducing feed (3 vol propane and 97
vol helium) was applied for long time on stream as well No new peak appeared in the
XRD pattern indicating that no new phase appeared but the lattice constants changed
under this extreme condition Additionally the STEMEDX analysis of the spent catalyst
revealed that pitting-like holes appeared on the catalyst particles and depletion of the
tellurium content was also noted
However the bulk structure of the used phase-pure M1 MoVTeNbOx catalyst is stable
under conditions relevant to catalytic applications Therefore the kinetics of the
heterogeneously catalyzed reaction is not coupled with any solid-state transformation
The next chapter reports the catalytic and kinetic study of propane oxidation over the
phase-pure M1 MoVTeNbOx catalyst
76
References Chapter 3
1 R K Grasselli D J Buttrey J D Burrington A Andersson J Holmberg W Ueda J Kubo C G Lungmair A F Volpe Top Catal 38 (2006) 7-16
2 G A Zenkovets G N Kryukova V Yu Gavrilov S V Tsybulya V A Anufrienko T A Larina D F Khabibulin O B Lapina E Roumldel A Trunschke T Ressler R Schloumlgl Materials Chemistry and Physics 103 (2007) 295-304
3 E K Novakova J C Veacutedrine E G Derouane Catalysis Letters 83 3-4 (2002) 177-182
4 I Griszligtede Die partielle Oxidation von Propan zu Acrylsaumlure Bestimmung der Reaktionskinetik und in-situ Characterisierung des Katalysators unter Betriebsbedingungen Dissertation Universitaumlt Karlsruhe 2004 Universitaumltsverlag Karlsruhe ISBN 3-937300-17-1
5 R Recknagel Chemische Technik 46 6 (1994) 324-331 6 G Landi L Lisi J C Volta Chem Commun 9 4 (2003) 492-493 7 G Landi L Lisi J-C Volta J Mol Catal A 222 (2004) 175-181 8 G Landi L Lisi J C Volta Catal Today 91-92 (2004) 275-279
77
Chapter 4 Kinetic studies of propane oxidation to acrylic acid on a phase-pure
MoVTeNbOx catalyst
41 Abstract
A detailed kinetic study is presented for the phase pure M1 MoVTeNbOx catalyst
Kinetic studies including the effect of temperature steam- propane- and oxygen content
variation were performed The oxidation of propylene acrolein carbon monoxide and
water gas shift reaction gave important additional information concerning the reactivity
of the intermediates and reaction pathways respectively Catalytic experiments were
performed also in a two-stage reactor system consisting of two reactor tubes connected
serially
42 Kinetic studies on phase-pure M1 MoVTeNbOx
According to the motivation of the present work a phase-pure and structurally stable
MoVTeNbOx catalyst was envisaged for detailed kinetic study in the propane oxidation
reaction The exceptional stability of the phase-pure M1 MoVTeNbOx catalyst under
catalytically relevant reaction conditions was evidenced in the Chapter 3 In this chapter
the results of the kinetic and catalytic experiments are presented The temperature
propane- oxygen- and steam contents were varied Furthermore the reactivity of the
oxidation in propylene intermediate was carried out in the temperature interval
corresponding to propane oxidation reaction (360-400degC) and high space velocity
(typically 20000 and 80000 h-1) The effect of steam on propylene oxidation was also
studied
Acrolein oxidation was carried out in the typical temperature interval corresponding to
propane oxidation and very high space velocity (GHSV=250000 h-1)
CO oxidation and water gas shift reaction was carried out in the temperature interval of
propane oxidation for revealing the secondary pathways that CO might be involved in
On the other hand the CO oxidation activity was used as a proxy for the amount of
electrophilic oxygen species on the catalyst surface
A two-stage reactor system was used for studying the effect of stage-wise addition of
different gases (O2 N2O C3H6 CO and CO2)
78
The oxygen addition in the two-stage reactor design revealed that the acrylic acid yield
can be increased in contrast to the oxygen content variation in the conventional single-
tube fixed bed reactor
Nitrous oxide addition showed no effect on the reactivity Moreover the nitrous oxide
conversion was found to be zero under every condition suggesting that the phase pure
M1 MoVTeNbOx catalyst is not reoxidized by N2O
The product distribution upon propylene addition in the two-stage reactor revealed that
acrylic acid acetic acid carbon monoxide and carbon dioxide are formed from
propylene
Upon addition of CO in the two stage reactor no change in the catalytic activity was
observed CO was not further oxidized which suggests that this is an inert end product
besides the CO2 Furthermore this experiment indicated a very low abundance of the
electrophilic oxygen species during propane oxidation reaction
The addition of CO2 in the two-stage reactor showed also no influence on the product
distribution of propane oxidation reaction
421 Variation of the contact time and temperature
For the kinetic study the contact time was varied up to 202 gsml by changing the flow
rate and the catalyst mass The experiments were performed at 360 380 and 400degC The
feed composition was kept constant at C3H8O2H2ON2=364051 vol
The dimensionless concentration profiles corresponding to all the detectable compounds
(propane propylene acrylic and acetic acid CO and CO2 respectively) are presented in
the Figure 421 The normalization of the concentrations was done by dividing the actual
concentrations with the initial concentration of propane By numerical differentiation of
the concentration-contact time curves it is possible to obtain the rates of propane
consumption and the rates of product formation respectively Strictly speaking the rates
can be obtained only in the differential regime because by definition within the
differential regime the concentrations change linearly with the contact time In the
integral regime the curves deviate from linearity therefore the rates depend on the extent
of the reaction Highly nonlinear concentration profiles can be observed for the reaction
79
products above 01 gsml contact time Though for the qualitative description of the
kinetic curves the rate of propane consumption and product formation is considered
irrespective of the integral or differential mode
The highest acrylic acid productivity is observed in the integral regime For this reason
in order to find out the effect of operational variables (temperature redox potential and
the steam content) and optimize the acrylic acid yield it was necessary to carry out the
experiment also in the integral mode
In this section the effect of temperature on the catalytic properties and kinetic rate
constants are presented
Qualitatively the concentration profiles can be described as follows
The propane consumption rate increases with temperature
Propylene is the first intermediate of the reaction as indicated by a curve that passes
through a maximum
The CO2 and CO formation rate increases with the temperature However the CO
formation rate was found to be higher than the CO2 formation rate Thermodynamically
the carbon monoxide may be further oxidized to CO2 This could mean that possibly CO
is formed first and in a consecutive step it may be oxidized to the thermodynamically
favored product CO2 If CO would be readily further oxidized to CO2 a maximum
would be observable in the CO concentration profile However in the studied contact time
interval the CO concentration profile does not show a maximum at any temperature
Measurements at higher contact times were avoided because of complete oxygen
conversion Therefore from these data the CO oxidation can neither be stated nor refuted
The reactivity in CO oxidation over MoVTeNbOx catalyst was addressed in a separate
series of experiments The results are presented in detail in subchapter 427 As it is
shown there the CO oxidation and water gas shift activity is negligible under the reaction
conditions relevant for the selective oxidation reactions Therefore CO and CO2 are
formed in independent pathways during the propane propylene and acrolein oxidation
reactions
The acetic acid is a minor byproduct which appears at contact times higher than 01
gsml No maximum can be observed on the concentration profile though it can not be
stated whether it is a relatively stable end product or it is further oxidized to CO or CO2
80
00 05 10 15 2000
02
04
06
08
10
12
360degC
380degC
400degCy C
3H8
WF (gsml)
00 05 10 15 20
000
001
002
003
004
005
006 360degC
380degC
400degC
y C
3H6
WF (gsml)
C3H8 C3H6
00 05 10 15 20
00
01
02
03
04
05 360degC
380degC
400degC
y AA
WF (gsml)
00 05 10 15 20 25
000
004
008
012
016
020 360degC
380degC
400degC
yHAc
WF (gsml)
AA HAc
00 05 10 15 20 25
00
01
02
03
04
05 360degC
380degC
400degC
y CO
WF (gsml)
00 05 10 15 20 25
00
01
02
03
04
05 360degC
380degC
400degC
y CO2
WF (gsml)
CO CO2
Figure 421 The evolution of concentrations with the residence time at different temperatures Squares ndash experimental data dashed curves ndash fitted kinetic curves based on reaction model 1 (for modeling see
section 64) Feed composition C3H8O2H2ON2=364051 vol Catalyst ID=6059
81
The acrylic acid is the desired product of the reaction Its concentration ndash therefore its
formation rate as well ndash increase with the contact time and reaction temperature
However above 15 gsml contact time the conversion of oxygen approaches 100
which leads to a high redox potential gradient along the reactor High oxygen conversions
were avoided because the catalyst particles in the bottom of the catalytic bed are reduced
and the kinetics may change with the reduction degree of the catalyst surface The
maximum acrylic acid yield was 25-30 depending on the temperature
422 Variation of the steam content
The steam content variation was performed in the interval between 0 and 40vol and for
a contact time up to 090 gsml (GHSV=4500 h-1) The feed consisted in every case of 3
vol propane and 6 vol oxygen The steam content was decreased from 40 to 0 vol
by steps of 10 vol the balance being N2 at a reaction temperature of 400degC
The experiments presented here were started up with steam containing feed (40 vol)
then the steam content was then reduced by 10 vol The catalytic properties were
measured for relatively long time in dry feed in order to be able to observe if deactivation
occurs Subsequently the catalytic performance was re-measured using 20 vol steam
containing feed
The ldquoreasonably long term stabilityrdquo of the catalytic properties in steam free feed is
demonstrated in Figure 422 The adjective of reasonability in the context of long term
stability is related here to the time resolution of the used analytical methods As shown in
the Experimental part (section 225) the gas chromatographic setup has a time
resolution of one injection17 minutes On the other hand in situ XRD experiments were
carried out on the effect of oxygen and steam (Chapter 3) The time resolution of the
XRD setup is several hoursscan
As shown by Figure 422 the stability in time of the catalytic performance exceeds
satisfactorily the gas chromatographic analysis time Neither catalyst deactivation nor
change in the selectivity was observed within the studied time on stream intervals up to 4
hours at different space velocities The stability of catalytic performance makes possible
to perform the kinetic study of propane oxidation also under steam free feed conditions
82
It has to be emphasized that even if no steam is fed in the reactor water is produced by
the reaction on the active sites of the catalyst Therefore it would be improper to state
that the experiments were carried out under dry conditions Moreover there is a gradient
of produced water concentration along the catalytic bed Indeed the chromatographic
analysis of the reactor effluent gas showed a detectable amount of water However due to
highly asymmetric peak shape and low peak area the quantification of the formed water
was difficult
It is important to notice that at a contact time of 0227 gsml (GHSV=18000 h-1) the
conversion is low and at the limit of the differential operation mode The most abundant
product is propylene with a selectivity of ca 50 The acrylic acid selectivity is quite
low and acetic acid is not produced at all
At lower space velocities the conversion increases and the selectivity to acrylic acid
becomes higher than the propylene selectivity Additionally acetic acid appears as
byproduct Below the space velocity of 9000 h-1 the selectivity to acrylic acid decreases
due to total oxidation In every case however the selectivity to CO was higher than the
selectivity to CO2
0 100 200 300 400 500 600 700
0
10
20
30
40
50
60
70
80
90
100
GHSV=
2500h-1
GHSV=
4500h-1GHSV=9000h
-1
Conversion Selectivity Yield ()
X C3H8 X O2 S AA S CO2 S C3H6 S HAc S CO Y AA C-bal
TOS (min)
GHSV=18000h-1
Figure 422 The stability of catalytic performance in steam-free feed
83
After performing the catalytic performance in dry feed the catalytic properties were re-
measured using a feed mixture containing 20 vol steam Upon immediate switching
from dry feed to steam containing feed the conversions and selectivities were found to be
constant over the time on stream within experimental errors Moreover the catalytic
performance was the same as before exposing the catalyst to dry feed (Figure 423)
This suggests that the catalyst responds dynamically to the changes of the steam content
in the feed The changes are completely reversible and faster than the gas
chromatographic analysis time of 17 minutes The productivity of the catalyst expressed
in terms of conversion of propane the selectivity and yield to acrylic acid is displayed on
Figure 423 at a space velocity of 18000 9000 and 4500 h-1 (WF=0228 0455 and
0904 gsml respectively)
In the concentration interval between 20 and 40 vol the catalytic performance is not
influenced significantly by the steam
Below a steam content of 20 vol both the conversion and selectivity drops
dramatically Nevertheless in contrast to the observation reported by Novakova et al [1]
this drop is reversible after switching back to the feed containing 20 vol steam the
conversions and selectivities were comparable to those determined before exposing the
catalyst to dry feed
20 0 20 400
20
40
60
80
100
Conversion Selectivity ()
H2O concentration in feed mixture (vol)
XC3H8 GHSV=4500h-1
XC3H8 GHSV=9000h-1
XC3H8 GHSV=18000h-1
SAA GHSV=4500h-1
SAA GHSV=9000h-1
SAA GHSV=18000h-1
20 0 20 400
5
10
15
20
25
30
Yield ()
H2O concentration in feed mixture (vol)
YAA GHSV=4500 h-1
YAA GHSV=9000 h-1
YAA GHSV=18000 h-1
Figure 423 The effect of steam on the acrylic acid productivity at GHSV=4500 9000 and 18000 h-1
84
The temperature variation between 360 and 400degC using reaction mixtures containing 0
10 and 40 vol steam was also performed The catalytic properties expressed in terms of
propane conversion acrylic acid selectivity and yield are summarized in the Figure 424
Similarly to the trend demonstrated in Figure 423 the conversion of propane and the
selectivity to acrylic acid is positively influenced at every temperature (Figure 424)
Although the conversion rises and the selectivity decreases slightly the yield to acrylic
acid levels off at around 380degC
360 380 4000
20
40
60
80
100
Conversion Selectivity ()
T (degC)
XC3H8 0vol H2O GHSV=4500h-1
XC3H8 10 vol H2O GHSV=4500h-1
XC3H8 40vol H2O GHSV=5000h-1
SAA 0vol H2O GHSV=4500h-1
SAA 10vol H2O GHSV=4500h-1
SAA 40vol H2O GHSV=5000h-1
360 380 400
0
10
20
30
40
50
Yield ()
T (degC)
YAA 0vol H2O GHSV=4500h-1
YAA 10vol H2O GHSV=4500h
-1
YAA 40vol H2O GHSV=5000h
-1
Figure424 The effect of temperature on the catalytic performance at 0 10 and 40 vol steam content Catalyst 6059
The activation parameters (apparent activation energy logarithm of the pre-exponential
factor activation enthalpy and entropy respectively) were calculated using the linearized
form of the Arrhenius- and Polanyi-Eyring equations The numerical values of these
activation parameters are summarized in Table 421
It can be observed that in the presence of steam the apparent activation energy is reduced
significantly by a factor of 24 when 40 vol steam is present in the feed mixture The
logarithm of the pre-exponential factor and the activation entropy decreases as well
indicating that in presence of steam both the number of collisions per unit surface and
also the structure of the activated complex is influenced On the other hand the activation
enthalpy is larger when steam is present in the feed
85
Table 421 The activation parameters of propane consumption at different steam contents
Activation
parameter
C3H8 consumption
0 vol H2O 10 vol H2O 40 vol H2O
Ea (kJmol) 95 plusmn 13 76 plusmn 7 39 plusmn 8
lnA 20 plusmn 2 17 plusmn 1 11 plusmn 1
∆H (kJmol) -8970 plusmn 002 -7026 plusmn 001 -3349 plusmn 001
∆S (JmolK) -9258 plusmn 003 -11836 plusmn 002 -16822 plusmn 002
A decreasing trend in the apparent activation energy of propane oxidation on
MoVSbNbOx catalyst was reported by Novakova et al In dry feed the apparent activation
energy was found to be 68 kJmol while only 50 kJmol at 25 vol steam content [1]
However in the work reported by Novakova et al the MoVNbSbOx catalyst was
deactivating and the bulk structure was altered irreversible in steam-free feed Therefore
the apparent activation energy of 68 kJmol was probably not determined under steady-
state conditions
The concentration profiles from contact time variation at different steam concentrations
are presented in Figure 425 In the following the qualitative information arising from
these plots are summarized
The propane consumption rate depends on the steam content of the feed The lowest
consumption rate was observed in a steam free feed The presence of steam enhances the
consumption rate however this positive effect levels off above the concentration of 20
vol
This observation is in accordance with the trends reported by Novakova et al and
Griszligtede [1-4]
The propylene concentration profile is similar at all steam contents However the contact
time (WFmax) corresponding to the maximum propylene concentration shows the
following dependence on the steam content 0272 gsml at 0 vol steam 0227 gsml at
10 vol steam and 0185 gsml for 20 30 and 40 vol steam The value of WFmax is
related to the formation and consumption rate constant of propylene In case of the first
86
order consecutive reactions the WFmax is equal to the logarithmic average of the rate
constants of the steps involving the intermediate product
Figure 425 The effect of steam on the concentration profiles
00 02 04 06 08 1000
02
04
06
08
10
12 0 vol H
2O
10 vol H2O
20 vol H2O
30 vol H2O
40 vol H2O
y C3H8
WF (gsml)
00 02 04 06 08 10000
002
004
006 0 vol H
2O
10 vol H2O
20 vol H2O
30 vol H2O
40 vol H2O
y C3H6
WF (gsml)
C3H8 C3H6
00 02 04 06 08 1000
01
02
03
04 0 vol H
2O
10 vol H2O
20 vol H2O
30 vol H2O
40 vol H2O
y CO2
WF (gsml)
00 02 04 06 08 1000
01
02
03
04 0 vol H
2O
10 vol H2O
20 vol H2O
30 vol H2O
40 vol H2O
yCO
WF (gsml)
CO2 CO
00 02 04 06 08 10000
002
004
006
008
010 0 vol H
2O
10 vol H2O
20 vol H2O
30 vol H2O
40 vol H2O
y HAc
WF (gsml)
00 02 04 06 08 10000
005
010
015
020
025
030 0 vol H2O
10 vol H2O
20 vol H2O
30 vol H2O
40 vol H2O
y O2
WF (gsml)
CH3COOH CH2CHCOOH
87
The decrease of WFmax suggests that presence of steam increases the increase of the ratio
between the consumption and the formation rate constant of propyleneOn the other hand
not only the position of the maximum is related to the formation and consumption rate
constants but the actual concentration of the intermediate product as well At high
contact times the decay of propylene concentration is more enhanced in presence of
steam This also suggests that steam increases the rate constant of further oxidation of
propylene [5]
The CO and CO2 concentration profiles share the same qualitative features compared to
the dry feed both the CO and CO2 formation rates are reduced already in the presence of
10 vol steam
A further increase of steam concentration does not further reduce the rates of CO and
CO2 formation It is also notable that the rate of CO formation is higher than CO2
formation rate under every condition Nevertheless the concentration profile does not
reveal more information about the steps by which these total oxidation products are
formed Therefore it could not be established whether CO was formed as a first total
oxidation product and then further oxidized to CO2 or they are products of parallel and
independent steps This issue was addressed and elaborated in subchapters 427 and
433 where results concerning the CO oxidation water gas shift reaction and addition of
CO in the two-stage reactor are presented respectively
The formation rate of acrylic acid and acetic acid is enhanced significantly in presence of
steam in the feed in accordance with the observations of Griszligtede [2 3] Novakova et al
[1] Dubois et al [6] and Zheng et al [7] The maximum formation rates are observed at
20 and 30 vol steam concentration At 40 vol water content the acetic and acrylic acid
concentrations are slightly lower compared to those determined at 20 and 30 vol steam
content especially at contact times close to 10 gsml
Neither the acetic acid nor the acrylic acid concentration passes a maximum in the
studied contact time interval The only exception is the measurement carried out without
steam in the feed in this measurement the concentration profiles of acetic acid and
acrylic acid are flattened at high contact times but no net decay can be observed This
shows that both acids are relatively stable against further oxidation
88
423 Variation of the propane content
The propane concentration variation was performed in the interval between 1 and 3 vol
for the determination of the partial order with respect to propane For this purpose the
concentration of oxygen and steam was kept constant at 6 and 40 vol respectively the
nitrogen making up the balance (Figure 426)
1 2 3 40
20
40
60
80
100
X C3H8 X O2 S AA S CO2 S C3H6 S HAc S CO C-∆∆∆∆
Conversion Selectivity ()
x=C3H
8 concentration (vol)
Figure 426 The effect of the propane concentration on the catalytic performance
C3H8O2H2ON2=x640(54-x) vol T=400degC GHSV= 34280 h-1 WF=011 gsml Catalyst 6059
Because the propane concentration was varied at constant oxygen concentration the
redox potential was stoichiometric with respect to the propane to acrylic acid reaction (in
the case of the feed C3H8O2=36 vol) and net oxidizing (in the case of C3H8O2=26
and 16 vol feeds respectively) The experiment was performed at 400degC and a contact
time of 011 gsml
The propane conversion is relatively independent on the initial propane concentration
Propylene is the main product while other products in the order of abundance are acrylic
acid CO CO2 and acetic acid In case of slightly oxidizing feed (C3H8O2=26 vol) the
selectivities were very similar to that obtained for stoichiometric feed while in case of
89
strongly oxidizing feed (6-fold excess of oxygen) the propylene selectivity increased
slightly at the expense of acrylic acid selectivity
For kinetic modeling the partial order with respect to reactants propane and oxygen
were determined using a power rate equation This power rate equation contains two
independent variables the concentrations of propane and oxygen respectively (Equation
421) Because of this the reaction order with respect to both components can be
obtained by partial derivation of the rate equation if both concentrations are varied
simultaneously in the experiments (Equations 422 and 423) On the other hand if the
concentration of one component is kept constant the rate law is simplified Since the
initial oxygen concentration was 6 vol in all the experiments the two constant terms on
the right hand side of the power law can be contracted into a single apparent rate constant
kacute (Equation 424) Then the power law will contain only one variable The reaction
order m can be determined from the slope of the straight line of the double-logarithmic
plot according to the linearized equation 425 (Figure 427) [8 9]
)524 ( lnlnln
)424 (
)324 ( ln
ln
)224 ( ln
ln
)124 (
08383
08383
02
083
02083
Equationcmkr
Equationckr
Equationc
rn
Equationc
rm
Equationcckr
HCHC
m
HCHC
O
HC
n
O
m
HC
sdot+=
sdot=
partpart
=
partpart
=
sdotsdot=
The slope of the above plot shown below is equal to 110plusmn001 and consequently the
reaction is first order with respect to propane
The application of the integral method supported that the reaction is first order with
respect to propane the simulated concentration profile based on the integrated rate
equations containing a first order step with respect to propane is in good agreement with
the experimentally determined profile over a wide contact time interval (Figure 421)
This is an indication that first order kinetics is valid under both differential and integral
regimes [8]
90
-50 -45 -40 -35 -30-10
-08
-06
-04
-02
00
02
04
ln rC3H8
ln(cC3H8)ττττ=0
Figure 427 Determination of the reaction order with respect to propane
424 Variation of the oxygen content
The effect of the initial oxygen concentration was also studied The initial oxygen
concentration was varied in the interval from 4 to 15 vol keeping the initial propane
concentration constant at 3 vol Thus the catalytic experiments were performed under
three redox potentials of the gas mixture
i) reducing at 4 vol O2
ii) stoichiometric at 6 vol O2 and
iii) net oxidizing at 9 12 and 15vol O2 respectively
91
4 6 8 10 12 14 160
20
40
60
80
100
y=O2 concentration (vol)
Conversion Selectivity ()
X C3H8 X O2 S AA S CO2 S C3H6 S HAc S CO Y AA
Figure 428 The effect of the oxygen concentration on catalytic performance
C3H8O2H2ON2=3y40(57-y) vol T=400degC GHSV= 4500 h-1 WF=0904 gsml catalyst 6059
The redox potential in terms of reducing stoichiometric and oxidizing feed was defined
with respect of the stoichiometry of 12 with respect to propane and oxygen
corresponding to the propane to acrylic acid transformation
Under reducing conditions both the conversion and selectivity to acrylic acid were found
to be slightly lower compared to the catalytic performance observed at stoichiometric and
oxidizing conditions However the conversion selectivity and consequently also the
yield to acrylic acid levels off at 6 vol O2 as demonstrated in Figure 428 The fact that
the propane conversion does not depend on the initial oxygen concentration under
stoichiometric and oxidizing conditions suggests that the O2 activation is not rate
limiting
For the determination of the reaction order with respect to oxygen the power rate law
was considered
427)(Equation lnlnln
426)(Equation
022
022
OO
n
OO
cnkr
ckr
sdot+=
sdot=
92
-40 -35 -30 -25 -20 -15 -10000
025
050
075
100
125
ln rO2
ln (cO2)ττττ=0
Figure 429 Determination of the reaction order with respect to oxygen Cat 6059
Since the initial propane concentration was constant at 3 vol in all the experiments the
first two terms in the right hand side of the power law were contracted into a single
apparent rate constant ḱ The reaction order was determined from the slope of the straight
line of the double-logarithmic plot (Figure 429) according to the linearized equation
427
The integral oxygen consumption rate was calculated as the product between the
fractional conversion (xO2) and the molar flow of oxygen in the feed (uO2) expressed in
micromolgs Weighted linear regression of the double-logarithmic plot gave a reaction order
with respect to oxygen equal to nO2=0512plusmn0002
Griszligtede and Balcells et al reported similar catalytic properties to that shown on Figure
428 [2 3] Under net oxidizing conditions (C3H8O2 ratio ranging from 26 to 220) the
propane conversion and product selectivities were the same for every oxygen
concentration and contact time [2 3 10] Balcells et al used reducing stoichiometric and
oxidizing feed the C3H8O2 ratio being between 115 and 14 The propane consumption
rate and acrylic acid formation rate leveled off at the molar ratio of C3H8O2=12 [2]
93
In contrast Zheng et al noted an increase in the propane conversion with the C3H8O2
molar ratio varied between 11 and 15 The highest selectivity and yield of acrylic acid
was observed at a molar ratio of 13 [7]
425 Propylene oxidation
Upon analyzing the concentrationndashresidence time plot propylene presents the first
maximum This means that it is an intermediate in the direct oxidation of propane to
acrylic acid The application of the delplot technique (section 64) also supported that
propylene is an intermediate At higher contact times where the acrylic acid selectivity is
higher the propylene selectivity is low usually less than 10 On the other hand
propylene is known to be more reactive in oxidation reactions
The selective oxidation of propylene is usually carried out at lower temperatures (325-
350degC) than propane oxidation [11] For these reasons the authors stated that the
oxidative dehydrogenation is the rate determining step in propane oxidation to acrylic
acid arguing that once the propylene is formed it reacts readily further to acrylic acid
and byproducts Griszligtede also reported the propylene oxidation over M1 and M2 phase
mixture MoVTeNbOx on steatite balls The reaction was performed at a lower
temperature interval (310-330degC) because at higher temperature the propane conversion
was nearly 100 Kinetic experiments on propylene oxidation were done at 360degC
However it may be inappropriate to extrapolate the reactivity and reaction kinetic data
from 310-360deg to 360-400degC [3]
A possible strategy for unraveling the pathways and kinetics of a complex reaction such
as propane oxidation is the bottom to top approach According to this approach catalytic
reaction is carried out using the reaction products and intermediates as educts The
product distribution gives information concerning the reaction pathways while the rates
show the relative reactivity of all the compounds However the reaction conditions
(temperature redox potential) should be chosen in such a way to approach those of the
one-step propane oxidation conditions in order to avoid an unjustifiable extrapolation
94
In order to explain the reactivity difference in propylene oxidation the results of two sets
of experiment are presented here
(a) at low GHSV of 5000 h-1 (WF=072 gsml) and in a low temperature interval
(230-270degC) (Figure 4210 top)
(b) at higher GHSV of 20000h-1 (WF=0018 gsml) and in the temperature
interval between 360 and 400degC (Figure 4210 bottom)
230 240 250 260 270
0
20
40
60
80
100
X C3H6 X O2 S AA S CO2 S Ace S HAc S CO C-bal
Conversion Selectivity ()
T (degC)
360 370 380 390 400
0
20
40
60
80
100
X C3H6 X O2 S AA S CO2 S Ace S HAc S CO C- bal
Conversion Selectivity ()
T (degC)
Figure 4210 Propylene oxidation with 6902 Feed composition C3H6O2H2ON2=364051 vol Top
GHSV=5000 h-1 bottom GHSV=20000 h-1 Catalyst 6902
95
In both experiments the feed composition was the following
C3H6O2H2ON2=364051vol The oxygen and steam contents were chosen to be
equal with that of the feed for propane oxidation on this catalyst
In the case (a) the propylene conversion was high despite of the low temperature
suggesting the high activity of the catalyst The main product was acetone its substantial
selectivity dropped approximately linearly with the temperature The selectivity of acrylic
acid - the second most abundant product - showed an increasing trend with the
temperature
The CO2 CO and acetic acid were found to be minor products the maximum selectivities
being 43 36 and 23 respectively Surprisingly maleic anhydride was also produced in
quite significant amounts as identified on the chromatogram by the mass spectrometric
detector
However the quantification of this product was not possible because of the very broad
and irreproducible peak shape in the chromatogram One reason for the scarce
reproducibility is that the maleic anhydride is a larger molecule and more polar than
acrylic acid The second difficulty is related to the fact that maleic anhydride hydrolyzes
to maleic acid in presence of the high steam content of the feed Hydrolysis may happen
in the downstream tubing of the reactor system as well as in the DB-1 column gas
chromatograph causing broad peaks with irreproducible peak areas
The temperature interval in case (b) was identical with that used for the propane
oxidation reaction Almost complete propylene conversion was achieved at a relatively
high space velocity of 20000 h-1 In contrast to the low space velocity ndash low temperature
experiment in this case the acrylic acid is the most abundant product with a maximum
selectivity at a reaction temperature of 380degC
A small amount of acetone is also produced during the reaction but its selectivity sinks
strongly with increasing reaction temperature CO2 CO and acetic acid are produced in a
higher amount than in the experiment carried out at low space-velocity and low
temperature An inversion can be observed in the selectivity ratio between the CO2 and
CO compared to the experiment done in the low temperature interval with five times
longer contact time
96
It is notable that a substantial amount of maleic anhydride was also produced but the
quantification problem was more severe than is case (a) Therefore the maleic acid
selectivity was not calculated in any of the above two cases which led to a systematic
error in the carbon balance as shown in the Figure 4210 Nevertheless the formation of
maleic acid a four carbon atom containing product from propylene is indeed not
straightforward One possible explanation is that hydrogen radical was removed from the
methyl group of propylene Then two allyl radicals recombined to benzene which finally
was oxidized to maleic acid
Because the propylene conversion at 270degC GHSV=5000h-1 and 360degC 20000h-1 are
very similar the selectivities obtained under these two conditions can readily be
compared It is to be observed that the product distribution is very different In the low
space velocityndashlow temperature experiment acetone is the most abundant product
followed by acrylic acid while in the higher space velocityndashhigher temperature
experiment these selectivities were inverted On the other hand during propane
oxidation reaction acetone is not produced in detectable amounts even if propylene is an
intermediate product Also the CO and CO2 selectivity ratio is inverted in the low
temperature interval
Therefore this experiment exemplifies that the catalytic and kinetic experiments of
propylene and other intermediate oxidation should be performed in the temperature
interval which is identical to that used for propane oxidation
The effect of steam on the catalytic performance of propylene oxidation over phase pure
MoVTeNbOx was also investigated (Figure 4211) The steam content variation was
performed using the same procedure as in the case of propane oxidation The steam
content was reduced from 40vol to 0 vol by 10 vol steps No deactivation was
observed in absence of steam After exposing the catalyst to dry feed the catalytic
performance was re-measured at 20 vol steam content
97
20 10 0 10 20 30 40
0
20
40
60
80
100
Conversion Selectivity () X C3H6
X O2 S AA S CO2 S Ace S HAc S CO C-bal Y AA
z=H2O concentration in feed mixture (vol)
Figure 4211 The effect of H2O on propylene oxidation Feed composition C3H6O2H2ON2=36z(91-z)
vol GHSV=80000 h-1 T=400degC Catalyst 6902
The reaction temperature was set to 400degC which is identical with the temperature where
the steam content variation for propane oxidation was carried out Since in the
temperature variation at a space velocity of 20000 h-1 almost 100 propylene conversion
was observed at 400degC the steam content variation was carried out at a space velocity of
80000 h-1 (WF= 0045 gsml) At this high space velocity the highest conversion was
approximately 40 between 20 and 40 vol steam content
Similarly to the observations for the steam content variation in the propane oxidation the
conversion decreased continuously below 30 vol steam content while a significant
drop below 20 vol steam concentration also for propylene oxidation The acrylic acid
selectivity did not change significantly upon decreasing the steam content of the feed
However the acetone selectivity decreased dramatically at 0 vol steam content no
detectable amount of acetone was formed This suggests the involvement of steam in
acetone formation according to the oxy-hydration pathway [12-16]
It is notable that in absence of co-fed steam the selectivity to total oxidation products
increased and the ratio between the COCO2 selectivities was inverted compared with
experiments carried out in the steam-containing feed Since the propylene conversion was
relatively low maleic anhydride formation was also lower which led to a better carbon
balance than that reported for the space velocity of 20000 h-1
98
Upon re-measuring the catalytic performance in 20 vol steam the catalytic
performance was found to be identical with the one determined before measuring in a dry
feed The reversibility of both the conversion and selectivity with the steam content is
similar to that observed in the case of propane oxidation
426 Acrolein oxidation
Propylene was found to be the first intermediate in propane selective oxidation It is
supposed that the oxidation of propylene to acrylic acid proceeds through allyl alcohol
and acrolein intermediates This assertion was supported by the fact that the oxidation of
propylene to acrylic acid in a single elementary step is not probable because such a
transformation would require the elimination of two hydrogen atoms and insertion of two
oxygen atoms
Postulated reaction pathways take into consideration acrolein and sometimes allyl-
alcohol formation as well although only in a few studies is their detection reported under
catalytic conditions [16-21]
Concepcioacuten et al reported the detection of a π-allylic intermediate (CH2=CH-CH2-O-) by
means of FTIR spectroscopy on MoVTeNbOx catalyst [22] It was suggested that this
surface intermediate of the propylene oxidation is transformed to acrylic acid by a redox
mechanism via acrolein However in the gas phase no acrolein was detected
In the propane and propylene oxidation experiments described above neither allyl
alcohol nor acrolein was formed at any space velocity andor feed composition in the
temperature interval between 360 and 400degC
The purpose of this experiment was to determine the reactivity and product distribution in
acrolein oxidation over the phase-pure MoVTeNbOx catalyst
For the catalytic experiment a feed with the following composition was used
acroleinO2H2ON2=36091vol at a weight hourly space velocity of 250000 mlgh
(WF=0014 gsml) The temperature was varied between 360 and 400degC (Figure 4212)
99
360 370 380 390 4000
10
20
70
80
90
100
Conversion Selectivity ()
T (degC)
X Acr X O2 S AA S CO2 S HAc S CO
Figure 4212 The effect of temperature on acrolein oxidation Catalyst 6059
As seen in Figure 4213 the catalyst is very active in acrolein oxidation even at very
high space velocity The highest acrylic acid selectivity was attained at 380degC while the
highest yield of 89 at 400degC
Acetic acid was found to be a by-product its selectivity decreased with increasing
temperature Literature sources also reported the production of acetic acid during the
oxidation of acrolein Without experimental evidence Lin et al explained the appearance
of acetic acid byproduct as due to oxidative degradation of acrylic acid at temperatures
close to 400degC [23] However both the acrolein and acrylic acid contain only sp2 carbon
atoms while acetic acid contains a sp3 carbon atom as well This would imply that the
C=C bond is saturated upon oxidation of acrylic acid (ie the formal charge of -2 is
reduced to -3) Such saturation (reduction) is uncommon in oxidation reactions A
possible explanation might be the intra-molecular transposition of a hydrogen atom from
the carbonyl- or carboxyl group to the methylene group
An increasing trend was observed for CO and CO2 the latter total oxidation product
being produced in larger amount than CO
From the Arrhenius- and Eyring-Polanyi plots the activation parameters of acrolein and
oxygen consumption were determined (Table 422)
100
Table 422 The activation parameters of acrolein oxidation on 6059 catalyst
Parameter Acrolein Oxygen
Ea (kJmol) 255 plusmn 14 249 plusmn 20
lnA 915 plusmn 02 75 plusmn 04
∆H (kJmol) -20129 plusmn 0002 -183617 plusmn 0003
∆S (JmolK) -183617 plusmn 0003 -197160 plusmn 0003
427 CO oxidation and water gas shift reaction
As observed at the kinetic study of propane oxidation (421 and 422 subchapters) the
CO formation rate was always higher than the CO2 formation rate in the studied contact
time interval independently of the temperature and steam content This raised the
question whether first the CO is produced which upon further oxidation is converted to
CO2 The delplots indicate that both CO and CO2 are mainly second rank products
(Section 64) However the delplot technique relies on extrapolation of the dependent
variable to zero propane conversion This implies that strictly speaking the rank order is
valid only in the differential regime
The CO concentration profile steadily increased in the studied contact time interval
without showing a maximum characteristic to an intermediate product (Figure 421 and
425) Because of these reasons it was not possible to state or to refute whether CO is
further oxidized On the other hand the oxidation of CO by water known as water gas
shift reaction could neither be confirmed nor denied based on the kinetic data of propane
oxidation
To answer the above questions CO oxidation experiments were carried out In order to
get more insights in the reaction kinetics possible reaction pathways and oxygen species
on the catalyst surface the reactivity of CO oxidation was screened in the following
order
i) CO oxidation in absence of steam using stoichiometric and oxidizing feed
(COO2N2=315955 vol and COO2N2=3691 vol respectively)
ii) Water-gas shift reaction with a feed containing 40 vol steam
(COO2H2ON2=304054 vol)
101
iii) CO oxidation in absence of steam using oxidizing (COO2H2ON2=364051
vol) feed
The steam-free feed resembles to propane oxidation carried out in absence of water The
choice of COO2=315 and 36 covers a wide range of redox potentials which occur
under propane oxidation conditions
In the presence of oxygen and water the CO oxidation by oxygen and the water gas shift
reaction may occur simultaneously
)224 (Re
)124 (Re 2
1
222
22
actionHCOOHCO
actionCOOCO
+rarr+
rarr+
This would lead to an ambiguity in deciding which reaction is actually taking place On
the other hand the contribution of each to the overall CO oxidation reactivity is also
difficult because the above mentioned parallel reaction steps involve the same educt and
the same product Therefore it was necessary to perform separately the water gas shift
reaction and the CO oxidation reaction in presence of steam The conditions of these two
reactions were also chosen in such a way to cover the relevant conditions of propane
oxidation reaction
Since the CO oxidation and water gas shift activity of MoVTeNbOx mixed metal oxide
catalysts was not reported up to now the reactivity screening started with an exploratory
measurement performed in a wide range of temperature (from 150 to 400degC) and two
space velocities (3000 h-1 and 12000 h-1 respectively) in dry feed The product appeared
only at temperatures higher than 250degC at low space velocity (Figure 4214) However
the highest conversion of CO was only 1 At the space velocity of 12000 h-1 no
reactivity was observed below 350degC
102
150 200 250 300 350 400
000
001
002
003
004
005
CO2 concentration (vol
)
T (degC)
COO2H2ON2=3150955vol GHSV=3000h-1
COO2H2ON2=36091vol GHSV=3000h-1
COO2H2ON2=3150955volGHSV=12000h-1
Figure 4213 CO oxidation at different temperatures space velocities in stoichiometric and oxidizing
feed Catalyst 8947
The activation parameters of CO oxidation reaction have been determined based on the
linearized Arrhenius- and Polanyi-Eyring plots The results are summarized in Table
423
Table 423 The activation parameters of CO oxidation in dry feed
Feed Stoichiometric
COO2=21
Oxidizing
COO2=12
lnA 75plusmn12 92plusmn12
Ea (kJmol) 41plusmn7 52plusmn2
∆H (kJmol) -36plusmn7 -46plusmn2
∆S (JmolK) -197plusmn10 -183plusmn3
After performing the above exploratory experiment the space velocity variation was
carried out for CO oxidation in dry feed for the water gas shift reaction and CO
oxidation in presence of steam The catalytic data are summarized in Figure 4214 This
plot reveals the least reactivity in the water gas shift reaction the highest CO conversion
being 05 in the studied contact time interval
103
The CO oxidation activity in dry feed was higher than the water gas shift reaction For
the CO oxidation in dry feed the CO conversion was found to be the same
independently on whether the feed was stoichiometric or oxidizing
The highest activity was observed in the case of CO oxidation in presence of 40 vol
steam It should be mentioned that the reactivity in this latter reaction is not a simple
algebraic sum of the CO oxidation in dry feed and the water gas shift reactions
However in all these reactions the conversion of CO to CO2 is far below 2 These
observations show that the CO oxidation and water gas shift reaction are negligible
reaction steps under the propane oxidation reaction conditions It is also to be mentioned
that the kinetic study of propane oxidation was carried out in the space velocity interval
between 66000-4500 h-1 (WF=005-090 gsml)
00 02 04 06 08 10 12 14
000
001
002
003
004
COO2H
2ON
2=3150955vol
COO2H
2ON
2=36091 vol
COO2H
2ON
2=364051 vol
COO2H
2ON
2=304057 vol
CO2 concentration (vol
)
WF (gsml)
Figure 42 14 Space velocity variation for CO oxidation and water gas shift reaction
The low reactivity in CO oxidation reaction has two implications with respect to the
propane oxidation
The first is related to the reaction pathways involving CO and CO2 The above
experiments revealed that the CO is not further oxidized to CO2 under any conditions
This suggests that in the propane oxidation reaction CO and CO2 are formed in two
different and independent pathways
104
The second implication is related to the nature of oxygen species As it was described in
the introduction the CO oxidation activity is related to the presence of the electrophilic
oxygen species on the catalyst surface [24]
Although quantitative correlations were not done because of the lack of calibration
standards based on the negligible CO oxidation activity it can be stated that the
electrophilic oxygen species are not abundant on the phase-pure MoVTeNbOx catalyst
under propane oxidation conditions
428 Comparison of the reactivity of propane propylene acrolein and carbon
monoxide oxidation reactions
The activity of phase pure MoVTeNbOx catalyst in propane propylene acrolein and
carbon monoxide oxidation is summarized and presented on Figure 4215 Because the
reactivity of propylene and acrolein is higher the space velocity was adjusted in such a
way that the conversion is below 100 Therefore the propylene oxidation was carried
out at a space velocity of 20000 h-1 while in the case of acrolein oxidation a much higher
space velocity of 250000 h-1 was used
Because the conversions at different space velocities are difficult to compare the
consumption rates of the four educts were calculated and plotted versus the reaction
temperature
The reactivity increases in the following order carbon
monoxideltltpropaneltpropyleneltltacrolein The reactivity ranking order of propane
propylene and acrolein is similar to that reported by Ai [19] and Lin et al [23] However
in these literature sources the reactivity ranking order was established by performing the
reactions at the same space velocity and varying the reaction temperature
105
360 380 4000
2
4
660
70
80
90
100 rC3H8 GHSV=5000h-1 H2O=40vol 6902
rC3H6 GHSV=20000h-1 H2O=40vol 6902
rAcr GHSV=250000h-1 H2O=0vol 6059
r ( micromicro micromicromolgs)
T (K)
200 250 300 350 400000
001
002
05
10
15
20
rC3H8 GHSV=5000h-1 H2O=40vol 6902
rC3H8 GHSV=5000h-1 H2O=40vol 8947
rCO GHSV=3000h-1 H2O=0vol 8947
rCO GHSV=4500h-1 H2O=0vol 8947
rCO GHSV=4500h-1 H2O=40vol 8947
rWGS GHSV=4500h-1 H2O=40vol 8947
r ( micromicro micromicromolgs)
T (degC)
Figure 4215 Comparison of the propane propylene acrolein (top) propane CO oxidation and water gas
shift activity (bottom) of the catalyst
As Figure 4216 indicates the reaction rates span over four orders of magnitude The
relative rate of propylene consumption with respect to propane consumption is equal to
66 at the reaction temperature of 400degC On the other hand the relative rate of acrolein
oxidation at 400degC is 944 The relative rate of CO oxidation with respect to propane was
106
0016 and 0011 in dry feed and 40 vol steam containing feed respectively The lowest
relative rate of 0006 was observed for the water gas shift reaction on the MoVTeNbOx
catalyst
43 Two-stage reactor used as a distributor of oxidizing and reducing gases
The dosing of oxygen in catalytic membrane reactors and multi-tubular reactors were
reported to give better catalytic performance compared to the conventional single tube
fixed bed reactor design [25-31] The ODH of propane and ethane was extensively
studied by Seidel-Morgenstern et al [31] The ODH and selective oxidation reaction to
acrylic acid share the same steps of propane activation to propylene therefore
qualitatively these two reactions are similar The oxidation of propane to acrolein [32]
and acrylic acid [33] was reported by employing a dual-bed sytem whereby in the first
reactor ODH proceeded while in the second reactor the propylene was further oxidized
In contrast to these above mentioned catalyst systems the MoVTeNbOx is able to
oxidize directly the propane to acrylic acid Therefore in the present section the selective
oxidation of propane is reported over a phase-pure M1 MoVTeNbOx catalyst in a two-
stage reactor
The stage-wise addition of oxygen and other gases was performed in a system consisting
of two reactor tubes connected serially (two-stage reactor TSR) The addition of gases
was technically realized by means of a T-junction installed on the tubing that connects
the two reactor tubes (section 224 Figure 223)
The reactors were loaded with the same amount of catalyst phase-pure M1 MoVTeNbOx
catalyst (02400 g or 02667 ml sieve fraction of sample 6059) mixed with SiC diluent
The initial concentration of the feed components entering the first reactor was kept
constant (C3H8O2H2ON2=364051vol) while different gases (O2 N2O C3H6 CO
and CO2) were added to the gas mixture entering the second reactor tube The
temperature of both reactors was set to 400degC A total flow rate of 40 mlnmin
corresponds to a space velocity of 9000 h-1 in each reactor tube while the overall space
velocity is 4500 h-1
107
431 Addition of O2 and N2O
The variation of oxygen concentration in a single tube reactor revealed that the catalytic
performance is neither enhanced nor reduced by up to a five-fold oxygen excess
compared to the stoichiometric feed The effect of the redox potential was studied also in
the two-stage reactor setup
Additionally the potential applicability of N2O as an oxidant was examined The
motivation for this was the numerous reports in the literature about the successful
application of nitrous-oxide as oxidant instead of molecular oxygen in heterogeneously
catalyzed reactions (ie the industrial oxidation of benzene to phenol over FeZSM-5
catalyst alkane oxidative dehydrogenation propylene epoxidation hydroxylation of
chlorobenzene fluorobenzene phenol biphenyl [34]) Also N2O was found to be an
applicable oxidant in propane oxidative dehydrogenation on VOx on MCM-41 [35] SiO2
and γ-Al2O3 [36] supports Markedly higher propylene selectivity was reported when
N2O was using as oxidant compared to the catalytic data obtained with O2 This was
explained by the slower reoxidation kinetics observed in case of N2O More recently
Kondratenko et al reported two different surface species as probed by in-situ EPR
spectroscopy and postulated two different reoxidation mechanisms of the VOxMCM-41
catalyst by O2 and N2O respectively In the case of reoxidation by O2 the Vn+hellipO-
species was identified which was assumed to give rise to O- electrophilic species leading
to total oxidation [37]
However no reports were found about the potential application of N2O in the oxidation
of propane to acrylic acid
The staged addition of oxygen was performed as follows First the propane oxidation
reaction was performed at a space velocity of 9000 h-1 using the feed of
C3H8O2H2ON2=364051vol in a single-tube operation mode The oxygen content of
the effluent mixture was found to be 4 vol Therefore in the two-stage operation mode
the initial oxygen concentration in the second reactor tube is equal to 4 vol without
addition of oxygen
108
-05 00 05 10 15 20 25 3009
10
11
12
4000
4250
4500
4750
5000
0
3
6
9
12
15
Overall GHSV (h-1)
Dilution ratio
added O2 flow rate (mlnmin)
O2 concentration that enters in R2 (vol)
overall O2 concentration in R1+R2 (vol)
O2 concentration (vol
)
Figure 431 The dilution ratios (black squares) overall space velocities (black dots) and the oxygen
concentrations (empty and full blue triangles) in function of the flow rate of the added oxygen
To the effluent gas mixture leaving the first reactor tube pure oxygen gas was added
through the T-junction in order to achieve initial oxygen concentrations of 6 8 and 10
vol O2 in the second reactor tube
The overall oxygen concentration in the two reactor tubes was 6 8 10 and 12 vol
respectively Because of the oxygen addition the total flow rate increased in the second
reactor tube and in the same time the reaction mixture was diluted The dilution factor
the overall space velocity the oxygen concentration at the inlet of the second reactor tube
and the overall oxygen concentration in the two-stage reactor in function of the flow rate
of added oxygen gas is displayed in Figure 431 The dilution factor and the space
velocity change were taken into account for the calculation of the conversion selectivity
and reaction rates
The reaction rates obtained at a space velocity of 4500 h-1 in the single-tube mode and
two-stage mode without addition of oxygen between the two reactor tubes were very
similar (Figure 432) In contrast to the oxygen content variation experiments performed
in the single tube reactor (Figure 428 in subchapter 424) the staged addition of oxygen
in relatively high concentration positively influenced the catalytic properties
109
4 6 8 1000
04
08
12
00 05 10 15 20 25
6 8 10 12
O2 concentration in mixture that enters in R2 (vol)
Rates (
micromicro micromicromolgs)
r C3H8 r C3H6 r CO2 r CO r HAc r AA
no O2
additionaddition of O2
Added O2 between R1 and R2 reactors (mlnmin)
Overall O2 concentration (vol)
Figure 432 The effect of oxygen addition in the two-stage reactor
At the oxygen content of 8 and 10 vol in the second reactor (10 and 12 vol overall
oxygen content) the overall rate of propane consumption increased slightly compared to
measurements with lower oxygen concentrations (Figure 432)
The rate of acrylic acid formation was observed to increase at 8 and 10 vol oxygen
concentrations in the second reactor The rate of CO and CO2 production increased only
marginally upon oxygen addition while the rate of propylene and acetic acid formation
was not influenced by the oxygen concentration
When the catalytic properties obtained in the two-stage reactor and single-tube reactors
were compared in terms of conversion selectivity and yield two cases could be
distinguished (Figure 433) Both reactor systems performed similarly at 6 and 8 vol
overall oxygen concentration However the catalytic performance in the two-stage
reactor is superior to the single-tube reactor above 8 vol overall oxygen content A net
increase of 11 in the propane conversion and an increase of 47 in the acrylic acid
selectivity was determined at an overall oxygen content of 10 vol compared to the
110
single-tube reactor experiment Therefore by employing the two-stage reactor the acrylic
acid yield could be increased by 53
4 6 8 10 12 14 16 180
20
40
60
80
100Conversion Selectivity Yield ()
Overall O2 concentration (vol)
XC3H8 TSR
XC3H8 STR
SAA TSR
SAA STR
YAA TSR
YAA STR
0 10 20 30 40 50 60 70 80 90 1000
20
40
60
80
100
SAA ()
XC3H8 ()
STR 6 vol O2 GHSV var
STR O2 var GHSV=4500h
-1
TSR O2 var GHSV=4500h
-1
Figure 433 Comparison of the catalytic performance in the single-tube reactor (STR) and two-stage
reactor (TSR)
As already mentioned above the oxygen addition diluted the reacting gas mixture and
also increased the space velocity However the conversion and selectivity also depends
on the space velocity Firstly it can be ruled out that the slight enhancement of propane
111
conversion is due to the increase of space velocity from oxygen addition because the
conversion decreases with increasing space velocity
In order to rule out that the positive effect of oxygen addition on the selectivity is an
artifact due to the minor increase of space velocity a conversion-selectivity plot was
constructed displaying all the STR and TSR data (Figure 433 bottom) On this plot the
selectivity to acrylic acid determined at 6 vol initial oxygen concentration in the STR
passed through a maximum at a conversion of ca 55 Despite varying the oxygen
content variation in the STR operation mode the selectivity could not be improved On
the other hand upon oxygen addition in the TSR both the conversion and the selectivity
increased the data points were above the maximum of the conversion-selectivity curve
corresponding to the conventional STR system This revealed that the increase in the
selectivity is not an artifact due to the change of the space velocity by oxygen addition
The feasibility of application of N2O as an oxidant was also studied in the two-stage
reactor The N2O concentration was varied from 05 vol up to 40 vol in the second
reactor keeping constant the gas mixture composition of C3H8O2H2ON2=364051
vol in the first reactor The catalytic properties were found to be the same in the
presence of N2O irrespective of its concentration (Figure 434) Moreover the N2O
conversion was found to be zero indicating that N2O has no effect on the reaction when
dioxygen is also present in the gas mixture Then the initial oxygen concentration fed in
the first reactor was reduced from 60 to 40 vol and in the same time 4 vol N2O was
fed in the second reactor respectively (Figure 434 condition noted with ) Under this
condition total O2 consumption was observed accompanied by a slight decrease of the
propane conversion and a significant decrease of the acrylic acid selectivity At the same
time the propylene acetic acid and carbon dioxide selectivities are increasing slightly
Under reducing condition the N2O conversion was also found to be zero similarly for
the catalytic runs performed in presence of dioxygen In terms of oxygen atoms 4 vol
N2O is equivalent with 2 vol O2 Therefore feeding 4 vol oxygen and 4 vol N2O in
the two-stage reactor is equivalent to 6 vol oxygen with respect to oxygen atoms The
fact that the N2O conversion was zero throughout all the above described conditions led
112
to the conclusion that N2O does not reoxidize the phase-pure MoVTeNbOx catalyst under
propane oxidation conditions The explanation for this observation could be that either
the N2O does not adsorb on the surface of the catalyst or the catalyst in unable to activate
the N-O bond while there is no such a constraint in dioxygen adsorption and the
activation of the O=O bond
0 1 2 3 4 5 6
0
20
40
60
80
100
added N2O (vol)
X C3H8 X O2 X N2O S AA S CO2 S C3H6 S HAc S CO C-Bal Y AA
Conversion Selectivity Yield ()
Figure 434 Addition of N2O in the two-stage reactor Conditions noted with stars - 40 vol O2
introduced in R1 reactor and 40 vol N2O in R2 reactor - 6 vol O2 introduced in R1 reactor and 00 vol N2O in R2 reactor
Nitrous oxide may undergo thermal dissociation leading to N2 and O The oxygen free
radicals may induce radical homogeneous reactions under propane oxidation conditions
Although as it is shown above the product distribution is independent on the
concentration of added N2O it was necessary to assess the amount of the highly reactive
oxygen radical the new oxygen species introduced in the system by the addition of N2O
Based on the kinetic data published by Allen et al [38] on thermal dissociation of N2O
the maximum concentration of the gas phase oxygen radical was found to be 54108
radicalscm-3 (in the order of 10-15 mol radicalcm-3) The calculated conversion of N2O
towards N2 and O was extremely low in the order of magnitude of 10-8 This is in
accordance with the observed zero conversion of N2O during the addition experiments
113
Therefore this calculation proves that the thermal dissociation of N2O and the appearance
of oxygen radicals are negligible under propane oxidation conditions
After the N2O was switched off and 6 vol O2 was fed in the first reactor in the
beginning the conversion of propane and the selectivity of acrylic acid were as low as in
the case of 4 vol O2 in the first reactor and 4 vol N2O in the second reactor
0 100 200 300 4000
20
40
60
80
100
X C3H8 X O2 S AA S CO2 S C3H6 S HAc S CO C-bal Y AA
Conversion Selectivity Yield ()
TOS (min)
before after the N2O-addition experiment in TSR
Figure 435 Reactivation of the catalyst after exposing to reducing conditions
The catalytic properties converged slowly (in ca 8 hours time on stream) to the initial
values (ldquoreactivation during catalytic reactionrdquo) (Figure 435) This suggests the
reversibility of the decay in catalytic performance when operating the reaction under
reducing conditions for short time on stream (1 hour)
432 Addition of propylene
In the previous section it was shown that the staged addition of the oxygen can increase
the catalytic performance The effect of added reducing agents was also studied
The reducing agent was chosen based on the following considerations
i) the added compound should neither produce compounds which may poison the
catalyst nor react in homogeneous or heterogeneous pathways with the intermediates or
products of propane oxidation reaction
114
ii) it should present a reasonably high reduction potential and
iii) it should not introduce additional complexity in the reaction pathways of
propane oxidation
Hydrogen was not applied because of the i) and ii) criteria Firstly it may hydrogenate
the propylene and acrylic acid at 400degC Secondly the onset temperature of H2-TPR of
the catalyst was at around 370degC whith the peak maximum at 450degC (data not shown)
therefore is not a very strong reducing agent Ethylene the C1-C3 alcohols and aldehydes
were excluded based on the iii) criterion because all of these compounds are oxidized to
aldehydes or acids and undergo total oxidation pathways as well The remaining options
were propylene and carbon monoxide
However both of these compounds are also reaction products in the propane oxidation
reaction Being an intermediate propylene is further oxidized to acrylic acid acetic acid
and carbon oxides
In the following the addition of propylene in the two-stage reactor is presented (Figure
436) Upon addition of 050 and 075 vol propylene between the two reactors the
global rate of propane consumption was constant within experimental errors However
the propylene concentration monitored at the outlet of the second reactor was constant
irrespective of the added amount of propylene between the two reactors The global rate
of propylene formation was constant in spite of addition This means that the whole
amount of added propylene completely was completely consumed The oxidation of the
added propylene was well reflected in the enhancement of the global rates of acrylic acid
acetic acid and carbon monoxide and carbon dioxide formation It is notable that upon
propylene addition in the two-stage reactor no other product (ie acetone) was detected
by the GC-MS setup like in the case of propylene oxidation
The significant increase of the oxygen consumption rate attests that the added propylene
indeed acts as a strong reducing agent Addition of propylene in higher concentration
than 075 vol was avoided in order to keep the oxygen conversion below 100
Upon switching off the propylene addition the catalytic properties were remeasured
Because the catalyst was not exposed to very reducing conditions (XO2lt100) the
catalytic performance was found to be constant over time (ie no ldquoreactive reactivation
was observed like in the case shown on Figure 436) The rates of propane consumption
115
and the product formation were found to be very similar to the values determined before
the addition of propylene (Figure 436) This also supports the observed reversibility of
the catalytic properties after operating the reaction under reducing conditions
000 025 050 075 10000
02
04
06
0818
20
22
24
26
28
30
noaddition
C3H6addition
000
Rates (
micromicro micromicromolgs)
added C3H6 in R2 (vol)
r C3H8 r O2 r C3H6 r CO2 r CO r HAc r AA
noaddition
Figure 436 The effect of C3H6 addition of in the two-stage reactor
A very slight decrease of the propane consumption rate was observed upon propylene
addition This may suggest that there is a slight competition between propane and
propylene on the adsorption sites Microcalorimetric experiments on propane and
propylene adsorption showed that a larger amount of propylene can be adsorbed
compared to propane at the same equilibrium pressure [39] On the other hand the
additional propylene may be adsorbed on the sites which are energetically less favored
for propane adsorption
In turn the results may be interpreted as there are two active sites One of them is
performing the oxidative dehydrogenation of propane while the other one oxidizes
further the propylene The slight reduction of the propane consumption rate may be a
consequence of the higher reduction degree of the catalyst surface
116
433 Addition of CO
In the 427 section it is shown that CO oxidation reactivity over MoVTeNbOx catalyst is
a negligible even though CO is known to be a reducing compound This can be attributed
to low abundance of electrophilic oxygen species on the surface
However because of the very low reactivity in CO oxidation the surface redox property
of the MoVTeNbOx catalyst certainly does not change significantly during one catalytic
cycle On the other hand the catalyst showed ca 80 times higher reactivity in propane
oxidation (Figure 4215) therefore in this reaction the reduction degree is expected to be
changed more significantly during one catalytic cycle [40] Upon such significant
changes of the oxidation states the nature and the abundance of the surface oxygen
species might be different Because the CO oxidation reaction is suitable for semi-
quantitative estimation of the electrophilic oxygen species the CO addition in the two-
stage reactor was performed in order to probe the changes of the abundance of active
oxygen species during propane oxidation reaction
000 025 050 075 10000
02
04
06
0816
18
20
22
24
26CO addition
no addition
r C3H8 r O2 r C3H6 r CO2 r CO r HAc r AAR
ates (
micromicro micromicromolgs)
added CO in R2 (vol)
0
no addition
Figure 437 The effect of CO addition in the two-stage reactor
Upon addition of 05 vol CO to the mixture that enters the second reactor no change in
the propane and oxygen consumption was observed (Figure 437) This suggests that CO
117
does not compete with propane for adsorption sites and is not further oxidized to CO2
The added CO concentration was subtracted from the concentration measured at the
outlet of the second reactor The resulting value was found to be identical with the CO
concentration measured without addition Moreover the CO2 formation was also not
affected by the CO addition These latter observations also support the fact that the CO
oxidation during propane selective oxidation reaction is negligible independent of the
surface redox potential changes of the catalyst in the catalytic cycle
The formation of propylene acetic acid and acrylic acid was also not affected by the CO
addition revealing that the CO is an inert end-product
This experiment confirmed that the electrophilic oxygen species are not abundant on the
catalyst surface under working conditions
434 Addition of CO2
Carbon dioxide is the thermodynamically favored end product of the propane oxidation
reaction Although it is often considered to be an inert product CO2 may play different
roles in heterogeneous catalysis
bull competitively adsorb with educt or intermediates on the active sites
bull it was reported to increase the conversion in the dehydrogenation reaction
of isobutane [41]
bull the presence of CO2 was found to be beneficial for propane oxidation
reaction over MoVTeNbOx catalyst The obtained catalytic results
revealed a linear increase of yield of acrylic acid with the CO2 content in
the feed [42]
The microcalorimetric experiment on CO2 adsorption revealed that the density of sites
interacting with CO2 is higher than the density of sites available for propane adsorption
On the other hand the initial differential heat of adsorption of CO2 was found to be ca 30
kJmol while for propane adsorption a value of 40 kJmol was determined on catalyst
6059 after propane oxidation reaction The heat profile corresponding to the CO2
adsorption on the used catalyst indicated a relatively homogeneous distribution of the
surface basic sites
118
CO2 addition in the two-stage reactor system was performed in order to find out whether
it competitively adsorbs with propane on the active sites of the catalyst Up to 20 vol
CO2 was added to the gas mixture leaving the first reactor tube (Figure 438)
00 05 10 15 20 25 3000
02
04
06
08
18
20
22
24
26no
add
00
Rates (
micromicro micromicromolgs)
added CO2 in R2 (vol)
r C3H8 r O2 r C3H6 r CO2 r CO r HAc r AA
CO2 additionno
add
Figure 438 The effect of CO2 addition in the two-stage reactor
Because the added CO2 is a non-reactive gas added to the mixture a mass balance
equation was set in order to calculate the amount of CO2 produced in the reaction Figure
438 displays the rates of educt consumption and product formation as a function of the
concentration of the added CO2 No significant changes could be observed in the propane
and oxygen consumption rate
The propylene and acrylic acid formation rate is insensitive to the addition of CO2 This
suggests that carbon dioxide does not adsorb competitively either with propane or with
propylene on the active sites of the catalyst A slight increase in the CO formation rate
could be observed when 10 vol CO2 was added to the reacting mixture On the other
hand CO2 formation rate was slightly reduced when 20 vol CO2 was added while
acetic acid formation was slightly enhanced by the presence of carbon dioxide
119
44 Conclusions
Catalytic and kinetic studies on propane oxidation to acrylic acid were carried out using a
high performing phase-pure M1 MoVTeNbOx catalyst The reaction temperature redox
potential of the gas phase and the steam content of the feed was varied The highest
acrylic acid yield of ca 30 was attained at 400degC and stoichiometric feed containing 40
vol steam A reversible drop of the catalytic performance was observed when the steam
concentration was decreased to 0 vol Neither the conversion nor the selectivity was
increased or decreased in oxidizing feed (up to five-fold excess of oxygen)
The oxidation of intermediates (propylene and acrolein) and CO over the phase-pure M1
catalyst was also performed at the same temperature interval where propane oxidation is
carried out in order to establish the reactivity ranking product distribution and to probe
the reaction pathways
The catalyst was found to be ca 6 times more active in propylene oxidation compared to
propane oxidation at a temperature of 400degC the main product being acrylic acid The
acrolein oxidation rate was ca 100 times higher compared to the propane oxidation at
400degC while the acrylic acid yield was over 90 On the other hand the rate of CO
oxidation and water gas shift reaction was found to be ca 100 times lower compared to
the propane oxidation The low reactivity in CO oxidation suggested low abundance of
electrophilic oxygen species Additionally this finding suggested that the CO and CO2
are produced in independent pathways during the propane propylene and acrolein
oxidation reactions
Staged addition of oxidizing and reducing agents (O2 N2O C3H6 CO and CO2) was
performed in a setup consisting of two serially connected reactor tubes The oxygen
content variation in this arrangement lead to increase in the propane conversion and
acrylic acid selectivity giving an improvement of the acrylic acid yield by 5 compared
to the conventional fixed bed reactor Additionally it was found that N2O is an inert gas
in the propane oxidation reaction This lead to the conclusion that the phase-pure
MoVTeNbOx catalyst in unable to activate the N2O molecule
Upon addition of propylene the formation rate of acrylic acid acetic acid CO and CO2
products increased
120
The addition of CO did not influence the consumption rate of propane and oxygen and
the formation rate of any product This suggested that the CO does not adsorb
competitively with propane or any intermediates on the active sites Additionally this
experiment proved that the CO oxidation activity is very low during propane oxidation
reaction therefore indirectly also proved that the CO2 is produced independently from
CO in the propane oxidation reaction The observation concerning the low abundance of
electrophilic oxygen species irrespectively on the degree of reduction of the catalyst
surface within one catalytic cycle was also supported by the results of this experiment
The CO2 addition in relatively low concentration also did not influence the rates
significantly suggesting that the thermodynamically favored end product does not adsorb
competitively with the educt or intermediates on the active sites of the catalyst
References Chapter 4
1 E Novakova E G Derouane J Veacutedrine Catal Lett 83 3-4 (2002) 177-182 2 E Balcells F Borgmeier I Griszligtede H-G Lintz Catal Lett 87 (2003) 195 3 I Griszligtede Die Partielle Oxidation von Propan zu Acrylsaumlure Bestimmung der
Reaktionskinetik und in-situ characterisierung des Katalysators unter Betriebsbedingungen Dissertation Universitaumlt Karlsruhe 2004 Universitaumltsverlag Karlsruhe ISBN 3-937300-17-1 E Balcells
4 F Borgmeier I Griszligtede H-G Lintz F Rosowski Appl Catal A General 266 (2004) 211
5 J B Butt Reaction kinetics and reactor design 2nd Ed Marcel Dekker Inc 2000 pp 25-35
6 J L Dubois D Garrait A Le Gall G Bazin S Serreau FR Patent WO 2006072682 A1 2006
7 W Zheng Zh Yu P Zhang Y Zhang H Fu X Zhang Q Sun X Hu J Natural Gas Chemistry 17 (2008) 191-194
8 Ch G Hill An Introduction to Chemical Engineering Kinetics and Reactor Design John Wiley and Sons 1977 24-74
9 R W Missen Ch A Mims B A Saville Introduction to Chemical Reaction Engineering and Kinetics John Wiley and Sons 1999 49-55
10 I Griszligtede H-G Lintz Catal Lett 87 (2003) 195 11 G Centi F Cavani F Trifiro Selective oxidation by heterogeneous catalysis
Kluwer AcademicPlenum Publishers 2001 363-384 12 M Ai J Catal 101 (1986) 473-483 13 Y Moro-oka Appl Catal A General 181 (1999) 323-329 14 L Luo PhD thesis California Institute of Technology Pasadena California 2001 15 J C Veacutedrine E K Novakova E G Derouane Catal Today 81 (2003) 247-262 16 H-G Lintz S P Muumlller Applied Catal A General 357 (2009) 178-183
121
17 M M Lin Appl Catal A 207 (2001) 1-16 18 E K Novakova J C Vedrine Propane selective oxidation to propene and
oxygenates on metal oxides in Metal Oxides - Chemistry and applications JGL Fierro (Ed) 2006 CRC Press pp 414-461
19 M Ai Catal Today 13 (1992) 679-684 20 M Ai J Catal 101 (1986) 389-395 21 J C Veacutedrine E K Novakova E G Derouane Catal Today 81 (2003) 247-262 22 P Concepcioacuten P Botella J M Loacutepez Nieto Appl Catal A General 278 (2004)
45-56 23 M Lin T B Desai F W Kaiser P D Klugherz Catal Today 61 (2000) 223-
229 24 J Hermann Catal Today 112 (2006) 73-77 25 ST Oyama X Zhang J Lu Y Gu T Fujitani J Catal 257 (2008) 1-4 26 G Campanelli A Bottino D Romano O Montinelli A Servida F Cavani S
Rossini Stud in Surf Sci and Catal 119 (1998) 423-428 27 A Bottino G Campanelli A Comite J Membr Sci 197 1-2 (2002) 75-88 28 G Campanelli E Carosini F Cavani O Monticelli F Trifiro Chem Eng Sci
51 10 (1996) 1817-1826 29 J A Dalmon A Cruz-Lopez D Farruseng N Guilhaume E Iojoiu J-Ch
Jalibert S Miachon C Mirodatos A Pantazidis M Rebeilleau-Dassonneville Y Schuurman A C van Veen Appl Catal A General 325 2 15 (2007) 198-204
30 H-G Lintz A Reitzmann Catalysis Reviews Science and Engineering 49 1 (2007) 1-32
31 C Hamel Aacute Toacuteta F Klose F Tsotsas A Seidel-Morgenstern Chem Eng Res Design 86 (2008) 753-764 C O`Neill E E Wolf Catal Today 156 (2010) 124-131 W Fang Q-J Ge J-F Yu H-Y Xu Ind Eng Chem Res 50 (2011) 1962ndash1967
32 C O`Neill E E Wolf Catal Today 156 (2010) 124-131 33 W Fang Q-J Ge J-F Yu H-Y Xu Ind Eng Chem Res 50 (4) (2011)
1962ndash1967 34 V N Parmon G I Panov A Uriarte A S Noskov Catal Today 100 (2005)
115-131 35 E V Kondratenko M Cherian M Baerns D Su R Schloumlgl X Wang I E
Wachs J Catal 234 (2005) 131ndash142 36 E V Kondratenko M Cherian M Baerns D Su R Schloumlgl X Wang I E
Wachs J Catal 234 (2005) 131ndash142 37 E V Kondratenko A Bruumlckner J Catal 274 (2010) 111ndash116 38 M T Allen R A Setter F L Dryer Int J Chem Kinet 27 (1995) 883-909 39 M Haumlvecker S Wrabetz J Kroumlhnert L Csepei R Naumann Yu V Kolen`ko
F Girgsdies R Schloumlgl A Trunschke J Catal submitted 40 J M Loacutepez-Nieto B Solsona P Concepcioacuten F Ivars A Dejoz M I Vaacutezquez
Catal Today 157 (2010) 291-296 41 J Ogonovski E Skrzynska Cat Comm 11 (2009) 132-136 42 R Fushimi S O Sekhtman A Gaffney S Han G Yablonsky J T Gleaves
Ind Eng Chem Res 44 (2005) 6310-6319
122
Chapter 5 Post synthesis treatment of the phase-pure M1 MoVTeNbOx catalyst
511 Abstract
Post-synthesis treatment of the phase-pure M1 MoVTeNbOx catalyst with
different aqueous solutions at room temperature is presented in this chapter The
modifying agents were selected in such a way to cover all the chemical effects (neutral
acidic basic oxidizing and reducing respectively) Catalytic experiments on propane and
propylene oxidation showed that the chemical treatment of the phase-pure M1
MoVTeNbOx sample with neutral acidic basic and reducing solution leads to a marginal
improvement in the activity while the acrylic acid yield is not significantly influenced
On the other hand the treatment with oxidizing solution leads to a very dramatic decrease
in activity and selectivity and alters the homogeneous energetic distribution of propane
adsorption sites probed by adsorption microcalorimetry The acrylic acid selectivity at the
same propane conversion was found to correlate with the surface Te content and TeV
ratio The phase purity was not affected either by the chemical treatment or the catalytic
reaction of propane and propylene oxidation suggesting the exceptional bulk structural
robustness of the M1 MoVTeNbOx catalyst
512 Introduction
The as prepared mixed metal oxide catalysts are seldom phase pure materials The
synthesis of MoVTeNbOx catalyst often leads to M1+M2 phase mixtures
In the patent literature several methods are claimed for the selective removal of the M2
phase The Japanese Laid-Open Patent Application No 10-330343 claimed a single and a
dual stage washing procedure using aqueous oxalic acid ethylene glycol and hydrogen-
peroxide solutions aiming at modification of the crystalline phase composition of
MoVSb based oxide catalysts Treatments of the same oxide catalyst with organic acid
alcohol inorganic acid and hydrogen peroxide are claimed as well [1]
Washing of MoVTeNbO and related oxide catalysts using organic acids alcohols
inorganic acids and hydrogen peroxide has been claimed by the patent literature for
selective removal of the M2 phase [2 3] Oxalic acid and ethylene diol were claimed to
123
be the most effective agents in removal of the M2 phase None of the listed inorganic
acids was highlighted as preferred washing agent Higher temperatures were suggested to
be favorable for faster removal of the M2 phase However the results concerning the
phase composition are described only qualitatively by the term ldquosubstantially free of
hexagonal phaserdquo Changes in the bulk andor surface elemental composition were not
monitored and the results of catalytic experiments are completely missing
Guliants et al reported that the treatment of phase pure MoVOx catalyst by anhydrous 2-
propanol leads to significant change in the surface elemental composition as probed by
LEIS study [4] The as prepared material exhibited a surface composition of MoV019Ox
while in case of the treated sample the enrichment of vanadium was observed the
composition being MoV069Ox On the other hand the bulk composition and M1 phase
was unaffected by the treatment The 2-propanol treated sample however showed an
improved selectivity to acrylic acid and a lower propane apparent activation energy
compared to the as prepared MoVOx catalyst
Baca et al reported complete removal of M2 phase by washing with 15 hydrogen-
peroxide containing solution from a M1+M2 phase mixture [5]
Due to the lack of any quantitative data reported in the patent literature it is not known
whether the claimed positive effect of solution treatment applied to a phase mixture is
due exclusively to the selective dissolution of the M2 phase or it might be related to the
possible change in the surface composition as well similarly to the data reported by
Guliants et al [4]
Therefore in this chapter the effect of different selected solutions (neutral acidic basic
complexing oxidizing and reducing) on the phase pure M1 MoVTeNbOx catalyst is
addressed in order to sort out their effect on the
bull Bulk structure phase purity
bull Surfacebulk composition
bull Catalytic properties
124
52 Modifying agents and procedure
The starting material (called also parent sample) was a phase-pure M1 MoVNbOx
catalyst with the internal identification number 6902 This was subjected to modification
procedure by washing in solutions The systhesis and characterization of the original
sample is described in detail in chapter 23
Modification procedure 20 g of parent sample was dispersed in 50 ml of the solutions
listed below The suspension was shaked at room temperature for 3 hours Then the solid
sample was separated from the liquid by vacuum filtration Finally the sample was dried
in a vacuum desiccator Although in the literature a heat treatment step is also
recommended after performing the modification procedure in the present study the final
calcination was not performed The reason for avoiding heat treatment is the evidence of
surface reconstruction of a hydrogen-peroxide treated sample given by Kolenrsquoko et al
[6]
The modifying solutions were as follows
1 Distilled water Chemical effect neutral The rationale of using pure water was
that to sort out the effect of the solvent on the catalyst since all the other modifying
agents were used as aqueous solutions The distilled water treated sample got the internal
identification number of 7797
The pH of the filtrate solution was 19 Since the catalyst does not contain hydrogen ions
bound in the structure the surprisingly high pH change of 51 was a consequence of
metal ion leaching The metal ions leached out from the sample may undergo hydrolysis
and form hydroxides and oxo-ions The consumption of hydroxyl ions in the hydrolysis is
reflected in the drop of the pH
2 01M phosphoric acid H3PO4 This compound has acidic and complexing
properties The pH of the 01 M H3PO4 solution was 17 while the pH of the filtrate after
treatment was 27 Even though phosphoric acid is a relatively strong acid the pH of the
filtrate is higher by 18 compared to the pH of the filtrate from the water treated sample
This might be due to the fact that the leached metal ions form complexes with phosphate
ions and hydrolysis is suppressed To the phosphoric acid solution treated sample the
internal number of 7798 was assigned
125
3 01 M tetramethylethylenediamine (CH3)2NCH2CH2N(CH3)2 (TMEDA) This
compound has basic (pH=109) and complexing effects Upon treating the MoVTeNbOx
with this solution the pH of the filtrate decreased to 41 The solid sample after treatment
got the number of 7799
4 01 M sodium bromate NaBrO3 The bromate ion presents oxidizing properties
which potentially may oxidize the elements of the sample in the intermediate oxidation
states The pH change of the solution was from 69 to 30 The sample was got the
internal identification number of 7798
5 01 M hydrazine N2H4H2O This compound with reducing properties was
selected in order to try to reduce some elements in the highest or intermediate oxidation
states The initial pH of the 01 M N2H4 solution was 98 while the pH of the filtrate was
found to be 93 The hydrazine treated sample got the internal identification number of
8113
In the liquid filtrate four types of equilibria involving the leached metal ions may
proceed One of them is hydrolysis and precipitation formation From the literature only
limited information is available about the solubility of the molybdenum vanadium
tellurium and niobium hydroxides The solubility product of VO(OH)2 is 59middot10-23 while
of Te(OH)4 is equal to 3middot10-54 [8] The calculated pH of a solution that contains Te(OH)4
in equilibrium is 33 while hydrolysis of vanadyl ion leads to a solution with pH of 66
None of these pH values matches with the pH of the filtrate resulting from the water
treated 6902 sample suggesting a complicated hydrolysisprecipitation equilibrium
Based on the Pourbaix-diagrams of Mo- V- Nb- and Te-species [7-10] in aqueous
solution at the pH of 19 the following species are stable MoO3 VO2+VO2+V3+
(depending on redox potential) Nb2O5 HTeO2-Te2
2-TeO33H2OTeO32-
H2TeO4HTeO2+ (depending on the redox potential)
The second equilibrium is condensation of hydrated metal ions and formation of oligo-
and polymetallates
The third equilibrium is the complex formation involving the leached metal cations and
the inorganicorganic ligands (H3PO4 TMEDA and N2H4 respectively) from the washing
solutions
126
Finally the fourth equilibrium is the redox reaction between the redox active transitional
metal ions with bromate and hydrazine
200 300 400 500 600 700 800
0
1
2
3
4
Absorbance
wavelength (nm)
7797 - water 7798 - 01 M H3PO4 7799 - 01 M TMEDA 7800 - 01 M NaBrO3 8113 - 01 M N2H4
Figure 521 The UV-Vis spectra of the filtrate solutions
As a result of these equilibria a multitude of cationic and anionic transitional metal
containing species may exist in the filtrate solutions The UV-Vis spectra of the filtrate
solutions were found to be different from each other indicating that different species are
present in all the solutions (Figure 521) Because of the complexity of the reactions that
may occur in the liquid phase and consequently the formation of large number of
species it was not possible to assign directly the bands to the species
However the composition and catalytic properties of the solid material after the liquid
treatment is more important rather than the qualitative and quantitative identification of
the ions leached out upon the above described liquid treatments Therefore the next
sections are focused on the characterization of the solid material after the liquid
treamtment Furthermore catalytic data are presented on propane and propylene
oxidation using the modified samples The reaction pathway analysis of propane
oxidation was performed Different pathways were found therefore a preliminary kinetic
analysis of the propane and oxygen partial order and consumption rate constant was
127
evaluated Furthermore the rate constant of propylene consumption was also determined
for every modified catalyst
53 Characterization of the modified samples
531 N2 physisorption
The nitrogen adsorption isotherms determined at the temperature of liquid nitrogen are
shown in Figure 531
Table 531 The BET surface area of the samples
Sample number Treatment BET surface area (m2g)
6902 None 75 7797 H2O 128 7798 H3PO4 113 7799 TMEDA 55 7800 NaBrO3 50 8113 N2H4 116
In case of the water treated sample the surface area increased by about 70 while upon
phosphoric acid and the hydrazine treatment the surface are increased by about 50 On
the other hand in the case of the tetramethylethylenediamin and bromate treatment the
surface area decreased by about 30 compared to the parent sample
532 X-ray diffraction
The parent and the as prepared modified samples were subjected to XRD measurements
between 2Θ=2deg and 2Θ=80deg XRD measurements were performed on samples after the
catalytic experiments on propane and propylene oxidation
Rietveld refinement performed on the patterns showed that the phase purity was not
affected irrespective of the nature of the chemical treatment The quantitative Rietveld
analysis was obtained using the crystal structure of M1 MoVTeNbOx (ICSD 55097)
[11] This observation suggests that the bulk structure of the phase-pure MoVTeNbOx
catalyst is robust enough to withstand treatment with the above listed solutions No phase
change has happened under propane and propylene oxidation reaction conditions in
128
contrast to the phase alteration when switching from propane to propylene educt
speculated by Griszligtede [12]
Table 532 The lattice parameters of the catalysts before and after catalytic oxidation of propane and propylene
Catalyst ID
Latt const
6902 7797 7798 7799 7800 8113
a (Aring) 21146 21138 21126 21127 21143 21143 b (Aring) 26641 26630 26615 26615 26640 26633 c (Aring) 40161 40169 4015 40153 4018 40151 B
efor
e re
acti
on
V (Aring3) 22624 22612 22576 22577 22628 22609 a (Aring) 21139 21142 21145 21134 21162 21144 b (Aring) 26628 26631 26640 26632 26654 26632 c (Aring) 40146 40123 4013 4010 4013 40133 A
fter
re
acti
on
V (Aring3) 22598 22590 22607 22570 22635 22599
The lattice constants were extracted for all the samples before and after catalytic reaction
They are listed in Table 532 It can be observed that by treatment the lattice constants
are only slightly affected The lattice parameters are also slightly changing during the
propane and propylene oxidation reaction
533 SEMEDX
The SEM images of the parent and modified samples are shown in Figure 531
The SEM micrograph of the parent sample is a homogeneous material but consists of
irregularly shaped rod-like particles with length up to 500 nm and diameter between 50
and 100 nm
Water treatment leads to a wider distribution of particle diameter but the predominant
rod-like shape of the parent sample is conserved
Upon phosphoric acid treatment the particles loose their rod-like shape and their size is
reduced Aggregates of particles with ill defined shape can also be observed
Treatment by tetramethylethylenediamin leads to a rather wide distribution of particle
size The shape varies from plate-like to needles and also particles with aspect ratio close
to unity can be observed
129
Figure 531 The SEM picture of the catalysts 6902 (parent sample) 7797 (water treated sample) 7798 (H3PO4 treated sample) 7799 (TMEDA treated sample) 7800 (NaBrO3 treated sample) 8113 (N2H4
treated sample)
Also in the bromate treated sample a broad shape and size distribution can be observed
In the hydrazine treated sample the predominant shape of needle-like morphology from
the parent sample is conserved however particles with not well defined shape between
50-100 nm intervals can also be observed
130
original water H3PO4 TMEDA NaBrO3Hydrazine0
10
20
30
40
50
60
70
80
content [
]
sample
Nb
Mo
Te
V
Figure 532 The elemental composition of the original and the modified catalysts as probed by EDX
The bulk elemental composition of all the samples was determined by means of EDX
(Figure 532) The parent sample (6902) consists of 6244 at Mo 1627 atV 689
at Te and 1440 at Nb which corresponds to a formula of MoV026Te011Nb023Ox
In the distilled water treated sample (7797) the enrichment of Mo and V (6261 at and
1728 at) and depletion of Te and Nb (647 at and 1365 at respectively) was
observed leading to a formula of MoV028Te010Nb022Ox
The phosphoric acid treatment leads to slight decrease of Mo V and Te content in the
sample 7798 (6064 at 1516 at and 550 at respectively) balanced by the
enrichment of Nb (187 at)
Upon tetramethylethylenediamine treatment the Mo and Te content is increasing (to
6294 at and 727 at) while the V and Nb content decreases (1607 and 1372 at)
giving a sample of 7799 with the formula MoV026Te012Nb022Ox
Bromate treatment leads to the most significant depletion of Mo (to 5994 at) while V
Te and Nb are enriched (1699 704 and 1663 at) This sample with number 7800 has
the formula of MoV028Te012Nb028Ox
Upon hydrazine treatment the Mo and Te content decreases (6045at and 637 at)
while V and Nb are enriched compared to the parent sample (1784 at and 1534at)
The formula of the sample 8113 is MoV030Te011Nb025Ox
131
534 XAS and XPS
X-ray photoelectron spectroscopy (XPS) spectra were recorded at the synchrotron
radiation facility BESSY II for each modified samples The high pressure XPS spectra
were recorded at room temperature and in the presence of about 025 mbar oxygen
pressure in order to avoid the beam-induced reduction of the tellurium
No significant difference was observed between the X-ray absorption spectra (XAS)
corresponding to the original material water- phosphoric acid-
tetramethylethylenediamine- and hydrazine treated samples This suggests that no
significant changes happened in the average oxidation state or coordination geometry of
the metals upon treatment with the above named modifiers On the other hand the
difference spectra between the bromate treated sample (7800) and the original material
corresponding to the vanadium L3 edge showed a similarity with the V5+ reference
spectrum (Figure 535) This suggests that the bromate treatment lead to partial oxidation
of the V4+ ions to V5+
The survey photoelectron spectra showed that phosphorous- nitrogen- and bromide
containing species are absent in all the samples This suggests that none of the modifying
agents or their eventual reaction products (complexes reduced or oxidized forms of
bromate and hydrazine respectively) were bound to the catalyst
533 NEXAFS spectra of the bromate treated sample( 7800) the parent sample (6902) the difference
spectrum and the V5+ reference spectrum
132
Therefore the contamination of the M1 structure with different molecular or ionic
species from the chemical treatment can be ruled out
Core level photoelectron spectra of O1s V2p (32) Mo3d (52) Nd3d (52) and Te3d
(52) were recorded at different kinetic energies Low kinetic energy (165 170 and 180
eV) was applied for surface sensitive mode while higher kinetic energy (465 470 and
480 eV) for the bulk sensitive mode
The binding energy (BE) of Mo3d (52) are slightly lower compared to the typical value
of 2326 eV reported for MoO3 standard compound [5 13 14] The Mo3d peak is likely
composed of three peaks corresponding to a binding energy of 2310 2320 and the
highest component of 2326 eV Therefore the predominant oxidation state of
molybdenum is 6+ with minor contribution of 5+ and 4+ The presence of low
abundance of Mo5+ oxidation state has also been reported [14 15]
Table 533 The binding energies corresponding to every catalyst
Sample O1s
(eV)
V2p (32)
(eV)
Mo3d (52)
(eV)
Nb3d (52)
(eV)
Te3d
(52)
(eV)
6902 parent 5303 5163 2321 2064 5762 5733
7797 H2O 530-5301 516-5161 2320-2321 2063 576-5762 573-5732
7798 H3PO4 5299-5301 516-5162 2321 2063 576-5761 573-5731
7799 TMEDA 5301-5302 5161-5162
~2322 2064-2065 576-5761
573
7800 NaBrO3 ~5303 ~5164-5162
~2322 ~2065 5764-5762
~5733 8113
N2H4H2O 5301- 5302
5162-5163
2322 2065 5763 5733
The binding energy of Nb3d (52) was close to the value of 2072 reported for 5+
oxidation state while the binding energy of tellurium indicated the oxidation state of 4+
On the other hand the vanadium oxidation state was found to be 4+ As identified by
XAS in the bromate treated sample a small amount of V5+ was also present
133
The surface and bulk elemental composition was quantified from the spectra obtained at
low and high kinetic energy respectively The bulk elemental composition showed a
good agreement with the values determined by multi-spot EDX analysis
Figure 534 Normalized surface concentrations Correlation of Te content and TeV ratio with the
normalized selectivity to acrylic acid (bar-graph)
For a correlation between the elemental composition and the elemental composition and
the catalytic properties the surface concentration of the constituents corresponding to
every catalyst was normalized to the water treated sample 7797 (Figure 534)
Similarly the selectivity to acrylic acid determined at a propane conversion of 22plusmn2
was normalized to the selectivity of the water treated sample More detailed description
about catalytic oxidation of propane can be found in the subchapter 541 A good
correlation was found between the tellurium and the normalized selectivity The same
trend can be observed for between the tellurium to vanadium ratio and the normalized
selectivity This observation is in accordance with that reported by Haumlvecker et al [15]
134
535 Microcalorimetry
Adsorption microcalorimetry was employed to determine the number strength and
energy distribution of the adsorption sites on the catalyst Among the possible probe
molecules applicable in microcalorimetry propane and propylene were used to determine
the adsorption heat of educt on the catalyst On the other hand CO and NH3 probe
molecules were applied in order to characterize the acid-base properties of the sample
The interaction of these latter molecules with the catalyst was monitored also by means
of FTIR spectroscopy
A detailed microcalorimetric experiment using propane and propylene as probe
molecules was carried out on the original catalyst (6059) the results serving as
reference for the modified and spent catalysts The term ldquospent catalystrdquo refers to a
sample which has been used for catalytic reaction of propane and propylene oxidation
Since the aim of the study was to determine adsorption properties the temperature was
chosen low enough (40degC) to avoid chemical reaction on the catalyst surface
The Figure 535 displays the adsorption isotherm and the differential heat of propane
adsorption on the original material before and after catalytic reaction
Adsoprtion isotherm Differential heats as a function of coverage Figure 535 Adsorption of propane (educt of the catalytic reaction) at 313 K on fresh (dots) and used M1
(triangle) activated at 423 K under vacuum
The adsorption isotherm was fitted with a Langmuir model A fit up to 25 mbar
equilibrium pressure corresponding to the monolayer coverage yielded an adsorption
order of 106 on the fresh catalyst The adsorption equilibrium constant was found to be
135
0080 On the other hand the amount of adsorbed propane on the spent catalyst is lower
at every equilibrium pressure compared to the fresh catalyst The Langmuir fit gave an
adsorption order of 104 The adsorption order close to unity suggests non dissociative
adsorption
The initial differential heat of propane adsorption on the fresh M1 MoVTeNbOx is
constant at approximately 57 kJmol This indicates homogeneous distribution of
energetically uniform adsorption sites Additionally FTIR spectroscopy of ammonia
adsorption showed the presence of both Broslashnsted and Lewis acid sites However the ratio
between the Broslashnsted and Lewis acid sites was found to be equal to 234 [15]
The monolayer is completed at 35 micromolm2 propane coverage corresponding to an
equilibrium pressure of 25 mbar Above this coverage the differential heat of adsorption
decreases linearly with the amount of adsorbed propane suggesting the absence of
interaction between adsorbed molecules A saturation value of adsorption is reached at
about 52 micromolm2 and 22 kJmol enthalpy
Upon desorption of propane by evacuation at 40degC the integral signal of desorption was
recorded The integration of this signal gave the integral heat of desorption The absolute
value of the sum of differential heat of adsorption is comparable to the integral heat of
desorption (Table 534) indicating that the propane adsorption is a reversible process
Additionally the individual differential adsorption signals did not deviate from the
baseline suggesting that the process is pure adsorption The time constant of the stepwise
adsorption was found to be close to the time constant determined in the calibration of the
calorimetric cell (250-350 s) This also supports the absence of an additional process (eg
chemical reaction) besides the adsorption
A repeated experiment (re-adsorption after desorption Table 534) showed that the
isotherm and the differential adsorption heats are reproducible
Table 534 Adsorption and desorption heats corresponding to different coverages
Experiment (J) 1
)int(sum=
n
i
adsiq (J) )int( desiqminus
Adsorption of 0006 mmolm2 C3H8 789 656
Re-adsorption of 0004 mmolm2 C3H8 156 153
136
The initial differential heat of propane adsorption was constant also on the spent 6059
catalyst indicating homogeneous distribution of adsorption sites Nevertheless the initial
differential adsorption heat determined for on the spent catalyst was lower compared to
the fresh catalyst it is only ca 40 kJmol Similarly to the fresh catalyst the monolayer
was completed at a coverage of 35 micromolm2 coverage on the spent catalyst as well Since
the monolayer coverage is the same like on the fresh catalyst the number of adsorption
sites does not change during catalytic reaction but the strength of the interaction
decreases by ca 30
The linear decay of the differential heat of adsorption after completion of the monolayer
suggests that there are no significant interaction forces between the adsorbed molecules
The reversibility of the propane adsorption on the spent catalyst was proven by the good
agreement between the sum of integral heats corresponding to the individual adsorption
steps and the integral heat of desorption
The propylene adsorption isotherms and heat profiles determined at 40degC corresponding
to the fresh and spent 6059 catalyst are displayed on Figure 536 For comparison the
propane adsorption isotherms and heat profiles are also included in the plot
Adsorption isotherm Differential heats as a function of coverage Figure 536 Adsorption of propylene at 313 K on fresh (dots) and used M1 (triangle) activated at 423 K
under vacuum
The propylene adsorption isotherms indicate that a larger amount of propylene can be
adsorbed than propane on the fresh and used catalyst at the same equilibrium pressure
137
Similarly to propane adsorption the spent catalyst adsorbs a lower amount of propylene
compared to the fresh catalyst
The heat profile of propylene adsorption on fresh catalyst reflects the formation of two
different adsorption complexes due to energetically different adsorption sites Below the
coverage of 2 micromolm2 the differential heats are constant at ca 54 kJmol which is
comparable to the propane differential adsorption heat
The second plateau on the heat profile is between 25 and 42 micromolm2 where the
differential adsorption heat is around 41 kJmol Above the coverage of 42 micromolm2 the
differential heat of propylene adsorption decays linearly indicating no interaction
between the adsorbed molecules
Upon evacuation at 40degC the signal corresponding to the propylene desorption was
recorded The integral desorption heat was found to be 10 J while the sum of the
individual integral heats was 20 J The large difference between the adsorption and
desorption heats suggests that the propylene adsorption is not a fully reversible process
in contrast to propane adsorption On the other hand the time constant was between 400
and 550 seconds for the low propylene coverage This exceeds significantly the time
constant of 250-350 seconds determined for the empty calorimeter indicating irreversible
adsorption Nevertheless at higher propylene coverage the time constant of the
adsorption was comparable to that determined for the empty calorimeter
The partial irreversibility of propylene adsorption might be assigned to partial physical
blockage of adsorption sites or irreversible changes of these sites In order to find out
which of these possibilities is the reason for the observed irreversibility the adsorption
properties were re-measured with propane as probe molecule
After desorption of propylene from the fresh 6059 sample propane was re-adsorbed at
40degC The adsorption isotherm of propane re-adsorption performed after propylene
adsorption-desorption cycle showed a very significant difference in comparison to the
propane adsorption on the fresh 6059 sample (Figure 538) The amount of re-adsorbed
propane was significantly lower at any equilibrium pressure indicating that the number
138
of available adsorption sites was reduced during propylene adsorption-desorption
experiment
On the heat profile corresponding to the propane re-adsorption an initial plateau at 57
kJmol was observed
Adsorption isotherm Differential heats as a function of coverage Figure 537 Adsorption of propane at 313 K after propylene adsorption on fresh (open dots) M1 activated
at 423 K under vacuum For comparison the propane adsorption isotherm and differential heat profile if propane firstly adsorbed on the fresh M1 (dots)
This differential adsorption heat of propane is equal to the value determined on the fresh
catalyst suggesting that the energetics of propane adsorption is the same The
homogeneous distribution of the propane adsorption sites was not altered by the
preceding propylene adsorption-desorption process Nevertheless the monolayer
completion occurred already at around 03 micromolm2 coverage indicating that the number
of adsorption sites was reduced very significantly by ca 90 upon propylene
adsorption-desorption This confirms the observation made by comparing the adsorption
isotherms shown on Figure 536
The heat profile corresponding to propylene adsorption on the spent catalyst showed
three plateaus which is an indication of three groups of energetically equivalent
adsorption sites The initial differential adsorption heat determined up to 1 micromolm2
coverage is 55 kJmol This is identical with the initial adsorption heat on the fresh
sample but also similar to the propane initial adsorption heat on the fresh sample
Between 1 and 3 micromolm2 coverage the propylene adsorption heat is 41 kJ which is
139
equal to that determined for the fresh catalyst The third group of energetically equivalent
adsorption sites characterized by an adsorption heat of 37 kJmol can be observed
between 3 and 6 micromolm2 coverage
Propane adsorption experiment was carried out also on the fresh and spent bromate
treated M1 sample (7800) Compared to the original sample the modified catalyst
(7800) adsorbed a lower amount of propane at any equilibrium pressure The same trend
could be observed upon comparing the adsorption isotherms of the spent original and
spent bromate modified (7800) samples (Figure 539)
On the heat profile the fresh bromate treated sample shows an initial linear decay of the
differential heat of adsorption The differential adsorption heat is constant at 33 kJmol
between 22 and 35 micromolm2 coverage This plateau indicates the presence of Broslashnsted
acid sites After the decaying trend a second plateau can be observed between 4 and 5
micromolm2 coverage
FTIR study on ammonia adsorption supported the presence of both acid sites and
revealed a ratio of Broslashnsted to Lewis acid sites equal to 229 [15] This number is lower
compared to that one determined on the original material (234) indicating that indeed
and the density of Lewis acid sites is increasing upon bromate treatment
Additionally the spent bromate treated sample showed a decaying heat profile with no
plateau
Adsorption Isotherm Differential heats as a function of coverage Figure 538 Microcalorimetry on the bromate-treated phase-pure M1 catalyst (7800) before and after
catalytic experiment
140
The quantities of propane adsorption determined from the three-variable Langmuir fit
(adsorption order n monolayer coverage Nmono and the equilibrium constant of
adsorption K) are summarized in Table 535 The propane adsorption equilibrium
constant decreases for both catalysts during the reaction
The surface area available for propane adsorption was calculated based on the monolayer
coverage assuming one-to-one adsorption stoechiometry and propane cross sectional
area of 355Aring2 The surface areas determined by propane and propylene adsorption are in
good agreement with the surface area determined by nitrogen physisorption
Table 535 The adsorption order monolayer coverage and adsorption constant of propane adsorption for the 6059 and bromate treated sample (7800)
Surface area (m2g) Probe
molecule
Catalyst
state
Catalyst
ID n
Nmono
(mmolg)
K
(hPa-1) Langmuir BET
6059 107(1) 00485(8) 0078(3) 104 879 Fresh
7800 128(4) 00561(1) 0006(2) 132 504
6059 113(6) 0048(7) 0022(6) 114 nd C3H8
Spent 7800 099(8) 0044(3) 0005(4) 103 nd
Therefore the main difference between the original and the bromate treated sample
probed by adsorption microcalorimetry are the following
bull the fresh original catalyst exhibits homogeneously distributed energetically
equivalent adsorption sites for propane adsorption while upon bromate treatment
energetic heterogeneity
bull the energetic homogeneity of the adsorption sites is conserved for the original
material during the propane oxidation reaction but the reaction induces reduction
of the differential adsorption heat compared to the fresh catalyst In contrast to
this the heat profile of the spent bromate treated material shows a high degree of
heterogeneity the LewisBroslashnsted acid site ratio changes as observed by FTIR
study on ammonia adsorption
141
54 Catalytic experiments
541 Propane oxidation
Prior to catalytic tests the samples were pressed with 15 tons of force for 1 minute in a
pressing tool with 13 mm die Then the pellet was crushed gently in an agate mortar A
sieve fraction between 250 and 355 microm was used for catalytic experiments An amount of
ca 024 g sieve fraction was mixed with SiC (particle size between 315 and 400 microm) and
loaded in the isothermal zone of the reactor tube
Constant feed composition was used (C3H8O2H2ON2=364051 vol) while the space
velocity was varied between 20000 and 3000 h-1 at a reaction temperature of 400degC
The propane conversion at different space velocities is shown in Figure 541 The
activity of H3PO4- H2O- and TMEDA treated samples are slightly higher compared to
the parent sample However the differences are becoming less significant in the integral
operation mode between 30 and 80 conversion On the other hand the activity of the
bromate treated sample was significantly below the parent- and other modified samples
20000 15000 10000 50000
20
40
60
80
100
X C3H8 ()
GHSV (h-1)
6902 - original 7797 - H
2O mod 6902
7798 - H3PO
4 mod 6902
7799 - TMEDA mod 6902 7800 - NaBrO
3 mod 6902
8113 - N2H
4 mod 6902
Figure 541 The activity of the catalysts
The hydrazine treated sample showed lower activity at a space velocity compared to the
parent sample The activity becomes the same in the space velocity interval between
15000 and 5000 h-1 At GHSV=3000 h-1 the oxygen conversion reached 100 for this
catalyst and consequently the propane conversion was lower compared to the other
142
catalysts After performing the measurement at GHSV=3000 h-1 the catalytic properties
were re-measured at a space velocity of 5000 h-1 These results are summarized in Table
541 The data show that the catalytic properties are reversible after performing the
reaction under partly reducing conditions (100 oxygen conversion) This is in
accordance with the observations reported in the subchapter 431 In case of all the other
catalysts the highest oxygen conversion was ca 95 The selectivity to acrylic acid of all
the catalysts is plotted against the space velocity (Figure 542 left) The highest
selectivity was reached on the parent sample (6902) at the space velocity of 10000 h-1
Compared to this the selectivity on H2O- H3PO4 and TMEDA are slightly lower at
space velocities above 10000 h-1 and more significantly lower below GHSV=10000 h-1
The selectivity of the hydrazine and bromate treated samples is significantly below the
parent sample
Table 541 The catalytic performance of the hydrazine treated catalyst (8113) compared before and after the complete oxygen conversion experiment
Catalytic
Property GHSV=5000 h
-1 GHSV=3000 h
-1 GHSV=5000 h
-1
remeasured
XC3H8 () 589 plusmn 22 651 plusmn 61 589 plusmn 41 XO2 () 769 plusmn 22 100 778 plusmn 20 SAA () 314 plusmn 17 149 plusmn 21 279 plusmn 11 SCO2 () 286 plusmn 11 383 plusmn 17 292 plusmn 28 SC3H6 () 47 plusmn 04 34 plusmn 04 55 plusmn 05 SHAc () 88 plusmn 06 100 plusmn 13 120 plusmn 16 SCO () 265 plusmn 10 335 plusmn 15 278 plusmn 23
C-bal () 790 plusmn 11 908 plusmn 106 829 plusmn 40
The yield to acrylic acid at every space velocity is shown in Figure 542 (right) The
maximum yield of ca 26 has been attained on the parent sample and the TMEDA
treated sample at the space velocity of 5000 h-1 For the H2O- H3PO4 and N2H4 modified
samples the maximum yield of ca 20 was also at the space velocity of 5000 h-1 This
suggests that the kinetics of the reaction might be similar on these catalysts though the
rate constants may differ slightly
143
20000 15000 10000 50000
20
40
60
80
100 6902 - original 7797 - H
2O mod 6902
7798 - H3PO
4 mod 6902
7799 - TMEDA mod 6902 7800 - NaBrO
3 mod 6902
8113 - N2H
4 mod 6902
Selectivity to AA ()
GHSV (h-1)
20000 15000 10000 50000
10
20
30
40
50 6902 - original 7797 - H
2O mod 6902
7798 - H3PO
4 mod 6902
7799 - TMEDA mod 6902 7800 - NaBrO
3 mod 6902
8113 - N2H
4 mod 6902
GHSV (h-1)
Yield AA ()
Figure 542 The selectivity and yield of the catalysts
The conversion selectivity and yield profile of the bromate treated sample however
differs very much from all the other catalysts which suggests that the kinetics of propane
oxidation is significantly different
6902 7797 7798 7799 7800 811320
40
60
80
1006902 - original7797 - H
2O mod 6902
7798 - H3PO
4 mod 6902
7799 - TMEDA mod 69027800 - NaBrO
3 mod 6902
8113 - N2H
4 mod 6902
Apparent activation energy (kJm
ol)
Catalyst sample number
Figure 543 The apparent activation energy of propane activation over the catalysts
The temperature variation in 20degC steps between 360 and 400degC was carried out at a
space velocity of 5000 h-1 The apparent activation energy of propane consumption has
been determined from the Arrhenius plots Similar activation energies have been found
for the parent sample and the H2O- H3PO4- TMEDA and N2H4 treated samples
144
However the apparent activation energy of propane on the bromate and hydrazine treated
sample was significantly higher than for the other samples
542 Kinetic analysis of propane oxidation over the modified catalysts
The primary analysis of the activity and selectivity to acrylic acid on different catalysts
showed that only the bromate and the hydrazine treated samples are behaving different in
propane oxidation reaction The product rank analysis revealed that the reaction pathways
are also different although in every case the catalyst was M1 MoVTeNbOx with slightly
different surface and bulk elemental composition (Appendix 51) In this subchapter the
kinetic analysis of propane oxidation is presented
In section 423 and 424 it is shown that the reaction is first order with respect to
propane and 05th order with respect to oxygen Prior to kinetic modeling the verification
of first order kinetics with respect to propane and half-order kinetics with respect to
oxygen was verified using the integral method [16-17] For this purpose the integrated
rate laws were considered (Equations 541 and 542)
)245 ( 2
)145 ( lnln
222
8383
083
83
50
050
Equationkcc
Equationkyc
c
OappOO
HCappHC
HC
HC
τ
τ
sdotsdot+=
sdotminus==
The logarithm of the dimensionless propane concentration was plotted against the contact
time leading to straight lines This indicates that on every catalyst the reaction order with
respect of propane is equal to one According to the integrated rate law corresponding to
oxygen the square root of the oxygen concentration was represented in function of the
contact time No curvature was observed on the plots which supports that the reaction
order with respect to oxygen is 05 for all the catalysts
145
00 04 08 12 16 20-20
-16
-12
-08
-04
00
04 6902 7797 7798 7799 7800 8113
ln(yC3H8)
WF (gsml)
00 04 08 12 16 20
000
005
010
015
020
025
030 6902 7797 7798 7799 7800 8113
sqrt(cO2)
WF (gsml)
C3H8 O2
Figure 544 The linear representation of the rate law with respect to propane and oxygen 6902 ndash original 7797 ndash H2O modified 7798 ndash H3PO4 modified 7799 ndash TMEDA modified 7800 ndash NaBrO3
modified 8113 ndash N2H4 modified sample
The slopes of the linear regressions are collected in the Table 543 These slopes
correspond to the apparent rate constants of propane and oxygen consumption
respectively The apparent rate constant of propane activation is very similar for all the
catalysts except for the bromate treated sample which is less active by a factor of 27
compared to the parent sample
Table 542 The apparent rate constants of propane and oxygen consumption
C3H8 O2 Catalyst
-slope (mlgs) RN -slope (mlgs) RN
6902 119 plusmn 005 -09973 5 072 plusmn 001 -09999 5 7797 112 plusmn 009 -09955 5 068 plusmn 001 -09993 5 7798 116 plusmn 004 -09945 5 060 plusmn 001 -09995 5 7799 112 plusmn 004 -09854 5 074 plusmn 001 -09998 5 7800 044 plusmn 002 -09971 5 019plusmn 001 -09901 5 8113 114 plusmn 002 -09923 4 080 plusmn 005 -09989 5
Propylene was found to be an intermediate product The reaction pathways involving
propylene was approximated by the following scheme
)145 (Re Pr6383 actionoductsHCHC rarrrarr
146
The rate constant of propylene formation is k1 while the cumulative rate constant of
propylene further oxidation is k2 The differential equations corresponding to this scheme
are the following
)445 (
)345 (
63283163
83183
Equationckckdt
dc
Equationckdt
dc
HCHCHC
HCHC
sdotminussdot=
sdot=minus
By dividing the above two differential equations the derivative of time (dt term) is
cancelled and resulting differential equation contains only concentrations (Equation
545) Solving this differential equation leads to the equation involving the dimensionless
concentrations of propane and propylene and the dimensionless ratio of the rate constants
(κ=k2k1) (Equations 546 and 547)
[ ]
)845 ( )(
)745 ( 1
1
)645 (
)545 (
2
163exp63
838363
083
83
083
83
12
1
083
63
831
632831
83
63
1
2
Equationn
yy
S
Equationyyy
Equationc
c
c
c
kk
k
c
c
Equationck
ckck
dc
dc
n
i
calcdHCHC
HCHCHC
k
k
HC
HC
HC
HC
HC
HC
HC
HCHC
HC
HC
sum=
minus=
minussdotminus
=
minussdot
minus=
sdotminussdotminussdot
=
κ
κ
Iterative nonlinear fitting procedure was employed for the determination of the
dimensionless rate constant (Figure 545) A plausible value of κ was chosen and then
the value of yC3H6 was calculated For the objective function of the fitting the standard
deviation between the measured and calculated propylene dimensionless concentration
has been considered (Equation 548) The iteration was continued until the minimum of
the objective function was found (dSdκ=0) (Figure 545 right)
147
yC3H6 vs WF plot Standard deviation vs κ
00 02 04 06 08 10 12 14 16
000
001
002
003
004
005 y
C3H6 experimental
yC3H6
calculated κ=30
y C3H6
WF (gsml)
24 26 28 30 32
00000
00002
00004
00006
00008
00010
00012
00014
Standard deviation
κ
Figure 545 Plot of the experimental with calculated yC3H6 data for catalyst 6902
The dimensionless rate constant κ for each catalyst was determined using the above
described procedure The numerical values are collected in Table 543
Table 543 The rate constants of propane and propylene consumption
Catalyst ID k1
(mlgs) κκκκ k2
(mlgs) ττττmax
(gsml)
6902 119 300 3570 010 7797 112 225 2520 013 7798 116 234 2714 012 7799 112 225 2520 013 7800 044 232 1021 032 8113 114 220 2508 013
The κ values may be compared to literature results
Griszligtede reported a propane consumption rate constant of 084 gsml a propylene partial
oxidation rate constant to acrylic acid equal to 17 gsml and a rate constant of 34 gsml
towards byproducts (CO CO2 and acetic acid) formation on a MoV033Te025Nb017Ox
catalyst [12 18] The global consumption rate of propylene is therefore 204 gsml The
ratio of propylene consumption and propane consumption rate is 204084=243
Loacutepez-Nieto et al reported a value of ca 24 on a predominantly M1 phase containing
MoVTeNbOx catalyst [19]
148
Naraschewski et al reported a value of 25 for MoVTeNbOx catalysts with ten different
elemental- and phase compositions [20] However the fitting was made in case of one of
the catalyst the κ value for each catalyst was not quantified
From the κ and the k1 data the k2 was also calculated and shown in the Table 544
Additionally the contact time corresponding to the maximum propylene concentration
was also calculated (Table 543)
)945 ( ln)1(
1ln
1
11
2
12max Equation
kk
k
kkκ
κτ
minus=
minus=
It can be seen that the maximum propylene concentration is at around 012 gsml for most
of the catalysts This low contact time was not covered in the experiments On the
bromate treated sample (7800) the calculated τmax is equal to 032 while the
experimental value lies around 033 which is in good agreement with the calculated one
543 Propylene oxidation
Catalytic testing in propylene oxidation reaction has also been carried out using the
parent sample and all the modified descendant catalysts
The feed composition was the following C3H6O2H2ON2=364051vol According to
the reasoning in section 425 the temperature interval between 360-400degC was chosen
which corresponds to the temperature interval for the propane oxidation The space
velocity was kept at 20000 h-1 in order to achieve propylene conversions below 100
The ranking order of the catalysts in the activity of propylene activity resembles the
activity in propane oxidation the tetramethylethylenediamine treated sample showed the
highest activity followed by the original the water- the phosphoric acid hydrazine and
the bromate treated samples Similarly to the propane oxidation reaction the propylene
conversion was also significantly lower on the bromate treated sample compared to the
other catalysts
149
360 370 380 390 400
40
60
80
100
6902 7797 7798 7799 7800 8113
X C3H6 ()
T (degC)
Figure 546 The activity of the catalysts in propane oxidation reaction 6902 ndash original 7797 ndash H2O
modified 7798 ndash H3PO4 modified 7799 ndash TMEDA modified 7800 ndash NaBrO3 modified 8113 ndash N2H4 modified sample
360 370 380 390 4000
20
40
60
80
100
6902 7797 7798 7799 7800 8113
S AA ()
T (degC)
360 370 380 390 4000
20
40
60
80
6902 7797 7798 7799 7800 8113
Y AA ()
T (degC)
Figure 547 The selectivity and yield of the catalysts in propane oxidation reaction 6902 ndash original 7797 ndash H2O modified 7798 ndash H3PO4 modified 7799 ndash TMEDA modified 7800 ndash NaBrO3 modified
8113 ndash N2H4 modified sample
The acrylic acid selectivity was found to be the highest on the bromate treated sample
followed by the hydrazine treated sample (Figure 547) The higher selectivity however
may be attributed to the fact that these catalysts are less active than the others The
150
acrylic acid selectivity on other catalysts was lower and similar to each other with a
maximum at 380degC
When the the acrylic acid yield is compared the highest performing catalyst is hydrazine
treated sample All the other catalysts show a similar yield at every temperature except
for the bromate treated sample which has the lowest performance (Figure 547)
It is notable that the ratio between the CO and CO2 selectivity is higher than one for the
parent- H2O- TMEDA- and treated samples while for the H3PO4- NaBrO3 and N2H4-
treated samples this ratio is statistically close to one
544 CO oxidation and water gas shift reaction
CO oxidation reaction as a test reaction for electrophilic oxygen species on the catalyst
surface was also performed [21] The reaction was carried out in dry and in 40vol
steam containing feed Besides this water gas shift reaction was also carried out using a
40 vol steam containing feed The same experimental procedure was applied as it was
described in the section 427
150 200 250 300 350 400
000
001
002
003
004
005
006 8947 7800 8113
CO2 concentration (vol
)
T (degC)
000 025 050 075 100 125 150
0000
0005
0010
0015
0020
0025 8947 7800 8113
yCO2
WF (gsml)
CO2 production vs temperature yCO2 vs contact time at 400degC
Figure 548 The CO oxidation activity at different temperatures and GHSV=3000 h-1 (left) The kinetic curves of CO2 formation at 400degC (right) Conditions COO2H2ON2=36091 vol Catalysts 8947 ndash
as prepared M1 MoVTeNbOx 7800 ndash NaBrO3 treated 6902 8113 ndash N2H4 treated 6902
151
CO oxidation carried out in steam free oxidizing feed (GHSV=3000h-1) at different
temperatures revealed that for all the catalysts the onset temperature is between 250 and
300degC The ranking order in CO oxidation activity at 400degC is the following hydrazine
treated sample (8113) the bromate treated material (7800) and original sample
(8947) Therefore the abundance of electrophilic oxygen species is decreasing in this
order of the catalysts [26] It is also notable that the CO conversion was far below the
equilibrium conversion for both the CO oxidation and water gas shift reactions (100
and 996 respectively) calculated from the thermodynamic data of CO CO2 H2 and
H2O (Table 545)
Table 544 Activation energy of CO oxidation Feed composition COO2H2ON2=36091 vol 8947 ndash as prepared M1 MoVTeNbOx 7800 ndash NaBrO3 treated 6902 8113 ndash N2H4 treated 6902
Catalyst ID Ea (kJmol)
8947 51 plusmn 2 7800 55 plusmn 7 8113 54 plusmn 7
Because the CO conversion is very low (below 3) all the data are in the differential
operation regime Therefore the rate constant of CO2 formation is equal to the slope of
the straight line of the dimensionless concentration of CO2 represented in function of the
contact time (Figure 548 and 549) Since there is no other product than CO2 the rate
and rate constant of CO consumption is equal to the rate and rate constant of CO2
formation The activation energy of CO oxidation determined from the Arrhenius-plot is
statistically similar on the three catalysts (Table 544)
In case of all the three catalysts the water gas shift reaction had the lowest conversion
and rate constant followed by the CO oxidation in dry feed (Table 545 and 546) The
highest CO conversion was observed in the case of CO oxidation in presence of 40 vol
steam in the feed This suggests that CO oxidation and water gas shift reactions are
parallel reaction steps However it is notable that the CO oxidation activity in presence
of 40 vol steam is less than the algebraic sum of the CO conversions determined in the
CO oxidation in dry feed and the water gas shift reaction in presence of 40 vol steam
152
000 025 050 075 100 125 150
0000
0005
0010
0015
0020
0025
0030 8947 7800 8113
yCO2
WF (gsml)
000 025 050 075 100 125 150
00000
00025
00050
00075
00100
00125
00150
yCO2
8947 7800 8113
WF (gsml)
CO oxidation in presence of steam
COO2H2ON2=364051 vol 400degC Water gas shift reaction
COO2H2ON2=304057 vol 400degC Figure 549 Kinetic curves for CO2 formation for the CO oxidation in presence of steam and for the water
gas shift reactions Catalysts 6902 minus as prepared M1 MoVTeNbOx) 7800 minus NaBrO3 treated sample 8113 minus N2H4 treated sample
Table 545 The CO conversion at GHSV=3000 h-1 and 400degC
Catalyst ID
XCO () CO oxidation
COO2H2ON2= 36091 vol
XCO () CO oxidation
COO2H2ON2= 364051 vol
XCO () water gas shift
COO2H2ON2= 304057 vol
8947 114plusmn012 146plusmn004 074plusmn004 7800 186plusmn004 239plusmn002 099plusmn012 8113 215plusmn012 227plusmn004 132plusmn008
Equilibrium 100 100 996
The rate constant of CO oxidation or water gas shift reaction was found to be very low in
the order of magnitude of 10-2 mlgs The same trends of the rate constant with respect of
the catalyst and the feed composition can be observed like in the activity expressed by
CO conversion (Table 546) The difference between the rate constant of CO oxidation in
dry feed and the sum of the rate constants CO oxidation in dry feed and the water gas
shift reaction suggests that these reactions may run in parallel but their contribution is
not the same
153
Table 546 Rate constants of CO2 formation at 400degC
Catalyst ID
kCO2 (mlgs) CO oxidation
COO2H2ON2= 36091 vol
kCO2 (mlgs) CO oxidation
COO2H2ON2= 364051 vol
kCO2 (mlgs) water gas shift
COO2H2ON2= 304057 vol
8947 (104plusmn04)10-3 (127plusmn03)10-3 (62plusmn02)10-3 7800 (148plusmn02)10-3 (192plusmn02)10-3 (87plusmn08)10-3 8113 (164plusmn04)10-3 (184plusmn03)10-3 (89plusmn05)10-3
The very low reactivity in CO oxidation and water gas shift reaction supports the fact that
during the propane oxidation the CO2 is formed in reaction steps which are independent
on the CO formation steps
55 Conclusions
The chemical treatment of the phase-pure MoVTeNbOx catalyst (referred to as parent or
original sample) with distilled water and solutions of phosphoric acid
tetramethylethylenediamin sodium-bromate and hydrazine was carried out at room
temperature The solutions were chosen in such a way to cover all the chemical effects
neutral acidic and complexing basic and complexing oxidizing and reducing None of
these treatments altered the M1 phase as probed by XRD The surface area was only
marginally affected by the treatment as shown by N2 physisorption
The morphology did not change significantly upon water treatment of the M1 material
However the treatment by all other solutions changed more significantly the shape of the
particles and the aspect ratio In contrast to the literature evidence [4] not only the
surface composition but also the bulk elemental composition was slightly affected by
chemical treatments with different solutions Nevertheless the M1 phase was kept intact
which showed that the crystal structure is robust enough to withstand minor changes in
the elemental composition upon leaching with the above mentioned solutions Besides
leaching of ions the oxidation of V4+ to V5+ during bromate treatment was also observed
No detectable change of the oxidation states has been observed for the other modified
catalysts
All the modified samples were tested for propane and propylene oxidation reaction Only
marginal improvements were observed in the propane conversion for the H2O- H3PO4
and the TMEDA-treated samples accompanied by a slight decrease in the acrylic acid
154
selectivity On the other hand the hydrazine treatment reduced slightly while the
bromate treatment reduces significantly both the conversion and the acrylic acid
selectivity at any space velocity For these two latter catalysts the apparent activation
energy was found to be higher than for all the other samples The reaction pathway
analysis using the delplot technique revealed that propylene is a first rank product in
every case The acrylic acid CO CO2 and acetic acid were found to be mixed rank
products (including primary secondary and tertiary ranks the main rank being
secondary) The only exception is the hydrazine treated sample on which all products
were found to be of first rank This sample is the only one which exhibited COCO2
selectivity ratio smaller than one
The first order kinetics with respect to propane and half order kinetics with respect to
oxygen was conserved in all the modified catalysts The ratio of propylene formation and
its further consumption is the highest (κ=30) for the parent sample This ratio is lower
for the modified catalysts the lowest value of 22 being determined for the hydrazine
treated sample
The ranking order for catalytic performance of propylene oxidation resembles to the trend
observed in propane oxidation
CO oxidation reaction was carried out on selected catalysts as a semi-quantitative
indicator-reaction for electrophilic oxygen species The semi-quantitative character of
this test reaction is derived from the fact that no standards were used with known
abundance of electrophilic oxygen species on the surface but rather the parent sample
was used as a reference catalyst The CO oxidation activity of the bromate and hydrazine
treated samples were determined because these showed markedly different catalytic
behavior both in propane and propylene oxidation reactions The ranking order in CO
oxidation activity showed that the hydrazine treated sample exhibits the highest
abundance of electrophilic oxygen species followed by the bromate treated sample and
the original catalyst
Furthermore water gas shift reaction and CO oxidation in presence of steam was also
carried out on these catalysts The CO conversion was found to be below 25 at the
space velocity of 3000 h-1 and a reaction temperature of 400 degC The low rate of CO2
production indicated that under propane oxidation conditions the CO oxidation and water
155
gas shift reactions are negligible Therefore this experiment proved that CO and CO2
byproducts are formed independently on each other in different pathways
The XRD patterns of the samples after propane and propylene oxidation reaction showed
that there was no phase change re-confirming the robustness of the M1 phase under
propane and propylene oxidation reaction conditions
References Chapter 5
1 Japanese Laid-Open Patent Application No 10-330343 2 L E Bogdan European Patent 1254707 A1 assigned to Rohm and Haas
Company 2002 3 4 LE Bogdan D A Bors F A Pessoa Cavalcanti M Bruce Clark A M
Gaffney S Han US Patent 7326668 B2 assigned to Rohm and Haas Company 5 V V Guliants R Bhandari B Swaminathan V K Vasudevan H H
Brongersma A Knoester A M Gaffney S Han J Phys Chem B 109 (2005) 24046-24055
6 M Baca J M M Millet Appl Catal A General 279 (2005) 67-77 7 Yu V Kolenrsquoko T Wolfram F Girgsdies W Zhang T W Hansen D Su A
Trunschke R Schloumlgl Chem Cat Comm accepted for publication 8 I H Warren DC Reid Chemistry and materials science Metallurgical and
materials transaction B Vol 13 No 4 565-570 9 D Langmuir P Chrostowksi R Chaney B Vigneault Issue Paper on the
environmental chemistry of metals US Environmental Protection Agency August 2003
10 E Asselin T M Ahmed A Alfantazi Corrosion Science 49 2 (2007) 694-710 11 M Bouroushian Electrochemistry of metal chalcogenides Monographs in
Electrochemistry (Ed F Scholz) Springer 2010 Page 65-69 12 P DeSanto DJ Buttrey RK Grasselli CG Lugmair AF Volpe BH Toby
T Vogt Z Krist 219 (2004) 152-165 13 I Griszligtede Die Partielle Oxidation von Propan zu Acrylsaumlure Bestimmung der
Reaktionskinetik und in-situ characterisierung des Katalysators unter Betriebsbedingungen Dissertation Universitaumlt Karlsruhe 2004 Universitaumltsverlag Karlsruhe ISBN 3-937300-17-1
14 J F Moulder W F Strickle P E Sobol K D Bomben Handbook of XPS spectroscopy Perkin-Elmer USA 1992
15 A Celaya Sanfiz T W Hansen D Teschner P Schnoumlrch F Girgsdies A Trunschke R Schloumlgl M H Looi S B A Hamid Journal of Physical Chemistry C 114 (2010) 1912
16 M Haumlvecker S Wrabetz J Kroumlhnert LI Csepei R Naumann dacuteAlnoncourt Yu V Kolenacuteko F Girgsdies R Schloumlgl A Trunschke J Catal submitted
17 Ch G Hill An introduction to chemical reaction engineering kinetics and reactor design John Wiley and Sons 1977 24-74
156
18 R W Missen Ch A Mims B A Saville Introduction to chemical reaction engineering and kinetics John Wiley and Sons 1999 49-55
19 E Balcells F Borgmeier I Griszligtede H G Lintz F Rosowski Appl Catal A General 266 (2004) 211
20 J M Loacutepez-Nieto B Solsona P Concepcioacuten F Ivars A Dejoz M I Vaacutezquez Catal Today 157 (2010) 291-296
21 F N Naraschewski C P Kumar A Jentys J A Lercher Appl Catal A General 391 1-2 (2011) 63-69
22 J Hermann Catal Today 2006 (112) 73-77
157
Chapter 6 Exploratory experiments
61 Introduction
In the literature many catalyst systems are reported for the selective oxidation of propane
to acrylic acid These can be classified into heteropolyacids and their salts phosphates
and molybdenum based mixed oxides [1 2] A strict delimitation between these classes
can not be made because under reaction conditions the heteropolyacids may transform
into oxides or phosphates [3] In general the performance of catalysts belonging to the
first two classes is rather poor Ai reported that an acid yield of ca 12 mol V2O5-P2O5
with a PV ratio equal to 100 while the yield decreased strongly with increasing PV
ratio
Upon incorporation of H3PMo12O40 heteropoly acid and Te in the V2O5-P2O5 the yield
could be increased The addition of SO3 barely had any effect while in presence of
H3PW12O40 Nb2O5 Sb2O3 SiO2 and B2O3 the yield decreased significantly [4 5]
The most prominent catalysts are the molybdenum and vanadium based mixed oxides
Katou et al reported the hydrothermal synthesis of orthorhombic and amorphous MoVOx
and MoVTeOx catalysts with surface areas up to 10 m2g [6] The catalytic experiments
were carried out in the narrow temperature interval between 343 and 354 degC A rather
reducing feed with the composition of C3H8O2H2ON2=651045385 vol was used
Propane conversions below 30 were reported on these catalysts at a single space
velocity of 2400 h-1 The products were acrylic acid propylene acetic acid acetone and
carbon oxides The acrylic acid selectivity was found to be around 6 for the crystalline
MoVOx catalyst In comparison to that the acrylic acid selectivity on the amorphous
catalyst was below 4 even at low propane conversion The quaternary orthorhombic
MoVTeOx oxide was found to be the best performing catalyst a selectivity of 493 was
reported at a conversion of 256 This led to the conclusion that tellurium promotes the
selective pathway towards acrylic acid The CO2 selectivity was in every case higher
than the CO selectivity On the other hand the acetic acid selectivity was also significant
above 15 However the product selectivities were compared at different conversions
for each catalyst Because of the fact that the selectivity depends on the conversion any
kind of comparison or ranking of selectivities made at different conversions might be
misleading Ueda et al addressed the question of catalytic function of each element of
158
MoVTeNbOx in the selective oxidation of propane to acrylic acid [7 8] Catalytic
experiments were carried out at different temperatures on hydrothermally prepared single
phase orthorhombic MoVOx MoVTeOx and MoVTeNbOx catalysts using a more
reducing feed (C3H8O2H2ON2=8104537 vol) than that reported by Katou et al [6]
The propane conversion was found to be very similar over all the catalysts at every
temperature below 380degC Although activation parameters were not calculated the very
similar temperature-conversion curve indicated that the activation energy indeed did not
depend on the presence and the quality of the third and fourth element Based on this fact
the authors claimed that Mo and V are the sole elements responsible for propane
activation On the other hand a rather poor selectivity (below 10) to acrylic acid was
reported for MoVOx at every temperature while the incorporation of tellurium lead to a
major increase in the selectivity to over 40 In the presence of niobium the highest
selectivity exceeded 60 indicating that both tellurium and niobium are indispensable
components of a high performing propane oxidation catalyst The positive effect of
tellurium was ascribed to its promoting effect on propylene further oxidation to acrylic
acid On the other hand the positive effect of niobium was ascribed for preventing the
acrylic acid over-oxidation One possible explanation was given by the site isolation
concept introduced by Grasselli [9] Without experimental evidence the modulation of
the redox couplings by Nb5+ in the MoVTeNbOx was highlighted as second possibility
for the beneficial effect of niobium on the catalytic performance
Guliants et al reported the surface promotion of hydrothermally synthesized
orthorhombic MoVOx catalyst [10] The tellurium antimony and niobium promoters lead
to increased activity and selectivity to acrylic acid The mixed Nb+Te and Sb+Nb
promoted catalysts showed the highest performance in accordance with the observations
on bulk mixed oxide catalysts
62 Propane oxidation reactivity on different Mo and V based catalysts
In the present study the catalytic testing in propane oxidation reaction to acrylic acid was
carried out on different ternary quaternary and quinternary Mo and V based mixed metal
oxide catalysts These are summarized in Table 621
159
In order to compare the catalytic data with literature results for the ternary and
quaternary oxides the experiments were performed under identical conditions with
respect to feed composition and contact time (C3H8O2H2ON2=651045385 vol
GHSV=2400 h-1 WF=150 gsml) with that used by Katou et al [6]
Table 621 The used catalysts and reaction conditions Catalyst preparation methods SD ndash spray drying HT ndash hydrothermal
Sample
ID
Composition
(EDX analysis)
Prep
Meth
C3H8O2H2ON2
(vol)
GHSV
(h-1
)
T
(degC)
1862 (Mo093V007)5O14 SD 36091 5000 400-
450
6142 MoV031Ox HT 651045385 2400 280-
320
8103 MoV034Ox HT 364051 9000-
42000 400
6274 MoV029P013Ox HT 651045385 2400 320-
360
6619 MoV044P005Ox HT 651045385 2400 300-
340
6683 MoV03Te003Ox HT 651045385 2400 300-
340
6059 MoV026Te010Nb022Ox HT 364051 5000-
66000
360-
400
The activities of the catalysts were found to be different under identical space velocity
and temperature Therefore the temperature was varied in 20degC steps in order to achieve
similar conversions of propane on the above named ternary and quaternary oxides In
case of 6274 the temperature was varied between 320 and 360degC while in case of 6619
and 6683 the reaction temperatures were between 300 and 340degC Among this set of
catalysts the MoVOx 6142 showed the highest activity thus the temperature was varied
between 280 and 320degC
160
Most of the catalytic studies in propane oxidation are performed under a different
condition that that reported by Katou et al [6] The typical feed composition is
C3H8O2H2ON2=364051vol and the temperature between 360 and 400degC For the
purpose of comparison the reactivity of MoVOx 8103 catalyst was tested using the
latter feed composition at 400degC In order to achieve different conversion of propane
which are comparable to those determined for the previously mentioned catalysts the
contact time was varied between 0075 and 0400 gsml (GHSV=48000 and 9000h-1)
Table 622 Comparison of the catalytic performance of MoVTeNbOx (6059) and MoVOx (8103) samples at 400degC feed composition C3H8O2H2ON2=364051 vol
6059 8103 GHSV (h
-1)
XC3H8 () SAA () XC3H8 () SAA ()
9000 381 plusmn 04 513 plusmn 13 436 plusmn 07 050 plusmn 002
24000 153 plusmn 04 392 plusmn 06 230 plusmn 05 18 plusmn 02
Upon comparing the conversions of propane under identical conditions with respect to
the feed composition temperature and space velocity it was found that MoVOx 8103 is
more active than MoVTeNbOx 6059 (Table 621) in contrast to the observation of
Ueda et al [6] On the other hand the significantly lower selectivity towards acrylic acid
of the MoVOx is in accordance with the trend reported by Ueda et al [6]
For comparison of the catalytic performance of phase-pure M1 MoVOx and Mo5O14-type
structure the (Mo093V007)5O14 oxide catalyst (1862) was also tested for propane
oxidation The (Mo093V007)5O14 catalyst was found to be rather inactive at 400degC and a
contact time of 072 gsml the conversion being only 04 and propylene selectivity of
48 At a reaction temperature of 450degC a propane conversion of 21 was achieved
while the propylene selectivity decreased to 29 Contrary to the experiment using M1
MoVOx catalysts no oxygenates were detected either in steam containing feed or in dry
feed Under every condition only propylene CO and CO2 were produced Therefore this
oxide acts only as an oxidative dehydrogenation catalyst This observation indicated that
besides the elemental composition the crystal structure has a decisive role both in
propane activation and reaction pathways
161
The Mo and V containing M1 catalyst (8103) was very active at 400degC while the
(Mo093V007)5O14 structure was much less active In contrast to the MoVOx M1 structure
the (Mo093V007)5O14 is unable to insert oxygen in the C-H bond to form oxygenates The
different reactivity of M1 MoVOx and (Mo093V007)5O14 is certainly related to the
different termination of the different bulk structures
The low propane oxidation activity of (Mo093V007)5O14 (1862) sample is in accordance
with the literature Baca et al reported a propane conversion of 08 and acrylic acid
selectivity of 6 on (Mo093V007)5O14 at 410degC On the other hand the (Mo093V097)5O14
exhibited a conversion of 26 at 410degC with 0 selectivity to acrylic acid [11]
For the comparison of the catalytic property of the catalysts the acrylic acid selectivity
was plotted versus the conversion (Figure 621) which allows a better comparison of the
performance rather than comparing selectivities at different conversions
The performances of all the ternary and quaternary catalysts were spread in the low
conversion-low selectivity quartile of the conversion-selectivity plot On the other hand
the phase pure MoVTeNbOx catalyst can be found in both the low conversion ndash high
selectivity and the high conversion ndash high selectivity quartile Therefore the rather
complex phase pure MoVTeNbOx is the best performing catalyst since the selectivity is
markedly higher than for all the other studied catalysts
The MoVOx 6142 catalyst exhibited a highest selectivity to acrylic acid of 25plusmn02
determined at a conversion of propane equal to 185plusmn20 the maximum yield being
05plusmn01 The most abundant product at this conversion was CO almost independently
on the reaction temperature (S=435plusmn08) followed by CO2 with a selectivity of
253plusmn05 A significant amount of acetic acid was also formed (SHAc=217plusmn08)
while propylene was a relatively minor product with a selectivity of 80plusmn03 The
selectivity to propylene acrylic acid and acetic acid decreased with increasing
temperature while the CO2 selectivity increased significantly with increasing reaction
temperature
The inclusion of tellurium in the MoVOx structure (6683) led to a slightly reduced
selectivity to acrylic acid compared to the pure MoVOx catalyst Similarly to the MoVOx
162
catalyst CO was the most abundant product with selectivity of ca 46 and almost
independently of the temperature
0 10 20 30 40 50 60 70 800
10
20
30
40
50
60
70
80
6619 - MoVPOx
6683 - MoVTeOx
6274 - MoVPOx
6142 - MoVOx
8103 - MoVOx
6059 - MoVTeNbOx
SAA ()
XC3H8 ()
Figure 621 Catalytic performance of different phase-pure Mo and V based oxides
The second most abundant byproduct was CO2 Its selectivity increased with the
temperature from 290plusmn07 to 360plusmn04 Acetic acid was formed in quite important
amounts (S=155plusmn16) while propylene was formed only in 68plusmn02
The inclusion of small amount of phosphorous in the MoVOx structure (6619) led to the
increase in the selectivity to acrylic acid to 47plusmn07 measured at the propane conversion
of 157plusmn35 The main product was CO its selectivity being over 40 Carbon dioxide
was the second most abundant product with selectivities above 28 The propylene
selectivity was situated between 111plusmn04 and 62plusmn04 while acetic acid between
124plusmn15 and 106plusmn07 depending on the temperature
A higher phosphorous content in the catalyst 6274 was beneficial for the increase of the
selectivity to acrylic to (obtained at 181plusmn10 propane conversion)
Among the studied ternary and quaternary catalysts this one exhibited the highest
selectivity (156plusmn03 obtained at a conversion of 181plusmn10) and yield of 33plusmn03
This yield is higher than the best value reported by Katou et al [6] Similarly to the other
163
catalysts the total oxidation products are the most abundant ones The propylene and
acetic acid selectivity was 122plusmn02 and 176plusmn01 respectively
The apparent activation parameters (activation energy Ea logarithm of the preexponential
factor lnA activation enthalpy ∆H and activation entropy ∆S) of propane and oxygen
conversion were calculated based on the linearized Arrhenius- and Eyring-Polanyi
equations In the literature the activation enthalpy and entropy is seldom considered
although these quantities also give an important insight into the activation of molecules
involved in the reaction
Figure 622 The activation parameters of the propane and oxygen conversion on the MoV(Te)(P)(Nb)Ox catalysts
The highest propane activation energy of ca 60 kJmol was observed for MoVOx
catalyst Statistically similar activation energy was determined for the phosphorous
containing catalysts However in the case of tellurium inclusion the activation energy of
propane is reduced significantly by ca 20 kJmol compared to MoVOx This observation
is in contradiction with that reported by Ueda et al namely that the presence of the
tellurium and niobium does not affect the propane activation [6-8]
The logarithm of the pre-exponential factor is also different for all the catalysts The
apparent activation energy and the pre-exponential factor of oxygen consumption differ
for the individual catalysts It is remarkable that the highest oxygen activation energy is
associated to the catalyst 6274 with the highest acrylic acid selectivity However the
6142 6274 6619 6683 60590
20
40
60
80
100 Ea C3H8 (kJmol)
lnA C3H8
Ea O2 (kJmol)
lnA O2
Ea lnA
Catalyst
Activation energy pre-exponential factor Activation enthalpy and entropy
6142 6274 6619 6683 60590
-50
-100
-150
-200
-250 ∆∆∆∆H
C3H8 (kJmol)
∆∆∆∆S C3H8 (JmolK)
∆∆∆∆H O
2 (kJmol)
∆∆∆∆S O
2 (JmolK)
∆∆ ∆∆H (kJm
ol)
∆∆ ∆∆S (J
molK)
Catalyst
164
active surface oxygen species are involved in many reaction steps including the
dehydrogenation of propane to propylene the oxidation of propylene to acrylic and acetic
acids and eventually the combustion steps Certainly the global oxygen consumption is
the sum of the amount of oxygen species consumed in all these steps
The negative activation entropy of both propane and oxygen activation suggests that
these are involved in associative steps in the formation of the transitional state More
negative activation entropy indicates a more rigid transitional state The most negative
activation entropy was observed on 6683 MoVTeOx while the least negative on 6142
MoVOx
Table 623 summarizes the catalytic performance of some selected catalysts reported in
the literature The literature search data serves as a basis for comparison of the catalytic
performance for the catalysts reported in the present work
The first and second column contains information concerning the catalyst composition
and preparation method respectively Very different preparation methods (including
slurry- hydrothermal- solid-solid reaction impregnation- and spray drying) were used
On the other hand the extent of characterization reported by the literature sources also
differs very much
For instance the elemental composition reported by Ai refers to preparative composition
[4 5] In contrast to that in the more recent studies a thorough characterization of the
catalysts (including surface and bulk sensitive analytical methods) is documented
Very different reaction conditions were used by the different authors Ai used highly
oxidizing feed (O2C3H8=40) without employing inert gas (balance gas) besides steam
[4 5] A reducing feed was used by Ueda et al Baca et al Guliants et al [7 8 10]
while Celaya Sanfiz et al worked with stoichiometric feed [12] As it is shown in Table
623 in the present work both reducing and stoichiometric feed were used
Table 623 summarizes the catalytic performance of some selected catalysts reported in
the literature The literature search data serves as a basis for comparison of the catalytic
performance for the catalysts reported in the present work
165
Table 623 Comparison of the performance of selected catalysts Composition as determined by (a) stoichiometry (b) ICP (c) EDX (d) LEIS-surface Preparation method slurry (Sl) hydrothermal (Ht)
Solid-solid (Ss) Incipient impregnation (Ii) Spray drying (Sd) (P) ndash present work Catalyst Prep
meth C3H8O2H2Oinert
(vol) GHSVWF-1τ (h-1gsml-1s)
T (degC)
XC3H8
() SAA
() YAA
() EaC3H8
(kJmol-
1) Ref
VPOa 380 281 na na 126plusmn8 VPO+H3PMo12O40
a 380 348 na na 113plusmn9 VPO+ H3PW12O40
a 370 294 na na 195 VPO+ SO3
a 380 330 na na 79plusmn11 VPO+TeO2
a 380 246 na na 109plusmn4 VPO+Nb2O5
a 360 342 na na 74 VPO+Sb2O3
a 380 332 na na 88 VPO+SiO2
a 385 171 na na 107plusmn7 VPO+B2O3
a
Sl 19762210
--9
400 236 na na 126
4
VP115Te015Oa 340 18 46 8 na
VP115Te015Nb01Oa 340 25 32 8 na
VP115Te015Zr01Oa
Sl 19762210
340 42 16 7 na
5
MoV034Ob 379 327 34 1 na
MoV044Te01Ob 380 362 466 17 na
MoV025Te011Nb012Ob
Ht 8104537 240015-
380 334 624 21 na 6
MoV023Te011Nb014Oc
(M1) Ht 380 299 52 16
58 plusmn04
MoV03Te032Nb007Oc
(M2) Ss 410 06 22 01 na
MoV033Te022Nb011Oc Sl 380 349 53 19 58plusmn18
MoV05Te022Nb011Oc Sl
6104341 2500--
400 253 46 12 648
Mo097V095O5c Ht
651045385 3300--
410 264 0 0 26plusmn1
11
MoV019Od 400 47 4 02 168plusmn18
MoV068Od 400 114 4 05 68plusmn6
MoV036Te007Od 400 111 8 09 48
MoV03Nb013Od 400 136 20 27 72plusmn12
MoV02Sb007Od 400 181 19 34 67plusmn23
MoV069Te004Nb013Od 400 102 29 30 108plusmn13
MoV031Nb014Sb002Od
Ht
MoV
O
Ii M
Ox
639447337 -125-
400 181 19 34 79plusmn18
10
MoV026Te017Nb029O 400 56 79 44 na MoV026Te017Nb029O
Ht 364051 -075 3- 400 49 73 36 na
12
MoV031Oc 300 279 17 05 59plusmn8
MoV029P013Oc 320 272 84 23 47plusmn4
MoV044P005Oc 320 233 36 08 53plusmn11
MoV03Te003Oc H
t M
oVO
Ii
EO
x
6104539 240015-
320 371 21 08 38plusmn8 MoV026Te010Nb022O
c 400 607 582 35 56plusmn3 MoV034O
c Ht
400 23 17 04 na (Mo093V007)5O14
c Sd
364051 4500 24000--
450 21 0 0 125plusmn14
(P)
166
The first and second column contains information concerning the catalyst composition
and preparation method respectively Very different preparation methods (including
slurry- hydrothermal- solid-solid reaction impregnation- and spray drying) were used
On the other hand the extent of characterization reported by the literature sources also
differs very much
For instance the elemental composition reported by Ai refers to preparative composition
[4 5] In contrast to that in the more recent studies a thorough characterization of the
catalysts (including surface and bulk sensitive analytical methods) is documented
Very different reaction conditions were used by the different authors Ai used highly
oxidizing feed (O2C3H8=40) without employing inert gas (balance gas) besides steam
[4 5] A reducing feed was used by Ueda et al Baca et al Guliants et al [7 8 10]
while Celaya Sanfiz et al worked with stoichiometric feed [12] As it is shown in Table
623 in the present work both reducing and stoichiometric feed were used
The conversion selectivity and yield were listed at the given temperature The apparent
activation energy of propane consumption was either taken from the publications or
calculated based on the reported catalytic data in the cited sources
Due to the fact that the reaction conditions used by different groups are different it is
difficult or even impossible to compare directly the catalytic data A general observation
is however that both niobium and tellurium are indispensable elements for a high
performing Mo and V based catalyst
63 Propylene oxidation reactivity on different Mo and V based catalysts
Besides the phase-pure M1 MoVTeNbOx other Mo and V based oxides were tested for
propylene oxidation These catalysts were
bull MoV03Te003Ox (6683)
bull (Mo093V007)5O14 (1862) and
bull (Mo068V023W009)5O14 (1401)
167
The results of the catalytic tests are summarized in the following
Propylene oxidation was performed on MoV03Te003Ox 6683 using the following feed
C3H6O2H2ON2=57545385 vol The catalyst was very active at a temperature
interval between 180 and 250degC conversions between 30 and 80 were measured at a
space velocity of 2400 h-1 (WF=150 gsml) (Table 631) Similarly to the experiments
performed on MoVTeNbOx 6902 (section 425) the production of maleic anhydride
was also observed
Compared to MoVTeOx and MoVTeNbOx catalysts the (Mo093V007)5O14 was found to
be a less active propylene oxidation catalyst In the 300-420degC temperature interval 10-
50 conversion was observed for a space velocity of 5000 h-1 (Figure 631)
When steam was not introduced in the feed the main product was found to be acrolein
Interestingly maleic anhydryde was formed in a quite high amount at a reaction
temperature of 350degC at the expense of acrolein formation In this case the quantitation
of maleic anhydride was possible because in absence of the co-fed steam no hydrolysis
occurred It should be noted however that the peak shape of maleic anhydride was
highly asymmetric but quantifiable Therefore the carbon balance approached
satisfyingly 100 The acrolein selectivity peaked at ca 70 at a reaction temperature of
400degC The acrylic acid selectivity was below 10 while acetic acid and acetone were
produced in traces
In presence of 40 vol steam in the feed the propylene conversion and acrylic acid
selectivity was slightly increased The positive effect of steam on the productivity was in
accordance with the observation of steam effect on propane and propylene oxidation over
the phase pure M1 MoVTeNbOx catalyst (6902)
Similarly to the experiment carried out on catalyst 6902 acetone was the main product
at low temperatures when steam containing feed was applied The acetone selectivity
dropped according to a sigmoidal curve with increasing temperature
The acrolein selectivity increased and reached a plateau at 70 in the temperature
interval between 400 and 420degC The CO and CO2 production was not influenced very
significantly by the presence of steam On the other hand the maleic acid was also
produced but its quantification was not possible because of the problems related to
hydrolysis However because the mass balance was as high as 95 it can be concluded
168
that in presence of steam the maleic acid production was suppressed compared to the
experiment carried out in absence of steam
300 350 400 450
0
20
40
60
80
100
Conversion Selectivity ()
T (degC)
X C3H6 XO2 S AA S CO2 S Ace S Acr S HAc S MAnh S CO C-bal
250 300 350 400 450
0
20
40
60
80
100 X C3H6 X O2 S AA S CO2 S Ace S Acr S HAc S CO C-balC
onversion Selectivity ()
T (degC)
C3H6O2H2ON2=510085 vol
WHSV=5000 h-1 WF=072 gsml
C3H6O2H2ON2=5104045 vol
WHSV=5000 h-1 WF=072 gsml
Figure 631 Propylene oxidation over (Mo093V007)5O14 catalyst (1862)
The reactivity of MoVTeNbOx MoVTeOx and (Mo093V007)5O14 in propylene oxidation
reaction is summarized in the Table 631
The reactivity ranking is the following (Mo093V007)5O14 lt (Mo068V023W009)5O14 lt
MoV03Te003Ox ~MoVTeNbOx
As it can be seen there is a very large difference of about one order of magnitude
between the apparent activation energy of propylene activation on Mo5O14 structures and
phase pure M1 Mo and V based oxide catalysts
The co-fed steam induced a significant decrease of about 50 kJmol in the apparent
activation energy of propylene over the (Mo093V007)5O14 catalyst In presence of steam
the activation energy was similar on (Mo093V007)5O14 and (Mo068V023W009)5O14
catalysts
As it can be seen there is a very large difference of about one order of magnitude
between the apparent activation energy of propylene activation on Mo5O14 structures and
phase pure M1 Mo and V based oxide catalysts
169
Table 631 Propylene oxidation reactivity on different catalysts
Catalyst Feed
GHSV
T
(degC)
XC3H6
()
SAA
()
YAA
()
rC3H6
(micromicromicromicromolgs)
EA
(kJmol)
510085
5000 400 344plusmn03 44plusmn01 15plusmn01 098 140plusmn3
(Mo093V007)5O14
1862 5104045
5000 400 416plusmn03 83plusmn04 35plusmn02 118 93plusmn2
(Mo068V023W009)5O14
1401
510085
5000 400 592plusmn03 83plusmn01 49plusmn01 168 92plusmn2
MoV03Te003Ox
6683
57545385
2400 220 727plusmn03 26plusmn3 19plusmn2 099 22plusmn2
MoVTeNbOx
6902
364051
20000 400 947plusmn02 63plusmn1 60plusmn1 583 15plusmn1
The co-fed steam induced a significant decrease of about 50 kJmol in the apparent
activation energy of propylene over the (Mo093V007)5O14 catalyst In presence of steam
the activation energy was similar on (Mo093V007)5O14 and (Mo068V023W009)5O14
catalysts
Rather low apparent activation energies (22 and 15 kJmol) were found for the
MoV03Te003Ox and the MoVTeNbOx catalysts
64 Exploratory reaction pathway analysis of propane oxidation on phase-pure M1
catalyst
The kinetic modeling of a complex reaction involves two main steps The first step is the
discrimination between possible networks of reaction pathway
The second step constitutes the discrimination between rate expressions and fitting the
kinetic equations to the experimental data [13-15]
The proposed pathways in the literature state that the oxidative dehydrogenation of
propane is the first step The formed propylene may undergo oxidation to acrolein and
then to acrylic acid Parallel to these steps in presence of steam propylene is hydrated to
acetone followed by oxidation to acetic acid [4 5 11 16 17] Some proposed pathways
170
include the oxidation of propane to 1-propanol and 2-propanol in the scheme in
competition with the propane oxidative dehydrogenation step [1 2 16 17] However
these compounds are seldom reported to be detectable reaction products at high
temperature (350-400degC) Additionally the propylene formation is more favored
thermodynamically than the formation of 1-propanol and 2-propanol
The common feature of all the proposed pathways is that the CO and CO2 are shown to
be produced by total oxidation of acrylic acid and acetic acid However the propylene
and other undetectable intermediates (acrolein acetone etc) are reactive compounds
which are prone to undergo total combustion reaction pathways Also in the literature
there is frequently no discrimination between CO and CO2 both oxidation products being
designated as COx In the model proposed by Grisstede the CO CO2 and acetic acid is
merged under the term ldquobyproductsrdquo [18-20]
Due to the above described inconsistencies of the proposed models in this section the
identification of reaction pathways and the kinetic modeling based on the reaction
pathways is presented
Among the numerous methods for reaction pathway discrimination described in the
literature the delplot technique was claimed to be one of the most efficient and reliable
This is because its application is not limited to primary products or by reaction orders
[15] This technique is based on the relationships between the conversion (X) and yield
(Y) respectively The mathematical derivation of the formulas corresponding to the
YXn=f(X) n-th order delplots is presented in detail in the cited source [15]
Historically the plot of product selectivity in function of the conversion is the most
widely applied which is equivalent with a first rank delplot This plot is a measure of
reaction economics because it directly provides information concerning the maximum
productivity In addition to this the discrimination of primary products from non-primary
products is possible based on this plot The extrapolation of the curves corresponding to
the products towards zero conversion gives an intercept with the selectivity axis If the
intercept is a finite number the respective product is a primary or first rank product The
products with a zero intercept are non-primary or higher rank products
To discriminate between secondary tertiary etc rank products higher rank delplots are
used The second rank delplot represents the yield divided by the square of the
171
conversion in function of the conversion (YX2=f(X)) A diverging curve on this plot is
characteristic of a primary product A finite intercept indicates secondary product while
the curves with zero intercept correspond to product rank higher than two
On the third rank delplot the YX3 ratio is represented in function of the conversion (X)
A diverging curve on the third rank delplot indicates product with a ranking order lower
than two A curve with finite intercept corresponds to a third rank product while zero
intercept indicates a product with higher rank This method can be continued until all the
product ranks are sorted out
The delplot technique is applied to catalytic data determined for the propane oxidation
over the phase pure MoVTeNbOx catalyst in order to sort out the reaction product ranks
In the paper published by Bhore et al the YXn ratio is plotted in function of the
conversion where n is the rank of the delplot Because the yield is the product of
conversion and selectivity the SXn-1 quantity is equivalent with the YXn quantity
Therefore here the SXn-1=f(X) plots are considered in the following
Figure 641 displays the delplots corresponding to the experiment carried out at 400degC
using a feed composition of C3H8O2H2ON2=364051 vol
On the first rank delplot the curve corresponding to propylene has a finite intercept which
is close to 90 indicating a first rank product The acrylic acid and carbon monoxide
show an intercept statistically around 3 This may imply that both are second rank
products Carbon dioxide and acetic acid show statistically zero intercept which indicates
that these are higher rank products
On the second rank delplot the propylene curve is diverging which supports that this is a
primary product On the other hand acrylic acid carbon monoxide carbon dioxide and
acetic acid show finite intercept indicating that all these are secondary products
On the third and fourth rank delplots the curves corresponding to propylene and acrylic
acid are diverging Upon magnification it becomes visible that the curves of acetic acid
carbon monoxide and dioxide are diverging as well indicating that their rank is below
three and four Due to the fact that there are no curves with zero intercept on the third and
fourth rank delplots all product ranks are discriminated by the first and second rank
plots
172
0 20 40 60 80 100
0
20
40
60
80
100
AA
CO2
C3H
6
HAc
CO
S ()
X C3H8
()
0 20 40 60 80 100
0
5
10
15
20
25
AA
CO2
C3H
6
HAc
CO
SX
C3H
8
X C3H8
()
1st rank delplot 2nd rank delplot
0 20 40 60 80 100
0
1
2
3
4 AA
CO2
C3H6
HAc
CO
SX2
X C3H8
()
0 20 40 60 80 100
00
02
04
06
08
10 AA
CO2
C3H
6
HAc
COSX3
X C3H8
()
3rd rank delplot 4th rank delplot
Figure 641 Delplots for propane oxidation using the feed C3H8O2H2ON2=364051vol at T=400degC Catalyst ID 6059
In contrast to the reaction pathways proposed in the literature the total oxidation products
are not formed only in the combustion steps of acrylic acid and acetic acid because their
main rank is two However due to the limitation of the delplot technique ndash that it uses
extrapolation of the curves toward zero educt conversion ndash it is not possible to
discriminate whether a product is purely a second rank product or it has a multiple rank
of two and three The third rank delplot diverges in case of a product which has a rank of
two and three suggesting only second rank Consequently this method is not applicable
to discriminate products with superimposed ranks (Appendix 61)
173
For this reason the total oxidation products should not be considered to be only second
rank products as the delplots indicate Due to the fact that acrylic acid as a mainly second
rank product is also prone to combustion the resulting CO and CO2 are third rank
products
Table 641 Product ranks at different temperatures For multiple rank products the main ranks are highlighted by bold letter P-primary S-secondary
Product rank T (degC)
C3H6 AA HAc CO CO2
360 P P S S P S S 380 P P S S P S S 400 P P S S P S S
The product ranks at different temperatures are the same as Table 641 demonstrates
This indicates that the reaction network is the same in the temperature interval between
360 and 400degC
The Figure 642 displays the delplots corresponding to the experiment carried out in
absence of steam in the feed at 400degC
On the first rank delplot the propylene appears to be a first rank product However in
contrast to the experiment carried out in presence of steam the acrylic acid has a
statistically zero intercept indicating a higher rank than one Both the CO and CO2 show
low finite intercepts suggesting that they are minor first rank products The curve
corresponding to acetic acid has a zero intercept
On the second rank delplot the propylene curve is diverging The curves corresponding to
acrylic acid acetic acid CO and CO2 show finite intercepts Therefore all these products
are second rank products
The higher rank delplots are diverging similarly to the experiment carried out in presence
of steam
174
0 20 40 60 80 100
0
20
40
60
80
100
S ()
XC3H8 ()
AA
CO2
C3H
6
HAc
CO
0 20 40 60 80 100
0
2
4
6
8
AA
CO2
C3H
6
HAc
CO
SX
XC3H8 ()
1st rank delplot 2nd rank delplot
0 20 40 60 80 100
00
02
04
06
08
10
AA
CO2
C3H
6
HAc
CO
SX2
X C3H8 ()
0 20 40 60 80 100
000
002
004
006
008
AA
CO2
C3H
6
HAc
CO
SX3
XC3H8 ()
3rd rank delplot 4th rank delplot
Figure 642 Delplots for propane oxidation using the feed C3H8O2H2ON2=36091vol at T=400degC Catalyst ID 6059
The product ranks for the steam content variation experiment are summarized in Table
642 Between 10 and 40 vol steam content the ranks are the same suggesting the
same reaction pathway However in absence of steam the acrylic acid is purely a second
rank product while carbon dioxide has a minor primary rank as well The difference
between the product ranks indicates that the reaction pathways are different in presence
and in absence of steam
175
Table 642 Product ranks at different steam contents For multiple rank products the main ranks are highlighted by bold letter P-primary S-secondary rank
Product rank H2O content
(vol) C3H6 AA HAc CO CO2
0 P S S P S P S 10 P P S S P S S 20 P P S S P S S 30 P P S S P S S 40 P P S S P S S
Taking into account the reaction product ranks the main reaction pathway was found to
be propanerarrpropylenerarracrylic acid Due to the fact that acetic acid is a secondary
product it is formed in a parallel step with respect to acrylic acid Separated CO and CO2
production pathways were included on the main pathways (Figure 4219 and 4220) As
the CO oxidation and water gas shift activity of the catalyst is found to be negligible (see
subchapter 427 and 433) the inclusion of these steps was omitted in the first approach
of kinetic modeling
Alternative reaction models including the following steps
bull coupled production of CO and CO2 from propylene acrylic acid and acetic
acid
bull coupled production of acetic acid and CO
bull coupled production of acetic acid and CO2
bull production of acrylic acid in a single step from propane and in a secondary
step from propylene (cf minor first rank component of acrylic acid in
presence of steam in the feed)
bull simultaneous production of acetic acid from propylene and acrylic acid
followed by combustion to CO
bull simultaneous production of acetic acid from propylene and acrylic acid
followed by slow combustion to CO2
were disregarded because the simulated concentration profiles did not match up with the
experimental profiles
176
The kinetic modeling was performed in Berkeley Madonna software First order rate
equations were set up with respect to each compound The first order kinetics with
respect to propane was experimentally verified (subchapter 423)
For the integration of the differential equations system corresponding to the reaction
models the fourth order Runge-Kutta method numerical method (RK4) was used The
calculated dimensionless concentration profiles of the products and educt were compared
to the experimental dimensionless concentration profiles The dimensionless
concentration of any compound i was calculated as the ratio between the molar
concentration of i species and the initial molar concentration of propane
)146 ( 083
Equationc
cy
HC
i
i =
The best correlation of the simulated concentration profiles with the experimental data
was found to be in the case of the model shown in Figure 643 This is highlighted as
model 1 This model was found to be applicable for the experiments carried out in the
temperature interval between 360 and 400degC and 40 vol steam content and also for the
experiments using 10 20 30 and 40 vol steam in the feed at a reaction temperature of
400degC
Figure 643 Reaction model 1 for propane oxidation
CH2=CH-COOH C3H8 C3H6
CH3COOH+CO2 CO2
CO CO CO
k1 k2
k3
k4
k5
k6
k7
177
The set of differential equations corresponding to model 1 are shown below
)646 (
)546 (
)446 ( )(
)346 ( )(
)246 ( )(
6634
75633
65632
6343283163
838183
2
83
Equationykykdt
dy
Equationykykykdt
dy
Equationykkykdt
dy
Equationykkkykdt
dy
Equationykkdt
dy
AAHC
CO
HCAAHCCO
AAHCAA
HCHC
HC
HC
HC
sdot+sdot=
sdot+sdot+sdot=
sdot+minussdot=
sdot++minussdot=
sdot+=minus
On the other hand for the experiment carried out in dry feed delplot technique indicated
that CO2 is also a minor primary product besides propylene and CO Therefore in the
model valid for the steam free conditions is shown in the Figure 644
Figure 644 The reaction model 2
Including in the reaction model the total oxidation step of propane to carbon dioxide
leads to the following set of differential equations
CH2=CH-COOH C3H8 C3H6
CH3COOH+CO2 CO2
CO CO CO
k1 k3
k4
k5
k5
k6
k2
CO2
k8
178
)1146 (
)1046 (
)946 ( )(
)846 ( )(
)746 ( )(
8386634
75633
65632
6343283163
8387183
2
83
Equationykykykdt
dy
Equationykykykdt
dy
Equationykkykdt
dy
Equationykkkykdt
dy
Equationykkkdt
dy
HCAAHC
CO
HCAAHCCO
AAHCAA
HCHC
HC
HC
HC
sdot+sdot+sdot=
sdot+sdot+sdot=
sdot+minussdot=
sdot++minussdot=
sdot++=minus
The implementation in the Berkeley Madonna software of the differential equations corresponding to Model 1 and Model 2 is shown in Appendix 62
65 Exploratory kinetic modeling on propane oxidation on phase-pure MoVTeNbOx
catalyst
651 The effect of temperature
The kinetic modeling based on reaction model 1 (section 64) lead to the rate constants
which are summarized in the Table 651 The model one contains seven reaction steps as
follows propane is oxidatively dehydrogenated to propylene and oxidized in parallel to
carbon monoxide The formed propylene undergoes oxidation to acrylic acid carbon
monoxide and in a coupled step to acetic acid and carbon dioxide Finally the acrylic
acid undergoes total oxidation as well to carbon monoxide and dioxide
Propane undergoes mainly oxidative dehydrogenation to propylene Oxidation of propane
to carbon monoxide also takes place but the rate constant (k7) of this step is very low in
the order of magnitude of 10-6 mlgs The low rate constant of propane total combustion
is in accordance with the low CO selectivity determined at low propane conversion On
the other hand the low value of the intercept on the first rank delplot also suggests low
total oxidation activity towards carbon monoxide
Propylene is a highly reactive intermediate as demonstrated by the high values of rate
constants of oxidation to acrylic acid (k2) acetic acid and total oxidation products (k3 and
k4) The ratio between the propylene consumption rate constants (k2+k3+k4) and the
179
propylene formation rate constant is 198 210 and 178 respectively at 360 380 and
400degC These are in good accordance with the values reported in the literature
Loacutepez-Nieto et al reported a value of ca 24 on a predominantly M1 phase containing
MoV024Te024Nb013Ox catalyst [21]
Naraschewski et al reported a value of 25 for MoVTeNbOx catalysts with ten different
elemental- and phase compositions However the fitting was made in case of one of the
catalyst the value for each catalyst was not quantified [22]
Grisstede reported a propane consumption rate constant of 084 gsml and a global
consumption rate of propylene of 204 gsml on a MoV033Te025Nb017Ox catalyst at
400degC The ratio of propylene consumption and formation rate constant is therefore
204084=243 [18-20]
Acrylic acid is also prone to further oxidation mainly to carbon dioxide (k6) and in very
minor proportions to carbon monoxide (k5)
It is remarkable that the highest rate constant in the reaction model corresponds to the
selective oxidation step of propylene to acrylic acid
Table 651 The rate constants corresponding to the steps of the reaction model 1
T (degC) k1
(mlgs)
k2
(mlgs)
k3
(mlgs)
k4
(mlgs)
k5
(mlgs)
k6
(mlgs)
k7
(mlgs)
360 0519 7443 2401 0451 501 10-4 0684 597 10-7
380 0650 8806 4211 0642 817 10-4 0912 120 10-6
400 0871 9244 5195 1093 162 10-3 1089 216 10-6
The activation parameters determined from the above data based on the Arrhenius-plot
are shown in Table 422
Table 652 The activation energy and preexponential factor of the individual reaction steps
Reaction step 1 2 3 4 5 6 7
Ea (kJmol) 46plusmn4 19plusmn6 69plusmn17 78plusmn10 104plusmn12 41plusmn5 114plusmn4
lnA 80plusmn08 57plusmn11 139plusmn31 140plusmn19 121plusmn22 75plusmn09 73plusmn07
180
The activation energy of propane to propylene transformation is in good agreement with
the value of 53plusmn8 kJmol (section 424) determined from the temperature dependence of
propane conversion
652 The effect of steam
Reaction kinetic modeling was performed using model 1 for the concentration profiles
determined using steam containing feed Due to the fact that in absence of steam carbon
dioxide was also a primary product an additional total oxidation pathway involving
propane was taken into account (model 2) The reaction steps of the models are
propanerarrpropylenerarracrylic acid as main pathway to which k1 and k2 rate constants are
associated The unselective pathway involving propane is oxidation to CO (in steam
containing feed characterized by the rate constant k7) and CO2 (in dry feed characterized
by rate constant k8) One of the unselective pathways starting from propylene
intermediate gives carbon monoxide (k3) while the other yields acetic acid and carbon
dioxide (k4) The two unselective pathways involving acrylic acid are the total oxidation
to CO (k5) and CO2 (k6) The reaction models are described in more detail in subchapter
429
Table 653 The rate constants of the individual steps as determined based on model 1 and model 2
H2O
content
(vol)
0 10 20 30 40
k1 (mlgs) 0431 0650 0711 0821 0870
k2 (mlgs) 7772 7195 8395 9394 9244
k3 (mlgs) 0736 3896 4595 4395 5194
k4 (mlgs) 0675 1490 1283 1589 1093
k5 (mlgs) 0668 00074 000144 00076 000162
k6 (mlgs) 0538 0935 1037 0962 1089
k7 (mlgs) 00241 849middot10-6 334middot10-6 288middot10-6 316middot10-6
k8 (mlgs) 00057 - - - -
181
The rate constants obtained from the kinetic modeling using reaction model 1 for the
steam containing feed and reaction model 2 for the steam free feed are compiled in Table
653
In accordance with the catalytic data shown on Figure 425 the propane consumption
rate constant (k1) increases when steam is added to the feed and it levels off above the
concentration of 20 vol Addition of steam increases also the rate constant of propylene
selective oxidation to acrylic acid (k2) The same trends were reported by Grisstede [18
19]
In presence of steam the rate constants of acetic acid and total oxidation product
formation from propylene intermediate are also increased dramatically (k3 and k4)
The increasing steam content may promote the propylene hydration to isopropanol [23
26] Further oxidation of isopropanol gives acetone and finally acetic acid and total
oxidation products However neither the isopropanol nor acetone was detected in the
reaction mixture suggesting that these products are further oxidized rapidly without
desorption
In the presence of steam the oxidation of acrylic acid to carbon dioxide is increased
(reaction step 6) however the total oxidation of propane to carbon monoxide- and
dioxide is very significantly suppressed (reaction steps 7 and 8)
Some literature source assigns the positive effect of steam on the catalytic performance to
the better heat transfer properties of the steam containing feed [27] Due to the fact that
the propane oxidation reaction is a rather exothermic reaction the real temperature of the
active site might be higher than the measured (macroscopic) temperature of the catalytic
bed Zheng et al [27) 191-194] speculated that the steam containing feed more efficiently
removes the reaction heat preventing overheating of the active sites and therefore total
combustion is prevented However according to the calculation of Grisstede the
maximum temperature increase above the setpoint temperature due to reaction heat is 2degC
[19]
The heat capacity and heat conductivity of the feed indeed decreases linearly with the
decreasing steam content (Appendix 63) Nevertheless the propane conversion and
acrylic acid selectivity is not influenced significantly in the 20-40 vol steam content
182
interval while both catalytic properties are decreasing below 20 vol steam
concentration If in absence of steam the reaction heat would not be removed efficiently
and the catalyst surface would be overheated the propane conversion would not drop
(Figure 423) but it would increase below 20 vol steam content (Appendix 63)
Therefore it can be excluded that the only effect of steam is that to improve the thermal
properties of the feed with respect to heat transfer
References Chapter 6
1 M M Lin Appl Catal A 207 (2001) 1-16 2 E K Novakova J C Vedrine Propane selective oxidation to propene and
oxygenates on metal oxides in Metal Oxides - Chemistry and applications JGL Fierro (Ed) 2006 CRC Press pp 414-461
3 A Trunschke Propane selective oxidation to acrylic acid in Nanostructured Catalysts Selective oxidation reactions Ch Hess R Schloumlgl (Eds) RCS Cambridge in press
4 M Ai Catal Today 13 (1992) 679-684 5 M Ai J Catal 101 (1986) 389-395 6 T Katou D Vitry W Ueda Catal Today 91-92 (2004) 237-240 7 W Ueda D Vitry T Katou Catal Today 96 (2004) 235-240 8 D Vitry Y Morikawa J L Dubois W Ueda Appl Catal A 251 (2003) 411-
424 9 R K Grasselli Top Catal 15 (2001) 5 10 V V Guliants R B Bhandari B Swaminathan V K Vasudevan H H
Brongersma A Knoester A M Gaffney S Han J Phys Chem B 109 (2005) 24046-24055
11 M Baca A Pigamo J L Dubois J M M Millet Top Catal 23 (2003) 39-46 12 A Celaya Sanfiz T W Hansen D Teschner P Schnoumlrch F Girgsdies A
Trunschke R Schloumlgl M H Looi S B A Hamid J Phys Chem C 114 (2010) 1912-1921
13 J R Kittrell Adv in Chem Eng 8 (1970) 97-183 14 P G Ashmore A Jones Reaction Kinetics RSC Specialist Periodical Reports 1
(1975) 291-308 15 N A Bhore M T Klein K B Bishoff Ind Eng Chem Res 29 (1990) 313-
316 16 M Lin T B Desai F W Kaiser P D Klugherz Catal Today 61 (2000) 223-
229 17 R Fushimi S O Shekhtman A Gaffney S Han G Yablonsky J T Gleaves
Ind Eng Chem Res 44 (2005) 6310-6319 18 E Balcells F Borgmeier I Grisstede H-G Lintz Catal Lett 87 (2003) 195 19 I Grisstede Die Partielle Oxidation von Propan zu Acrylsaumlure Bestimmung der
Reaktionskinetik und in-situ characterisierung des Katalysators unter
183
Betriebsbedingungen Dissertation Universitaumlt Karlsruhe 2004 Universitaumltsverlag Karlsruhe ISBN 3-937300-17-1
20 E Balcells F Borgmeier I Grisstede H-G Lintz F Rosowski Appl Catal A General 266 (2004) 211
21 J M Loacutepez-Nieto B Solsona P Concepcioacuten F Ivars A Dejoz M I Vaacutezquez Catal Today 157 (2010) 291-296
22 F N Naraschewski C P Kumar A Jentys J A Lercher Appl Catal A General 391 1-2 (2011) 63-69
23 Y Moro-oka Appl Catal A General 181 (1999) 323-329 24 L Luo PhD thesis California Institute of Technology Pasadena California 2001 25 J C Veacutedrine E K Novakova E G Derouane Catal Today 81 (2003) 26 247-262 H-G Lintz S P Muumlller Applied Catal A General 357 (2009) 178-
183 27 W Zheng Zh Yu P Zhang Y Zhang H Fu X Zhang Q Sun X Hu J
Natural Gas Chemistry 17 (2008) 191-194
184
General Conclusions and Outlook
The present work was centered on the systematic kinetic study of the selective oxidation
of propane to acrylic acid using a well defined mixed oxide catalyst
A well characterized phase-pure M1 MoVTeNbOx catalyst was used for the studies
which was synthesized reproducibly on the multi-gram scale
The objectives were to
bull Study the bulk structural stability of the catalyst under the reaction conditions
whereby the kinetic experiments are carried out
bull Study the effect of the reaction variables (temperature steam content redox
potential) on the catalytic performance and the kinetics of the propane selective
oxidation reaction
bull Study the catalytic oxidation propylene acrolein and carbon monoxide under
identical conditions corresponding to the propane oxidation in order to determine
the relative reactivity and product distributions
bull Study the effect of stage-wise addition of oxidizing gases (oxygen nitrous oxide)
in order to verify whether the multi-tubular reactor arrangement is suitable to
increase the catalytic performance compared to the conventional single-tube fixed
bed reactor
bull Study the addition of propylene carbon monoxide and carbon dioxide in order to
gain more information about the reaction pathways and identify whether these
compounds adsorb competitively on the active sites of the catalyst with propane
or other intermediates
bull Study the effect of post synthesis treatment employing different solutions (neutral
acidic basic complexing oxidizing and reducing) on the bulk structure
surfacebulk composition and catalytic performance of the phase-pure M1
MoVTeNbOx catalyst
The knowledge of the stability is an absolute criterion for the proper catalytic kinetic and
structure-relationship studies and mechanistic understanding of the reaction The
structural stability was addressed in a long term in-situ XRD experiment The feed
185
composition was varied in such a way that the conditions covered all the relevant ones for
catalytic and kinetic experiments (ie steam containing and steam free mixture net
oxidizing stoichiometric and net reducing) The phase purity of the used catalyst is not
affected under any of the conditions The Rietveld refinement revealed that the lattice
constants are not affected by the reaction conditions ranging from net oxidizing to net
reducing feed irrespective of the steam content When the catalyst was exposed to
strongly reducing conditions (3 vol propane in nitrogen) for long time (24 hours) the
lattice constants changed but no new phase could be detected The STEM analysis of the
sample after in-situ reaction showed pitting-like holes on the particles The voids and
their sizes were statistically distributed which suggests that the recrystallization which
occurred upon exposing the catalyst to extreme reducing conditions was controlled by
diffusion as no reaction front could be observed The EDX analysis performed
complementary to the STEM imaging revealed tellurium and oxygen depletion The
results show that the catalyst bulk structure is stable and homogeneous under reaction
conditions unless it is exposed to extremely strong reducing conditions for long time
Therefore the reactivity is detemined by the surface properties The exceptional bulk
structural stability permitted the kinetic study of the reaction variables
The effect of reaction variables was studied in a conventional fixed bed reactor The
detectable products were propylene acrylic acid acetic acid CO and CO2 The
temperature was varied between 360 and 400degC in 20degC steps The highest acrylic acid
productivity was observed at 400degC The steam content was varied between 40 and 0
vol in 10 vol steps A decrease of the propane conversion and acrylic acid selectivity
was observed below 20 vol steam content Stable operation (ie no deactivation) was
observed in steam free feed Upon reintroducing the steam in the feed the same catalytic
performance was attained as before exposing the catalyst to dry feed This shows that the
change of the catalytic performance with the steam content is fully reversible
The redox potential variation covered reducing stoichiometric and oxidizing conditions
(up to 5-fold oxygen excess) Under oxidizing conditions the same conversion and
selectivity was observed as in stoichiometric feed while under reducing condition the
conversion and selectivity to acrylic acid was slightly lower Cycling experiments
186
showed reversibility of the catalytic performance upon exposing the catalyst to net
reducing conditions However the stady state was restored slower (ca 8 hours time on
stream) compared to the the steam content variation variation experiment whereby the
steady state operation was achieved within minutes
The catalytic oxidation of other substrates (propylene acrolein and CO) was performed
in order to gain more insight into reactivity of these intermediates and the reaction
pathways they might be involved in
The propylene was found to be ca 7 times more reactive than propane at 400degC and it
produced mainly acrylic acid It was notable that acetone was also produced in significant
amounts while this compound was not detected at all under propane oxidation
conditions even though propylene is a reaction intermediate
The acrolein was found to be 94 times more reactive compared to propane at 400degC The
reaction products were acrylic acid (with a yield up to 89) acetic acid and carbon
oxides
The CO oxidation performed under stoichiometric and oxidizing conditions in dry and
steam-containing feed revealed a very low activity the highest conversion being below
1 at a space velocity of 3000h-1 at 400degC Additionally the water gas shift activity was
found to be even lower compared to the CO oxidation activity The CO oxidation and
water gas shift activity was 80 to 100 times lower compared to the propane oxidation
activity These results suggested that under propane oxidation conditions (400degC GHSV
between 4500 and 66000 h-1) the formed CO2 is not formed via CO oxidation or water
gas shift reaction Given this fact the formation of CO and CO2 during the propane
oxidation reaction occurs in two different pathways that are independent on each other
which may suggest the existence of two different active sites whereby combustion
pathways occur Based on this finding the reaction networks proposed in the literature
according to which the total oxidation products are merged together as COX=CO+CO2
may be improved Furthermore the CO oxidation activity may be used as a proxy for the
abundance of the electrophilic oxygen species on the surface The low CO oxidation
activity suggested low abundance of electrophilic oxygen which activates electron rich
centers (such as C=C bond) of the molecule and lead to unselective pathways in
nucleophilic oxidation reactions such as propane oxidation to acrylic acid
187
The stage-wise addition of oxygen lead to an improvement of the acrylic acid yield by
5 when compared to the catalytic data obtained in the conventional single-tube reactor
Upon dosing O2 in the first reactor tube and N2O in the second reactor tube of the two-
stage setup it was observed that N2O is not consumed at all even if the conditions were
chosen in such a way that the oxygen was consumed completely This suggests that the
phase-pure M1 MoVTeNbOx is not reoxidized by N2O
Upon addition of propylene in the second reactor tube revealed a slight competition of
propane and propylene on the active sites or for the available oxygen active species all
the added propylene was oxidized to acrylic acid acetic acid CO and CO2 It is notable
that in contrast to the propylene oxidation experiments no acetone formation was
observed
Neither the CO nor the CO2 influenced the product distribution of propane oxidation
reaction This suggested that none of these gases were competitively adsorbed on the
active sites with the educt or intermediates The added CO was not oxidized to CO2
which confirmed the negligible activity observed for the separate CO oxidation
experiments
In a series of experiments carried out separately from the above described ones the
phase-pure M1 MoVTeNbOx was subjected to treatment with solutions os different
nature (neutral acidic basic complexing oxidizing and reducing) at room temperature
The bulk structure was not affected by any of these treatments as probed by the XRD
measurement The bulk composition varied only marginally as probed by EDX while
the morphology and the surface composition changed more significantly upon the
chemical treatment The samples treated by neutral acidic basic complexing and
reducing solutions exhibited similar catalytic properties in propane and propylene
oxidation with the original untreated sample However the treatment by an oxidizing
solution led to a dramatic decrease in the activity and the selectivity to acrylic acid in the
propane oxidation reaction
188
The findings of the above summarized experiments on the well defined structurally
exceptionally stable catalyst suggest that the catalyst surface responds dynamically to the
changes in the chemical potential of the feed mixture under real reaction conditions The
dynamics is reflected in the changes of the reactivity This study may contribute to the
better understanding of the kinetics and the mechanism of the propane selective oxidation
reaction
189
Appendices
Appendix 51 Reaction networks of propane oxidation over the modified catalysts
To find out the reaction pathways on modified catalysts the delplot technique was applied as it was described in the section 64 The delplots corresponding to the catalytic measurements with H2O- NaBrO3 and N2H4- treated samples are presented below The H2O-treated sample behaves similarly to the parent sample As it is shown on the Figure A511 the first rank delplot gives a fairly high intercept for propylene and acrylic acid (35 and 65 respectively) indicating that these are primary products Since the extrapolation is made over a large interval of conversion the rank of acrylic acid is uncertain
First rank delplot Second rank delplot
0 10 20 30 40 50 60 70 80 90 1000
20
40
60
80
100
S ()
X C3H8 ()
AA CO2 C3H6 HAc CO
0 10 20 30 40 50 60 70 80 90 100
00
05
10
15
20
25
30 AA CO2 C3H6 HAc CO
SX
XC3H8 ()
Third rank delplot Fourth rank delplot
0 10 20 30 40 50 60 70 80 90 100
000
002
004
006
008
010
012
SX2
X C3H8 ()
AA CO2 C3H6 HAc CO
0 10 20 30 40 50 60 70 80 90 100
0000
0001
0002
0003
0004
0005
0006
SX3
X C3H8 ()
AA CO2 C3H6 HAc CO
Figure A511 The delplots corresponding to the propane oxidation using the H2O modified sample
(7797) Feed composition C3H8O2H2ON2=364051 vol T=400degC Extrapolation over the differential operation is suggested Usually the conversion-selectivity curve corresponding to acrylic acid goes through a maximum The increasing
190
segment of such a curve lies in the low conversion interval The intercepts corresponding to other products (CO CO2 and acetic acid) are low statistically close to zero on the first rank delplot suggesting that these are not primary products On the second rank delplot the curves of propylene and acrylic acid are diverging which indicate that the rank of these are primary products The divergent curves on the third and fourth rank delplots indicate that all the product ranks are less than three and four The total oxidation products and acetic acid have a finite intercept suggesting that these are secondary products The bromate treated sample (7800) was less active than the other samples at any space velocity The lowest conversions were in the differential operation mode On the first rank delplot finite intercepts were observed for propylene acrylic acid CO and CO2 indicating that all of these are first rank products On the second rank delplot the propylene and acrylic acid curves are diverging strongly (Figure A512)
First rank delplot Second rank delplot
0 10 20 30 40 500
20
40
60
80
100 AA CO
2
C3H
6
HAc CO
S ()
XC3H8 ()
0 10 20 30 40 50
0
10
20
30
40
50 AA CO2 C3H6 HAc CO
SX
XC3H8 ()
Third rank delplot Fourth rank delplot
0 10 20 30 40 50
0
3
6
9
12
15
SX2
X C3H8 ()
AA CO2 C3H6 HAc CO
0 10 20 30 40 50
0
2
4
6
8
10
SX3
X C3H8 ()
AA CO2 C3H6 HAc CO
Figure A512 The delplots corresponding to the propane oxidation using the NaBrO3 modified sample
(7800) Feed composition C3H8O2H2ON2=364051 vol T=400degC
191
The slight divergence of CO and CO2 indicate that these products are mainly first rank products but a small second rank component can not be excluded The acetic acid is a second rank product Similarly to the previous cases the higher rank delplots lead to diverging curves for all the products
First rank delplot Second rank delplot
0 20 40 60 80 1000
20
40
60
80
100 AA CO2 C3H6 HAc CO
S ()
XC3H8 ()
0 20 40 60 80 1000
1
2
3
4
5 AA CO2 C3H6 HAc CO
SX
XC3H8 ()
Third rank delplot Fourth rank delplot
0 20 40 60 80 100
00
01
02
03
04
SX2
X C3H8 ()
AA CO2 C3H6 HAc CO
0 20 40 60 80 100
0000
0005
0010
0015
0020
0025
SX3
X C3H8 ()
AA CO2 C3H6 HAc CO
Figure A513 The delplots corresponding to the propane oxidation using the hydrazine modified sample
(8113) Feed composition C3H8O2H2ON2=364051 vol T=400degC Differences were noted also in the catalytic properties of the hydrazine treated sample (8113) compared to the parent and other modified catalysts The activity differences were significant only at low conversions close to the differential operation mode Nevertheless the product distribution also differs from all the other catalysts In case of the parent sample and all the other modified the selectivity of CO and CO2 was higher than one except the measurement at the lowest space velocity of 3000 h-1 whereby
192
almost complete oxygen conversion (95) was attained Compared to these catalysts on the hydrazine treated sample the ratio between the CO and CO2 selectivity is inverted at any conversion On the first rank delplot corresponding to catalyst 8113 every compound had a nonzero positive intercept indicating that all are first rank products (Figure A513) The strongly diverging curves on the second third and fourth rank delplot confirmed that every product is mainly a primary product The product ranks corresponding to every catalyst mentioned in this chapter are summarized in Table A511 It can be observed that propylene is a primary product on all the catalysts Acrylic acid showed a primary and secondary component in case of the parent sample and the tetramethylethylenediamine treated sample while for the rest of the samples it was a primary product A mixed rank for CO and CO2 was found except for the water treated sample (7797) where these were only secondary products while on the hydrazine treated sample (8113) only primary products The acetic acid was mainly a secondary product except for the 7797 where a primary rank could not be excluded and for 8113 where first rank was observed Table A511 Product ranks on the different catalysts P-primary S-secondary Catalyst 6902 7797 7798 7799 7800 8113
C3H6 rank P P P P P P AA rank P S P P P S P P CO rank P S S P S P S P S P CO2 rank P S S S P S P S P HAc rank S P S S S S P
Certainly the CO and CO2 are multiple rank products and according to the rationale described in the section 427 and Appendix 52 the tertiary rank can not be excluded However in Table A511 only those ranks were listed which resulted from the delplots Upon summarizing the results of catalytic experiments on propane oxidation over the modified samples the most striking differences were noted The bromate treated sample (7800) shows the
bull lowest activity and selectivity in propane oxidation bull highest apparent activation energy bull mainly primary rank toward acrylic acid
The hydrazine treated sample (8113) is unique among the studied catalysts with respect to the followings
bull the ratio of COCO2 selectivity was below one for all the conditions bull all products were found to be mainly primary products
193
Appendix 61 Modeling the delplots for a reaction pathway that contains multiple
rank product
The applicability of the delplot technique introduced by Bhore et al was demonstrated on a reaction pathway consisting of one intermediate and two end products This technique is easily applicable for discernment of product ranks for a network of serial and parallel steps such as isomerisation reactions However in the case of oxidation reactions such as propane oxidation the educt the intermediate (propylene acrolein) and the product (acrylic acid) may undergo total oxidation pathways as well leading to CO and CO2 (cf section 64 and Appendix 51) In most of the proposed networks in the literature the total oxidation products appear only as end products from oxidation of acrylic acid and acetic acid respectively If this would be true the CO and CO2 rank would be quaternary As it was demonstrated by the delplots (subchapter 429) the curves corresponding to CO and CO2 on the third and fourth rank delplot are diverging which indicate that the rank of products are less than three and four It was found that these products are mainly secondary products and sometimes they appear also as minor products depending on the reaction conditions and the catalyst To tackle the above noted apparent inconsistency the delplot technique was applied to a reaction network that contains products with superposed or multiple ranks (primary secondary and tertiary) The simplest model for such a network consists of two parallel steps involving the reactant A (Figure A611) In one of the steps A is converted to intermediate B which undergoes a transformation to C In parallel to this sequence A is transformed directly to the C species
Figure A611 Reaction network containing a superposed primary and secondary rank end product
Therefore the C species is secondary product in the upper pathway and a primary product in the lower pathway This simple model resembles the oxidative dehydrogenation reactions with the simplification that only one total oxidation product is taken into account (CO or CO2) The simplification was made only for the purpose of easier mathematical handling of the kinetic modelThe differential equations corresponding to this model are the following
A B C
A C
k1 k2
k3
194
)316 (
)216 (
)116 ( )(
32
21
31
AEquationykykdt
dy
AEquationykykdt
dy
AEquationykkdt
dy
AB
C
BAB
AA
+=
minus=
+=minus
This set of differential equations is analytically solvable but because of the fact that the integrated rate equations are rather complicated they are not shown here Moreover the analytical equation for the calculation of the intercept is even more complicated the limit of the function can be obtained only by applying the lrsquoHospitalrsquos rule Therefore the set of differential equations was solved numerically in the Berkeley Madonna software using time steps of 002 s
0 20 40 60 80 1000
20
40
60
80
100
k3=02 gsml
k3=05 gsml
k3=10 gsml
k3=60 gsml
SB ()
X A ()
k1=10 gsml
k2=50 gsml
0 20 40 60 80 1000
20
40
60
80
100
k1=10 gsml
k2=50 gsml
k3=02 gsml
k3=05 gsml
k3=10 gsml
k3=60 gsml
SC ()
X A ()
First rank delplot species B First rank delplot species C
0 20 40 60 80 100
0
10
20
30
40
50
k1=10 gsml
k2=50 gsml
k3=02 gsml
k3=05 gsml
k3=10 gsml
k3=60 gsml
SBXA
X A ()
0 20 40 60 80 1000
1
2
3
4
5
6
k1=10 gsml
k2=50 gsml
k3=02 gsml
k3=05 gsml
k3=10 gsml
k3=60 gsml
SCXA
X A ()
Second rank delplot species B Second rank delplot species C
Figure A612 The delplot for B and C species corresponding to the reaction pathway depicted on Figure A611
The k1 rate constant was fixed to 10 gsml while k2 to 50 gsml Four different values were tried for k3 as follows 02 05 10 and 60 respectively The conversion and selectivities were calculated from the concentrations obtained from the numerical
195
solution of the differential equations Then the first and second rank delplots were constructed for the B and C species (Figure A612) The finite intercept on the first rank delplot corresponding to B species indicated first rank product On the other hand the first rank delplot corresponding to C shows an intercept close to zero at low values of k3 (02 and 05) while in the case of higher k3 values the intercept is above zero (around 2) This suggests that at higher k3 the C species is clearly a first rank product The divergent curves corresponding to the B species on the second rank delplot indicated that B is a primary product However the curves corresponding to the C species are diverging in the second rank delplot A slight divergence can be observed for low k3 values (02 and 05) while the divergence at high rate constants (10 and 60) is very pronounced Therefore based on exclusively the delplots one would erroneously conclude that the B and C species are primary products
A more complicated reaction network is depicted on Figure A613 This consists of two parallel pathways involving the reactant A producing the B and D species The B intermediate species is also involved in two parallel steps In one of them it is transformed to C while the other represents transformation to the D product Finally the C is transformed to D product Therefore according to the scheme B is a primary product C is a secondary product while the D is a primary secondary and a tertiary product as well This resembles to a simplified network for the oxidation of propane to acrylic acid The B stands for propylene the C is acrylic acid while D represents one of the total oxidation products (CO or CO2) The simplification consists of neglecting the pathway leading to acetic acid and considering of only one total oxidation product
Figure A613 Reaction network containing a superposed primary secondary and tertiary end product
The differential equations corresponding to this reaction network is shown below This set of differential equations was solved using the Berkeley Madonna software Since the case of simultaneous formation of a primary and secondary product with different rate constant of the second rank product formation was discussed on the Figure A612 in the present case the rate constant of the tertiary product formation (k5) was varied between 005 and 300 gsml while all the other rate constants were kept constant (k1=100 gsml k2=500 gsml k3=005 gsml k4=005 gsml)
A B C k1 k2
k3
D
k4 k5
196
)716 (
)616 (
)516 ( )(
)416 ( )(
543
52
422
31
AEquationykykykdt
dy
AEquationykykdt
dy
AEquationykkykdt
dy
AEquationykkdt
dy
CBAD
CB
C
BAB
AA
++=
minus=
+minus=
+=minus
Because the B was only a primary product the delplots corresponding to this species are not shown Only the delplots corresponding to the C and D products are analyzed in the following The first rank delplot corresponding to C and D exhibits a low but nonzero intercept (2 and 4 respectively) This suggests that both are primary products The D is indeed a primary product on the reaction scheme however the C is a secondary product The inconsistency in the rank of C determined from the delplot is due to systematic error introduced by extrapolation On the other hand the second rank delplot corresponding to C confirms that this species is a secondary product independently on the value of the k5 rate constant The third rank delplot showed that indeed the C has a lower rank than three The highly divergent curves corresponding D species on the second rank delplot suggests that this is only a primary product in contrast to the reaction scheme Finally the third rank delplot for the D species are strongly diverging indicating lower ranks than three However according to the reaction scheme D is a tertiary product as we ll As demonstrated by the above two simulated cases when a reaction network contains a product that is formed in two or more steps (multiple rank product) the delplot technique is not always suitable to find out the ranks Usually the lowest rank can be identified but the higher ranks are not identifiable due to diverging curves (these ranks being ldquomaskedrdquo by the lowest rank) The curvature strongly depends on the rate constants of the individual reaction steps Therefore in real applications a great care should be taken when discriminating the pathways leading to potentially multiple rank products such as CO and CO2 in oxidation catalysis For the identification of the pathways the ldquochemical knowledgerdquo arising from reactivity studies involving the reaction intermediates should also be taken into account besides the mathematics of the delplot technique
197
0 20 40 60 80 1000
20
40
60
80
100 k
5=005 gsml
k5=020 gsml
k5=100 gsml
k5=300 gsml
SC ()
X A ()
0 20 40 60 80 1000
20
40
60
80
100 k
5=005 gsml
k5=020 gsml
k5=100 gsm
k5=300 gsml
S D ()
X A ()
First rank delplot species C First rank delplot species D
0 20 40 60 80 10000
05
10
15
20
25
30
k5=005 gsml
k5=020 gsml
k5=100 gsm
k5=300 gsml
SCXA
X A ()
0 20 40 60 80 10000
05
10
15
20
25
30 k
5=005 gsml
k5=020 gsml
k5=100 gsm
k5=300 gsml
SDXA
X A ()
Second rank delplot species C Second rank delplot species D
0 20 40 60 80 100
00
01
02
03
04
05
06 k5=005 gsml
k5=020 gsml
k5=100 gsm
k5=300 gsml
SCXA2
X A ()
0 20 40 60 80 100
00
01
02
03
04
05
06 k
5=005 gsml
k5=020 gsml
k5=100 gsm
k5=300 gsml
SDXA2
X A ()
Third rank delplot species C Third rank delplot species D
Figure A614 The delplots for C and D species corresponding to the parallel-consecutive reaction network depicted on Figure A613
198
Appendix 62 The kinetic models implemented in the Berkeley Madonna software
Program for implementing Model 1 in Berkeley Madonna Rxn1a1=k1yC3H8 k1=12 rxn1a2=k2yC3H6 k2=12 rxn1a3=k3yC3H6 k3=1 rxn1a4=k4yC3H6 k4=1 rxn1a5=k5yAA k5=1 rxn1a6=k6yAA k6=1 rxn1a7=k7yC3H8 k7=1 INIT yC3H8=1 INIT yC3H6=0 INIT yAA=0 INIT yHAc=0 INIT yCO=0 INIT yCO2=0 ddt(yC3H8)=-rxn1a1-rxn1a7 ddt(yC3H6)=rxn1a1-(rxn1a2+rxn1a3+rxn1a4) ddt(yAA)=rxn1a2-(rxn1a5+rxn1a6) ddt(yHAc)=rxn1a4 ddt(yCO)=rxn1a3+rxn1a5+rxn1a7 ddt(yCO2)=rxn1a4+rxn1a6 METHOD RK4 STARTTIME = 0 STOPTIME=2 DT = 002
Program for implementing Model 2 in Berkeley Madonna rxn2a1=k1yC3H8 k1=12 rxn2a2=k2yC3H6 k2=12 rxn2a3=k3yC3H6 k3=1 rxn2a4=k4yC3H6 k4=1 rxn2a5=k5yAA k5=1 rxn2a6=k6yAA k6=1 rxn2a7=k7yC3H8 k7=1 rxn2a8=k8yC3H8 k8=1 INIT yC3H8=1 INIT yC3H6=0
199
INIT yAA=0 INIT yHAc=0 INIT yCO=0 INIT yCO2=0 ddt(yC3H8)=-rxn2a1-rxn2a7-rxn2a8 ddt(yC3H6)=rxn2a1-(rxn2a2+rxn2a3+rxn2a4) ddt(yAA)=rxn2a2-(rxn2a5+rxn2a6) ddt(yHAc)=rxn2a4 ddt(yCO)=rxn2a3+rxn2a5+rxn2a7 ddt(yCO2)=rxn2a4+rxn2a6+rxn2a8 METHOD RK4 STARTTIME = 0 STOPTIME=2 DT = 002
Appendix 63 The physical properties of the gas mixtures with different steam
contents
The selected physical properties (such as density heat capacity heat conductivity and kinematic viscosity) of mixtures containing C3H8 H2O O2 and N2 are shown in the Table A631 The mixtures correspond to the feed compositions used for the steam content variation presented in section 422 The physical properties were calculated at a temperature of 400degC using the Fluidatreg on the Net on-line calculator (wwwfluidatcom) provided by Bronkhorst For the estimation of the eventual hot-spot formation on the catalyst surface all the above mentioned physical properties are needed Semi-quantitatively the data may be interpreted as follows if in absence of steam hot-spot formation would occur the propane conversion would increase and the selectivity would decrease Since in absence of steam the conversion decreases (Figure A 631) the hot-spot formation is not likely to occur Therefore isothermal operation mode may be assumed Table A631 Physical properties of different feed mixtures Mixture 1 C3H8O2H2ON2=364051 vol Mixture 2 C3H8O2H2ON2=363061 vol Mixture 3 C3H8O2H2ON2=362071 vol Mixture 4 C3H8O2H2ON2=361081 vol Mixture 5 C3H8O2H2ON2=36091 vol
Property Mixture
1
Mixture
2
Mixture
3
Mixture
4
Mixture
5
Density (kgm3) 044 046 048 049 051 Heat capacity
(kJkgmiddotK) 1482 1399 1322 1250 1184
Heat conductivity102 (WmK)
634 610 582 551 527
Kinematic viscositymiddot105 (m2s)
654 640 624 609 604
200
0 10 20 30 40000
004
008
1200
1400
1600
0
20
40
60
80
100 HeatCapacity (kJkgK)
HeatConductivity (WmK)
Therm
al property
H2O content (vol)
Conversion Selectivity ()
X C3H8
S AA
Figure A 631 Plot of thermal properties of the feed mixture and the catalytic properties in function of the
steam content
201
Acknowledgements for permission to reprint published materials
1 Robert K Grasselli J D Burrington D J Buttrey P DeSanto C G Lungmair A F Volpe Jr T Weignand Multifunctionality of Active Centers in (Amm)oxidation Catalysts From BindashMondashOx to MondashVndashNbndash(Te Sb)ndashOx Topics in Catalysis 23 (2003) 5 with permission from Springer
2 MM Bettahar G Costentin L Savary JC Lavalley On the partial oxidation of propane and propylene on mixed metal oxide catalysts Applied Catalysis A General 145 (1996) 1-48 with permission from Elsevier
3 Gang Fu X Xu X Lu H Wan Mechanisms of Initial Propane Activation on Molybdenum Oxides A Density Functional Theory Study Journal of Physical Chemistry B 109 2005 6416-6421 with permission from the American Chemical Society
4 Manhua Lin Tejal B Desai Frederick W Kaiser Peter D Klugherz Reaction pathways in the selective oxidation of propane over a mixed metal oxide catalyst Catalysis Today 61 (2000) 223-229 with permission from Elsevier
5 R Fushimi S O Shekhtman A Gaffney S Han G S Yablonsky J T Gleaves Industrial amp Engineering Chemistry Research 44 (2005) 6310-6319 with permission from the American Chemical Society
6 P Botella J M Loacutepez Nieto B Solsona A Mifsud F Maacuterquez The Preparation Characterization and Catalytic Behavior of MoVTeNbO Catalysts Prepared by Hydrothermal Synthesis Journal of Catalysis 209 (2002) 445-455 with permission from Elsevier
7 C Hamel Aacute Toacuteta F Klose E Tsotsas A Seidel-Morgenstern Analysis of single and multi-stage membrane reactors for the oxidation of short-chain alkanesmdashSimulation study and pilot scale experiments Chemical Engineering Research and Design 86 (2008) 753-764 with permission from Elsevier
202
List of abbreviations
AA ndash acrylic acid
Ace ndash acetone
Acr ndash acrolein
AHM ndash ammonium heptamolybdate
at - atomic percentage
BESSY ndash Berliner Elektronenspeicherring-Gesellschaft fuumlr Synchrotronstrahlung
BET ndash Brunauer Emmett Teller method
C-bal ndash carbon balance
CSTR ndash continuous-flow stirred tank reactor
DFT ndash density functional theory
dpmax ndash the maximum particle diameter of the sieve fraction
dpmin ndash the minimum particle diameter of the sieve fraction
dr ndash the inner diameter of the reactor tube
Ea Eaapp ndash apparent activation energy
EDX ndash energy dispersive X-ray analysis
ESR ndash electron spin resonance
FBR ndash fixed bed reactor
FTIR ndash Fourier transform infrared spectroscopy
GC-MS ndash gas chromatograph coupled to mass spectrometer
GHSV ndash gas hourly space velocity
HAc ndash acetic acid
HPC ndash heteropoly-compounds
k ndash rate constant
LEIS ndash low energy ion scattering
MAnh ndash malonic anhydride
MFC ndash mass flow controller
MMO ndash multi-metal oxide
MSD ndash mass spectrometric detector
ODH ndash oxidative dehydrogenation
203
P ndash primary product
PFR ndash plug-flow reactor
PI ndash pressure indicator
r ndash reaction rate
R1 R2 ndash reactor tubes of the two-stage reactor
S ndash secondary product
SEM ndash scanning electron microscopy
Si ndash selectivity to the product appearing in the index
STEM ndash scanning transmission electronmicroscopy
STR ndash single-tube reactor
TCD ndash temperature conductivity detector
TIC ndash temperature indicator and controller
TMEDA ndash tetramethylethylenediamine
TSR ndash two-stage reactor
UV-Vis ndash ultraviolet-visible spectroscopy
VPO ndash vanadium-phosphorous oxides
WF ndash weight per flow contact time
WGS ndash water gas shift reaction
WHSV ndash weight hourly space velocity
XAS ndash X-ray absorption spectroscopy
Xi ndash conversion of the species in the index
XPS ndash X-ray photoelectron spectroscopy
XRD ndash X-ray diffraction
Yi ndash yield of the species in the index
yi ndash dimensionless concentration
∆H ndash enthalpy change
∆H ndash activation enthalpy
∆S ndash entropy change
∆S ndash activation entropy
204
List of figures
Chapter 1 Introduction and motivation Figure 121 Propylene oxidation and ammoxidation mechanism over bismuth molybdate catalysts as proposed by Grasselli et al [9]helliphelliphelliphelliphelliphelliphelliphelliphelliphelliphelliphelliphelliphelliphelliphelliphelliphelliphelliphelliphelliphelliphelliphelliphelliphelliphelliphelliphelliphellip4 Figure 122 Mechanism of propylene oxidation by consecutive acid-base and redox steps as proposed by Bettahar et al [12]helliphelliphelliphelliphelliphelliphelliphelliphelliphelliphelliphelliphelliphelliphelliphelliphelliphelliphelliphelliphelliphelliphelliphelliphelliphelliphelliphelliphelliphelliphelliphelliphelliphelliphellip5 Figure 123 Some examples of the possible transitional states of hydrogen atom abstraction according to[18] The numbers on the figures correspond to the calculated bond lengthshelliphelliphelliphelliphelliphelliphelliphelliphelliphelliphellip11 Figure 124 Reaction network of propane oxidation according to Bettahar et al [12]helliphelliphelliphelliphelliphelliphellip14 Figure 125 The relative oxidative stability of several intermediates at different temperatures [22]helliphellip15 Figure 126 Oxidation pathways of propane according to [22]helliphelliphelliphelliphelliphelliphelliphelliphelliphelliphelliphelliphelliphelliphelliphellip16 Figure 127 Effect of CO2 on the acrylic acid yield [30]helliphelliphelliphelliphelliphelliphelliphelliphelliphelliphelliphelliphelliphelliphelliphelliphelliphelliphellip20
Figure 128 Reaction steps and nature of active and selective sites in the oxidation of propane to acrylic acid on MoVTeNbOx catalysts [35]helliphelliphelliphelliphelliphelliphelliphelliphelliphelliphelliphelliphelliphelliphelliphelliphelliphelliphelliphelliphelliphelliphelliphelliphelliphelliphellip21 Figure129 The flow rate (left) and concentration distribution of oxygen (right) in the catalytic membrane reactor without reaction taking place The blue and green curves correspond to different reactor geometries (aspect ratios) The profile corresponding to fixed bed reactor (FBR) is indicated by orange line [61]helliphellip34 Figure 1210 (a) Selectivity of propylene vs propane conversion (b) selectivity of propylene vs temperature Conditions xC3H8
in=1 O2C3H8=1 and WHSV=100 and 400 kgsm3 [61]helliphelliphelliphelliphelliphelliphellip35
Chapter 2 Experimental methods Fig 221 The experimental setup denominated as PropOx-1helliphelliphelliphelliphelliphelliphelliphelliphelliphelliphelliphelliphelliphelliphelliphelliphellip47 Figure 222 The temperature profile of the reactor tube Zero centimeter corresponds to the bottom of the heating cartridge The delimitation of the isothermal zone is marked by blue lineshelliphelliphelliphelliphelliphelliphelliphelliphellip49 Figure 223 The gas tubing connection of the two stage reactorhelliphelliphelliphelliphelliphelliphelliphelliphelliphelliphelliphelliphelliphelliphelliphellip53 Figure 224 The dilution ratio in the second reactor (red dots) and the overall space velocity (black squares) change upon oxygen addition in the two-stage reactor systemhelliphelliphelliphelliphelliphelliphelliphelliphelliphelliphelliphelliphelliphellip54 Figure 225 Detection at the MSD 1 acetic acid 2 acrylic acid helliphelliphelliphelliphelliphelliphelliphelliphelliphelliphelliphelliphelliphelliphellip56 Figure 226 Detection at the TCD 1 carbon- dioxide 2 water 3 propylene 4 propane 5 oxygen 6 nitrogen 7 carbon-monoxide valve switching helliphelliphelliphelliphelliphelliphelliphelliphelliphelliphelliphelliphelliphelliphelliphelliphelliphellip56 Figure 227 Calibration graphs helliphelliphelliphelliphelliphelliphelliphelliphelliphelliphelliphelliphelliphelliphelliphelliphelliphelliphelliphelliphelliphelliphelliphelliphelliphelliphelliphellip58 Figure 231 The TEM image of the catalyst 6059 helliphelliphelliphelliphelliphelliphelliphelliphelliphelliphelliphelliphelliphelliphelliphelliphelliphelliphelliphellip62 Figure 232 The XRD pattern of 6059 6902 and 8947helliphelliphelliphelliphelliphelliphelliphelliphelliphelliphelliphelliphelliphelliphelliphelliphelliphellip63
Chapter 3 Structural stability of the M1 MoVTeNbOx catalyst under propane
oxidation conditions Figure 331 The XRD patterns recorded under different reaction conditionshelliphelliphelliphelliphelliphelliphelliphelliphelliphelliphellip70 Figure 332 The lattice constants determined for every conditionhelliphelliphelliphelliphelliphelliphelliphelliphelliphelliphelliphelliphelliphelliphellip71 Figure 333 The normalized average intensity corresponding to acrylic acid during the in-situ XRD experiment monitored by on-line MS (black squares) The concentration of acrylic acid determined in the PropOx-1 fixed bed reactor (blue dots)helliphelliphelliphelliphelliphelliphelliphelliphelliphelliphelliphelliphelliphelliphelliphelliphelliphelliphelliphelliphelliphelliphelliphelliphelliphellip72 Figure 341 STEM images of the catalyst before and after the in-situ XRD experimenthelliphelliphelliphelliphelliphellip73 Figure 342 The elemental mapping of the catalyst before reactionhelliphelliphelliphelliphelliphelliphelliphelliphelliphelliphelliphelliphelliphellip74 Figure 343 The elemental mapping of the catalyst after reactionhelliphelliphelliphelliphelliphelliphelliphelliphelliphelliphelliphelliphelliphelliphellip74
Chapter 4 Kinetic studies of propane oxidation to acrylic acid on a phase-pure
MoVTeNbOx catalyst Figure 421 The evolution of concentrations with the residence time at different temperatures Squares ndash experimental data dashed curves ndash fitted kinetic curves based on reaction model 1 (for modeling see section 64) Feed composition C3H8O2H2ON2=364051 vol Catalyst ID=6059helliphelliphelliphelliphelliphelliphellip80
205
Figure 422 The stability of catalytic performance in steam-free feedhelliphelliphelliphelliphelliphelliphelliphelliphelliphelliphelliphelliphelliphellip82 Figure 423 The effect of steam on the acrylic acid productivity at GHSV=4500 9000 and 18000 h-1hellip83
Figure424 The effect of temperature on the catalytic performance at 0 10 and 40 vol steam content Catalyst 6059helliphelliphelliphelliphelliphelliphelliphelliphelliphelliphelliphelliphelliphelliphelliphelliphelliphelliphelliphelliphelliphelliphelliphelliphelliphelliphelliphelliphelliphelliphelliphelliphelliphelliphelliphellip84
Figure 425 The effect of steam on the concentration profileshelliphelliphelliphelliphelliphelliphelliphelliphelliphelliphelliphelliphelliphelliphelliphelliphellip86 Figure 426 The effect of the propane concentration on the catalytic performance C3H8O2H2ON2=x640(54-x) vol T=400degC GHSV= 34280 h-1 WF=011 gsml Catalyst 6059hellip88 Figure 427 Determination of the reaction order with respect to propanehelliphelliphelliphelliphelliphelliphelliphelliphelliphelliphelliphellip90 Figure 428 The effect of the oxygen concentration on catalytic performance C3H8O2H2ON2=3y40(57-y) vol T=400degC GHSV= 4500 h-1 WF=0904 gsml catalyst 605991 Figure 429 Determination of the reaction order with respect to oxygen Cat 6059helliphelliphelliphelliphelliphelliphelliphellip92 Figure 4210 Propylene oxidation with 6902 Feed composition C3H6O2H2ON2=364051 vol Top GHSV=5000 h-1 bottom GHSV=20000 h-1 Catalyst 6902helliphelliphelliphelliphelliphelliphelliphelliphelliphelliphelliphelliphelliphelliphelliphelliphellip94 Figure 4211 The effect of H2O on propylene oxidation Feed composition C3H6O2H2ON2=36z(91-z) vol GHSV=80000 h-1 T=400degC Catalyst 690297 Figure 4212 The effect of temperature on acrolein oxidation Catalyst 6059helliphelliphelliphelliphelliphelliphelliphelliphelliphellip99
Figure 4213 CO oxidation at different temperatures space velocities in stoichiometric and oxidizing feed Catalyst 8947helliphelliphelliphelliphelliphelliphelliphelliphelliphelliphelliphelliphelliphelliphelliphelliphelliphelliphelliphelliphelliphelliphelliphelliphelliphelliphelliphelliphelliphelliphelliphelliphellip102 Figure 42 14 Space velocity variation for CO oxidation and water gas shift reactionhelliphelliphelliphelliphelliphelliphellip103 Figure 4215 Comparison of the propane propylene acrolein (top) propane CO oxidation and water gas shift activity (bottom) of the catalyst helliphelliphelliphelliphelliphelliphelliphelliphelliphelliphelliphelliphelliphelliphelliphelliphelliphelliphelliphelliphelliphelliphelliphelliphelliphellip105
Figure 431 The dilution ratios (black squares) overall space velocities (black dots) and the oxygen concentrations (empty and full blue triangles) in function of the flow rate of the added oxygenhelliphelliphelliphellip108 Figure 432 The effect of oxygen addition in the two-stage reactorhelliphelliphelliphelliphelliphelliphelliphelliphelliphelliphelliphelliphelliphellip109 Figure 433 Comparison of the catalytic performance in the single-tube reactor (STR) and two-stage reactor (TSR)helliphelliphelliphelliphelliphelliphelliphelliphelliphelliphelliphelliphelliphelliphelliphelliphelliphelliphelliphelliphelliphelliphelliphelliphelliphelliphelliphelliphelliphelliphelliphelliphelliphelliphelliphellip110 Figure 434 Addition of N2O in the two-stage reactor Conditions noted with stars - 40 vol O2 introduced in R1 reactor and 40 vol N2O in R2 reactor - 6 vol O2 introduced in R1 reactor and 00 vol N2O in R2 reactorhelliphelliphelliphelliphelliphelliphelliphelliphelliphelliphelliphelliphelliphelliphelliphelliphelliphelliphelliphelliphelliphelliphelliphelliphelliphelliphelliphelliphelliphelliphelliphellip112 Figure 435 Reactivation of the catalyst after exposing to reducing conditionshelliphelliphelliphelliphelliphelliphelliphelliphelliphellip113 Figure 436 The effect of C3H6 addition of in the two-stage reactorhelliphelliphelliphelliphelliphelliphelliphelliphelliphelliphelliphelliphelliphellip115 Figure 437 The effect of CO addition in the two-stage reactorhelliphelliphelliphelliphelliphelliphelliphelliphelliphelliphelliphelliphelliphelliphelliphellip116 Figure 438 The effect of CO2 addition in the two-stage reactorhelliphelliphelliphelliphelliphelliphelliphelliphelliphelliphelliphelliphelliphelliphellip118
Chapter 5 Post synthesis treatment of the phase-pure M1 MoVTeNbOx catalyst Figure 521 The UV-Vis spectra of the filtrate solutionshelliphelliphelliphelliphelliphelliphelliphelliphelliphelliphelliphelliphelliphelliphelliphelliphelliphellip126
Figure 531 The SEM picture of the catalysts 6902 (parent sample) 7797 (water treated sample) 7798 (H3PO4 treated sample) 7799 (TMEDA treated sample) 7800 (NaBrO3 treated sample) 8113 (N2H4 treated sample)helliphelliphelliphelliphelliphelliphelliphelliphelliphelliphelliphelliphelliphelliphelliphelliphelliphelliphelliphelliphelliphelliphelliphelliphelliphelliphelliphelliphelliphelliphelliphelliphelliphelliphellip129 Figure 532 The elemental composition of the original and the modified catalysts as probed by EDX130
533 NEXAFS spectra of the bromate treated sample( 7800) the parent sample (6902) the difference spectrum and the V5+ reference spectrumhelliphelliphelliphelliphelliphelliphelliphelliphelliphelliphelliphelliphelliphelliphelliphelliphelliphelliphelliphelliphelliphelliphelliphelliphellip131 Figure 534 Normalized surface concentrations Correlation of Te content and TeV ratio with the normalized selectivity to acrylic acid (bar-graph)helliphelliphelliphelliphelliphelliphelliphelliphelliphelliphelliphelliphelliphelliphelliphelliphelliphelliphelliphelliphelliphellip133 Figure 535 Adsorption of propane (educt of the catalytic reaction) at 313 K on fresh (dots) and used M1 (triangle) activated at 423 K under vacuumhelliphelliphelliphelliphelliphelliphelliphelliphelliphelliphelliphelliphelliphelliphelliphelliphelliphelliphelliphelliphelliphelliphelliphellip134 Figure 536 Adsorption of propylene at 313 K on fresh (dots) and used M1 (triangle) activated at 423 K under vacuumhelliphelliphelliphelliphelliphelliphelliphelliphelliphelliphelliphelliphelliphelliphelliphelliphelliphelliphelliphelliphelliphelliphelliphelliphelliphelliphelliphelliphelliphelliphelliphelliphelliphelliphelliphellip136 Figure 537 Adsorption of propane at 313 K after propylene adsorption on fresh (open dots) M1 activated at 423 K under vacuum For comparison the propane adsorption isotherm and differential heat profile if propane firstly adsorbed on the fresh M1 (dots)helliphelliphelliphelliphelliphelliphelliphelliphelliphelliphelliphelliphelliphelliphelliphelliphelliphelliphelliphelliphelliphellip138 Figure 538 Microcalorimetry on the bromate-treated phase-pure M1 catalyst (7800) before and after catalytic experimenthelliphelliphelliphelliphelliphelliphelliphelliphelliphelliphelliphelliphelliphelliphelliphelliphelliphelliphelliphelliphelliphelliphelliphelliphelliphelliphelliphelliphelliphelliphelliphelliphellip139 Figure 541 The activity of the catalystshelliphelliphelliphelliphelliphelliphelliphelliphelliphelliphelliphelliphelliphelliphelliphelliphelliphelliphelliphelliphelliphelliphelliphelliphellip141 Figure 542 The selectivity and yield of the catalystshelliphelliphelliphelliphelliphelliphelliphelliphelliphelliphelliphelliphelliphelliphelliphelliphelliphelliphelliphellip143
206
Figure 543 The apparent activation energy of propane activation over the catalystshelliphelliphelliphelliphelliphelliphellip143 Figure 544 The linear representation of the rate law with respect to propane and oxygen 6902 ndash original 7797 ndash H2O modified 7798 ndash H3PO4 modified 7799 ndash TMEDA modified 7800 ndash NaBrO3 modified 8113 ndash N2H4 modified samplehelliphelliphelliphelliphelliphelliphelliphelliphelliphelliphelliphelliphelliphelliphelliphelliphelliphelliphelliphelliphelliphelliphelliphelliphellip145 Figure 545 Plot of the experimental with calculated yC3H6 data for catalyst 6902helliphelliphelliphelliphelliphelliphelliphellip147 Figure 546 The activity of the catalysts in propane oxidation reaction 6902 ndash original 7797 ndash H2O modified 7798 ndash H3PO4 modified 7799 ndash TMEDA modified 7800 ndash NaBrO3 modified 8113 ndash N2H4 modified samplehelliphelliphelliphelliphelliphelliphelliphelliphelliphelliphelliphelliphelliphelliphelliphelliphelliphelliphelliphelliphelliphelliphelliphelliphelliphelliphelliphelliphelliphelliphelliphelliphelliphelliphellip149 Figure 547 The selectivity and yield of the catalysts in propane oxidation reaction 6902 ndash original 7797 ndash H2O modified 7798 ndash H3PO4 modified 7799 ndash TMEDA modified 7800 ndash NaBrO3 modified 8113 ndash N2H4 modified samplehelliphelliphelliphelliphelliphelliphelliphelliphelliphelliphelliphelliphelliphelliphelliphelliphelliphelliphelliphelliphelliphelliphelliphelliphelliphelliphelliphelliphellip149 Figure 548 The CO oxidation activity at different temperatures and GHSV=3000 h-1 (left) The kinetic curves of CO2 formation at 400degC (right) Conditions COO2H2ON2=36091 vol Catalysts 8947 ndash as prepared M1 MoVTeNbOx 7800 ndash NaBrO3 treated 6902 8113 ndash N2H4 treated 6902helliphelliphelliphelliphellip150
Figure 549 Kinetic curves for CO2 formation for the CO oxidation in presence of steam and for the water gas shift reactions Catalysts 6902 minus as prepared M1 MoVTeNbOx) 7800 minus NaBrO3 treated sample 8113 minus N2H4 treated samplehelliphelliphelliphelliphelliphelliphelliphelliphelliphelliphelliphelliphelliphelliphelliphelliphelliphelliphelliphelliphelliphelliphelliphelliphelliphelliphelliphelliphellip152
Chapter 6 Exploratory experiments Figure 621 Catalytic performance of different phase-pure Mo and V based oxideshelliphelliphelliphelliphelliphelliphelliphellip162
Figure 622 The activation parameters of the propane and oxygen conversion on the MoV(Te)(P)(Nb)Ox catalystshelliphelliphelliphelliphelliphelliphelliphelliphelliphelliphelliphelliphelliphelliphelliphelliphelliphelliphelliphelliphelliphelliphelliphelliphelliphelliphelliphelliphelliphelliphelliphelliphelliphelliphelliphelliphelliphellip163 Figure 631 Propylene oxidation over (Mo093V007)5O14 catalyst (1862)helliphelliphelliphelliphelliphelliphelliphelliphelliphelliphelliphellip168 Figure 641 Delplots for propane oxidation using the feed C3H8O2H2ON2=364051vol at T=400degC Catalyst ID 6059helliphelliphelliphelliphelliphelliphelliphelliphelliphelliphelliphelliphelliphelliphelliphelliphelliphelliphelliphelliphelliphelliphelliphelliphelliphelliphelliphelliphelliphelliphelliphelliphelliphellip172 Figure 642 Delplots for propane oxidation using the feed C3H8O2H2ON2=36091vol at T=400degC Catalyst ID 6059helliphelliphelliphelliphelliphelliphelliphelliphelliphelliphelliphelliphelliphelliphelliphelliphelliphelliphelliphelliphelliphelliphelliphelliphelliphelliphelliphelliphelliphelliphelliphelliphelliphellip174 Figure 643 Reaction model 1 for propane oxidationhelliphelliphelliphelliphelliphelliphelliphelliphelliphelliphelliphelliphelliphelliphelliphelliphelliphelliphelliphellip176 Figure 644 The reaction model 2helliphelliphelliphelliphelliphelliphelliphelliphelliphelliphelliphelliphelliphelliphelliphelliphelliphelliphelliphelliphelliphelliphelliphelliphelliphelliphellip177
Appendices
Appendix 51 Reaction networks of propane oxidation over the modified catalysts
Figure A511 The delplots corresponding to the propane oxidation using the H2O modified sample (7797) Feed composition C3H8O2H2ON2=364051 vol T=400degC189 Figure A512 The delplots corresponding to the propane oxidation using the NaBrO3 modified sample (7800) Feed composition C3H8O2H2ON2=364051 vol T=400degC190
Figure A513 The delplots corresponding to the propane oxidation using the hydrazine modified sample (8113) Feed composition C3H8O2H2ON2=364051 vol T=400deghelliphelliphelliphelliphelliphelliphelliphelliphelliphelliphelliphelliphellip191
Appendix 61 Modeling the delplots for a reaction pathway that contains multiple
rank product Figure A611 Reaction network containing a superposed primary and secondary rank end producthellip193 Figure A612 The delplot for B and C species corresponding to the reaction pathway depicted on Figure A611helliphelliphelliphelliphelliphelliphelliphelliphelliphelliphelliphelliphelliphelliphelliphelliphelliphelliphelliphelliphelliphelliphelliphelliphelliphelliphelliphelliphelliphelliphelliphelliphelliphelliphelliphelliphelliphellip194 Figure A613 Reaction network containing a superposed primary secondary and tertiary end product195 Figure A614 The delplots for C and D species corresponding to the parallel-consecutive reaction network depicted on Figure A613helliphelliphelliphelliphelliphelliphelliphelliphelliphelliphelliphelliphelliphelliphelliphelliphelliphelliphelliphelliphelliphelliphelliphelliphelliphelliphellip197 Figure A 631 Plot of thermal properties of the feed mixture and the catalytic properties in function of the steam contenthelliphelliphelliphelliphelliphelliphelliphelliphelliphelliphelliphelliphelliphelliphelliphelliphelliphelliphelliphelliphelliphelliphelliphelliphelliphelliphelliphelliphelliphelliphelliphelliphelliphelliphelliphellip200
207
List of tables
Chapter 1 Introduction and motivation Table 121 The characteristics of catalysts studied in [14 ]helliphelliphelliphelliphelliphelliphelliphelliphelliphelliphelliphelliphelliphelliphelliphelliphelliphellip8 Table 122 The calculated thermodynamic quantities of the supposed hydrogen atom abstraction pathways in comparison with the experimentally determined values [18]helliphelliphelliphelliphelliphelliphelliphelliphelliphelliphelliphelliphellip12 Table 123 Optimized catalytic performance of VPO HPC and MMO catalyst systems for oxidation of propane to acrylic acid as summarized based on references [2] and [4]helliphelliphelliphelliphelliphelliphelliphelliphelliphelliphelliphelliphellip13 Table 124 Catalytic effect of the individual phases of the mixture in the propane partial oxidation [2]21 Table 125 Activation energy of propane partial oxidation on different surface-promoted catalysts [36]23
Chapter 2 Experimental methods Table221 The Ψ Φ and η dimensionless numbers corresponding to propane oxidation reactionhelliphellip52 Table 222 The resolution for the peak-pairs which elute close to each otherhelliphelliphelliphelliphelliphelliphelliphelliphelliphelliphellip57 Table223 Vapor pressures of acetic- and acrylic acid at around room temperature [11]helliphelliphelliphelliphelliphellip58 Table 231 The properties of the phase-pure M1 catalysts 6059 6902 and 8947helliphelliphelliphelliphelliphelliphelliphellip62
Chapter 4 Kinetic studies of propane oxidation to acrylic acid on a phase-pure
MoVTeNbOx catalyst Table 421 The activation parameters of propane consumption at different steam contentshelliphelliphelliphelliphellip85
Table 422 The activation parameters of acrolein oxidation on 6059 catalysthelliphelliphelliphelliphelliphelliphelliphelliphelliphellip100
Table 423 The activation parameters of CO oxidation in dry feedhelliphelliphelliphelliphelliphelliphelliphelliphelliphelliphelliphelliphelliphellip102
Chapter 5 Post synthesis treatment of the phase-pure M1 MoVTeNbOx catalyst Table 531 The BET surface area of the sampleshelliphelliphelliphelliphelliphelliphelliphelliphelliphelliphelliphelliphelliphelliphelliphelliphelliphelliphelliphelliphellip127 Table 532 The lattice parameters of the catalysts before and after catalytic oxidation of propane and propylenehelliphelliphelliphelliphelliphelliphelliphelliphelliphelliphelliphelliphelliphelliphelliphelliphelliphelliphelliphelliphelliphelliphelliphelliphelliphelliphelliphelliphelliphelliphellip128 Table 533 The binding energies corresponding to every catalyst helliphelliphelliphelliphelliphelliphelliphelliphelliphelliphelliphelliphelliphellip132
Table 534 Adsorption and desorption heats corresponding to different coverageshelliphelliphelliphelliphelliphelliphelliphellip135
Table 535 The adsorption order monolayer coverage and adsorption constant of propane adsorption for the 6059 and bromate treated sample (7800) helliphelliphelliphelliphelliphelliphelliphelliphelliphelliphelliphelliphelliphelliphelliphelliphelliphelliphelliphelliphelliphellip140
Table 541 The catalytic performance of the hydrazine treated catalyst (8113) compared before and after the complete oxygen conversion experimenthelliphelliphelliphelliphelliphelliphelliphelliphelliphelliphelliphelliphelliphelliphelliphelliphelliphelliphelliphelliphelliphelliphellip142 Table 542 The apparent rate constants of propane and oxygen consumptionhelliphelliphelliphelliphelliphelliphelliphelliphelliphellip145 Table 543 The rate constants of propane and propylene consumptionhelliphelliphelliphelliphelliphelliphelliphelliphelliphelliphelliphelliphellip147 Table 544 Activation energy of CO oxidation Feed composition COO2H2ON2=36091 vol 8947 ndash as prepared M1 MoVTeNbOx 7800 ndash NaBrO3 treated 6902 8113 ndash N2H4 treated 6902helliphelliphelliphellip151
Table 545 The CO conversion at GHSV=3000 h-1 and 400degChelliphelliphelliphelliphelliphelliphelliphelliphelliphelliphelliphelliphelliphelliphelliphellip152
Table 546 Rate constants of CO2 formation at 400degChelliphelliphelliphelliphelliphelliphelliphelliphelliphelliphelliphelliphelliphelliphelliphelliphelliphelliphellip153
Chapter 6 Exploratory experiments Table 621 The used catalysts and reaction conditions Catalyst preparation methods SD ndash spray drying HT ndash hydrothermalhelliphelliphelliphelliphelliphelliphelliphelliphelliphelliphelliphelliphelliphelliphelliphelliphelliphelliphelliphelliphelliphelliphelliphelliphelliphelliphelliphelliphelliphelliphelliphelliphellip159 Table 622 Comparison of the catalytic performance of MoVTeNbOx (6059) and MoVOx (8103) samples at 400degC feed composition C3H8O2H2ON2=364051 vol helliphelliphelliphelliphelliphelliphelliphelliphelliphelliphelliphellip160
Table 623 Comparison of the performance of selected catalysts Composition as determined by (a) stoichiometry (b) ICP (c) EDX (d) LEIS-surface Preparation method slurry (Sl) hydrothermal (Ht) Solid-solid (Ss) Incipient impregnation (Ii) Spray drying (Sd) (P) ndash present workhelliphelliphelliphelliphelliphelliphellip165
Table 631 Propylene oxidation reactivity on different catalysts helliphelliphelliphelliphelliphelliphelliphelliphelliphelliphelliphelliphelliphelliphellip169
Table 641 Product ranks at different temperatures For multiple rank products the main ranks are highlighted by bold letter P-primary S-secondaryhelliphelliphelliphelliphelliphelliphelliphelliphelliphelliphelliphelliphelliphelliphelliphelliphelliphelliphelliphelliphellip173
208
Table 642 Product ranks at different steam contents For multiple rank products the main ranks are highlighted by bold letter P-primary S-secondary rankhelliphelliphelliphelliphelliphelliphelliphelliphelliphelliphelliphelliphelliphelliphelliphelliphelliphelliphellip175
Table 651 The rate constants corresponding to the steps of the reaction model 1helliphelliphelliphelliphelliphelliphelliphellip179
Table 652 The activation energy and preexponential factor of the individual reaction stepshelliphelliphelliphellip179
Table 653 The rate constants of the individual steps as determined based on model 1 and model 2hellip180
Appendices
Appendix 51 Reaction networks of propane oxidation over the modified catalysts
Table A511 Product ranks on the different catalysts P-primary S-secondaryhelliphelliphelliphelliphelliphelliphelliphelliphellip192
Appendix 63 The physical properties of the gas mixtures with different steam
contents Table A631 Physical properties of different feed mixtures Mixture 1 C3H8O2H2ON2=364051 vol Mixture 2 C3H8O2H2ON2=363061 vol Mixture 3 C3H8O2H2ON2=362071 vol Mixture 4 C3H8O2H2ON2=361081 vol Mixture 5 C3H8O2H2ON2=36091 vol199

i
AcknowledgementsDanksagung
The work presented in this thesis was carried out in the time interval between February
2007 and June 2011 at the Inorganic Chemistry Department of the Fritz Haber Institute of
the Max Planck Society in Berlin
Foremost I would like to thank to Prof Dr Robert Schloumlgl for giving me the opportunity
to carry out the doctoral studies at this Institute In the same time I would like to express
my gratitude for giving me this interesting topic and the constructive criticism during the
discussions I also would like to thank Dr Annette Trunschke for introducing me in the
topic of the present thesis for the fruitful discussions and new ideas and for contributing
to my professional development
The substantial contributions of the department members to this work are also
acknowledged I thank Yury Kolen`ko Almudena Celaya Sanfiz ZiRong Tang and Olaf
Timpe for catalyst synthesis Gisela Lorenz for the nitrogen physisorption experiments
Gisela Weinberg and Wei Zhang for the SEM-EDX and the STEM measurements Edith
Kitzelmann for the XRD measurements Sabine Wrabetz for the microcalorimetric
experiments Raoul Blume Michael Haumlvecker and Detre Teschner for the XPS
experiments and data analysis Benjamin Frank Kazu Amakawa Peacuteter Schnoumlrch Tom
Cotter Manfred Schuster Anton Nagy and Sylvia Reiche for the helpful discussions
Special thanks are addressed to Siegfried Engelschalt and Raoul Naumann d`Alnoncourt
for their help in setting up the reactor system and to Frank Girgsdies for the in-situ XRD
experiment and data analysis on the effect of steam and the redox potential Finally the
help of all the members of the department and the workshops is acknowledged
Last but not least I would like to express my gratitude to my parents and my former
supervisor Dr Csaba Bolla for encouraging me to undertake the doctoral studies abroad
and for their continuous moral support along these years
ii
To my parents
iii
Eidesstattliche Versicherung Hiermit erklaumlre ich dass ich die Dissertation selbst angefertigt habe Die Arbeit enthaumlltndash auch in Anteilen ndash keine Kopien andere Arbeiten Verwendete Hilfsmittel und Quellen sind vollstaumlndig angegeben Die Namen alle Wissenschaftler die mit mir zusammengearbeiten haben sind in den Anlagen vollstaumlndig genannt
iv
Abstract
The present work concentrates on the systematic kinetic study of the one-step propane
oxidation to acrylic acid over a well defined phase-pure M1 MoVTeNbOx catalyst The
bulk structural stability of the catalyst is a key issue for kinetic studies The stability of
the phase-pure M1 MoVTeNbOx catalyst under various conditions (steam-containing
steam-free net reducing stoichiometric and net oxidizing feed compositions) was
evidenced by an in-situ XRD experiment which suggested that the bulk structure is
homogeneous and constant under reaction conditions Thereby the heterogeneously
catalyzed reactivity is exclusively determined by the surface properties which in turn are
controlled by the chemical potential of the gas phase
A kinetic study on the reaction variables (temperature steam content and redox potential)
was carried out Stable catalytic performance was observed for all the conditions Cycling
experiments showed the reversibility of the conversion and selectivity decrease upon
exposing the catalyst to dry and reducing feed respectively Further catalytic experiments
revealed that the reactivity spans over 5 orders of magnitude in the order of acrolein
oxidationgtgtpropylene oxidationgtpropane oxidationgtgtcarbon monoxide oxidation~water
gas shift reaction The negligible CO oxidation activity suggested that the CO and CO2
are formed via two independent pathways in propane oxidation over M1 The stage-wise
addition of oxygen lead to an improvement of the catalytic performance by 5 compared
to the conventional single-tube reactor Further experiments in the two-stage reactor
revealed that the phase-pure M1 is not reoxidized by N2O The addition of propylene in
the two-stage reactor revealed a slight competitive adsorption on the active sites with
propane which observation was supported by the results of microcalorimetric
experiments On the other hand the addition of CO and CO2 in the two-stage reactor
showed that these products do not adsorb competitively with the educt or intermediates
In the literature much of the kinetic data was reported for ill-defined catalyst surfaces In
contrast to that the present work reports the kinetic study of propane selective oxidation
to acrylic acid on a well defined phase-pure and structurally stable M1 MoVTeNbOx
catalyst This study may contribute to the better kinetic and mechanistic understanding of
the propane selective oxidation reaction
v
Zusammenfassung
Die vorliegende Arbeit enthaumllt systematische kinetische Untersuchungen zur einstufigen
selektiven Oxidation von Propan zu Acrylsaumlure an wohl definierten phasenreinen M1-
MoVTeNbOx-Katalysatoren Die Stabilitaumlt der phasenreinen M1-Katalysatoren unter
verschiedenen Reaktionsbedingungen (in Wasserdampf wasserdampffrei netto-
reduzierende stoumlchiometrische und netto-oxidierende Feed-Zusammensetzung) konnte in
In-situ-XRD-Experimenten bewiesen werden Da die Festkoumlrperstruktur homogen ist und
bestaumlndig unter Reaktionsbedingungen kann die unterschiedliche Reaktivitaumlt des
heterogenen Katalysators allein durch seine Oberflaumlcheneigenschaften bestimmt werden
welche wiederum stark vom chemischen Potential der Gasphase abhaumlngen
Es wurden kinetische Studien zu den Reaktionsparametern Temperatur Wasserdampf-
anteil und Redoxpotential durchgefuumlhrt wobei die Systeme unter allen Bedingungen
stabile Katalysatorleistungen aufwiesen Zyklische Experimente zeigten die Reversibilitaumlt
des Umsatz- und Selektivitaumltsruumlckgangs sowohl unter wasserfreiem als auch
reduzierendem Feed Zudem konnten in den Katalysetests Unterschiede in den
Reaktivitaumlten von bis zu 5 Groumlszligenordnungen ermittelt werden mit Acrolein gtgt Propylen
gt Propan gtgt CO-Oxidation~Wassergas-Shift Die bestimmte Oxidationsaktivitaumlt von CO
war vernachlaumlssigbar klein was die Bildung von CO und CO2 auf zwei voneinander
unabhaumlngigen Reaktionspfaden suggeriert Uumlber eine stufenweise Zufuhr von Sauerstoff
konnte eine Steigerung der katalytischen Aktivitaumlt um 5 im Vergleich zum
konventionellen einstufigen Reaktor erreicht werden Die Versuche im zweistufigen
Reaktor zeigten auch dass der phasenreine M1-Katalysator in N2O nicht reoxidiert
Weiterhin konnte unter Zugabe von Propylen im zweistufigen Reaktor eine teilweise
kompetitive Adsorption zu Propan an die aktiven Zentren des Katalysators beobachtet
werden Im Gegensatz dazu stand die Adsorption von CO und CO2 nicht in Konkurrenz
mit der Adsorption von Edukten oder Zwischenprodukten
Die kinetischen Untersuchungen der im Gegensatz zu den meisten Systemen in der
Literatur wohl definierten strukturstabilen M1-MoVTeNbOx-Katalysatoren koumlnnten
einen entscheidenden Beitrag zum Verstaumlndnis von Kinetik und Reaktionsmechanismus
der Propanoxidation leisten
vi
Table of contents
AcknowledgementsDanksagung helliphelliphelliphelliphelliphelliphelliphelliphelliphelliphelliphelliphelliphelliphelliphelliphelliphellipi Eidesstattliche Versicherunghelliphelliphelliphelliphelliphelliphelliphelliphelliphelliphelliphelliphelliphelliphelliphelliphelliphelliphelliphelliphelliphellipiii Abstract helliphelliphelliphelliphelliphelliphelliphelliphelliphelliphelliphelliphelliphelliphelliphelliphelliphelliphelliphelliphelliphelliphelliphelliphelliphelliphelliphelliphelliphellipiv
Zusammenfassung helliphelliphelliphelliphelliphelliphelliphelliphelliphelliphelliphelliphelliphelliphelliphelliphelliphelliphelliphelliphelliphelliphelliphelliphelliphellipv
Table of contents helliphelliphelliphelliphelliphelliphelliphelliphelliphelliphelliphelliphelliphelliphelliphelliphelliphelliphelliphelliphelliphelliphelliphelliphelliphelliphellipvi
Chapter 1 Introduction and motivation helliphelliphelliphelliphelliphelliphelliphelliphelliphelliphelliphelliphelliphelliphelliphelliphellip1 11 Introduction helliphelliphelliphelliphelliphelliphelliphelliphelliphelliphelliphelliphelliphelliphelliphelliphelliphelliphelliphelliphelliphelliphelliphelliphelliphelliphellip1 12 Overview on the literature results helliphelliphelliphelliphelliphelliphelliphelliphelliphelliphelliphelliphelliphelliphelliphelliphelliphellip3
121 The selective oxidation of propylene helliphelliphelliphelliphelliphelliphelliphelliphelliphelliphelliphelliphellip3 122 Oxidative dehydrogenation of propane helliphelliphelliphelliphelliphelliphelliphelliphelliphelliphelliphelliphellip8 123 The direct oxidation of propane to acrylic acid helliphelliphelliphelliphelliphelliphelliphelliphelliphellip13 1231 Generalities helliphelliphelliphelliphelliphelliphelliphelliphelliphelliphelliphelliphelliphelliphelliphelliphelliphelliphelliphellip13
1232 Identification of propane selective oxidation pathways helliphelliphellip14 1233 Active sites on MoVTeNbOx catalysts helliphelliphelliphelliphelliphelliphelliphellip20 1234 The effect of acid-base character of the catalyst helliphelliphelliphellip hellip24 1235 The effect of steam helliphelliphelliphelliphelliphelliphelliphelliphelliphelliphelliphelliphelliphelliphelliphellip25 1236 The effect of redox potential of gas phase and oxygen specieshellip27
124 Reactor designs operation modes helliphelliphelliphelliphelliphelliphelliphelliphelliphelliphelliphelliphelliphelliphellip31 1241 Conventional laboratory scale reactors helliphelliphelliphelliphelliphelliphelliphelliphelliphellip31 1242 Catalytic membrane- and multi-stage reactor designs helliphelliphelliphellip33
125 Reaction kinetics helliphelliphelliphelliphelliphelliphelliphelliphelliphelliphelliphelliphelliphelliphelliphelliphelliphelliphelliphelliphelliphellip37 13 Motivation helliphelliphelliphelliphelliphelliphelliphelliphelliphelliphelliphelliphelliphelliphelliphelliphelliphelliphelliphelliphelliphelliphelliphelliphelliphelliphelliphellip38 References Chapter 1 helliphelliphelliphelliphelliphelliphelliphelliphelliphelliphelliphelliphelliphelliphelliphelliphelliphelliphelliphelliphelliphelliphelliphelliphelliphellip40
Chapter 2 Experimental methods helliphelliphelliphelliphelliphelliphelliphelliphelliphelliphelliphelliphelliphelliphelliphelliphelliphelliphelliphellip44 21 Physico-chemical characterization of the catalysts helliphelliphelliphelliphelliphelliphelliphelliphelliphelliphelliphelliphellip44
211 Nitrogen physisorption helliphelliphelliphelliphelliphelliphelliphelliphelliphelliphelliphelliphelliphelliphelliphelliphelliphelliphelliphellip44 212 X-Ray Diffraction helliphelliphelliphelliphelliphelliphelliphelliphelliphelliphelliphelliphelliphelliphelliphelliphelliphelliphelliphelliphellip44 213 Scanning Electron Microscopy (SEMEDX) and Scanning Transmission Electron Microscopy (STEM) helliphelliphelliphelliphelliphelliphelliphelliphelliphelliphelliphelliphelliphellip45 214 X-Ray Photoelectron Spectroscopy (XPS) helliphelliphelliphelliphelliphelliphelliphelliphelliphelliphelliphellip45 215 Microcalorimetry helliphelliphelliphelliphelliphelliphelliphelliphelliphelliphelliphelliphelliphelliphelliphelliphelliphelliphelliphelliphelliphellip45
22 The experimental setup for propane oxidation helliphelliphelliphelliphelliphelliphelliphelliphelliphelliphelliphelliphelliphellip46 221 The gas dosing system helliphelliphelliphelliphelliphelliphelliphelliphelliphelliphelliphelliphelliphelliphelliphelliphelliphelliphelliphellip46 222 Reactor tube characteristics helliphelliphelliphelliphelliphelliphelliphelliphelliphelliphelliphelliphelliphelliphelliphelliphelliphellip48 223 Estimation of the Weisz-number the Thiele modulus and the effectiveness factor helliphelliphelliphelliphelliphelliphelliphelliphelliphelliphelliphelliphelliphelliphelliphelliphelliphelliphelliphelliphelliphelliphellip51 224 The two stage reactor system helliphelliphelliphelliphelliphelliphelliphelliphelliphelliphelliphelliphelliphelliphelliphelliphellip52 225 The analytical system helliphelliphelliphelliphelliphelliphelliphelliphelliphelliphelliphelliphelliphelliphelliphelliphelliphelliphelliphellip55 226 Calibration of the GC-MS helliphelliphelliphelliphelliphelliphelliphelliphelliphelliphelliphelliphelliphelliphelliphelliphelliphellip57 227 Data analysis helliphelliphelliphelliphelliphelliphelliphelliphelliphelliphelliphelliphelliphelliphelliphelliphelliphelliphelliphelliphelliphellip59
23 Catalyst synthesis and characterization helliphelliphelliphelliphelliphelliphelliphelliphelliphelliphelliphelliphelliphelliphelliphelliphellip61
vii
231 The synthesis of phase pure M1 MoVTeNbOx catalyst helliphelliphelliphelliphelliphelliphellip61 References Chapter 2 helliphelliphelliphelliphelliphelliphelliphelliphelliphelliphelliphelliphelliphelliphelliphelliphelliphelliphelliphelliphelliphelliphelliphelliphelliphellip63
Chapter 3 Structural stability of the M1 MoVTeNbOx catalyst under
propane oxidation conditions helliphelliphelliphelliphelliphelliphelliphelliphelliphelliphelliphelliphelliphelliphelliphelliphelliphelliphelliphelliphelliphellip65
31 Abstract helliphelliphelliphelliphelliphelliphelliphelliphelliphelliphelliphelliphelliphelliphelliphelliphelliphelliphelliphelliphelliphelliphelliphelliphelliphelliphelliphelliphellip65 32 Introduction helliphelliphelliphelliphelliphelliphelliphelliphelliphelliphelliphelliphelliphelliphelliphelliphelliphelliphelliphelliphelliphelliphelliphelliphelliphelliphelliphellip65 33 In-situ XRD study on the effect of steam and oxygenhelliphelliphelliphelliphelliphelliphelliphelliphelliphelliphellip68 34 STEM analysis of the catalyst before and after the in-situ XRD experiment helliphelliphellip72 35 Conclusions helliphelliphelliphelliphelliphelliphelliphelliphelliphelliphelliphelliphelliphelliphelliphelliphelliphelliphelliphelliphelliphelliphelliphelliphelliphelliphelliphellip75 References Chapter 3 helliphelliphelliphelliphelliphelliphelliphelliphelliphelliphelliphelliphelliphelliphelliphelliphelliphelliphelliphelliphelliphelliphelliphelliphelliphellip76
4 Kinetic studies of propane oxidation to acrylic acid on a phase-pure
MoVTeNbOx catalyst helliphelliphelliphelliphelliphelliphelliphelliphelliphelliphelliphelliphelliphelliphelliphelliphelliphelliphelliphelliphelliphelliphelliphelliphellip77
41 Abstract helliphelliphelliphelliphelliphelliphelliphelliphelliphelliphelliphelliphelliphelliphelliphelliphelliphelliphelliphelliphelliphelliphelliphelliphelliphelliphelliphelliphellip77 42 Kinetic studies on phase-pure M1 MoVTeNbOx helliphelliphelliphelliphelliphelliphelliphelliphelliphelliphelliphelliphellip77
421 Variation of the contact time and temperature helliphelliphelliphelliphelliphelliphelliphelliphelliphelliphellip78 422 Variation of the steam content helliphelliphelliphelliphelliphelliphelliphelliphelliphelliphelliphelliphelliphelliphelliphelliphellip81 423 Variation of the propane content helliphelliphelliphelliphelliphelliphelliphelliphelliphelliphelliphelliphelliphelliphellip88 424 Variation of the oxygen content helliphelliphelliphelliphelliphelliphelliphelliphelliphelliphelliphelliphelliphelliphelliphellip90 425 Propylene oxidation helliphelliphelliphelliphelliphelliphelliphelliphelliphelliphelliphelliphelliphelliphelliphelliphelliphelliphelliphelliphellip93 426 Acrolein oxidation helliphelliphelliphelliphelliphelliphelliphelliphelliphelliphelliphelliphelliphelliphelliphelliphelliphelliphelliphelliphellip98 427 CO oxidation and water gas shift reaction helliphelliphelliphelliphelliphelliphelliphelliphelliphelliphelliphellip100 428 Comparison of the reactivity of propane propylene acrolein and carbon monoxide oxidation reactions helliphelliphelliphelliphelliphelliphelliphelliphelliphelliphelliphelliphelliphelliphelliphellip104
43 Two-stage reactor used as a distributor of oxidizing and reducing gases helliphelliphelliphellip106 431 Addition of O2 and N2O helliphelliphelliphelliphelliphelliphelliphelliphelliphelliphelliphelliphelliphelliphelliphelliphelliphelliphellip107 432 Addition of propylenehelliphelliphelliphelliphelliphelliphelliphelliphelliphelliphelliphelliphelliphelliphelliphelliphelliphelliphellip 113 433 Addition of CO helliphelliphelliphelliphelliphelliphelliphelliphelliphelliphelliphelliphelliphelliphelliphelliphelliphelliphelliphelliphelliphellip116 434 Addition of CO2 helliphelliphelliphelliphelliphelliphelliphelliphelliphelliphelliphelliphelliphelliphelliphelliphelliphelliphelliphelliphelliphellip117
44 Conclusions helliphelliphelliphelliphelliphelliphelliphelliphelliphelliphelliphelliphelliphelliphelliphelliphelliphelliphelliphelliphelliphelliphelliphelliphelliphellip119 References Chapter 4 helliphelliphelliphelliphelliphelliphelliphelliphelliphelliphelliphelliphelliphelliphelliphelliphelliphelliphelliphelliphelliphelliphelliphelliphellip120 Chapter 5 Post synthesis treatment of the phase-pure M1 MoVTeNbOx catalyst122
511 Abstract helliphelliphelliphelliphelliphelliphelliphelliphelliphelliphelliphelliphelliphelliphelliphelliphelliphelliphelliphelliphelliphelliphelliphelliphelliphelliphelliphellip122 512 Introduction helliphelliphelliphelliphelliphelliphelliphelliphelliphelliphelliphelliphelliphelliphelliphelliphelliphelliphelliphelliphelliphelliphelliphelliphelliphellip122 52 Modifying agents and procedure helliphelliphelliphelliphelliphelliphelliphelliphelliphelliphelliphelliphelliphelliphelliphelliphelliphelliphellip124 53 Characterization of the modified samples helliphelliphelliphelliphelliphelliphelliphelliphelliphelliphelliphelliphelliphelliphellip127
531 N2 physisorption helliphelliphelliphelliphelliphelliphelliphelliphelliphelliphelliphelliphelliphelliphelliphelliphelliphelliphelliphelliphellip127 532 X-ray diffraction helliphelliphelliphelliphelliphelliphelliphelliphelliphelliphelliphelliphelliphelliphelliphelliphelliphelliphelliphelliphellip127 533 SEMEDX helliphelliphelliphelliphelliphelliphelliphelliphelliphelliphelliphelliphelliphelliphelliphelliphelliphelliphelliphelliphelliphelliphelliphellip128 534 XAS and XPS helliphelliphelliphelliphelliphelliphelliphelliphelliphelliphelliphelliphelliphelliphelliphelliphelliphelliphelliphelliphelliphellip131 535 Microcalorimetry helliphelliphelliphelliphelliphelliphelliphelliphelliphelliphelliphelliphelliphelliphelliphelliphelliphelliphelliphelliphellip134
54 Catalytic experiments helliphelliphelliphelliphelliphelliphelliphelliphelliphelliphelliphelliphelliphelliphelliphelliphelliphelliphelliphelliphelliphelliphellip141 541 Propane oxidation helliphelliphelliphelliphelliphelliphelliphelliphelliphelliphelliphelliphelliphelliphelliphelliphelliphelliphelliphelliphellip141 542 Kinetic analysis of propane oxidation over the modified catalysts helliphellip144
viii
543 Propylene oxidation helliphelliphelliphelliphelliphelliphelliphelliphelliphelliphelliphelliphelliphelliphelliphelliphelliphelliphelliphellip148 544 CO oxidation and water gas shift reaction helliphelliphelliphelliphelliphelliphelliphelliphelliphelliphelliphellip150
55 Conclusions helliphelliphelliphelliphelliphelliphelliphelliphelliphelliphelliphelliphelliphelliphelliphelliphelliphelliphelliphelliphelliphelliphelliphelliphelliphelliphellip153 References Chapter 5 helliphelliphelliphelliphelliphelliphelliphelliphelliphelliphelliphelliphelliphelliphelliphelliphelliphelliphelliphelliphelliphelliphelliphelliphellip155 Chapter 6 Exploratory experiments helliphelliphelliphelliphelliphelliphelliphelliphelliphelliphelliphelliphelliphelliphelliphelliphelliphellip157
61 Introduction helliphelliphelliphelliphelliphelliphelliphelliphelliphelliphelliphelliphelliphelliphelliphelliphelliphelliphelliphelliphelliphelliphelliphelliphelliphelliphellip157 62 Propane oxidation reactivity on different Mo and V based catalysts helliphelliphelliphelliphellip158 63 Propylene oxidation reactivity on different Mo and V based catalysts helliphelliphelliphellip166 64 Exploratory reaction pathway analysis of propane oxidation on phase-pure M1 catalyst helliphelliphelliphelliphelliphelliphelliphelliphelliphelliphelliphelliphelliphelliphelliphelliphelliphelliphelliphelliphelliphellip169 65 Exploratory kinetic modeling on propane oxidation on phase-pure MoVTeNbOx catalyst helliphelliphelliphelliphelliphelliphelliphelliphelliphelliphelliphelliphelliphelliphelliphelliphelliphelliphelliphelliphelliphelliphellip178
651 The effect of temperature helliphelliphelliphelliphelliphelliphelliphelliphelliphelliphelliphelliphelliphelliphelliphelliphelliphellip178 652 The effect of steam helliphelliphelliphelliphelliphelliphelliphelliphelliphelliphelliphelliphelliphelliphelliphelliphelliphelliphelliphelliphellip180
References Chapter 6 helliphelliphelliphelliphelliphelliphelliphelliphelliphelliphelliphelliphelliphelliphelliphelliphelliphelliphelliphelliphelliphelliphelliphelliphellip182 General Conclusions and Outlook helliphelliphelliphelliphelliphelliphelliphelliphelliphelliphelliphelliphelliphelliphelliphelliphelliphelliphellip184
Appendices helliphelliphelliphelliphelliphelliphelliphelliphelliphelliphelliphelliphelliphelliphelliphelliphelliphelliphelliphelliphelliphelliphelliphelliphelliphelliphelliphelliphellip189
Appendix 51 Reaction networks of propane oxidation over the modified catalystshellip 189 Appendix 61 Modeling the delplots for a reaction pathway that contains multiple rank product helliphelliphelliphelliphelliphelliphelliphelliphelliphelliphelliphelliphelliphelliphelliphelliphelliphelliphellip193 Appendix 62 Program for implementing Model 1 in Berkeley Madonna helliphelliphelliphellip198 Appendix 63 The physical properties of the gas mixtures with different steam contents helliphelliphelliphelliphelliphelliphelliphelliphelliphelliphelliphelliphelliphelliphelliphelliphelliphelliphelliphelliphelliphellip199 Acknowledgements for permission to reprint published materials helliphelliphelliphelliphelliphellip201 List of abbreviations helliphelliphelliphelliphelliphelliphelliphelliphelliphelliphelliphelliphelliphelliphelliphelliphelliphelliphelliphelliphelliphelliphelliphellip202 List of figureshelliphelliphelliphelliphelliphelliphelliphelliphelliphelliphelliphelliphelliphelliphelliphelliphelliphelliphelliphelliphelliphelliphelliphelliphelliphelliphellip204 List of tableshelliphelliphelliphelliphelliphelliphelliphelliphelliphelliphelliphelliphelliphelliphelliphelliphelliphelliphelliphelliphelliphelliphelliphelliphelliphelliphelliphellip207
1
Chapter 1 Introduction and motivation
11 Introduction
Based on economical and ecological considerations many attempts have been undertaken
during the last decades to replace petroleum by other feedstock for producing chemicals
and polymers The use of C2-C4 components of the natural gas for this purpose is one
option [1-3]
Acrylic acid and acrylonitrile are very important monomers The global crude acrylic
acid market reached around 32 million tons by the end of 2005 and the demand increased
steadily with ca 4year Esterification of crude acrylic acid yields acrylates which are
used to produce various homo- and copolymers by emulsion polymerization with
manifold applications ranging from coatings (ca 44 of the total market) adhesives (ca
19 of the total market) and fibres to textiles (ca 7 of the total market) Acrylic acid
in its glacial form is used to produce polyacrylic acid and polyacrylates for
superabsorbents (ca 11 of the total market) inks detergents and dispersants (ca 8 of
the total market)
Acrylic acid has been produced in commercial processes starting from acetylene
ethylene or propylene respectively In the last century acrylic acid was mainly
manufactured by means of an acetylene-based process (Reaction 111) developed by
Reppe in the 1930acutes in Germany The process was commercialized by the BASF in
Ludwigshafen Germany in the 1950acutes
HCequivCH + CO + H2O rarr CH2=CHCOOH (Reaction 111)
This process was operated at 200degC and 80 bar applying a catalyst that contains a
carbonyl forming metal such as nickel The plant in Ludwigshafen was closed in the
1990acutes with the start-up of a new propylene-based plant in Antwerp Belgium
The direct oxidation of propylene to acrylic acid was developed by Nippon Shokubai
using catalysts like Mo-W-Te-Sn-Co-O or Nb-W-Co-Ni-Bi-Fe-Mn-Si-Zr-O at 325-350ordmC
with 65 and 75 yield respectively [2-4] The reaction is very exothermic
2
(∆H=minus598kJmol) The process requires maintaining the temperature between 325 and
350degC in order to attain an economically reasonable propylene conversion but under
these conditions significant total oxidation occurs which causes a decrease of selectivity
Moreover the catalyst shows significant deactivation For these reasons the process
turned out to be uneconomic
Nowadays a two stage oxidation process starting from propylene is exclusively used
worldwide In the first step propylene is oxidized to acrolein at 350plusmn50degC over promoted
molybdenum-bismuth systems (Reaction 112)
H2C=CHCH3 + O2 rarr H2C=CHCHO + H2O ∆H = - 3408 kJmol (Reaction 112)
Promoted molybdenum-vanadium systems and temperatures around 210-250degC are used
to oxidize acrolein to acrylic acid (Reaction 113)
H2C=CHCHO + 12O2 rarr H2C=CHCOOH ∆H = - 2541 kJmol (Reaction 113)
Both of these steps are rather exothermic In the first step a yield of 90 acrolein can be
attained During the second step a yield of 97 acrylic acid can be reached The overall
acrylic acid yield is around 87
Upcoming new process developments include
bull biotransformation processes (eg using lactic acid as an intermediate)
bull oxidation of propane via propylene (oxidative dehydrogenation) and acrolein
(three stage process) or
bull direct oxidation of propane to acrylic acid in one step
The price of propylene is 1105 euroton [5] while the price of acrylic acid is currently
1825euroton [6] On the other hand the propane is much cheaper than propylene it costs
ca 345 euroton [6] Because the feedstock cost accounts about 80 of the profited cost the
3
realization of the direct (one step) oxidation of propane to acrylic acid would be
economically very important [1 2]
Due to the apparent attractiveness with respect to potential utilization of the low cost
propane feedstock considerable research activities were initiated in the last two decades
for the selective oxidation of propane to acrylic acid However propane is less reactive
than propylene therefore higher temperatures or more active catalysts are needed to
activate it The increase of temperature causes the increase of conversion but usually also
enhances the formation of side products (propionic and acetic acids) andor total
combustion products (CO and CO2) which results in the decrease of selectivity and yield
of the process Hence the development of an active and selective catalyst for the direct
(one-step) transformation of propane to acrylic acid is still a challenging task [1-3]
Owing to the price difference between propane and propylene and the high performance
of the two-stage propylene oxidation process a yield of 50-60 would be needed for the
one step propane oxidation process in order to replace the actual process
12 Overview on the literature results
The literature overview consists of five main parts In the first part the propylene
selective oxidation is presented which is industrially applied In the second part the main
results concerning propane oxidative dehydrogenation are summarized The third part
concentrates on the one-step propane oxidation reaction Here the current knowledge
from literature about the reaction pathways active sites and effects of the operating
variables (acid-basic properties of the catalyst feed composition) are presented In the
last two parts reactor design and reaction kinetic considerations are summarized The
motivations for the present study are outlined at the end of this chapter
121 The selective oxidation of propylene
The oxidation of propylene to acrolein has been studied on various catalysts mainly on
bismuth molybdates Cu2O and multi-component metal oxides (ie SbSnO CoMoTeO
NiMoTeO VPTeO etc)
4
Based on structural considerations kinetic studies IR and Raman spectroscopic
investigations and reactivity studies using isotopically labeled feeds and intermediates
the organic reaction mechanism of propylene oxidation over bismuth molybdates has
been proposed according to the scheme depicted in Figure 121 [7-9] The involvement
of lattice oxygen atoms was postulated
Figure 121 Propylene oxidation and ammoxidation mechanism over bismuth molybdate catalysts as
proposed by Grasselli et al [9]
According to the reaction mechanism depicted on Figure 121 propylene is chemisorbed
on di-oxo molybdenum sites with molybdenum in the highest oxidation state The C-H
bonds in the methyl group of chemisorbed propylene are activated by withdrawing
electron density towards the molybdenum atom The rate determining step is the
abstraction an α-methyl hydrogen atom as a H radical˙ by an adjacent Bi3+ site forming
an allyl radical adsorbed as a π complex on the Mo di-oxo species (homolytic C-H bond
splitting) Oxygen insertion and abstraction of the second hydrogen atom occur on
adjacent di-oxo Mo sites The metal-oxo group attacks the allyl intermediate forming a σ-
5
bonded allyl species The latter species is transformed to acrolein by abstraction of a
further hydrogen atom The surface OH groups formed by hydrogen abstraction then
react to form water which is desorbed Reoxidation of the reduced molybdenum and
bismuth sites by O2 was suggested to close the catalytic cycle The adsorption and
dissociation of gaseous oxygen was supposed to occur on bismuth sites It was also
claimed that the reoxidation sites should be located in the vicinity of the catalytically
active centers to achieve high activity (this is referred to as ldquophase cooperationrdquo concept)
[10] The proper BiMo stoichiometry exists in the α- and β-phase [9] which are the most
effective phases among the numerous Bi-molybdate phases that exist [11] It was also
claimed that high selectivity requires isolation of the active sites from each other (this is
referred to as ldquosite isolationrdquo concept) [10]
Figure 122 Mechanism of propylene oxidation by consecutive acid-base and redox steps as proposed by
Bettahar et al [12]
6
According to Bettahar et al [12] the reaction scheme demonstrated in Figure 122 may
also be interpreted in terms of proton abstraction on basic Bi-O groups leading to a
symmetric π-allyl anionic intermediate coordinated to the molybdenum di-oxo species
(heterolytic C-H bond splitting) The allyl-anion is subsequently oxidized to a π-allyl
cation on a redox active site Then the nucleophilic Mo-O group attacks the π-allyl cation
and transforms it into σ-allylic alkoxide This unsaturated oxygenated intermediate loses
another H atom in a subsequent redox step and it is transformed into acrolein [12]
It was claimed that
bull The reaction steps are sequential ones not simultaneous concerted steps However
Bettahar et al pointed out that the mechanism may also occur through a SN2 type
mechanism by nucleophilic attack of the O2- anion to the C=C bond concerted with
hydride abstraction from the CH3 group [12]
bull The reaction occurs on a specific ensemble BiMo-site there is no movement
desorptionre-adsorption of the intermediate species
bull The intermediates that appear after the rate determining step are transformed
instantly into other intermediates or desorbed (the surface coverage of adspecies
produced after the rate determining step is negligible)
bull Gaseous O2 dissociates rapidly and re-oxidizes the vacancy without forming
adsorbed oxygen species [3]
The theoretical study on the propylene oxidation mechanism over Bi-Mo catalysts carried
out by Jang et al supported the experimental observations [13] In order to determine the
possible reaction routes the thermodynamic quantities such as C-H bond dissociation
enthalpies and free enthalpies were calculated using the density functional theory (DFT)
The geometry of each considered structure was optimized The vibrational frequencies
were calculated from the Hessian matrices and used for calculation of zero-point energies
and thermodynamic quantities (enthalpy and free enthalpy) of the reaction The
calculations of C-H bond dissociation enthalpies and free enthalpies revealed that the
weakest bond in the propylene molecule is the methylene (Cα-Hα) bond (∆G=+2883
7
kJmol) In order to determine the olefin activating site the α-hydrogen atom abstracting
ability of both Mo3O9 and Bi4O6 clusters was investigated All of the O-atoms in the
Bi4O6 structure are equivalent however in Mo3O9 cluster there are two types of O atoms
bridging (Mo-O-Mo) and terminal ones (M=O) The free enthalpy of Cα-Hα activation on
the two different Mo sites was calculated to be ∆G=+1791 kJmol and ∆G=+1134
kJmol respectively depending on whether the abstracted H-atom is linked to the
terminal oxo-group (M=O) or to the bridging oxygen atom (Mo-O-Mo) respectively
Therefore the bond activation by the terminal M=O group is thermodynamically favored
This is in accordance with the conclusions derived from the experimental observations
However in both cases the H-atom abstraction step is much too endothermic The C-H
bond cleavage on the Bi3+ site is even more endothermic probably because the linking of
hydrogen atom to the bridging O-atom leads to Bi-O cleavage and the resulting structure
is not favorable In turn the dissociative chemisorption of O2 oxidizes the Bi3+ site to Bi5+
(Reaction 121) on which the hydrogen atom abstraction is more favorable (Reaction
122)
[ ] )221 (Re 510
)121 (Re 4154 2
1
22746374
74264
actionmolkJGCHCHCHHOBiHCOBi
actionmolkJGOBiOOBi
+=∆minus=+rarr+
+=∆rarr+
minus
The dissociative chemisorption of O2 was found to be enhanced by the presence of
Fe2+Fe3+ redox couple This is the explanation of the outstanding performance of Mo-Bi-
Co-Fe-O catalyst on which 90 conversion was attained compared to only 20
conversion on binary bismuth-molybdates
Furthermore the calculations revealed that
bull the allyl species is coordinated preferably to the Mo=O group
bull the oxygen insertion occurs at the Mo=O group to which the allyl species
is coordinated
bull the second H-atom abstraction occurs at the adjacent Mo=O group and
subsequently the acrolein formed is desorbed
8
bull after the desorption of the water molecule the reduced molybdenum site is
re-oxidized by O2 in an exothermic step
In summary the olefin activation was suggested to occur on the Bi-site while the further
chemical transformations occur on the Mo-sites
122 Oxidative dehydrogenation of propane
Chen et al carried out a kinetic analysis and isotopic tracer studies in order to identify the
elementary steps in the ODH of propane [14 15] Three kinds of ZrO2 supported MoOx
catalysts were used with different MoO3 loadings and thermal pretreatment conditions
(Table 121)
Table 121 The characteristics of catalysts studied in [14 ]
catalyst MoO3 loading
(wt )
temperature of the
thermal treatment (K)
structure of the
Mo-species
MoOxZrO2 11 773 MoOx oligomers
MoO3ZrO2 37 673 bulk MoO3
ZrMo2O8ZrO2 37 873 bulk ZrMo2O8
The catalytic tests were carried out in a quartz micro-reactor using small amount of
catalyst (0020-0100 g) Varying the flow rate the conversions were held at low values
below 2 with respect to propane and 20 with respect to O2 The chemical and isotopic
composition of products was analyzed using a GC-MS equipment It was found that
propylene is the most abundant product The rate of propylene combustion was found to
be 80 times higher than the rate of propane combustion The rate law of propane
oxidative dehydrogenation was found to be the same for all three catalysts This fact
suggested a similar mechanism A first order kinetics with respect to propane and zeroth
order with respect to oxygen was observed when steam was not present in the initial gas
mixture The presence of steam inhibited the propylene production Based on the
9
observations the following mechanism for propane ODH over the ZrO2 supported MoOx
catalysts was proposed
bull The first step (Reaction 123) is the rapid non-dissociative adsorption of
propane by interaction with lattice oxygen atoms (OL)
bull The second step (Reaction 124) is the C-H bond activation by H-atom
abstraction from the adsorbed propane using a neighboring OL A mixture
of C3H8 and C3D8 underwent oxidative dehydrogenation without forming
C3H8-xDx mixed isotopomers suggesting that the steps involving C-H bond
activation are irreversible
bull In the third step (Reaction 125) a hydrogen atom is removed from the
methyl group propylene and a surface hydroxyl group is formed
bull Two neighboring surface hydroxyl groups are recombining in the fourth
step (Reaction 126) water is desorbed and a vacancy is formed
bull The reoxidation of two neighboring vacancies by an oxygen molecule
(Reaction 127) was suggested to close the catalytic cycle
)721 Re(
)621 Re(
)521 Re(
)421 (Re
)321 (Re
)(2
)(2)()(
)()(63)(73
)()(73)(83
)(83)(83
actionOOO
actionOOHOHOH
actionOHHCOHC
actionOHOHCOOHC
actionOHCOHC
LLgas
Lgasadsads
adsgasads
adsadsLads
adsLgas
+rarrloz+loz+
loz++hArr+
+rarr
+rarr+
hArr+
Reactions of 18O2C3H8 on supported Mo16Ox species lead to the preferential initial
appearance of lattice 16O atoms in H2O CO and CO2 products indicating that the lattice
oxygen is required for C-H bond activation and for the ultimate oxidation of the adsorbed
products The kinetic isotopic effect of CH3CD2CH3 with respect to CH3CH2CH3 is 17
which is slightly smaller than the value of 23 obtained when using CD3CD2CD3 and
CH3CH2CH3 This finding was interpreted as both methyl and methylene groups can be
involved in the rate determining step required for propane activation
10
Based on the inhibitory effect of steam on propylene production it was assumed that the
recombination of the two OH-groups (reaction step126) is reversible The isotopic tracer
study supported this assumption as H-D exchange occurs readily between C3H6 and D2O
or C3D6 and H2O suggesting that OH recombination steps are reversible and quasi-
equilibrated
When a mixture of 18O and 16O was used as oxidant the 18O16O mixed isotopomer was
not detected in the gas phase suggesting an irreversible O2 dissociation step for the
reoxidation of the reduced active site However it is notable that the reoxidation of the
reduced site can not occur in a single step because it would require a four electron
transfer from two reduced centers Moreover statistically it is not very probable that
there are two reduced centers (vacancies) within the bond length of the oxygen molecule
Certainly the electron transfer and breaking of the O-O bond should occur in consecutive
steps
Kinetic and isotopic studies of propane ODH over ZrO2 supported VOx catalysts lead to
the same observations described above [14-16] First order kinetics with respect to C3H8
was found on both the supported and bulk catalysts when steam was not present in the
initial gas mixture The presence of water clearly inhibited the propane ODH and
changed the reaction order with respect to propane and oxygen Without H2O in the
initial gas mixture zero order kinetics was observed with respect to O2 In presence of
steam the rate of propylene formation was reduced considerably (by about 30) and the
partial reaction order of O2 was found to be greater than zero in this case The elementary
steps were considered to be identical with those for the ODH of propane over ZrO2
supported MoOx catalyst In this case the lattice oxygen OL was designated for V=O or
V-O-V structures OH(ads) stands for V-O-H terminal hydroxyl group while the vacancy
(loz) corresponding the reduced redox site (V4+ or V3+) [16] Kinetic isotopic effect
measurements demonstrated that the methylene C-H group is activated first
Jibril studied the kinetics of ODH of propane on alumina supported metal-oxides rare
earth metal oxides and metal phosphates [17] The temperature dependence of propane
conversion was investigated activation energies (EA) and logarithm of pre-exponential
11
factors (lnA) were evaluated A compensation effect was noted as significant linear
correlation was found between the EA and lnA within the three groups of studied
catalysts The existence of the compensation effect in reactions catalyzed by similar
catalysts suggests the same mechanism within the three groups of catalysts
Fu et al reported a detailed DFT study on the mechanism of propane activation over
molybdenum oxide catalyst [18] The Mo3O9 cluster was chosen as a model for the
catalyst Two basis sets (6-31G and 6-31G) were tested for geometry optimization
No significant changes were found between the modeled geometries 6 possible ways of
C-H bond activation were considered
bull two kinds of 2+2 pathways which involve the homolytic dissociation of
the C-H bond at a Mo=O group leading to carbide or hydride
bull 3+2 (homolytic dissociation on a O=Mo=O group) and 5+2 (homolytic
dissociation on a O=Mo-O-Mo=O group) paths both of them lead to
hydroxyl- and alkoxy species directly
bull direct O atom insertion by a M=O group in the C-H bond giving an
alcohol
bull the 2+4 pathway involves linking of both the methyl and methylene C-H
bonds simultaneously to the M=O group
bull hydrogen atom abstraction that may occur theoretically either from methyl
or methylene group leading to n-propyl or iso-propyl radical
Figure 123 Some examples of the possible transitional states of hydrogen atom abstraction according
to[18] The numbers on the figures correspond to the calculated bond lengths
12
17 different transitional states were taken into account The free enthalpy of activation for
each case (∆G) was estimated at 688 K and the rate constants were evaluated according
to the Eyring equation In order to compare directly the calculated and the experimental
findings of the isotopic tracer studies reported by Chen et al [15] the kinetic isotopic
effect for each considered reaction pathway was also estimated using the transitional state
theory
The hydrogen abstraction pathways were considered to be one electron processes leading
to radicals The energy barriers for these pathways were found to be the lowest among the
considered ones This indicated that the probability of hydrogen atom abstraction is much
higher than the occurrence of other two-electron processes The propane molecule may
approach the Mo=O group in syn or anti position (Figure 123) Only one of the terminal
Mo=O group is involved in the process the another one is a spectator group
The calculated activation enthalpy values revealed that the anti-modes are favored
against the syn-modes by 251-293 kJmol (Table 122)
Table 122 The calculated thermodynamic quantities of the supposed hydrogen atom abstraction pathways in comparison with the experimentally determined values [18]
Type of C-H cleavage ∆∆∆∆H (kJmol) ∆∆∆∆S
(JmolmiddotK) ∆∆∆∆Hr (kJmol)
-CH2- syn 1640 -1059 1335
-CH3 syn 1803 -1004 1544
-CH2- anti 1351 -1197 1335
-CH3 anti 1548 -1230 1544
-CH2- experimental 1172 -1218 -
It was also pointed out that breaking the methylene C-H bond is more favorable than
breaking of the methyl C-H bond The difference of 163-197 kJmol in the activation
enthalpy could be assigned to the differences in bond strengths The reasonable
agreement between the calculated and experimental activation parameters corresponding
to the methylene C-H bond suggests that the theoretical description of the experimental
observation is good It is also notable that the calculation overestimated the kinetic
isotopic effect compared to the experimental data reported by Chen et al [15] but some
indications were found that both methyl and methylene hydrogen atoms are involved
13
123 The direct oxidation of propane to acrylic acid
1231 Generalities
Different types of catalysts were tested for the activation of propane The most efficient
catalyst class is represented by the systems based on reducible (typically transition) metal
oxides V2O5 and MoO3 are versatile catalysts for organic compound oxidation because
they loose oxygen reversibly [19] The most investigated catalytic materials within this
class are vanadium phosphorous oxides (VPO) heteropoly compounds (HPCs) and
multi-component mixed oxides (MMOs) [2-4] The performance of these catalysts in
terms of propane conversion selectivity and yield to acrylic acid is summarized in the
Table 123
Table 123 Optimized catalytic performance of VPO HPC and MMO catalyst systems for oxidation of propane to acrylic acid as summarized based on references [2] and [4]
Catalyst T(ordmC) XC3
()
SAA
()
YAA
()
VPO (PV=11) 420 46 32 147
VPO (PV=11) 400 23 48 112 VPO
001 Ce ndash VPO 390 28 68 188
H2(VO)05(22-bipy)PMo12O40 400 504 215 108
Nb(pyridine)-PMo11VO40 380 21 49 103 HPC
20 HxCu06Cr06PMoV2AsO40SiO2 390 38 39 148
MoV03Te023Nb012On 380 84 63 53 MMO
MoV03Te023Nb012On 380 80 60 48
Table 123 indicates that the highest conversions of propane and the highest selectivities
for acrylic acid were achieved on MoVTeNbOx catalysts originally patented by
Mitsubishi [20 21] This catalyst is also active and selective for propane ammoxidation
suggesting that there are some common steps in the partial oxidation and ammoxidation
reactions [2-4]
14
1232 Identification of propane selective oxidation pathways
The early ideas about the mechanism of the propane selective oxidation reaction were
summarized by Bettahar et al [12] The theoretical network of reaction steps in selective
oxidation of propane is shown in Figure 124 This reaction network was supported
mainly by thermodynamic considerations However the thermodynamic calculations on
the reaction enthalpy were performed at normal conditions and not reaction conditions
Too less catalytic and kinetic evidences were known for this reaction network
Figure 124 Reaction network of propane oxidation according to Bettahar et al [12]
Lin et al studied the reaction pathways of the selective oxidation of propane over a
MoVTeNbOx catalyst [22] They prepared the catalyst according to the method described
in the patent literature [20 21] The catalyst characterization indicated the following
composition MoV025Te018Nb009Ox (bulk composition determined by XRF) and
MoV03Te019Nb015Ox (surface composition determined by XPS) The BET surface area
-
+ frac12 O2
15
was 36 m2g while the mean pore diameter was found to be 180 Aring The SEM images
revealed primary sub-micron particles and their aggregates XRD peaks were found at
2Θ=224ordm 286ordm 366ordm 454ordm and 504ordm respectively which are in accordance with the
peaks reported by Ushikubo [20 21] The catalytic test was carried out at the reaction
temperature of 391ordmC with initial feed composition C3H8 air H2O = 3 50 47 vol at
GHSV=1200 h-1 Under these conditions 18 propane conversion was attained the
selectivity for acrylic acid was 26 and COx acetic acid and acetone were produced
with 54 8 and 1 selectivity respectively The presence of propylene and acrolein in the
outflow gas mixture was not observed
In order to elucidate the propane oxidation pathways the relative reactivities of oxidation
products and of potential intermediates were studied (Figure 125) The ranking order of
the reactivity was found to be propane ltlt acetic acid asymp acrylic acid lt propylene
ltacetone lt acrolein asymp isopropanol
Figure 125 The relative oxidative stability of several intermediates at different temperatures [22]
The acrolein acetone isopropanol and propylene were found to be very reactive at
around 390degC Based on this observation the authors argued that this is the reason why
these intermediates can not be detected during the partial oxidation of propane to acrylic
16
acid It is to be noted that the real reactivity of the isopropanol acrolein and acetone can
not be observed from the above plot because the conversions reach 100 at around
390degC
The product distribution upon oxidation of the above compounds was the following The
acetone oxidation over the catalyst produced acetic acid at lower temperatures and COx at
higher temperatures The oxidation of acrolein produced acrylic acid and COx At higher
temperatures a small amount of acetic acid was also detected The acetic acid was
believed to be a product of the oxidative degradation of acrylic acid
Figure 126 Oxidation pathways of propane according to [22]
A more complicated profile consisting of parallel and consecutive steps was found for
propylene oxidation at higher temperatures the propylenerarracroleinrarracrylic acid was
favored while at lower temperatures acetone and subsequently acetic acid were produced
in larger amounts
The isopropanol reacted also via two competing pathways the dehydration lead to
propylene while the oxidation produced acetone At higher temperatures the propylene
pathway was found to be favored and the selectivity to acrylic acid was higher in this
case
17
The product of oxidative degradation of acrylic acid was found to be acetic acid and COx
as also shown by Vitry et al [23] During the oxidation of acetic acid only carbon oxides
were detected
Based on these observations a reaction scheme of propane oxidation was proposed
(Figure 126) The pathways (a) and (c) leading to n-propanol and isopropanol are in
conflict with the experimental and theoretical findings [12-16] These alcohols were
believed to undergo dehydration to propylene and oxidation to the corresponding
carbonyl compounds and carboxylic acids respectively according to the above scheme
During the catalytic oxidation of propane however n-propanol propionaldehyde and
propionic acid were not detected at all Therefore path (a) was regarded as not to be
probable Path (b) is a direct oxidative dehydrogenation of propane to propylene
followed by oxidation to acrylic acid through acrolein The latter pathway was regarded
to be more likely because the product distribution patterns of propane and propylene
oxidation are similar while that of isopropanol are significantly different
Similar reactivity studies were undertaken by Luo et al including the oxidation of n-
propanol and propanal as potential intermediates [24] Basically the same reaction
pathway was proposed as the one shown above (Figure 126)
Based on gas phase analysis at different residence times the reaction sequence
propanerarrpropenerarracroleinrarracrylic acid has also been proposed on MoVSbNbOx
catalysts [25] The acetic acid obtained on these catalysts was assumed to be formed via
propenerarracetone The main function of water on MoVSbNbOx catalysts was assigned to
its role in preserving the metals in a partially reduced oxidation state [26]
Kinetic studies on the partial oxidation of propane to acrylic acid over egg-shell type
MoV033Te022Nb011Ox catalysts containing 10 to 20 active mass on spherical steatite
have been performed by Balcells et al and Griszligtede [27 28] From the characteristic
shapes of the selectivities vs propane conversion plots propene was considered to be the
only primary product which is in agreement with the previous studies The low
propylene concentrations observed in the gas phase was regarded to be the indication that
18
the oxidative dehydrogenation of propane is the rate determining step A simple system
of differential equations containing first order rate expressions with respect to the organic
compounds was set up However the carbon monoxide carbon dioxide and acetic acid
were considered as three carbon atom containing pseudo-products and merged under the
term ldquobyproductsrdquo Although the calculated results were in a good agreement with the
experimental data the model proposed by Griszligtede seems to be too abstract because it
assumes that the three byproducts are formed in a coupled reaction step
The reaction scheme of propene on the same catalyst was found to be more complex
including acrolein acetone and acetic acid as detectable intermediatesby-products The
model proposed for propylene oxidation was based the same assumption as the model
proposed for propane oxidation The influence of temperature oxygen concentration and
water content on propane oxidation was studied Only a small influence of the oxygen
concentration was observed Concerning the reactor operation a steam content of about
20-30 vol- was recommended
The reaction network of selective oxidation of propene on mixed oxide catalysts
(MoVNbO MoVSbO and MoVTeNbO) was also investigated by Concepcioacuten et al [29]
FTIR measurements of propylene adsorptiondesorption over these catalysts suggested
three different intermediates
bull a symmetric π-allylic species which is formed if α-hydrogen abstraction sites
(ie Sb3+ or Te4+) are present The π-allylic species represent the intermediate in
the selective oxidation of propylene to acrylic acid by a redox mechanism
bull an enolic-type intermediate in the hydrationoxidation of the olefin to form
acetone and acetic acid on Broslashnsted acid sites
bull a π-bonded propylene species interacting with Lewis acid sites which is regarded
as a precursor in the deep oxidation of propylene
Fushimi et al has carried out catalytic studies on MoV03Te023Nb017Ox over a wide range
of temperatures feed compositions and contact times [30] Steady-state (space velocity
19
and temperature variation) and non steady-state experiments (pulse-response temporal
analysis of the products) were carried out The temperature variation experiment was
done by increasing the reaction temperature up to 400degC followed by a controlled
cooling In this temperature programmed reaction complete oxygen conversion was
observed at around 400degC More important a hysteresis phenomenon of the product
yields was observed during the cooling when using stoichiometric and reducing feed
compositions The hysteresis phenomenon was accounted for the effect of nonlinearity of
the kinetics and adsorption-desorption of the intermediates and products However no
hysteresis was observed when using net oxidizing feed The apparent activation energies
of acrylic acid formation were determined to be 73 and 186 kJmol depending on feed
composition and contact time respectively
Based on transient experiments a complicated reaction network was proposed The main
reaction pathway consists of propanerarrpropylenerarracroleinrarracrylic acidrarrCO+CO2
steps The TAP experiments indicated that water reacts with the adsorbed acrolein to
form acrylic acid The unselective pathways corresponding to total oxidation of
propylene allylic intermediate and acrylic acid were proposed for the production of CO
CO2 and acetic acid Since no differentiation was made between the pathways leading to
these products the model has the same restrictions like the one proposed by Griszligtede [27
28]
The effect of CO2 initial concentration added to the initial feed was also studied in the
interval between 0 and 50 vol (Figure 127) The results revealed an approximately
linear increase of the acrylic acid yield with the initial CO2 content in the feed Without
experimental evidence the positive effect of the higher CO2 concentrations was
accounted for the adsorption of CO2 on the active sites andor formation of an
intermediate that favors the selective pathway
20
Figure 127 Effect of CO2 on the acrylic acid yield [30]
Redox pulse experiments on MoVTeNbOx carried out by Grasselli et al in absence of
O2 (gas) revealed that the oxidation of the propane occurs even under this condition The
catalyst remained in the reduced state without a structural collapse The reduced catalyst
could be re-oxidized in presence of O2 The authors claimed this finding as a
confirmation of the direct involvement of lattice oxygen in (amm)oxidation process [31]
1233 Active sites on MoVTeNbOx catalysts
MoVTeNbOx catalysts are generally composed of two crystalline phases [32]
- an orthorhombic active and selective phase (M1)
- an orthorhombic much less active but selective phase (M2)
Propane activation and high selectivities towards acrylic acid are generally attributed to
the presence of the orthorhombic M1 phase [33 34]
A synergistic effect in activity and selectivity for (amm)oxidation of propane was
claimed for the nano-scale mixture of M1 and M2 The synergistic effect was not
observed for physical mixtures of the phases (Table 124) [2 9 31] However it is to be
noted that the selectivities were compared at very different propane conversions
Moreover the M2 catalyst was tested at 410degC while the M1 and the phase mixture at
21
380degC It is well known that the selectivity depends on the conversion of propane
Therefore the conclusions concerning the synergistic effect are questionable
Table 124 Catalytic effect of the individual phases of the mixture in the propane partial oxidation [2]
Catalyst T(ordmC) XC3 () SAA ()
M1 380 279 52
M2 410 06 22
M1+M2 380 349 53
The function of the individual catalysts components has been assigned by Loacutepez-Nieto
according to the schema given in Figure 128 [35] The transformation of propane to
propylene was suggested to occur on the V=O adjacent to Mo or Nb-sites The further
oxidation of propylene to acrolein was believed to occur on Te-sites while the oxidation
of acrolein to acrylic acid on the V- or Nb-sites adjacent to Mo-site However the model
does not explain the formation of acetic acid CO and CO2 It is also notable that the
catalyst used by Loacutepez-Nieto was a phase mixture [35]
Figure 128 Reaction steps and nature of active and selective sites in the oxidation of propane to acrylic acid on MoVTeNbOx catalysts [35]
22
Three single-phase M1 catalysts having different elemental compositions MoVOx
MoVTeOx and MoVTeNbOx have been prepared hydrothermally by Ueda et al [34] On
the basis of the catalytic results in propane oxidation it was concluded that
1 crystallinity seems to be necessary for selective oxidation of propane to acrylic
acid
2 the propane molecule is oxidized to propene over surface active sites composed of
octahedrally coordinated Mo and V units located in the unique heptagonal
arrangement of the M1 structure
3 when Te is incorporated into the network the resulting catalyst becomes selective
for the formation of acrylic acid without changing intrinsic oxidation activity of
Mo and V sites
4 Nb prevents the over-oxidation of acrylic acid by its site isolation effect
Without experimental evidence the propane activating property of the M1 phase was
assigned by Grasselli et al to V5+ centers which favor the radical-type H-atom
abstraction leading to a secondary propyl-radical [9 31] The second H-atom abstraction
occurs on the Te4+-center next to the V5+-center The Nb5+-center stabilizes the primary
active centers and separates them spatially from each other The formed olefin
coordinates to the Mo6+-center where the O or N atom is inserted via another H-atom
abstraction on the adjacent Te4+-center of the M2 phase Therefore the M2 phase is
considered to contribute to the selective olefin conversion toward the desired product
Because V5+ centers are not available in M2 phase it cannot activate propane On the
other hand the excellent performance of propylene conversion of the M2 phase is
accounted for the rather high number of α-H-atom abstracting Te4+-sites However the
presence of active centers is not sufficient the catalytic performance depends in a crucial
manner on the surface geometry of the active sites and the redox properties of the
catalyst
Guliants et al has studied the catalytic performance of a nano-crystalline Mo-V-O M1
phase [36] The original Mo-V-O was practically unselective in propane oxidation
however a significant improvement in selectivity was observed when Te- Nb- and Sb-
oxides were supported on the surface at sub-monolayer coverage Low-energy ion
23
scattering (LEIS) study of the submonolayer coverage indicated that Nb species were
preferentially located at the topmost surface while the subsurface Te- and Sb
concentrations declined gradually into the bulk The highest selectivity was observed
when both Nb and Te (or Sb) oxide species were present at the surface In general the
selectivity was comparable to those observed on bulk MoVMOx catalysts (M=Te Nb or
Sb)
Table 125 Activation energy of propane partial oxidation on different surface-promoted catalysts [36]
Promoter EA (kJmol) Promoter EA (kJmol)
none 74 Nb 72
Te 125 Nb+Te 108
Sb 62 Nb+Sb 79
The effect of temperature and space velocity was studied on the conversion selectivity
and yield The apparent activation energies of propane conversion were determined
(Table 125) Interestingly only the inclusion of Sb led to a descrease while promotion
by Te led to a net increase in the apparent activation energy The niobium barely had any
effect on the activation energy The inclusion of Nb besides Te led to a catalyst on which
the apparent activation energy of propane was still considerably higher than for the
unpromoted and the Nb-modified catalyst Even though Nb and Sb promotion alone
decreased slightly the activation energy the simultaneous presence of Nb and Sb led to a
slight increase of the activation energy
Zhu et al modified selectively the V5+V4+ ratio in the MoVTeO catalyst by adjusting the
acidity of the precursor solution [37] The solutions were evaporated and calcined at 873
K in N2 stream to obtain the catalyst XPS measurements suggested that the number of
surface V5+ were preferentially enhanced by addition of pH adjustors in the precursor
solution The high number of surface V5+ sites (5+V=O groups) was claimed to be
responsible for propane activation while the bulk V4+ was suggested to play a significant
role in promoting electron- and oxygen atom transfer during the reaction The authors
24
claimed that the bulk V5+V4+ ratio is also important as higher number of V4+ sites
facilitate the total oxidation while less V4+ sites resulted in a high selectivity to acrolein
1234 The effect of acid-base character of the catalyst
Besides the redox properties of the transition metal oxide catalysts the aciditybasicity
also plays a significant role in the oxidation reactions The ideal surface structure of an
oxide as generated by cutting the crystal at a specific crystal plane is composed by an
array of cations (Lewis acid site) and lattice oxygen anions (basic site) The acidic
character of the cations and the basicity of lattice oxygen depend on the ionic character of
the metal-oxygen bonds [38]
The metal-oxygen bond in oxides of transitional metals with high oxidation state (Mo6+
V5+) is rather covalent thus they are acidic oxides On the other hand the same elements
in the lower oxidation state have more ionic character and they behave as basic oxides
The acid-base characteristics of the oxide have a major effect on the activation of the
reactants the relative rates of the competitive pathways and the rate of
adsorptiondesorption of the reactants and products The relatively weak Lewis acidity is
a key parameter that determines the oxygenate formation The Broslashnsted acidity is
important in propane activation however strong Broslashnsted acidity favors the hydration of
propylene to isopropanol which may be oxidized to acetone and acetic acid Controlling
the LewisBroslashnsted acidity of the catalyst is also connected with the effect of steam on
the catalyst activity In general it is stated that by blocking Broslashnsted acid sites with water
or ammonia the over-oxidation is reduced and favors acrylic acid formation [2 3]
Many attempts to correlate the catalyst activity with the redox and acid-base properties
were reported in the literature Due to the fact that that the redox and acid-base
characteristics are not independent Novakova et al and Centi pointed out that these
correlations are not generally valid [2 3] A careful study of these characteristics on the
individual reaction steps rather than on the global behavior of the whole reacting system
was recommended [3]
25
1235 The effect of steam
The introduction of steam in the feed mixture inhibits the oxidative dehydrogenation of
propane over ZrO2 supported MoOx and VOx catalysts [14-16]
In contrast to that the presence of steam in the feed was noted to be essential for the
formation of acrylic acid from propane over Mo and V based catalysts [26 27 28 39]
Novakova et al noted that the steam content affects on the kinetics of propane oxidation
over a phase mixture MoVNbSbOx catalyst [26] The rate of acrylic and acetic acid
formation increases strongly in the steam content interval between 0 and 20 vol and
the rates leveled off above 20 vol steam content It was also noted that the presence of
steam influences the apparent activation energy of propane consumption At a steam
content of 25 vol a value of 50 kJmol was determined while in dry feed the apparent
activation energy was found to be 68 kJmol It was observed that in absence of steam an
irreversible phase change occurs accompanied by deactivation of the catalyst upon
addition of steam after performing the experiment in dry feed neither the original phase
composition nor the initial catalytic activity was attained It was noted that the
deactivation was a relatively fast process which completed in ca 50 minutes
Griszligtede has carried out a kinetic study on the steam effect on propane oxidation over
MoV033Te025Nb017Ox catalyst deposited on steatite balls [27 28] It was found that in the
presence of 50 vol steam the rate constant of propane consumption increased by a
factor of 24 while the propylene further oxidation rate constant increased by a factor of
44 compared to the experiment performed in dry feed The selectivity to acrylic acid was
only 50 while the oxidative stability (ie the ratio between the formation and further
oxidation rate constants) of acrylic acid was found to be 13 in dry feed Upon introducing
50 vol steam in the feed the selectivity increased to 80 and the oxidative stability
was also improved to 32 Similarly to the results given by Novakova [26] the conversion
and selectivity increased in the steam concentration interval between 0 and 20 vol and
leveled off at concentrations higher than 20 vol The positive effect of the steam on the
productivity was accounted for the faster desorption rate of the product However no
experimental evidence was given for this assumption On the other hand as a second
26
possibility the modification of the phase composition in presence of steam was
highlighted This possibility was speculated based on the observation that the
pretreatment of the catalyst in the reactor using steam containing a gas mixture (50 vol
H2O and 50 vol N2 at 140degC for 24 hours) lead to a better performances (SAA=80)
compared to the experiment in which the reaction was started without pretreatment
When the catalyst was pretreated with a 10 vol steam containing mixture the highest
acrylic acid selectivity was found to be only 40 However the catalyst was not
characterized by XRD either before or after the pretreatment or catalytic experiment in
order to support the assumption concerning the phase change
Dubois et al patented a method for preparation of acrylic acid by selective oxidation of
propane over MoVTe(Sb)Nb(Ta)SiOx catalysts in fluidized bed without steam in the feed
[40] They noted that the presence of steam favored the formation of acetone acetic acid
and propanoic acid however the latter was produced in very small amounts (below 1)
The catalyst activity was not decreased after 24 h on stream in contrast to the
deactivation phenomenon noted by Novakova et al The conversion was below 30 in
all cases while the highest selectivity toward acrylic acid was about 40
Landi et al studied the effect of water on propane oxidation over (VO)2P2O7 catalyst [41-
43] The catalytic testing was started using dry feed at 430degC the acrylic acid selectivity
was very low When stable catalytic operation was reached the temperature was
decreased to 400degC and 20 vol steam was introduced in the feed The propane
conversion decreased in presence of steam while the acrylic acid selectivity increased
compared to the steam free feed Stable operation in steam containing feed was reached
in about 40 hours time on stream Steady-state and dynamic experiments carried out at
different steam contents revealed that the activity and selectivity changed reversibly with
the steam content but stable operation was reached in 6-12 hours time on stream The
propane conversion decreased monotonically with the steam content while the maximum
acrylic acid selectivity was attained at 15 vol steam content
The characterization of the catalyst lead to the conclusion that the presence of steam
27
enhances the crystallinity promotes the disappearance of V5+ containing phase and
reduces the number and strength of surface acid sites
Based on the literature records the possible effect of steam can be summarized as
follows
Physical interaction of water with the catalyst
bull competitively adsorbs with C3H8 and intermediates on the active sites andor blocks
the Lewis acid sites or modifies the ratio of LewisBroslashnsted acidity [3 39 41-45]
bull enhances the desorption of oxygenates [28 39 46-50]
Chemical interaction of water with the catalyst
bull changes the oxidation statecomposition of the M1 MoVTeNbOx catalyst [51]
bull increases the number of Broslashnsted acid sites [46]
bull increases the number of surface hydroxyl groups [14 15 45 52]
bull induces phase change [26 52 53] enhances the crystallinity [41-43 53]
Chemical interaction of water with the adsorbed reaction intermediates
bull the water could act as both a nucleophilic and oxidizing reactant in the formation of
the acrylic acid from the acrolein [3 30]
bull in presence of water different reaction pathways are possible ie the propylene
intermediate may undergo hydration to 2-propanol on the acid sites followed by
oxidation to acetone and acetic acid [3 54]
1236 The effect of redox potential of gas phase and oxygen species
The redox potential of the gas mixture depends on the propaneoxygen ratio Due to the
stoichiometry of the propane to acrylic acid reaction the ratio of 12 is defined as
stoichiometric When the propaneoxygen ratio is smaller than 12 the gas mixture is
28
rather reducing Finally if this ratio is higher than 12 the feed is net oxidizing In the
literature various feed compositions were used from reducing (C3H8O2=6510) [33 34
36] stoichiometric [20 21 51] to strongly oxidizing (C3H8O2 ratio ranging from
08314 to 26974) [47 48] However only a few studies were concentrated on finding
out the effect the redox potential on the catalytic properties
Griszligtede has carried out a kinetic study on the effect of oxygen using the
MoV033Te025Nb017Ox catalyst Only oxidizing feed compositions were used (C3H8O2
equal to 26 29 and 220 vol respectively) [28] The concentration profiles
conversion and selectivities were found to be the same irrespectively on the oxygen
concentration From this observation it was argued that the reaction is 0th order with
respect to oxygen In connection to the steam effect it was also argued that the steam does
not enhance the reoxidation rate becausee of the 0th order kinetics involving the oxygen
Zheng et al studied the effect of oxygen concentration on propane oxidation over
MoV031Te023Nb012Ox catalyst [39] The C3H8O2 ratio was varied from 11 to 15
therefore reducing stoechiometric and net oxidizing feed compositions were used at a
space velocity of 1800 h-1 and 400degC The conversion was steadily increasing with the
oxygen concentration while the selectivity and consequently the yield passed through a
maximum at the C3H8O2 ratio of 13
The selective partial oxidation of alkanes to oxygenates and the oxidative
dehydrogenation reactions as well imply chemical reaction on saturated hydrocarbon
molecules and oxygen species The hydrocarbon molecules possess a closed shell
electronic structure therefore they are in a singlet state The oxygen species activate of
the C-H bonds or eventually the C-C bonds to form the desired product(s) and the COx
respectively The bonding and electronic structure of oxygen species are reviewed here
The oxygen atom has 8 electrons the electron configuration is the following
1s22s22px22py
12pz1 Upon molecule formation the atomic orbital of two oxygen atoms are
hybridized The oxygen molecule in its ground state has an open-shell electronic
structure There is one unpaired electron on each of the πx and πy degenerated
antibonding orbitals The electronic configuration of the oxygen molecule in the ground-
29
state is KK(σ2s)2(σlowast
2s)2(σ2pz)
2(π2px)2(π2py)
2(πlowast2px)
1(πlowast2py)
1 where K denotes the closed
molecular orbital formed by the 1s atomic orbitals
The presence of the unpaired electrons has two consequences (a) the gas phase oxygen in
the ground state is a triplet diradical noted with the term symbol of 3Σ-g
(b) the oxygen molecule is the only paramagnetic species among the diatomic gases with
even number of electrons
The bond order ndash defined as the half of the difference between the number of electrons in
the bonding orbitals and the numbers of electrons that occupy antibonding orbitals ndash is
equal to two [55 56]
Due to spin constraints no reaction happens between a singlet (eg hydrocarbon) and a
triplet species (eg molecular oxygen in ground state) This explains that there is no
reaction between the alkanes and oxygen at low temperatures and without a catalyst
However there are a number of excited or ionized oxygen species which are much more
reactive
Upon excitation of the ground state O2 by 9472 kJmol energy the spin of one of the
unpaired electron on the antibonding π orbital will be inverted leading to a singlet
species 1∆g However the electron configuration and the bond order of the 1∆g is the same
as in the case of the ground state oxygen molecule When the ground state oxygen
molecule is excited by 15785 kJmol the two unpaired electrons are getting paired on
one antibonding π orbital The resulting species is ldquothe other singletrdquo with the term
symbol of 1Σ+g and the same bond order with the first excited state 1∆g and the ground
state 3Σ-g species However the electronic configuration is different from the 1∆g and
3Σ-g
states KK(σ2s)2(σlowast
2s)2(σ2pz)
2(π2px)2(π2py)
2(πlowast2px)
2
In heterogeneous catalysis however the redox catalysts involve ionic oxygen species
which are the following O- and O2- (oxide anion) O2- (superoxide anion) O2
2- (peroxide
anion)
The O- anion contains one more electron then the oxygen atom The electronic
configuration of 1s22s22px22py
22pz1 shows that this species is a mono-radical anion
Because the total electron spin angular momentum is frac12 the degeneracy is equal to 2
This doublet oxygen species gives a single ESR signal without hyperfine splitting
30
The orbitals of the doubly ionized O2- are fully occupied The electronic configuration of
this species is 1s22s22px22py
22pz2 The total electron spin angular momentum is zero
therefore this ion is a singlet species which does not give a signal in the ESR spectrum
The superoxide ion (O2macr) is formed by monoelectronic ionization of the oxygen molecule
the extra electron being located on one of the antibonding π orbitals The electron
configuration of KK(σ2s)2(σlowast
2s)2(σ2pz)
2(π2px)2(π2py)
2(πlowast2px)
2(πlowast2py)
1 displays a mono-
radical feature As a doublet species the superoxide anion gives a single ESR signal
Because the antibonding orbital is more populated compared to the molecular oxygen the
bond order is reduced from 2 to 15
In the peroxide anion (O22-) both antibonding π orbitals are fully occupied which leads to
a bonding order of one
KK(σ2s)2(σlowast
2s)2(σ2pz)
2(π2px)2(π2py)
2(πlowast2px)
2(πlowast2py)
2
Upon population of the antibonding orbitals with electrons the O-O bond length
increases and the bond energy decreases in the O2 O2- and O2
2- series Similarly to the O2-
anion the peroxide anion is a singlet
Since the formation of all these ionic oxygen species is exothermic they are activated
species Upon ionization however the degeneracy also decreases from triplet to doublet
and singlet respectively The reaction between the hydrocarbon and singlet oxygen anion
on the catalyst surface is not spin forbidden anymore therefore the alkane oxidation
reaction may take place at a reasonable temperature
However the reactivity of these species is different and often controls the selectivity of
the process The electrophilic species are represented by O- O2- and O2
2- respectively
They are electron deficient and react with the electron rich regions of the hydrocarbon
molecule such as C=C bonds The nucleophilic O2- anion is often identified as lattice
oxygen Because its orbitals are fully occupied by electrons this species is expected to
react with electron poor regions of the molecule such as C-H bonds [55 57 58]
The selectivity control also depends on the reaction type In the alkane oxidative
dehydrogenation or oxidation to unsaturated aldehydes or acids the selective pathway is
associated to C-H bond activation The attack of electrophilic species on the C=C bond
leads to peroxo-complexes or epoxides which decompose by C-C bond cleavage and
gives total oxidation products Other examples of nucleophilic oxidation are oxidative
31
dehydroisomerization and dehydrocyclization oxidation of alkylaromatics to aldehydes
without aromatic ring rupture ammoxidation oxidation of aldehydes to acids oxidation
of aromatics to anhydrides
On the other hand in the case of electrophilic oxidation reactions the C=C bond
activation is desired because the C-H bond activation by nucleophilic oxygen leads to
unselective pathways Such reactions are the epoxidation oxidation and oxyhydration of
alkenes to saturated ketones oxidation of aromatics to anhydrides and acids with ring
rupture [57 58]
124 Reactor designs operation modes
1241 Conventional laboratory scale reactors
In heterogeneous catalysis different reactor types and designs are employed [59 60] The
most important and frequently used ones are described here
Based on the operation mode two types can be distinguished batch and continuous
reactors The batch reactor is a closed system with a fixed mass of catalyst and volume
of reactant The volume or density of the reacting mixture may change as the reaction
proceeds while the temperature can be kept constant The concentration of reactants and
products change with the reaction time The reaction rate involving the reactant A can be
easily determined from the change of number of moles divided by the volume of the
reactor (Equation 121) If the volume of the reacting mixture is kept constant the
reaction rate is defined as the first order derivative of the concentration with respect to
reaction time
)121 ( 1
Equationdt
dn
Vr AA sdotminus=
The continuous reactors are open systems These can be further classified based on the
flow characteristics in total backmixing reactors (gradientless or continuous flow stirred
tank reactor CSTR) and plug-flow reactors The CSTR consists of a vessel equipped
with an efficient stirrer The reacting mixture flows in with a continuous rate The
32
concentrations are the same in any volume element and any time of the vessel because of
the stirring Moreover the concentrations at the outlet are the same as in the reactor The
difference between the inlet and outlet concentration resembles a step-function For a
system with constant density the reaction rate can be calculated by dividing the
concentration difference by the mean residence time (minus
t ) (Equation 122) The mean
residence time is defined as the reatio between the volume of the reactor and the
volumetric feed flow rate The most important advantage of a CSTR is indeed the fact
that there are no concentration gradients in the catalyst bed the chemical potential is
equal at any volume element of the reactor
)221 ( Equation
t
c
t
ccr AoutletAinletA
A minusminus
∆=
minusminus=
The plug-flow reactor (PFR) consists of a tube which contains the catalyst in the form of
packing or a fixed bed The reacting mixture passes through the reactor tube Two
constraints are to be fulfilled by this type of reactor
bull No axial mixing (ie in the direction of flow) of fluid in the inside of the tube
bull Complete radial mixing (ie perpendicular to the direction of flow) of fluid in the
reactor tube
When the reactor is operated in steady-state and there is no or negligible change of the
density the reaction rate is the first derivative of the concentration with respect to the
contact time (τ ) (Equation 123)
)321 ( Equationd
dcr AA τ
minus=
The most widely employed reactor type for laboratory-scale experiments in
heterogeneous catalysis is the PFR Using this reactor permits testing for screening the
best performing catalyst in a given series More importantly the study of the effect of
33
operation variables (initial concentration of reactants reaction temperature and contact
time) for kinetic purposes
Two different regimes are distinguished
bull Differential regime when the reactor is operated at low educt conversion This
can be determined experimentally by plotting the conversion of the educt against
the contact time The upper limit of the conversion for the differential regime is
that point where the plot deviates from linearity The educt consumption rate can
be determined from the slope of the concentration ndash contact time plot for the
differential regime
bull Integral regime when the reactor is operated at high conversions The integral
regime extends between the upper conversion limit of the differential regime and
full conversion
For industrial applications the maximum performance is usually attained in the integral
regime For this purpose it is often not enough to carry out experiments only in the
differential regime However strictly speaking the reaction rates can be defined only for
the differential regime Therefore kinetic modeling is needed to fit the curves with
integrated rate equations derived from a proposed reaction network The fitting
parameters are the rate constants which do not depend on the extent of the reaction
1242 Catalytic membrane- and multi-stage reactor designs
In partial oxidation reactions the high yield for the desired product is often difficult to
achieve because the intermediate(s) and the product are thermodynamically less stable
than the educt In those cases when the intermediate(s) and product are oxidatively not
stable over a given catalyst the excess of oxygen in the feed favors the total oxidation
which results in low productivity [39 61] For this reasons different reactor designs
(such as catalytic membrane- and multi-tubular reactors) were applied for the dosing of
the oxidant to avoid high oxygen concentrations and to change the local kinetics along
the reactor tube
34
The catalytic membrane reactor is a tubular reactor but the tube is made of a semi-
permeable membrane instead of quartz or metal The reactant is fed in the tube like in the
case of a conventional fixed bed reactor while the oxidant is fed through the membrane
The membrane acts as a distributor of the oxygen along the catalytic bed Therefore the
local oxygen concentration is lower than in the case of the conventional plug-flow
reactor The local oxygen concentration influences the local reaction rate also the rate of
total combustion By changing the local oxygen concentrations a better performance may
be achieved in the catalytic membrane reactor compared to the conventional reactor
designs [61]
However it is to be noted that complete radial mixing is needed in order to avoid the
radial concentration gradients Otherwise high oxygen concentrations at around the walls
of the reactor which would favor total oxidation while in the middle of the reactor tube
the mixture would be rather reducing
Figure129 The flow rate (left) and concentration distribution of oxygen (right) in the catalytic membrane reactor without reaction taking place The blue and green curves correspond to different reactor geometries
(aspect ratios) The profile corresponding to fixed bed reactor (FBR) is indicated by orange line [61]
In contrast to the plug flow reactors operated in steady-state the feed total flow rate
increases along the catalytic bed (Figure 129) Therefore the space velocity also
increases along the tube Without catalytic reaction taking place the oxygen
concentration also increases along the reactor tube [61]
35
Some examples of applications of such reactor designs are briefly reviewed below
Oyama et al employed a catalytic membrane reactor for the epoxidation of propylene in
presence of hydrogen over AuTS-1 catalyst In this reactor the formation rate of
propylene epoxide could by improved by 100-200 compared to the conventional fixed
bed reactor [62] This is due to the fact that high oxygen concentrations could be used in
the catalytic membrane reactor which are not accessible in a conventional reactor for
safety reasons
Campanelli et al studied the oxidative dehydrogenation of propane over VOxγ-Al2O3
and VOxZSM-5 in catalytic membrane reactor The performance of this reaction was
found to be higher than the conventional fixed bed reactor [63 64]
The reactor system developed by Hamel et al is a combination between the multi-stage
reactors and catalytic membrane reactors Three catalytic membrane reactors were
connected in series In this arrangement increasing decreasing and constant oxygen
concentrations were achievable along the reactor cascade as well as different
temperatures in the different reactor units [61]
Figure 1210 (a) Selectivity of propylene vs propane conversion (b) selectivity of propylene vs temperature Conditions xC3H8
in=1 O2C3H8=1 and WHSV=100 and 400 kgsm3 [61]
36
The ethane and propane oxidative dehydrogenation was performed in this system using
VOxγ-Al2O3 catalyst The catalytic results from the membrane (MR) reactor were better
compared to the experiments carried out in a conventional fixed bed (FB) reactor almost
under any conditions (Figure 1210)
OacuteNeill et al used a dual-bed membrane reactor as oxygen distributor for the oxidation of
propane to acrolein [65] The first bed contained propane oxidative dehydrogenation
catalyst (05 g V2O5MgO at a reaction temperature of 500degC while the second bed
consisted of bismuth-molybdate for the further oxidation of propylene to acrolein
produced in the first reactor tube (20g at a reaction temperature of 475degC)
Catalytic studies were conducted with both catalysts separately then in the dual-bed
configuration In these separated experiments the maximum selectivity to propylene and
acrolein was observed for stoichiometric feed while the selectivity declined in both cases
when oxygen excess was used The dual bed experiments were performed under the
optimal conditions determined in the single-bed separated catalytic membrane reactors
Using the dual bed configuration the selectivity to acrolein could be improved by 21
compared to the experiment when the catalytic membrane reactors were used separated
However it was also found that the separate membrane reactor performance was only
marginally higher (by a few ) compared to the conventional fixed bed reactor
Fang et al used a modified fixed bed reactor design equipped with an oxygen distributor
tube [66] The reactor setup permitted experiments with a single- as well as dual catalytic
bed The reacting mixture was fed at the top of the reactor and in the dual bed operation
mode additional oxygen was supplied through the distributor tube which ended up
between the two catalyst beds NiZrOx catalyst was used for oxidative dehydrogenation
of propane while in the second bed cobalt containing bismuth molybdate catalyst was
used for oxidation of propylene to acrylic acid Both of these catalysts showed low
activity in a single-bed arrangement the conversion over NiZrOx catalyst was below 10
and selectivity around 2 while on the modified bismuth molybdate catalyst the
conversion and acrylic acid selectivity were below 1 at the temperature of 380degC The
37
combination of the catalyst beds lead to a conversion of about 10 while the selectivity
was around 25 The addition of oxygen via the distributor tube increased significantly
the yield of acrylic acid to about 12
Summarizing the advantages of catalytic membrane and multi-tubular reactors it can be
stated that
bull These systems permit the variation of the local concentration of the oxidant The
local concentration has a direct effect on the local kinetics and reaction rate thus
the total oxidation may be prevented
bull Different amounts of catalysts may be loaded in the individual reactor tubes
Therefore different contact times are achievable in the reactor tubes The contact
time in each reactor can also be an operational variable in these systems
bull The temperature of each reactor tube can be set individually which is important if
the product is oxidatively unstable
As shown by the above presented examples the optimization of the additional
operational variables in catalytic membrane and multi-tubular reactors the performance
may be improved compared to the conventional reactor systems used for basic research
125 Reaction kinetics
The heterogeneously catalyzed reactions consist of 7 serial steps as follows [67]
bull Diffusion of the reactant species in the fluid phase towards the surface of the solid
catalyst
bull Internal diffusion of the reactant in the pores of the catalyst particle
bull Adsorption of the reactant molecule on the surface
bull Chemical transformation of the reactant into product
38
bull Desorption of the product
bull Diffusion of the products in the pores of the catalyst
bull Diffusion of the product towards the fluid phase
The first two and the last two steps are transport phenomena and as such physical
phenomena The reaction conditions and operation mode can be chosen in such a way
that the mass transport does not limit the chemical reaction on the surface
The reaction mechanism is ultimately the set of elementary steps which explains how the
bonds are split and formed during the chemical transformation However besides the
description of all elementary reactions the postulated reaction mechanism should contain
information concerning the chemical and electronic structures of the transition state for
each elementary step [75] In applied heterogeneous catalysis such a description is
seldom achieved even though in many literature sources the elucidation of reaction
mechanism is claimed
13 Motivation
Upon reviewing the literature about the selective oxidation of propane to acrylic acid on
Mo and V based mixed oxides it was found that predominantly the studies were
performed using phase mixture catalysts The understanding of the role of the individual
phases and active sites in the propane oxidation reaction is still under debate [2 9 29 34
36 70-72] in spite of the claims given by Grasselli et al [31] and Loacutepez-Nieto et al [35]
Their conclusions were assigned based on disproportionately few catalytic and kinetic
data compared to the structural characterization data
In contrast to this very limited information exists about the catalytic properties of phase-
pure materials in propane oxidation reaction Furthermore the following open questions
and conflicting conclusions were identified
bull The bulk structural stability of the MoVTeNbOx catalyst under various conditions
(dry reducing stoichiometric and oxidizing feed) was not evidenced [27 28] On
the other hand it was reported that the phase composition of the not phase pure
39
MoVSbNbOx catalyst is irreversibly altered when exposing to dry feed
conditions accompanied by the irreversible drop of the catalytic performance
bull The detailed kinetic study of the operational variables (reaction temperature
steam content redox potential) was not described on a phase-pure M1
MoVTeNbOx catalyst
bull The reaction pathways are under debate The early versions were proposed mainly
based on thermodynamic considerations [4 12] and a very limited number of
integral catalytic data [2 12 22 30 47 48] but only very few systematic kinetic
studies were carried out Typically these studies were performed using phase
mixture catalysts [24-28 73 74]
bull The common feature of the proposed pathways is that the total oxidation product
(CO and CO2) formation is either not explained at all [12 24 35] or they are
merged together as COx=CO+CO2 produced by the total oxidation of acrylic and
acetic acids [2 4 22 24 25 47 48 71 74] Lintz et al and Fushimi et al
continued the simplification by merging the CO CO2 and acetic acid under a
three carbon atom containing pseudo-byproduct [27 28 30 71] The mechanism
proposed by Grasselli et al does not explain at all the formation of these
byproducts [9 31 35 70] However a postulated mechanism should contain all
the contributing elementary reactions as well as the description of electronic and
chemical structures of the transition state for each elementary reaction [75]
The experimental work presented this thesis is centered around the kinetic study of
propane selective oxidation to acrylic acid on MoVTeNbOx catalyst Due to the fact that
the role of the individual phases is not yet fully understood a phase-pure MoVTeNbOx
catalyst was used The experiments were designed to answer some of the above outlined
open questions
bull The bulk structural stability of the phase-pure M1 MoVTeNbOx catalyst under
real reaction conditions (T=400degC and GHSV=5000 h-1 whereby maximum
acrylic acid selectivity is attained in fixed bed reactor) was addressed in an in situ
XRD experiment The steam content and redox potential was varied during this
experiment the conditions covered steam containing- dry- stoichiometric-
40
oxidizing- reducing- and strongly reducing (C3H8 in N2) feed compositions
respectively
bull The kinetic study on the temperature steam- and oxygen concentration was
carried out in a conventional fixed bed reactor The oxidation of the intermediates
(propylene and acrolein) was also carried out in the temperature interval
corresponding to the propane oxidation in order to determine the relative
reactivities For unraveling the source of CO2 in the C3H8 and C3H6 and acrolein
oxidation reactions (ie is CO2 produced from the total oxidation of the organics
or the further oxidation of CO) a separate CO oxidation and water gas shift
reaction was envisaged
bull A two-stage reactor design was employed for the stage-wise addition of the
oxidant (O2 and N2O) reducing gases (C3H6 CO) and the thermodynamically
stable end product (CO2) The O2 addition was performed in order to check
whether the multi-stage arrangement improves the catalytic performance similarly
to the literature sources In the literature the nitrous oxide was reported to be an
alternative and more efficient oxidant than molecular oxygen in ODH reactions
[77 78] Therefore the potential applicability of this oxidant was also checked in
the two-stage reactor system The addition of C3H6 CO and CO2 was performed
in order to observe whether these products competitively adsorb on the active
sites of the catalyst or not
bull The product distribution analysis corresponding to the propane oxidation and the
catalytic data obtained for propylene acrolein and CO oxidation reactions in both
the single-tube and the two-stage reactor setups are considered in the proposed
reaction network [76]
References Chapter 1
1 J P Lange Economics of alkane conversion Chapter 3 in E G Derouane et al (Eds) Sustainable strategies for the upgrading of natural gas fundamentals challenges and opportunities Springer 2005 51-83
2 EK Novakova V C Veacutedrine Propane Selective Oxidation to Propene and Oxygenates on Metal Oxides in JLG Fierro Metal Oxides Chemistry and Applications CRC Press 2006 414-455
41
3 G Centi F Cavani F Cavani F Trifiro Selective Oxidation by Heterogeneous Catalysis Kluwer AcademicPlenum Publishers 2001 363-384
4 M M Lin Appl Catal A 207 (2001) 1ndash16 5 wwwiciscom retrieved on 02032011 6 wwwoilnergycom retrieved on 02032011 7 RK Grasselli JD Burrington Adv Catal 30 (1981) 133 8 JD Burrington CT Kartisek RK Grasselli J Catal 81 (1983) 489 9 RK Grasselli JD Burrington DJ Buttrey P DeSanto Jt CG Lugmair AF
Volpe Jr T Weingand Topics in Catal 23 (2003) 5 10 RK Grasselli Topics in Catal 15 (2001) 93 11 M Egishara K Matsuo S Kawaga T Seiyama J Catal 58 (1979) 409 12 M M Bettahar G Costentin L Savary J C Lavalley Appl Catal A 145
(1996) 1-48 13 Y H Jang W A Goddard III J Phys Chem B 106 (2002) 5997-6013 14 K Chen A T Bell and E Iglesia J Phys Chem B 104 (2000) 1292-1299 15 K Chen E Iglesia A T Bell J Phys Chem B 105 (2001) 646-653 16 K Chen A Khodakov J Yang A T Bell E Iglesia J Catal 186 (1999) 325-
333 17 B Y Jibril Int J Chem Kinet 38 (2003) 176-183 18 G Fu X Xu X Lu and H Wan J Phys Chem B 109 (2005) 6416-6421 19 NN Greenwood A Earnshaw Chemistry of the Elements 2nd Edition
Butterworth Heinemann 1997 981-987 1007-1017 20 T Ushikubo H Nakamura Y Koyasu S Wajiki US Patent 5 380 933 (1995) to
Mitsubishi Kasei Corporation 21 T Ushikubo I Sawaki K Oshima K Inumaru S Kobayakawa K Kiyono US
Patent 5 422 328 (1995) to Mitsubishi Kasei Corporation 22 M Lin T B Desai F W Kaiser P D Klugherz Catal Today 61 (2000) 223ndash
229 23 D Vitry Y Morikawa JL Dubois W Ueda Applied Catalysis A General 251
(2003) 411ndash424 24 L Luo JA Labinger ME Davis J Catal 200 (2001) 222ndash231 25 EK Novakova JC Vedrine EG Derouane J Catal 211 (2002) 235-243 26 EK Novakova JC Vedrine EG Derouane Catal Lett 83 (2002) 177 27 E Balcells F Borgmeier I Griszligtede H-G Lintz F Rosowski Appl Catal A
266 (2004) 211-221 28 I Griszligtede Die partielle Oxidation von Propan zu Acrlysaumlure Bestimmung der
Reaktionskinetik und in-situ Charakterisierung des Katalysators unter Betriebsbedingungen Dissertation Universitaumlt Karlsruhe 2004 Universitaumltsverlag Karlsruhe ISBN 3-937300-17-1
29 P Concepcion P Botella J M Lopez Nieto App Catal A 278 (2004) 45ndash56 30 R Fushimi S O Shekhtman A Gaffney S Han G S Yablonsky J T
Gleaves Ind Eng Chem Res 44 (2005) 6310-6319 31 R K Grasselli D J Buttrey J D Burrington A Andersson J Holmberg W
Ueda J Kubo C G Lugmair A F Volpe Top Catal 38 (2006) 7-16 32 P DeSanto D J Buttrey R K Grasselli C G Lugmair A F Volpe Jr B H
Toby T Vogt Z Kristallogr 219 (2004) 152-165
42
33 M Baca A Pigamo JL Dubois and JMM Millet Top Catal 23 (2003) 39-46
34 WUeda DVitry T Katou Catal Today 96 (2004) 235ndash240 35 P Botella J M Loacutepez-Nieto B Solsona A Mifsud and F Maacuterquez J Catal
209 (2002) 445-455 36 V V Guliants R Bhandari B SwaminathanV K Vasudevan J Phys Chem
B 109 (2005) 24046-24055 37 Y Zhu W Lu H Li H Wan J Catal 246 (2007) 382-389 38 G Busca Phys Chem Chem Phys 1 (1999) 723-736 39 W Zheng Z Yu P Zhang H Fu X Zhang Q Sun X Hu J Natural Gas
Chem 17 (2008) 191-194 40 J L Dubois D Garrait A Le Gall G Bazin S Serreau FR patent WO
2006072682 A1 2006 41 G Landi L Lisi J C Volta Chem Commun 9 4 (2003) 492-493 42 G Landi L Lisi J-C Volta J Mol Catal A 222 (2004) 175-181 43 G Landi L Lisi J C Volta Catal Today 91-92 (2004) 275-279 44 TV Andrushkevich CatalRev Sci Eng 35 (1993) 213-259 45 E M Erenburg T V Andrushkevich G Ya Popova A A Davidov V M
Bondareva React Kinet Catal Lett 12 1 (1979) 5-11 46 EM Erenburg T V Andrushkevich V I Bibin Kinet Catal 20 3 (1979) 680 47 M Ai J Catal 101 (1986) 389 48 M Ai Catal Today 42 (1998) 297 49 A C Kaddouri C Mazzochia E Tempesti Appl Catal A 180 (1999) 271 50 J Barrault C Batiot L Magaud M Ganne Stud Surf Sci Catal 110 (1997)
375 51 A C Sanfiz T W Hansen D Teschner P Schnorch F Girgsdies A
Trunschke R Schlogl M H Looi S B A Hamid J Phys Chem C 114 4 (2010) 1912-1921
52 J C Vedrine J M M Millet J C Volta Catal Today 32 1-4 (1996) 115-123 53 R Recknagel Chemische Technik 46 6 (1994) 324-331 54 Moro-oka Appl Catal A General 181 (1999) 323-329 55 Z Sojka E Giamello M C Paganini Radicals in Catalysis ndash Heterogeneous in
I T Horvaacuteth (Ed) Encyclopedia of Catalysis Vol 5 Wiley-Interscience 2003 738-768
56 NN Greenwood A Earnshaw Chemistry of the Elements 2nd Edition Butterworth Heinemann 1997 [13] P Mars D W Krevelen Chem Eng Sci 3 1954 41
57 S T Oyama Factors affecting selectivity in catalytic partial oxidation and combustion reactions in B KWarren S T Oyama (Eds) Heterogeneous Hydrocarbon Oxidation ACS Symposium Series 638 2-20 J Haber Selectivity in heterogeneous catalytic oxidation of hydrocarbons B KWarren S T Oyama (Eds) Heterogeneous Hydrocarbon Oxidation ACS Symposium Series 638 20-36
58 J Haber Selective oxidation ndash Heterogeneous in I T Horvaacuteth (Ed) Encyclopedia of Catalysis Vol 6 Wiley-Interscience 2003 141-187
43
59 R W Missen Ch A Mims B A Saville Introduction to Chemical Reaction Engineering and Kinetics John Wiley and Sons 1999 25-41
60 J M Berty Experiments in catalytic reaction engineering Studies in surface science and catalysis Vol 124 Elsevier 1999 29-45
61 C Hamel Aacute Toacuteta F Klose F Tsotsas A Seidel-Morgenstern Chem Eng Res and Design 86 (2008) 753-764
62 ST Oyama X Zhang J Lu Y Gu T Fujitani J Catal 257 (2008) 1-4 63 A Bottino G Campanelli A Comite J Membr Sci 197 1-2 (2002) 75-88 64 G Campanelli E Carosini F Cavani O Monticelli F Trifiro Chem Eng Sci
51 10 (1996) 1817-1826 65 C Oacute Neill E E Wolf Catal Today 156 (2010) 124-131 66 W Fang Q J Ge J F Yu H Y Xu Ind Eng Chem Res 50 4 (2011) 1962-
1967 67 J B Butt Reaction kinetics and reactor design Chapter 7 Chapter 1 Marcel
Dekker 2000 1-104 457-571 68 R A van Santen J W Niemantsverdriet Chemical kinetics and catalysis
Fundamental and Applied Catalysis Plenum Press 1995 Chapter 2 21-66 69 N A Bhore M T Klein K Bishoff Ind Eng Chem Res 29 (1990) 313-316 70 R K Grasselli C G Lugmair A F Volpe Top Catal 50 (2008) 66-73 71 H-G Lintz S P Muumlller Appl Catal A General 357 (2009) 178-183 72 R Schloumlgl Top Catal 54 (2011) 627-638 73 Lin Luo PhD Thesis California Institute of Technology Pasadena California
2001 74 F N Naraschewski A Jentys J A Lercher Top Catal 54 (2011) 639-649 75 K A Connors Chemical kinetics VCH Publishers 1990 1-10 76 R Naumann d`Alnoncourt L I Csepei Yu V Kolen`ko A Trunschke R
Schloumlgl manuscript in preparation 77 E V Kondratenko M Cherian M Baerns D Su R Schloumlgl X Wang I E
Wachs J Catal 234 (2005) 131ndash142 78 E V Kondratenko A Bruumlckner J Catal 274 (2010) 111ndash116
44
Chapter 2 Experimental methods
21 Physico-chemical characterization of the catalysts
In this section those methods are described which were employed to characterize the
catalyst Routine measurements (determination of the surface area recording the X-ray
diffractogram for checking the phase purity imaging by SEMTEM and elemental
analysis by EDX) were done for each sample while XPS and microcalorimetric
experiments on the adsorption of propane was performed for selected samples
211 Nitrogen physisorption
The nitrogen physisorption was carried out on a Quantachrome 6B setup at -196deg C Prior
to the measurement an outgassing procedure was performed at 150degC for 2 hours The
specific surface area was calculated using the multipoint Brunauer-Emmett-Teller
method applied to the data collected in the relative pressure interval between 005 and 03
of the adsorption isotherms The total pore volume was estimated from the volume of the
physisorbed nitrogen at the relative pressure of 095
212 X-Ray Diffraction
The powder X-ray diffraction patterns were recorded using a Stoe STADI-P transmission
diffractometer and a Bruker D8 ADVANCED diffractometer both equipped with a Cu
Kα1 radiation source
The in-situ XRD study was performed using the Bruker D8 ADVANCED diffractometer
The gas mixture of propane oxygen and helium was supplied by mass flow controllers
and while a bubbler connected to a HAAKEreg thermostat was employed for introducing
the steam Catalytic reaction was carried out at a temperature of 400degC the reaction was
followed by an on-line mass spectrometer
45
213 Scanning Electron Microscopy (SEMEDX) and Scanning Transmission
Electron Microscopy (STEM)
The SEM-EDX analysis was performed using a Hitachi S-4800 scanning electron
microscope operated at 10 kV accelerating voltage The STEM measurement was done in
Titan CS 80-300 TEM setup operated at 300 kV The spatial resolution was ca 13 Aring
214 X-Ray Photoelectron Spectroscopy (XPS)
The XPS experiments were carried out using the monochromatic radiation of the ISISS
(Innovative Station for In Situ Spectroscopy) at the synchrotron facility BESSY II of the
Helmholtz Zentrum Berlin The measurements were carried out at a pressure of 025
mbar oxygen in order to avoid reduction of tellurium The core level spectra of O 1s V
2p Mo 3d Te 3d Nb 3d and C 1s were recorded at 150 eV constant kinetic energy of the
incident photon beam This corresponded to the inelastic mean free path of approximately
06 nm therefore the setup was operated in the surface sensitive mode The
normalization of the spectra was done with respect to the storage ring current and the
incident photon flux determined by using a gold foil The data analysis was done in
CASA software using Shirley baseline subtraction
215 Microcalorimetry
The differential heats of adsorption were determined using an MS70 Calvet Calorimeter
(SETRAM) Details about the experimental setup consisting of the gas dosing system
calorimeter and the custom-designed high-vacuum system were described in detail before
[1] The catalyst sample was investigated in the same sieve fraction as used for the
catalytic experiments (250-355 microm) The pretreatment of the sample prior to the
calorimetric experiment was performed in vacuum (at 310-8 mbar) at 150degC The
propane and propylene adsorption experiment was performed at 40degC The pressure
change and the heat signal were recorded at every dosing step of the probe molecules
The adsorption isotherm was derived from the dosed amount of probe molecule and the
46
equilibrium pressure The signal area was converted into heat by means of the calibration
factor of the calorimeter determined in advance The heat was divided by the number of
molecules adsorbed in the respective dosing step [2]
22 The experimental setup for propane oxidation
For catalytic and kinetic experiments a home built fixed bed reactor system was used
(Figure 221) The propane oxidation setup (denominated as PropOx 1) consisted of
three modules
bull Gas dosing system
bull Reactor system
bull On-line gas analytics
In the following sections the design features and details of the modules are given
221 The gas dosing system
On Figure 221 the scheme of the reactor system is shown The gas dosing system
consisted of 3+2 mass flow controllers (MFC) as follows
bull O2 ( Bronkhorst type EL-FLOW max flow rate 5 mlnmin)
bull C3H8 (Bronkhorst type EL-FLOW max flow rate 25 mlnmin)
bull N2 (Bronkhorst type EL-FLOW max flow rate 70 mlnmin)
bull N2 (Bronkhorst type EL-FLOW max flow rate 100 mlnmin) This was used in
the steam content variation experiment when the feed was switched from steam
containing feed to dry feed Additionally this flow controller was used for the
purging of the second reactor tube with a mixture of N2+H2O when the two-stage
reactor system was operated in a single-tube mode
bull O2 (Bronkhorst type EL-FLOW max flow rate 5 mlnmin not shown on Figure
221) this was used for the addition of oxygen and other gases (C3H6 N2O CO
CO2) in the two-stage reactor system The two-stage reactor system is described
in section 223
47
For the study on the effect of steam it was necessary to vary the steam content between
40 and 0 vol The steam was introduced via a syringe pump (Harvard Apparatus Model
22 with a double syringe holder) equipped with a 50 ml gas tight syringe made of quartz
(provided by Hamilton) and an evaporator The home-built evaporator was a stainless
steel vessel surrounded by a heater (nominal power of 600W) heated up to 97degC The
cavity of the vessel was filled up with SiC (particle size between 200 and 400 microns)
The liquid water entered the vessel through a 116 inch size tubing Nitrogen was used as
carrier gas for steam through the evaporator Even though the evaporation temperature
was experimentally optimized oscillations in the steam concentration were noticed
which induced oscillations in the concentration of all the other components Therefore a
Swagelok stainless steel pressure vessel of 150 ml was installed in the heated oven as a
buffer volume in order to minimize the fluctuations of the concentrations
Fig 221 The experimental setup denominated as PropOx-1
O2
C3H8
N2
N2
PC GC MS
vent
Filter
Filter
Buffer
PI
MFC
MFC
MFC
MFC
Syringe pump TIC
Flow bus
48
A Swagelok four-way valve installed in the heated oven permitted to switch immediately
between a steam containing feed and dry feed and back When the four way valve was in
the position indicated by Figure 221 the N2+steam mixture was added to the C3H8+O2
mixture On the other hand when the valve was turned in the other position pure
nitrogen was added to the C3H8+O2 mixture for the experiments carried out under steam
free conditions The N2+steam mixture was produced continuously but it was purged by
the valve to the vent
For re-measuring the catalytic properties with the steam containing feed the four way
valve was turned back in the position indicated by Figure 221
The necessity of above described arrangement and procedure is due to the fact that the
replacement of the steam containing feed by dry feed by switching off the syringe pump
is not fast enough Both the evaporator and the pressure vessel has a relatively large
volume and it would have taken more than an hour to replace the steam containing feed
by dry feed and vice versa However by using this valve system the time resolution of
the measurement on the steam effect was reduced to the time resolution of the analytical
setup (ca 17 min) permitting to observe if the catalyst is deactivating fast or not in
absence of steam
A Swagelok filter (2 microns) was installed between the T-junction where the N2+steam
and the C3H8+O2 mixtures were unified in order to ensure complete mixing
The 4 way valve buffer volume the reactor tube and the gas lines were housed in a
Heraeus oven heated up to 140degC The transfer line between the oven and the heated oven
and the analytical setup was heated to the same temperature by means of heating tapes
222 Reactor tube characteristics
A quartz tube was used as reactor with an outer diameter of 97 mm and inner diameter of
68 mm The reactor tube was surrounded by a tubular heating cartridge (Figure 221)
and placed in the heated oven The oven was heated up to 140degC in order to avoid
condensation of the steam and reaction products (acrylic acid and acetic acid)
49
For finding out the isothermal zone of the reactor the oven was heated up to 140degC
while the temperature of the reactor heating cartridge was set to 400degC A gas mixture
containing 40 vol steam and 60 vol N2 was flown through the empty reactor with a
flow rate of 50 mlnmin The thermocouple was moved by 05-10 cm along the tube
from bottom towards the top and the temperature was measured at each position The
temperature profile is given in Figure 222 A plateau is observed between 8 and 13 cm
of the reactor length For a better estimation a standard deviation of less than 1degC was
considered as an objective criterion for the length of the isothermal zone
The isothermal zone started at 85 cm and ended at 125 cm therefore the length is 4 cm
Within this zone the average temperature was found to be 4001degC with a standard
deviation of 07degC and a confidence interval of 02degC The absolute difference between
the maximum and minimum temperatures (∆T=Tmax-Tmin) was 15degC within this interval
The difference of Tmax-Taverage was 07degC which is in good agreement with the standard
deviation of the temperature profile curve in the isothermal zone Therefore it can be
stated that the catalytic reaction was carried out under isothermal conditions
An isothermal volume of 145 ml was calculated from the inner diameter of the reactor
tube and the length of the isothermal zone This was the maximum volume of the catalyst
which could be loaded in the isothermal zone
240 260 280 300 320 340 360 380 400 420
0
2
4
6
8
10
12
14
16
d (cm)
T(degC)
Figure 222 The temperature profile of the reactor tube Zero centimeter corresponds to the
bottom of the heating cartridge The delimitation of the isothermal zone is marked by blue lines
50
The catalyst was used as a sieve fraction between dpmin=250 and dpmax=355 microns The
ratio between the reactor diameter (dr) length of the isothermal zone (Lisoth) and the
particle size are given by the equation 221-223 The ratio between the reactor diameter
and particle size should be at least 10 (Equation 221) The length of the isothermal zone
should exceed at least 50 times the particle size (Equation 222) The dimensionless
criterion concerning the reactor geometry is that the length of the isothermal zone should
be at least 5 times larger than the diameter The numerical values of these ratios exceed
the minimum criteria (Equations 221-223) therefore no axial diffusion (back-mixing)
no radial gradient in concentrations temperature and reaction rate occurs [3]
223)(Equation 9586
40
222)(Equation 01602500
40 7112
3550
40
221)(Equation 2272500
86 219
3550
86
min
max
minmax
==
====
====
r
isoth
p
isoth
p
isoth
p
r
p
r
d
L
d
L
d
L
d
d
d
d
In order to avoid hot-spots or temperature gradient formation the catalyst was mixed
with SiC (particle size between 315 and 400 microns) prior to filling in the reactor tube
Usually 025-030 ml catalyst was mixed up with 115-12 ml SiC This corresponds to a
dilution ratio between 38 and 48 The SiC does not only act as a diluent between the
catalyst particles but also improves the reaction heat transfer The heat conductivity of
SiC is 2-3 order of magnitude higher compared to the heat conductivity of molybdenum
and vanadium based oxides (λSiC=12-25 WcmmiddotK [4] λMoVOx=25middot10-3 WcmK [5])
A slightly different SiC sieve fraction was used (315-400 microm) compared to the catalyst
particle size (250-355 microm) in order to facilitate the separation of the catalyst after
catalytic experiment When the loading was taken out from the reactor the solid mixture
was sieved using a 315 micron sieve The catalyst particles between 250 and 315 micron
fell in the collection plate while the catalyst particles and SiC above 315 microns
remained in the sieve The collected catalyst was not always free of small fraction of SiC
51
(less than 1) Therefore sometimes the post-catalytic XRD patterns contained
reflections of SiC as well
The loading of the reactor was performed according to the following procedure a quartz
wool plug was inserted in the tube to the lower end of the isothermal zone Then the
catalyst and SiC physical mixture was poured in the tube using a glass funnel to a level
which was 2 mm below the upper end of the isothermal zone At the end ca 2 mm of
SiC layer was added to the top of the bed The reactor tube was inserted in the heating
cartridge A K-type thermocouple that measured the temperature in the catalytic bed was
fixed in such a way that it touched only the SiC on the top Therefore this arrangement
permitted to avoid cross contamination of one catalytic bed to another by the particles
which eventually might stick to the surface of the thermocouple
For the downstream tubing and transfer line between the reactor and the analytical setup
a PEEK tubing was used which is chemically more inert than stainless steel The
employment of PEEK was necessary in order to minimize the adsorption of products and
polymerization of acrylic acid on the walls of the tubing On the downstream tubing from
the reactor a second filter (Swagelok 2 micron) was installed in order to prevent the
solid particles to enter into the valve system andor columns of the analytical setup
223 Estimation of the Weisz-number and the Thiele modulus and effectiveness
factor
For the estimation of whether mass transport limitation plays a role in the reaction the
Weisz-number (Ψ) and the Thiele modulus (Φ) was calculated according to the
equations
)622 ( tanh
)522 (
)422 ( 2
1
183
083
832
Equation
EquationD
ckL
EquationcD
rnL
eff
n
sHCc
HCeff
catHC
c
Φ
Φ=
sdotsdot=Φ
sdot
sdotsdot
+sdot=Ψ
minus
η
ρ
52
Since the propane oxidation reaction was found to be first order with respect to propane
(n=1 see section 423) the (n+1)2 term becomes equal to one Similarly the term
involving the surface concentration of propane on the (n-1)th power becomes equal to one
in the equation 225 for n=1
The characteristic length (Lc) was calculated from the particle diameter assuming
spherical particles The catalyst density (ρcat) of 112 gml was determined by weighting
10 ml sieve fraction The effective diffusion coefficient of propane (Deff=0018 cm2s)
was taken from [6] The integral reaction rate of propane consumption was calculated at
the highest reaction temperature of 400degC The rate constant of propane consumption
(kC3H8=0870 gsml at 400degC) was determined from the fitting of the rate equation to the
experimental data points (section 65) Finally the effectiveness factor (η) was calculated
according to the equation 226 Because the particle size was between 250 and 355
microns the values were calculated for both extremes (Table 221)
Table221 The Ψ Φ and η dimensionless numbers corresponding to propane oxidation reaction
Dimensionless number dp=250 mm dp=355 mm
Ψ 005 010
Φ 029 041
η 097 095
As it is demonstrated by Table 221 the Weisz-number and Thiele modulus are below
one The effectiveness factor (the ratio between the actual rate and the highest possible
rate) approaches one Therefore it can be concluded that the pore diffusion is negligible
and the reaction rate is kinetically controlled
224 The two stage reactor system
A reactor cascade consisting of two reactor tubes with identical diameter was
constructed These were equipped with the same type of heating cartridge The isothermal
zone was determined also for the second reactor tube according to the previoulsy
described procedure (section 222)
53
The reactor tubes were connected in series according to the Figure 223 In order to
permit experiments in one reactor tube only a six port valve was used for the connection
of the tubes
When the position of the six port valve was according to the left side of Figure 223 the
feed mixture was flowing only through the reactor 1 The gas mixture which was leaving
this reactor is transferred to the analytical setup (indicated by green lines) Therefore this
corresponds to a single-tube reactor operation mode In the meantime the second reactor
was purged continuously with a mixture of steam and nitrogen using the second nitrogen
line and the second syringe of the syringe pump
R1
Feed
mix
GC-
MS
N2
+H2O
vent
R2
O2
R1
Feed
mix
GC-
MS
N2
+H2O
vent
R2
O2
Feed
mix
GC-
MS
N2
+H2O
vent
R1 R2
O2
Feed
mix
GC-
MS
N2
+H2O
vent
R1 R2
O2 Single-tube operation mode Two-stage operation mode
Figure 223 The gas tubing connection of the two stage reactor
The steam and nitrogen mixture which left the second reactor tube was purged to the vent
(indicated by the blue lines) In this configuration the optional oxygen mass flow
controller was not in use
On the other hand when the six port valve was turned in the position indicated by the
right side of Figure 223 the feed mixture went through both reactor tubes and then
analyzed by the GC-MS (green lines) This corresponds to the two-stage operation mode
Addition of oxygen or other gas was possible through the T-junction installed between
54
the six port valve and the second reactor The steam+N2 mixture was continuously
generated but purged to the vent (blue lines)
The addition of gases between the two reactors increased the total flow rate in the second
reactor tube Therefore it influenced slightly both the concentrations and the space
velocity The change of the concentration was corrected by means of the dilution ratio
(ie the ratio between the total flow rates leaving the second and the first reactor tube)
The corrected concentrations were used for the selectivity and rate calculations The
space velocity in the second reactor was calculated based on the loaded amount of
catalyst and the total flow rate
2 4 6 8 10 1209
10
11
12
4000
4250
4500
4750
5000
Overall GHSV (h-1)
Dilution ratio
O2 concentration in mixture that enters in R2 (vol)
Figure 224 The dilution ratio in the second reactor (red dots) and the overall space velocity (black
squares) change upon oxygen addition in the two-stage reactor system
An example for the change of these parameters in function of the added oxygen gas
concentration is shown by Figure 224 For the calculation of rates the corrected
concentrations were divided by the overall contact time Therefore the rate data are more
appropriate for the assessment of the effect of added gases than conversion-selectivity
data which are not corrected with respect to the change of contact time
55
225 The analytical system
For the on-line analysis of the reaction mixture a GC-MS was used This setup consisted
of five columns three valves and two detectors (MSD and TCD respectively) (Agilent
6890 N gas chromatograph Agilent Technologies 6957 B inert MSD)
The configuration of the columns and the detectors are as follows
1 15 m long DB-1 guard-column + 60 m long analytical DB-1 column
connected to the MSD Helium was used as carrier gas at 20 mlmin flow
rate The chromatographic method was developed in such a way to
separate the oxygenates on the DB-1 columns (Figure 225) The MSD
was operated in Solvent Delay mode until 4 minutes in order to protect the
filament and electron-multiplier damage caused by the oxygen and high
steam content of the analyzed gas mixture Therefore the part of the
chromatogram below 4 minutes was not shown on the MSD
2 1 m long HaysepQ guard column + 30 m long Plot Q analytical column +
30 m long Plot Molesieve analytical column The molesieve column could
be bypassed by means of a switching valve in order to avoid that polar
compounds enter in this column The detector was a TCD Helium was
used as carrier gas at 70 mlmin constant flow rate
The method was developed in such a way to enable separation and quatitation of C3H8
C3H6 H2O N2 CO and CO2 (Figure 226) The critical separations were the C3H6-C3H8
and the O2-N2 peak pairs respectively The peak resolution of the critical separations was
calculated based on Equation 227 [7]
)722 ( )(2
1
1Equation
ttR
ii
iRiR
s ωω +
minussdot=
+
+
The criterion for baseline separation is that the resolution is higher than 15 (Rs gt 15)
[7] The resolution of the C3H6-C3H8 and O2-N2 is higher than the limit of 15 (Table
222) Therefore the above method is good with respect to peak resolution
56
0 2 4 6 8 10 12 14
00
10x105
20x105
30x105
40x105
50x105
60x105
40
80
120
160
200
240
Intensity (au)
t (min)
1
2
GC Oven Temperature (deg)
Figure 225 Detection at the MSD 1 acetic acid 2 acrylic acid
0 2 4 6 8 10 12 14
00
25x106
50x106
75x106
40
80
120
160
200
240
Intensity (au)
t (min)
1
2
3
4
5
6
7
GC Oven Temperature (deg)
Figure 226 Detection at the TCD 1 carbon- dioxide 2 water 3 propylene 4 propane 5
oxygen 6 nitrogen 7 carbon-monoxide valve switching
57
Table 222 The resolution for the peak-pairs which elute close to each other
Peak-pair number Peak-pair Rs
3-4 C3H6-C3H8 25 5-6 O2-N2 53
The total length of the analysis time was 15 minutes Gas sampling was performed at
every 17 minutes Therefore the method was satisfactory with respect to the sampling
frequency (35h) In case of the acrolein and CO oxidation experiments (sections 426
and 427) the number of components were less therefore the analysis time could be
further reduced (to 10 and 8 minutes respectively)
226 Calibration of the GC-MS
For the calibration with C3H8 and O2 the pure gases (supplied by Westfalen 9995)
were mixed with nitrogen (Westfalen 9995) For the calibration with products (C3H6
CO CO2) and low concentrations of C3H8 and O2 gas mixtures with certified
concentrations were used (supplied by Westfalen) The composition of calibration
mixture 1 was the following 105 vol C3H8 103 vol C3H6 balance N2 The
calibration mixture 2 consisted of 104 vol CO 102 vol CO2 106 volO2 463
vol N2 and balance He
These mixtures were dosed via mass flow controller and diluted further with nitrogen
The resulting gas mixtures were analyzed by the GC-MS The peaks were integrated and
the peak areas were represented with respect to the concentrations (Figure 227)
Weighted linear regression was performed in order to determine the sensitivity (the
weighting factor being given by the standard deviation of the repeated measurements)
For the calibration of oxygenates a saturator was used to saturate a gas stream of
nitrogen The acetic acid and acrylic acid was used with a pa quality solutions supplied
by Merck Ca 15 ml of liquid was poured in the saturator and nitrogen was bubbled
through it with a flow rate of 15 mlnmin The temperature of the bubbler was controlled
by a HAAKEreg thermostat The vapor pressures of theses acids at different temperatures
are shown in the Table 223
58
Table223 Vapor pressures of acetic- and acrylic acid at around room temperature [11]
T(degC) pHAc (bar) pAA (bar)
15 00079 00017
20 00109 00025
25 00149 00036
00 05 10 15 20 25 30 35
00
40x107
80x107
12x108
16x108 C3H8 C3H6 CO CO2
Peak area (au)
Concentration (vol)
00 02 04 06 0800
40x107
80x107
12x108
AA HAc
Peak area (au)
Concentrations (vol)
Calibration of the TCD Calibration of the MSD
Figure 227 Calibration graphs
The vapor pressure of these oxygenates are too high at temperatures above 20degC
compared to that observed usually in the catalytic experiments On the other hand both
acids freeze at around 13degC therefore lower concentrations are not achievable only by
using the saturator Therefore in order to avoid extrapolations the mixture was further
diluted with nitrogen using the second nitrogen line The calibration graphs of the
oxygenates are shown in Figure 227
The sensitivity of the TCD is known to be stable over a relatively long time (months) but
the MSD is much less stable Therefore the TCD was recalibrated every 3-4 months
while much frequent (weekly) recalibration was needed for the MSD In order to take
into account the daily variation of the MSD sensitivity every day a solution of 05 vol
acetic acid in acetonitrile solvent was injected using the liquid injector port of the GC
(Agilent Technologies 7683 B Series Injector) The relative sensitivity was determined
every day with respect to the sensitivity determined from the multi-point calibration
59
described above For the calculation of the concentration of oxygenates the actual
relative sensitivity was also taken into account
227 Data analysis
The gas hourly space velocity (GHSV) was calculated based on the volume of the
catalyst (Vcat) loaded in the reactor and the feed total flow rate ( totVbull
) (Equation 228)
Whenever the density of the catalyst was not determined with the sufficient precision the
weight hourly space velocity was used (WHSV) which is calculated based on the mass of
the catalyst and the total flow rate of the feed The contact time (WF or τ) is the
reciprocal value of the weight hourly space velocity The volumetric flow rates were
considered at normal conditions (mln)
)1022 ( )(
)922 ( )(
)822 ( )(
1
Equationml
sg
V
mFW
Equationhg
ml
m
VWHSV
EquationhV
VGHSV
tot
cat
cat
tot
cat
tot
sdot==
sdot=
=
bull
bull
minus
bull
τ
For primary data analysis the conversion selectivity and yield was calculated under every
condition The educt conversion (XEduct) was defined as the ratio between the consumed
amount of educt and the initial concentration (Equation 2211) The product selectivities
(SPi) were calculated by dividing the amount of formed product by the amount of
transformed educt (Equation 2212) The product yield (YPi) was calculated as the
product between the conversion and the selectivity (Equation 2213) while the carbon
balance (C-balance) as the ratio between the initial concentration of the educt and the
sum of the concentrations of the carbon containing species measured at the reactor outlet
(Equation 2213)
60
)1422 ( () 100
cn
n
)1322 ( ()
)1222 ( () 100
cn
n
cn
n
S
)1122 ( () 100
0
n
1iP
Educt
iP
n
1iP
Educt
iP
iPEduct
iP
iP
0
0
Equationc
balanceC
EquationSXY
Equation
Equationc
ccX
Educt
i
iPEductiP
i
Educt
EductEduct
Educt
sdot
sdot
=minus
sdot=
sdot
sdot
sdot
=
sdotminus
=
sum
sum
=
=
The consumption and formation reaction rate was determined as
)1522 ( )( 0Equation
sg
molccr
ii
i sdot
minus=
microτ
The apparent activation energy (Ea) and the preexponential factor (lnA) were determined
from the linearized Arrhenius-equation
)2216 ( lnln EquationTR
EAr a
i sdotminus=
The activation enthalpy (∆H) and activation entropy (∆S) were calculated based on the
linearized Eyring-Polanyi equation
)1722 ( lnln EquationTR
H
R
S
h
k
T
r Bi
sdot∆
minus
∆+=
nene
61
23 Catalyst synthesis and characterization
This section describes the preparation of the catalysts which were used for catalytic and
kinetic studies reported in chapter 4 Besides the description of the preparation method
the results of physico-chemical characterization are also reported here
231 The synthesis of phase pure M1 MoVTeNbOx catalyst
The phase-pure M1 MoVTeNbOx catalyst was prepared in a relatively large batch (ca 50
g) according to the procedure developed by detail by Kolen`ko et al [8 ] This method is
adapted from Ushikubo et al [9] which lead to M1+M2 phase mixture The phase-pure
M1 material was obtained by the washing route described by Baca et al [10]
9286 mmol ammonium-heptamolybdate (AHM (NH4)6Mo7O244H2O) and 19500 mmol
NH4VO3 was dissolved in 1500 ml MQ water at 80degC The solution was cooled to 40degC
and 14950 mmol solid Te(OH)6 was added to it and dissolved 8125 mmol
NH4[NbO(C2O4)2]middotxH2O was dissolved in 500 ml MQ water at 40degC The two solutions
were mixed up and diluted to a total volume of 2500 ml by MQ water giving a solution
with a nominal metal ion concentrations normalized to molybdenum equal to
MoVTeNb=10300230125 This solution was stirred for 30 min at 40degC then spray-
dried in a Buumlchi B-191 spray-dryer The resulting solid material was calcined at 275 degC
for 1 h in synthetic air flow of 100 mlnmin followed by annealing in a Xerion rotary
tube furnace 600 degC for 2 hours in Ar flow (100 mlnmin) [2 8] A crystalline phase
mixture was produced (internal identification number 6057) consisting of 63 M1 and
37 M2 phase The BET surface area was found to be 5 m2g while the SEM indicated
large spherical aggregates The M2 phase was dissolved by treatment with 15 H2O2
solution and stirring for 24 hours After washing by distilled water and drying the
remaining solid (internal identification number 6058) was a phase pure M1 material with
a surface area of 19 m2g The SEM revealed rod-like morphology while aggregate
formation was not characteristic to this sample The shape of the ab plane is ill defined
and rather porous Finally the washed sample was activated at 600degC for 2 hours in the
rotary tube furnace under argon flow
62
Table 231 The properties of the phase-pure M1 catalysts 6059 6902 and 8947
6059 6902 8947
BET SA (m2g) 88 75 102
Phase comp M1 M1 M1
Unit cell
parameters (Aring)
Pba2 (no 32)
a=211255(2)
b=266145(2)
c=40137(2)
a=211201(1)
b=266088(2)
c=4015342)
a=211462(2)
b=266312(3)
c=401454(3)
Elem Comp MoV026Te010Nb022Ox MoV023Te010Nb024Ox --
Figure 231 The TEM image of the catalyst 6059
The resulting material (internal identification number 6059) exhibited a BET surface
area of 9 m2g The nitrogen adsorption isotherm is of type III characteristic to a
macroporous material (isotherm not shown) Because there are no meso- or micropores
internal mass transport limitation is not expected to occur In the section 223 it is shown
that the effectiveness factor is above 095 which proves that the internal mass transport
limitation is indeed negligible
63
In the XRD pattern the reflections corresponded to the phase-pure M1 material (ICSD
55097) (Figure 232) The degree of crystallinity was found to be ca 85 using rutile
TiO2 SRM 674b as internal standard The lattice parameters were determined after
Rietveld refinement (Table 231)
The TEM images revealed rod-like morphology (Figure 231)
A second batch activated from sample 6058 got the internal identification number of
8947 This showed very similar XRD pattern and catalytic properties to that of 6059
0 10 20 30 40 50 60
Intensity (au)
2 Θ Θ Θ Θ (deg)
6059 6902 8947
Figure 232 The XRD pattern of 6059 6902 and 8947
A repeated synthesis gave the sample 6902 with a similar physico-chemical and
catalytic properties with the 6059 sample This suggests the reproducibility and
reliability of the relatively large scale synthesis method reported by Kolen`ko et al [8]
References Chapter 2
1 L C Jozefowincz H G Karge E NacuteCoker J Phys Chem 98 (1994) 8053 2 M Haumlvecker S Wrabetz J Kroumlhnert L I Csepei R Naumann dacuteAlnoncourt
Yu V Kolenacuteko F Girgsdies R Schloumlgl A Trunschke J Catal submitted 3 M Baerns et al Technische Chemie Wiley-VCH 2006 145-193 4 E A Burgermeister W von Muench E Pettenpaul J Appl Phys 50 9 (1979)
5790-5794
64
5 M Baerns H Hofmann A Renken Chemische Reaktionstechnik Lehrbuch der Chemie Volume 1 Georg Thieme Verlag 3rd Edition 1999
6 I Griszligtede Die partielle Oxidation von Propan zu Acrlysaumlure Bestimmung der Reaktionskinetik und in-situ Charakterisierung des Katalysators unter Betriebsbedingungen Dissertation Universitaumlt Karlsruhe 2004 Universitaumltsverlag Karlsruhe ISBN 3-937300-17-1
7 R L Grob E F Barry Modern practice of gas chromatography 4th Ed 2004 25-65 A Braithwaite Chromatographic methods 5th Ed Kluwer Acedamic Publishers 1999 17-40
8 Yu V Kolen`ko W Zhang R Naumann d`Alnoncourt F Girgsdies T W Hansen T Wolfram R Schloumlgl A Trunschke submitted ChemCatChem 2011
9 T Ushikubo K Oshima A Kayou M Hatano X Can Li Stud Surf Sci and Catal 112 (1997) 473-480
10 M Baca J M M Millet Appl Catal A General 279 (2005) 67-77 11 wwwfluidatcom
65
Chapter 3 Structural stability of the M1 MoVTeNbOx catalyst
under propane oxidation conditions
31 Abstract
In this section the details and results of the in-situ XRD experiment are described in
which the bulk structural stability of the phase-pure M1 MoVTeNbOx under real reaction
conditions catalyst was addressed XRD diffractograms were recorded during the long
term catalytic experiment on propane oxidation reaction whereby different conditions
(steam containing and steam free net reducing stoichiometric and net oxidizing feed
compositions) The evaluation of the XRD patterns revealed that the catalyst phase purity
was not affected under any of the conditions Therefore the bulk structure of the catalyst
is stable and constant during the propane oxidation reaction
32 Introduction
Upon reviewing the literature of propane oxidation on Mo and V based oxides only a few
studies were found which addressed the question of bulk structural stability of the
catalyst under working conditions However the information concerning structural
stability under reaction conditions is an absolute prerequisite for proper catalytic kinetic
and structure-activity relationship studies
The stability of the catalyst might be influenced by different factors
bull The temperature is one of the most important ones Upon the catalyst formulation
usually the thermal treatment or activation is the last step when the desired
crystal structure is developed The activation is usually carried out at higher
temperature than the reaction temperature Therefore it is not expected that under
reaction conditions the temperature plays a role in the stability provided that the
reaction is carried out isothermally and hot-spots do not form on the catalyst
surface However because the activation is carried out in inert atmosphere (argon
or helium) and it is not evident that the catalyst is stable in presence of feed at
66
reaction conditions even if the reaction temperature is inferior to the activation
temperature
bull The redox potential When a reducing feed is used the catalyst might be reduced
which leads to change in the composition and in severe cases to the
transformation of the crystal structure On the other hand when oxidizing feed is
used and if the constituting metal ions are not in the highest oxidation state these
ions may be oxidized which also may induce phase change if the structure is not
flexible enough Grasselli et al carried out redox pulse experiments using a
phase-pure M1 MoV025Te011Nb012Ox catalyst By applying 120 pulses consisting
of C3H8 and NH3 the catalyst could be reduced as deep as 70 atomic layers of the
lattice and then reoxidized by oxygen without structural collapse [1] This showed
the stability of the catalyst bulk structure under reducing conditions Of course
under reducing conditions the product distribution changed and the propylene
formation prevailed However it was not shown whether the reoxidized catalyst
shows the same conversion and selectivity or not Zenkovets et al has also shown
that the (MoVW)5O14 may be reduced by hydrogen without structural
transformation [2]
bull The presence or absence of steam in the feed Water is a reaction product of
oxidation catalysis However frequently a high steam content (20-40 vol) is
needed to introduce in the feed for optimal catalytic performance Novakova et al
observed that in absence of the steam the catalytic performance of the
MoV03Sb025Nb008Ox (mixture of (MoVNb)5O14 (MoV)5O14 MoNbOx and
SbVOx phases) drops and the phase composition also changes [3] Upon re-
introducing the steam in the feed neither the initial phase composition nor the
catalytic performance was established Griszligtede noted that the pretreatment of the
MoV033Nb017Te025Ox catalyst at 140degC for 24 hours in the reactor using a gas
mixture consisting of 50 vol steam and 50 vol nitrogen is necessary to achieve
high selectivity (69) When the pretreatment was done with a mixture
containing only 10 vol steam the highest selectivity was around 40 Without
evidences from XRD measurements it was assumed that the steam promotes the
formation of the selective phase [4] Recknagel also supposed that the better
67
catalytic performance in acrolein oxidation to acrylic acid is due to phase change
induced by steam [5]
bull Griszligtede noted that when propane was switched to propylene in the feed the
conversion and selectivities reached the steady state only after 72 hours time on
stream Without further experimental evidences (eg XRD) this observation was
also accounted for the altering of the phase composition
bull The formation of the selective VPO phase (documented by XRD study) was
described under propane oxidation conditions by feeding propane and oxygen at
430degC then decreasing the temperature to 400degC and introducing steam [6-8]
As shown in the above enlisted literature sources there is not enough information
concerning to the
bull bulk structural stability of the phase pure Mo and V based oxide catalysts under
various reaction conditions (steam containing and dry feed low and high oxygen
content and switching from propane to propylene as educt)
bull eventual coupling between kinetics of the solid state transformation and the
kinetics of the surface catalyzed reaction
Therefore within this work foremost the above open questions were addressed In order
to find out whether under real reaction conditions phase transformation occurs or not an
in-situ XRD experiment was carried out at different steam contents and oxygen
concentrations In the section 33 the results of this experiment are summarized
For the study of the effect of steam and oxygen content on the stability under reaction
conditions experiments were carried out to vary these parameters in the fixed bed reactor
as well The catalytic performance was found to be constant over the time at any steam
content (including dry feed) and any initial oxygen concentration (sections 422 and
424) The reaction was followed for relatively long time (up to 4 hours at every space
velocity) and neither deactivation in time nor change in the selectivity was observed The
conversion measured in dry feed was found to be lower compared to the steam containing
feed Upon switching back from dry feed to the steam containing feed the catalytic
68
properties were found to be the same as before (section 422) Therefore in contrast to
the finding of Novakova et al [3] reported for the MoVSbNbOx catalyst the catalytic
properties of MoVTeNbOx are reversible when exposing it to dry feed
When the reaction was operated under reducing conditions the propane conversion was
found to be lower than in the case of stoichiometric or net oxidizing feed After
performing the reaction under reducing conditions stoichiometric feed was used again
The conversion and selectivity was comparable to that measured under reducing
conditions but it converged slowly to the value measured before exposing the catalyst to
reducing conditions (section 424 and 431)
33 In-situ XRD study on the effect of steam and oxygen
The experiment was carried out using a STOE Stadi P type diffractometer in a theta-theta
arrangement equipped with a Cu Kα1 radiation source (wavelength=154060 Aring) and a
scintillation detector A mass of 02107 g catalyst was placed in the sample holder of the
XRD setup The feed consisting of steam propane oxygen and balance helium was
supplied via heated stainless steel tubing in order to avoid condensation of the steam For
the introduction of the steam a bubbler attached to a HAAKEreg thermostat was used The
total flow rate was always 176 mlnmin giving a gas hourly space velocity of 5000 h-1
The rationale behind choosing this space velocity is that the maximum productivity in the
fixed bed reactor experiments was observed between 4500 and 9000 h-1 space velocity
(described in detail in sections 421 422) Therefore the bulk structure was envisaged to
be probed by XRD under the highest performance of the catalyst The gas mixture
leaving the XRD cell was analyzed by an OmnistarTM mass spectrometer The following
fragments were monitored in time 12 13 14 16 17 18 28 29 30 31 32 40 41 42
43 44 45 56 60 and 72
69
XRD scans were performed under every condition as follows
1 in helium (100) at room temperature
2 in helium (100) at 400degC
3 C3H8O2H2OHe=362071 vol 400degC
4 C3H8O2H2OHe=33094 vol 400degC
5 C3H8O2H2OHe=3450925 vol 400degC
6 C3H8O2H2OHe=36091 vol 400degC
7 C3H8O2H2OHe=39088 vol 400degC
8 C3H8O2H2OHe=312085 vol 400degC
9 C3H8O2H2OHe=312580 vol 400degC
10 C3H8O2H2OHe=30592 vol 400degC
11 C3H8O2H2OHe=30097 vol 400degC
12 C3H8O2H2OHe=30097 vol 400degC scan performed after long time on
stream (24 hours) under this strongly reducing condition
13 in helium (100) at room temperature
Repeated scans were performed at every condition in order to be able to observe if
eventually slow solid state transformation occurs The second reason for repeated
acquisition of the patterns is that to improve the data quality for the Rietveld refinement
The total length of the experiment was 2 weeks
First scans were made at room temperature and 400degC as well in pure helium (condition
1 and 2) Then a measurement was performed using stoichiometric feed and 20 vol
steam (condition 3) In the next step both the oxygen and steam was changed to 3 and 0
vol respectively (condition 4) In the next four conditions (5 6 7 and 8) the oxygen
content was increased from 45 (reducing) to 6 (stoichiometric) to 9 and 12 (net
oxidizing) in dry feed In the next condition 5 vol steam was introduced while keeping
the initial oxygen concentration at 12 vol The condition 10 corresponds to strongly
reducing feed (0 vol O2) in presence of 5 vol steam while in the last condition (11)
the feeding of steam was also stopped The scanning was continued while exposing the
catalyst to this extreme condition (12) for long time (ca 24 hours) After this the propane
was switched off and the final scans were recorded at room temperature in helium flow
70
The XRD patterns shown in Figure 331 indicated that under reaction conditions from 3
to 11 no new peak appeared ie no new phase was developed irrespective of the steam
content or the redox potential of the gas mixture Only slight changes were observed in
the peak intensities and positions More pronounced decrease in the peak intensity was
observed upon exposing the catalyst to extreme reducing condition (propane in helium)
for long time but the absence of a new peak suggested that no new phase was formed
The XRD patterns were evaluated quantitatively as well Rietveld refinement showed that
all the patterns correspond to phase-pure M1 MoVTeNbOx therefore phase
transformation during all the above conditions could be ruled out The lattice parameters
are shown in Figure 332
1 2 3 4 5 6 7 8 9 10 11 12 13
10
20
30
40
50
60
2 Theta (deg)
Condition
Figure 331 The XRD patterns recorded under different reaction conditions
71
0 1 2 3 4 5 6 7 8 9 10 11 12 13 14
0200400
212502150021750
267527002725
396400404
T (degC
)a (Aring)
b (Aring)
c (Aring)
Figure 332 The lattice constants determined for every condition
First it can be seen that upon heating up the catalyst in helium anisotropic lattice
expansion occurs ie the thermal expansion occured preferentially along the c and a axis
while the b lattice parameter was unaffected Under reaction conditions ranging from 3-
11 no change was observed in any of the lattice constants irrespectively of the steam
content or the redox potential However upon exposing the catalyst to extreme reducing
conditions for long time the a and b lattice constants were increasing while the c was
decreasing Finally anisotropic contraction along the c axis was observed also upon
cooling down the catalyst in inert atmosphere
The mass spectrometric data recorded during the in-situ XRD experiment was also
evaluated Because the sensitivity of a mass spectrometer changes over the time the
conversion and selectivity data could not be determined with the usual precision obtained
at the PropOx-1 fixed bed reactor setup Therefore the current of mz=72 fragment
corresponding to the acrylic acid was normalized with respect to helium The signal was
averaged over the time for every condition (Figure 333) For comparison the
concentration of the acrylic acid determined in PropOx-1 setup corresponding to three of
the conditions is shown in the same graph It can be observed that the results are
72
comparable The differences may be accounted to the fact that the MS data is only semi-
quantitative while the GC-MS data is quantitative (section 22) Furthermore the other
reason might be that the sample holder cell o the in-situ XRD setup has a very different
geometry compared to the PropOx-1 setup described in the section 22
1 2 3 4 5 6 7 8 9 10 11 12 13
0000
0002
0004
00
02
04
06
Norm
alized average intensity m
z=72 (au)
Condition
Concentration of AA Propox1 (vol
)
Figure 333 The normalized average intensity corresponding to acrylic acid during the in-situ XRD
experiment monitored by on-line MS (black squares) The concentration of acrylic acid determined in the PropOx-1 fixed bed reactor (blue dots)
34 STEM analysis of the catalyst before and after
the in-situ XRD experiment
The catalyst sample was analyzed by means of scanning transmission electron
microscopy (STEM) before and after the in-situ XRD experiment The elemental analysis
was performed by EDX at selected spots
The STEM images are shown in Figure 341 It can be observed that the particle size was
not affected by the reaction However the images corresponding to the post-catalytic
sample revealed pitting-like holes on the particles The occurrence of the voids is
statistically distributed and the void size is approximately the same This suggests that the
transformation from the initial to the final state of the catalyst is not a topotactic
transformation (ie no reaction front can be observed)
73
Before reaction
After reaction
Figure 341 STEM images of the catalyst before and after the in-situ XRD experiment
The elemental mapping of the particles before reaction showed homogeneous distribution
of all the constituting elements (Figure 342) In contrast to this the post catalytic sample
showed a very heterogeneous distribution of the oxygen supporting the fact that the
catalyst was indeed reduced Depletion of the tellurium content was also observed in the
spots marked with red crosses in the Figure 343
100 nm100 nm100 nm100 nm100 nm
100 nm 20 nm20 nm20 nm20 nm20 nm
20 nm
50 nm50 nm50 nm50 nm50 nm
100 nm 20 nm20 nm20 nm20 nm20 nm
20 nm
74
Figure 342 The elemental mapping of the catalyst before reaction
Figure 343 The elemental mapping of the catalyst after reaction
O Nb
Te V Mo
Mo V Te
Nb O
75
35 Conclusions
Upon reviewing the literature dealing with selective oxidation of propane to acrylic acid
it was found that the information concerning the structural stability or instability of the
catalyst is seldom reported Novakova et al has shown that the deactivation of the
MoVSbNbOx phase mixture in dry feed is irreversible and it is a consequence of
irreversible change in the phase composition Griszligtede also reported the decay of the
catalytic performance over the MoVTeNbOx catalyst but no information was provided
about the phase composition either before or after the catalytic experiments
The motivation for the work presented in this section is the fact that the structural
stability of a catalyst under various reaction conditions is a criterion for the proper
catalytic and kinetic study
In-situ XRD study was performed on the effect of steam and the oxygen concentration
using a phase-pure MoVTeNbOx catalyst The measurements were done at the space
velocity corresponding to the maximum productivity of the catalyst The steam content
was varied between 20 and 0 vol while the redox potential of the feed between net
oxidizing stoichiometric moderately reducing conditions Neither the XRD patterns nor
the lattice parameters were changing significantly under these conditions suggesting that
the catalyst bulk structure is robust enough to withstand the variation of the parameters in
such a broad interval At the end very strongly reducing feed (3 vol propane and 97
vol helium) was applied for long time on stream as well No new peak appeared in the
XRD pattern indicating that no new phase appeared but the lattice constants changed
under this extreme condition Additionally the STEMEDX analysis of the spent catalyst
revealed that pitting-like holes appeared on the catalyst particles and depletion of the
tellurium content was also noted
However the bulk structure of the used phase-pure M1 MoVTeNbOx catalyst is stable
under conditions relevant to catalytic applications Therefore the kinetics of the
heterogeneously catalyzed reaction is not coupled with any solid-state transformation
The next chapter reports the catalytic and kinetic study of propane oxidation over the
phase-pure M1 MoVTeNbOx catalyst
76
References Chapter 3
1 R K Grasselli D J Buttrey J D Burrington A Andersson J Holmberg W Ueda J Kubo C G Lungmair A F Volpe Top Catal 38 (2006) 7-16
2 G A Zenkovets G N Kryukova V Yu Gavrilov S V Tsybulya V A Anufrienko T A Larina D F Khabibulin O B Lapina E Roumldel A Trunschke T Ressler R Schloumlgl Materials Chemistry and Physics 103 (2007) 295-304
3 E K Novakova J C Veacutedrine E G Derouane Catalysis Letters 83 3-4 (2002) 177-182
4 I Griszligtede Die partielle Oxidation von Propan zu Acrylsaumlure Bestimmung der Reaktionskinetik und in-situ Characterisierung des Katalysators unter Betriebsbedingungen Dissertation Universitaumlt Karlsruhe 2004 Universitaumltsverlag Karlsruhe ISBN 3-937300-17-1
5 R Recknagel Chemische Technik 46 6 (1994) 324-331 6 G Landi L Lisi J C Volta Chem Commun 9 4 (2003) 492-493 7 G Landi L Lisi J-C Volta J Mol Catal A 222 (2004) 175-181 8 G Landi L Lisi J C Volta Catal Today 91-92 (2004) 275-279
77
Chapter 4 Kinetic studies of propane oxidation to acrylic acid on a phase-pure
MoVTeNbOx catalyst
41 Abstract
A detailed kinetic study is presented for the phase pure M1 MoVTeNbOx catalyst
Kinetic studies including the effect of temperature steam- propane- and oxygen content
variation were performed The oxidation of propylene acrolein carbon monoxide and
water gas shift reaction gave important additional information concerning the reactivity
of the intermediates and reaction pathways respectively Catalytic experiments were
performed also in a two-stage reactor system consisting of two reactor tubes connected
serially
42 Kinetic studies on phase-pure M1 MoVTeNbOx
According to the motivation of the present work a phase-pure and structurally stable
MoVTeNbOx catalyst was envisaged for detailed kinetic study in the propane oxidation
reaction The exceptional stability of the phase-pure M1 MoVTeNbOx catalyst under
catalytically relevant reaction conditions was evidenced in the Chapter 3 In this chapter
the results of the kinetic and catalytic experiments are presented The temperature
propane- oxygen- and steam contents were varied Furthermore the reactivity of the
oxidation in propylene intermediate was carried out in the temperature interval
corresponding to propane oxidation reaction (360-400degC) and high space velocity
(typically 20000 and 80000 h-1) The effect of steam on propylene oxidation was also
studied
Acrolein oxidation was carried out in the typical temperature interval corresponding to
propane oxidation and very high space velocity (GHSV=250000 h-1)
CO oxidation and water gas shift reaction was carried out in the temperature interval of
propane oxidation for revealing the secondary pathways that CO might be involved in
On the other hand the CO oxidation activity was used as a proxy for the amount of
electrophilic oxygen species on the catalyst surface
A two-stage reactor system was used for studying the effect of stage-wise addition of
different gases (O2 N2O C3H6 CO and CO2)
78
The oxygen addition in the two-stage reactor design revealed that the acrylic acid yield
can be increased in contrast to the oxygen content variation in the conventional single-
tube fixed bed reactor
Nitrous oxide addition showed no effect on the reactivity Moreover the nitrous oxide
conversion was found to be zero under every condition suggesting that the phase pure
M1 MoVTeNbOx catalyst is not reoxidized by N2O
The product distribution upon propylene addition in the two-stage reactor revealed that
acrylic acid acetic acid carbon monoxide and carbon dioxide are formed from
propylene
Upon addition of CO in the two stage reactor no change in the catalytic activity was
observed CO was not further oxidized which suggests that this is an inert end product
besides the CO2 Furthermore this experiment indicated a very low abundance of the
electrophilic oxygen species during propane oxidation reaction
The addition of CO2 in the two-stage reactor showed also no influence on the product
distribution of propane oxidation reaction
421 Variation of the contact time and temperature
For the kinetic study the contact time was varied up to 202 gsml by changing the flow
rate and the catalyst mass The experiments were performed at 360 380 and 400degC The
feed composition was kept constant at C3H8O2H2ON2=364051 vol
The dimensionless concentration profiles corresponding to all the detectable compounds
(propane propylene acrylic and acetic acid CO and CO2 respectively) are presented in
the Figure 421 The normalization of the concentrations was done by dividing the actual
concentrations with the initial concentration of propane By numerical differentiation of
the concentration-contact time curves it is possible to obtain the rates of propane
consumption and the rates of product formation respectively Strictly speaking the rates
can be obtained only in the differential regime because by definition within the
differential regime the concentrations change linearly with the contact time In the
integral regime the curves deviate from linearity therefore the rates depend on the extent
of the reaction Highly nonlinear concentration profiles can be observed for the reaction
79
products above 01 gsml contact time Though for the qualitative description of the
kinetic curves the rate of propane consumption and product formation is considered
irrespective of the integral or differential mode
The highest acrylic acid productivity is observed in the integral regime For this reason
in order to find out the effect of operational variables (temperature redox potential and
the steam content) and optimize the acrylic acid yield it was necessary to carry out the
experiment also in the integral mode
In this section the effect of temperature on the catalytic properties and kinetic rate
constants are presented
Qualitatively the concentration profiles can be described as follows
The propane consumption rate increases with temperature
Propylene is the first intermediate of the reaction as indicated by a curve that passes
through a maximum
The CO2 and CO formation rate increases with the temperature However the CO
formation rate was found to be higher than the CO2 formation rate Thermodynamically
the carbon monoxide may be further oxidized to CO2 This could mean that possibly CO
is formed first and in a consecutive step it may be oxidized to the thermodynamically
favored product CO2 If CO would be readily further oxidized to CO2 a maximum
would be observable in the CO concentration profile However in the studied contact time
interval the CO concentration profile does not show a maximum at any temperature
Measurements at higher contact times were avoided because of complete oxygen
conversion Therefore from these data the CO oxidation can neither be stated nor refuted
The reactivity in CO oxidation over MoVTeNbOx catalyst was addressed in a separate
series of experiments The results are presented in detail in subchapter 427 As it is
shown there the CO oxidation and water gas shift activity is negligible under the reaction
conditions relevant for the selective oxidation reactions Therefore CO and CO2 are
formed in independent pathways during the propane propylene and acrolein oxidation
reactions
The acetic acid is a minor byproduct which appears at contact times higher than 01
gsml No maximum can be observed on the concentration profile though it can not be
stated whether it is a relatively stable end product or it is further oxidized to CO or CO2
80
00 05 10 15 2000
02
04
06
08
10
12
360degC
380degC
400degCy C
3H8
WF (gsml)
00 05 10 15 20
000
001
002
003
004
005
006 360degC
380degC
400degC
y C
3H6
WF (gsml)
C3H8 C3H6
00 05 10 15 20
00
01
02
03
04
05 360degC
380degC
400degC
y AA
WF (gsml)
00 05 10 15 20 25
000
004
008
012
016
020 360degC
380degC
400degC
yHAc
WF (gsml)
AA HAc
00 05 10 15 20 25
00
01
02
03
04
05 360degC
380degC
400degC
y CO
WF (gsml)
00 05 10 15 20 25
00
01
02
03
04
05 360degC
380degC
400degC
y CO2
WF (gsml)
CO CO2
Figure 421 The evolution of concentrations with the residence time at different temperatures Squares ndash experimental data dashed curves ndash fitted kinetic curves based on reaction model 1 (for modeling see
section 64) Feed composition C3H8O2H2ON2=364051 vol Catalyst ID=6059
81
The acrylic acid is the desired product of the reaction Its concentration ndash therefore its
formation rate as well ndash increase with the contact time and reaction temperature
However above 15 gsml contact time the conversion of oxygen approaches 100
which leads to a high redox potential gradient along the reactor High oxygen conversions
were avoided because the catalyst particles in the bottom of the catalytic bed are reduced
and the kinetics may change with the reduction degree of the catalyst surface The
maximum acrylic acid yield was 25-30 depending on the temperature
422 Variation of the steam content
The steam content variation was performed in the interval between 0 and 40vol and for
a contact time up to 090 gsml (GHSV=4500 h-1) The feed consisted in every case of 3
vol propane and 6 vol oxygen The steam content was decreased from 40 to 0 vol
by steps of 10 vol the balance being N2 at a reaction temperature of 400degC
The experiments presented here were started up with steam containing feed (40 vol)
then the steam content was then reduced by 10 vol The catalytic properties were
measured for relatively long time in dry feed in order to be able to observe if deactivation
occurs Subsequently the catalytic performance was re-measured using 20 vol steam
containing feed
The ldquoreasonably long term stabilityrdquo of the catalytic properties in steam free feed is
demonstrated in Figure 422 The adjective of reasonability in the context of long term
stability is related here to the time resolution of the used analytical methods As shown in
the Experimental part (section 225) the gas chromatographic setup has a time
resolution of one injection17 minutes On the other hand in situ XRD experiments were
carried out on the effect of oxygen and steam (Chapter 3) The time resolution of the
XRD setup is several hoursscan
As shown by Figure 422 the stability in time of the catalytic performance exceeds
satisfactorily the gas chromatographic analysis time Neither catalyst deactivation nor
change in the selectivity was observed within the studied time on stream intervals up to 4
hours at different space velocities The stability of catalytic performance makes possible
to perform the kinetic study of propane oxidation also under steam free feed conditions
82
It has to be emphasized that even if no steam is fed in the reactor water is produced by
the reaction on the active sites of the catalyst Therefore it would be improper to state
that the experiments were carried out under dry conditions Moreover there is a gradient
of produced water concentration along the catalytic bed Indeed the chromatographic
analysis of the reactor effluent gas showed a detectable amount of water However due to
highly asymmetric peak shape and low peak area the quantification of the formed water
was difficult
It is important to notice that at a contact time of 0227 gsml (GHSV=18000 h-1) the
conversion is low and at the limit of the differential operation mode The most abundant
product is propylene with a selectivity of ca 50 The acrylic acid selectivity is quite
low and acetic acid is not produced at all
At lower space velocities the conversion increases and the selectivity to acrylic acid
becomes higher than the propylene selectivity Additionally acetic acid appears as
byproduct Below the space velocity of 9000 h-1 the selectivity to acrylic acid decreases
due to total oxidation In every case however the selectivity to CO was higher than the
selectivity to CO2
0 100 200 300 400 500 600 700
0
10
20
30
40
50
60
70
80
90
100
GHSV=
2500h-1
GHSV=
4500h-1GHSV=9000h
-1
Conversion Selectivity Yield ()
X C3H8 X O2 S AA S CO2 S C3H6 S HAc S CO Y AA C-bal
TOS (min)
GHSV=18000h-1
Figure 422 The stability of catalytic performance in steam-free feed
83
After performing the catalytic performance in dry feed the catalytic properties were re-
measured using a feed mixture containing 20 vol steam Upon immediate switching
from dry feed to steam containing feed the conversions and selectivities were found to be
constant over the time on stream within experimental errors Moreover the catalytic
performance was the same as before exposing the catalyst to dry feed (Figure 423)
This suggests that the catalyst responds dynamically to the changes of the steam content
in the feed The changes are completely reversible and faster than the gas
chromatographic analysis time of 17 minutes The productivity of the catalyst expressed
in terms of conversion of propane the selectivity and yield to acrylic acid is displayed on
Figure 423 at a space velocity of 18000 9000 and 4500 h-1 (WF=0228 0455 and
0904 gsml respectively)
In the concentration interval between 20 and 40 vol the catalytic performance is not
influenced significantly by the steam
Below a steam content of 20 vol both the conversion and selectivity drops
dramatically Nevertheless in contrast to the observation reported by Novakova et al [1]
this drop is reversible after switching back to the feed containing 20 vol steam the
conversions and selectivities were comparable to those determined before exposing the
catalyst to dry feed
20 0 20 400
20
40
60
80
100
Conversion Selectivity ()
H2O concentration in feed mixture (vol)
XC3H8 GHSV=4500h-1
XC3H8 GHSV=9000h-1
XC3H8 GHSV=18000h-1
SAA GHSV=4500h-1
SAA GHSV=9000h-1
SAA GHSV=18000h-1
20 0 20 400
5
10
15
20
25
30
Yield ()
H2O concentration in feed mixture (vol)
YAA GHSV=4500 h-1
YAA GHSV=9000 h-1
YAA GHSV=18000 h-1
Figure 423 The effect of steam on the acrylic acid productivity at GHSV=4500 9000 and 18000 h-1
84
The temperature variation between 360 and 400degC using reaction mixtures containing 0
10 and 40 vol steam was also performed The catalytic properties expressed in terms of
propane conversion acrylic acid selectivity and yield are summarized in the Figure 424
Similarly to the trend demonstrated in Figure 423 the conversion of propane and the
selectivity to acrylic acid is positively influenced at every temperature (Figure 424)
Although the conversion rises and the selectivity decreases slightly the yield to acrylic
acid levels off at around 380degC
360 380 4000
20
40
60
80
100
Conversion Selectivity ()
T (degC)
XC3H8 0vol H2O GHSV=4500h-1
XC3H8 10 vol H2O GHSV=4500h-1
XC3H8 40vol H2O GHSV=5000h-1
SAA 0vol H2O GHSV=4500h-1
SAA 10vol H2O GHSV=4500h-1
SAA 40vol H2O GHSV=5000h-1
360 380 400
0
10
20
30
40
50
Yield ()
T (degC)
YAA 0vol H2O GHSV=4500h-1
YAA 10vol H2O GHSV=4500h
-1
YAA 40vol H2O GHSV=5000h
-1
Figure424 The effect of temperature on the catalytic performance at 0 10 and 40 vol steam content Catalyst 6059
The activation parameters (apparent activation energy logarithm of the pre-exponential
factor activation enthalpy and entropy respectively) were calculated using the linearized
form of the Arrhenius- and Polanyi-Eyring equations The numerical values of these
activation parameters are summarized in Table 421
It can be observed that in the presence of steam the apparent activation energy is reduced
significantly by a factor of 24 when 40 vol steam is present in the feed mixture The
logarithm of the pre-exponential factor and the activation entropy decreases as well
indicating that in presence of steam both the number of collisions per unit surface and
also the structure of the activated complex is influenced On the other hand the activation
enthalpy is larger when steam is present in the feed
85
Table 421 The activation parameters of propane consumption at different steam contents
Activation
parameter
C3H8 consumption
0 vol H2O 10 vol H2O 40 vol H2O
Ea (kJmol) 95 plusmn 13 76 plusmn 7 39 plusmn 8
lnA 20 plusmn 2 17 plusmn 1 11 plusmn 1
∆H (kJmol) -8970 plusmn 002 -7026 plusmn 001 -3349 plusmn 001
∆S (JmolK) -9258 plusmn 003 -11836 plusmn 002 -16822 plusmn 002
A decreasing trend in the apparent activation energy of propane oxidation on
MoVSbNbOx catalyst was reported by Novakova et al In dry feed the apparent activation
energy was found to be 68 kJmol while only 50 kJmol at 25 vol steam content [1]
However in the work reported by Novakova et al the MoVNbSbOx catalyst was
deactivating and the bulk structure was altered irreversible in steam-free feed Therefore
the apparent activation energy of 68 kJmol was probably not determined under steady-
state conditions
The concentration profiles from contact time variation at different steam concentrations
are presented in Figure 425 In the following the qualitative information arising from
these plots are summarized
The propane consumption rate depends on the steam content of the feed The lowest
consumption rate was observed in a steam free feed The presence of steam enhances the
consumption rate however this positive effect levels off above the concentration of 20
vol
This observation is in accordance with the trends reported by Novakova et al and
Griszligtede [1-4]
The propylene concentration profile is similar at all steam contents However the contact
time (WFmax) corresponding to the maximum propylene concentration shows the
following dependence on the steam content 0272 gsml at 0 vol steam 0227 gsml at
10 vol steam and 0185 gsml for 20 30 and 40 vol steam The value of WFmax is
related to the formation and consumption rate constant of propylene In case of the first
86
order consecutive reactions the WFmax is equal to the logarithmic average of the rate
constants of the steps involving the intermediate product
Figure 425 The effect of steam on the concentration profiles
00 02 04 06 08 1000
02
04
06
08
10
12 0 vol H
2O
10 vol H2O
20 vol H2O
30 vol H2O
40 vol H2O
y C3H8
WF (gsml)
00 02 04 06 08 10000
002
004
006 0 vol H
2O
10 vol H2O
20 vol H2O
30 vol H2O
40 vol H2O
y C3H6
WF (gsml)
C3H8 C3H6
00 02 04 06 08 1000
01
02
03
04 0 vol H
2O
10 vol H2O
20 vol H2O
30 vol H2O
40 vol H2O
y CO2
WF (gsml)
00 02 04 06 08 1000
01
02
03
04 0 vol H
2O
10 vol H2O
20 vol H2O
30 vol H2O
40 vol H2O
yCO
WF (gsml)
CO2 CO
00 02 04 06 08 10000
002
004
006
008
010 0 vol H
2O
10 vol H2O
20 vol H2O
30 vol H2O
40 vol H2O
y HAc
WF (gsml)
00 02 04 06 08 10000
005
010
015
020
025
030 0 vol H2O
10 vol H2O
20 vol H2O
30 vol H2O
40 vol H2O
y O2
WF (gsml)
CH3COOH CH2CHCOOH
87
The decrease of WFmax suggests that presence of steam increases the increase of the ratio
between the consumption and the formation rate constant of propyleneOn the other hand
not only the position of the maximum is related to the formation and consumption rate
constants but the actual concentration of the intermediate product as well At high
contact times the decay of propylene concentration is more enhanced in presence of
steam This also suggests that steam increases the rate constant of further oxidation of
propylene [5]
The CO and CO2 concentration profiles share the same qualitative features compared to
the dry feed both the CO and CO2 formation rates are reduced already in the presence of
10 vol steam
A further increase of steam concentration does not further reduce the rates of CO and
CO2 formation It is also notable that the rate of CO formation is higher than CO2
formation rate under every condition Nevertheless the concentration profile does not
reveal more information about the steps by which these total oxidation products are
formed Therefore it could not be established whether CO was formed as a first total
oxidation product and then further oxidized to CO2 or they are products of parallel and
independent steps This issue was addressed and elaborated in subchapters 427 and
433 where results concerning the CO oxidation water gas shift reaction and addition of
CO in the two-stage reactor are presented respectively
The formation rate of acrylic acid and acetic acid is enhanced significantly in presence of
steam in the feed in accordance with the observations of Griszligtede [2 3] Novakova et al
[1] Dubois et al [6] and Zheng et al [7] The maximum formation rates are observed at
20 and 30 vol steam concentration At 40 vol water content the acetic and acrylic acid
concentrations are slightly lower compared to those determined at 20 and 30 vol steam
content especially at contact times close to 10 gsml
Neither the acetic acid nor the acrylic acid concentration passes a maximum in the
studied contact time interval The only exception is the measurement carried out without
steam in the feed in this measurement the concentration profiles of acetic acid and
acrylic acid are flattened at high contact times but no net decay can be observed This
shows that both acids are relatively stable against further oxidation
88
423 Variation of the propane content
The propane concentration variation was performed in the interval between 1 and 3 vol
for the determination of the partial order with respect to propane For this purpose the
concentration of oxygen and steam was kept constant at 6 and 40 vol respectively the
nitrogen making up the balance (Figure 426)
1 2 3 40
20
40
60
80
100
X C3H8 X O2 S AA S CO2 S C3H6 S HAc S CO C-∆∆∆∆
Conversion Selectivity ()
x=C3H
8 concentration (vol)
Figure 426 The effect of the propane concentration on the catalytic performance
C3H8O2H2ON2=x640(54-x) vol T=400degC GHSV= 34280 h-1 WF=011 gsml Catalyst 6059
Because the propane concentration was varied at constant oxygen concentration the
redox potential was stoichiometric with respect to the propane to acrylic acid reaction (in
the case of the feed C3H8O2=36 vol) and net oxidizing (in the case of C3H8O2=26
and 16 vol feeds respectively) The experiment was performed at 400degC and a contact
time of 011 gsml
The propane conversion is relatively independent on the initial propane concentration
Propylene is the main product while other products in the order of abundance are acrylic
acid CO CO2 and acetic acid In case of slightly oxidizing feed (C3H8O2=26 vol) the
selectivities were very similar to that obtained for stoichiometric feed while in case of
89
strongly oxidizing feed (6-fold excess of oxygen) the propylene selectivity increased
slightly at the expense of acrylic acid selectivity
For kinetic modeling the partial order with respect to reactants propane and oxygen
were determined using a power rate equation This power rate equation contains two
independent variables the concentrations of propane and oxygen respectively (Equation
421) Because of this the reaction order with respect to both components can be
obtained by partial derivation of the rate equation if both concentrations are varied
simultaneously in the experiments (Equations 422 and 423) On the other hand if the
concentration of one component is kept constant the rate law is simplified Since the
initial oxygen concentration was 6 vol in all the experiments the two constant terms on
the right hand side of the power law can be contracted into a single apparent rate constant
kacute (Equation 424) Then the power law will contain only one variable The reaction
order m can be determined from the slope of the straight line of the double-logarithmic
plot according to the linearized equation 425 (Figure 427) [8 9]
)524 ( lnlnln
)424 (
)324 ( ln
ln
)224 ( ln
ln
)124 (
08383
08383
02
083
02083
Equationcmkr
Equationckr
Equationc
rn
Equationc
rm
Equationcckr
HCHC
m
HCHC
O
HC
n
O
m
HC
sdot+=
sdot=
partpart
=
partpart
=
sdotsdot=
The slope of the above plot shown below is equal to 110plusmn001 and consequently the
reaction is first order with respect to propane
The application of the integral method supported that the reaction is first order with
respect to propane the simulated concentration profile based on the integrated rate
equations containing a first order step with respect to propane is in good agreement with
the experimentally determined profile over a wide contact time interval (Figure 421)
This is an indication that first order kinetics is valid under both differential and integral
regimes [8]
90
-50 -45 -40 -35 -30-10
-08
-06
-04
-02
00
02
04
ln rC3H8
ln(cC3H8)ττττ=0
Figure 427 Determination of the reaction order with respect to propane
424 Variation of the oxygen content
The effect of the initial oxygen concentration was also studied The initial oxygen
concentration was varied in the interval from 4 to 15 vol keeping the initial propane
concentration constant at 3 vol Thus the catalytic experiments were performed under
three redox potentials of the gas mixture
i) reducing at 4 vol O2
ii) stoichiometric at 6 vol O2 and
iii) net oxidizing at 9 12 and 15vol O2 respectively
91
4 6 8 10 12 14 160
20
40
60
80
100
y=O2 concentration (vol)
Conversion Selectivity ()
X C3H8 X O2 S AA S CO2 S C3H6 S HAc S CO Y AA
Figure 428 The effect of the oxygen concentration on catalytic performance
C3H8O2H2ON2=3y40(57-y) vol T=400degC GHSV= 4500 h-1 WF=0904 gsml catalyst 6059
The redox potential in terms of reducing stoichiometric and oxidizing feed was defined
with respect of the stoichiometry of 12 with respect to propane and oxygen
corresponding to the propane to acrylic acid transformation
Under reducing conditions both the conversion and selectivity to acrylic acid were found
to be slightly lower compared to the catalytic performance observed at stoichiometric and
oxidizing conditions However the conversion selectivity and consequently also the
yield to acrylic acid levels off at 6 vol O2 as demonstrated in Figure 428 The fact that
the propane conversion does not depend on the initial oxygen concentration under
stoichiometric and oxidizing conditions suggests that the O2 activation is not rate
limiting
For the determination of the reaction order with respect to oxygen the power rate law
was considered
427)(Equation lnlnln
426)(Equation
022
022
OO
n
OO
cnkr
ckr
sdot+=
sdot=
92
-40 -35 -30 -25 -20 -15 -10000
025
050
075
100
125
ln rO2
ln (cO2)ττττ=0
Figure 429 Determination of the reaction order with respect to oxygen Cat 6059
Since the initial propane concentration was constant at 3 vol in all the experiments the
first two terms in the right hand side of the power law were contracted into a single
apparent rate constant ḱ The reaction order was determined from the slope of the straight
line of the double-logarithmic plot (Figure 429) according to the linearized equation
427
The integral oxygen consumption rate was calculated as the product between the
fractional conversion (xO2) and the molar flow of oxygen in the feed (uO2) expressed in
micromolgs Weighted linear regression of the double-logarithmic plot gave a reaction order
with respect to oxygen equal to nO2=0512plusmn0002
Griszligtede and Balcells et al reported similar catalytic properties to that shown on Figure
428 [2 3] Under net oxidizing conditions (C3H8O2 ratio ranging from 26 to 220) the
propane conversion and product selectivities were the same for every oxygen
concentration and contact time [2 3 10] Balcells et al used reducing stoichiometric and
oxidizing feed the C3H8O2 ratio being between 115 and 14 The propane consumption
rate and acrylic acid formation rate leveled off at the molar ratio of C3H8O2=12 [2]
93
In contrast Zheng et al noted an increase in the propane conversion with the C3H8O2
molar ratio varied between 11 and 15 The highest selectivity and yield of acrylic acid
was observed at a molar ratio of 13 [7]
425 Propylene oxidation
Upon analyzing the concentrationndashresidence time plot propylene presents the first
maximum This means that it is an intermediate in the direct oxidation of propane to
acrylic acid The application of the delplot technique (section 64) also supported that
propylene is an intermediate At higher contact times where the acrylic acid selectivity is
higher the propylene selectivity is low usually less than 10 On the other hand
propylene is known to be more reactive in oxidation reactions
The selective oxidation of propylene is usually carried out at lower temperatures (325-
350degC) than propane oxidation [11] For these reasons the authors stated that the
oxidative dehydrogenation is the rate determining step in propane oxidation to acrylic
acid arguing that once the propylene is formed it reacts readily further to acrylic acid
and byproducts Griszligtede also reported the propylene oxidation over M1 and M2 phase
mixture MoVTeNbOx on steatite balls The reaction was performed at a lower
temperature interval (310-330degC) because at higher temperature the propane conversion
was nearly 100 Kinetic experiments on propylene oxidation were done at 360degC
However it may be inappropriate to extrapolate the reactivity and reaction kinetic data
from 310-360deg to 360-400degC [3]
A possible strategy for unraveling the pathways and kinetics of a complex reaction such
as propane oxidation is the bottom to top approach According to this approach catalytic
reaction is carried out using the reaction products and intermediates as educts The
product distribution gives information concerning the reaction pathways while the rates
show the relative reactivity of all the compounds However the reaction conditions
(temperature redox potential) should be chosen in such a way to approach those of the
one-step propane oxidation conditions in order to avoid an unjustifiable extrapolation
94
In order to explain the reactivity difference in propylene oxidation the results of two sets
of experiment are presented here
(a) at low GHSV of 5000 h-1 (WF=072 gsml) and in a low temperature interval
(230-270degC) (Figure 4210 top)
(b) at higher GHSV of 20000h-1 (WF=0018 gsml) and in the temperature
interval between 360 and 400degC (Figure 4210 bottom)
230 240 250 260 270
0
20
40
60
80
100
X C3H6 X O2 S AA S CO2 S Ace S HAc S CO C-bal
Conversion Selectivity ()
T (degC)
360 370 380 390 400
0
20
40
60
80
100
X C3H6 X O2 S AA S CO2 S Ace S HAc S CO C- bal
Conversion Selectivity ()
T (degC)
Figure 4210 Propylene oxidation with 6902 Feed composition C3H6O2H2ON2=364051 vol Top
GHSV=5000 h-1 bottom GHSV=20000 h-1 Catalyst 6902
95
In both experiments the feed composition was the following
C3H6O2H2ON2=364051vol The oxygen and steam contents were chosen to be
equal with that of the feed for propane oxidation on this catalyst
In the case (a) the propylene conversion was high despite of the low temperature
suggesting the high activity of the catalyst The main product was acetone its substantial
selectivity dropped approximately linearly with the temperature The selectivity of acrylic
acid - the second most abundant product - showed an increasing trend with the
temperature
The CO2 CO and acetic acid were found to be minor products the maximum selectivities
being 43 36 and 23 respectively Surprisingly maleic anhydride was also produced in
quite significant amounts as identified on the chromatogram by the mass spectrometric
detector
However the quantification of this product was not possible because of the very broad
and irreproducible peak shape in the chromatogram One reason for the scarce
reproducibility is that the maleic anhydride is a larger molecule and more polar than
acrylic acid The second difficulty is related to the fact that maleic anhydride hydrolyzes
to maleic acid in presence of the high steam content of the feed Hydrolysis may happen
in the downstream tubing of the reactor system as well as in the DB-1 column gas
chromatograph causing broad peaks with irreproducible peak areas
The temperature interval in case (b) was identical with that used for the propane
oxidation reaction Almost complete propylene conversion was achieved at a relatively
high space velocity of 20000 h-1 In contrast to the low space velocity ndash low temperature
experiment in this case the acrylic acid is the most abundant product with a maximum
selectivity at a reaction temperature of 380degC
A small amount of acetone is also produced during the reaction but its selectivity sinks
strongly with increasing reaction temperature CO2 CO and acetic acid are produced in a
higher amount than in the experiment carried out at low space-velocity and low
temperature An inversion can be observed in the selectivity ratio between the CO2 and
CO compared to the experiment done in the low temperature interval with five times
longer contact time
96
It is notable that a substantial amount of maleic anhydride was also produced but the
quantification problem was more severe than is case (a) Therefore the maleic acid
selectivity was not calculated in any of the above two cases which led to a systematic
error in the carbon balance as shown in the Figure 4210 Nevertheless the formation of
maleic acid a four carbon atom containing product from propylene is indeed not
straightforward One possible explanation is that hydrogen radical was removed from the
methyl group of propylene Then two allyl radicals recombined to benzene which finally
was oxidized to maleic acid
Because the propylene conversion at 270degC GHSV=5000h-1 and 360degC 20000h-1 are
very similar the selectivities obtained under these two conditions can readily be
compared It is to be observed that the product distribution is very different In the low
space velocityndashlow temperature experiment acetone is the most abundant product
followed by acrylic acid while in the higher space velocityndashhigher temperature
experiment these selectivities were inverted On the other hand during propane
oxidation reaction acetone is not produced in detectable amounts even if propylene is an
intermediate product Also the CO and CO2 selectivity ratio is inverted in the low
temperature interval
Therefore this experiment exemplifies that the catalytic and kinetic experiments of
propylene and other intermediate oxidation should be performed in the temperature
interval which is identical to that used for propane oxidation
The effect of steam on the catalytic performance of propylene oxidation over phase pure
MoVTeNbOx was also investigated (Figure 4211) The steam content variation was
performed using the same procedure as in the case of propane oxidation The steam
content was reduced from 40vol to 0 vol by 10 vol steps No deactivation was
observed in absence of steam After exposing the catalyst to dry feed the catalytic
performance was re-measured at 20 vol steam content
97
20 10 0 10 20 30 40
0
20
40
60
80
100
Conversion Selectivity () X C3H6
X O2 S AA S CO2 S Ace S HAc S CO C-bal Y AA
z=H2O concentration in feed mixture (vol)
Figure 4211 The effect of H2O on propylene oxidation Feed composition C3H6O2H2ON2=36z(91-z)
vol GHSV=80000 h-1 T=400degC Catalyst 6902
The reaction temperature was set to 400degC which is identical with the temperature where
the steam content variation for propane oxidation was carried out Since in the
temperature variation at a space velocity of 20000 h-1 almost 100 propylene conversion
was observed at 400degC the steam content variation was carried out at a space velocity of
80000 h-1 (WF= 0045 gsml) At this high space velocity the highest conversion was
approximately 40 between 20 and 40 vol steam content
Similarly to the observations for the steam content variation in the propane oxidation the
conversion decreased continuously below 30 vol steam content while a significant
drop below 20 vol steam concentration also for propylene oxidation The acrylic acid
selectivity did not change significantly upon decreasing the steam content of the feed
However the acetone selectivity decreased dramatically at 0 vol steam content no
detectable amount of acetone was formed This suggests the involvement of steam in
acetone formation according to the oxy-hydration pathway [12-16]
It is notable that in absence of co-fed steam the selectivity to total oxidation products
increased and the ratio between the COCO2 selectivities was inverted compared with
experiments carried out in the steam-containing feed Since the propylene conversion was
relatively low maleic anhydride formation was also lower which led to a better carbon
balance than that reported for the space velocity of 20000 h-1
98
Upon re-measuring the catalytic performance in 20 vol steam the catalytic
performance was found to be identical with the one determined before measuring in a dry
feed The reversibility of both the conversion and selectivity with the steam content is
similar to that observed in the case of propane oxidation
426 Acrolein oxidation
Propylene was found to be the first intermediate in propane selective oxidation It is
supposed that the oxidation of propylene to acrylic acid proceeds through allyl alcohol
and acrolein intermediates This assertion was supported by the fact that the oxidation of
propylene to acrylic acid in a single elementary step is not probable because such a
transformation would require the elimination of two hydrogen atoms and insertion of two
oxygen atoms
Postulated reaction pathways take into consideration acrolein and sometimes allyl-
alcohol formation as well although only in a few studies is their detection reported under
catalytic conditions [16-21]
Concepcioacuten et al reported the detection of a π-allylic intermediate (CH2=CH-CH2-O-) by
means of FTIR spectroscopy on MoVTeNbOx catalyst [22] It was suggested that this
surface intermediate of the propylene oxidation is transformed to acrylic acid by a redox
mechanism via acrolein However in the gas phase no acrolein was detected
In the propane and propylene oxidation experiments described above neither allyl
alcohol nor acrolein was formed at any space velocity andor feed composition in the
temperature interval between 360 and 400degC
The purpose of this experiment was to determine the reactivity and product distribution in
acrolein oxidation over the phase-pure MoVTeNbOx catalyst
For the catalytic experiment a feed with the following composition was used
acroleinO2H2ON2=36091vol at a weight hourly space velocity of 250000 mlgh
(WF=0014 gsml) The temperature was varied between 360 and 400degC (Figure 4212)
99
360 370 380 390 4000
10
20
70
80
90
100
Conversion Selectivity ()
T (degC)
X Acr X O2 S AA S CO2 S HAc S CO
Figure 4212 The effect of temperature on acrolein oxidation Catalyst 6059
As seen in Figure 4213 the catalyst is very active in acrolein oxidation even at very
high space velocity The highest acrylic acid selectivity was attained at 380degC while the
highest yield of 89 at 400degC
Acetic acid was found to be a by-product its selectivity decreased with increasing
temperature Literature sources also reported the production of acetic acid during the
oxidation of acrolein Without experimental evidence Lin et al explained the appearance
of acetic acid byproduct as due to oxidative degradation of acrylic acid at temperatures
close to 400degC [23] However both the acrolein and acrylic acid contain only sp2 carbon
atoms while acetic acid contains a sp3 carbon atom as well This would imply that the
C=C bond is saturated upon oxidation of acrylic acid (ie the formal charge of -2 is
reduced to -3) Such saturation (reduction) is uncommon in oxidation reactions A
possible explanation might be the intra-molecular transposition of a hydrogen atom from
the carbonyl- or carboxyl group to the methylene group
An increasing trend was observed for CO and CO2 the latter total oxidation product
being produced in larger amount than CO
From the Arrhenius- and Eyring-Polanyi plots the activation parameters of acrolein and
oxygen consumption were determined (Table 422)
100
Table 422 The activation parameters of acrolein oxidation on 6059 catalyst
Parameter Acrolein Oxygen
Ea (kJmol) 255 plusmn 14 249 plusmn 20
lnA 915 plusmn 02 75 plusmn 04
∆H (kJmol) -20129 plusmn 0002 -183617 plusmn 0003
∆S (JmolK) -183617 plusmn 0003 -197160 plusmn 0003
427 CO oxidation and water gas shift reaction
As observed at the kinetic study of propane oxidation (421 and 422 subchapters) the
CO formation rate was always higher than the CO2 formation rate in the studied contact
time interval independently of the temperature and steam content This raised the
question whether first the CO is produced which upon further oxidation is converted to
CO2 The delplots indicate that both CO and CO2 are mainly second rank products
(Section 64) However the delplot technique relies on extrapolation of the dependent
variable to zero propane conversion This implies that strictly speaking the rank order is
valid only in the differential regime
The CO concentration profile steadily increased in the studied contact time interval
without showing a maximum characteristic to an intermediate product (Figure 421 and
425) Because of these reasons it was not possible to state or to refute whether CO is
further oxidized On the other hand the oxidation of CO by water known as water gas
shift reaction could neither be confirmed nor denied based on the kinetic data of propane
oxidation
To answer the above questions CO oxidation experiments were carried out In order to
get more insights in the reaction kinetics possible reaction pathways and oxygen species
on the catalyst surface the reactivity of CO oxidation was screened in the following
order
i) CO oxidation in absence of steam using stoichiometric and oxidizing feed
(COO2N2=315955 vol and COO2N2=3691 vol respectively)
ii) Water-gas shift reaction with a feed containing 40 vol steam
(COO2H2ON2=304054 vol)
101
iii) CO oxidation in absence of steam using oxidizing (COO2H2ON2=364051
vol) feed
The steam-free feed resembles to propane oxidation carried out in absence of water The
choice of COO2=315 and 36 covers a wide range of redox potentials which occur
under propane oxidation conditions
In the presence of oxygen and water the CO oxidation by oxygen and the water gas shift
reaction may occur simultaneously
)224 (Re
)124 (Re 2
1
222
22
actionHCOOHCO
actionCOOCO
+rarr+
rarr+
This would lead to an ambiguity in deciding which reaction is actually taking place On
the other hand the contribution of each to the overall CO oxidation reactivity is also
difficult because the above mentioned parallel reaction steps involve the same educt and
the same product Therefore it was necessary to perform separately the water gas shift
reaction and the CO oxidation reaction in presence of steam The conditions of these two
reactions were also chosen in such a way to cover the relevant conditions of propane
oxidation reaction
Since the CO oxidation and water gas shift activity of MoVTeNbOx mixed metal oxide
catalysts was not reported up to now the reactivity screening started with an exploratory
measurement performed in a wide range of temperature (from 150 to 400degC) and two
space velocities (3000 h-1 and 12000 h-1 respectively) in dry feed The product appeared
only at temperatures higher than 250degC at low space velocity (Figure 4214) However
the highest conversion of CO was only 1 At the space velocity of 12000 h-1 no
reactivity was observed below 350degC
102
150 200 250 300 350 400
000
001
002
003
004
005
CO2 concentration (vol
)
T (degC)
COO2H2ON2=3150955vol GHSV=3000h-1
COO2H2ON2=36091vol GHSV=3000h-1
COO2H2ON2=3150955volGHSV=12000h-1
Figure 4213 CO oxidation at different temperatures space velocities in stoichiometric and oxidizing
feed Catalyst 8947
The activation parameters of CO oxidation reaction have been determined based on the
linearized Arrhenius- and Polanyi-Eyring plots The results are summarized in Table
423
Table 423 The activation parameters of CO oxidation in dry feed
Feed Stoichiometric
COO2=21
Oxidizing
COO2=12
lnA 75plusmn12 92plusmn12
Ea (kJmol) 41plusmn7 52plusmn2
∆H (kJmol) -36plusmn7 -46plusmn2
∆S (JmolK) -197plusmn10 -183plusmn3
After performing the above exploratory experiment the space velocity variation was
carried out for CO oxidation in dry feed for the water gas shift reaction and CO
oxidation in presence of steam The catalytic data are summarized in Figure 4214 This
plot reveals the least reactivity in the water gas shift reaction the highest CO conversion
being 05 in the studied contact time interval
103
The CO oxidation activity in dry feed was higher than the water gas shift reaction For
the CO oxidation in dry feed the CO conversion was found to be the same
independently on whether the feed was stoichiometric or oxidizing
The highest activity was observed in the case of CO oxidation in presence of 40 vol
steam It should be mentioned that the reactivity in this latter reaction is not a simple
algebraic sum of the CO oxidation in dry feed and the water gas shift reactions
However in all these reactions the conversion of CO to CO2 is far below 2 These
observations show that the CO oxidation and water gas shift reaction are negligible
reaction steps under the propane oxidation reaction conditions It is also to be mentioned
that the kinetic study of propane oxidation was carried out in the space velocity interval
between 66000-4500 h-1 (WF=005-090 gsml)
00 02 04 06 08 10 12 14
000
001
002
003
004
COO2H
2ON
2=3150955vol
COO2H
2ON
2=36091 vol
COO2H
2ON
2=364051 vol
COO2H
2ON
2=304057 vol
CO2 concentration (vol
)
WF (gsml)
Figure 42 14 Space velocity variation for CO oxidation and water gas shift reaction
The low reactivity in CO oxidation reaction has two implications with respect to the
propane oxidation
The first is related to the reaction pathways involving CO and CO2 The above
experiments revealed that the CO is not further oxidized to CO2 under any conditions
This suggests that in the propane oxidation reaction CO and CO2 are formed in two
different and independent pathways
104
The second implication is related to the nature of oxygen species As it was described in
the introduction the CO oxidation activity is related to the presence of the electrophilic
oxygen species on the catalyst surface [24]
Although quantitative correlations were not done because of the lack of calibration
standards based on the negligible CO oxidation activity it can be stated that the
electrophilic oxygen species are not abundant on the phase-pure MoVTeNbOx catalyst
under propane oxidation conditions
428 Comparison of the reactivity of propane propylene acrolein and carbon
monoxide oxidation reactions
The activity of phase pure MoVTeNbOx catalyst in propane propylene acrolein and
carbon monoxide oxidation is summarized and presented on Figure 4215 Because the
reactivity of propylene and acrolein is higher the space velocity was adjusted in such a
way that the conversion is below 100 Therefore the propylene oxidation was carried
out at a space velocity of 20000 h-1 while in the case of acrolein oxidation a much higher
space velocity of 250000 h-1 was used
Because the conversions at different space velocities are difficult to compare the
consumption rates of the four educts were calculated and plotted versus the reaction
temperature
The reactivity increases in the following order carbon
monoxideltltpropaneltpropyleneltltacrolein The reactivity ranking order of propane
propylene and acrolein is similar to that reported by Ai [19] and Lin et al [23] However
in these literature sources the reactivity ranking order was established by performing the
reactions at the same space velocity and varying the reaction temperature
105
360 380 4000
2
4
660
70
80
90
100 rC3H8 GHSV=5000h-1 H2O=40vol 6902
rC3H6 GHSV=20000h-1 H2O=40vol 6902
rAcr GHSV=250000h-1 H2O=0vol 6059
r ( micromicro micromicromolgs)
T (K)
200 250 300 350 400000
001
002
05
10
15
20
rC3H8 GHSV=5000h-1 H2O=40vol 6902
rC3H8 GHSV=5000h-1 H2O=40vol 8947
rCO GHSV=3000h-1 H2O=0vol 8947
rCO GHSV=4500h-1 H2O=0vol 8947
rCO GHSV=4500h-1 H2O=40vol 8947
rWGS GHSV=4500h-1 H2O=40vol 8947
r ( micromicro micromicromolgs)
T (degC)
Figure 4215 Comparison of the propane propylene acrolein (top) propane CO oxidation and water gas
shift activity (bottom) of the catalyst
As Figure 4216 indicates the reaction rates span over four orders of magnitude The
relative rate of propylene consumption with respect to propane consumption is equal to
66 at the reaction temperature of 400degC On the other hand the relative rate of acrolein
oxidation at 400degC is 944 The relative rate of CO oxidation with respect to propane was
106
0016 and 0011 in dry feed and 40 vol steam containing feed respectively The lowest
relative rate of 0006 was observed for the water gas shift reaction on the MoVTeNbOx
catalyst
43 Two-stage reactor used as a distributor of oxidizing and reducing gases
The dosing of oxygen in catalytic membrane reactors and multi-tubular reactors were
reported to give better catalytic performance compared to the conventional single tube
fixed bed reactor design [25-31] The ODH of propane and ethane was extensively
studied by Seidel-Morgenstern et al [31] The ODH and selective oxidation reaction to
acrylic acid share the same steps of propane activation to propylene therefore
qualitatively these two reactions are similar The oxidation of propane to acrolein [32]
and acrylic acid [33] was reported by employing a dual-bed sytem whereby in the first
reactor ODH proceeded while in the second reactor the propylene was further oxidized
In contrast to these above mentioned catalyst systems the MoVTeNbOx is able to
oxidize directly the propane to acrylic acid Therefore in the present section the selective
oxidation of propane is reported over a phase-pure M1 MoVTeNbOx catalyst in a two-
stage reactor
The stage-wise addition of oxygen and other gases was performed in a system consisting
of two reactor tubes connected serially (two-stage reactor TSR) The addition of gases
was technically realized by means of a T-junction installed on the tubing that connects
the two reactor tubes (section 224 Figure 223)
The reactors were loaded with the same amount of catalyst phase-pure M1 MoVTeNbOx
catalyst (02400 g or 02667 ml sieve fraction of sample 6059) mixed with SiC diluent
The initial concentration of the feed components entering the first reactor was kept
constant (C3H8O2H2ON2=364051vol) while different gases (O2 N2O C3H6 CO
and CO2) were added to the gas mixture entering the second reactor tube The
temperature of both reactors was set to 400degC A total flow rate of 40 mlnmin
corresponds to a space velocity of 9000 h-1 in each reactor tube while the overall space
velocity is 4500 h-1
107
431 Addition of O2 and N2O
The variation of oxygen concentration in a single tube reactor revealed that the catalytic
performance is neither enhanced nor reduced by up to a five-fold oxygen excess
compared to the stoichiometric feed The effect of the redox potential was studied also in
the two-stage reactor setup
Additionally the potential applicability of N2O as an oxidant was examined The
motivation for this was the numerous reports in the literature about the successful
application of nitrous-oxide as oxidant instead of molecular oxygen in heterogeneously
catalyzed reactions (ie the industrial oxidation of benzene to phenol over FeZSM-5
catalyst alkane oxidative dehydrogenation propylene epoxidation hydroxylation of
chlorobenzene fluorobenzene phenol biphenyl [34]) Also N2O was found to be an
applicable oxidant in propane oxidative dehydrogenation on VOx on MCM-41 [35] SiO2
and γ-Al2O3 [36] supports Markedly higher propylene selectivity was reported when
N2O was using as oxidant compared to the catalytic data obtained with O2 This was
explained by the slower reoxidation kinetics observed in case of N2O More recently
Kondratenko et al reported two different surface species as probed by in-situ EPR
spectroscopy and postulated two different reoxidation mechanisms of the VOxMCM-41
catalyst by O2 and N2O respectively In the case of reoxidation by O2 the Vn+hellipO-
species was identified which was assumed to give rise to O- electrophilic species leading
to total oxidation [37]
However no reports were found about the potential application of N2O in the oxidation
of propane to acrylic acid
The staged addition of oxygen was performed as follows First the propane oxidation
reaction was performed at a space velocity of 9000 h-1 using the feed of
C3H8O2H2ON2=364051vol in a single-tube operation mode The oxygen content of
the effluent mixture was found to be 4 vol Therefore in the two-stage operation mode
the initial oxygen concentration in the second reactor tube is equal to 4 vol without
addition of oxygen
108
-05 00 05 10 15 20 25 3009
10
11
12
4000
4250
4500
4750
5000
0
3
6
9
12
15
Overall GHSV (h-1)
Dilution ratio
added O2 flow rate (mlnmin)
O2 concentration that enters in R2 (vol)
overall O2 concentration in R1+R2 (vol)
O2 concentration (vol
)
Figure 431 The dilution ratios (black squares) overall space velocities (black dots) and the oxygen
concentrations (empty and full blue triangles) in function of the flow rate of the added oxygen
To the effluent gas mixture leaving the first reactor tube pure oxygen gas was added
through the T-junction in order to achieve initial oxygen concentrations of 6 8 and 10
vol O2 in the second reactor tube
The overall oxygen concentration in the two reactor tubes was 6 8 10 and 12 vol
respectively Because of the oxygen addition the total flow rate increased in the second
reactor tube and in the same time the reaction mixture was diluted The dilution factor
the overall space velocity the oxygen concentration at the inlet of the second reactor tube
and the overall oxygen concentration in the two-stage reactor in function of the flow rate
of added oxygen gas is displayed in Figure 431 The dilution factor and the space
velocity change were taken into account for the calculation of the conversion selectivity
and reaction rates
The reaction rates obtained at a space velocity of 4500 h-1 in the single-tube mode and
two-stage mode without addition of oxygen between the two reactor tubes were very
similar (Figure 432) In contrast to the oxygen content variation experiments performed
in the single tube reactor (Figure 428 in subchapter 424) the staged addition of oxygen
in relatively high concentration positively influenced the catalytic properties
109
4 6 8 1000
04
08
12
00 05 10 15 20 25
6 8 10 12
O2 concentration in mixture that enters in R2 (vol)
Rates (
micromicro micromicromolgs)
r C3H8 r C3H6 r CO2 r CO r HAc r AA
no O2
additionaddition of O2
Added O2 between R1 and R2 reactors (mlnmin)
Overall O2 concentration (vol)
Figure 432 The effect of oxygen addition in the two-stage reactor
At the oxygen content of 8 and 10 vol in the second reactor (10 and 12 vol overall
oxygen content) the overall rate of propane consumption increased slightly compared to
measurements with lower oxygen concentrations (Figure 432)
The rate of acrylic acid formation was observed to increase at 8 and 10 vol oxygen
concentrations in the second reactor The rate of CO and CO2 production increased only
marginally upon oxygen addition while the rate of propylene and acetic acid formation
was not influenced by the oxygen concentration
When the catalytic properties obtained in the two-stage reactor and single-tube reactors
were compared in terms of conversion selectivity and yield two cases could be
distinguished (Figure 433) Both reactor systems performed similarly at 6 and 8 vol
overall oxygen concentration However the catalytic performance in the two-stage
reactor is superior to the single-tube reactor above 8 vol overall oxygen content A net
increase of 11 in the propane conversion and an increase of 47 in the acrylic acid
selectivity was determined at an overall oxygen content of 10 vol compared to the
110
single-tube reactor experiment Therefore by employing the two-stage reactor the acrylic
acid yield could be increased by 53
4 6 8 10 12 14 16 180
20
40
60
80
100Conversion Selectivity Yield ()
Overall O2 concentration (vol)
XC3H8 TSR
XC3H8 STR
SAA TSR
SAA STR
YAA TSR
YAA STR
0 10 20 30 40 50 60 70 80 90 1000
20
40
60
80
100
SAA ()
XC3H8 ()
STR 6 vol O2 GHSV var
STR O2 var GHSV=4500h
-1
TSR O2 var GHSV=4500h
-1
Figure 433 Comparison of the catalytic performance in the single-tube reactor (STR) and two-stage
reactor (TSR)
As already mentioned above the oxygen addition diluted the reacting gas mixture and
also increased the space velocity However the conversion and selectivity also depends
on the space velocity Firstly it can be ruled out that the slight enhancement of propane
111
conversion is due to the increase of space velocity from oxygen addition because the
conversion decreases with increasing space velocity
In order to rule out that the positive effect of oxygen addition on the selectivity is an
artifact due to the minor increase of space velocity a conversion-selectivity plot was
constructed displaying all the STR and TSR data (Figure 433 bottom) On this plot the
selectivity to acrylic acid determined at 6 vol initial oxygen concentration in the STR
passed through a maximum at a conversion of ca 55 Despite varying the oxygen
content variation in the STR operation mode the selectivity could not be improved On
the other hand upon oxygen addition in the TSR both the conversion and the selectivity
increased the data points were above the maximum of the conversion-selectivity curve
corresponding to the conventional STR system This revealed that the increase in the
selectivity is not an artifact due to the change of the space velocity by oxygen addition
The feasibility of application of N2O as an oxidant was also studied in the two-stage
reactor The N2O concentration was varied from 05 vol up to 40 vol in the second
reactor keeping constant the gas mixture composition of C3H8O2H2ON2=364051
vol in the first reactor The catalytic properties were found to be the same in the
presence of N2O irrespective of its concentration (Figure 434) Moreover the N2O
conversion was found to be zero indicating that N2O has no effect on the reaction when
dioxygen is also present in the gas mixture Then the initial oxygen concentration fed in
the first reactor was reduced from 60 to 40 vol and in the same time 4 vol N2O was
fed in the second reactor respectively (Figure 434 condition noted with ) Under this
condition total O2 consumption was observed accompanied by a slight decrease of the
propane conversion and a significant decrease of the acrylic acid selectivity At the same
time the propylene acetic acid and carbon dioxide selectivities are increasing slightly
Under reducing condition the N2O conversion was also found to be zero similarly for
the catalytic runs performed in presence of dioxygen In terms of oxygen atoms 4 vol
N2O is equivalent with 2 vol O2 Therefore feeding 4 vol oxygen and 4 vol N2O in
the two-stage reactor is equivalent to 6 vol oxygen with respect to oxygen atoms The
fact that the N2O conversion was zero throughout all the above described conditions led
112
to the conclusion that N2O does not reoxidize the phase-pure MoVTeNbOx catalyst under
propane oxidation conditions The explanation for this observation could be that either
the N2O does not adsorb on the surface of the catalyst or the catalyst in unable to activate
the N-O bond while there is no such a constraint in dioxygen adsorption and the
activation of the O=O bond
0 1 2 3 4 5 6
0
20
40
60
80
100
added N2O (vol)
X C3H8 X O2 X N2O S AA S CO2 S C3H6 S HAc S CO C-Bal Y AA
Conversion Selectivity Yield ()
Figure 434 Addition of N2O in the two-stage reactor Conditions noted with stars - 40 vol O2
introduced in R1 reactor and 40 vol N2O in R2 reactor - 6 vol O2 introduced in R1 reactor and 00 vol N2O in R2 reactor
Nitrous oxide may undergo thermal dissociation leading to N2 and O The oxygen free
radicals may induce radical homogeneous reactions under propane oxidation conditions
Although as it is shown above the product distribution is independent on the
concentration of added N2O it was necessary to assess the amount of the highly reactive
oxygen radical the new oxygen species introduced in the system by the addition of N2O
Based on the kinetic data published by Allen et al [38] on thermal dissociation of N2O
the maximum concentration of the gas phase oxygen radical was found to be 54108
radicalscm-3 (in the order of 10-15 mol radicalcm-3) The calculated conversion of N2O
towards N2 and O was extremely low in the order of magnitude of 10-8 This is in
accordance with the observed zero conversion of N2O during the addition experiments
113
Therefore this calculation proves that the thermal dissociation of N2O and the appearance
of oxygen radicals are negligible under propane oxidation conditions
After the N2O was switched off and 6 vol O2 was fed in the first reactor in the
beginning the conversion of propane and the selectivity of acrylic acid were as low as in
the case of 4 vol O2 in the first reactor and 4 vol N2O in the second reactor
0 100 200 300 4000
20
40
60
80
100
X C3H8 X O2 S AA S CO2 S C3H6 S HAc S CO C-bal Y AA
Conversion Selectivity Yield ()
TOS (min)
before after the N2O-addition experiment in TSR
Figure 435 Reactivation of the catalyst after exposing to reducing conditions
The catalytic properties converged slowly (in ca 8 hours time on stream) to the initial
values (ldquoreactivation during catalytic reactionrdquo) (Figure 435) This suggests the
reversibility of the decay in catalytic performance when operating the reaction under
reducing conditions for short time on stream (1 hour)
432 Addition of propylene
In the previous section it was shown that the staged addition of the oxygen can increase
the catalytic performance The effect of added reducing agents was also studied
The reducing agent was chosen based on the following considerations
i) the added compound should neither produce compounds which may poison the
catalyst nor react in homogeneous or heterogeneous pathways with the intermediates or
products of propane oxidation reaction
114
ii) it should present a reasonably high reduction potential and
iii) it should not introduce additional complexity in the reaction pathways of
propane oxidation
Hydrogen was not applied because of the i) and ii) criteria Firstly it may hydrogenate
the propylene and acrylic acid at 400degC Secondly the onset temperature of H2-TPR of
the catalyst was at around 370degC whith the peak maximum at 450degC (data not shown)
therefore is not a very strong reducing agent Ethylene the C1-C3 alcohols and aldehydes
were excluded based on the iii) criterion because all of these compounds are oxidized to
aldehydes or acids and undergo total oxidation pathways as well The remaining options
were propylene and carbon monoxide
However both of these compounds are also reaction products in the propane oxidation
reaction Being an intermediate propylene is further oxidized to acrylic acid acetic acid
and carbon oxides
In the following the addition of propylene in the two-stage reactor is presented (Figure
436) Upon addition of 050 and 075 vol propylene between the two reactors the
global rate of propane consumption was constant within experimental errors However
the propylene concentration monitored at the outlet of the second reactor was constant
irrespective of the added amount of propylene between the two reactors The global rate
of propylene formation was constant in spite of addition This means that the whole
amount of added propylene completely was completely consumed The oxidation of the
added propylene was well reflected in the enhancement of the global rates of acrylic acid
acetic acid and carbon monoxide and carbon dioxide formation It is notable that upon
propylene addition in the two-stage reactor no other product (ie acetone) was detected
by the GC-MS setup like in the case of propylene oxidation
The significant increase of the oxygen consumption rate attests that the added propylene
indeed acts as a strong reducing agent Addition of propylene in higher concentration
than 075 vol was avoided in order to keep the oxygen conversion below 100
Upon switching off the propylene addition the catalytic properties were remeasured
Because the catalyst was not exposed to very reducing conditions (XO2lt100) the
catalytic performance was found to be constant over time (ie no ldquoreactive reactivation
was observed like in the case shown on Figure 436) The rates of propane consumption
115
and the product formation were found to be very similar to the values determined before
the addition of propylene (Figure 436) This also supports the observed reversibility of
the catalytic properties after operating the reaction under reducing conditions
000 025 050 075 10000
02
04
06
0818
20
22
24
26
28
30
noaddition
C3H6addition
000
Rates (
micromicro micromicromolgs)
added C3H6 in R2 (vol)
r C3H8 r O2 r C3H6 r CO2 r CO r HAc r AA
noaddition
Figure 436 The effect of C3H6 addition of in the two-stage reactor
A very slight decrease of the propane consumption rate was observed upon propylene
addition This may suggest that there is a slight competition between propane and
propylene on the adsorption sites Microcalorimetric experiments on propane and
propylene adsorption showed that a larger amount of propylene can be adsorbed
compared to propane at the same equilibrium pressure [39] On the other hand the
additional propylene may be adsorbed on the sites which are energetically less favored
for propane adsorption
In turn the results may be interpreted as there are two active sites One of them is
performing the oxidative dehydrogenation of propane while the other one oxidizes
further the propylene The slight reduction of the propane consumption rate may be a
consequence of the higher reduction degree of the catalyst surface
116
433 Addition of CO
In the 427 section it is shown that CO oxidation reactivity over MoVTeNbOx catalyst is
a negligible even though CO is known to be a reducing compound This can be attributed
to low abundance of electrophilic oxygen species on the surface
However because of the very low reactivity in CO oxidation the surface redox property
of the MoVTeNbOx catalyst certainly does not change significantly during one catalytic
cycle On the other hand the catalyst showed ca 80 times higher reactivity in propane
oxidation (Figure 4215) therefore in this reaction the reduction degree is expected to be
changed more significantly during one catalytic cycle [40] Upon such significant
changes of the oxidation states the nature and the abundance of the surface oxygen
species might be different Because the CO oxidation reaction is suitable for semi-
quantitative estimation of the electrophilic oxygen species the CO addition in the two-
stage reactor was performed in order to probe the changes of the abundance of active
oxygen species during propane oxidation reaction
000 025 050 075 10000
02
04
06
0816
18
20
22
24
26CO addition
no addition
r C3H8 r O2 r C3H6 r CO2 r CO r HAc r AAR
ates (
micromicro micromicromolgs)
added CO in R2 (vol)
0
no addition
Figure 437 The effect of CO addition in the two-stage reactor
Upon addition of 05 vol CO to the mixture that enters the second reactor no change in
the propane and oxygen consumption was observed (Figure 437) This suggests that CO
117
does not compete with propane for adsorption sites and is not further oxidized to CO2
The added CO concentration was subtracted from the concentration measured at the
outlet of the second reactor The resulting value was found to be identical with the CO
concentration measured without addition Moreover the CO2 formation was also not
affected by the CO addition These latter observations also support the fact that the CO
oxidation during propane selective oxidation reaction is negligible independent of the
surface redox potential changes of the catalyst in the catalytic cycle
The formation of propylene acetic acid and acrylic acid was also not affected by the CO
addition revealing that the CO is an inert end-product
This experiment confirmed that the electrophilic oxygen species are not abundant on the
catalyst surface under working conditions
434 Addition of CO2
Carbon dioxide is the thermodynamically favored end product of the propane oxidation
reaction Although it is often considered to be an inert product CO2 may play different
roles in heterogeneous catalysis
bull competitively adsorb with educt or intermediates on the active sites
bull it was reported to increase the conversion in the dehydrogenation reaction
of isobutane [41]
bull the presence of CO2 was found to be beneficial for propane oxidation
reaction over MoVTeNbOx catalyst The obtained catalytic results
revealed a linear increase of yield of acrylic acid with the CO2 content in
the feed [42]
The microcalorimetric experiment on CO2 adsorption revealed that the density of sites
interacting with CO2 is higher than the density of sites available for propane adsorption
On the other hand the initial differential heat of adsorption of CO2 was found to be ca 30
kJmol while for propane adsorption a value of 40 kJmol was determined on catalyst
6059 after propane oxidation reaction The heat profile corresponding to the CO2
adsorption on the used catalyst indicated a relatively homogeneous distribution of the
surface basic sites
118
CO2 addition in the two-stage reactor system was performed in order to find out whether
it competitively adsorbs with propane on the active sites of the catalyst Up to 20 vol
CO2 was added to the gas mixture leaving the first reactor tube (Figure 438)
00 05 10 15 20 25 3000
02
04
06
08
18
20
22
24
26no
add
00
Rates (
micromicro micromicromolgs)
added CO2 in R2 (vol)
r C3H8 r O2 r C3H6 r CO2 r CO r HAc r AA
CO2 additionno
add
Figure 438 The effect of CO2 addition in the two-stage reactor
Because the added CO2 is a non-reactive gas added to the mixture a mass balance
equation was set in order to calculate the amount of CO2 produced in the reaction Figure
438 displays the rates of educt consumption and product formation as a function of the
concentration of the added CO2 No significant changes could be observed in the propane
and oxygen consumption rate
The propylene and acrylic acid formation rate is insensitive to the addition of CO2 This
suggests that carbon dioxide does not adsorb competitively either with propane or with
propylene on the active sites of the catalyst A slight increase in the CO formation rate
could be observed when 10 vol CO2 was added to the reacting mixture On the other
hand CO2 formation rate was slightly reduced when 20 vol CO2 was added while
acetic acid formation was slightly enhanced by the presence of carbon dioxide
119
44 Conclusions
Catalytic and kinetic studies on propane oxidation to acrylic acid were carried out using a
high performing phase-pure M1 MoVTeNbOx catalyst The reaction temperature redox
potential of the gas phase and the steam content of the feed was varied The highest
acrylic acid yield of ca 30 was attained at 400degC and stoichiometric feed containing 40
vol steam A reversible drop of the catalytic performance was observed when the steam
concentration was decreased to 0 vol Neither the conversion nor the selectivity was
increased or decreased in oxidizing feed (up to five-fold excess of oxygen)
The oxidation of intermediates (propylene and acrolein) and CO over the phase-pure M1
catalyst was also performed at the same temperature interval where propane oxidation is
carried out in order to establish the reactivity ranking product distribution and to probe
the reaction pathways
The catalyst was found to be ca 6 times more active in propylene oxidation compared to
propane oxidation at a temperature of 400degC the main product being acrylic acid The
acrolein oxidation rate was ca 100 times higher compared to the propane oxidation at
400degC while the acrylic acid yield was over 90 On the other hand the rate of CO
oxidation and water gas shift reaction was found to be ca 100 times lower compared to
the propane oxidation The low reactivity in CO oxidation suggested low abundance of
electrophilic oxygen species Additionally this finding suggested that the CO and CO2
are produced in independent pathways during the propane propylene and acrolein
oxidation reactions
Staged addition of oxidizing and reducing agents (O2 N2O C3H6 CO and CO2) was
performed in a setup consisting of two serially connected reactor tubes The oxygen
content variation in this arrangement lead to increase in the propane conversion and
acrylic acid selectivity giving an improvement of the acrylic acid yield by 5 compared
to the conventional fixed bed reactor Additionally it was found that N2O is an inert gas
in the propane oxidation reaction This lead to the conclusion that the phase-pure
MoVTeNbOx catalyst in unable to activate the N2O molecule
Upon addition of propylene the formation rate of acrylic acid acetic acid CO and CO2
products increased
120
The addition of CO did not influence the consumption rate of propane and oxygen and
the formation rate of any product This suggested that the CO does not adsorb
competitively with propane or any intermediates on the active sites Additionally this
experiment proved that the CO oxidation activity is very low during propane oxidation
reaction therefore indirectly also proved that the CO2 is produced independently from
CO in the propane oxidation reaction The observation concerning the low abundance of
electrophilic oxygen species irrespectively on the degree of reduction of the catalyst
surface within one catalytic cycle was also supported by the results of this experiment
The CO2 addition in relatively low concentration also did not influence the rates
significantly suggesting that the thermodynamically favored end product does not adsorb
competitively with the educt or intermediates on the active sites of the catalyst
References Chapter 4
1 E Novakova E G Derouane J Veacutedrine Catal Lett 83 3-4 (2002) 177-182 2 E Balcells F Borgmeier I Griszligtede H-G Lintz Catal Lett 87 (2003) 195 3 I Griszligtede Die Partielle Oxidation von Propan zu Acrylsaumlure Bestimmung der
Reaktionskinetik und in-situ characterisierung des Katalysators unter Betriebsbedingungen Dissertation Universitaumlt Karlsruhe 2004 Universitaumltsverlag Karlsruhe ISBN 3-937300-17-1 E Balcells
4 F Borgmeier I Griszligtede H-G Lintz F Rosowski Appl Catal A General 266 (2004) 211
5 J B Butt Reaction kinetics and reactor design 2nd Ed Marcel Dekker Inc 2000 pp 25-35
6 J L Dubois D Garrait A Le Gall G Bazin S Serreau FR Patent WO 2006072682 A1 2006
7 W Zheng Zh Yu P Zhang Y Zhang H Fu X Zhang Q Sun X Hu J Natural Gas Chemistry 17 (2008) 191-194
8 Ch G Hill An Introduction to Chemical Engineering Kinetics and Reactor Design John Wiley and Sons 1977 24-74
9 R W Missen Ch A Mims B A Saville Introduction to Chemical Reaction Engineering and Kinetics John Wiley and Sons 1999 49-55
10 I Griszligtede H-G Lintz Catal Lett 87 (2003) 195 11 G Centi F Cavani F Trifiro Selective oxidation by heterogeneous catalysis
Kluwer AcademicPlenum Publishers 2001 363-384 12 M Ai J Catal 101 (1986) 473-483 13 Y Moro-oka Appl Catal A General 181 (1999) 323-329 14 L Luo PhD thesis California Institute of Technology Pasadena California 2001 15 J C Veacutedrine E K Novakova E G Derouane Catal Today 81 (2003) 247-262 16 H-G Lintz S P Muumlller Applied Catal A General 357 (2009) 178-183
121
17 M M Lin Appl Catal A 207 (2001) 1-16 18 E K Novakova J C Vedrine Propane selective oxidation to propene and
oxygenates on metal oxides in Metal Oxides - Chemistry and applications JGL Fierro (Ed) 2006 CRC Press pp 414-461
19 M Ai Catal Today 13 (1992) 679-684 20 M Ai J Catal 101 (1986) 389-395 21 J C Veacutedrine E K Novakova E G Derouane Catal Today 81 (2003) 247-262 22 P Concepcioacuten P Botella J M Loacutepez Nieto Appl Catal A General 278 (2004)
45-56 23 M Lin T B Desai F W Kaiser P D Klugherz Catal Today 61 (2000) 223-
229 24 J Hermann Catal Today 112 (2006) 73-77 25 ST Oyama X Zhang J Lu Y Gu T Fujitani J Catal 257 (2008) 1-4 26 G Campanelli A Bottino D Romano O Montinelli A Servida F Cavani S
Rossini Stud in Surf Sci and Catal 119 (1998) 423-428 27 A Bottino G Campanelli A Comite J Membr Sci 197 1-2 (2002) 75-88 28 G Campanelli E Carosini F Cavani O Monticelli F Trifiro Chem Eng Sci
51 10 (1996) 1817-1826 29 J A Dalmon A Cruz-Lopez D Farruseng N Guilhaume E Iojoiu J-Ch
Jalibert S Miachon C Mirodatos A Pantazidis M Rebeilleau-Dassonneville Y Schuurman A C van Veen Appl Catal A General 325 2 15 (2007) 198-204
30 H-G Lintz A Reitzmann Catalysis Reviews Science and Engineering 49 1 (2007) 1-32
31 C Hamel Aacute Toacuteta F Klose F Tsotsas A Seidel-Morgenstern Chem Eng Res Design 86 (2008) 753-764 C O`Neill E E Wolf Catal Today 156 (2010) 124-131 W Fang Q-J Ge J-F Yu H-Y Xu Ind Eng Chem Res 50 (2011) 1962ndash1967
32 C O`Neill E E Wolf Catal Today 156 (2010) 124-131 33 W Fang Q-J Ge J-F Yu H-Y Xu Ind Eng Chem Res 50 (4) (2011)
1962ndash1967 34 V N Parmon G I Panov A Uriarte A S Noskov Catal Today 100 (2005)
115-131 35 E V Kondratenko M Cherian M Baerns D Su R Schloumlgl X Wang I E
Wachs J Catal 234 (2005) 131ndash142 36 E V Kondratenko M Cherian M Baerns D Su R Schloumlgl X Wang I E
Wachs J Catal 234 (2005) 131ndash142 37 E V Kondratenko A Bruumlckner J Catal 274 (2010) 111ndash116 38 M T Allen R A Setter F L Dryer Int J Chem Kinet 27 (1995) 883-909 39 M Haumlvecker S Wrabetz J Kroumlhnert L Csepei R Naumann Yu V Kolen`ko
F Girgsdies R Schloumlgl A Trunschke J Catal submitted 40 J M Loacutepez-Nieto B Solsona P Concepcioacuten F Ivars A Dejoz M I Vaacutezquez
Catal Today 157 (2010) 291-296 41 J Ogonovski E Skrzynska Cat Comm 11 (2009) 132-136 42 R Fushimi S O Sekhtman A Gaffney S Han G Yablonsky J T Gleaves
Ind Eng Chem Res 44 (2005) 6310-6319
122
Chapter 5 Post synthesis treatment of the phase-pure M1 MoVTeNbOx catalyst
511 Abstract
Post-synthesis treatment of the phase-pure M1 MoVTeNbOx catalyst with
different aqueous solutions at room temperature is presented in this chapter The
modifying agents were selected in such a way to cover all the chemical effects (neutral
acidic basic oxidizing and reducing respectively) Catalytic experiments on propane and
propylene oxidation showed that the chemical treatment of the phase-pure M1
MoVTeNbOx sample with neutral acidic basic and reducing solution leads to a marginal
improvement in the activity while the acrylic acid yield is not significantly influenced
On the other hand the treatment with oxidizing solution leads to a very dramatic decrease
in activity and selectivity and alters the homogeneous energetic distribution of propane
adsorption sites probed by adsorption microcalorimetry The acrylic acid selectivity at the
same propane conversion was found to correlate with the surface Te content and TeV
ratio The phase purity was not affected either by the chemical treatment or the catalytic
reaction of propane and propylene oxidation suggesting the exceptional bulk structural
robustness of the M1 MoVTeNbOx catalyst
512 Introduction
The as prepared mixed metal oxide catalysts are seldom phase pure materials The
synthesis of MoVTeNbOx catalyst often leads to M1+M2 phase mixtures
In the patent literature several methods are claimed for the selective removal of the M2
phase The Japanese Laid-Open Patent Application No 10-330343 claimed a single and a
dual stage washing procedure using aqueous oxalic acid ethylene glycol and hydrogen-
peroxide solutions aiming at modification of the crystalline phase composition of
MoVSb based oxide catalysts Treatments of the same oxide catalyst with organic acid
alcohol inorganic acid and hydrogen peroxide are claimed as well [1]
Washing of MoVTeNbO and related oxide catalysts using organic acids alcohols
inorganic acids and hydrogen peroxide has been claimed by the patent literature for
selective removal of the M2 phase [2 3] Oxalic acid and ethylene diol were claimed to
123
be the most effective agents in removal of the M2 phase None of the listed inorganic
acids was highlighted as preferred washing agent Higher temperatures were suggested to
be favorable for faster removal of the M2 phase However the results concerning the
phase composition are described only qualitatively by the term ldquosubstantially free of
hexagonal phaserdquo Changes in the bulk andor surface elemental composition were not
monitored and the results of catalytic experiments are completely missing
Guliants et al reported that the treatment of phase pure MoVOx catalyst by anhydrous 2-
propanol leads to significant change in the surface elemental composition as probed by
LEIS study [4] The as prepared material exhibited a surface composition of MoV019Ox
while in case of the treated sample the enrichment of vanadium was observed the
composition being MoV069Ox On the other hand the bulk composition and M1 phase
was unaffected by the treatment The 2-propanol treated sample however showed an
improved selectivity to acrylic acid and a lower propane apparent activation energy
compared to the as prepared MoVOx catalyst
Baca et al reported complete removal of M2 phase by washing with 15 hydrogen-
peroxide containing solution from a M1+M2 phase mixture [5]
Due to the lack of any quantitative data reported in the patent literature it is not known
whether the claimed positive effect of solution treatment applied to a phase mixture is
due exclusively to the selective dissolution of the M2 phase or it might be related to the
possible change in the surface composition as well similarly to the data reported by
Guliants et al [4]
Therefore in this chapter the effect of different selected solutions (neutral acidic basic
complexing oxidizing and reducing) on the phase pure M1 MoVTeNbOx catalyst is
addressed in order to sort out their effect on the
bull Bulk structure phase purity
bull Surfacebulk composition
bull Catalytic properties
124
52 Modifying agents and procedure
The starting material (called also parent sample) was a phase-pure M1 MoVNbOx
catalyst with the internal identification number 6902 This was subjected to modification
procedure by washing in solutions The systhesis and characterization of the original
sample is described in detail in chapter 23
Modification procedure 20 g of parent sample was dispersed in 50 ml of the solutions
listed below The suspension was shaked at room temperature for 3 hours Then the solid
sample was separated from the liquid by vacuum filtration Finally the sample was dried
in a vacuum desiccator Although in the literature a heat treatment step is also
recommended after performing the modification procedure in the present study the final
calcination was not performed The reason for avoiding heat treatment is the evidence of
surface reconstruction of a hydrogen-peroxide treated sample given by Kolenrsquoko et al
[6]
The modifying solutions were as follows
1 Distilled water Chemical effect neutral The rationale of using pure water was
that to sort out the effect of the solvent on the catalyst since all the other modifying
agents were used as aqueous solutions The distilled water treated sample got the internal
identification number of 7797
The pH of the filtrate solution was 19 Since the catalyst does not contain hydrogen ions
bound in the structure the surprisingly high pH change of 51 was a consequence of
metal ion leaching The metal ions leached out from the sample may undergo hydrolysis
and form hydroxides and oxo-ions The consumption of hydroxyl ions in the hydrolysis is
reflected in the drop of the pH
2 01M phosphoric acid H3PO4 This compound has acidic and complexing
properties The pH of the 01 M H3PO4 solution was 17 while the pH of the filtrate after
treatment was 27 Even though phosphoric acid is a relatively strong acid the pH of the
filtrate is higher by 18 compared to the pH of the filtrate from the water treated sample
This might be due to the fact that the leached metal ions form complexes with phosphate
ions and hydrolysis is suppressed To the phosphoric acid solution treated sample the
internal number of 7798 was assigned
125
3 01 M tetramethylethylenediamine (CH3)2NCH2CH2N(CH3)2 (TMEDA) This
compound has basic (pH=109) and complexing effects Upon treating the MoVTeNbOx
with this solution the pH of the filtrate decreased to 41 The solid sample after treatment
got the number of 7799
4 01 M sodium bromate NaBrO3 The bromate ion presents oxidizing properties
which potentially may oxidize the elements of the sample in the intermediate oxidation
states The pH change of the solution was from 69 to 30 The sample was got the
internal identification number of 7798
5 01 M hydrazine N2H4H2O This compound with reducing properties was
selected in order to try to reduce some elements in the highest or intermediate oxidation
states The initial pH of the 01 M N2H4 solution was 98 while the pH of the filtrate was
found to be 93 The hydrazine treated sample got the internal identification number of
8113
In the liquid filtrate four types of equilibria involving the leached metal ions may
proceed One of them is hydrolysis and precipitation formation From the literature only
limited information is available about the solubility of the molybdenum vanadium
tellurium and niobium hydroxides The solubility product of VO(OH)2 is 59middot10-23 while
of Te(OH)4 is equal to 3middot10-54 [8] The calculated pH of a solution that contains Te(OH)4
in equilibrium is 33 while hydrolysis of vanadyl ion leads to a solution with pH of 66
None of these pH values matches with the pH of the filtrate resulting from the water
treated 6902 sample suggesting a complicated hydrolysisprecipitation equilibrium
Based on the Pourbaix-diagrams of Mo- V- Nb- and Te-species [7-10] in aqueous
solution at the pH of 19 the following species are stable MoO3 VO2+VO2+V3+
(depending on redox potential) Nb2O5 HTeO2-Te2
2-TeO33H2OTeO32-
H2TeO4HTeO2+ (depending on the redox potential)
The second equilibrium is condensation of hydrated metal ions and formation of oligo-
and polymetallates
The third equilibrium is the complex formation involving the leached metal cations and
the inorganicorganic ligands (H3PO4 TMEDA and N2H4 respectively) from the washing
solutions
126
Finally the fourth equilibrium is the redox reaction between the redox active transitional
metal ions with bromate and hydrazine
200 300 400 500 600 700 800
0
1
2
3
4
Absorbance
wavelength (nm)
7797 - water 7798 - 01 M H3PO4 7799 - 01 M TMEDA 7800 - 01 M NaBrO3 8113 - 01 M N2H4
Figure 521 The UV-Vis spectra of the filtrate solutions
As a result of these equilibria a multitude of cationic and anionic transitional metal
containing species may exist in the filtrate solutions The UV-Vis spectra of the filtrate
solutions were found to be different from each other indicating that different species are
present in all the solutions (Figure 521) Because of the complexity of the reactions that
may occur in the liquid phase and consequently the formation of large number of
species it was not possible to assign directly the bands to the species
However the composition and catalytic properties of the solid material after the liquid
treatment is more important rather than the qualitative and quantitative identification of
the ions leached out upon the above described liquid treatments Therefore the next
sections are focused on the characterization of the solid material after the liquid
treamtment Furthermore catalytic data are presented on propane and propylene
oxidation using the modified samples The reaction pathway analysis of propane
oxidation was performed Different pathways were found therefore a preliminary kinetic
analysis of the propane and oxygen partial order and consumption rate constant was
127
evaluated Furthermore the rate constant of propylene consumption was also determined
for every modified catalyst
53 Characterization of the modified samples
531 N2 physisorption
The nitrogen adsorption isotherms determined at the temperature of liquid nitrogen are
shown in Figure 531
Table 531 The BET surface area of the samples
Sample number Treatment BET surface area (m2g)
6902 None 75 7797 H2O 128 7798 H3PO4 113 7799 TMEDA 55 7800 NaBrO3 50 8113 N2H4 116
In case of the water treated sample the surface area increased by about 70 while upon
phosphoric acid and the hydrazine treatment the surface are increased by about 50 On
the other hand in the case of the tetramethylethylenediamin and bromate treatment the
surface area decreased by about 30 compared to the parent sample
532 X-ray diffraction
The parent and the as prepared modified samples were subjected to XRD measurements
between 2Θ=2deg and 2Θ=80deg XRD measurements were performed on samples after the
catalytic experiments on propane and propylene oxidation
Rietveld refinement performed on the patterns showed that the phase purity was not
affected irrespective of the nature of the chemical treatment The quantitative Rietveld
analysis was obtained using the crystal structure of M1 MoVTeNbOx (ICSD 55097)
[11] This observation suggests that the bulk structure of the phase-pure MoVTeNbOx
catalyst is robust enough to withstand treatment with the above listed solutions No phase
change has happened under propane and propylene oxidation reaction conditions in
128
contrast to the phase alteration when switching from propane to propylene educt
speculated by Griszligtede [12]
Table 532 The lattice parameters of the catalysts before and after catalytic oxidation of propane and propylene
Catalyst ID
Latt const
6902 7797 7798 7799 7800 8113
a (Aring) 21146 21138 21126 21127 21143 21143 b (Aring) 26641 26630 26615 26615 26640 26633 c (Aring) 40161 40169 4015 40153 4018 40151 B
efor
e re
acti
on
V (Aring3) 22624 22612 22576 22577 22628 22609 a (Aring) 21139 21142 21145 21134 21162 21144 b (Aring) 26628 26631 26640 26632 26654 26632 c (Aring) 40146 40123 4013 4010 4013 40133 A
fter
re
acti
on
V (Aring3) 22598 22590 22607 22570 22635 22599
The lattice constants were extracted for all the samples before and after catalytic reaction
They are listed in Table 532 It can be observed that by treatment the lattice constants
are only slightly affected The lattice parameters are also slightly changing during the
propane and propylene oxidation reaction
533 SEMEDX
The SEM images of the parent and modified samples are shown in Figure 531
The SEM micrograph of the parent sample is a homogeneous material but consists of
irregularly shaped rod-like particles with length up to 500 nm and diameter between 50
and 100 nm
Water treatment leads to a wider distribution of particle diameter but the predominant
rod-like shape of the parent sample is conserved
Upon phosphoric acid treatment the particles loose their rod-like shape and their size is
reduced Aggregates of particles with ill defined shape can also be observed
Treatment by tetramethylethylenediamin leads to a rather wide distribution of particle
size The shape varies from plate-like to needles and also particles with aspect ratio close
to unity can be observed
129
Figure 531 The SEM picture of the catalysts 6902 (parent sample) 7797 (water treated sample) 7798 (H3PO4 treated sample) 7799 (TMEDA treated sample) 7800 (NaBrO3 treated sample) 8113 (N2H4
treated sample)
Also in the bromate treated sample a broad shape and size distribution can be observed
In the hydrazine treated sample the predominant shape of needle-like morphology from
the parent sample is conserved however particles with not well defined shape between
50-100 nm intervals can also be observed
130
original water H3PO4 TMEDA NaBrO3Hydrazine0
10
20
30
40
50
60
70
80
content [
]
sample
Nb
Mo
Te
V
Figure 532 The elemental composition of the original and the modified catalysts as probed by EDX
The bulk elemental composition of all the samples was determined by means of EDX
(Figure 532) The parent sample (6902) consists of 6244 at Mo 1627 atV 689
at Te and 1440 at Nb which corresponds to a formula of MoV026Te011Nb023Ox
In the distilled water treated sample (7797) the enrichment of Mo and V (6261 at and
1728 at) and depletion of Te and Nb (647 at and 1365 at respectively) was
observed leading to a formula of MoV028Te010Nb022Ox
The phosphoric acid treatment leads to slight decrease of Mo V and Te content in the
sample 7798 (6064 at 1516 at and 550 at respectively) balanced by the
enrichment of Nb (187 at)
Upon tetramethylethylenediamine treatment the Mo and Te content is increasing (to
6294 at and 727 at) while the V and Nb content decreases (1607 and 1372 at)
giving a sample of 7799 with the formula MoV026Te012Nb022Ox
Bromate treatment leads to the most significant depletion of Mo (to 5994 at) while V
Te and Nb are enriched (1699 704 and 1663 at) This sample with number 7800 has
the formula of MoV028Te012Nb028Ox
Upon hydrazine treatment the Mo and Te content decreases (6045at and 637 at)
while V and Nb are enriched compared to the parent sample (1784 at and 1534at)
The formula of the sample 8113 is MoV030Te011Nb025Ox
131
534 XAS and XPS
X-ray photoelectron spectroscopy (XPS) spectra were recorded at the synchrotron
radiation facility BESSY II for each modified samples The high pressure XPS spectra
were recorded at room temperature and in the presence of about 025 mbar oxygen
pressure in order to avoid the beam-induced reduction of the tellurium
No significant difference was observed between the X-ray absorption spectra (XAS)
corresponding to the original material water- phosphoric acid-
tetramethylethylenediamine- and hydrazine treated samples This suggests that no
significant changes happened in the average oxidation state or coordination geometry of
the metals upon treatment with the above named modifiers On the other hand the
difference spectra between the bromate treated sample (7800) and the original material
corresponding to the vanadium L3 edge showed a similarity with the V5+ reference
spectrum (Figure 535) This suggests that the bromate treatment lead to partial oxidation
of the V4+ ions to V5+
The survey photoelectron spectra showed that phosphorous- nitrogen- and bromide
containing species are absent in all the samples This suggests that none of the modifying
agents or their eventual reaction products (complexes reduced or oxidized forms of
bromate and hydrazine respectively) were bound to the catalyst
533 NEXAFS spectra of the bromate treated sample( 7800) the parent sample (6902) the difference
spectrum and the V5+ reference spectrum
132
Therefore the contamination of the M1 structure with different molecular or ionic
species from the chemical treatment can be ruled out
Core level photoelectron spectra of O1s V2p (32) Mo3d (52) Nd3d (52) and Te3d
(52) were recorded at different kinetic energies Low kinetic energy (165 170 and 180
eV) was applied for surface sensitive mode while higher kinetic energy (465 470 and
480 eV) for the bulk sensitive mode
The binding energy (BE) of Mo3d (52) are slightly lower compared to the typical value
of 2326 eV reported for MoO3 standard compound [5 13 14] The Mo3d peak is likely
composed of three peaks corresponding to a binding energy of 2310 2320 and the
highest component of 2326 eV Therefore the predominant oxidation state of
molybdenum is 6+ with minor contribution of 5+ and 4+ The presence of low
abundance of Mo5+ oxidation state has also been reported [14 15]
Table 533 The binding energies corresponding to every catalyst
Sample O1s
(eV)
V2p (32)
(eV)
Mo3d (52)
(eV)
Nb3d (52)
(eV)
Te3d
(52)
(eV)
6902 parent 5303 5163 2321 2064 5762 5733
7797 H2O 530-5301 516-5161 2320-2321 2063 576-5762 573-5732
7798 H3PO4 5299-5301 516-5162 2321 2063 576-5761 573-5731
7799 TMEDA 5301-5302 5161-5162
~2322 2064-2065 576-5761
573
7800 NaBrO3 ~5303 ~5164-5162
~2322 ~2065 5764-5762
~5733 8113
N2H4H2O 5301- 5302
5162-5163
2322 2065 5763 5733
The binding energy of Nb3d (52) was close to the value of 2072 reported for 5+
oxidation state while the binding energy of tellurium indicated the oxidation state of 4+
On the other hand the vanadium oxidation state was found to be 4+ As identified by
XAS in the bromate treated sample a small amount of V5+ was also present
133
The surface and bulk elemental composition was quantified from the spectra obtained at
low and high kinetic energy respectively The bulk elemental composition showed a
good agreement with the values determined by multi-spot EDX analysis
Figure 534 Normalized surface concentrations Correlation of Te content and TeV ratio with the
normalized selectivity to acrylic acid (bar-graph)
For a correlation between the elemental composition and the elemental composition and
the catalytic properties the surface concentration of the constituents corresponding to
every catalyst was normalized to the water treated sample 7797 (Figure 534)
Similarly the selectivity to acrylic acid determined at a propane conversion of 22plusmn2
was normalized to the selectivity of the water treated sample More detailed description
about catalytic oxidation of propane can be found in the subchapter 541 A good
correlation was found between the tellurium and the normalized selectivity The same
trend can be observed for between the tellurium to vanadium ratio and the normalized
selectivity This observation is in accordance with that reported by Haumlvecker et al [15]
134
535 Microcalorimetry
Adsorption microcalorimetry was employed to determine the number strength and
energy distribution of the adsorption sites on the catalyst Among the possible probe
molecules applicable in microcalorimetry propane and propylene were used to determine
the adsorption heat of educt on the catalyst On the other hand CO and NH3 probe
molecules were applied in order to characterize the acid-base properties of the sample
The interaction of these latter molecules with the catalyst was monitored also by means
of FTIR spectroscopy
A detailed microcalorimetric experiment using propane and propylene as probe
molecules was carried out on the original catalyst (6059) the results serving as
reference for the modified and spent catalysts The term ldquospent catalystrdquo refers to a
sample which has been used for catalytic reaction of propane and propylene oxidation
Since the aim of the study was to determine adsorption properties the temperature was
chosen low enough (40degC) to avoid chemical reaction on the catalyst surface
The Figure 535 displays the adsorption isotherm and the differential heat of propane
adsorption on the original material before and after catalytic reaction
Adsoprtion isotherm Differential heats as a function of coverage Figure 535 Adsorption of propane (educt of the catalytic reaction) at 313 K on fresh (dots) and used M1
(triangle) activated at 423 K under vacuum
The adsorption isotherm was fitted with a Langmuir model A fit up to 25 mbar
equilibrium pressure corresponding to the monolayer coverage yielded an adsorption
order of 106 on the fresh catalyst The adsorption equilibrium constant was found to be
135
0080 On the other hand the amount of adsorbed propane on the spent catalyst is lower
at every equilibrium pressure compared to the fresh catalyst The Langmuir fit gave an
adsorption order of 104 The adsorption order close to unity suggests non dissociative
adsorption
The initial differential heat of propane adsorption on the fresh M1 MoVTeNbOx is
constant at approximately 57 kJmol This indicates homogeneous distribution of
energetically uniform adsorption sites Additionally FTIR spectroscopy of ammonia
adsorption showed the presence of both Broslashnsted and Lewis acid sites However the ratio
between the Broslashnsted and Lewis acid sites was found to be equal to 234 [15]
The monolayer is completed at 35 micromolm2 propane coverage corresponding to an
equilibrium pressure of 25 mbar Above this coverage the differential heat of adsorption
decreases linearly with the amount of adsorbed propane suggesting the absence of
interaction between adsorbed molecules A saturation value of adsorption is reached at
about 52 micromolm2 and 22 kJmol enthalpy
Upon desorption of propane by evacuation at 40degC the integral signal of desorption was
recorded The integration of this signal gave the integral heat of desorption The absolute
value of the sum of differential heat of adsorption is comparable to the integral heat of
desorption (Table 534) indicating that the propane adsorption is a reversible process
Additionally the individual differential adsorption signals did not deviate from the
baseline suggesting that the process is pure adsorption The time constant of the stepwise
adsorption was found to be close to the time constant determined in the calibration of the
calorimetric cell (250-350 s) This also supports the absence of an additional process (eg
chemical reaction) besides the adsorption
A repeated experiment (re-adsorption after desorption Table 534) showed that the
isotherm and the differential adsorption heats are reproducible
Table 534 Adsorption and desorption heats corresponding to different coverages
Experiment (J) 1
)int(sum=
n
i
adsiq (J) )int( desiqminus
Adsorption of 0006 mmolm2 C3H8 789 656
Re-adsorption of 0004 mmolm2 C3H8 156 153
136
The initial differential heat of propane adsorption was constant also on the spent 6059
catalyst indicating homogeneous distribution of adsorption sites Nevertheless the initial
differential adsorption heat determined for on the spent catalyst was lower compared to
the fresh catalyst it is only ca 40 kJmol Similarly to the fresh catalyst the monolayer
was completed at a coverage of 35 micromolm2 coverage on the spent catalyst as well Since
the monolayer coverage is the same like on the fresh catalyst the number of adsorption
sites does not change during catalytic reaction but the strength of the interaction
decreases by ca 30
The linear decay of the differential heat of adsorption after completion of the monolayer
suggests that there are no significant interaction forces between the adsorbed molecules
The reversibility of the propane adsorption on the spent catalyst was proven by the good
agreement between the sum of integral heats corresponding to the individual adsorption
steps and the integral heat of desorption
The propylene adsorption isotherms and heat profiles determined at 40degC corresponding
to the fresh and spent 6059 catalyst are displayed on Figure 536 For comparison the
propane adsorption isotherms and heat profiles are also included in the plot
Adsorption isotherm Differential heats as a function of coverage Figure 536 Adsorption of propylene at 313 K on fresh (dots) and used M1 (triangle) activated at 423 K
under vacuum
The propylene adsorption isotherms indicate that a larger amount of propylene can be
adsorbed than propane on the fresh and used catalyst at the same equilibrium pressure
137
Similarly to propane adsorption the spent catalyst adsorbs a lower amount of propylene
compared to the fresh catalyst
The heat profile of propylene adsorption on fresh catalyst reflects the formation of two
different adsorption complexes due to energetically different adsorption sites Below the
coverage of 2 micromolm2 the differential heats are constant at ca 54 kJmol which is
comparable to the propane differential adsorption heat
The second plateau on the heat profile is between 25 and 42 micromolm2 where the
differential adsorption heat is around 41 kJmol Above the coverage of 42 micromolm2 the
differential heat of propylene adsorption decays linearly indicating no interaction
between the adsorbed molecules
Upon evacuation at 40degC the signal corresponding to the propylene desorption was
recorded The integral desorption heat was found to be 10 J while the sum of the
individual integral heats was 20 J The large difference between the adsorption and
desorption heats suggests that the propylene adsorption is not a fully reversible process
in contrast to propane adsorption On the other hand the time constant was between 400
and 550 seconds for the low propylene coverage This exceeds significantly the time
constant of 250-350 seconds determined for the empty calorimeter indicating irreversible
adsorption Nevertheless at higher propylene coverage the time constant of the
adsorption was comparable to that determined for the empty calorimeter
The partial irreversibility of propylene adsorption might be assigned to partial physical
blockage of adsorption sites or irreversible changes of these sites In order to find out
which of these possibilities is the reason for the observed irreversibility the adsorption
properties were re-measured with propane as probe molecule
After desorption of propylene from the fresh 6059 sample propane was re-adsorbed at
40degC The adsorption isotherm of propane re-adsorption performed after propylene
adsorption-desorption cycle showed a very significant difference in comparison to the
propane adsorption on the fresh 6059 sample (Figure 538) The amount of re-adsorbed
propane was significantly lower at any equilibrium pressure indicating that the number
138
of available adsorption sites was reduced during propylene adsorption-desorption
experiment
On the heat profile corresponding to the propane re-adsorption an initial plateau at 57
kJmol was observed
Adsorption isotherm Differential heats as a function of coverage Figure 537 Adsorption of propane at 313 K after propylene adsorption on fresh (open dots) M1 activated
at 423 K under vacuum For comparison the propane adsorption isotherm and differential heat profile if propane firstly adsorbed on the fresh M1 (dots)
This differential adsorption heat of propane is equal to the value determined on the fresh
catalyst suggesting that the energetics of propane adsorption is the same The
homogeneous distribution of the propane adsorption sites was not altered by the
preceding propylene adsorption-desorption process Nevertheless the monolayer
completion occurred already at around 03 micromolm2 coverage indicating that the number
of adsorption sites was reduced very significantly by ca 90 upon propylene
adsorption-desorption This confirms the observation made by comparing the adsorption
isotherms shown on Figure 536
The heat profile corresponding to propylene adsorption on the spent catalyst showed
three plateaus which is an indication of three groups of energetically equivalent
adsorption sites The initial differential adsorption heat determined up to 1 micromolm2
coverage is 55 kJmol This is identical with the initial adsorption heat on the fresh
sample but also similar to the propane initial adsorption heat on the fresh sample
Between 1 and 3 micromolm2 coverage the propylene adsorption heat is 41 kJ which is
139
equal to that determined for the fresh catalyst The third group of energetically equivalent
adsorption sites characterized by an adsorption heat of 37 kJmol can be observed
between 3 and 6 micromolm2 coverage
Propane adsorption experiment was carried out also on the fresh and spent bromate
treated M1 sample (7800) Compared to the original sample the modified catalyst
(7800) adsorbed a lower amount of propane at any equilibrium pressure The same trend
could be observed upon comparing the adsorption isotherms of the spent original and
spent bromate modified (7800) samples (Figure 539)
On the heat profile the fresh bromate treated sample shows an initial linear decay of the
differential heat of adsorption The differential adsorption heat is constant at 33 kJmol
between 22 and 35 micromolm2 coverage This plateau indicates the presence of Broslashnsted
acid sites After the decaying trend a second plateau can be observed between 4 and 5
micromolm2 coverage
FTIR study on ammonia adsorption supported the presence of both acid sites and
revealed a ratio of Broslashnsted to Lewis acid sites equal to 229 [15] This number is lower
compared to that one determined on the original material (234) indicating that indeed
and the density of Lewis acid sites is increasing upon bromate treatment
Additionally the spent bromate treated sample showed a decaying heat profile with no
plateau
Adsorption Isotherm Differential heats as a function of coverage Figure 538 Microcalorimetry on the bromate-treated phase-pure M1 catalyst (7800) before and after
catalytic experiment
140
The quantities of propane adsorption determined from the three-variable Langmuir fit
(adsorption order n monolayer coverage Nmono and the equilibrium constant of
adsorption K) are summarized in Table 535 The propane adsorption equilibrium
constant decreases for both catalysts during the reaction
The surface area available for propane adsorption was calculated based on the monolayer
coverage assuming one-to-one adsorption stoechiometry and propane cross sectional
area of 355Aring2 The surface areas determined by propane and propylene adsorption are in
good agreement with the surface area determined by nitrogen physisorption
Table 535 The adsorption order monolayer coverage and adsorption constant of propane adsorption for the 6059 and bromate treated sample (7800)
Surface area (m2g) Probe
molecule
Catalyst
state
Catalyst
ID n
Nmono
(mmolg)
K
(hPa-1) Langmuir BET
6059 107(1) 00485(8) 0078(3) 104 879 Fresh
7800 128(4) 00561(1) 0006(2) 132 504
6059 113(6) 0048(7) 0022(6) 114 nd C3H8
Spent 7800 099(8) 0044(3) 0005(4) 103 nd
Therefore the main difference between the original and the bromate treated sample
probed by adsorption microcalorimetry are the following
bull the fresh original catalyst exhibits homogeneously distributed energetically
equivalent adsorption sites for propane adsorption while upon bromate treatment
energetic heterogeneity
bull the energetic homogeneity of the adsorption sites is conserved for the original
material during the propane oxidation reaction but the reaction induces reduction
of the differential adsorption heat compared to the fresh catalyst In contrast to
this the heat profile of the spent bromate treated material shows a high degree of
heterogeneity the LewisBroslashnsted acid site ratio changes as observed by FTIR
study on ammonia adsorption
141
54 Catalytic experiments
541 Propane oxidation
Prior to catalytic tests the samples were pressed with 15 tons of force for 1 minute in a
pressing tool with 13 mm die Then the pellet was crushed gently in an agate mortar A
sieve fraction between 250 and 355 microm was used for catalytic experiments An amount of
ca 024 g sieve fraction was mixed with SiC (particle size between 315 and 400 microm) and
loaded in the isothermal zone of the reactor tube
Constant feed composition was used (C3H8O2H2ON2=364051 vol) while the space
velocity was varied between 20000 and 3000 h-1 at a reaction temperature of 400degC
The propane conversion at different space velocities is shown in Figure 541 The
activity of H3PO4- H2O- and TMEDA treated samples are slightly higher compared to
the parent sample However the differences are becoming less significant in the integral
operation mode between 30 and 80 conversion On the other hand the activity of the
bromate treated sample was significantly below the parent- and other modified samples
20000 15000 10000 50000
20
40
60
80
100
X C3H8 ()
GHSV (h-1)
6902 - original 7797 - H
2O mod 6902
7798 - H3PO
4 mod 6902
7799 - TMEDA mod 6902 7800 - NaBrO
3 mod 6902
8113 - N2H
4 mod 6902
Figure 541 The activity of the catalysts
The hydrazine treated sample showed lower activity at a space velocity compared to the
parent sample The activity becomes the same in the space velocity interval between
15000 and 5000 h-1 At GHSV=3000 h-1 the oxygen conversion reached 100 for this
catalyst and consequently the propane conversion was lower compared to the other
142
catalysts After performing the measurement at GHSV=3000 h-1 the catalytic properties
were re-measured at a space velocity of 5000 h-1 These results are summarized in Table
541 The data show that the catalytic properties are reversible after performing the
reaction under partly reducing conditions (100 oxygen conversion) This is in
accordance with the observations reported in the subchapter 431 In case of all the other
catalysts the highest oxygen conversion was ca 95 The selectivity to acrylic acid of all
the catalysts is plotted against the space velocity (Figure 542 left) The highest
selectivity was reached on the parent sample (6902) at the space velocity of 10000 h-1
Compared to this the selectivity on H2O- H3PO4 and TMEDA are slightly lower at
space velocities above 10000 h-1 and more significantly lower below GHSV=10000 h-1
The selectivity of the hydrazine and bromate treated samples is significantly below the
parent sample
Table 541 The catalytic performance of the hydrazine treated catalyst (8113) compared before and after the complete oxygen conversion experiment
Catalytic
Property GHSV=5000 h
-1 GHSV=3000 h
-1 GHSV=5000 h
-1
remeasured
XC3H8 () 589 plusmn 22 651 plusmn 61 589 plusmn 41 XO2 () 769 plusmn 22 100 778 plusmn 20 SAA () 314 plusmn 17 149 plusmn 21 279 plusmn 11 SCO2 () 286 plusmn 11 383 plusmn 17 292 plusmn 28 SC3H6 () 47 plusmn 04 34 plusmn 04 55 plusmn 05 SHAc () 88 plusmn 06 100 plusmn 13 120 plusmn 16 SCO () 265 plusmn 10 335 plusmn 15 278 plusmn 23
C-bal () 790 plusmn 11 908 plusmn 106 829 plusmn 40
The yield to acrylic acid at every space velocity is shown in Figure 542 (right) The
maximum yield of ca 26 has been attained on the parent sample and the TMEDA
treated sample at the space velocity of 5000 h-1 For the H2O- H3PO4 and N2H4 modified
samples the maximum yield of ca 20 was also at the space velocity of 5000 h-1 This
suggests that the kinetics of the reaction might be similar on these catalysts though the
rate constants may differ slightly
143
20000 15000 10000 50000
20
40
60
80
100 6902 - original 7797 - H
2O mod 6902
7798 - H3PO
4 mod 6902
7799 - TMEDA mod 6902 7800 - NaBrO
3 mod 6902
8113 - N2H
4 mod 6902
Selectivity to AA ()
GHSV (h-1)
20000 15000 10000 50000
10
20
30
40
50 6902 - original 7797 - H
2O mod 6902
7798 - H3PO
4 mod 6902
7799 - TMEDA mod 6902 7800 - NaBrO
3 mod 6902
8113 - N2H
4 mod 6902
GHSV (h-1)
Yield AA ()
Figure 542 The selectivity and yield of the catalysts
The conversion selectivity and yield profile of the bromate treated sample however
differs very much from all the other catalysts which suggests that the kinetics of propane
oxidation is significantly different
6902 7797 7798 7799 7800 811320
40
60
80
1006902 - original7797 - H
2O mod 6902
7798 - H3PO
4 mod 6902
7799 - TMEDA mod 69027800 - NaBrO
3 mod 6902
8113 - N2H
4 mod 6902
Apparent activation energy (kJm
ol)
Catalyst sample number
Figure 543 The apparent activation energy of propane activation over the catalysts
The temperature variation in 20degC steps between 360 and 400degC was carried out at a
space velocity of 5000 h-1 The apparent activation energy of propane consumption has
been determined from the Arrhenius plots Similar activation energies have been found
for the parent sample and the H2O- H3PO4- TMEDA and N2H4 treated samples
144
However the apparent activation energy of propane on the bromate and hydrazine treated
sample was significantly higher than for the other samples
542 Kinetic analysis of propane oxidation over the modified catalysts
The primary analysis of the activity and selectivity to acrylic acid on different catalysts
showed that only the bromate and the hydrazine treated samples are behaving different in
propane oxidation reaction The product rank analysis revealed that the reaction pathways
are also different although in every case the catalyst was M1 MoVTeNbOx with slightly
different surface and bulk elemental composition (Appendix 51) In this subchapter the
kinetic analysis of propane oxidation is presented
In section 423 and 424 it is shown that the reaction is first order with respect to
propane and 05th order with respect to oxygen Prior to kinetic modeling the verification
of first order kinetics with respect to propane and half-order kinetics with respect to
oxygen was verified using the integral method [16-17] For this purpose the integrated
rate laws were considered (Equations 541 and 542)
)245 ( 2
)145 ( lnln
222
8383
083
83
50
050
Equationkcc
Equationkyc
c
OappOO
HCappHC
HC
HC
τ
τ
sdotsdot+=
sdotminus==
The logarithm of the dimensionless propane concentration was plotted against the contact
time leading to straight lines This indicates that on every catalyst the reaction order with
respect of propane is equal to one According to the integrated rate law corresponding to
oxygen the square root of the oxygen concentration was represented in function of the
contact time No curvature was observed on the plots which supports that the reaction
order with respect to oxygen is 05 for all the catalysts
145
00 04 08 12 16 20-20
-16
-12
-08
-04
00
04 6902 7797 7798 7799 7800 8113
ln(yC3H8)
WF (gsml)
00 04 08 12 16 20
000
005
010
015
020
025
030 6902 7797 7798 7799 7800 8113
sqrt(cO2)
WF (gsml)
C3H8 O2
Figure 544 The linear representation of the rate law with respect to propane and oxygen 6902 ndash original 7797 ndash H2O modified 7798 ndash H3PO4 modified 7799 ndash TMEDA modified 7800 ndash NaBrO3
modified 8113 ndash N2H4 modified sample
The slopes of the linear regressions are collected in the Table 543 These slopes
correspond to the apparent rate constants of propane and oxygen consumption
respectively The apparent rate constant of propane activation is very similar for all the
catalysts except for the bromate treated sample which is less active by a factor of 27
compared to the parent sample
Table 542 The apparent rate constants of propane and oxygen consumption
C3H8 O2 Catalyst
-slope (mlgs) RN -slope (mlgs) RN
6902 119 plusmn 005 -09973 5 072 plusmn 001 -09999 5 7797 112 plusmn 009 -09955 5 068 plusmn 001 -09993 5 7798 116 plusmn 004 -09945 5 060 plusmn 001 -09995 5 7799 112 plusmn 004 -09854 5 074 plusmn 001 -09998 5 7800 044 plusmn 002 -09971 5 019plusmn 001 -09901 5 8113 114 plusmn 002 -09923 4 080 plusmn 005 -09989 5
Propylene was found to be an intermediate product The reaction pathways involving
propylene was approximated by the following scheme
)145 (Re Pr6383 actionoductsHCHC rarrrarr
146
The rate constant of propylene formation is k1 while the cumulative rate constant of
propylene further oxidation is k2 The differential equations corresponding to this scheme
are the following
)445 (
)345 (
63283163
83183
Equationckckdt
dc
Equationckdt
dc
HCHCHC
HCHC
sdotminussdot=
sdot=minus
By dividing the above two differential equations the derivative of time (dt term) is
cancelled and resulting differential equation contains only concentrations (Equation
545) Solving this differential equation leads to the equation involving the dimensionless
concentrations of propane and propylene and the dimensionless ratio of the rate constants
(κ=k2k1) (Equations 546 and 547)
[ ]
)845 ( )(
)745 ( 1
1
)645 (
)545 (
2
163exp63
838363
083
83
083
83
12
1
083
63
831
632831
83
63
1
2
Equationn
yy
S
Equationyyy
Equationc
c
c
c
kk
k
c
c
Equationck
ckck
dc
dc
n
i
calcdHCHC
HCHCHC
k
k
HC
HC
HC
HC
HC
HC
HC
HCHC
HC
HC
sum=
minus=
minussdotminus
=
minussdot
minus=
sdotminussdotminussdot
=
κ
κ
Iterative nonlinear fitting procedure was employed for the determination of the
dimensionless rate constant (Figure 545) A plausible value of κ was chosen and then
the value of yC3H6 was calculated For the objective function of the fitting the standard
deviation between the measured and calculated propylene dimensionless concentration
has been considered (Equation 548) The iteration was continued until the minimum of
the objective function was found (dSdκ=0) (Figure 545 right)
147
yC3H6 vs WF plot Standard deviation vs κ
00 02 04 06 08 10 12 14 16
000
001
002
003
004
005 y
C3H6 experimental
yC3H6
calculated κ=30
y C3H6
WF (gsml)
24 26 28 30 32
00000
00002
00004
00006
00008
00010
00012
00014
Standard deviation
κ
Figure 545 Plot of the experimental with calculated yC3H6 data for catalyst 6902
The dimensionless rate constant κ for each catalyst was determined using the above
described procedure The numerical values are collected in Table 543
Table 543 The rate constants of propane and propylene consumption
Catalyst ID k1
(mlgs) κκκκ k2
(mlgs) ττττmax
(gsml)
6902 119 300 3570 010 7797 112 225 2520 013 7798 116 234 2714 012 7799 112 225 2520 013 7800 044 232 1021 032 8113 114 220 2508 013
The κ values may be compared to literature results
Griszligtede reported a propane consumption rate constant of 084 gsml a propylene partial
oxidation rate constant to acrylic acid equal to 17 gsml and a rate constant of 34 gsml
towards byproducts (CO CO2 and acetic acid) formation on a MoV033Te025Nb017Ox
catalyst [12 18] The global consumption rate of propylene is therefore 204 gsml The
ratio of propylene consumption and propane consumption rate is 204084=243
Loacutepez-Nieto et al reported a value of ca 24 on a predominantly M1 phase containing
MoVTeNbOx catalyst [19]
148
Naraschewski et al reported a value of 25 for MoVTeNbOx catalysts with ten different
elemental- and phase compositions [20] However the fitting was made in case of one of
the catalyst the κ value for each catalyst was not quantified
From the κ and the k1 data the k2 was also calculated and shown in the Table 544
Additionally the contact time corresponding to the maximum propylene concentration
was also calculated (Table 543)
)945 ( ln)1(
1ln
1
11
2
12max Equation
kk
k
kkκ
κτ
minus=
minus=
It can be seen that the maximum propylene concentration is at around 012 gsml for most
of the catalysts This low contact time was not covered in the experiments On the
bromate treated sample (7800) the calculated τmax is equal to 032 while the
experimental value lies around 033 which is in good agreement with the calculated one
543 Propylene oxidation
Catalytic testing in propylene oxidation reaction has also been carried out using the
parent sample and all the modified descendant catalysts
The feed composition was the following C3H6O2H2ON2=364051vol According to
the reasoning in section 425 the temperature interval between 360-400degC was chosen
which corresponds to the temperature interval for the propane oxidation The space
velocity was kept at 20000 h-1 in order to achieve propylene conversions below 100
The ranking order of the catalysts in the activity of propylene activity resembles the
activity in propane oxidation the tetramethylethylenediamine treated sample showed the
highest activity followed by the original the water- the phosphoric acid hydrazine and
the bromate treated samples Similarly to the propane oxidation reaction the propylene
conversion was also significantly lower on the bromate treated sample compared to the
other catalysts
149
360 370 380 390 400
40
60
80
100
6902 7797 7798 7799 7800 8113
X C3H6 ()
T (degC)
Figure 546 The activity of the catalysts in propane oxidation reaction 6902 ndash original 7797 ndash H2O
modified 7798 ndash H3PO4 modified 7799 ndash TMEDA modified 7800 ndash NaBrO3 modified 8113 ndash N2H4 modified sample
360 370 380 390 4000
20
40
60
80
100
6902 7797 7798 7799 7800 8113
S AA ()
T (degC)
360 370 380 390 4000
20
40
60
80
6902 7797 7798 7799 7800 8113
Y AA ()
T (degC)
Figure 547 The selectivity and yield of the catalysts in propane oxidation reaction 6902 ndash original 7797 ndash H2O modified 7798 ndash H3PO4 modified 7799 ndash TMEDA modified 7800 ndash NaBrO3 modified
8113 ndash N2H4 modified sample
The acrylic acid selectivity was found to be the highest on the bromate treated sample
followed by the hydrazine treated sample (Figure 547) The higher selectivity however
may be attributed to the fact that these catalysts are less active than the others The
150
acrylic acid selectivity on other catalysts was lower and similar to each other with a
maximum at 380degC
When the the acrylic acid yield is compared the highest performing catalyst is hydrazine
treated sample All the other catalysts show a similar yield at every temperature except
for the bromate treated sample which has the lowest performance (Figure 547)
It is notable that the ratio between the CO and CO2 selectivity is higher than one for the
parent- H2O- TMEDA- and treated samples while for the H3PO4- NaBrO3 and N2H4-
treated samples this ratio is statistically close to one
544 CO oxidation and water gas shift reaction
CO oxidation reaction as a test reaction for electrophilic oxygen species on the catalyst
surface was also performed [21] The reaction was carried out in dry and in 40vol
steam containing feed Besides this water gas shift reaction was also carried out using a
40 vol steam containing feed The same experimental procedure was applied as it was
described in the section 427
150 200 250 300 350 400
000
001
002
003
004
005
006 8947 7800 8113
CO2 concentration (vol
)
T (degC)
000 025 050 075 100 125 150
0000
0005
0010
0015
0020
0025 8947 7800 8113
yCO2
WF (gsml)
CO2 production vs temperature yCO2 vs contact time at 400degC
Figure 548 The CO oxidation activity at different temperatures and GHSV=3000 h-1 (left) The kinetic curves of CO2 formation at 400degC (right) Conditions COO2H2ON2=36091 vol Catalysts 8947 ndash
as prepared M1 MoVTeNbOx 7800 ndash NaBrO3 treated 6902 8113 ndash N2H4 treated 6902
151
CO oxidation carried out in steam free oxidizing feed (GHSV=3000h-1) at different
temperatures revealed that for all the catalysts the onset temperature is between 250 and
300degC The ranking order in CO oxidation activity at 400degC is the following hydrazine
treated sample (8113) the bromate treated material (7800) and original sample
(8947) Therefore the abundance of electrophilic oxygen species is decreasing in this
order of the catalysts [26] It is also notable that the CO conversion was far below the
equilibrium conversion for both the CO oxidation and water gas shift reactions (100
and 996 respectively) calculated from the thermodynamic data of CO CO2 H2 and
H2O (Table 545)
Table 544 Activation energy of CO oxidation Feed composition COO2H2ON2=36091 vol 8947 ndash as prepared M1 MoVTeNbOx 7800 ndash NaBrO3 treated 6902 8113 ndash N2H4 treated 6902
Catalyst ID Ea (kJmol)
8947 51 plusmn 2 7800 55 plusmn 7 8113 54 plusmn 7
Because the CO conversion is very low (below 3) all the data are in the differential
operation regime Therefore the rate constant of CO2 formation is equal to the slope of
the straight line of the dimensionless concentration of CO2 represented in function of the
contact time (Figure 548 and 549) Since there is no other product than CO2 the rate
and rate constant of CO consumption is equal to the rate and rate constant of CO2
formation The activation energy of CO oxidation determined from the Arrhenius-plot is
statistically similar on the three catalysts (Table 544)
In case of all the three catalysts the water gas shift reaction had the lowest conversion
and rate constant followed by the CO oxidation in dry feed (Table 545 and 546) The
highest CO conversion was observed in the case of CO oxidation in presence of 40 vol
steam in the feed This suggests that CO oxidation and water gas shift reactions are
parallel reaction steps However it is notable that the CO oxidation activity in presence
of 40 vol steam is less than the algebraic sum of the CO conversions determined in the
CO oxidation in dry feed and the water gas shift reaction in presence of 40 vol steam
152
000 025 050 075 100 125 150
0000
0005
0010
0015
0020
0025
0030 8947 7800 8113
yCO2
WF (gsml)
000 025 050 075 100 125 150
00000
00025
00050
00075
00100
00125
00150
yCO2
8947 7800 8113
WF (gsml)
CO oxidation in presence of steam
COO2H2ON2=364051 vol 400degC Water gas shift reaction
COO2H2ON2=304057 vol 400degC Figure 549 Kinetic curves for CO2 formation for the CO oxidation in presence of steam and for the water
gas shift reactions Catalysts 6902 minus as prepared M1 MoVTeNbOx) 7800 minus NaBrO3 treated sample 8113 minus N2H4 treated sample
Table 545 The CO conversion at GHSV=3000 h-1 and 400degC
Catalyst ID
XCO () CO oxidation
COO2H2ON2= 36091 vol
XCO () CO oxidation
COO2H2ON2= 364051 vol
XCO () water gas shift
COO2H2ON2= 304057 vol
8947 114plusmn012 146plusmn004 074plusmn004 7800 186plusmn004 239plusmn002 099plusmn012 8113 215plusmn012 227plusmn004 132plusmn008
Equilibrium 100 100 996
The rate constant of CO oxidation or water gas shift reaction was found to be very low in
the order of magnitude of 10-2 mlgs The same trends of the rate constant with respect of
the catalyst and the feed composition can be observed like in the activity expressed by
CO conversion (Table 546) The difference between the rate constant of CO oxidation in
dry feed and the sum of the rate constants CO oxidation in dry feed and the water gas
shift reaction suggests that these reactions may run in parallel but their contribution is
not the same
153
Table 546 Rate constants of CO2 formation at 400degC
Catalyst ID
kCO2 (mlgs) CO oxidation
COO2H2ON2= 36091 vol
kCO2 (mlgs) CO oxidation
COO2H2ON2= 364051 vol
kCO2 (mlgs) water gas shift
COO2H2ON2= 304057 vol
8947 (104plusmn04)10-3 (127plusmn03)10-3 (62plusmn02)10-3 7800 (148plusmn02)10-3 (192plusmn02)10-3 (87plusmn08)10-3 8113 (164plusmn04)10-3 (184plusmn03)10-3 (89plusmn05)10-3
The very low reactivity in CO oxidation and water gas shift reaction supports the fact that
during the propane oxidation the CO2 is formed in reaction steps which are independent
on the CO formation steps
55 Conclusions
The chemical treatment of the phase-pure MoVTeNbOx catalyst (referred to as parent or
original sample) with distilled water and solutions of phosphoric acid
tetramethylethylenediamin sodium-bromate and hydrazine was carried out at room
temperature The solutions were chosen in such a way to cover all the chemical effects
neutral acidic and complexing basic and complexing oxidizing and reducing None of
these treatments altered the M1 phase as probed by XRD The surface area was only
marginally affected by the treatment as shown by N2 physisorption
The morphology did not change significantly upon water treatment of the M1 material
However the treatment by all other solutions changed more significantly the shape of the
particles and the aspect ratio In contrast to the literature evidence [4] not only the
surface composition but also the bulk elemental composition was slightly affected by
chemical treatments with different solutions Nevertheless the M1 phase was kept intact
which showed that the crystal structure is robust enough to withstand minor changes in
the elemental composition upon leaching with the above mentioned solutions Besides
leaching of ions the oxidation of V4+ to V5+ during bromate treatment was also observed
No detectable change of the oxidation states has been observed for the other modified
catalysts
All the modified samples were tested for propane and propylene oxidation reaction Only
marginal improvements were observed in the propane conversion for the H2O- H3PO4
and the TMEDA-treated samples accompanied by a slight decrease in the acrylic acid
154
selectivity On the other hand the hydrazine treatment reduced slightly while the
bromate treatment reduces significantly both the conversion and the acrylic acid
selectivity at any space velocity For these two latter catalysts the apparent activation
energy was found to be higher than for all the other samples The reaction pathway
analysis using the delplot technique revealed that propylene is a first rank product in
every case The acrylic acid CO CO2 and acetic acid were found to be mixed rank
products (including primary secondary and tertiary ranks the main rank being
secondary) The only exception is the hydrazine treated sample on which all products
were found to be of first rank This sample is the only one which exhibited COCO2
selectivity ratio smaller than one
The first order kinetics with respect to propane and half order kinetics with respect to
oxygen was conserved in all the modified catalysts The ratio of propylene formation and
its further consumption is the highest (κ=30) for the parent sample This ratio is lower
for the modified catalysts the lowest value of 22 being determined for the hydrazine
treated sample
The ranking order for catalytic performance of propylene oxidation resembles to the trend
observed in propane oxidation
CO oxidation reaction was carried out on selected catalysts as a semi-quantitative
indicator-reaction for electrophilic oxygen species The semi-quantitative character of
this test reaction is derived from the fact that no standards were used with known
abundance of electrophilic oxygen species on the surface but rather the parent sample
was used as a reference catalyst The CO oxidation activity of the bromate and hydrazine
treated samples were determined because these showed markedly different catalytic
behavior both in propane and propylene oxidation reactions The ranking order in CO
oxidation activity showed that the hydrazine treated sample exhibits the highest
abundance of electrophilic oxygen species followed by the bromate treated sample and
the original catalyst
Furthermore water gas shift reaction and CO oxidation in presence of steam was also
carried out on these catalysts The CO conversion was found to be below 25 at the
space velocity of 3000 h-1 and a reaction temperature of 400 degC The low rate of CO2
production indicated that under propane oxidation conditions the CO oxidation and water
155
gas shift reactions are negligible Therefore this experiment proved that CO and CO2
byproducts are formed independently on each other in different pathways
The XRD patterns of the samples after propane and propylene oxidation reaction showed
that there was no phase change re-confirming the robustness of the M1 phase under
propane and propylene oxidation reaction conditions
References Chapter 5
1 Japanese Laid-Open Patent Application No 10-330343 2 L E Bogdan European Patent 1254707 A1 assigned to Rohm and Haas
Company 2002 3 4 LE Bogdan D A Bors F A Pessoa Cavalcanti M Bruce Clark A M
Gaffney S Han US Patent 7326668 B2 assigned to Rohm and Haas Company 5 V V Guliants R Bhandari B Swaminathan V K Vasudevan H H
Brongersma A Knoester A M Gaffney S Han J Phys Chem B 109 (2005) 24046-24055
6 M Baca J M M Millet Appl Catal A General 279 (2005) 67-77 7 Yu V Kolenrsquoko T Wolfram F Girgsdies W Zhang T W Hansen D Su A
Trunschke R Schloumlgl Chem Cat Comm accepted for publication 8 I H Warren DC Reid Chemistry and materials science Metallurgical and
materials transaction B Vol 13 No 4 565-570 9 D Langmuir P Chrostowksi R Chaney B Vigneault Issue Paper on the
environmental chemistry of metals US Environmental Protection Agency August 2003
10 E Asselin T M Ahmed A Alfantazi Corrosion Science 49 2 (2007) 694-710 11 M Bouroushian Electrochemistry of metal chalcogenides Monographs in
Electrochemistry (Ed F Scholz) Springer 2010 Page 65-69 12 P DeSanto DJ Buttrey RK Grasselli CG Lugmair AF Volpe BH Toby
T Vogt Z Krist 219 (2004) 152-165 13 I Griszligtede Die Partielle Oxidation von Propan zu Acrylsaumlure Bestimmung der
Reaktionskinetik und in-situ characterisierung des Katalysators unter Betriebsbedingungen Dissertation Universitaumlt Karlsruhe 2004 Universitaumltsverlag Karlsruhe ISBN 3-937300-17-1
14 J F Moulder W F Strickle P E Sobol K D Bomben Handbook of XPS spectroscopy Perkin-Elmer USA 1992
15 A Celaya Sanfiz T W Hansen D Teschner P Schnoumlrch F Girgsdies A Trunschke R Schloumlgl M H Looi S B A Hamid Journal of Physical Chemistry C 114 (2010) 1912
16 M Haumlvecker S Wrabetz J Kroumlhnert LI Csepei R Naumann dacuteAlnoncourt Yu V Kolenacuteko F Girgsdies R Schloumlgl A Trunschke J Catal submitted
17 Ch G Hill An introduction to chemical reaction engineering kinetics and reactor design John Wiley and Sons 1977 24-74
156
18 R W Missen Ch A Mims B A Saville Introduction to chemical reaction engineering and kinetics John Wiley and Sons 1999 49-55
19 E Balcells F Borgmeier I Griszligtede H G Lintz F Rosowski Appl Catal A General 266 (2004) 211
20 J M Loacutepez-Nieto B Solsona P Concepcioacuten F Ivars A Dejoz M I Vaacutezquez Catal Today 157 (2010) 291-296
21 F N Naraschewski C P Kumar A Jentys J A Lercher Appl Catal A General 391 1-2 (2011) 63-69
22 J Hermann Catal Today 2006 (112) 73-77
157
Chapter 6 Exploratory experiments
61 Introduction
In the literature many catalyst systems are reported for the selective oxidation of propane
to acrylic acid These can be classified into heteropolyacids and their salts phosphates
and molybdenum based mixed oxides [1 2] A strict delimitation between these classes
can not be made because under reaction conditions the heteropolyacids may transform
into oxides or phosphates [3] In general the performance of catalysts belonging to the
first two classes is rather poor Ai reported that an acid yield of ca 12 mol V2O5-P2O5
with a PV ratio equal to 100 while the yield decreased strongly with increasing PV
ratio
Upon incorporation of H3PMo12O40 heteropoly acid and Te in the V2O5-P2O5 the yield
could be increased The addition of SO3 barely had any effect while in presence of
H3PW12O40 Nb2O5 Sb2O3 SiO2 and B2O3 the yield decreased significantly [4 5]
The most prominent catalysts are the molybdenum and vanadium based mixed oxides
Katou et al reported the hydrothermal synthesis of orthorhombic and amorphous MoVOx
and MoVTeOx catalysts with surface areas up to 10 m2g [6] The catalytic experiments
were carried out in the narrow temperature interval between 343 and 354 degC A rather
reducing feed with the composition of C3H8O2H2ON2=651045385 vol was used
Propane conversions below 30 were reported on these catalysts at a single space
velocity of 2400 h-1 The products were acrylic acid propylene acetic acid acetone and
carbon oxides The acrylic acid selectivity was found to be around 6 for the crystalline
MoVOx catalyst In comparison to that the acrylic acid selectivity on the amorphous
catalyst was below 4 even at low propane conversion The quaternary orthorhombic
MoVTeOx oxide was found to be the best performing catalyst a selectivity of 493 was
reported at a conversion of 256 This led to the conclusion that tellurium promotes the
selective pathway towards acrylic acid The CO2 selectivity was in every case higher
than the CO selectivity On the other hand the acetic acid selectivity was also significant
above 15 However the product selectivities were compared at different conversions
for each catalyst Because of the fact that the selectivity depends on the conversion any
kind of comparison or ranking of selectivities made at different conversions might be
misleading Ueda et al addressed the question of catalytic function of each element of
158
MoVTeNbOx in the selective oxidation of propane to acrylic acid [7 8] Catalytic
experiments were carried out at different temperatures on hydrothermally prepared single
phase orthorhombic MoVOx MoVTeOx and MoVTeNbOx catalysts using a more
reducing feed (C3H8O2H2ON2=8104537 vol) than that reported by Katou et al [6]
The propane conversion was found to be very similar over all the catalysts at every
temperature below 380degC Although activation parameters were not calculated the very
similar temperature-conversion curve indicated that the activation energy indeed did not
depend on the presence and the quality of the third and fourth element Based on this fact
the authors claimed that Mo and V are the sole elements responsible for propane
activation On the other hand a rather poor selectivity (below 10) to acrylic acid was
reported for MoVOx at every temperature while the incorporation of tellurium lead to a
major increase in the selectivity to over 40 In the presence of niobium the highest
selectivity exceeded 60 indicating that both tellurium and niobium are indispensable
components of a high performing propane oxidation catalyst The positive effect of
tellurium was ascribed to its promoting effect on propylene further oxidation to acrylic
acid On the other hand the positive effect of niobium was ascribed for preventing the
acrylic acid over-oxidation One possible explanation was given by the site isolation
concept introduced by Grasselli [9] Without experimental evidence the modulation of
the redox couplings by Nb5+ in the MoVTeNbOx was highlighted as second possibility
for the beneficial effect of niobium on the catalytic performance
Guliants et al reported the surface promotion of hydrothermally synthesized
orthorhombic MoVOx catalyst [10] The tellurium antimony and niobium promoters lead
to increased activity and selectivity to acrylic acid The mixed Nb+Te and Sb+Nb
promoted catalysts showed the highest performance in accordance with the observations
on bulk mixed oxide catalysts
62 Propane oxidation reactivity on different Mo and V based catalysts
In the present study the catalytic testing in propane oxidation reaction to acrylic acid was
carried out on different ternary quaternary and quinternary Mo and V based mixed metal
oxide catalysts These are summarized in Table 621
159
In order to compare the catalytic data with literature results for the ternary and
quaternary oxides the experiments were performed under identical conditions with
respect to feed composition and contact time (C3H8O2H2ON2=651045385 vol
GHSV=2400 h-1 WF=150 gsml) with that used by Katou et al [6]
Table 621 The used catalysts and reaction conditions Catalyst preparation methods SD ndash spray drying HT ndash hydrothermal
Sample
ID
Composition
(EDX analysis)
Prep
Meth
C3H8O2H2ON2
(vol)
GHSV
(h-1
)
T
(degC)
1862 (Mo093V007)5O14 SD 36091 5000 400-
450
6142 MoV031Ox HT 651045385 2400 280-
320
8103 MoV034Ox HT 364051 9000-
42000 400
6274 MoV029P013Ox HT 651045385 2400 320-
360
6619 MoV044P005Ox HT 651045385 2400 300-
340
6683 MoV03Te003Ox HT 651045385 2400 300-
340
6059 MoV026Te010Nb022Ox HT 364051 5000-
66000
360-
400
The activities of the catalysts were found to be different under identical space velocity
and temperature Therefore the temperature was varied in 20degC steps in order to achieve
similar conversions of propane on the above named ternary and quaternary oxides In
case of 6274 the temperature was varied between 320 and 360degC while in case of 6619
and 6683 the reaction temperatures were between 300 and 340degC Among this set of
catalysts the MoVOx 6142 showed the highest activity thus the temperature was varied
between 280 and 320degC
160
Most of the catalytic studies in propane oxidation are performed under a different
condition that that reported by Katou et al [6] The typical feed composition is
C3H8O2H2ON2=364051vol and the temperature between 360 and 400degC For the
purpose of comparison the reactivity of MoVOx 8103 catalyst was tested using the
latter feed composition at 400degC In order to achieve different conversion of propane
which are comparable to those determined for the previously mentioned catalysts the
contact time was varied between 0075 and 0400 gsml (GHSV=48000 and 9000h-1)
Table 622 Comparison of the catalytic performance of MoVTeNbOx (6059) and MoVOx (8103) samples at 400degC feed composition C3H8O2H2ON2=364051 vol
6059 8103 GHSV (h
-1)
XC3H8 () SAA () XC3H8 () SAA ()
9000 381 plusmn 04 513 plusmn 13 436 plusmn 07 050 plusmn 002
24000 153 plusmn 04 392 plusmn 06 230 plusmn 05 18 plusmn 02
Upon comparing the conversions of propane under identical conditions with respect to
the feed composition temperature and space velocity it was found that MoVOx 8103 is
more active than MoVTeNbOx 6059 (Table 621) in contrast to the observation of
Ueda et al [6] On the other hand the significantly lower selectivity towards acrylic acid
of the MoVOx is in accordance with the trend reported by Ueda et al [6]
For comparison of the catalytic performance of phase-pure M1 MoVOx and Mo5O14-type
structure the (Mo093V007)5O14 oxide catalyst (1862) was also tested for propane
oxidation The (Mo093V007)5O14 catalyst was found to be rather inactive at 400degC and a
contact time of 072 gsml the conversion being only 04 and propylene selectivity of
48 At a reaction temperature of 450degC a propane conversion of 21 was achieved
while the propylene selectivity decreased to 29 Contrary to the experiment using M1
MoVOx catalysts no oxygenates were detected either in steam containing feed or in dry
feed Under every condition only propylene CO and CO2 were produced Therefore this
oxide acts only as an oxidative dehydrogenation catalyst This observation indicated that
besides the elemental composition the crystal structure has a decisive role both in
propane activation and reaction pathways
161
The Mo and V containing M1 catalyst (8103) was very active at 400degC while the
(Mo093V007)5O14 structure was much less active In contrast to the MoVOx M1 structure
the (Mo093V007)5O14 is unable to insert oxygen in the C-H bond to form oxygenates The
different reactivity of M1 MoVOx and (Mo093V007)5O14 is certainly related to the
different termination of the different bulk structures
The low propane oxidation activity of (Mo093V007)5O14 (1862) sample is in accordance
with the literature Baca et al reported a propane conversion of 08 and acrylic acid
selectivity of 6 on (Mo093V007)5O14 at 410degC On the other hand the (Mo093V097)5O14
exhibited a conversion of 26 at 410degC with 0 selectivity to acrylic acid [11]
For the comparison of the catalytic property of the catalysts the acrylic acid selectivity
was plotted versus the conversion (Figure 621) which allows a better comparison of the
performance rather than comparing selectivities at different conversions
The performances of all the ternary and quaternary catalysts were spread in the low
conversion-low selectivity quartile of the conversion-selectivity plot On the other hand
the phase pure MoVTeNbOx catalyst can be found in both the low conversion ndash high
selectivity and the high conversion ndash high selectivity quartile Therefore the rather
complex phase pure MoVTeNbOx is the best performing catalyst since the selectivity is
markedly higher than for all the other studied catalysts
The MoVOx 6142 catalyst exhibited a highest selectivity to acrylic acid of 25plusmn02
determined at a conversion of propane equal to 185plusmn20 the maximum yield being
05plusmn01 The most abundant product at this conversion was CO almost independently
on the reaction temperature (S=435plusmn08) followed by CO2 with a selectivity of
253plusmn05 A significant amount of acetic acid was also formed (SHAc=217plusmn08)
while propylene was a relatively minor product with a selectivity of 80plusmn03 The
selectivity to propylene acrylic acid and acetic acid decreased with increasing
temperature while the CO2 selectivity increased significantly with increasing reaction
temperature
The inclusion of tellurium in the MoVOx structure (6683) led to a slightly reduced
selectivity to acrylic acid compared to the pure MoVOx catalyst Similarly to the MoVOx
162
catalyst CO was the most abundant product with selectivity of ca 46 and almost
independently of the temperature
0 10 20 30 40 50 60 70 800
10
20
30
40
50
60
70
80
6619 - MoVPOx
6683 - MoVTeOx
6274 - MoVPOx
6142 - MoVOx
8103 - MoVOx
6059 - MoVTeNbOx
SAA ()
XC3H8 ()
Figure 621 Catalytic performance of different phase-pure Mo and V based oxides
The second most abundant byproduct was CO2 Its selectivity increased with the
temperature from 290plusmn07 to 360plusmn04 Acetic acid was formed in quite important
amounts (S=155plusmn16) while propylene was formed only in 68plusmn02
The inclusion of small amount of phosphorous in the MoVOx structure (6619) led to the
increase in the selectivity to acrylic acid to 47plusmn07 measured at the propane conversion
of 157plusmn35 The main product was CO its selectivity being over 40 Carbon dioxide
was the second most abundant product with selectivities above 28 The propylene
selectivity was situated between 111plusmn04 and 62plusmn04 while acetic acid between
124plusmn15 and 106plusmn07 depending on the temperature
A higher phosphorous content in the catalyst 6274 was beneficial for the increase of the
selectivity to acrylic to (obtained at 181plusmn10 propane conversion)
Among the studied ternary and quaternary catalysts this one exhibited the highest
selectivity (156plusmn03 obtained at a conversion of 181plusmn10) and yield of 33plusmn03
This yield is higher than the best value reported by Katou et al [6] Similarly to the other
163
catalysts the total oxidation products are the most abundant ones The propylene and
acetic acid selectivity was 122plusmn02 and 176plusmn01 respectively
The apparent activation parameters (activation energy Ea logarithm of the preexponential
factor lnA activation enthalpy ∆H and activation entropy ∆S) of propane and oxygen
conversion were calculated based on the linearized Arrhenius- and Eyring-Polanyi
equations In the literature the activation enthalpy and entropy is seldom considered
although these quantities also give an important insight into the activation of molecules
involved in the reaction
Figure 622 The activation parameters of the propane and oxygen conversion on the MoV(Te)(P)(Nb)Ox catalysts
The highest propane activation energy of ca 60 kJmol was observed for MoVOx
catalyst Statistically similar activation energy was determined for the phosphorous
containing catalysts However in the case of tellurium inclusion the activation energy of
propane is reduced significantly by ca 20 kJmol compared to MoVOx This observation
is in contradiction with that reported by Ueda et al namely that the presence of the
tellurium and niobium does not affect the propane activation [6-8]
The logarithm of the pre-exponential factor is also different for all the catalysts The
apparent activation energy and the pre-exponential factor of oxygen consumption differ
for the individual catalysts It is remarkable that the highest oxygen activation energy is
associated to the catalyst 6274 with the highest acrylic acid selectivity However the
6142 6274 6619 6683 60590
20
40
60
80
100 Ea C3H8 (kJmol)
lnA C3H8
Ea O2 (kJmol)
lnA O2
Ea lnA
Catalyst
Activation energy pre-exponential factor Activation enthalpy and entropy
6142 6274 6619 6683 60590
-50
-100
-150
-200
-250 ∆∆∆∆H
C3H8 (kJmol)
∆∆∆∆S C3H8 (JmolK)
∆∆∆∆H O
2 (kJmol)
∆∆∆∆S O
2 (JmolK)
∆∆ ∆∆H (kJm
ol)
∆∆ ∆∆S (J
molK)
Catalyst
164
active surface oxygen species are involved in many reaction steps including the
dehydrogenation of propane to propylene the oxidation of propylene to acrylic and acetic
acids and eventually the combustion steps Certainly the global oxygen consumption is
the sum of the amount of oxygen species consumed in all these steps
The negative activation entropy of both propane and oxygen activation suggests that
these are involved in associative steps in the formation of the transitional state More
negative activation entropy indicates a more rigid transitional state The most negative
activation entropy was observed on 6683 MoVTeOx while the least negative on 6142
MoVOx
Table 623 summarizes the catalytic performance of some selected catalysts reported in
the literature The literature search data serves as a basis for comparison of the catalytic
performance for the catalysts reported in the present work
The first and second column contains information concerning the catalyst composition
and preparation method respectively Very different preparation methods (including
slurry- hydrothermal- solid-solid reaction impregnation- and spray drying) were used
On the other hand the extent of characterization reported by the literature sources also
differs very much
For instance the elemental composition reported by Ai refers to preparative composition
[4 5] In contrast to that in the more recent studies a thorough characterization of the
catalysts (including surface and bulk sensitive analytical methods) is documented
Very different reaction conditions were used by the different authors Ai used highly
oxidizing feed (O2C3H8=40) without employing inert gas (balance gas) besides steam
[4 5] A reducing feed was used by Ueda et al Baca et al Guliants et al [7 8 10]
while Celaya Sanfiz et al worked with stoichiometric feed [12] As it is shown in Table
623 in the present work both reducing and stoichiometric feed were used
Table 623 summarizes the catalytic performance of some selected catalysts reported in
the literature The literature search data serves as a basis for comparison of the catalytic
performance for the catalysts reported in the present work
165
Table 623 Comparison of the performance of selected catalysts Composition as determined by (a) stoichiometry (b) ICP (c) EDX (d) LEIS-surface Preparation method slurry (Sl) hydrothermal (Ht)
Solid-solid (Ss) Incipient impregnation (Ii) Spray drying (Sd) (P) ndash present work Catalyst Prep
meth C3H8O2H2Oinert
(vol) GHSVWF-1τ (h-1gsml-1s)
T (degC)
XC3H8
() SAA
() YAA
() EaC3H8
(kJmol-
1) Ref
VPOa 380 281 na na 126plusmn8 VPO+H3PMo12O40
a 380 348 na na 113plusmn9 VPO+ H3PW12O40
a 370 294 na na 195 VPO+ SO3
a 380 330 na na 79plusmn11 VPO+TeO2
a 380 246 na na 109plusmn4 VPO+Nb2O5
a 360 342 na na 74 VPO+Sb2O3
a 380 332 na na 88 VPO+SiO2
a 385 171 na na 107plusmn7 VPO+B2O3
a
Sl 19762210
--9
400 236 na na 126
4
VP115Te015Oa 340 18 46 8 na
VP115Te015Nb01Oa 340 25 32 8 na
VP115Te015Zr01Oa
Sl 19762210
340 42 16 7 na
5
MoV034Ob 379 327 34 1 na
MoV044Te01Ob 380 362 466 17 na
MoV025Te011Nb012Ob
Ht 8104537 240015-
380 334 624 21 na 6
MoV023Te011Nb014Oc
(M1) Ht 380 299 52 16
58 plusmn04
MoV03Te032Nb007Oc
(M2) Ss 410 06 22 01 na
MoV033Te022Nb011Oc Sl 380 349 53 19 58plusmn18
MoV05Te022Nb011Oc Sl
6104341 2500--
400 253 46 12 648
Mo097V095O5c Ht
651045385 3300--
410 264 0 0 26plusmn1
11
MoV019Od 400 47 4 02 168plusmn18
MoV068Od 400 114 4 05 68plusmn6
MoV036Te007Od 400 111 8 09 48
MoV03Nb013Od 400 136 20 27 72plusmn12
MoV02Sb007Od 400 181 19 34 67plusmn23
MoV069Te004Nb013Od 400 102 29 30 108plusmn13
MoV031Nb014Sb002Od
Ht
MoV
O
Ii M
Ox
639447337 -125-
400 181 19 34 79plusmn18
10
MoV026Te017Nb029O 400 56 79 44 na MoV026Te017Nb029O
Ht 364051 -075 3- 400 49 73 36 na
12
MoV031Oc 300 279 17 05 59plusmn8
MoV029P013Oc 320 272 84 23 47plusmn4
MoV044P005Oc 320 233 36 08 53plusmn11
MoV03Te003Oc H
t M
oVO
Ii
EO
x
6104539 240015-
320 371 21 08 38plusmn8 MoV026Te010Nb022O
c 400 607 582 35 56plusmn3 MoV034O
c Ht
400 23 17 04 na (Mo093V007)5O14
c Sd
364051 4500 24000--
450 21 0 0 125plusmn14
(P)
166
The first and second column contains information concerning the catalyst composition
and preparation method respectively Very different preparation methods (including
slurry- hydrothermal- solid-solid reaction impregnation- and spray drying) were used
On the other hand the extent of characterization reported by the literature sources also
differs very much
For instance the elemental composition reported by Ai refers to preparative composition
[4 5] In contrast to that in the more recent studies a thorough characterization of the
catalysts (including surface and bulk sensitive analytical methods) is documented
Very different reaction conditions were used by the different authors Ai used highly
oxidizing feed (O2C3H8=40) without employing inert gas (balance gas) besides steam
[4 5] A reducing feed was used by Ueda et al Baca et al Guliants et al [7 8 10]
while Celaya Sanfiz et al worked with stoichiometric feed [12] As it is shown in Table
623 in the present work both reducing and stoichiometric feed were used
The conversion selectivity and yield were listed at the given temperature The apparent
activation energy of propane consumption was either taken from the publications or
calculated based on the reported catalytic data in the cited sources
Due to the fact that the reaction conditions used by different groups are different it is
difficult or even impossible to compare directly the catalytic data A general observation
is however that both niobium and tellurium are indispensable elements for a high
performing Mo and V based catalyst
63 Propylene oxidation reactivity on different Mo and V based catalysts
Besides the phase-pure M1 MoVTeNbOx other Mo and V based oxides were tested for
propylene oxidation These catalysts were
bull MoV03Te003Ox (6683)
bull (Mo093V007)5O14 (1862) and
bull (Mo068V023W009)5O14 (1401)
167
The results of the catalytic tests are summarized in the following
Propylene oxidation was performed on MoV03Te003Ox 6683 using the following feed
C3H6O2H2ON2=57545385 vol The catalyst was very active at a temperature
interval between 180 and 250degC conversions between 30 and 80 were measured at a
space velocity of 2400 h-1 (WF=150 gsml) (Table 631) Similarly to the experiments
performed on MoVTeNbOx 6902 (section 425) the production of maleic anhydride
was also observed
Compared to MoVTeOx and MoVTeNbOx catalysts the (Mo093V007)5O14 was found to
be a less active propylene oxidation catalyst In the 300-420degC temperature interval 10-
50 conversion was observed for a space velocity of 5000 h-1 (Figure 631)
When steam was not introduced in the feed the main product was found to be acrolein
Interestingly maleic anhydryde was formed in a quite high amount at a reaction
temperature of 350degC at the expense of acrolein formation In this case the quantitation
of maleic anhydride was possible because in absence of the co-fed steam no hydrolysis
occurred It should be noted however that the peak shape of maleic anhydride was
highly asymmetric but quantifiable Therefore the carbon balance approached
satisfyingly 100 The acrolein selectivity peaked at ca 70 at a reaction temperature of
400degC The acrylic acid selectivity was below 10 while acetic acid and acetone were
produced in traces
In presence of 40 vol steam in the feed the propylene conversion and acrylic acid
selectivity was slightly increased The positive effect of steam on the productivity was in
accordance with the observation of steam effect on propane and propylene oxidation over
the phase pure M1 MoVTeNbOx catalyst (6902)
Similarly to the experiment carried out on catalyst 6902 acetone was the main product
at low temperatures when steam containing feed was applied The acetone selectivity
dropped according to a sigmoidal curve with increasing temperature
The acrolein selectivity increased and reached a plateau at 70 in the temperature
interval between 400 and 420degC The CO and CO2 production was not influenced very
significantly by the presence of steam On the other hand the maleic acid was also
produced but its quantification was not possible because of the problems related to
hydrolysis However because the mass balance was as high as 95 it can be concluded
168
that in presence of steam the maleic acid production was suppressed compared to the
experiment carried out in absence of steam
300 350 400 450
0
20
40
60
80
100
Conversion Selectivity ()
T (degC)
X C3H6 XO2 S AA S CO2 S Ace S Acr S HAc S MAnh S CO C-bal
250 300 350 400 450
0
20
40
60
80
100 X C3H6 X O2 S AA S CO2 S Ace S Acr S HAc S CO C-balC
onversion Selectivity ()
T (degC)
C3H6O2H2ON2=510085 vol
WHSV=5000 h-1 WF=072 gsml
C3H6O2H2ON2=5104045 vol
WHSV=5000 h-1 WF=072 gsml
Figure 631 Propylene oxidation over (Mo093V007)5O14 catalyst (1862)
The reactivity of MoVTeNbOx MoVTeOx and (Mo093V007)5O14 in propylene oxidation
reaction is summarized in the Table 631
The reactivity ranking is the following (Mo093V007)5O14 lt (Mo068V023W009)5O14 lt
MoV03Te003Ox ~MoVTeNbOx
As it can be seen there is a very large difference of about one order of magnitude
between the apparent activation energy of propylene activation on Mo5O14 structures and
phase pure M1 Mo and V based oxide catalysts
The co-fed steam induced a significant decrease of about 50 kJmol in the apparent
activation energy of propylene over the (Mo093V007)5O14 catalyst In presence of steam
the activation energy was similar on (Mo093V007)5O14 and (Mo068V023W009)5O14
catalysts
As it can be seen there is a very large difference of about one order of magnitude
between the apparent activation energy of propylene activation on Mo5O14 structures and
phase pure M1 Mo and V based oxide catalysts
169
Table 631 Propylene oxidation reactivity on different catalysts
Catalyst Feed
GHSV
T
(degC)
XC3H6
()
SAA
()
YAA
()
rC3H6
(micromicromicromicromolgs)
EA
(kJmol)
510085
5000 400 344plusmn03 44plusmn01 15plusmn01 098 140plusmn3
(Mo093V007)5O14
1862 5104045
5000 400 416plusmn03 83plusmn04 35plusmn02 118 93plusmn2
(Mo068V023W009)5O14
1401
510085
5000 400 592plusmn03 83plusmn01 49plusmn01 168 92plusmn2
MoV03Te003Ox
6683
57545385
2400 220 727plusmn03 26plusmn3 19plusmn2 099 22plusmn2
MoVTeNbOx
6902
364051
20000 400 947plusmn02 63plusmn1 60plusmn1 583 15plusmn1
The co-fed steam induced a significant decrease of about 50 kJmol in the apparent
activation energy of propylene over the (Mo093V007)5O14 catalyst In presence of steam
the activation energy was similar on (Mo093V007)5O14 and (Mo068V023W009)5O14
catalysts
Rather low apparent activation energies (22 and 15 kJmol) were found for the
MoV03Te003Ox and the MoVTeNbOx catalysts
64 Exploratory reaction pathway analysis of propane oxidation on phase-pure M1
catalyst
The kinetic modeling of a complex reaction involves two main steps The first step is the
discrimination between possible networks of reaction pathway
The second step constitutes the discrimination between rate expressions and fitting the
kinetic equations to the experimental data [13-15]
The proposed pathways in the literature state that the oxidative dehydrogenation of
propane is the first step The formed propylene may undergo oxidation to acrolein and
then to acrylic acid Parallel to these steps in presence of steam propylene is hydrated to
acetone followed by oxidation to acetic acid [4 5 11 16 17] Some proposed pathways
170
include the oxidation of propane to 1-propanol and 2-propanol in the scheme in
competition with the propane oxidative dehydrogenation step [1 2 16 17] However
these compounds are seldom reported to be detectable reaction products at high
temperature (350-400degC) Additionally the propylene formation is more favored
thermodynamically than the formation of 1-propanol and 2-propanol
The common feature of all the proposed pathways is that the CO and CO2 are shown to
be produced by total oxidation of acrylic acid and acetic acid However the propylene
and other undetectable intermediates (acrolein acetone etc) are reactive compounds
which are prone to undergo total combustion reaction pathways Also in the literature
there is frequently no discrimination between CO and CO2 both oxidation products being
designated as COx In the model proposed by Grisstede the CO CO2 and acetic acid is
merged under the term ldquobyproductsrdquo [18-20]
Due to the above described inconsistencies of the proposed models in this section the
identification of reaction pathways and the kinetic modeling based on the reaction
pathways is presented
Among the numerous methods for reaction pathway discrimination described in the
literature the delplot technique was claimed to be one of the most efficient and reliable
This is because its application is not limited to primary products or by reaction orders
[15] This technique is based on the relationships between the conversion (X) and yield
(Y) respectively The mathematical derivation of the formulas corresponding to the
YXn=f(X) n-th order delplots is presented in detail in the cited source [15]
Historically the plot of product selectivity in function of the conversion is the most
widely applied which is equivalent with a first rank delplot This plot is a measure of
reaction economics because it directly provides information concerning the maximum
productivity In addition to this the discrimination of primary products from non-primary
products is possible based on this plot The extrapolation of the curves corresponding to
the products towards zero conversion gives an intercept with the selectivity axis If the
intercept is a finite number the respective product is a primary or first rank product The
products with a zero intercept are non-primary or higher rank products
To discriminate between secondary tertiary etc rank products higher rank delplots are
used The second rank delplot represents the yield divided by the square of the
171
conversion in function of the conversion (YX2=f(X)) A diverging curve on this plot is
characteristic of a primary product A finite intercept indicates secondary product while
the curves with zero intercept correspond to product rank higher than two
On the third rank delplot the YX3 ratio is represented in function of the conversion (X)
A diverging curve on the third rank delplot indicates product with a ranking order lower
than two A curve with finite intercept corresponds to a third rank product while zero
intercept indicates a product with higher rank This method can be continued until all the
product ranks are sorted out
The delplot technique is applied to catalytic data determined for the propane oxidation
over the phase pure MoVTeNbOx catalyst in order to sort out the reaction product ranks
In the paper published by Bhore et al the YXn ratio is plotted in function of the
conversion where n is the rank of the delplot Because the yield is the product of
conversion and selectivity the SXn-1 quantity is equivalent with the YXn quantity
Therefore here the SXn-1=f(X) plots are considered in the following
Figure 641 displays the delplots corresponding to the experiment carried out at 400degC
using a feed composition of C3H8O2H2ON2=364051 vol
On the first rank delplot the curve corresponding to propylene has a finite intercept which
is close to 90 indicating a first rank product The acrylic acid and carbon monoxide
show an intercept statistically around 3 This may imply that both are second rank
products Carbon dioxide and acetic acid show statistically zero intercept which indicates
that these are higher rank products
On the second rank delplot the propylene curve is diverging which supports that this is a
primary product On the other hand acrylic acid carbon monoxide carbon dioxide and
acetic acid show finite intercept indicating that all these are secondary products
On the third and fourth rank delplots the curves corresponding to propylene and acrylic
acid are diverging Upon magnification it becomes visible that the curves of acetic acid
carbon monoxide and dioxide are diverging as well indicating that their rank is below
three and four Due to the fact that there are no curves with zero intercept on the third and
fourth rank delplots all product ranks are discriminated by the first and second rank
plots
172
0 20 40 60 80 100
0
20
40
60
80
100
AA
CO2
C3H
6
HAc
CO
S ()
X C3H8
()
0 20 40 60 80 100
0
5
10
15
20
25
AA
CO2
C3H
6
HAc
CO
SX
C3H
8
X C3H8
()
1st rank delplot 2nd rank delplot
0 20 40 60 80 100
0
1
2
3
4 AA
CO2
C3H6
HAc
CO
SX2
X C3H8
()
0 20 40 60 80 100
00
02
04
06
08
10 AA
CO2
C3H
6
HAc
COSX3
X C3H8
()
3rd rank delplot 4th rank delplot
Figure 641 Delplots for propane oxidation using the feed C3H8O2H2ON2=364051vol at T=400degC Catalyst ID 6059
In contrast to the reaction pathways proposed in the literature the total oxidation products
are not formed only in the combustion steps of acrylic acid and acetic acid because their
main rank is two However due to the limitation of the delplot technique ndash that it uses
extrapolation of the curves toward zero educt conversion ndash it is not possible to
discriminate whether a product is purely a second rank product or it has a multiple rank
of two and three The third rank delplot diverges in case of a product which has a rank of
two and three suggesting only second rank Consequently this method is not applicable
to discriminate products with superimposed ranks (Appendix 61)
173
For this reason the total oxidation products should not be considered to be only second
rank products as the delplots indicate Due to the fact that acrylic acid as a mainly second
rank product is also prone to combustion the resulting CO and CO2 are third rank
products
Table 641 Product ranks at different temperatures For multiple rank products the main ranks are highlighted by bold letter P-primary S-secondary
Product rank T (degC)
C3H6 AA HAc CO CO2
360 P P S S P S S 380 P P S S P S S 400 P P S S P S S
The product ranks at different temperatures are the same as Table 641 demonstrates
This indicates that the reaction network is the same in the temperature interval between
360 and 400degC
The Figure 642 displays the delplots corresponding to the experiment carried out in
absence of steam in the feed at 400degC
On the first rank delplot the propylene appears to be a first rank product However in
contrast to the experiment carried out in presence of steam the acrylic acid has a
statistically zero intercept indicating a higher rank than one Both the CO and CO2 show
low finite intercepts suggesting that they are minor first rank products The curve
corresponding to acetic acid has a zero intercept
On the second rank delplot the propylene curve is diverging The curves corresponding to
acrylic acid acetic acid CO and CO2 show finite intercepts Therefore all these products
are second rank products
The higher rank delplots are diverging similarly to the experiment carried out in presence
of steam
174
0 20 40 60 80 100
0
20
40
60
80
100
S ()
XC3H8 ()
AA
CO2
C3H
6
HAc
CO
0 20 40 60 80 100
0
2
4
6
8
AA
CO2
C3H
6
HAc
CO
SX
XC3H8 ()
1st rank delplot 2nd rank delplot
0 20 40 60 80 100
00
02
04
06
08
10
AA
CO2
C3H
6
HAc
CO
SX2
X C3H8 ()
0 20 40 60 80 100
000
002
004
006
008
AA
CO2
C3H
6
HAc
CO
SX3
XC3H8 ()
3rd rank delplot 4th rank delplot
Figure 642 Delplots for propane oxidation using the feed C3H8O2H2ON2=36091vol at T=400degC Catalyst ID 6059
The product ranks for the steam content variation experiment are summarized in Table
642 Between 10 and 40 vol steam content the ranks are the same suggesting the
same reaction pathway However in absence of steam the acrylic acid is purely a second
rank product while carbon dioxide has a minor primary rank as well The difference
between the product ranks indicates that the reaction pathways are different in presence
and in absence of steam
175
Table 642 Product ranks at different steam contents For multiple rank products the main ranks are highlighted by bold letter P-primary S-secondary rank
Product rank H2O content
(vol) C3H6 AA HAc CO CO2
0 P S S P S P S 10 P P S S P S S 20 P P S S P S S 30 P P S S P S S 40 P P S S P S S
Taking into account the reaction product ranks the main reaction pathway was found to
be propanerarrpropylenerarracrylic acid Due to the fact that acetic acid is a secondary
product it is formed in a parallel step with respect to acrylic acid Separated CO and CO2
production pathways were included on the main pathways (Figure 4219 and 4220) As
the CO oxidation and water gas shift activity of the catalyst is found to be negligible (see
subchapter 427 and 433) the inclusion of these steps was omitted in the first approach
of kinetic modeling
Alternative reaction models including the following steps
bull coupled production of CO and CO2 from propylene acrylic acid and acetic
acid
bull coupled production of acetic acid and CO
bull coupled production of acetic acid and CO2
bull production of acrylic acid in a single step from propane and in a secondary
step from propylene (cf minor first rank component of acrylic acid in
presence of steam in the feed)
bull simultaneous production of acetic acid from propylene and acrylic acid
followed by combustion to CO
bull simultaneous production of acetic acid from propylene and acrylic acid
followed by slow combustion to CO2
were disregarded because the simulated concentration profiles did not match up with the
experimental profiles
176
The kinetic modeling was performed in Berkeley Madonna software First order rate
equations were set up with respect to each compound The first order kinetics with
respect to propane was experimentally verified (subchapter 423)
For the integration of the differential equations system corresponding to the reaction
models the fourth order Runge-Kutta method numerical method (RK4) was used The
calculated dimensionless concentration profiles of the products and educt were compared
to the experimental dimensionless concentration profiles The dimensionless
concentration of any compound i was calculated as the ratio between the molar
concentration of i species and the initial molar concentration of propane
)146 ( 083
Equationc
cy
HC
i
i =
The best correlation of the simulated concentration profiles with the experimental data
was found to be in the case of the model shown in Figure 643 This is highlighted as
model 1 This model was found to be applicable for the experiments carried out in the
temperature interval between 360 and 400degC and 40 vol steam content and also for the
experiments using 10 20 30 and 40 vol steam in the feed at a reaction temperature of
400degC
Figure 643 Reaction model 1 for propane oxidation
CH2=CH-COOH C3H8 C3H6
CH3COOH+CO2 CO2
CO CO CO
k1 k2
k3
k4
k5
k6
k7
177
The set of differential equations corresponding to model 1 are shown below
)646 (
)546 (
)446 ( )(
)346 ( )(
)246 ( )(
6634
75633
65632
6343283163
838183
2
83
Equationykykdt
dy
Equationykykykdt
dy
Equationykkykdt
dy
Equationykkkykdt
dy
Equationykkdt
dy
AAHC
CO
HCAAHCCO
AAHCAA
HCHC
HC
HC
HC
sdot+sdot=
sdot+sdot+sdot=
sdot+minussdot=
sdot++minussdot=
sdot+=minus
On the other hand for the experiment carried out in dry feed delplot technique indicated
that CO2 is also a minor primary product besides propylene and CO Therefore in the
model valid for the steam free conditions is shown in the Figure 644
Figure 644 The reaction model 2
Including in the reaction model the total oxidation step of propane to carbon dioxide
leads to the following set of differential equations
CH2=CH-COOH C3H8 C3H6
CH3COOH+CO2 CO2
CO CO CO
k1 k3
k4
k5
k5
k6
k2
CO2
k8
178
)1146 (
)1046 (
)946 ( )(
)846 ( )(
)746 ( )(
8386634
75633
65632
6343283163
8387183
2
83
Equationykykykdt
dy
Equationykykykdt
dy
Equationykkykdt
dy
Equationykkkykdt
dy
Equationykkkdt
dy
HCAAHC
CO
HCAAHCCO
AAHCAA
HCHC
HC
HC
HC
sdot+sdot+sdot=
sdot+sdot+sdot=
sdot+minussdot=
sdot++minussdot=
sdot++=minus
The implementation in the Berkeley Madonna software of the differential equations corresponding to Model 1 and Model 2 is shown in Appendix 62
65 Exploratory kinetic modeling on propane oxidation on phase-pure MoVTeNbOx
catalyst
651 The effect of temperature
The kinetic modeling based on reaction model 1 (section 64) lead to the rate constants
which are summarized in the Table 651 The model one contains seven reaction steps as
follows propane is oxidatively dehydrogenated to propylene and oxidized in parallel to
carbon monoxide The formed propylene undergoes oxidation to acrylic acid carbon
monoxide and in a coupled step to acetic acid and carbon dioxide Finally the acrylic
acid undergoes total oxidation as well to carbon monoxide and dioxide
Propane undergoes mainly oxidative dehydrogenation to propylene Oxidation of propane
to carbon monoxide also takes place but the rate constant (k7) of this step is very low in
the order of magnitude of 10-6 mlgs The low rate constant of propane total combustion
is in accordance with the low CO selectivity determined at low propane conversion On
the other hand the low value of the intercept on the first rank delplot also suggests low
total oxidation activity towards carbon monoxide
Propylene is a highly reactive intermediate as demonstrated by the high values of rate
constants of oxidation to acrylic acid (k2) acetic acid and total oxidation products (k3 and
k4) The ratio between the propylene consumption rate constants (k2+k3+k4) and the
179
propylene formation rate constant is 198 210 and 178 respectively at 360 380 and
400degC These are in good accordance with the values reported in the literature
Loacutepez-Nieto et al reported a value of ca 24 on a predominantly M1 phase containing
MoV024Te024Nb013Ox catalyst [21]
Naraschewski et al reported a value of 25 for MoVTeNbOx catalysts with ten different
elemental- and phase compositions However the fitting was made in case of one of the
catalyst the value for each catalyst was not quantified [22]
Grisstede reported a propane consumption rate constant of 084 gsml and a global
consumption rate of propylene of 204 gsml on a MoV033Te025Nb017Ox catalyst at
400degC The ratio of propylene consumption and formation rate constant is therefore
204084=243 [18-20]
Acrylic acid is also prone to further oxidation mainly to carbon dioxide (k6) and in very
minor proportions to carbon monoxide (k5)
It is remarkable that the highest rate constant in the reaction model corresponds to the
selective oxidation step of propylene to acrylic acid
Table 651 The rate constants corresponding to the steps of the reaction model 1
T (degC) k1
(mlgs)
k2
(mlgs)
k3
(mlgs)
k4
(mlgs)
k5
(mlgs)
k6
(mlgs)
k7
(mlgs)
360 0519 7443 2401 0451 501 10-4 0684 597 10-7
380 0650 8806 4211 0642 817 10-4 0912 120 10-6
400 0871 9244 5195 1093 162 10-3 1089 216 10-6
The activation parameters determined from the above data based on the Arrhenius-plot
are shown in Table 422
Table 652 The activation energy and preexponential factor of the individual reaction steps
Reaction step 1 2 3 4 5 6 7
Ea (kJmol) 46plusmn4 19plusmn6 69plusmn17 78plusmn10 104plusmn12 41plusmn5 114plusmn4
lnA 80plusmn08 57plusmn11 139plusmn31 140plusmn19 121plusmn22 75plusmn09 73plusmn07
180
The activation energy of propane to propylene transformation is in good agreement with
the value of 53plusmn8 kJmol (section 424) determined from the temperature dependence of
propane conversion
652 The effect of steam
Reaction kinetic modeling was performed using model 1 for the concentration profiles
determined using steam containing feed Due to the fact that in absence of steam carbon
dioxide was also a primary product an additional total oxidation pathway involving
propane was taken into account (model 2) The reaction steps of the models are
propanerarrpropylenerarracrylic acid as main pathway to which k1 and k2 rate constants are
associated The unselective pathway involving propane is oxidation to CO (in steam
containing feed characterized by the rate constant k7) and CO2 (in dry feed characterized
by rate constant k8) One of the unselective pathways starting from propylene
intermediate gives carbon monoxide (k3) while the other yields acetic acid and carbon
dioxide (k4) The two unselective pathways involving acrylic acid are the total oxidation
to CO (k5) and CO2 (k6) The reaction models are described in more detail in subchapter
429
Table 653 The rate constants of the individual steps as determined based on model 1 and model 2
H2O
content
(vol)
0 10 20 30 40
k1 (mlgs) 0431 0650 0711 0821 0870
k2 (mlgs) 7772 7195 8395 9394 9244
k3 (mlgs) 0736 3896 4595 4395 5194
k4 (mlgs) 0675 1490 1283 1589 1093
k5 (mlgs) 0668 00074 000144 00076 000162
k6 (mlgs) 0538 0935 1037 0962 1089
k7 (mlgs) 00241 849middot10-6 334middot10-6 288middot10-6 316middot10-6
k8 (mlgs) 00057 - - - -
181
The rate constants obtained from the kinetic modeling using reaction model 1 for the
steam containing feed and reaction model 2 for the steam free feed are compiled in Table
653
In accordance with the catalytic data shown on Figure 425 the propane consumption
rate constant (k1) increases when steam is added to the feed and it levels off above the
concentration of 20 vol Addition of steam increases also the rate constant of propylene
selective oxidation to acrylic acid (k2) The same trends were reported by Grisstede [18
19]
In presence of steam the rate constants of acetic acid and total oxidation product
formation from propylene intermediate are also increased dramatically (k3 and k4)
The increasing steam content may promote the propylene hydration to isopropanol [23
26] Further oxidation of isopropanol gives acetone and finally acetic acid and total
oxidation products However neither the isopropanol nor acetone was detected in the
reaction mixture suggesting that these products are further oxidized rapidly without
desorption
In the presence of steam the oxidation of acrylic acid to carbon dioxide is increased
(reaction step 6) however the total oxidation of propane to carbon monoxide- and
dioxide is very significantly suppressed (reaction steps 7 and 8)
Some literature source assigns the positive effect of steam on the catalytic performance to
the better heat transfer properties of the steam containing feed [27] Due to the fact that
the propane oxidation reaction is a rather exothermic reaction the real temperature of the
active site might be higher than the measured (macroscopic) temperature of the catalytic
bed Zheng et al [27) 191-194] speculated that the steam containing feed more efficiently
removes the reaction heat preventing overheating of the active sites and therefore total
combustion is prevented However according to the calculation of Grisstede the
maximum temperature increase above the setpoint temperature due to reaction heat is 2degC
[19]
The heat capacity and heat conductivity of the feed indeed decreases linearly with the
decreasing steam content (Appendix 63) Nevertheless the propane conversion and
acrylic acid selectivity is not influenced significantly in the 20-40 vol steam content
182
interval while both catalytic properties are decreasing below 20 vol steam
concentration If in absence of steam the reaction heat would not be removed efficiently
and the catalyst surface would be overheated the propane conversion would not drop
(Figure 423) but it would increase below 20 vol steam content (Appendix 63)
Therefore it can be excluded that the only effect of steam is that to improve the thermal
properties of the feed with respect to heat transfer
References Chapter 6
1 M M Lin Appl Catal A 207 (2001) 1-16 2 E K Novakova J C Vedrine Propane selective oxidation to propene and
oxygenates on metal oxides in Metal Oxides - Chemistry and applications JGL Fierro (Ed) 2006 CRC Press pp 414-461
3 A Trunschke Propane selective oxidation to acrylic acid in Nanostructured Catalysts Selective oxidation reactions Ch Hess R Schloumlgl (Eds) RCS Cambridge in press
4 M Ai Catal Today 13 (1992) 679-684 5 M Ai J Catal 101 (1986) 389-395 6 T Katou D Vitry W Ueda Catal Today 91-92 (2004) 237-240 7 W Ueda D Vitry T Katou Catal Today 96 (2004) 235-240 8 D Vitry Y Morikawa J L Dubois W Ueda Appl Catal A 251 (2003) 411-
424 9 R K Grasselli Top Catal 15 (2001) 5 10 V V Guliants R B Bhandari B Swaminathan V K Vasudevan H H
Brongersma A Knoester A M Gaffney S Han J Phys Chem B 109 (2005) 24046-24055
11 M Baca A Pigamo J L Dubois J M M Millet Top Catal 23 (2003) 39-46 12 A Celaya Sanfiz T W Hansen D Teschner P Schnoumlrch F Girgsdies A
Trunschke R Schloumlgl M H Looi S B A Hamid J Phys Chem C 114 (2010) 1912-1921
13 J R Kittrell Adv in Chem Eng 8 (1970) 97-183 14 P G Ashmore A Jones Reaction Kinetics RSC Specialist Periodical Reports 1
(1975) 291-308 15 N A Bhore M T Klein K B Bishoff Ind Eng Chem Res 29 (1990) 313-
316 16 M Lin T B Desai F W Kaiser P D Klugherz Catal Today 61 (2000) 223-
229 17 R Fushimi S O Shekhtman A Gaffney S Han G Yablonsky J T Gleaves
Ind Eng Chem Res 44 (2005) 6310-6319 18 E Balcells F Borgmeier I Grisstede H-G Lintz Catal Lett 87 (2003) 195 19 I Grisstede Die Partielle Oxidation von Propan zu Acrylsaumlure Bestimmung der
Reaktionskinetik und in-situ characterisierung des Katalysators unter
183
Betriebsbedingungen Dissertation Universitaumlt Karlsruhe 2004 Universitaumltsverlag Karlsruhe ISBN 3-937300-17-1
20 E Balcells F Borgmeier I Grisstede H-G Lintz F Rosowski Appl Catal A General 266 (2004) 211
21 J M Loacutepez-Nieto B Solsona P Concepcioacuten F Ivars A Dejoz M I Vaacutezquez Catal Today 157 (2010) 291-296
22 F N Naraschewski C P Kumar A Jentys J A Lercher Appl Catal A General 391 1-2 (2011) 63-69
23 Y Moro-oka Appl Catal A General 181 (1999) 323-329 24 L Luo PhD thesis California Institute of Technology Pasadena California 2001 25 J C Veacutedrine E K Novakova E G Derouane Catal Today 81 (2003) 26 247-262 H-G Lintz S P Muumlller Applied Catal A General 357 (2009) 178-
183 27 W Zheng Zh Yu P Zhang Y Zhang H Fu X Zhang Q Sun X Hu J
Natural Gas Chemistry 17 (2008) 191-194
184
General Conclusions and Outlook
The present work was centered on the systematic kinetic study of the selective oxidation
of propane to acrylic acid using a well defined mixed oxide catalyst
A well characterized phase-pure M1 MoVTeNbOx catalyst was used for the studies
which was synthesized reproducibly on the multi-gram scale
The objectives were to
bull Study the bulk structural stability of the catalyst under the reaction conditions
whereby the kinetic experiments are carried out
bull Study the effect of the reaction variables (temperature steam content redox
potential) on the catalytic performance and the kinetics of the propane selective
oxidation reaction
bull Study the catalytic oxidation propylene acrolein and carbon monoxide under
identical conditions corresponding to the propane oxidation in order to determine
the relative reactivity and product distributions
bull Study the effect of stage-wise addition of oxidizing gases (oxygen nitrous oxide)
in order to verify whether the multi-tubular reactor arrangement is suitable to
increase the catalytic performance compared to the conventional single-tube fixed
bed reactor
bull Study the addition of propylene carbon monoxide and carbon dioxide in order to
gain more information about the reaction pathways and identify whether these
compounds adsorb competitively on the active sites of the catalyst with propane
or other intermediates
bull Study the effect of post synthesis treatment employing different solutions (neutral
acidic basic complexing oxidizing and reducing) on the bulk structure
surfacebulk composition and catalytic performance of the phase-pure M1
MoVTeNbOx catalyst
The knowledge of the stability is an absolute criterion for the proper catalytic kinetic and
structure-relationship studies and mechanistic understanding of the reaction The
structural stability was addressed in a long term in-situ XRD experiment The feed
185
composition was varied in such a way that the conditions covered all the relevant ones for
catalytic and kinetic experiments (ie steam containing and steam free mixture net
oxidizing stoichiometric and net reducing) The phase purity of the used catalyst is not
affected under any of the conditions The Rietveld refinement revealed that the lattice
constants are not affected by the reaction conditions ranging from net oxidizing to net
reducing feed irrespective of the steam content When the catalyst was exposed to
strongly reducing conditions (3 vol propane in nitrogen) for long time (24 hours) the
lattice constants changed but no new phase could be detected The STEM analysis of the
sample after in-situ reaction showed pitting-like holes on the particles The voids and
their sizes were statistically distributed which suggests that the recrystallization which
occurred upon exposing the catalyst to extreme reducing conditions was controlled by
diffusion as no reaction front could be observed The EDX analysis performed
complementary to the STEM imaging revealed tellurium and oxygen depletion The
results show that the catalyst bulk structure is stable and homogeneous under reaction
conditions unless it is exposed to extremely strong reducing conditions for long time
Therefore the reactivity is detemined by the surface properties The exceptional bulk
structural stability permitted the kinetic study of the reaction variables
The effect of reaction variables was studied in a conventional fixed bed reactor The
detectable products were propylene acrylic acid acetic acid CO and CO2 The
temperature was varied between 360 and 400degC in 20degC steps The highest acrylic acid
productivity was observed at 400degC The steam content was varied between 40 and 0
vol in 10 vol steps A decrease of the propane conversion and acrylic acid selectivity
was observed below 20 vol steam content Stable operation (ie no deactivation) was
observed in steam free feed Upon reintroducing the steam in the feed the same catalytic
performance was attained as before exposing the catalyst to dry feed This shows that the
change of the catalytic performance with the steam content is fully reversible
The redox potential variation covered reducing stoichiometric and oxidizing conditions
(up to 5-fold oxygen excess) Under oxidizing conditions the same conversion and
selectivity was observed as in stoichiometric feed while under reducing condition the
conversion and selectivity to acrylic acid was slightly lower Cycling experiments
186
showed reversibility of the catalytic performance upon exposing the catalyst to net
reducing conditions However the stady state was restored slower (ca 8 hours time on
stream) compared to the the steam content variation variation experiment whereby the
steady state operation was achieved within minutes
The catalytic oxidation of other substrates (propylene acrolein and CO) was performed
in order to gain more insight into reactivity of these intermediates and the reaction
pathways they might be involved in
The propylene was found to be ca 7 times more reactive than propane at 400degC and it
produced mainly acrylic acid It was notable that acetone was also produced in significant
amounts while this compound was not detected at all under propane oxidation
conditions even though propylene is a reaction intermediate
The acrolein was found to be 94 times more reactive compared to propane at 400degC The
reaction products were acrylic acid (with a yield up to 89) acetic acid and carbon
oxides
The CO oxidation performed under stoichiometric and oxidizing conditions in dry and
steam-containing feed revealed a very low activity the highest conversion being below
1 at a space velocity of 3000h-1 at 400degC Additionally the water gas shift activity was
found to be even lower compared to the CO oxidation activity The CO oxidation and
water gas shift activity was 80 to 100 times lower compared to the propane oxidation
activity These results suggested that under propane oxidation conditions (400degC GHSV
between 4500 and 66000 h-1) the formed CO2 is not formed via CO oxidation or water
gas shift reaction Given this fact the formation of CO and CO2 during the propane
oxidation reaction occurs in two different pathways that are independent on each other
which may suggest the existence of two different active sites whereby combustion
pathways occur Based on this finding the reaction networks proposed in the literature
according to which the total oxidation products are merged together as COX=CO+CO2
may be improved Furthermore the CO oxidation activity may be used as a proxy for the
abundance of the electrophilic oxygen species on the surface The low CO oxidation
activity suggested low abundance of electrophilic oxygen which activates electron rich
centers (such as C=C bond) of the molecule and lead to unselective pathways in
nucleophilic oxidation reactions such as propane oxidation to acrylic acid
187
The stage-wise addition of oxygen lead to an improvement of the acrylic acid yield by
5 when compared to the catalytic data obtained in the conventional single-tube reactor
Upon dosing O2 in the first reactor tube and N2O in the second reactor tube of the two-
stage setup it was observed that N2O is not consumed at all even if the conditions were
chosen in such a way that the oxygen was consumed completely This suggests that the
phase-pure M1 MoVTeNbOx is not reoxidized by N2O
Upon addition of propylene in the second reactor tube revealed a slight competition of
propane and propylene on the active sites or for the available oxygen active species all
the added propylene was oxidized to acrylic acid acetic acid CO and CO2 It is notable
that in contrast to the propylene oxidation experiments no acetone formation was
observed
Neither the CO nor the CO2 influenced the product distribution of propane oxidation
reaction This suggested that none of these gases were competitively adsorbed on the
active sites with the educt or intermediates The added CO was not oxidized to CO2
which confirmed the negligible activity observed for the separate CO oxidation
experiments
In a series of experiments carried out separately from the above described ones the
phase-pure M1 MoVTeNbOx was subjected to treatment with solutions os different
nature (neutral acidic basic complexing oxidizing and reducing) at room temperature
The bulk structure was not affected by any of these treatments as probed by the XRD
measurement The bulk composition varied only marginally as probed by EDX while
the morphology and the surface composition changed more significantly upon the
chemical treatment The samples treated by neutral acidic basic complexing and
reducing solutions exhibited similar catalytic properties in propane and propylene
oxidation with the original untreated sample However the treatment by an oxidizing
solution led to a dramatic decrease in the activity and the selectivity to acrylic acid in the
propane oxidation reaction
188
The findings of the above summarized experiments on the well defined structurally
exceptionally stable catalyst suggest that the catalyst surface responds dynamically to the
changes in the chemical potential of the feed mixture under real reaction conditions The
dynamics is reflected in the changes of the reactivity This study may contribute to the
better understanding of the kinetics and the mechanism of the propane selective oxidation
reaction
189
Appendices
Appendix 51 Reaction networks of propane oxidation over the modified catalysts
To find out the reaction pathways on modified catalysts the delplot technique was applied as it was described in the section 64 The delplots corresponding to the catalytic measurements with H2O- NaBrO3 and N2H4- treated samples are presented below The H2O-treated sample behaves similarly to the parent sample As it is shown on the Figure A511 the first rank delplot gives a fairly high intercept for propylene and acrylic acid (35 and 65 respectively) indicating that these are primary products Since the extrapolation is made over a large interval of conversion the rank of acrylic acid is uncertain
First rank delplot Second rank delplot
0 10 20 30 40 50 60 70 80 90 1000
20
40
60
80
100
S ()
X C3H8 ()
AA CO2 C3H6 HAc CO
0 10 20 30 40 50 60 70 80 90 100
00
05
10
15
20
25
30 AA CO2 C3H6 HAc CO
SX
XC3H8 ()
Third rank delplot Fourth rank delplot
0 10 20 30 40 50 60 70 80 90 100
000
002
004
006
008
010
012
SX2
X C3H8 ()
AA CO2 C3H6 HAc CO
0 10 20 30 40 50 60 70 80 90 100
0000
0001
0002
0003
0004
0005
0006
SX3
X C3H8 ()
AA CO2 C3H6 HAc CO
Figure A511 The delplots corresponding to the propane oxidation using the H2O modified sample
(7797) Feed composition C3H8O2H2ON2=364051 vol T=400degC Extrapolation over the differential operation is suggested Usually the conversion-selectivity curve corresponding to acrylic acid goes through a maximum The increasing
190
segment of such a curve lies in the low conversion interval The intercepts corresponding to other products (CO CO2 and acetic acid) are low statistically close to zero on the first rank delplot suggesting that these are not primary products On the second rank delplot the curves of propylene and acrylic acid are diverging which indicate that the rank of these are primary products The divergent curves on the third and fourth rank delplots indicate that all the product ranks are less than three and four The total oxidation products and acetic acid have a finite intercept suggesting that these are secondary products The bromate treated sample (7800) was less active than the other samples at any space velocity The lowest conversions were in the differential operation mode On the first rank delplot finite intercepts were observed for propylene acrylic acid CO and CO2 indicating that all of these are first rank products On the second rank delplot the propylene and acrylic acid curves are diverging strongly (Figure A512)
First rank delplot Second rank delplot
0 10 20 30 40 500
20
40
60
80
100 AA CO
2
C3H
6
HAc CO
S ()
XC3H8 ()
0 10 20 30 40 50
0
10
20
30
40
50 AA CO2 C3H6 HAc CO
SX
XC3H8 ()
Third rank delplot Fourth rank delplot
0 10 20 30 40 50
0
3
6
9
12
15
SX2
X C3H8 ()
AA CO2 C3H6 HAc CO
0 10 20 30 40 50
0
2
4
6
8
10
SX3
X C3H8 ()
AA CO2 C3H6 HAc CO
Figure A512 The delplots corresponding to the propane oxidation using the NaBrO3 modified sample
(7800) Feed composition C3H8O2H2ON2=364051 vol T=400degC
191
The slight divergence of CO and CO2 indicate that these products are mainly first rank products but a small second rank component can not be excluded The acetic acid is a second rank product Similarly to the previous cases the higher rank delplots lead to diverging curves for all the products
First rank delplot Second rank delplot
0 20 40 60 80 1000
20
40
60
80
100 AA CO2 C3H6 HAc CO
S ()
XC3H8 ()
0 20 40 60 80 1000
1
2
3
4
5 AA CO2 C3H6 HAc CO
SX
XC3H8 ()
Third rank delplot Fourth rank delplot
0 20 40 60 80 100
00
01
02
03
04
SX2
X C3H8 ()
AA CO2 C3H6 HAc CO
0 20 40 60 80 100
0000
0005
0010
0015
0020
0025
SX3
X C3H8 ()
AA CO2 C3H6 HAc CO
Figure A513 The delplots corresponding to the propane oxidation using the hydrazine modified sample
(8113) Feed composition C3H8O2H2ON2=364051 vol T=400degC Differences were noted also in the catalytic properties of the hydrazine treated sample (8113) compared to the parent and other modified catalysts The activity differences were significant only at low conversions close to the differential operation mode Nevertheless the product distribution also differs from all the other catalysts In case of the parent sample and all the other modified the selectivity of CO and CO2 was higher than one except the measurement at the lowest space velocity of 3000 h-1 whereby
192
almost complete oxygen conversion (95) was attained Compared to these catalysts on the hydrazine treated sample the ratio between the CO and CO2 selectivity is inverted at any conversion On the first rank delplot corresponding to catalyst 8113 every compound had a nonzero positive intercept indicating that all are first rank products (Figure A513) The strongly diverging curves on the second third and fourth rank delplot confirmed that every product is mainly a primary product The product ranks corresponding to every catalyst mentioned in this chapter are summarized in Table A511 It can be observed that propylene is a primary product on all the catalysts Acrylic acid showed a primary and secondary component in case of the parent sample and the tetramethylethylenediamine treated sample while for the rest of the samples it was a primary product A mixed rank for CO and CO2 was found except for the water treated sample (7797) where these were only secondary products while on the hydrazine treated sample (8113) only primary products The acetic acid was mainly a secondary product except for the 7797 where a primary rank could not be excluded and for 8113 where first rank was observed Table A511 Product ranks on the different catalysts P-primary S-secondary Catalyst 6902 7797 7798 7799 7800 8113
C3H6 rank P P P P P P AA rank P S P P P S P P CO rank P S S P S P S P S P CO2 rank P S S S P S P S P HAc rank S P S S S S P
Certainly the CO and CO2 are multiple rank products and according to the rationale described in the section 427 and Appendix 52 the tertiary rank can not be excluded However in Table A511 only those ranks were listed which resulted from the delplots Upon summarizing the results of catalytic experiments on propane oxidation over the modified samples the most striking differences were noted The bromate treated sample (7800) shows the
bull lowest activity and selectivity in propane oxidation bull highest apparent activation energy bull mainly primary rank toward acrylic acid
The hydrazine treated sample (8113) is unique among the studied catalysts with respect to the followings
bull the ratio of COCO2 selectivity was below one for all the conditions bull all products were found to be mainly primary products
193
Appendix 61 Modeling the delplots for a reaction pathway that contains multiple
rank product
The applicability of the delplot technique introduced by Bhore et al was demonstrated on a reaction pathway consisting of one intermediate and two end products This technique is easily applicable for discernment of product ranks for a network of serial and parallel steps such as isomerisation reactions However in the case of oxidation reactions such as propane oxidation the educt the intermediate (propylene acrolein) and the product (acrylic acid) may undergo total oxidation pathways as well leading to CO and CO2 (cf section 64 and Appendix 51) In most of the proposed networks in the literature the total oxidation products appear only as end products from oxidation of acrylic acid and acetic acid respectively If this would be true the CO and CO2 rank would be quaternary As it was demonstrated by the delplots (subchapter 429) the curves corresponding to CO and CO2 on the third and fourth rank delplot are diverging which indicate that the rank of products are less than three and four It was found that these products are mainly secondary products and sometimes they appear also as minor products depending on the reaction conditions and the catalyst To tackle the above noted apparent inconsistency the delplot technique was applied to a reaction network that contains products with superposed or multiple ranks (primary secondary and tertiary) The simplest model for such a network consists of two parallel steps involving the reactant A (Figure A611) In one of the steps A is converted to intermediate B which undergoes a transformation to C In parallel to this sequence A is transformed directly to the C species
Figure A611 Reaction network containing a superposed primary and secondary rank end product
Therefore the C species is secondary product in the upper pathway and a primary product in the lower pathway This simple model resembles the oxidative dehydrogenation reactions with the simplification that only one total oxidation product is taken into account (CO or CO2) The simplification was made only for the purpose of easier mathematical handling of the kinetic modelThe differential equations corresponding to this model are the following
A B C
A C
k1 k2
k3
194
)316 (
)216 (
)116 ( )(
32
21
31
AEquationykykdt
dy
AEquationykykdt
dy
AEquationykkdt
dy
AB
C
BAB
AA
+=
minus=
+=minus
This set of differential equations is analytically solvable but because of the fact that the integrated rate equations are rather complicated they are not shown here Moreover the analytical equation for the calculation of the intercept is even more complicated the limit of the function can be obtained only by applying the lrsquoHospitalrsquos rule Therefore the set of differential equations was solved numerically in the Berkeley Madonna software using time steps of 002 s
0 20 40 60 80 1000
20
40
60
80
100
k3=02 gsml
k3=05 gsml
k3=10 gsml
k3=60 gsml
SB ()
X A ()
k1=10 gsml
k2=50 gsml
0 20 40 60 80 1000
20
40
60
80
100
k1=10 gsml
k2=50 gsml
k3=02 gsml
k3=05 gsml
k3=10 gsml
k3=60 gsml
SC ()
X A ()
First rank delplot species B First rank delplot species C
0 20 40 60 80 100
0
10
20
30
40
50
k1=10 gsml
k2=50 gsml
k3=02 gsml
k3=05 gsml
k3=10 gsml
k3=60 gsml
SBXA
X A ()
0 20 40 60 80 1000
1
2
3
4
5
6
k1=10 gsml
k2=50 gsml
k3=02 gsml
k3=05 gsml
k3=10 gsml
k3=60 gsml
SCXA
X A ()
Second rank delplot species B Second rank delplot species C
Figure A612 The delplot for B and C species corresponding to the reaction pathway depicted on Figure A611
The k1 rate constant was fixed to 10 gsml while k2 to 50 gsml Four different values were tried for k3 as follows 02 05 10 and 60 respectively The conversion and selectivities were calculated from the concentrations obtained from the numerical
195
solution of the differential equations Then the first and second rank delplots were constructed for the B and C species (Figure A612) The finite intercept on the first rank delplot corresponding to B species indicated first rank product On the other hand the first rank delplot corresponding to C shows an intercept close to zero at low values of k3 (02 and 05) while in the case of higher k3 values the intercept is above zero (around 2) This suggests that at higher k3 the C species is clearly a first rank product The divergent curves corresponding to the B species on the second rank delplot indicated that B is a primary product However the curves corresponding to the C species are diverging in the second rank delplot A slight divergence can be observed for low k3 values (02 and 05) while the divergence at high rate constants (10 and 60) is very pronounced Therefore based on exclusively the delplots one would erroneously conclude that the B and C species are primary products
A more complicated reaction network is depicted on Figure A613 This consists of two parallel pathways involving the reactant A producing the B and D species The B intermediate species is also involved in two parallel steps In one of them it is transformed to C while the other represents transformation to the D product Finally the C is transformed to D product Therefore according to the scheme B is a primary product C is a secondary product while the D is a primary secondary and a tertiary product as well This resembles to a simplified network for the oxidation of propane to acrylic acid The B stands for propylene the C is acrylic acid while D represents one of the total oxidation products (CO or CO2) The simplification consists of neglecting the pathway leading to acetic acid and considering of only one total oxidation product
Figure A613 Reaction network containing a superposed primary secondary and tertiary end product
The differential equations corresponding to this reaction network is shown below This set of differential equations was solved using the Berkeley Madonna software Since the case of simultaneous formation of a primary and secondary product with different rate constant of the second rank product formation was discussed on the Figure A612 in the present case the rate constant of the tertiary product formation (k5) was varied between 005 and 300 gsml while all the other rate constants were kept constant (k1=100 gsml k2=500 gsml k3=005 gsml k4=005 gsml)
A B C k1 k2
k3
D
k4 k5
196
)716 (
)616 (
)516 ( )(
)416 ( )(
543
52
422
31
AEquationykykykdt
dy
AEquationykykdt
dy
AEquationykkykdt
dy
AEquationykkdt
dy
CBAD
CB
C
BAB
AA
++=
minus=
+minus=
+=minus
Because the B was only a primary product the delplots corresponding to this species are not shown Only the delplots corresponding to the C and D products are analyzed in the following The first rank delplot corresponding to C and D exhibits a low but nonzero intercept (2 and 4 respectively) This suggests that both are primary products The D is indeed a primary product on the reaction scheme however the C is a secondary product The inconsistency in the rank of C determined from the delplot is due to systematic error introduced by extrapolation On the other hand the second rank delplot corresponding to C confirms that this species is a secondary product independently on the value of the k5 rate constant The third rank delplot showed that indeed the C has a lower rank than three The highly divergent curves corresponding D species on the second rank delplot suggests that this is only a primary product in contrast to the reaction scheme Finally the third rank delplot for the D species are strongly diverging indicating lower ranks than three However according to the reaction scheme D is a tertiary product as we ll As demonstrated by the above two simulated cases when a reaction network contains a product that is formed in two or more steps (multiple rank product) the delplot technique is not always suitable to find out the ranks Usually the lowest rank can be identified but the higher ranks are not identifiable due to diverging curves (these ranks being ldquomaskedrdquo by the lowest rank) The curvature strongly depends on the rate constants of the individual reaction steps Therefore in real applications a great care should be taken when discriminating the pathways leading to potentially multiple rank products such as CO and CO2 in oxidation catalysis For the identification of the pathways the ldquochemical knowledgerdquo arising from reactivity studies involving the reaction intermediates should also be taken into account besides the mathematics of the delplot technique
197
0 20 40 60 80 1000
20
40
60
80
100 k
5=005 gsml
k5=020 gsml
k5=100 gsml
k5=300 gsml
SC ()
X A ()
0 20 40 60 80 1000
20
40
60
80
100 k
5=005 gsml
k5=020 gsml
k5=100 gsm
k5=300 gsml
S D ()
X A ()
First rank delplot species C First rank delplot species D
0 20 40 60 80 10000
05
10
15
20
25
30
k5=005 gsml
k5=020 gsml
k5=100 gsm
k5=300 gsml
SCXA
X A ()
0 20 40 60 80 10000
05
10
15
20
25
30 k
5=005 gsml
k5=020 gsml
k5=100 gsm
k5=300 gsml
SDXA
X A ()
Second rank delplot species C Second rank delplot species D
0 20 40 60 80 100
00
01
02
03
04
05
06 k5=005 gsml
k5=020 gsml
k5=100 gsm
k5=300 gsml
SCXA2
X A ()
0 20 40 60 80 100
00
01
02
03
04
05
06 k
5=005 gsml
k5=020 gsml
k5=100 gsm
k5=300 gsml
SDXA2
X A ()
Third rank delplot species C Third rank delplot species D
Figure A614 The delplots for C and D species corresponding to the parallel-consecutive reaction network depicted on Figure A613
198
Appendix 62 The kinetic models implemented in the Berkeley Madonna software
Program for implementing Model 1 in Berkeley Madonna Rxn1a1=k1yC3H8 k1=12 rxn1a2=k2yC3H6 k2=12 rxn1a3=k3yC3H6 k3=1 rxn1a4=k4yC3H6 k4=1 rxn1a5=k5yAA k5=1 rxn1a6=k6yAA k6=1 rxn1a7=k7yC3H8 k7=1 INIT yC3H8=1 INIT yC3H6=0 INIT yAA=0 INIT yHAc=0 INIT yCO=0 INIT yCO2=0 ddt(yC3H8)=-rxn1a1-rxn1a7 ddt(yC3H6)=rxn1a1-(rxn1a2+rxn1a3+rxn1a4) ddt(yAA)=rxn1a2-(rxn1a5+rxn1a6) ddt(yHAc)=rxn1a4 ddt(yCO)=rxn1a3+rxn1a5+rxn1a7 ddt(yCO2)=rxn1a4+rxn1a6 METHOD RK4 STARTTIME = 0 STOPTIME=2 DT = 002
Program for implementing Model 2 in Berkeley Madonna rxn2a1=k1yC3H8 k1=12 rxn2a2=k2yC3H6 k2=12 rxn2a3=k3yC3H6 k3=1 rxn2a4=k4yC3H6 k4=1 rxn2a5=k5yAA k5=1 rxn2a6=k6yAA k6=1 rxn2a7=k7yC3H8 k7=1 rxn2a8=k8yC3H8 k8=1 INIT yC3H8=1 INIT yC3H6=0
199
INIT yAA=0 INIT yHAc=0 INIT yCO=0 INIT yCO2=0 ddt(yC3H8)=-rxn2a1-rxn2a7-rxn2a8 ddt(yC3H6)=rxn2a1-(rxn2a2+rxn2a3+rxn2a4) ddt(yAA)=rxn2a2-(rxn2a5+rxn2a6) ddt(yHAc)=rxn2a4 ddt(yCO)=rxn2a3+rxn2a5+rxn2a7 ddt(yCO2)=rxn2a4+rxn2a6+rxn2a8 METHOD RK4 STARTTIME = 0 STOPTIME=2 DT = 002
Appendix 63 The physical properties of the gas mixtures with different steam
contents
The selected physical properties (such as density heat capacity heat conductivity and kinematic viscosity) of mixtures containing C3H8 H2O O2 and N2 are shown in the Table A631 The mixtures correspond to the feed compositions used for the steam content variation presented in section 422 The physical properties were calculated at a temperature of 400degC using the Fluidatreg on the Net on-line calculator (wwwfluidatcom) provided by Bronkhorst For the estimation of the eventual hot-spot formation on the catalyst surface all the above mentioned physical properties are needed Semi-quantitatively the data may be interpreted as follows if in absence of steam hot-spot formation would occur the propane conversion would increase and the selectivity would decrease Since in absence of steam the conversion decreases (Figure A 631) the hot-spot formation is not likely to occur Therefore isothermal operation mode may be assumed Table A631 Physical properties of different feed mixtures Mixture 1 C3H8O2H2ON2=364051 vol Mixture 2 C3H8O2H2ON2=363061 vol Mixture 3 C3H8O2H2ON2=362071 vol Mixture 4 C3H8O2H2ON2=361081 vol Mixture 5 C3H8O2H2ON2=36091 vol
Property Mixture
1
Mixture
2
Mixture
3
Mixture
4
Mixture
5
Density (kgm3) 044 046 048 049 051 Heat capacity
(kJkgmiddotK) 1482 1399 1322 1250 1184
Heat conductivity102 (WmK)
634 610 582 551 527
Kinematic viscositymiddot105 (m2s)
654 640 624 609 604
200
0 10 20 30 40000
004
008
1200
1400
1600
0
20
40
60
80
100 HeatCapacity (kJkgK)
HeatConductivity (WmK)
Therm
al property
H2O content (vol)
Conversion Selectivity ()
X C3H8
S AA
Figure A 631 Plot of thermal properties of the feed mixture and the catalytic properties in function of the
steam content
201
Acknowledgements for permission to reprint published materials
1 Robert K Grasselli J D Burrington D J Buttrey P DeSanto C G Lungmair A F Volpe Jr T Weignand Multifunctionality of Active Centers in (Amm)oxidation Catalysts From BindashMondashOx to MondashVndashNbndash(Te Sb)ndashOx Topics in Catalysis 23 (2003) 5 with permission from Springer
2 MM Bettahar G Costentin L Savary JC Lavalley On the partial oxidation of propane and propylene on mixed metal oxide catalysts Applied Catalysis A General 145 (1996) 1-48 with permission from Elsevier
3 Gang Fu X Xu X Lu H Wan Mechanisms of Initial Propane Activation on Molybdenum Oxides A Density Functional Theory Study Journal of Physical Chemistry B 109 2005 6416-6421 with permission from the American Chemical Society
4 Manhua Lin Tejal B Desai Frederick W Kaiser Peter D Klugherz Reaction pathways in the selective oxidation of propane over a mixed metal oxide catalyst Catalysis Today 61 (2000) 223-229 with permission from Elsevier
5 R Fushimi S O Shekhtman A Gaffney S Han G S Yablonsky J T Gleaves Industrial amp Engineering Chemistry Research 44 (2005) 6310-6319 with permission from the American Chemical Society
6 P Botella J M Loacutepez Nieto B Solsona A Mifsud F Maacuterquez The Preparation Characterization and Catalytic Behavior of MoVTeNbO Catalysts Prepared by Hydrothermal Synthesis Journal of Catalysis 209 (2002) 445-455 with permission from Elsevier
7 C Hamel Aacute Toacuteta F Klose E Tsotsas A Seidel-Morgenstern Analysis of single and multi-stage membrane reactors for the oxidation of short-chain alkanesmdashSimulation study and pilot scale experiments Chemical Engineering Research and Design 86 (2008) 753-764 with permission from Elsevier
202
List of abbreviations
AA ndash acrylic acid
Ace ndash acetone
Acr ndash acrolein
AHM ndash ammonium heptamolybdate
at - atomic percentage
BESSY ndash Berliner Elektronenspeicherring-Gesellschaft fuumlr Synchrotronstrahlung
BET ndash Brunauer Emmett Teller method
C-bal ndash carbon balance
CSTR ndash continuous-flow stirred tank reactor
DFT ndash density functional theory
dpmax ndash the maximum particle diameter of the sieve fraction
dpmin ndash the minimum particle diameter of the sieve fraction
dr ndash the inner diameter of the reactor tube
Ea Eaapp ndash apparent activation energy
EDX ndash energy dispersive X-ray analysis
ESR ndash electron spin resonance
FBR ndash fixed bed reactor
FTIR ndash Fourier transform infrared spectroscopy
GC-MS ndash gas chromatograph coupled to mass spectrometer
GHSV ndash gas hourly space velocity
HAc ndash acetic acid
HPC ndash heteropoly-compounds
k ndash rate constant
LEIS ndash low energy ion scattering
MAnh ndash malonic anhydride
MFC ndash mass flow controller
MMO ndash multi-metal oxide
MSD ndash mass spectrometric detector
ODH ndash oxidative dehydrogenation
203
P ndash primary product
PFR ndash plug-flow reactor
PI ndash pressure indicator
r ndash reaction rate
R1 R2 ndash reactor tubes of the two-stage reactor
S ndash secondary product
SEM ndash scanning electron microscopy
Si ndash selectivity to the product appearing in the index
STEM ndash scanning transmission electronmicroscopy
STR ndash single-tube reactor
TCD ndash temperature conductivity detector
TIC ndash temperature indicator and controller
TMEDA ndash tetramethylethylenediamine
TSR ndash two-stage reactor
UV-Vis ndash ultraviolet-visible spectroscopy
VPO ndash vanadium-phosphorous oxides
WF ndash weight per flow contact time
WGS ndash water gas shift reaction
WHSV ndash weight hourly space velocity
XAS ndash X-ray absorption spectroscopy
Xi ndash conversion of the species in the index
XPS ndash X-ray photoelectron spectroscopy
XRD ndash X-ray diffraction
Yi ndash yield of the species in the index
yi ndash dimensionless concentration
∆H ndash enthalpy change
∆H ndash activation enthalpy
∆S ndash entropy change
∆S ndash activation entropy
204
List of figures
Chapter 1 Introduction and motivation Figure 121 Propylene oxidation and ammoxidation mechanism over bismuth molybdate catalysts as proposed by Grasselli et al [9]helliphelliphelliphelliphelliphelliphelliphelliphelliphelliphelliphelliphelliphelliphelliphelliphelliphelliphelliphelliphelliphelliphelliphelliphelliphelliphelliphelliphelliphellip4 Figure 122 Mechanism of propylene oxidation by consecutive acid-base and redox steps as proposed by Bettahar et al [12]helliphelliphelliphelliphelliphelliphelliphelliphelliphelliphelliphelliphelliphelliphelliphelliphelliphelliphelliphelliphelliphelliphelliphelliphelliphelliphelliphelliphelliphelliphelliphelliphelliphelliphellip5 Figure 123 Some examples of the possible transitional states of hydrogen atom abstraction according to[18] The numbers on the figures correspond to the calculated bond lengthshelliphelliphelliphelliphelliphelliphelliphelliphelliphelliphellip11 Figure 124 Reaction network of propane oxidation according to Bettahar et al [12]helliphelliphelliphelliphelliphelliphellip14 Figure 125 The relative oxidative stability of several intermediates at different temperatures [22]helliphellip15 Figure 126 Oxidation pathways of propane according to [22]helliphelliphelliphelliphelliphelliphelliphelliphelliphelliphelliphelliphelliphelliphelliphellip16 Figure 127 Effect of CO2 on the acrylic acid yield [30]helliphelliphelliphelliphelliphelliphelliphelliphelliphelliphelliphelliphelliphelliphelliphelliphelliphelliphellip20
Figure 128 Reaction steps and nature of active and selective sites in the oxidation of propane to acrylic acid on MoVTeNbOx catalysts [35]helliphelliphelliphelliphelliphelliphelliphelliphelliphelliphelliphelliphelliphelliphelliphelliphelliphelliphelliphelliphelliphelliphelliphelliphelliphelliphellip21 Figure129 The flow rate (left) and concentration distribution of oxygen (right) in the catalytic membrane reactor without reaction taking place The blue and green curves correspond to different reactor geometries (aspect ratios) The profile corresponding to fixed bed reactor (FBR) is indicated by orange line [61]helliphellip34 Figure 1210 (a) Selectivity of propylene vs propane conversion (b) selectivity of propylene vs temperature Conditions xC3H8
in=1 O2C3H8=1 and WHSV=100 and 400 kgsm3 [61]helliphelliphelliphelliphelliphelliphellip35
Chapter 2 Experimental methods Fig 221 The experimental setup denominated as PropOx-1helliphelliphelliphelliphelliphelliphelliphelliphelliphelliphelliphelliphelliphelliphelliphelliphellip47 Figure 222 The temperature profile of the reactor tube Zero centimeter corresponds to the bottom of the heating cartridge The delimitation of the isothermal zone is marked by blue lineshelliphelliphelliphelliphelliphelliphelliphelliphellip49 Figure 223 The gas tubing connection of the two stage reactorhelliphelliphelliphelliphelliphelliphelliphelliphelliphelliphelliphelliphelliphelliphelliphellip53 Figure 224 The dilution ratio in the second reactor (red dots) and the overall space velocity (black squares) change upon oxygen addition in the two-stage reactor systemhelliphelliphelliphelliphelliphelliphelliphelliphelliphelliphelliphelliphelliphellip54 Figure 225 Detection at the MSD 1 acetic acid 2 acrylic acid helliphelliphelliphelliphelliphelliphelliphelliphelliphelliphelliphelliphelliphelliphellip56 Figure 226 Detection at the TCD 1 carbon- dioxide 2 water 3 propylene 4 propane 5 oxygen 6 nitrogen 7 carbon-monoxide valve switching helliphelliphelliphelliphelliphelliphelliphelliphelliphelliphelliphelliphelliphelliphelliphelliphelliphellip56 Figure 227 Calibration graphs helliphelliphelliphelliphelliphelliphelliphelliphelliphelliphelliphelliphelliphelliphelliphelliphelliphelliphelliphelliphelliphelliphelliphelliphelliphelliphelliphellip58 Figure 231 The TEM image of the catalyst 6059 helliphelliphelliphelliphelliphelliphelliphelliphelliphelliphelliphelliphelliphelliphelliphelliphelliphelliphelliphellip62 Figure 232 The XRD pattern of 6059 6902 and 8947helliphelliphelliphelliphelliphelliphelliphelliphelliphelliphelliphelliphelliphelliphelliphelliphelliphellip63
Chapter 3 Structural stability of the M1 MoVTeNbOx catalyst under propane
oxidation conditions Figure 331 The XRD patterns recorded under different reaction conditionshelliphelliphelliphelliphelliphelliphelliphelliphelliphelliphellip70 Figure 332 The lattice constants determined for every conditionhelliphelliphelliphelliphelliphelliphelliphelliphelliphelliphelliphelliphelliphelliphellip71 Figure 333 The normalized average intensity corresponding to acrylic acid during the in-situ XRD experiment monitored by on-line MS (black squares) The concentration of acrylic acid determined in the PropOx-1 fixed bed reactor (blue dots)helliphelliphelliphelliphelliphelliphelliphelliphelliphelliphelliphelliphelliphelliphelliphelliphelliphelliphelliphelliphelliphelliphelliphelliphelliphellip72 Figure 341 STEM images of the catalyst before and after the in-situ XRD experimenthelliphelliphelliphelliphelliphellip73 Figure 342 The elemental mapping of the catalyst before reactionhelliphelliphelliphelliphelliphelliphelliphelliphelliphelliphelliphelliphelliphellip74 Figure 343 The elemental mapping of the catalyst after reactionhelliphelliphelliphelliphelliphelliphelliphelliphelliphelliphelliphelliphelliphelliphellip74
Chapter 4 Kinetic studies of propane oxidation to acrylic acid on a phase-pure
MoVTeNbOx catalyst Figure 421 The evolution of concentrations with the residence time at different temperatures Squares ndash experimental data dashed curves ndash fitted kinetic curves based on reaction model 1 (for modeling see section 64) Feed composition C3H8O2H2ON2=364051 vol Catalyst ID=6059helliphelliphelliphelliphelliphelliphellip80
205
Figure 422 The stability of catalytic performance in steam-free feedhelliphelliphelliphelliphelliphelliphelliphelliphelliphelliphelliphelliphelliphellip82 Figure 423 The effect of steam on the acrylic acid productivity at GHSV=4500 9000 and 18000 h-1hellip83
Figure424 The effect of temperature on the catalytic performance at 0 10 and 40 vol steam content Catalyst 6059helliphelliphelliphelliphelliphelliphelliphelliphelliphelliphelliphelliphelliphelliphelliphelliphelliphelliphelliphelliphelliphelliphelliphelliphelliphelliphelliphelliphelliphelliphelliphelliphelliphelliphelliphellip84
Figure 425 The effect of steam on the concentration profileshelliphelliphelliphelliphelliphelliphelliphelliphelliphelliphelliphelliphelliphelliphelliphelliphellip86 Figure 426 The effect of the propane concentration on the catalytic performance C3H8O2H2ON2=x640(54-x) vol T=400degC GHSV= 34280 h-1 WF=011 gsml Catalyst 6059hellip88 Figure 427 Determination of the reaction order with respect to propanehelliphelliphelliphelliphelliphelliphelliphelliphelliphelliphelliphellip90 Figure 428 The effect of the oxygen concentration on catalytic performance C3H8O2H2ON2=3y40(57-y) vol T=400degC GHSV= 4500 h-1 WF=0904 gsml catalyst 605991 Figure 429 Determination of the reaction order with respect to oxygen Cat 6059helliphelliphelliphelliphelliphelliphelliphellip92 Figure 4210 Propylene oxidation with 6902 Feed composition C3H6O2H2ON2=364051 vol Top GHSV=5000 h-1 bottom GHSV=20000 h-1 Catalyst 6902helliphelliphelliphelliphelliphelliphelliphelliphelliphelliphelliphelliphelliphelliphelliphelliphellip94 Figure 4211 The effect of H2O on propylene oxidation Feed composition C3H6O2H2ON2=36z(91-z) vol GHSV=80000 h-1 T=400degC Catalyst 690297 Figure 4212 The effect of temperature on acrolein oxidation Catalyst 6059helliphelliphelliphelliphelliphelliphelliphelliphelliphellip99
Figure 4213 CO oxidation at different temperatures space velocities in stoichiometric and oxidizing feed Catalyst 8947helliphelliphelliphelliphelliphelliphelliphelliphelliphelliphelliphelliphelliphelliphelliphelliphelliphelliphelliphelliphelliphelliphelliphelliphelliphelliphelliphelliphelliphelliphelliphelliphellip102 Figure 42 14 Space velocity variation for CO oxidation and water gas shift reactionhelliphelliphelliphelliphelliphelliphellip103 Figure 4215 Comparison of the propane propylene acrolein (top) propane CO oxidation and water gas shift activity (bottom) of the catalyst helliphelliphelliphelliphelliphelliphelliphelliphelliphelliphelliphelliphelliphelliphelliphelliphelliphelliphelliphelliphelliphelliphelliphelliphelliphellip105
Figure 431 The dilution ratios (black squares) overall space velocities (black dots) and the oxygen concentrations (empty and full blue triangles) in function of the flow rate of the added oxygenhelliphelliphelliphellip108 Figure 432 The effect of oxygen addition in the two-stage reactorhelliphelliphelliphelliphelliphelliphelliphelliphelliphelliphelliphelliphelliphellip109 Figure 433 Comparison of the catalytic performance in the single-tube reactor (STR) and two-stage reactor (TSR)helliphelliphelliphelliphelliphelliphelliphelliphelliphelliphelliphelliphelliphelliphelliphelliphelliphelliphelliphelliphelliphelliphelliphelliphelliphelliphelliphelliphelliphelliphelliphelliphelliphelliphelliphellip110 Figure 434 Addition of N2O in the two-stage reactor Conditions noted with stars - 40 vol O2 introduced in R1 reactor and 40 vol N2O in R2 reactor - 6 vol O2 introduced in R1 reactor and 00 vol N2O in R2 reactorhelliphelliphelliphelliphelliphelliphelliphelliphelliphelliphelliphelliphelliphelliphelliphelliphelliphelliphelliphelliphelliphelliphelliphelliphelliphelliphelliphelliphelliphelliphelliphellip112 Figure 435 Reactivation of the catalyst after exposing to reducing conditionshelliphelliphelliphelliphelliphelliphelliphelliphelliphellip113 Figure 436 The effect of C3H6 addition of in the two-stage reactorhelliphelliphelliphelliphelliphelliphelliphelliphelliphelliphelliphelliphelliphellip115 Figure 437 The effect of CO addition in the two-stage reactorhelliphelliphelliphelliphelliphelliphelliphelliphelliphelliphelliphelliphelliphelliphelliphellip116 Figure 438 The effect of CO2 addition in the two-stage reactorhelliphelliphelliphelliphelliphelliphelliphelliphelliphelliphelliphelliphelliphelliphellip118
Chapter 5 Post synthesis treatment of the phase-pure M1 MoVTeNbOx catalyst Figure 521 The UV-Vis spectra of the filtrate solutionshelliphelliphelliphelliphelliphelliphelliphelliphelliphelliphelliphelliphelliphelliphelliphelliphelliphellip126
Figure 531 The SEM picture of the catalysts 6902 (parent sample) 7797 (water treated sample) 7798 (H3PO4 treated sample) 7799 (TMEDA treated sample) 7800 (NaBrO3 treated sample) 8113 (N2H4 treated sample)helliphelliphelliphelliphelliphelliphelliphelliphelliphelliphelliphelliphelliphelliphelliphelliphelliphelliphelliphelliphelliphelliphelliphelliphelliphelliphelliphelliphelliphelliphelliphelliphelliphelliphellip129 Figure 532 The elemental composition of the original and the modified catalysts as probed by EDX130
533 NEXAFS spectra of the bromate treated sample( 7800) the parent sample (6902) the difference spectrum and the V5+ reference spectrumhelliphelliphelliphelliphelliphelliphelliphelliphelliphelliphelliphelliphelliphelliphelliphelliphelliphelliphelliphelliphelliphelliphelliphelliphellip131 Figure 534 Normalized surface concentrations Correlation of Te content and TeV ratio with the normalized selectivity to acrylic acid (bar-graph)helliphelliphelliphelliphelliphelliphelliphelliphelliphelliphelliphelliphelliphelliphelliphelliphelliphelliphelliphelliphelliphellip133 Figure 535 Adsorption of propane (educt of the catalytic reaction) at 313 K on fresh (dots) and used M1 (triangle) activated at 423 K under vacuumhelliphelliphelliphelliphelliphelliphelliphelliphelliphelliphelliphelliphelliphelliphelliphelliphelliphelliphelliphelliphelliphelliphelliphellip134 Figure 536 Adsorption of propylene at 313 K on fresh (dots) and used M1 (triangle) activated at 423 K under vacuumhelliphelliphelliphelliphelliphelliphelliphelliphelliphelliphelliphelliphelliphelliphelliphelliphelliphelliphelliphelliphelliphelliphelliphelliphelliphelliphelliphelliphelliphelliphelliphelliphelliphelliphelliphellip136 Figure 537 Adsorption of propane at 313 K after propylene adsorption on fresh (open dots) M1 activated at 423 K under vacuum For comparison the propane adsorption isotherm and differential heat profile if propane firstly adsorbed on the fresh M1 (dots)helliphelliphelliphelliphelliphelliphelliphelliphelliphelliphelliphelliphelliphelliphelliphelliphelliphelliphelliphelliphelliphellip138 Figure 538 Microcalorimetry on the bromate-treated phase-pure M1 catalyst (7800) before and after catalytic experimenthelliphelliphelliphelliphelliphelliphelliphelliphelliphelliphelliphelliphelliphelliphelliphelliphelliphelliphelliphelliphelliphelliphelliphelliphelliphelliphelliphelliphelliphelliphelliphelliphellip139 Figure 541 The activity of the catalystshelliphelliphelliphelliphelliphelliphelliphelliphelliphelliphelliphelliphelliphelliphelliphelliphelliphelliphelliphelliphelliphelliphelliphelliphellip141 Figure 542 The selectivity and yield of the catalystshelliphelliphelliphelliphelliphelliphelliphelliphelliphelliphelliphelliphelliphelliphelliphelliphelliphelliphelliphellip143
206
Figure 543 The apparent activation energy of propane activation over the catalystshelliphelliphelliphelliphelliphelliphellip143 Figure 544 The linear representation of the rate law with respect to propane and oxygen 6902 ndash original 7797 ndash H2O modified 7798 ndash H3PO4 modified 7799 ndash TMEDA modified 7800 ndash NaBrO3 modified 8113 ndash N2H4 modified samplehelliphelliphelliphelliphelliphelliphelliphelliphelliphelliphelliphelliphelliphelliphelliphelliphelliphelliphelliphelliphelliphelliphelliphelliphellip145 Figure 545 Plot of the experimental with calculated yC3H6 data for catalyst 6902helliphelliphelliphelliphelliphelliphelliphellip147 Figure 546 The activity of the catalysts in propane oxidation reaction 6902 ndash original 7797 ndash H2O modified 7798 ndash H3PO4 modified 7799 ndash TMEDA modified 7800 ndash NaBrO3 modified 8113 ndash N2H4 modified samplehelliphelliphelliphelliphelliphelliphelliphelliphelliphelliphelliphelliphelliphelliphelliphelliphelliphelliphelliphelliphelliphelliphelliphelliphelliphelliphelliphelliphelliphelliphelliphelliphelliphelliphellip149 Figure 547 The selectivity and yield of the catalysts in propane oxidation reaction 6902 ndash original 7797 ndash H2O modified 7798 ndash H3PO4 modified 7799 ndash TMEDA modified 7800 ndash NaBrO3 modified 8113 ndash N2H4 modified samplehelliphelliphelliphelliphelliphelliphelliphelliphelliphelliphelliphelliphelliphelliphelliphelliphelliphelliphelliphelliphelliphelliphelliphelliphelliphelliphelliphelliphellip149 Figure 548 The CO oxidation activity at different temperatures and GHSV=3000 h-1 (left) The kinetic curves of CO2 formation at 400degC (right) Conditions COO2H2ON2=36091 vol Catalysts 8947 ndash as prepared M1 MoVTeNbOx 7800 ndash NaBrO3 treated 6902 8113 ndash N2H4 treated 6902helliphelliphelliphelliphellip150
Figure 549 Kinetic curves for CO2 formation for the CO oxidation in presence of steam and for the water gas shift reactions Catalysts 6902 minus as prepared M1 MoVTeNbOx) 7800 minus NaBrO3 treated sample 8113 minus N2H4 treated samplehelliphelliphelliphelliphelliphelliphelliphelliphelliphelliphelliphelliphelliphelliphelliphelliphelliphelliphelliphelliphelliphelliphelliphelliphelliphelliphelliphelliphellip152
Chapter 6 Exploratory experiments Figure 621 Catalytic performance of different phase-pure Mo and V based oxideshelliphelliphelliphelliphelliphelliphelliphellip162
Figure 622 The activation parameters of the propane and oxygen conversion on the MoV(Te)(P)(Nb)Ox catalystshelliphelliphelliphelliphelliphelliphelliphelliphelliphelliphelliphelliphelliphelliphelliphelliphelliphelliphelliphelliphelliphelliphelliphelliphelliphelliphelliphelliphelliphelliphelliphelliphelliphelliphelliphelliphelliphellip163 Figure 631 Propylene oxidation over (Mo093V007)5O14 catalyst (1862)helliphelliphelliphelliphelliphelliphelliphelliphelliphelliphelliphellip168 Figure 641 Delplots for propane oxidation using the feed C3H8O2H2ON2=364051vol at T=400degC Catalyst ID 6059helliphelliphelliphelliphelliphelliphelliphelliphelliphelliphelliphelliphelliphelliphelliphelliphelliphelliphelliphelliphelliphelliphelliphelliphelliphelliphelliphelliphelliphelliphelliphelliphelliphellip172 Figure 642 Delplots for propane oxidation using the feed C3H8O2H2ON2=36091vol at T=400degC Catalyst ID 6059helliphelliphelliphelliphelliphelliphelliphelliphelliphelliphelliphelliphelliphelliphelliphelliphelliphelliphelliphelliphelliphelliphelliphelliphelliphelliphelliphelliphelliphelliphelliphelliphelliphellip174 Figure 643 Reaction model 1 for propane oxidationhelliphelliphelliphelliphelliphelliphelliphelliphelliphelliphelliphelliphelliphelliphelliphelliphelliphelliphelliphellip176 Figure 644 The reaction model 2helliphelliphelliphelliphelliphelliphelliphelliphelliphelliphelliphelliphelliphelliphelliphelliphelliphelliphelliphelliphelliphelliphelliphelliphelliphelliphellip177
Appendices
Appendix 51 Reaction networks of propane oxidation over the modified catalysts
Figure A511 The delplots corresponding to the propane oxidation using the H2O modified sample (7797) Feed composition C3H8O2H2ON2=364051 vol T=400degC189 Figure A512 The delplots corresponding to the propane oxidation using the NaBrO3 modified sample (7800) Feed composition C3H8O2H2ON2=364051 vol T=400degC190
Figure A513 The delplots corresponding to the propane oxidation using the hydrazine modified sample (8113) Feed composition C3H8O2H2ON2=364051 vol T=400deghelliphelliphelliphelliphelliphelliphelliphelliphelliphelliphelliphelliphellip191
Appendix 61 Modeling the delplots for a reaction pathway that contains multiple
rank product Figure A611 Reaction network containing a superposed primary and secondary rank end producthellip193 Figure A612 The delplot for B and C species corresponding to the reaction pathway depicted on Figure A611helliphelliphelliphelliphelliphelliphelliphelliphelliphelliphelliphelliphelliphelliphelliphelliphelliphelliphelliphelliphelliphelliphelliphelliphelliphelliphelliphelliphelliphelliphelliphelliphelliphelliphelliphelliphelliphellip194 Figure A613 Reaction network containing a superposed primary secondary and tertiary end product195 Figure A614 The delplots for C and D species corresponding to the parallel-consecutive reaction network depicted on Figure A613helliphelliphelliphelliphelliphelliphelliphelliphelliphelliphelliphelliphelliphelliphelliphelliphelliphelliphelliphelliphelliphelliphelliphelliphelliphelliphellip197 Figure A 631 Plot of thermal properties of the feed mixture and the catalytic properties in function of the steam contenthelliphelliphelliphelliphelliphelliphelliphelliphelliphelliphelliphelliphelliphelliphelliphelliphelliphelliphelliphelliphelliphelliphelliphelliphelliphelliphelliphelliphelliphelliphelliphelliphelliphelliphelliphellip200
207
List of tables
Chapter 1 Introduction and motivation Table 121 The characteristics of catalysts studied in [14 ]helliphelliphelliphelliphelliphelliphelliphelliphelliphelliphelliphelliphelliphelliphelliphelliphelliphellip8 Table 122 The calculated thermodynamic quantities of the supposed hydrogen atom abstraction pathways in comparison with the experimentally determined values [18]helliphelliphelliphelliphelliphelliphelliphelliphelliphelliphelliphelliphellip12 Table 123 Optimized catalytic performance of VPO HPC and MMO catalyst systems for oxidation of propane to acrylic acid as summarized based on references [2] and [4]helliphelliphelliphelliphelliphelliphelliphelliphelliphelliphelliphelliphellip13 Table 124 Catalytic effect of the individual phases of the mixture in the propane partial oxidation [2]21 Table 125 Activation energy of propane partial oxidation on different surface-promoted catalysts [36]23
Chapter 2 Experimental methods Table221 The Ψ Φ and η dimensionless numbers corresponding to propane oxidation reactionhelliphellip52 Table 222 The resolution for the peak-pairs which elute close to each otherhelliphelliphelliphelliphelliphelliphelliphelliphelliphelliphellip57 Table223 Vapor pressures of acetic- and acrylic acid at around room temperature [11]helliphelliphelliphelliphelliphellip58 Table 231 The properties of the phase-pure M1 catalysts 6059 6902 and 8947helliphelliphelliphelliphelliphelliphelliphellip62
Chapter 4 Kinetic studies of propane oxidation to acrylic acid on a phase-pure
MoVTeNbOx catalyst Table 421 The activation parameters of propane consumption at different steam contentshelliphelliphelliphelliphellip85
Table 422 The activation parameters of acrolein oxidation on 6059 catalysthelliphelliphelliphelliphelliphelliphelliphelliphelliphellip100
Table 423 The activation parameters of CO oxidation in dry feedhelliphelliphelliphelliphelliphelliphelliphelliphelliphelliphelliphelliphelliphellip102
Chapter 5 Post synthesis treatment of the phase-pure M1 MoVTeNbOx catalyst Table 531 The BET surface area of the sampleshelliphelliphelliphelliphelliphelliphelliphelliphelliphelliphelliphelliphelliphelliphelliphelliphelliphelliphelliphelliphellip127 Table 532 The lattice parameters of the catalysts before and after catalytic oxidation of propane and propylenehelliphelliphelliphelliphelliphelliphelliphelliphelliphelliphelliphelliphelliphelliphelliphelliphelliphelliphelliphelliphelliphelliphelliphelliphelliphelliphelliphelliphelliphelliphellip128 Table 533 The binding energies corresponding to every catalyst helliphelliphelliphelliphelliphelliphelliphelliphelliphelliphelliphelliphelliphellip132
Table 534 Adsorption and desorption heats corresponding to different coverageshelliphelliphelliphelliphelliphelliphelliphellip135
Table 535 The adsorption order monolayer coverage and adsorption constant of propane adsorption for the 6059 and bromate treated sample (7800) helliphelliphelliphelliphelliphelliphelliphelliphelliphelliphelliphelliphelliphelliphelliphelliphelliphelliphelliphelliphelliphellip140
Table 541 The catalytic performance of the hydrazine treated catalyst (8113) compared before and after the complete oxygen conversion experimenthelliphelliphelliphelliphelliphelliphelliphelliphelliphelliphelliphelliphelliphelliphelliphelliphelliphelliphelliphelliphelliphelliphellip142 Table 542 The apparent rate constants of propane and oxygen consumptionhelliphelliphelliphelliphelliphelliphelliphelliphelliphellip145 Table 543 The rate constants of propane and propylene consumptionhelliphelliphelliphelliphelliphelliphelliphelliphelliphelliphelliphelliphellip147 Table 544 Activation energy of CO oxidation Feed composition COO2H2ON2=36091 vol 8947 ndash as prepared M1 MoVTeNbOx 7800 ndash NaBrO3 treated 6902 8113 ndash N2H4 treated 6902helliphelliphelliphellip151
Table 545 The CO conversion at GHSV=3000 h-1 and 400degChelliphelliphelliphelliphelliphelliphelliphelliphelliphelliphelliphelliphelliphelliphelliphellip152
Table 546 Rate constants of CO2 formation at 400degChelliphelliphelliphelliphelliphelliphelliphelliphelliphelliphelliphelliphelliphelliphelliphelliphelliphelliphellip153
Chapter 6 Exploratory experiments Table 621 The used catalysts and reaction conditions Catalyst preparation methods SD ndash spray drying HT ndash hydrothermalhelliphelliphelliphelliphelliphelliphelliphelliphelliphelliphelliphelliphelliphelliphelliphelliphelliphelliphelliphelliphelliphelliphelliphelliphelliphelliphelliphelliphelliphelliphelliphelliphellip159 Table 622 Comparison of the catalytic performance of MoVTeNbOx (6059) and MoVOx (8103) samples at 400degC feed composition C3H8O2H2ON2=364051 vol helliphelliphelliphelliphelliphelliphelliphelliphelliphelliphelliphellip160
Table 623 Comparison of the performance of selected catalysts Composition as determined by (a) stoichiometry (b) ICP (c) EDX (d) LEIS-surface Preparation method slurry (Sl) hydrothermal (Ht) Solid-solid (Ss) Incipient impregnation (Ii) Spray drying (Sd) (P) ndash present workhelliphelliphelliphelliphelliphelliphellip165
Table 631 Propylene oxidation reactivity on different catalysts helliphelliphelliphelliphelliphelliphelliphelliphelliphelliphelliphelliphelliphelliphellip169
Table 641 Product ranks at different temperatures For multiple rank products the main ranks are highlighted by bold letter P-primary S-secondaryhelliphelliphelliphelliphelliphelliphelliphelliphelliphelliphelliphelliphelliphelliphelliphelliphelliphelliphelliphelliphellip173
208
Table 642 Product ranks at different steam contents For multiple rank products the main ranks are highlighted by bold letter P-primary S-secondary rankhelliphelliphelliphelliphelliphelliphelliphelliphelliphelliphelliphelliphelliphelliphelliphelliphelliphelliphellip175
Table 651 The rate constants corresponding to the steps of the reaction model 1helliphelliphelliphelliphelliphelliphelliphellip179
Table 652 The activation energy and preexponential factor of the individual reaction stepshelliphelliphelliphellip179
Table 653 The rate constants of the individual steps as determined based on model 1 and model 2hellip180
Appendices
Appendix 51 Reaction networks of propane oxidation over the modified catalysts
Table A511 Product ranks on the different catalysts P-primary S-secondaryhelliphelliphelliphelliphelliphelliphelliphelliphellip192
Appendix 63 The physical properties of the gas mixtures with different steam
contents Table A631 Physical properties of different feed mixtures Mixture 1 C3H8O2H2ON2=364051 vol Mixture 2 C3H8O2H2ON2=363061 vol Mixture 3 C3H8O2H2ON2=362071 vol Mixture 4 C3H8O2H2ON2=361081 vol Mixture 5 C3H8O2H2ON2=36091 vol199
ii
To my parents
iii
Eidesstattliche Versicherung Hiermit erklaumlre ich dass ich die Dissertation selbst angefertigt habe Die Arbeit enthaumlltndash auch in Anteilen ndash keine Kopien andere Arbeiten Verwendete Hilfsmittel und Quellen sind vollstaumlndig angegeben Die Namen alle Wissenschaftler die mit mir zusammengearbeiten haben sind in den Anlagen vollstaumlndig genannt
iv
Abstract
The present work concentrates on the systematic kinetic study of the one-step propane
oxidation to acrylic acid over a well defined phase-pure M1 MoVTeNbOx catalyst The
bulk structural stability of the catalyst is a key issue for kinetic studies The stability of
the phase-pure M1 MoVTeNbOx catalyst under various conditions (steam-containing
steam-free net reducing stoichiometric and net oxidizing feed compositions) was
evidenced by an in-situ XRD experiment which suggested that the bulk structure is
homogeneous and constant under reaction conditions Thereby the heterogeneously
catalyzed reactivity is exclusively determined by the surface properties which in turn are
controlled by the chemical potential of the gas phase
A kinetic study on the reaction variables (temperature steam content and redox potential)
was carried out Stable catalytic performance was observed for all the conditions Cycling
experiments showed the reversibility of the conversion and selectivity decrease upon
exposing the catalyst to dry and reducing feed respectively Further catalytic experiments
revealed that the reactivity spans over 5 orders of magnitude in the order of acrolein
oxidationgtgtpropylene oxidationgtpropane oxidationgtgtcarbon monoxide oxidation~water
gas shift reaction The negligible CO oxidation activity suggested that the CO and CO2
are formed via two independent pathways in propane oxidation over M1 The stage-wise
addition of oxygen lead to an improvement of the catalytic performance by 5 compared
to the conventional single-tube reactor Further experiments in the two-stage reactor
revealed that the phase-pure M1 is not reoxidized by N2O The addition of propylene in
the two-stage reactor revealed a slight competitive adsorption on the active sites with
propane which observation was supported by the results of microcalorimetric
experiments On the other hand the addition of CO and CO2 in the two-stage reactor
showed that these products do not adsorb competitively with the educt or intermediates
In the literature much of the kinetic data was reported for ill-defined catalyst surfaces In
contrast to that the present work reports the kinetic study of propane selective oxidation
to acrylic acid on a well defined phase-pure and structurally stable M1 MoVTeNbOx
catalyst This study may contribute to the better kinetic and mechanistic understanding of
the propane selective oxidation reaction
v
Zusammenfassung
Die vorliegende Arbeit enthaumllt systematische kinetische Untersuchungen zur einstufigen
selektiven Oxidation von Propan zu Acrylsaumlure an wohl definierten phasenreinen M1-
MoVTeNbOx-Katalysatoren Die Stabilitaumlt der phasenreinen M1-Katalysatoren unter
verschiedenen Reaktionsbedingungen (in Wasserdampf wasserdampffrei netto-
reduzierende stoumlchiometrische und netto-oxidierende Feed-Zusammensetzung) konnte in
In-situ-XRD-Experimenten bewiesen werden Da die Festkoumlrperstruktur homogen ist und
bestaumlndig unter Reaktionsbedingungen kann die unterschiedliche Reaktivitaumlt des
heterogenen Katalysators allein durch seine Oberflaumlcheneigenschaften bestimmt werden
welche wiederum stark vom chemischen Potential der Gasphase abhaumlngen
Es wurden kinetische Studien zu den Reaktionsparametern Temperatur Wasserdampf-
anteil und Redoxpotential durchgefuumlhrt wobei die Systeme unter allen Bedingungen
stabile Katalysatorleistungen aufwiesen Zyklische Experimente zeigten die Reversibilitaumlt
des Umsatz- und Selektivitaumltsruumlckgangs sowohl unter wasserfreiem als auch
reduzierendem Feed Zudem konnten in den Katalysetests Unterschiede in den
Reaktivitaumlten von bis zu 5 Groumlszligenordnungen ermittelt werden mit Acrolein gtgt Propylen
gt Propan gtgt CO-Oxidation~Wassergas-Shift Die bestimmte Oxidationsaktivitaumlt von CO
war vernachlaumlssigbar klein was die Bildung von CO und CO2 auf zwei voneinander
unabhaumlngigen Reaktionspfaden suggeriert Uumlber eine stufenweise Zufuhr von Sauerstoff
konnte eine Steigerung der katalytischen Aktivitaumlt um 5 im Vergleich zum
konventionellen einstufigen Reaktor erreicht werden Die Versuche im zweistufigen
Reaktor zeigten auch dass der phasenreine M1-Katalysator in N2O nicht reoxidiert
Weiterhin konnte unter Zugabe von Propylen im zweistufigen Reaktor eine teilweise
kompetitive Adsorption zu Propan an die aktiven Zentren des Katalysators beobachtet
werden Im Gegensatz dazu stand die Adsorption von CO und CO2 nicht in Konkurrenz
mit der Adsorption von Edukten oder Zwischenprodukten
Die kinetischen Untersuchungen der im Gegensatz zu den meisten Systemen in der
Literatur wohl definierten strukturstabilen M1-MoVTeNbOx-Katalysatoren koumlnnten
einen entscheidenden Beitrag zum Verstaumlndnis von Kinetik und Reaktionsmechanismus
der Propanoxidation leisten
vi
Table of contents
AcknowledgementsDanksagung helliphelliphelliphelliphelliphelliphelliphelliphelliphelliphelliphelliphelliphelliphelliphelliphelliphellipi Eidesstattliche Versicherunghelliphelliphelliphelliphelliphelliphelliphelliphelliphelliphelliphelliphelliphelliphelliphelliphelliphelliphelliphelliphelliphellipiii Abstract helliphelliphelliphelliphelliphelliphelliphelliphelliphelliphelliphelliphelliphelliphelliphelliphelliphelliphelliphelliphelliphelliphelliphelliphelliphelliphelliphelliphelliphellipiv
Zusammenfassung helliphelliphelliphelliphelliphelliphelliphelliphelliphelliphelliphelliphelliphelliphelliphelliphelliphelliphelliphelliphelliphelliphelliphelliphelliphellipv
Table of contents helliphelliphelliphelliphelliphelliphelliphelliphelliphelliphelliphelliphelliphelliphelliphelliphelliphelliphelliphelliphelliphelliphelliphelliphelliphelliphellipvi
Chapter 1 Introduction and motivation helliphelliphelliphelliphelliphelliphelliphelliphelliphelliphelliphelliphelliphelliphelliphelliphellip1 11 Introduction helliphelliphelliphelliphelliphelliphelliphelliphelliphelliphelliphelliphelliphelliphelliphelliphelliphelliphelliphelliphelliphelliphelliphelliphelliphelliphellip1 12 Overview on the literature results helliphelliphelliphelliphelliphelliphelliphelliphelliphelliphelliphelliphelliphelliphelliphelliphelliphellip3
121 The selective oxidation of propylene helliphelliphelliphelliphelliphelliphelliphelliphelliphelliphelliphelliphellip3 122 Oxidative dehydrogenation of propane helliphelliphelliphelliphelliphelliphelliphelliphelliphelliphelliphelliphellip8 123 The direct oxidation of propane to acrylic acid helliphelliphelliphelliphelliphelliphelliphelliphelliphellip13 1231 Generalities helliphelliphelliphelliphelliphelliphelliphelliphelliphelliphelliphelliphelliphelliphelliphelliphelliphelliphelliphellip13
1232 Identification of propane selective oxidation pathways helliphelliphellip14 1233 Active sites on MoVTeNbOx catalysts helliphelliphelliphelliphelliphelliphelliphellip20 1234 The effect of acid-base character of the catalyst helliphelliphelliphellip hellip24 1235 The effect of steam helliphelliphelliphelliphelliphelliphelliphelliphelliphelliphelliphelliphelliphelliphelliphellip25 1236 The effect of redox potential of gas phase and oxygen specieshellip27
124 Reactor designs operation modes helliphelliphelliphelliphelliphelliphelliphelliphelliphelliphelliphelliphelliphelliphellip31 1241 Conventional laboratory scale reactors helliphelliphelliphelliphelliphelliphelliphelliphelliphellip31 1242 Catalytic membrane- and multi-stage reactor designs helliphelliphelliphellip33
125 Reaction kinetics helliphelliphelliphelliphelliphelliphelliphelliphelliphelliphelliphelliphelliphelliphelliphelliphelliphelliphelliphelliphelliphellip37 13 Motivation helliphelliphelliphelliphelliphelliphelliphelliphelliphelliphelliphelliphelliphelliphelliphelliphelliphelliphelliphelliphelliphelliphelliphelliphelliphelliphelliphellip38 References Chapter 1 helliphelliphelliphelliphelliphelliphelliphelliphelliphelliphelliphelliphelliphelliphelliphelliphelliphelliphelliphelliphelliphelliphelliphelliphelliphellip40
Chapter 2 Experimental methods helliphelliphelliphelliphelliphelliphelliphelliphelliphelliphelliphelliphelliphelliphelliphelliphelliphelliphelliphellip44 21 Physico-chemical characterization of the catalysts helliphelliphelliphelliphelliphelliphelliphelliphelliphelliphelliphelliphellip44
211 Nitrogen physisorption helliphelliphelliphelliphelliphelliphelliphelliphelliphelliphelliphelliphelliphelliphelliphelliphelliphelliphelliphellip44 212 X-Ray Diffraction helliphelliphelliphelliphelliphelliphelliphelliphelliphelliphelliphelliphelliphelliphelliphelliphelliphelliphelliphelliphellip44 213 Scanning Electron Microscopy (SEMEDX) and Scanning Transmission Electron Microscopy (STEM) helliphelliphelliphelliphelliphelliphelliphelliphelliphelliphelliphelliphelliphellip45 214 X-Ray Photoelectron Spectroscopy (XPS) helliphelliphelliphelliphelliphelliphelliphelliphelliphelliphelliphellip45 215 Microcalorimetry helliphelliphelliphelliphelliphelliphelliphelliphelliphelliphelliphelliphelliphelliphelliphelliphelliphelliphelliphelliphelliphellip45
22 The experimental setup for propane oxidation helliphelliphelliphelliphelliphelliphelliphelliphelliphelliphelliphelliphelliphellip46 221 The gas dosing system helliphelliphelliphelliphelliphelliphelliphelliphelliphelliphelliphelliphelliphelliphelliphelliphelliphelliphelliphellip46 222 Reactor tube characteristics helliphelliphelliphelliphelliphelliphelliphelliphelliphelliphelliphelliphelliphelliphelliphelliphelliphellip48 223 Estimation of the Weisz-number the Thiele modulus and the effectiveness factor helliphelliphelliphelliphelliphelliphelliphelliphelliphelliphelliphelliphelliphelliphelliphelliphelliphelliphelliphelliphelliphelliphellip51 224 The two stage reactor system helliphelliphelliphelliphelliphelliphelliphelliphelliphelliphelliphelliphelliphelliphelliphelliphellip52 225 The analytical system helliphelliphelliphelliphelliphelliphelliphelliphelliphelliphelliphelliphelliphelliphelliphelliphelliphelliphelliphellip55 226 Calibration of the GC-MS helliphelliphelliphelliphelliphelliphelliphelliphelliphelliphelliphelliphelliphelliphelliphelliphelliphellip57 227 Data analysis helliphelliphelliphelliphelliphelliphelliphelliphelliphelliphelliphelliphelliphelliphelliphelliphelliphelliphelliphelliphelliphellip59
23 Catalyst synthesis and characterization helliphelliphelliphelliphelliphelliphelliphelliphelliphelliphelliphelliphelliphelliphelliphelliphellip61
vii
231 The synthesis of phase pure M1 MoVTeNbOx catalyst helliphelliphelliphelliphelliphelliphellip61 References Chapter 2 helliphelliphelliphelliphelliphelliphelliphelliphelliphelliphelliphelliphelliphelliphelliphelliphelliphelliphelliphelliphelliphelliphelliphelliphelliphellip63
Chapter 3 Structural stability of the M1 MoVTeNbOx catalyst under
propane oxidation conditions helliphelliphelliphelliphelliphelliphelliphelliphelliphelliphelliphelliphelliphelliphelliphelliphelliphelliphelliphelliphelliphellip65
31 Abstract helliphelliphelliphelliphelliphelliphelliphelliphelliphelliphelliphelliphelliphelliphelliphelliphelliphelliphelliphelliphelliphelliphelliphelliphelliphelliphelliphelliphellip65 32 Introduction helliphelliphelliphelliphelliphelliphelliphelliphelliphelliphelliphelliphelliphelliphelliphelliphelliphelliphelliphelliphelliphelliphelliphelliphelliphelliphelliphellip65 33 In-situ XRD study on the effect of steam and oxygenhelliphelliphelliphelliphelliphelliphelliphelliphelliphelliphellip68 34 STEM analysis of the catalyst before and after the in-situ XRD experiment helliphelliphellip72 35 Conclusions helliphelliphelliphelliphelliphelliphelliphelliphelliphelliphelliphelliphelliphelliphelliphelliphelliphelliphelliphelliphelliphelliphelliphelliphelliphelliphelliphellip75 References Chapter 3 helliphelliphelliphelliphelliphelliphelliphelliphelliphelliphelliphelliphelliphelliphelliphelliphelliphelliphelliphelliphelliphelliphelliphelliphelliphellip76
4 Kinetic studies of propane oxidation to acrylic acid on a phase-pure
MoVTeNbOx catalyst helliphelliphelliphelliphelliphelliphelliphelliphelliphelliphelliphelliphelliphelliphelliphelliphelliphelliphelliphelliphelliphelliphelliphelliphellip77
41 Abstract helliphelliphelliphelliphelliphelliphelliphelliphelliphelliphelliphelliphelliphelliphelliphelliphelliphelliphelliphelliphelliphelliphelliphelliphelliphelliphelliphelliphellip77 42 Kinetic studies on phase-pure M1 MoVTeNbOx helliphelliphelliphelliphelliphelliphelliphelliphelliphelliphelliphelliphellip77
421 Variation of the contact time and temperature helliphelliphelliphelliphelliphelliphelliphelliphelliphelliphellip78 422 Variation of the steam content helliphelliphelliphelliphelliphelliphelliphelliphelliphelliphelliphelliphelliphelliphelliphelliphellip81 423 Variation of the propane content helliphelliphelliphelliphelliphelliphelliphelliphelliphelliphelliphelliphelliphelliphellip88 424 Variation of the oxygen content helliphelliphelliphelliphelliphelliphelliphelliphelliphelliphelliphelliphelliphelliphelliphellip90 425 Propylene oxidation helliphelliphelliphelliphelliphelliphelliphelliphelliphelliphelliphelliphelliphelliphelliphelliphelliphelliphelliphelliphellip93 426 Acrolein oxidation helliphelliphelliphelliphelliphelliphelliphelliphelliphelliphelliphelliphelliphelliphelliphelliphelliphelliphelliphelliphellip98 427 CO oxidation and water gas shift reaction helliphelliphelliphelliphelliphelliphelliphelliphelliphelliphelliphellip100 428 Comparison of the reactivity of propane propylene acrolein and carbon monoxide oxidation reactions helliphelliphelliphelliphelliphelliphelliphelliphelliphelliphelliphelliphelliphelliphelliphellip104
43 Two-stage reactor used as a distributor of oxidizing and reducing gases helliphelliphelliphellip106 431 Addition of O2 and N2O helliphelliphelliphelliphelliphelliphelliphelliphelliphelliphelliphelliphelliphelliphelliphelliphelliphelliphellip107 432 Addition of propylenehelliphelliphelliphelliphelliphelliphelliphelliphelliphelliphelliphelliphelliphelliphelliphelliphelliphelliphellip 113 433 Addition of CO helliphelliphelliphelliphelliphelliphelliphelliphelliphelliphelliphelliphelliphelliphelliphelliphelliphelliphelliphelliphelliphellip116 434 Addition of CO2 helliphelliphelliphelliphelliphelliphelliphelliphelliphelliphelliphelliphelliphelliphelliphelliphelliphelliphelliphelliphelliphellip117
44 Conclusions helliphelliphelliphelliphelliphelliphelliphelliphelliphelliphelliphelliphelliphelliphelliphelliphelliphelliphelliphelliphelliphelliphelliphelliphelliphellip119 References Chapter 4 helliphelliphelliphelliphelliphelliphelliphelliphelliphelliphelliphelliphelliphelliphelliphelliphelliphelliphelliphelliphelliphelliphelliphelliphellip120 Chapter 5 Post synthesis treatment of the phase-pure M1 MoVTeNbOx catalyst122
511 Abstract helliphelliphelliphelliphelliphelliphelliphelliphelliphelliphelliphelliphelliphelliphelliphelliphelliphelliphelliphelliphelliphelliphelliphelliphelliphelliphelliphellip122 512 Introduction helliphelliphelliphelliphelliphelliphelliphelliphelliphelliphelliphelliphelliphelliphelliphelliphelliphelliphelliphelliphelliphelliphelliphelliphelliphellip122 52 Modifying agents and procedure helliphelliphelliphelliphelliphelliphelliphelliphelliphelliphelliphelliphelliphelliphelliphelliphelliphelliphellip124 53 Characterization of the modified samples helliphelliphelliphelliphelliphelliphelliphelliphelliphelliphelliphelliphelliphelliphellip127
531 N2 physisorption helliphelliphelliphelliphelliphelliphelliphelliphelliphelliphelliphelliphelliphelliphelliphelliphelliphelliphelliphelliphellip127 532 X-ray diffraction helliphelliphelliphelliphelliphelliphelliphelliphelliphelliphelliphelliphelliphelliphelliphelliphelliphelliphelliphelliphellip127 533 SEMEDX helliphelliphelliphelliphelliphelliphelliphelliphelliphelliphelliphelliphelliphelliphelliphelliphelliphelliphelliphelliphelliphelliphelliphellip128 534 XAS and XPS helliphelliphelliphelliphelliphelliphelliphelliphelliphelliphelliphelliphelliphelliphelliphelliphelliphelliphelliphelliphelliphellip131 535 Microcalorimetry helliphelliphelliphelliphelliphelliphelliphelliphelliphelliphelliphelliphelliphelliphelliphelliphelliphelliphelliphelliphellip134
54 Catalytic experiments helliphelliphelliphelliphelliphelliphelliphelliphelliphelliphelliphelliphelliphelliphelliphelliphelliphelliphelliphelliphelliphelliphellip141 541 Propane oxidation helliphelliphelliphelliphelliphelliphelliphelliphelliphelliphelliphelliphelliphelliphelliphelliphelliphelliphelliphelliphellip141 542 Kinetic analysis of propane oxidation over the modified catalysts helliphellip144
viii
543 Propylene oxidation helliphelliphelliphelliphelliphelliphelliphelliphelliphelliphelliphelliphelliphelliphelliphelliphelliphelliphelliphellip148 544 CO oxidation and water gas shift reaction helliphelliphelliphelliphelliphelliphelliphelliphelliphelliphelliphellip150
55 Conclusions helliphelliphelliphelliphelliphelliphelliphelliphelliphelliphelliphelliphelliphelliphelliphelliphelliphelliphelliphelliphelliphelliphelliphelliphelliphelliphellip153 References Chapter 5 helliphelliphelliphelliphelliphelliphelliphelliphelliphelliphelliphelliphelliphelliphelliphelliphelliphelliphelliphelliphelliphelliphelliphelliphellip155 Chapter 6 Exploratory experiments helliphelliphelliphelliphelliphelliphelliphelliphelliphelliphelliphelliphelliphelliphelliphelliphelliphellip157
61 Introduction helliphelliphelliphelliphelliphelliphelliphelliphelliphelliphelliphelliphelliphelliphelliphelliphelliphelliphelliphelliphelliphelliphelliphelliphelliphelliphellip157 62 Propane oxidation reactivity on different Mo and V based catalysts helliphelliphelliphelliphellip158 63 Propylene oxidation reactivity on different Mo and V based catalysts helliphelliphelliphellip166 64 Exploratory reaction pathway analysis of propane oxidation on phase-pure M1 catalyst helliphelliphelliphelliphelliphelliphelliphelliphelliphelliphelliphelliphelliphelliphelliphelliphelliphelliphelliphelliphelliphellip169 65 Exploratory kinetic modeling on propane oxidation on phase-pure MoVTeNbOx catalyst helliphelliphelliphelliphelliphelliphelliphelliphelliphelliphelliphelliphelliphelliphelliphelliphelliphelliphelliphelliphelliphelliphellip178
651 The effect of temperature helliphelliphelliphelliphelliphelliphelliphelliphelliphelliphelliphelliphelliphelliphelliphelliphelliphellip178 652 The effect of steam helliphelliphelliphelliphelliphelliphelliphelliphelliphelliphelliphelliphelliphelliphelliphelliphelliphelliphelliphelliphellip180
References Chapter 6 helliphelliphelliphelliphelliphelliphelliphelliphelliphelliphelliphelliphelliphelliphelliphelliphelliphelliphelliphelliphelliphelliphelliphelliphellip182 General Conclusions and Outlook helliphelliphelliphelliphelliphelliphelliphelliphelliphelliphelliphelliphelliphelliphelliphelliphelliphelliphellip184
Appendices helliphelliphelliphelliphelliphelliphelliphelliphelliphelliphelliphelliphelliphelliphelliphelliphelliphelliphelliphelliphelliphelliphelliphelliphelliphelliphelliphelliphellip189
Appendix 51 Reaction networks of propane oxidation over the modified catalystshellip 189 Appendix 61 Modeling the delplots for a reaction pathway that contains multiple rank product helliphelliphelliphelliphelliphelliphelliphelliphelliphelliphelliphelliphelliphelliphelliphelliphelliphelliphellip193 Appendix 62 Program for implementing Model 1 in Berkeley Madonna helliphelliphelliphellip198 Appendix 63 The physical properties of the gas mixtures with different steam contents helliphelliphelliphelliphelliphelliphelliphelliphelliphelliphelliphelliphelliphelliphelliphelliphelliphelliphelliphelliphelliphellip199 Acknowledgements for permission to reprint published materials helliphelliphelliphelliphelliphellip201 List of abbreviations helliphelliphelliphelliphelliphelliphelliphelliphelliphelliphelliphelliphelliphelliphelliphelliphelliphelliphelliphelliphelliphelliphelliphellip202 List of figureshelliphelliphelliphelliphelliphelliphelliphelliphelliphelliphelliphelliphelliphelliphelliphelliphelliphelliphelliphelliphelliphelliphelliphelliphelliphelliphellip204 List of tableshelliphelliphelliphelliphelliphelliphelliphelliphelliphelliphelliphelliphelliphelliphelliphelliphelliphelliphelliphelliphelliphelliphelliphelliphelliphelliphelliphellip207
1
Chapter 1 Introduction and motivation
11 Introduction
Based on economical and ecological considerations many attempts have been undertaken
during the last decades to replace petroleum by other feedstock for producing chemicals
and polymers The use of C2-C4 components of the natural gas for this purpose is one
option [1-3]
Acrylic acid and acrylonitrile are very important monomers The global crude acrylic
acid market reached around 32 million tons by the end of 2005 and the demand increased
steadily with ca 4year Esterification of crude acrylic acid yields acrylates which are
used to produce various homo- and copolymers by emulsion polymerization with
manifold applications ranging from coatings (ca 44 of the total market) adhesives (ca
19 of the total market) and fibres to textiles (ca 7 of the total market) Acrylic acid
in its glacial form is used to produce polyacrylic acid and polyacrylates for
superabsorbents (ca 11 of the total market) inks detergents and dispersants (ca 8 of
the total market)
Acrylic acid has been produced in commercial processes starting from acetylene
ethylene or propylene respectively In the last century acrylic acid was mainly
manufactured by means of an acetylene-based process (Reaction 111) developed by
Reppe in the 1930acutes in Germany The process was commercialized by the BASF in
Ludwigshafen Germany in the 1950acutes
HCequivCH + CO + H2O rarr CH2=CHCOOH (Reaction 111)
This process was operated at 200degC and 80 bar applying a catalyst that contains a
carbonyl forming metal such as nickel The plant in Ludwigshafen was closed in the
1990acutes with the start-up of a new propylene-based plant in Antwerp Belgium
The direct oxidation of propylene to acrylic acid was developed by Nippon Shokubai
using catalysts like Mo-W-Te-Sn-Co-O or Nb-W-Co-Ni-Bi-Fe-Mn-Si-Zr-O at 325-350ordmC
with 65 and 75 yield respectively [2-4] The reaction is very exothermic
2
(∆H=minus598kJmol) The process requires maintaining the temperature between 325 and
350degC in order to attain an economically reasonable propylene conversion but under
these conditions significant total oxidation occurs which causes a decrease of selectivity
Moreover the catalyst shows significant deactivation For these reasons the process
turned out to be uneconomic
Nowadays a two stage oxidation process starting from propylene is exclusively used
worldwide In the first step propylene is oxidized to acrolein at 350plusmn50degC over promoted
molybdenum-bismuth systems (Reaction 112)
H2C=CHCH3 + O2 rarr H2C=CHCHO + H2O ∆H = - 3408 kJmol (Reaction 112)
Promoted molybdenum-vanadium systems and temperatures around 210-250degC are used
to oxidize acrolein to acrylic acid (Reaction 113)
H2C=CHCHO + 12O2 rarr H2C=CHCOOH ∆H = - 2541 kJmol (Reaction 113)
Both of these steps are rather exothermic In the first step a yield of 90 acrolein can be
attained During the second step a yield of 97 acrylic acid can be reached The overall
acrylic acid yield is around 87
Upcoming new process developments include
bull biotransformation processes (eg using lactic acid as an intermediate)
bull oxidation of propane via propylene (oxidative dehydrogenation) and acrolein
(three stage process) or
bull direct oxidation of propane to acrylic acid in one step
The price of propylene is 1105 euroton [5] while the price of acrylic acid is currently
1825euroton [6] On the other hand the propane is much cheaper than propylene it costs
ca 345 euroton [6] Because the feedstock cost accounts about 80 of the profited cost the
3
realization of the direct (one step) oxidation of propane to acrylic acid would be
economically very important [1 2]
Due to the apparent attractiveness with respect to potential utilization of the low cost
propane feedstock considerable research activities were initiated in the last two decades
for the selective oxidation of propane to acrylic acid However propane is less reactive
than propylene therefore higher temperatures or more active catalysts are needed to
activate it The increase of temperature causes the increase of conversion but usually also
enhances the formation of side products (propionic and acetic acids) andor total
combustion products (CO and CO2) which results in the decrease of selectivity and yield
of the process Hence the development of an active and selective catalyst for the direct
(one-step) transformation of propane to acrylic acid is still a challenging task [1-3]
Owing to the price difference between propane and propylene and the high performance
of the two-stage propylene oxidation process a yield of 50-60 would be needed for the
one step propane oxidation process in order to replace the actual process
12 Overview on the literature results
The literature overview consists of five main parts In the first part the propylene
selective oxidation is presented which is industrially applied In the second part the main
results concerning propane oxidative dehydrogenation are summarized The third part
concentrates on the one-step propane oxidation reaction Here the current knowledge
from literature about the reaction pathways active sites and effects of the operating
variables (acid-basic properties of the catalyst feed composition) are presented In the
last two parts reactor design and reaction kinetic considerations are summarized The
motivations for the present study are outlined at the end of this chapter
121 The selective oxidation of propylene
The oxidation of propylene to acrolein has been studied on various catalysts mainly on
bismuth molybdates Cu2O and multi-component metal oxides (ie SbSnO CoMoTeO
NiMoTeO VPTeO etc)
4
Based on structural considerations kinetic studies IR and Raman spectroscopic
investigations and reactivity studies using isotopically labeled feeds and intermediates
the organic reaction mechanism of propylene oxidation over bismuth molybdates has
been proposed according to the scheme depicted in Figure 121 [7-9] The involvement
of lattice oxygen atoms was postulated
Figure 121 Propylene oxidation and ammoxidation mechanism over bismuth molybdate catalysts as
proposed by Grasselli et al [9]
According to the reaction mechanism depicted on Figure 121 propylene is chemisorbed
on di-oxo molybdenum sites with molybdenum in the highest oxidation state The C-H
bonds in the methyl group of chemisorbed propylene are activated by withdrawing
electron density towards the molybdenum atom The rate determining step is the
abstraction an α-methyl hydrogen atom as a H radical˙ by an adjacent Bi3+ site forming
an allyl radical adsorbed as a π complex on the Mo di-oxo species (homolytic C-H bond
splitting) Oxygen insertion and abstraction of the second hydrogen atom occur on
adjacent di-oxo Mo sites The metal-oxo group attacks the allyl intermediate forming a σ-
5
bonded allyl species The latter species is transformed to acrolein by abstraction of a
further hydrogen atom The surface OH groups formed by hydrogen abstraction then
react to form water which is desorbed Reoxidation of the reduced molybdenum and
bismuth sites by O2 was suggested to close the catalytic cycle The adsorption and
dissociation of gaseous oxygen was supposed to occur on bismuth sites It was also
claimed that the reoxidation sites should be located in the vicinity of the catalytically
active centers to achieve high activity (this is referred to as ldquophase cooperationrdquo concept)
[10] The proper BiMo stoichiometry exists in the α- and β-phase [9] which are the most
effective phases among the numerous Bi-molybdate phases that exist [11] It was also
claimed that high selectivity requires isolation of the active sites from each other (this is
referred to as ldquosite isolationrdquo concept) [10]
Figure 122 Mechanism of propylene oxidation by consecutive acid-base and redox steps as proposed by
Bettahar et al [12]
6
According to Bettahar et al [12] the reaction scheme demonstrated in Figure 122 may
also be interpreted in terms of proton abstraction on basic Bi-O groups leading to a
symmetric π-allyl anionic intermediate coordinated to the molybdenum di-oxo species
(heterolytic C-H bond splitting) The allyl-anion is subsequently oxidized to a π-allyl
cation on a redox active site Then the nucleophilic Mo-O group attacks the π-allyl cation
and transforms it into σ-allylic alkoxide This unsaturated oxygenated intermediate loses
another H atom in a subsequent redox step and it is transformed into acrolein [12]
It was claimed that
bull The reaction steps are sequential ones not simultaneous concerted steps However
Bettahar et al pointed out that the mechanism may also occur through a SN2 type
mechanism by nucleophilic attack of the O2- anion to the C=C bond concerted with
hydride abstraction from the CH3 group [12]
bull The reaction occurs on a specific ensemble BiMo-site there is no movement
desorptionre-adsorption of the intermediate species
bull The intermediates that appear after the rate determining step are transformed
instantly into other intermediates or desorbed (the surface coverage of adspecies
produced after the rate determining step is negligible)
bull Gaseous O2 dissociates rapidly and re-oxidizes the vacancy without forming
adsorbed oxygen species [3]
The theoretical study on the propylene oxidation mechanism over Bi-Mo catalysts carried
out by Jang et al supported the experimental observations [13] In order to determine the
possible reaction routes the thermodynamic quantities such as C-H bond dissociation
enthalpies and free enthalpies were calculated using the density functional theory (DFT)
The geometry of each considered structure was optimized The vibrational frequencies
were calculated from the Hessian matrices and used for calculation of zero-point energies
and thermodynamic quantities (enthalpy and free enthalpy) of the reaction The
calculations of C-H bond dissociation enthalpies and free enthalpies revealed that the
weakest bond in the propylene molecule is the methylene (Cα-Hα) bond (∆G=+2883
7
kJmol) In order to determine the olefin activating site the α-hydrogen atom abstracting
ability of both Mo3O9 and Bi4O6 clusters was investigated All of the O-atoms in the
Bi4O6 structure are equivalent however in Mo3O9 cluster there are two types of O atoms
bridging (Mo-O-Mo) and terminal ones (M=O) The free enthalpy of Cα-Hα activation on
the two different Mo sites was calculated to be ∆G=+1791 kJmol and ∆G=+1134
kJmol respectively depending on whether the abstracted H-atom is linked to the
terminal oxo-group (M=O) or to the bridging oxygen atom (Mo-O-Mo) respectively
Therefore the bond activation by the terminal M=O group is thermodynamically favored
This is in accordance with the conclusions derived from the experimental observations
However in both cases the H-atom abstraction step is much too endothermic The C-H
bond cleavage on the Bi3+ site is even more endothermic probably because the linking of
hydrogen atom to the bridging O-atom leads to Bi-O cleavage and the resulting structure
is not favorable In turn the dissociative chemisorption of O2 oxidizes the Bi3+ site to Bi5+
(Reaction 121) on which the hydrogen atom abstraction is more favorable (Reaction
122)
[ ] )221 (Re 510
)121 (Re 4154 2
1
22746374
74264
actionmolkJGCHCHCHHOBiHCOBi
actionmolkJGOBiOOBi
+=∆minus=+rarr+
+=∆rarr+
minus
The dissociative chemisorption of O2 was found to be enhanced by the presence of
Fe2+Fe3+ redox couple This is the explanation of the outstanding performance of Mo-Bi-
Co-Fe-O catalyst on which 90 conversion was attained compared to only 20
conversion on binary bismuth-molybdates
Furthermore the calculations revealed that
bull the allyl species is coordinated preferably to the Mo=O group
bull the oxygen insertion occurs at the Mo=O group to which the allyl species
is coordinated
bull the second H-atom abstraction occurs at the adjacent Mo=O group and
subsequently the acrolein formed is desorbed
8
bull after the desorption of the water molecule the reduced molybdenum site is
re-oxidized by O2 in an exothermic step
In summary the olefin activation was suggested to occur on the Bi-site while the further
chemical transformations occur on the Mo-sites
122 Oxidative dehydrogenation of propane
Chen et al carried out a kinetic analysis and isotopic tracer studies in order to identify the
elementary steps in the ODH of propane [14 15] Three kinds of ZrO2 supported MoOx
catalysts were used with different MoO3 loadings and thermal pretreatment conditions
(Table 121)
Table 121 The characteristics of catalysts studied in [14 ]
catalyst MoO3 loading
(wt )
temperature of the
thermal treatment (K)
structure of the
Mo-species
MoOxZrO2 11 773 MoOx oligomers
MoO3ZrO2 37 673 bulk MoO3
ZrMo2O8ZrO2 37 873 bulk ZrMo2O8
The catalytic tests were carried out in a quartz micro-reactor using small amount of
catalyst (0020-0100 g) Varying the flow rate the conversions were held at low values
below 2 with respect to propane and 20 with respect to O2 The chemical and isotopic
composition of products was analyzed using a GC-MS equipment It was found that
propylene is the most abundant product The rate of propylene combustion was found to
be 80 times higher than the rate of propane combustion The rate law of propane
oxidative dehydrogenation was found to be the same for all three catalysts This fact
suggested a similar mechanism A first order kinetics with respect to propane and zeroth
order with respect to oxygen was observed when steam was not present in the initial gas
mixture The presence of steam inhibited the propylene production Based on the
9
observations the following mechanism for propane ODH over the ZrO2 supported MoOx
catalysts was proposed
bull The first step (Reaction 123) is the rapid non-dissociative adsorption of
propane by interaction with lattice oxygen atoms (OL)
bull The second step (Reaction 124) is the C-H bond activation by H-atom
abstraction from the adsorbed propane using a neighboring OL A mixture
of C3H8 and C3D8 underwent oxidative dehydrogenation without forming
C3H8-xDx mixed isotopomers suggesting that the steps involving C-H bond
activation are irreversible
bull In the third step (Reaction 125) a hydrogen atom is removed from the
methyl group propylene and a surface hydroxyl group is formed
bull Two neighboring surface hydroxyl groups are recombining in the fourth
step (Reaction 126) water is desorbed and a vacancy is formed
bull The reoxidation of two neighboring vacancies by an oxygen molecule
(Reaction 127) was suggested to close the catalytic cycle
)721 Re(
)621 Re(
)521 Re(
)421 (Re
)321 (Re
)(2
)(2)()(
)()(63)(73
)()(73)(83
)(83)(83
actionOOO
actionOOHOHOH
actionOHHCOHC
actionOHOHCOOHC
actionOHCOHC
LLgas
Lgasadsads
adsgasads
adsadsLads
adsLgas
+rarrloz+loz+
loz++hArr+
+rarr
+rarr+
hArr+
Reactions of 18O2C3H8 on supported Mo16Ox species lead to the preferential initial
appearance of lattice 16O atoms in H2O CO and CO2 products indicating that the lattice
oxygen is required for C-H bond activation and for the ultimate oxidation of the adsorbed
products The kinetic isotopic effect of CH3CD2CH3 with respect to CH3CH2CH3 is 17
which is slightly smaller than the value of 23 obtained when using CD3CD2CD3 and
CH3CH2CH3 This finding was interpreted as both methyl and methylene groups can be
involved in the rate determining step required for propane activation
10
Based on the inhibitory effect of steam on propylene production it was assumed that the
recombination of the two OH-groups (reaction step126) is reversible The isotopic tracer
study supported this assumption as H-D exchange occurs readily between C3H6 and D2O
or C3D6 and H2O suggesting that OH recombination steps are reversible and quasi-
equilibrated
When a mixture of 18O and 16O was used as oxidant the 18O16O mixed isotopomer was
not detected in the gas phase suggesting an irreversible O2 dissociation step for the
reoxidation of the reduced active site However it is notable that the reoxidation of the
reduced site can not occur in a single step because it would require a four electron
transfer from two reduced centers Moreover statistically it is not very probable that
there are two reduced centers (vacancies) within the bond length of the oxygen molecule
Certainly the electron transfer and breaking of the O-O bond should occur in consecutive
steps
Kinetic and isotopic studies of propane ODH over ZrO2 supported VOx catalysts lead to
the same observations described above [14-16] First order kinetics with respect to C3H8
was found on both the supported and bulk catalysts when steam was not present in the
initial gas mixture The presence of water clearly inhibited the propane ODH and
changed the reaction order with respect to propane and oxygen Without H2O in the
initial gas mixture zero order kinetics was observed with respect to O2 In presence of
steam the rate of propylene formation was reduced considerably (by about 30) and the
partial reaction order of O2 was found to be greater than zero in this case The elementary
steps were considered to be identical with those for the ODH of propane over ZrO2
supported MoOx catalyst In this case the lattice oxygen OL was designated for V=O or
V-O-V structures OH(ads) stands for V-O-H terminal hydroxyl group while the vacancy
(loz) corresponding the reduced redox site (V4+ or V3+) [16] Kinetic isotopic effect
measurements demonstrated that the methylene C-H group is activated first
Jibril studied the kinetics of ODH of propane on alumina supported metal-oxides rare
earth metal oxides and metal phosphates [17] The temperature dependence of propane
conversion was investigated activation energies (EA) and logarithm of pre-exponential
11
factors (lnA) were evaluated A compensation effect was noted as significant linear
correlation was found between the EA and lnA within the three groups of studied
catalysts The existence of the compensation effect in reactions catalyzed by similar
catalysts suggests the same mechanism within the three groups of catalysts
Fu et al reported a detailed DFT study on the mechanism of propane activation over
molybdenum oxide catalyst [18] The Mo3O9 cluster was chosen as a model for the
catalyst Two basis sets (6-31G and 6-31G) were tested for geometry optimization
No significant changes were found between the modeled geometries 6 possible ways of
C-H bond activation were considered
bull two kinds of 2+2 pathways which involve the homolytic dissociation of
the C-H bond at a Mo=O group leading to carbide or hydride
bull 3+2 (homolytic dissociation on a O=Mo=O group) and 5+2 (homolytic
dissociation on a O=Mo-O-Mo=O group) paths both of them lead to
hydroxyl- and alkoxy species directly
bull direct O atom insertion by a M=O group in the C-H bond giving an
alcohol
bull the 2+4 pathway involves linking of both the methyl and methylene C-H
bonds simultaneously to the M=O group
bull hydrogen atom abstraction that may occur theoretically either from methyl
or methylene group leading to n-propyl or iso-propyl radical
Figure 123 Some examples of the possible transitional states of hydrogen atom abstraction according
to[18] The numbers on the figures correspond to the calculated bond lengths
12
17 different transitional states were taken into account The free enthalpy of activation for
each case (∆G) was estimated at 688 K and the rate constants were evaluated according
to the Eyring equation In order to compare directly the calculated and the experimental
findings of the isotopic tracer studies reported by Chen et al [15] the kinetic isotopic
effect for each considered reaction pathway was also estimated using the transitional state
theory
The hydrogen abstraction pathways were considered to be one electron processes leading
to radicals The energy barriers for these pathways were found to be the lowest among the
considered ones This indicated that the probability of hydrogen atom abstraction is much
higher than the occurrence of other two-electron processes The propane molecule may
approach the Mo=O group in syn or anti position (Figure 123) Only one of the terminal
Mo=O group is involved in the process the another one is a spectator group
The calculated activation enthalpy values revealed that the anti-modes are favored
against the syn-modes by 251-293 kJmol (Table 122)
Table 122 The calculated thermodynamic quantities of the supposed hydrogen atom abstraction pathways in comparison with the experimentally determined values [18]
Type of C-H cleavage ∆∆∆∆H (kJmol) ∆∆∆∆S
(JmolmiddotK) ∆∆∆∆Hr (kJmol)
-CH2- syn 1640 -1059 1335
-CH3 syn 1803 -1004 1544
-CH2- anti 1351 -1197 1335
-CH3 anti 1548 -1230 1544
-CH2- experimental 1172 -1218 -
It was also pointed out that breaking the methylene C-H bond is more favorable than
breaking of the methyl C-H bond The difference of 163-197 kJmol in the activation
enthalpy could be assigned to the differences in bond strengths The reasonable
agreement between the calculated and experimental activation parameters corresponding
to the methylene C-H bond suggests that the theoretical description of the experimental
observation is good It is also notable that the calculation overestimated the kinetic
isotopic effect compared to the experimental data reported by Chen et al [15] but some
indications were found that both methyl and methylene hydrogen atoms are involved
13
123 The direct oxidation of propane to acrylic acid
1231 Generalities
Different types of catalysts were tested for the activation of propane The most efficient
catalyst class is represented by the systems based on reducible (typically transition) metal
oxides V2O5 and MoO3 are versatile catalysts for organic compound oxidation because
they loose oxygen reversibly [19] The most investigated catalytic materials within this
class are vanadium phosphorous oxides (VPO) heteropoly compounds (HPCs) and
multi-component mixed oxides (MMOs) [2-4] The performance of these catalysts in
terms of propane conversion selectivity and yield to acrylic acid is summarized in the
Table 123
Table 123 Optimized catalytic performance of VPO HPC and MMO catalyst systems for oxidation of propane to acrylic acid as summarized based on references [2] and [4]
Catalyst T(ordmC) XC3
()
SAA
()
YAA
()
VPO (PV=11) 420 46 32 147
VPO (PV=11) 400 23 48 112 VPO
001 Ce ndash VPO 390 28 68 188
H2(VO)05(22-bipy)PMo12O40 400 504 215 108
Nb(pyridine)-PMo11VO40 380 21 49 103 HPC
20 HxCu06Cr06PMoV2AsO40SiO2 390 38 39 148
MoV03Te023Nb012On 380 84 63 53 MMO
MoV03Te023Nb012On 380 80 60 48
Table 123 indicates that the highest conversions of propane and the highest selectivities
for acrylic acid were achieved on MoVTeNbOx catalysts originally patented by
Mitsubishi [20 21] This catalyst is also active and selective for propane ammoxidation
suggesting that there are some common steps in the partial oxidation and ammoxidation
reactions [2-4]
14
1232 Identification of propane selective oxidation pathways
The early ideas about the mechanism of the propane selective oxidation reaction were
summarized by Bettahar et al [12] The theoretical network of reaction steps in selective
oxidation of propane is shown in Figure 124 This reaction network was supported
mainly by thermodynamic considerations However the thermodynamic calculations on
the reaction enthalpy were performed at normal conditions and not reaction conditions
Too less catalytic and kinetic evidences were known for this reaction network
Figure 124 Reaction network of propane oxidation according to Bettahar et al [12]
Lin et al studied the reaction pathways of the selective oxidation of propane over a
MoVTeNbOx catalyst [22] They prepared the catalyst according to the method described
in the patent literature [20 21] The catalyst characterization indicated the following
composition MoV025Te018Nb009Ox (bulk composition determined by XRF) and
MoV03Te019Nb015Ox (surface composition determined by XPS) The BET surface area
-
+ frac12 O2
15
was 36 m2g while the mean pore diameter was found to be 180 Aring The SEM images
revealed primary sub-micron particles and their aggregates XRD peaks were found at
2Θ=224ordm 286ordm 366ordm 454ordm and 504ordm respectively which are in accordance with the
peaks reported by Ushikubo [20 21] The catalytic test was carried out at the reaction
temperature of 391ordmC with initial feed composition C3H8 air H2O = 3 50 47 vol at
GHSV=1200 h-1 Under these conditions 18 propane conversion was attained the
selectivity for acrylic acid was 26 and COx acetic acid and acetone were produced
with 54 8 and 1 selectivity respectively The presence of propylene and acrolein in the
outflow gas mixture was not observed
In order to elucidate the propane oxidation pathways the relative reactivities of oxidation
products and of potential intermediates were studied (Figure 125) The ranking order of
the reactivity was found to be propane ltlt acetic acid asymp acrylic acid lt propylene
ltacetone lt acrolein asymp isopropanol
Figure 125 The relative oxidative stability of several intermediates at different temperatures [22]
The acrolein acetone isopropanol and propylene were found to be very reactive at
around 390degC Based on this observation the authors argued that this is the reason why
these intermediates can not be detected during the partial oxidation of propane to acrylic
16
acid It is to be noted that the real reactivity of the isopropanol acrolein and acetone can
not be observed from the above plot because the conversions reach 100 at around
390degC
The product distribution upon oxidation of the above compounds was the following The
acetone oxidation over the catalyst produced acetic acid at lower temperatures and COx at
higher temperatures The oxidation of acrolein produced acrylic acid and COx At higher
temperatures a small amount of acetic acid was also detected The acetic acid was
believed to be a product of the oxidative degradation of acrylic acid
Figure 126 Oxidation pathways of propane according to [22]
A more complicated profile consisting of parallel and consecutive steps was found for
propylene oxidation at higher temperatures the propylenerarracroleinrarracrylic acid was
favored while at lower temperatures acetone and subsequently acetic acid were produced
in larger amounts
The isopropanol reacted also via two competing pathways the dehydration lead to
propylene while the oxidation produced acetone At higher temperatures the propylene
pathway was found to be favored and the selectivity to acrylic acid was higher in this
case
17
The product of oxidative degradation of acrylic acid was found to be acetic acid and COx
as also shown by Vitry et al [23] During the oxidation of acetic acid only carbon oxides
were detected
Based on these observations a reaction scheme of propane oxidation was proposed
(Figure 126) The pathways (a) and (c) leading to n-propanol and isopropanol are in
conflict with the experimental and theoretical findings [12-16] These alcohols were
believed to undergo dehydration to propylene and oxidation to the corresponding
carbonyl compounds and carboxylic acids respectively according to the above scheme
During the catalytic oxidation of propane however n-propanol propionaldehyde and
propionic acid were not detected at all Therefore path (a) was regarded as not to be
probable Path (b) is a direct oxidative dehydrogenation of propane to propylene
followed by oxidation to acrylic acid through acrolein The latter pathway was regarded
to be more likely because the product distribution patterns of propane and propylene
oxidation are similar while that of isopropanol are significantly different
Similar reactivity studies were undertaken by Luo et al including the oxidation of n-
propanol and propanal as potential intermediates [24] Basically the same reaction
pathway was proposed as the one shown above (Figure 126)
Based on gas phase analysis at different residence times the reaction sequence
propanerarrpropenerarracroleinrarracrylic acid has also been proposed on MoVSbNbOx
catalysts [25] The acetic acid obtained on these catalysts was assumed to be formed via
propenerarracetone The main function of water on MoVSbNbOx catalysts was assigned to
its role in preserving the metals in a partially reduced oxidation state [26]
Kinetic studies on the partial oxidation of propane to acrylic acid over egg-shell type
MoV033Te022Nb011Ox catalysts containing 10 to 20 active mass on spherical steatite
have been performed by Balcells et al and Griszligtede [27 28] From the characteristic
shapes of the selectivities vs propane conversion plots propene was considered to be the
only primary product which is in agreement with the previous studies The low
propylene concentrations observed in the gas phase was regarded to be the indication that
18
the oxidative dehydrogenation of propane is the rate determining step A simple system
of differential equations containing first order rate expressions with respect to the organic
compounds was set up However the carbon monoxide carbon dioxide and acetic acid
were considered as three carbon atom containing pseudo-products and merged under the
term ldquobyproductsrdquo Although the calculated results were in a good agreement with the
experimental data the model proposed by Griszligtede seems to be too abstract because it
assumes that the three byproducts are formed in a coupled reaction step
The reaction scheme of propene on the same catalyst was found to be more complex
including acrolein acetone and acetic acid as detectable intermediatesby-products The
model proposed for propylene oxidation was based the same assumption as the model
proposed for propane oxidation The influence of temperature oxygen concentration and
water content on propane oxidation was studied Only a small influence of the oxygen
concentration was observed Concerning the reactor operation a steam content of about
20-30 vol- was recommended
The reaction network of selective oxidation of propene on mixed oxide catalysts
(MoVNbO MoVSbO and MoVTeNbO) was also investigated by Concepcioacuten et al [29]
FTIR measurements of propylene adsorptiondesorption over these catalysts suggested
three different intermediates
bull a symmetric π-allylic species which is formed if α-hydrogen abstraction sites
(ie Sb3+ or Te4+) are present The π-allylic species represent the intermediate in
the selective oxidation of propylene to acrylic acid by a redox mechanism
bull an enolic-type intermediate in the hydrationoxidation of the olefin to form
acetone and acetic acid on Broslashnsted acid sites
bull a π-bonded propylene species interacting with Lewis acid sites which is regarded
as a precursor in the deep oxidation of propylene
Fushimi et al has carried out catalytic studies on MoV03Te023Nb017Ox over a wide range
of temperatures feed compositions and contact times [30] Steady-state (space velocity
19
and temperature variation) and non steady-state experiments (pulse-response temporal
analysis of the products) were carried out The temperature variation experiment was
done by increasing the reaction temperature up to 400degC followed by a controlled
cooling In this temperature programmed reaction complete oxygen conversion was
observed at around 400degC More important a hysteresis phenomenon of the product
yields was observed during the cooling when using stoichiometric and reducing feed
compositions The hysteresis phenomenon was accounted for the effect of nonlinearity of
the kinetics and adsorption-desorption of the intermediates and products However no
hysteresis was observed when using net oxidizing feed The apparent activation energies
of acrylic acid formation were determined to be 73 and 186 kJmol depending on feed
composition and contact time respectively
Based on transient experiments a complicated reaction network was proposed The main
reaction pathway consists of propanerarrpropylenerarracroleinrarracrylic acidrarrCO+CO2
steps The TAP experiments indicated that water reacts with the adsorbed acrolein to
form acrylic acid The unselective pathways corresponding to total oxidation of
propylene allylic intermediate and acrylic acid were proposed for the production of CO
CO2 and acetic acid Since no differentiation was made between the pathways leading to
these products the model has the same restrictions like the one proposed by Griszligtede [27
28]
The effect of CO2 initial concentration added to the initial feed was also studied in the
interval between 0 and 50 vol (Figure 127) The results revealed an approximately
linear increase of the acrylic acid yield with the initial CO2 content in the feed Without
experimental evidence the positive effect of the higher CO2 concentrations was
accounted for the adsorption of CO2 on the active sites andor formation of an
intermediate that favors the selective pathway
20
Figure 127 Effect of CO2 on the acrylic acid yield [30]
Redox pulse experiments on MoVTeNbOx carried out by Grasselli et al in absence of
O2 (gas) revealed that the oxidation of the propane occurs even under this condition The
catalyst remained in the reduced state without a structural collapse The reduced catalyst
could be re-oxidized in presence of O2 The authors claimed this finding as a
confirmation of the direct involvement of lattice oxygen in (amm)oxidation process [31]
1233 Active sites on MoVTeNbOx catalysts
MoVTeNbOx catalysts are generally composed of two crystalline phases [32]
- an orthorhombic active and selective phase (M1)
- an orthorhombic much less active but selective phase (M2)
Propane activation and high selectivities towards acrylic acid are generally attributed to
the presence of the orthorhombic M1 phase [33 34]
A synergistic effect in activity and selectivity for (amm)oxidation of propane was
claimed for the nano-scale mixture of M1 and M2 The synergistic effect was not
observed for physical mixtures of the phases (Table 124) [2 9 31] However it is to be
noted that the selectivities were compared at very different propane conversions
Moreover the M2 catalyst was tested at 410degC while the M1 and the phase mixture at
21
380degC It is well known that the selectivity depends on the conversion of propane
Therefore the conclusions concerning the synergistic effect are questionable
Table 124 Catalytic effect of the individual phases of the mixture in the propane partial oxidation [2]
Catalyst T(ordmC) XC3 () SAA ()
M1 380 279 52
M2 410 06 22
M1+M2 380 349 53
The function of the individual catalysts components has been assigned by Loacutepez-Nieto
according to the schema given in Figure 128 [35] The transformation of propane to
propylene was suggested to occur on the V=O adjacent to Mo or Nb-sites The further
oxidation of propylene to acrolein was believed to occur on Te-sites while the oxidation
of acrolein to acrylic acid on the V- or Nb-sites adjacent to Mo-site However the model
does not explain the formation of acetic acid CO and CO2 It is also notable that the
catalyst used by Loacutepez-Nieto was a phase mixture [35]
Figure 128 Reaction steps and nature of active and selective sites in the oxidation of propane to acrylic acid on MoVTeNbOx catalysts [35]
22
Three single-phase M1 catalysts having different elemental compositions MoVOx
MoVTeOx and MoVTeNbOx have been prepared hydrothermally by Ueda et al [34] On
the basis of the catalytic results in propane oxidation it was concluded that
1 crystallinity seems to be necessary for selective oxidation of propane to acrylic
acid
2 the propane molecule is oxidized to propene over surface active sites composed of
octahedrally coordinated Mo and V units located in the unique heptagonal
arrangement of the M1 structure
3 when Te is incorporated into the network the resulting catalyst becomes selective
for the formation of acrylic acid without changing intrinsic oxidation activity of
Mo and V sites
4 Nb prevents the over-oxidation of acrylic acid by its site isolation effect
Without experimental evidence the propane activating property of the M1 phase was
assigned by Grasselli et al to V5+ centers which favor the radical-type H-atom
abstraction leading to a secondary propyl-radical [9 31] The second H-atom abstraction
occurs on the Te4+-center next to the V5+-center The Nb5+-center stabilizes the primary
active centers and separates them spatially from each other The formed olefin
coordinates to the Mo6+-center where the O or N atom is inserted via another H-atom
abstraction on the adjacent Te4+-center of the M2 phase Therefore the M2 phase is
considered to contribute to the selective olefin conversion toward the desired product
Because V5+ centers are not available in M2 phase it cannot activate propane On the
other hand the excellent performance of propylene conversion of the M2 phase is
accounted for the rather high number of α-H-atom abstracting Te4+-sites However the
presence of active centers is not sufficient the catalytic performance depends in a crucial
manner on the surface geometry of the active sites and the redox properties of the
catalyst
Guliants et al has studied the catalytic performance of a nano-crystalline Mo-V-O M1
phase [36] The original Mo-V-O was practically unselective in propane oxidation
however a significant improvement in selectivity was observed when Te- Nb- and Sb-
oxides were supported on the surface at sub-monolayer coverage Low-energy ion
23
scattering (LEIS) study of the submonolayer coverage indicated that Nb species were
preferentially located at the topmost surface while the subsurface Te- and Sb
concentrations declined gradually into the bulk The highest selectivity was observed
when both Nb and Te (or Sb) oxide species were present at the surface In general the
selectivity was comparable to those observed on bulk MoVMOx catalysts (M=Te Nb or
Sb)
Table 125 Activation energy of propane partial oxidation on different surface-promoted catalysts [36]
Promoter EA (kJmol) Promoter EA (kJmol)
none 74 Nb 72
Te 125 Nb+Te 108
Sb 62 Nb+Sb 79
The effect of temperature and space velocity was studied on the conversion selectivity
and yield The apparent activation energies of propane conversion were determined
(Table 125) Interestingly only the inclusion of Sb led to a descrease while promotion
by Te led to a net increase in the apparent activation energy The niobium barely had any
effect on the activation energy The inclusion of Nb besides Te led to a catalyst on which
the apparent activation energy of propane was still considerably higher than for the
unpromoted and the Nb-modified catalyst Even though Nb and Sb promotion alone
decreased slightly the activation energy the simultaneous presence of Nb and Sb led to a
slight increase of the activation energy
Zhu et al modified selectively the V5+V4+ ratio in the MoVTeO catalyst by adjusting the
acidity of the precursor solution [37] The solutions were evaporated and calcined at 873
K in N2 stream to obtain the catalyst XPS measurements suggested that the number of
surface V5+ were preferentially enhanced by addition of pH adjustors in the precursor
solution The high number of surface V5+ sites (5+V=O groups) was claimed to be
responsible for propane activation while the bulk V4+ was suggested to play a significant
role in promoting electron- and oxygen atom transfer during the reaction The authors
24
claimed that the bulk V5+V4+ ratio is also important as higher number of V4+ sites
facilitate the total oxidation while less V4+ sites resulted in a high selectivity to acrolein
1234 The effect of acid-base character of the catalyst
Besides the redox properties of the transition metal oxide catalysts the aciditybasicity
also plays a significant role in the oxidation reactions The ideal surface structure of an
oxide as generated by cutting the crystal at a specific crystal plane is composed by an
array of cations (Lewis acid site) and lattice oxygen anions (basic site) The acidic
character of the cations and the basicity of lattice oxygen depend on the ionic character of
the metal-oxygen bonds [38]
The metal-oxygen bond in oxides of transitional metals with high oxidation state (Mo6+
V5+) is rather covalent thus they are acidic oxides On the other hand the same elements
in the lower oxidation state have more ionic character and they behave as basic oxides
The acid-base characteristics of the oxide have a major effect on the activation of the
reactants the relative rates of the competitive pathways and the rate of
adsorptiondesorption of the reactants and products The relatively weak Lewis acidity is
a key parameter that determines the oxygenate formation The Broslashnsted acidity is
important in propane activation however strong Broslashnsted acidity favors the hydration of
propylene to isopropanol which may be oxidized to acetone and acetic acid Controlling
the LewisBroslashnsted acidity of the catalyst is also connected with the effect of steam on
the catalyst activity In general it is stated that by blocking Broslashnsted acid sites with water
or ammonia the over-oxidation is reduced and favors acrylic acid formation [2 3]
Many attempts to correlate the catalyst activity with the redox and acid-base properties
were reported in the literature Due to the fact that that the redox and acid-base
characteristics are not independent Novakova et al and Centi pointed out that these
correlations are not generally valid [2 3] A careful study of these characteristics on the
individual reaction steps rather than on the global behavior of the whole reacting system
was recommended [3]
25
1235 The effect of steam
The introduction of steam in the feed mixture inhibits the oxidative dehydrogenation of
propane over ZrO2 supported MoOx and VOx catalysts [14-16]
In contrast to that the presence of steam in the feed was noted to be essential for the
formation of acrylic acid from propane over Mo and V based catalysts [26 27 28 39]
Novakova et al noted that the steam content affects on the kinetics of propane oxidation
over a phase mixture MoVNbSbOx catalyst [26] The rate of acrylic and acetic acid
formation increases strongly in the steam content interval between 0 and 20 vol and
the rates leveled off above 20 vol steam content It was also noted that the presence of
steam influences the apparent activation energy of propane consumption At a steam
content of 25 vol a value of 50 kJmol was determined while in dry feed the apparent
activation energy was found to be 68 kJmol It was observed that in absence of steam an
irreversible phase change occurs accompanied by deactivation of the catalyst upon
addition of steam after performing the experiment in dry feed neither the original phase
composition nor the initial catalytic activity was attained It was noted that the
deactivation was a relatively fast process which completed in ca 50 minutes
Griszligtede has carried out a kinetic study on the steam effect on propane oxidation over
MoV033Te025Nb017Ox catalyst deposited on steatite balls [27 28] It was found that in the
presence of 50 vol steam the rate constant of propane consumption increased by a
factor of 24 while the propylene further oxidation rate constant increased by a factor of
44 compared to the experiment performed in dry feed The selectivity to acrylic acid was
only 50 while the oxidative stability (ie the ratio between the formation and further
oxidation rate constants) of acrylic acid was found to be 13 in dry feed Upon introducing
50 vol steam in the feed the selectivity increased to 80 and the oxidative stability
was also improved to 32 Similarly to the results given by Novakova [26] the conversion
and selectivity increased in the steam concentration interval between 0 and 20 vol and
leveled off at concentrations higher than 20 vol The positive effect of the steam on the
productivity was accounted for the faster desorption rate of the product However no
experimental evidence was given for this assumption On the other hand as a second
26
possibility the modification of the phase composition in presence of steam was
highlighted This possibility was speculated based on the observation that the
pretreatment of the catalyst in the reactor using steam containing a gas mixture (50 vol
H2O and 50 vol N2 at 140degC for 24 hours) lead to a better performances (SAA=80)
compared to the experiment in which the reaction was started without pretreatment
When the catalyst was pretreated with a 10 vol steam containing mixture the highest
acrylic acid selectivity was found to be only 40 However the catalyst was not
characterized by XRD either before or after the pretreatment or catalytic experiment in
order to support the assumption concerning the phase change
Dubois et al patented a method for preparation of acrylic acid by selective oxidation of
propane over MoVTe(Sb)Nb(Ta)SiOx catalysts in fluidized bed without steam in the feed
[40] They noted that the presence of steam favored the formation of acetone acetic acid
and propanoic acid however the latter was produced in very small amounts (below 1)
The catalyst activity was not decreased after 24 h on stream in contrast to the
deactivation phenomenon noted by Novakova et al The conversion was below 30 in
all cases while the highest selectivity toward acrylic acid was about 40
Landi et al studied the effect of water on propane oxidation over (VO)2P2O7 catalyst [41-
43] The catalytic testing was started using dry feed at 430degC the acrylic acid selectivity
was very low When stable catalytic operation was reached the temperature was
decreased to 400degC and 20 vol steam was introduced in the feed The propane
conversion decreased in presence of steam while the acrylic acid selectivity increased
compared to the steam free feed Stable operation in steam containing feed was reached
in about 40 hours time on stream Steady-state and dynamic experiments carried out at
different steam contents revealed that the activity and selectivity changed reversibly with
the steam content but stable operation was reached in 6-12 hours time on stream The
propane conversion decreased monotonically with the steam content while the maximum
acrylic acid selectivity was attained at 15 vol steam content
The characterization of the catalyst lead to the conclusion that the presence of steam
27
enhances the crystallinity promotes the disappearance of V5+ containing phase and
reduces the number and strength of surface acid sites
Based on the literature records the possible effect of steam can be summarized as
follows
Physical interaction of water with the catalyst
bull competitively adsorbs with C3H8 and intermediates on the active sites andor blocks
the Lewis acid sites or modifies the ratio of LewisBroslashnsted acidity [3 39 41-45]
bull enhances the desorption of oxygenates [28 39 46-50]
Chemical interaction of water with the catalyst
bull changes the oxidation statecomposition of the M1 MoVTeNbOx catalyst [51]
bull increases the number of Broslashnsted acid sites [46]
bull increases the number of surface hydroxyl groups [14 15 45 52]
bull induces phase change [26 52 53] enhances the crystallinity [41-43 53]
Chemical interaction of water with the adsorbed reaction intermediates
bull the water could act as both a nucleophilic and oxidizing reactant in the formation of
the acrylic acid from the acrolein [3 30]
bull in presence of water different reaction pathways are possible ie the propylene
intermediate may undergo hydration to 2-propanol on the acid sites followed by
oxidation to acetone and acetic acid [3 54]
1236 The effect of redox potential of gas phase and oxygen species
The redox potential of the gas mixture depends on the propaneoxygen ratio Due to the
stoichiometry of the propane to acrylic acid reaction the ratio of 12 is defined as
stoichiometric When the propaneoxygen ratio is smaller than 12 the gas mixture is
28
rather reducing Finally if this ratio is higher than 12 the feed is net oxidizing In the
literature various feed compositions were used from reducing (C3H8O2=6510) [33 34
36] stoichiometric [20 21 51] to strongly oxidizing (C3H8O2 ratio ranging from
08314 to 26974) [47 48] However only a few studies were concentrated on finding
out the effect the redox potential on the catalytic properties
Griszligtede has carried out a kinetic study on the effect of oxygen using the
MoV033Te025Nb017Ox catalyst Only oxidizing feed compositions were used (C3H8O2
equal to 26 29 and 220 vol respectively) [28] The concentration profiles
conversion and selectivities were found to be the same irrespectively on the oxygen
concentration From this observation it was argued that the reaction is 0th order with
respect to oxygen In connection to the steam effect it was also argued that the steam does
not enhance the reoxidation rate becausee of the 0th order kinetics involving the oxygen
Zheng et al studied the effect of oxygen concentration on propane oxidation over
MoV031Te023Nb012Ox catalyst [39] The C3H8O2 ratio was varied from 11 to 15
therefore reducing stoechiometric and net oxidizing feed compositions were used at a
space velocity of 1800 h-1 and 400degC The conversion was steadily increasing with the
oxygen concentration while the selectivity and consequently the yield passed through a
maximum at the C3H8O2 ratio of 13
The selective partial oxidation of alkanes to oxygenates and the oxidative
dehydrogenation reactions as well imply chemical reaction on saturated hydrocarbon
molecules and oxygen species The hydrocarbon molecules possess a closed shell
electronic structure therefore they are in a singlet state The oxygen species activate of
the C-H bonds or eventually the C-C bonds to form the desired product(s) and the COx
respectively The bonding and electronic structure of oxygen species are reviewed here
The oxygen atom has 8 electrons the electron configuration is the following
1s22s22px22py
12pz1 Upon molecule formation the atomic orbital of two oxygen atoms are
hybridized The oxygen molecule in its ground state has an open-shell electronic
structure There is one unpaired electron on each of the πx and πy degenerated
antibonding orbitals The electronic configuration of the oxygen molecule in the ground-
29
state is KK(σ2s)2(σlowast
2s)2(σ2pz)
2(π2px)2(π2py)
2(πlowast2px)
1(πlowast2py)
1 where K denotes the closed
molecular orbital formed by the 1s atomic orbitals
The presence of the unpaired electrons has two consequences (a) the gas phase oxygen in
the ground state is a triplet diradical noted with the term symbol of 3Σ-g
(b) the oxygen molecule is the only paramagnetic species among the diatomic gases with
even number of electrons
The bond order ndash defined as the half of the difference between the number of electrons in
the bonding orbitals and the numbers of electrons that occupy antibonding orbitals ndash is
equal to two [55 56]
Due to spin constraints no reaction happens between a singlet (eg hydrocarbon) and a
triplet species (eg molecular oxygen in ground state) This explains that there is no
reaction between the alkanes and oxygen at low temperatures and without a catalyst
However there are a number of excited or ionized oxygen species which are much more
reactive
Upon excitation of the ground state O2 by 9472 kJmol energy the spin of one of the
unpaired electron on the antibonding π orbital will be inverted leading to a singlet
species 1∆g However the electron configuration and the bond order of the 1∆g is the same
as in the case of the ground state oxygen molecule When the ground state oxygen
molecule is excited by 15785 kJmol the two unpaired electrons are getting paired on
one antibonding π orbital The resulting species is ldquothe other singletrdquo with the term
symbol of 1Σ+g and the same bond order with the first excited state 1∆g and the ground
state 3Σ-g species However the electronic configuration is different from the 1∆g and
3Σ-g
states KK(σ2s)2(σlowast
2s)2(σ2pz)
2(π2px)2(π2py)
2(πlowast2px)
2
In heterogeneous catalysis however the redox catalysts involve ionic oxygen species
which are the following O- and O2- (oxide anion) O2- (superoxide anion) O2
2- (peroxide
anion)
The O- anion contains one more electron then the oxygen atom The electronic
configuration of 1s22s22px22py
22pz1 shows that this species is a mono-radical anion
Because the total electron spin angular momentum is frac12 the degeneracy is equal to 2
This doublet oxygen species gives a single ESR signal without hyperfine splitting
30
The orbitals of the doubly ionized O2- are fully occupied The electronic configuration of
this species is 1s22s22px22py
22pz2 The total electron spin angular momentum is zero
therefore this ion is a singlet species which does not give a signal in the ESR spectrum
The superoxide ion (O2macr) is formed by monoelectronic ionization of the oxygen molecule
the extra electron being located on one of the antibonding π orbitals The electron
configuration of KK(σ2s)2(σlowast
2s)2(σ2pz)
2(π2px)2(π2py)
2(πlowast2px)
2(πlowast2py)
1 displays a mono-
radical feature As a doublet species the superoxide anion gives a single ESR signal
Because the antibonding orbital is more populated compared to the molecular oxygen the
bond order is reduced from 2 to 15
In the peroxide anion (O22-) both antibonding π orbitals are fully occupied which leads to
a bonding order of one
KK(σ2s)2(σlowast
2s)2(σ2pz)
2(π2px)2(π2py)
2(πlowast2px)
2(πlowast2py)
2
Upon population of the antibonding orbitals with electrons the O-O bond length
increases and the bond energy decreases in the O2 O2- and O2
2- series Similarly to the O2-
anion the peroxide anion is a singlet
Since the formation of all these ionic oxygen species is exothermic they are activated
species Upon ionization however the degeneracy also decreases from triplet to doublet
and singlet respectively The reaction between the hydrocarbon and singlet oxygen anion
on the catalyst surface is not spin forbidden anymore therefore the alkane oxidation
reaction may take place at a reasonable temperature
However the reactivity of these species is different and often controls the selectivity of
the process The electrophilic species are represented by O- O2- and O2
2- respectively
They are electron deficient and react with the electron rich regions of the hydrocarbon
molecule such as C=C bonds The nucleophilic O2- anion is often identified as lattice
oxygen Because its orbitals are fully occupied by electrons this species is expected to
react with electron poor regions of the molecule such as C-H bonds [55 57 58]
The selectivity control also depends on the reaction type In the alkane oxidative
dehydrogenation or oxidation to unsaturated aldehydes or acids the selective pathway is
associated to C-H bond activation The attack of electrophilic species on the C=C bond
leads to peroxo-complexes or epoxides which decompose by C-C bond cleavage and
gives total oxidation products Other examples of nucleophilic oxidation are oxidative
31
dehydroisomerization and dehydrocyclization oxidation of alkylaromatics to aldehydes
without aromatic ring rupture ammoxidation oxidation of aldehydes to acids oxidation
of aromatics to anhydrides
On the other hand in the case of electrophilic oxidation reactions the C=C bond
activation is desired because the C-H bond activation by nucleophilic oxygen leads to
unselective pathways Such reactions are the epoxidation oxidation and oxyhydration of
alkenes to saturated ketones oxidation of aromatics to anhydrides and acids with ring
rupture [57 58]
124 Reactor designs operation modes
1241 Conventional laboratory scale reactors
In heterogeneous catalysis different reactor types and designs are employed [59 60] The
most important and frequently used ones are described here
Based on the operation mode two types can be distinguished batch and continuous
reactors The batch reactor is a closed system with a fixed mass of catalyst and volume
of reactant The volume or density of the reacting mixture may change as the reaction
proceeds while the temperature can be kept constant The concentration of reactants and
products change with the reaction time The reaction rate involving the reactant A can be
easily determined from the change of number of moles divided by the volume of the
reactor (Equation 121) If the volume of the reacting mixture is kept constant the
reaction rate is defined as the first order derivative of the concentration with respect to
reaction time
)121 ( 1
Equationdt
dn
Vr AA sdotminus=
The continuous reactors are open systems These can be further classified based on the
flow characteristics in total backmixing reactors (gradientless or continuous flow stirred
tank reactor CSTR) and plug-flow reactors The CSTR consists of a vessel equipped
with an efficient stirrer The reacting mixture flows in with a continuous rate The
32
concentrations are the same in any volume element and any time of the vessel because of
the stirring Moreover the concentrations at the outlet are the same as in the reactor The
difference between the inlet and outlet concentration resembles a step-function For a
system with constant density the reaction rate can be calculated by dividing the
concentration difference by the mean residence time (minus
t ) (Equation 122) The mean
residence time is defined as the reatio between the volume of the reactor and the
volumetric feed flow rate The most important advantage of a CSTR is indeed the fact
that there are no concentration gradients in the catalyst bed the chemical potential is
equal at any volume element of the reactor
)221 ( Equation
t
c
t
ccr AoutletAinletA
A minusminus
∆=
minusminus=
The plug-flow reactor (PFR) consists of a tube which contains the catalyst in the form of
packing or a fixed bed The reacting mixture passes through the reactor tube Two
constraints are to be fulfilled by this type of reactor
bull No axial mixing (ie in the direction of flow) of fluid in the inside of the tube
bull Complete radial mixing (ie perpendicular to the direction of flow) of fluid in the
reactor tube
When the reactor is operated in steady-state and there is no or negligible change of the
density the reaction rate is the first derivative of the concentration with respect to the
contact time (τ ) (Equation 123)
)321 ( Equationd
dcr AA τ
minus=
The most widely employed reactor type for laboratory-scale experiments in
heterogeneous catalysis is the PFR Using this reactor permits testing for screening the
best performing catalyst in a given series More importantly the study of the effect of
33
operation variables (initial concentration of reactants reaction temperature and contact
time) for kinetic purposes
Two different regimes are distinguished
bull Differential regime when the reactor is operated at low educt conversion This
can be determined experimentally by plotting the conversion of the educt against
the contact time The upper limit of the conversion for the differential regime is
that point where the plot deviates from linearity The educt consumption rate can
be determined from the slope of the concentration ndash contact time plot for the
differential regime
bull Integral regime when the reactor is operated at high conversions The integral
regime extends between the upper conversion limit of the differential regime and
full conversion
For industrial applications the maximum performance is usually attained in the integral
regime For this purpose it is often not enough to carry out experiments only in the
differential regime However strictly speaking the reaction rates can be defined only for
the differential regime Therefore kinetic modeling is needed to fit the curves with
integrated rate equations derived from a proposed reaction network The fitting
parameters are the rate constants which do not depend on the extent of the reaction
1242 Catalytic membrane- and multi-stage reactor designs
In partial oxidation reactions the high yield for the desired product is often difficult to
achieve because the intermediate(s) and the product are thermodynamically less stable
than the educt In those cases when the intermediate(s) and product are oxidatively not
stable over a given catalyst the excess of oxygen in the feed favors the total oxidation
which results in low productivity [39 61] For this reasons different reactor designs
(such as catalytic membrane- and multi-tubular reactors) were applied for the dosing of
the oxidant to avoid high oxygen concentrations and to change the local kinetics along
the reactor tube
34
The catalytic membrane reactor is a tubular reactor but the tube is made of a semi-
permeable membrane instead of quartz or metal The reactant is fed in the tube like in the
case of a conventional fixed bed reactor while the oxidant is fed through the membrane
The membrane acts as a distributor of the oxygen along the catalytic bed Therefore the
local oxygen concentration is lower than in the case of the conventional plug-flow
reactor The local oxygen concentration influences the local reaction rate also the rate of
total combustion By changing the local oxygen concentrations a better performance may
be achieved in the catalytic membrane reactor compared to the conventional reactor
designs [61]
However it is to be noted that complete radial mixing is needed in order to avoid the
radial concentration gradients Otherwise high oxygen concentrations at around the walls
of the reactor which would favor total oxidation while in the middle of the reactor tube
the mixture would be rather reducing
Figure129 The flow rate (left) and concentration distribution of oxygen (right) in the catalytic membrane reactor without reaction taking place The blue and green curves correspond to different reactor geometries
(aspect ratios) The profile corresponding to fixed bed reactor (FBR) is indicated by orange line [61]
In contrast to the plug flow reactors operated in steady-state the feed total flow rate
increases along the catalytic bed (Figure 129) Therefore the space velocity also
increases along the tube Without catalytic reaction taking place the oxygen
concentration also increases along the reactor tube [61]
35
Some examples of applications of such reactor designs are briefly reviewed below
Oyama et al employed a catalytic membrane reactor for the epoxidation of propylene in
presence of hydrogen over AuTS-1 catalyst In this reactor the formation rate of
propylene epoxide could by improved by 100-200 compared to the conventional fixed
bed reactor [62] This is due to the fact that high oxygen concentrations could be used in
the catalytic membrane reactor which are not accessible in a conventional reactor for
safety reasons
Campanelli et al studied the oxidative dehydrogenation of propane over VOxγ-Al2O3
and VOxZSM-5 in catalytic membrane reactor The performance of this reaction was
found to be higher than the conventional fixed bed reactor [63 64]
The reactor system developed by Hamel et al is a combination between the multi-stage
reactors and catalytic membrane reactors Three catalytic membrane reactors were
connected in series In this arrangement increasing decreasing and constant oxygen
concentrations were achievable along the reactor cascade as well as different
temperatures in the different reactor units [61]
Figure 1210 (a) Selectivity of propylene vs propane conversion (b) selectivity of propylene vs temperature Conditions xC3H8
in=1 O2C3H8=1 and WHSV=100 and 400 kgsm3 [61]
36
The ethane and propane oxidative dehydrogenation was performed in this system using
VOxγ-Al2O3 catalyst The catalytic results from the membrane (MR) reactor were better
compared to the experiments carried out in a conventional fixed bed (FB) reactor almost
under any conditions (Figure 1210)
OacuteNeill et al used a dual-bed membrane reactor as oxygen distributor for the oxidation of
propane to acrolein [65] The first bed contained propane oxidative dehydrogenation
catalyst (05 g V2O5MgO at a reaction temperature of 500degC while the second bed
consisted of bismuth-molybdate for the further oxidation of propylene to acrolein
produced in the first reactor tube (20g at a reaction temperature of 475degC)
Catalytic studies were conducted with both catalysts separately then in the dual-bed
configuration In these separated experiments the maximum selectivity to propylene and
acrolein was observed for stoichiometric feed while the selectivity declined in both cases
when oxygen excess was used The dual bed experiments were performed under the
optimal conditions determined in the single-bed separated catalytic membrane reactors
Using the dual bed configuration the selectivity to acrolein could be improved by 21
compared to the experiment when the catalytic membrane reactors were used separated
However it was also found that the separate membrane reactor performance was only
marginally higher (by a few ) compared to the conventional fixed bed reactor
Fang et al used a modified fixed bed reactor design equipped with an oxygen distributor
tube [66] The reactor setup permitted experiments with a single- as well as dual catalytic
bed The reacting mixture was fed at the top of the reactor and in the dual bed operation
mode additional oxygen was supplied through the distributor tube which ended up
between the two catalyst beds NiZrOx catalyst was used for oxidative dehydrogenation
of propane while in the second bed cobalt containing bismuth molybdate catalyst was
used for oxidation of propylene to acrylic acid Both of these catalysts showed low
activity in a single-bed arrangement the conversion over NiZrOx catalyst was below 10
and selectivity around 2 while on the modified bismuth molybdate catalyst the
conversion and acrylic acid selectivity were below 1 at the temperature of 380degC The
37
combination of the catalyst beds lead to a conversion of about 10 while the selectivity
was around 25 The addition of oxygen via the distributor tube increased significantly
the yield of acrylic acid to about 12
Summarizing the advantages of catalytic membrane and multi-tubular reactors it can be
stated that
bull These systems permit the variation of the local concentration of the oxidant The
local concentration has a direct effect on the local kinetics and reaction rate thus
the total oxidation may be prevented
bull Different amounts of catalysts may be loaded in the individual reactor tubes
Therefore different contact times are achievable in the reactor tubes The contact
time in each reactor can also be an operational variable in these systems
bull The temperature of each reactor tube can be set individually which is important if
the product is oxidatively unstable
As shown by the above presented examples the optimization of the additional
operational variables in catalytic membrane and multi-tubular reactors the performance
may be improved compared to the conventional reactor systems used for basic research
125 Reaction kinetics
The heterogeneously catalyzed reactions consist of 7 serial steps as follows [67]
bull Diffusion of the reactant species in the fluid phase towards the surface of the solid
catalyst
bull Internal diffusion of the reactant in the pores of the catalyst particle
bull Adsorption of the reactant molecule on the surface
bull Chemical transformation of the reactant into product
38
bull Desorption of the product
bull Diffusion of the products in the pores of the catalyst
bull Diffusion of the product towards the fluid phase
The first two and the last two steps are transport phenomena and as such physical
phenomena The reaction conditions and operation mode can be chosen in such a way
that the mass transport does not limit the chemical reaction on the surface
The reaction mechanism is ultimately the set of elementary steps which explains how the
bonds are split and formed during the chemical transformation However besides the
description of all elementary reactions the postulated reaction mechanism should contain
information concerning the chemical and electronic structures of the transition state for
each elementary step [75] In applied heterogeneous catalysis such a description is
seldom achieved even though in many literature sources the elucidation of reaction
mechanism is claimed
13 Motivation
Upon reviewing the literature about the selective oxidation of propane to acrylic acid on
Mo and V based mixed oxides it was found that predominantly the studies were
performed using phase mixture catalysts The understanding of the role of the individual
phases and active sites in the propane oxidation reaction is still under debate [2 9 29 34
36 70-72] in spite of the claims given by Grasselli et al [31] and Loacutepez-Nieto et al [35]
Their conclusions were assigned based on disproportionately few catalytic and kinetic
data compared to the structural characterization data
In contrast to this very limited information exists about the catalytic properties of phase-
pure materials in propane oxidation reaction Furthermore the following open questions
and conflicting conclusions were identified
bull The bulk structural stability of the MoVTeNbOx catalyst under various conditions
(dry reducing stoichiometric and oxidizing feed) was not evidenced [27 28] On
the other hand it was reported that the phase composition of the not phase pure
39
MoVSbNbOx catalyst is irreversibly altered when exposing to dry feed
conditions accompanied by the irreversible drop of the catalytic performance
bull The detailed kinetic study of the operational variables (reaction temperature
steam content redox potential) was not described on a phase-pure M1
MoVTeNbOx catalyst
bull The reaction pathways are under debate The early versions were proposed mainly
based on thermodynamic considerations [4 12] and a very limited number of
integral catalytic data [2 12 22 30 47 48] but only very few systematic kinetic
studies were carried out Typically these studies were performed using phase
mixture catalysts [24-28 73 74]
bull The common feature of the proposed pathways is that the total oxidation product
(CO and CO2) formation is either not explained at all [12 24 35] or they are
merged together as COx=CO+CO2 produced by the total oxidation of acrylic and
acetic acids [2 4 22 24 25 47 48 71 74] Lintz et al and Fushimi et al
continued the simplification by merging the CO CO2 and acetic acid under a
three carbon atom containing pseudo-byproduct [27 28 30 71] The mechanism
proposed by Grasselli et al does not explain at all the formation of these
byproducts [9 31 35 70] However a postulated mechanism should contain all
the contributing elementary reactions as well as the description of electronic and
chemical structures of the transition state for each elementary reaction [75]
The experimental work presented this thesis is centered around the kinetic study of
propane selective oxidation to acrylic acid on MoVTeNbOx catalyst Due to the fact that
the role of the individual phases is not yet fully understood a phase-pure MoVTeNbOx
catalyst was used The experiments were designed to answer some of the above outlined
open questions
bull The bulk structural stability of the phase-pure M1 MoVTeNbOx catalyst under
real reaction conditions (T=400degC and GHSV=5000 h-1 whereby maximum
acrylic acid selectivity is attained in fixed bed reactor) was addressed in an in situ
XRD experiment The steam content and redox potential was varied during this
experiment the conditions covered steam containing- dry- stoichiometric-
40
oxidizing- reducing- and strongly reducing (C3H8 in N2) feed compositions
respectively
bull The kinetic study on the temperature steam- and oxygen concentration was
carried out in a conventional fixed bed reactor The oxidation of the intermediates
(propylene and acrolein) was also carried out in the temperature interval
corresponding to the propane oxidation in order to determine the relative
reactivities For unraveling the source of CO2 in the C3H8 and C3H6 and acrolein
oxidation reactions (ie is CO2 produced from the total oxidation of the organics
or the further oxidation of CO) a separate CO oxidation and water gas shift
reaction was envisaged
bull A two-stage reactor design was employed for the stage-wise addition of the
oxidant (O2 and N2O) reducing gases (C3H6 CO) and the thermodynamically
stable end product (CO2) The O2 addition was performed in order to check
whether the multi-stage arrangement improves the catalytic performance similarly
to the literature sources In the literature the nitrous oxide was reported to be an
alternative and more efficient oxidant than molecular oxygen in ODH reactions
[77 78] Therefore the potential applicability of this oxidant was also checked in
the two-stage reactor system The addition of C3H6 CO and CO2 was performed
in order to observe whether these products competitively adsorb on the active
sites of the catalyst or not
bull The product distribution analysis corresponding to the propane oxidation and the
catalytic data obtained for propylene acrolein and CO oxidation reactions in both
the single-tube and the two-stage reactor setups are considered in the proposed
reaction network [76]
References Chapter 1
1 J P Lange Economics of alkane conversion Chapter 3 in E G Derouane et al (Eds) Sustainable strategies for the upgrading of natural gas fundamentals challenges and opportunities Springer 2005 51-83
2 EK Novakova V C Veacutedrine Propane Selective Oxidation to Propene and Oxygenates on Metal Oxides in JLG Fierro Metal Oxides Chemistry and Applications CRC Press 2006 414-455
41
3 G Centi F Cavani F Cavani F Trifiro Selective Oxidation by Heterogeneous Catalysis Kluwer AcademicPlenum Publishers 2001 363-384
4 M M Lin Appl Catal A 207 (2001) 1ndash16 5 wwwiciscom retrieved on 02032011 6 wwwoilnergycom retrieved on 02032011 7 RK Grasselli JD Burrington Adv Catal 30 (1981) 133 8 JD Burrington CT Kartisek RK Grasselli J Catal 81 (1983) 489 9 RK Grasselli JD Burrington DJ Buttrey P DeSanto Jt CG Lugmair AF
Volpe Jr T Weingand Topics in Catal 23 (2003) 5 10 RK Grasselli Topics in Catal 15 (2001) 93 11 M Egishara K Matsuo S Kawaga T Seiyama J Catal 58 (1979) 409 12 M M Bettahar G Costentin L Savary J C Lavalley Appl Catal A 145
(1996) 1-48 13 Y H Jang W A Goddard III J Phys Chem B 106 (2002) 5997-6013 14 K Chen A T Bell and E Iglesia J Phys Chem B 104 (2000) 1292-1299 15 K Chen E Iglesia A T Bell J Phys Chem B 105 (2001) 646-653 16 K Chen A Khodakov J Yang A T Bell E Iglesia J Catal 186 (1999) 325-
333 17 B Y Jibril Int J Chem Kinet 38 (2003) 176-183 18 G Fu X Xu X Lu and H Wan J Phys Chem B 109 (2005) 6416-6421 19 NN Greenwood A Earnshaw Chemistry of the Elements 2nd Edition
Butterworth Heinemann 1997 981-987 1007-1017 20 T Ushikubo H Nakamura Y Koyasu S Wajiki US Patent 5 380 933 (1995) to
Mitsubishi Kasei Corporation 21 T Ushikubo I Sawaki K Oshima K Inumaru S Kobayakawa K Kiyono US
Patent 5 422 328 (1995) to Mitsubishi Kasei Corporation 22 M Lin T B Desai F W Kaiser P D Klugherz Catal Today 61 (2000) 223ndash
229 23 D Vitry Y Morikawa JL Dubois W Ueda Applied Catalysis A General 251
(2003) 411ndash424 24 L Luo JA Labinger ME Davis J Catal 200 (2001) 222ndash231 25 EK Novakova JC Vedrine EG Derouane J Catal 211 (2002) 235-243 26 EK Novakova JC Vedrine EG Derouane Catal Lett 83 (2002) 177 27 E Balcells F Borgmeier I Griszligtede H-G Lintz F Rosowski Appl Catal A
266 (2004) 211-221 28 I Griszligtede Die partielle Oxidation von Propan zu Acrlysaumlure Bestimmung der
Reaktionskinetik und in-situ Charakterisierung des Katalysators unter Betriebsbedingungen Dissertation Universitaumlt Karlsruhe 2004 Universitaumltsverlag Karlsruhe ISBN 3-937300-17-1
29 P Concepcion P Botella J M Lopez Nieto App Catal A 278 (2004) 45ndash56 30 R Fushimi S O Shekhtman A Gaffney S Han G S Yablonsky J T
Gleaves Ind Eng Chem Res 44 (2005) 6310-6319 31 R K Grasselli D J Buttrey J D Burrington A Andersson J Holmberg W
Ueda J Kubo C G Lugmair A F Volpe Top Catal 38 (2006) 7-16 32 P DeSanto D J Buttrey R K Grasselli C G Lugmair A F Volpe Jr B H
Toby T Vogt Z Kristallogr 219 (2004) 152-165
42
33 M Baca A Pigamo JL Dubois and JMM Millet Top Catal 23 (2003) 39-46
34 WUeda DVitry T Katou Catal Today 96 (2004) 235ndash240 35 P Botella J M Loacutepez-Nieto B Solsona A Mifsud and F Maacuterquez J Catal
209 (2002) 445-455 36 V V Guliants R Bhandari B SwaminathanV K Vasudevan J Phys Chem
B 109 (2005) 24046-24055 37 Y Zhu W Lu H Li H Wan J Catal 246 (2007) 382-389 38 G Busca Phys Chem Chem Phys 1 (1999) 723-736 39 W Zheng Z Yu P Zhang H Fu X Zhang Q Sun X Hu J Natural Gas
Chem 17 (2008) 191-194 40 J L Dubois D Garrait A Le Gall G Bazin S Serreau FR patent WO
2006072682 A1 2006 41 G Landi L Lisi J C Volta Chem Commun 9 4 (2003) 492-493 42 G Landi L Lisi J-C Volta J Mol Catal A 222 (2004) 175-181 43 G Landi L Lisi J C Volta Catal Today 91-92 (2004) 275-279 44 TV Andrushkevich CatalRev Sci Eng 35 (1993) 213-259 45 E M Erenburg T V Andrushkevich G Ya Popova A A Davidov V M
Bondareva React Kinet Catal Lett 12 1 (1979) 5-11 46 EM Erenburg T V Andrushkevich V I Bibin Kinet Catal 20 3 (1979) 680 47 M Ai J Catal 101 (1986) 389 48 M Ai Catal Today 42 (1998) 297 49 A C Kaddouri C Mazzochia E Tempesti Appl Catal A 180 (1999) 271 50 J Barrault C Batiot L Magaud M Ganne Stud Surf Sci Catal 110 (1997)
375 51 A C Sanfiz T W Hansen D Teschner P Schnorch F Girgsdies A
Trunschke R Schlogl M H Looi S B A Hamid J Phys Chem C 114 4 (2010) 1912-1921
52 J C Vedrine J M M Millet J C Volta Catal Today 32 1-4 (1996) 115-123 53 R Recknagel Chemische Technik 46 6 (1994) 324-331 54 Moro-oka Appl Catal A General 181 (1999) 323-329 55 Z Sojka E Giamello M C Paganini Radicals in Catalysis ndash Heterogeneous in
I T Horvaacuteth (Ed) Encyclopedia of Catalysis Vol 5 Wiley-Interscience 2003 738-768
56 NN Greenwood A Earnshaw Chemistry of the Elements 2nd Edition Butterworth Heinemann 1997 [13] P Mars D W Krevelen Chem Eng Sci 3 1954 41
57 S T Oyama Factors affecting selectivity in catalytic partial oxidation and combustion reactions in B KWarren S T Oyama (Eds) Heterogeneous Hydrocarbon Oxidation ACS Symposium Series 638 2-20 J Haber Selectivity in heterogeneous catalytic oxidation of hydrocarbons B KWarren S T Oyama (Eds) Heterogeneous Hydrocarbon Oxidation ACS Symposium Series 638 20-36
58 J Haber Selective oxidation ndash Heterogeneous in I T Horvaacuteth (Ed) Encyclopedia of Catalysis Vol 6 Wiley-Interscience 2003 141-187
43
59 R W Missen Ch A Mims B A Saville Introduction to Chemical Reaction Engineering and Kinetics John Wiley and Sons 1999 25-41
60 J M Berty Experiments in catalytic reaction engineering Studies in surface science and catalysis Vol 124 Elsevier 1999 29-45
61 C Hamel Aacute Toacuteta F Klose F Tsotsas A Seidel-Morgenstern Chem Eng Res and Design 86 (2008) 753-764
62 ST Oyama X Zhang J Lu Y Gu T Fujitani J Catal 257 (2008) 1-4 63 A Bottino G Campanelli A Comite J Membr Sci 197 1-2 (2002) 75-88 64 G Campanelli E Carosini F Cavani O Monticelli F Trifiro Chem Eng Sci
51 10 (1996) 1817-1826 65 C Oacute Neill E E Wolf Catal Today 156 (2010) 124-131 66 W Fang Q J Ge J F Yu H Y Xu Ind Eng Chem Res 50 4 (2011) 1962-
1967 67 J B Butt Reaction kinetics and reactor design Chapter 7 Chapter 1 Marcel
Dekker 2000 1-104 457-571 68 R A van Santen J W Niemantsverdriet Chemical kinetics and catalysis
Fundamental and Applied Catalysis Plenum Press 1995 Chapter 2 21-66 69 N A Bhore M T Klein K Bishoff Ind Eng Chem Res 29 (1990) 313-316 70 R K Grasselli C G Lugmair A F Volpe Top Catal 50 (2008) 66-73 71 H-G Lintz S P Muumlller Appl Catal A General 357 (2009) 178-183 72 R Schloumlgl Top Catal 54 (2011) 627-638 73 Lin Luo PhD Thesis California Institute of Technology Pasadena California
2001 74 F N Naraschewski A Jentys J A Lercher Top Catal 54 (2011) 639-649 75 K A Connors Chemical kinetics VCH Publishers 1990 1-10 76 R Naumann d`Alnoncourt L I Csepei Yu V Kolen`ko A Trunschke R
Schloumlgl manuscript in preparation 77 E V Kondratenko M Cherian M Baerns D Su R Schloumlgl X Wang I E
Wachs J Catal 234 (2005) 131ndash142 78 E V Kondratenko A Bruumlckner J Catal 274 (2010) 111ndash116
44
Chapter 2 Experimental methods
21 Physico-chemical characterization of the catalysts
In this section those methods are described which were employed to characterize the
catalyst Routine measurements (determination of the surface area recording the X-ray
diffractogram for checking the phase purity imaging by SEMTEM and elemental
analysis by EDX) were done for each sample while XPS and microcalorimetric
experiments on the adsorption of propane was performed for selected samples
211 Nitrogen physisorption
The nitrogen physisorption was carried out on a Quantachrome 6B setup at -196deg C Prior
to the measurement an outgassing procedure was performed at 150degC for 2 hours The
specific surface area was calculated using the multipoint Brunauer-Emmett-Teller
method applied to the data collected in the relative pressure interval between 005 and 03
of the adsorption isotherms The total pore volume was estimated from the volume of the
physisorbed nitrogen at the relative pressure of 095
212 X-Ray Diffraction
The powder X-ray diffraction patterns were recorded using a Stoe STADI-P transmission
diffractometer and a Bruker D8 ADVANCED diffractometer both equipped with a Cu
Kα1 radiation source
The in-situ XRD study was performed using the Bruker D8 ADVANCED diffractometer
The gas mixture of propane oxygen and helium was supplied by mass flow controllers
and while a bubbler connected to a HAAKEreg thermostat was employed for introducing
the steam Catalytic reaction was carried out at a temperature of 400degC the reaction was
followed by an on-line mass spectrometer
45
213 Scanning Electron Microscopy (SEMEDX) and Scanning Transmission
Electron Microscopy (STEM)
The SEM-EDX analysis was performed using a Hitachi S-4800 scanning electron
microscope operated at 10 kV accelerating voltage The STEM measurement was done in
Titan CS 80-300 TEM setup operated at 300 kV The spatial resolution was ca 13 Aring
214 X-Ray Photoelectron Spectroscopy (XPS)
The XPS experiments were carried out using the monochromatic radiation of the ISISS
(Innovative Station for In Situ Spectroscopy) at the synchrotron facility BESSY II of the
Helmholtz Zentrum Berlin The measurements were carried out at a pressure of 025
mbar oxygen in order to avoid reduction of tellurium The core level spectra of O 1s V
2p Mo 3d Te 3d Nb 3d and C 1s were recorded at 150 eV constant kinetic energy of the
incident photon beam This corresponded to the inelastic mean free path of approximately
06 nm therefore the setup was operated in the surface sensitive mode The
normalization of the spectra was done with respect to the storage ring current and the
incident photon flux determined by using a gold foil The data analysis was done in
CASA software using Shirley baseline subtraction
215 Microcalorimetry
The differential heats of adsorption were determined using an MS70 Calvet Calorimeter
(SETRAM) Details about the experimental setup consisting of the gas dosing system
calorimeter and the custom-designed high-vacuum system were described in detail before
[1] The catalyst sample was investigated in the same sieve fraction as used for the
catalytic experiments (250-355 microm) The pretreatment of the sample prior to the
calorimetric experiment was performed in vacuum (at 310-8 mbar) at 150degC The
propane and propylene adsorption experiment was performed at 40degC The pressure
change and the heat signal were recorded at every dosing step of the probe molecules
The adsorption isotherm was derived from the dosed amount of probe molecule and the
46
equilibrium pressure The signal area was converted into heat by means of the calibration
factor of the calorimeter determined in advance The heat was divided by the number of
molecules adsorbed in the respective dosing step [2]
22 The experimental setup for propane oxidation
For catalytic and kinetic experiments a home built fixed bed reactor system was used
(Figure 221) The propane oxidation setup (denominated as PropOx 1) consisted of
three modules
bull Gas dosing system
bull Reactor system
bull On-line gas analytics
In the following sections the design features and details of the modules are given
221 The gas dosing system
On Figure 221 the scheme of the reactor system is shown The gas dosing system
consisted of 3+2 mass flow controllers (MFC) as follows
bull O2 ( Bronkhorst type EL-FLOW max flow rate 5 mlnmin)
bull C3H8 (Bronkhorst type EL-FLOW max flow rate 25 mlnmin)
bull N2 (Bronkhorst type EL-FLOW max flow rate 70 mlnmin)
bull N2 (Bronkhorst type EL-FLOW max flow rate 100 mlnmin) This was used in
the steam content variation experiment when the feed was switched from steam
containing feed to dry feed Additionally this flow controller was used for the
purging of the second reactor tube with a mixture of N2+H2O when the two-stage
reactor system was operated in a single-tube mode
bull O2 (Bronkhorst type EL-FLOW max flow rate 5 mlnmin not shown on Figure
221) this was used for the addition of oxygen and other gases (C3H6 N2O CO
CO2) in the two-stage reactor system The two-stage reactor system is described
in section 223
47
For the study on the effect of steam it was necessary to vary the steam content between
40 and 0 vol The steam was introduced via a syringe pump (Harvard Apparatus Model
22 with a double syringe holder) equipped with a 50 ml gas tight syringe made of quartz
(provided by Hamilton) and an evaporator The home-built evaporator was a stainless
steel vessel surrounded by a heater (nominal power of 600W) heated up to 97degC The
cavity of the vessel was filled up with SiC (particle size between 200 and 400 microns)
The liquid water entered the vessel through a 116 inch size tubing Nitrogen was used as
carrier gas for steam through the evaporator Even though the evaporation temperature
was experimentally optimized oscillations in the steam concentration were noticed
which induced oscillations in the concentration of all the other components Therefore a
Swagelok stainless steel pressure vessel of 150 ml was installed in the heated oven as a
buffer volume in order to minimize the fluctuations of the concentrations
Fig 221 The experimental setup denominated as PropOx-1
O2
C3H8
N2
N2
PC GC MS
vent
Filter
Filter
Buffer
PI
MFC
MFC
MFC
MFC
Syringe pump TIC
Flow bus
48
A Swagelok four-way valve installed in the heated oven permitted to switch immediately
between a steam containing feed and dry feed and back When the four way valve was in
the position indicated by Figure 221 the N2+steam mixture was added to the C3H8+O2
mixture On the other hand when the valve was turned in the other position pure
nitrogen was added to the C3H8+O2 mixture for the experiments carried out under steam
free conditions The N2+steam mixture was produced continuously but it was purged by
the valve to the vent
For re-measuring the catalytic properties with the steam containing feed the four way
valve was turned back in the position indicated by Figure 221
The necessity of above described arrangement and procedure is due to the fact that the
replacement of the steam containing feed by dry feed by switching off the syringe pump
is not fast enough Both the evaporator and the pressure vessel has a relatively large
volume and it would have taken more than an hour to replace the steam containing feed
by dry feed and vice versa However by using this valve system the time resolution of
the measurement on the steam effect was reduced to the time resolution of the analytical
setup (ca 17 min) permitting to observe if the catalyst is deactivating fast or not in
absence of steam
A Swagelok filter (2 microns) was installed between the T-junction where the N2+steam
and the C3H8+O2 mixtures were unified in order to ensure complete mixing
The 4 way valve buffer volume the reactor tube and the gas lines were housed in a
Heraeus oven heated up to 140degC The transfer line between the oven and the heated oven
and the analytical setup was heated to the same temperature by means of heating tapes
222 Reactor tube characteristics
A quartz tube was used as reactor with an outer diameter of 97 mm and inner diameter of
68 mm The reactor tube was surrounded by a tubular heating cartridge (Figure 221)
and placed in the heated oven The oven was heated up to 140degC in order to avoid
condensation of the steam and reaction products (acrylic acid and acetic acid)
49
For finding out the isothermal zone of the reactor the oven was heated up to 140degC
while the temperature of the reactor heating cartridge was set to 400degC A gas mixture
containing 40 vol steam and 60 vol N2 was flown through the empty reactor with a
flow rate of 50 mlnmin The thermocouple was moved by 05-10 cm along the tube
from bottom towards the top and the temperature was measured at each position The
temperature profile is given in Figure 222 A plateau is observed between 8 and 13 cm
of the reactor length For a better estimation a standard deviation of less than 1degC was
considered as an objective criterion for the length of the isothermal zone
The isothermal zone started at 85 cm and ended at 125 cm therefore the length is 4 cm
Within this zone the average temperature was found to be 4001degC with a standard
deviation of 07degC and a confidence interval of 02degC The absolute difference between
the maximum and minimum temperatures (∆T=Tmax-Tmin) was 15degC within this interval
The difference of Tmax-Taverage was 07degC which is in good agreement with the standard
deviation of the temperature profile curve in the isothermal zone Therefore it can be
stated that the catalytic reaction was carried out under isothermal conditions
An isothermal volume of 145 ml was calculated from the inner diameter of the reactor
tube and the length of the isothermal zone This was the maximum volume of the catalyst
which could be loaded in the isothermal zone
240 260 280 300 320 340 360 380 400 420
0
2
4
6
8
10
12
14
16
d (cm)
T(degC)
Figure 222 The temperature profile of the reactor tube Zero centimeter corresponds to the
bottom of the heating cartridge The delimitation of the isothermal zone is marked by blue lines
50
The catalyst was used as a sieve fraction between dpmin=250 and dpmax=355 microns The
ratio between the reactor diameter (dr) length of the isothermal zone (Lisoth) and the
particle size are given by the equation 221-223 The ratio between the reactor diameter
and particle size should be at least 10 (Equation 221) The length of the isothermal zone
should exceed at least 50 times the particle size (Equation 222) The dimensionless
criterion concerning the reactor geometry is that the length of the isothermal zone should
be at least 5 times larger than the diameter The numerical values of these ratios exceed
the minimum criteria (Equations 221-223) therefore no axial diffusion (back-mixing)
no radial gradient in concentrations temperature and reaction rate occurs [3]
223)(Equation 9586
40
222)(Equation 01602500
40 7112
3550
40
221)(Equation 2272500
86 219
3550
86
min
max
minmax
==
====
====
r
isoth
p
isoth
p
isoth
p
r
p
r
d
L
d
L
d
L
d
d
d
d
In order to avoid hot-spots or temperature gradient formation the catalyst was mixed
with SiC (particle size between 315 and 400 microns) prior to filling in the reactor tube
Usually 025-030 ml catalyst was mixed up with 115-12 ml SiC This corresponds to a
dilution ratio between 38 and 48 The SiC does not only act as a diluent between the
catalyst particles but also improves the reaction heat transfer The heat conductivity of
SiC is 2-3 order of magnitude higher compared to the heat conductivity of molybdenum
and vanadium based oxides (λSiC=12-25 WcmmiddotK [4] λMoVOx=25middot10-3 WcmK [5])
A slightly different SiC sieve fraction was used (315-400 microm) compared to the catalyst
particle size (250-355 microm) in order to facilitate the separation of the catalyst after
catalytic experiment When the loading was taken out from the reactor the solid mixture
was sieved using a 315 micron sieve The catalyst particles between 250 and 315 micron
fell in the collection plate while the catalyst particles and SiC above 315 microns
remained in the sieve The collected catalyst was not always free of small fraction of SiC
51
(less than 1) Therefore sometimes the post-catalytic XRD patterns contained
reflections of SiC as well
The loading of the reactor was performed according to the following procedure a quartz
wool plug was inserted in the tube to the lower end of the isothermal zone Then the
catalyst and SiC physical mixture was poured in the tube using a glass funnel to a level
which was 2 mm below the upper end of the isothermal zone At the end ca 2 mm of
SiC layer was added to the top of the bed The reactor tube was inserted in the heating
cartridge A K-type thermocouple that measured the temperature in the catalytic bed was
fixed in such a way that it touched only the SiC on the top Therefore this arrangement
permitted to avoid cross contamination of one catalytic bed to another by the particles
which eventually might stick to the surface of the thermocouple
For the downstream tubing and transfer line between the reactor and the analytical setup
a PEEK tubing was used which is chemically more inert than stainless steel The
employment of PEEK was necessary in order to minimize the adsorption of products and
polymerization of acrylic acid on the walls of the tubing On the downstream tubing from
the reactor a second filter (Swagelok 2 micron) was installed in order to prevent the
solid particles to enter into the valve system andor columns of the analytical setup
223 Estimation of the Weisz-number and the Thiele modulus and effectiveness
factor
For the estimation of whether mass transport limitation plays a role in the reaction the
Weisz-number (Ψ) and the Thiele modulus (Φ) was calculated according to the
equations
)622 ( tanh
)522 (
)422 ( 2
1
183
083
832
Equation
EquationD
ckL
EquationcD
rnL
eff
n
sHCc
HCeff
catHC
c
Φ
Φ=
sdotsdot=Φ
sdot
sdotsdot
+sdot=Ψ
minus
η
ρ
52
Since the propane oxidation reaction was found to be first order with respect to propane
(n=1 see section 423) the (n+1)2 term becomes equal to one Similarly the term
involving the surface concentration of propane on the (n-1)th power becomes equal to one
in the equation 225 for n=1
The characteristic length (Lc) was calculated from the particle diameter assuming
spherical particles The catalyst density (ρcat) of 112 gml was determined by weighting
10 ml sieve fraction The effective diffusion coefficient of propane (Deff=0018 cm2s)
was taken from [6] The integral reaction rate of propane consumption was calculated at
the highest reaction temperature of 400degC The rate constant of propane consumption
(kC3H8=0870 gsml at 400degC) was determined from the fitting of the rate equation to the
experimental data points (section 65) Finally the effectiveness factor (η) was calculated
according to the equation 226 Because the particle size was between 250 and 355
microns the values were calculated for both extremes (Table 221)
Table221 The Ψ Φ and η dimensionless numbers corresponding to propane oxidation reaction
Dimensionless number dp=250 mm dp=355 mm
Ψ 005 010
Φ 029 041
η 097 095
As it is demonstrated by Table 221 the Weisz-number and Thiele modulus are below
one The effectiveness factor (the ratio between the actual rate and the highest possible
rate) approaches one Therefore it can be concluded that the pore diffusion is negligible
and the reaction rate is kinetically controlled
224 The two stage reactor system
A reactor cascade consisting of two reactor tubes with identical diameter was
constructed These were equipped with the same type of heating cartridge The isothermal
zone was determined also for the second reactor tube according to the previoulsy
described procedure (section 222)
53
The reactor tubes were connected in series according to the Figure 223 In order to
permit experiments in one reactor tube only a six port valve was used for the connection
of the tubes
When the position of the six port valve was according to the left side of Figure 223 the
feed mixture was flowing only through the reactor 1 The gas mixture which was leaving
this reactor is transferred to the analytical setup (indicated by green lines) Therefore this
corresponds to a single-tube reactor operation mode In the meantime the second reactor
was purged continuously with a mixture of steam and nitrogen using the second nitrogen
line and the second syringe of the syringe pump
R1
Feed
mix
GC-
MS
N2
+H2O
vent
R2
O2
R1
Feed
mix
GC-
MS
N2
+H2O
vent
R2
O2
Feed
mix
GC-
MS
N2
+H2O
vent
R1 R2
O2
Feed
mix
GC-
MS
N2
+H2O
vent
R1 R2
O2 Single-tube operation mode Two-stage operation mode
Figure 223 The gas tubing connection of the two stage reactor
The steam and nitrogen mixture which left the second reactor tube was purged to the vent
(indicated by the blue lines) In this configuration the optional oxygen mass flow
controller was not in use
On the other hand when the six port valve was turned in the position indicated by the
right side of Figure 223 the feed mixture went through both reactor tubes and then
analyzed by the GC-MS (green lines) This corresponds to the two-stage operation mode
Addition of oxygen or other gas was possible through the T-junction installed between
54
the six port valve and the second reactor The steam+N2 mixture was continuously
generated but purged to the vent (blue lines)
The addition of gases between the two reactors increased the total flow rate in the second
reactor tube Therefore it influenced slightly both the concentrations and the space
velocity The change of the concentration was corrected by means of the dilution ratio
(ie the ratio between the total flow rates leaving the second and the first reactor tube)
The corrected concentrations were used for the selectivity and rate calculations The
space velocity in the second reactor was calculated based on the loaded amount of
catalyst and the total flow rate
2 4 6 8 10 1209
10
11
12
4000
4250
4500
4750
5000
Overall GHSV (h-1)
Dilution ratio
O2 concentration in mixture that enters in R2 (vol)
Figure 224 The dilution ratio in the second reactor (red dots) and the overall space velocity (black
squares) change upon oxygen addition in the two-stage reactor system
An example for the change of these parameters in function of the added oxygen gas
concentration is shown by Figure 224 For the calculation of rates the corrected
concentrations were divided by the overall contact time Therefore the rate data are more
appropriate for the assessment of the effect of added gases than conversion-selectivity
data which are not corrected with respect to the change of contact time
55
225 The analytical system
For the on-line analysis of the reaction mixture a GC-MS was used This setup consisted
of five columns three valves and two detectors (MSD and TCD respectively) (Agilent
6890 N gas chromatograph Agilent Technologies 6957 B inert MSD)
The configuration of the columns and the detectors are as follows
1 15 m long DB-1 guard-column + 60 m long analytical DB-1 column
connected to the MSD Helium was used as carrier gas at 20 mlmin flow
rate The chromatographic method was developed in such a way to
separate the oxygenates on the DB-1 columns (Figure 225) The MSD
was operated in Solvent Delay mode until 4 minutes in order to protect the
filament and electron-multiplier damage caused by the oxygen and high
steam content of the analyzed gas mixture Therefore the part of the
chromatogram below 4 minutes was not shown on the MSD
2 1 m long HaysepQ guard column + 30 m long Plot Q analytical column +
30 m long Plot Molesieve analytical column The molesieve column could
be bypassed by means of a switching valve in order to avoid that polar
compounds enter in this column The detector was a TCD Helium was
used as carrier gas at 70 mlmin constant flow rate
The method was developed in such a way to enable separation and quatitation of C3H8
C3H6 H2O N2 CO and CO2 (Figure 226) The critical separations were the C3H6-C3H8
and the O2-N2 peak pairs respectively The peak resolution of the critical separations was
calculated based on Equation 227 [7]
)722 ( )(2
1
1Equation
ttR
ii
iRiR
s ωω +
minussdot=
+
+
The criterion for baseline separation is that the resolution is higher than 15 (Rs gt 15)
[7] The resolution of the C3H6-C3H8 and O2-N2 is higher than the limit of 15 (Table
222) Therefore the above method is good with respect to peak resolution
56
0 2 4 6 8 10 12 14
00
10x105
20x105
30x105
40x105
50x105
60x105
40
80
120
160
200
240
Intensity (au)
t (min)
1
2
GC Oven Temperature (deg)
Figure 225 Detection at the MSD 1 acetic acid 2 acrylic acid
0 2 4 6 8 10 12 14
00
25x106
50x106
75x106
40
80
120
160
200
240
Intensity (au)
t (min)
1
2
3
4
5
6
7
GC Oven Temperature (deg)
Figure 226 Detection at the TCD 1 carbon- dioxide 2 water 3 propylene 4 propane 5
oxygen 6 nitrogen 7 carbon-monoxide valve switching
57
Table 222 The resolution for the peak-pairs which elute close to each other
Peak-pair number Peak-pair Rs
3-4 C3H6-C3H8 25 5-6 O2-N2 53
The total length of the analysis time was 15 minutes Gas sampling was performed at
every 17 minutes Therefore the method was satisfactory with respect to the sampling
frequency (35h) In case of the acrolein and CO oxidation experiments (sections 426
and 427) the number of components were less therefore the analysis time could be
further reduced (to 10 and 8 minutes respectively)
226 Calibration of the GC-MS
For the calibration with C3H8 and O2 the pure gases (supplied by Westfalen 9995)
were mixed with nitrogen (Westfalen 9995) For the calibration with products (C3H6
CO CO2) and low concentrations of C3H8 and O2 gas mixtures with certified
concentrations were used (supplied by Westfalen) The composition of calibration
mixture 1 was the following 105 vol C3H8 103 vol C3H6 balance N2 The
calibration mixture 2 consisted of 104 vol CO 102 vol CO2 106 volO2 463
vol N2 and balance He
These mixtures were dosed via mass flow controller and diluted further with nitrogen
The resulting gas mixtures were analyzed by the GC-MS The peaks were integrated and
the peak areas were represented with respect to the concentrations (Figure 227)
Weighted linear regression was performed in order to determine the sensitivity (the
weighting factor being given by the standard deviation of the repeated measurements)
For the calibration of oxygenates a saturator was used to saturate a gas stream of
nitrogen The acetic acid and acrylic acid was used with a pa quality solutions supplied
by Merck Ca 15 ml of liquid was poured in the saturator and nitrogen was bubbled
through it with a flow rate of 15 mlnmin The temperature of the bubbler was controlled
by a HAAKEreg thermostat The vapor pressures of theses acids at different temperatures
are shown in the Table 223
58
Table223 Vapor pressures of acetic- and acrylic acid at around room temperature [11]
T(degC) pHAc (bar) pAA (bar)
15 00079 00017
20 00109 00025
25 00149 00036
00 05 10 15 20 25 30 35
00
40x107
80x107
12x108
16x108 C3H8 C3H6 CO CO2
Peak area (au)
Concentration (vol)
00 02 04 06 0800
40x107
80x107
12x108
AA HAc
Peak area (au)
Concentrations (vol)
Calibration of the TCD Calibration of the MSD
Figure 227 Calibration graphs
The vapor pressure of these oxygenates are too high at temperatures above 20degC
compared to that observed usually in the catalytic experiments On the other hand both
acids freeze at around 13degC therefore lower concentrations are not achievable only by
using the saturator Therefore in order to avoid extrapolations the mixture was further
diluted with nitrogen using the second nitrogen line The calibration graphs of the
oxygenates are shown in Figure 227
The sensitivity of the TCD is known to be stable over a relatively long time (months) but
the MSD is much less stable Therefore the TCD was recalibrated every 3-4 months
while much frequent (weekly) recalibration was needed for the MSD In order to take
into account the daily variation of the MSD sensitivity every day a solution of 05 vol
acetic acid in acetonitrile solvent was injected using the liquid injector port of the GC
(Agilent Technologies 7683 B Series Injector) The relative sensitivity was determined
every day with respect to the sensitivity determined from the multi-point calibration
59
described above For the calculation of the concentration of oxygenates the actual
relative sensitivity was also taken into account
227 Data analysis
The gas hourly space velocity (GHSV) was calculated based on the volume of the
catalyst (Vcat) loaded in the reactor and the feed total flow rate ( totVbull
) (Equation 228)
Whenever the density of the catalyst was not determined with the sufficient precision the
weight hourly space velocity was used (WHSV) which is calculated based on the mass of
the catalyst and the total flow rate of the feed The contact time (WF or τ) is the
reciprocal value of the weight hourly space velocity The volumetric flow rates were
considered at normal conditions (mln)
)1022 ( )(
)922 ( )(
)822 ( )(
1
Equationml
sg
V
mFW
Equationhg
ml
m
VWHSV
EquationhV
VGHSV
tot
cat
cat
tot
cat
tot
sdot==
sdot=
=
bull
bull
minus
bull
τ
For primary data analysis the conversion selectivity and yield was calculated under every
condition The educt conversion (XEduct) was defined as the ratio between the consumed
amount of educt and the initial concentration (Equation 2211) The product selectivities
(SPi) were calculated by dividing the amount of formed product by the amount of
transformed educt (Equation 2212) The product yield (YPi) was calculated as the
product between the conversion and the selectivity (Equation 2213) while the carbon
balance (C-balance) as the ratio between the initial concentration of the educt and the
sum of the concentrations of the carbon containing species measured at the reactor outlet
(Equation 2213)
60
)1422 ( () 100
cn
n
)1322 ( ()
)1222 ( () 100
cn
n
cn
n
S
)1122 ( () 100
0
n
1iP
Educt
iP
n
1iP
Educt
iP
iPEduct
iP
iP
0
0
Equationc
balanceC
EquationSXY
Equation
Equationc
ccX
Educt
i
iPEductiP
i
Educt
EductEduct
Educt
sdot
sdot
=minus
sdot=
sdot
sdot
sdot
=
sdotminus
=
sum
sum
=
=
The consumption and formation reaction rate was determined as
)1522 ( )( 0Equation
sg
molccr
ii
i sdot
minus=
microτ
The apparent activation energy (Ea) and the preexponential factor (lnA) were determined
from the linearized Arrhenius-equation
)2216 ( lnln EquationTR
EAr a
i sdotminus=
The activation enthalpy (∆H) and activation entropy (∆S) were calculated based on the
linearized Eyring-Polanyi equation
)1722 ( lnln EquationTR
H
R
S
h
k
T
r Bi
sdot∆
minus
∆+=
nene
61
23 Catalyst synthesis and characterization
This section describes the preparation of the catalysts which were used for catalytic and
kinetic studies reported in chapter 4 Besides the description of the preparation method
the results of physico-chemical characterization are also reported here
231 The synthesis of phase pure M1 MoVTeNbOx catalyst
The phase-pure M1 MoVTeNbOx catalyst was prepared in a relatively large batch (ca 50
g) according to the procedure developed by detail by Kolen`ko et al [8 ] This method is
adapted from Ushikubo et al [9] which lead to M1+M2 phase mixture The phase-pure
M1 material was obtained by the washing route described by Baca et al [10]
9286 mmol ammonium-heptamolybdate (AHM (NH4)6Mo7O244H2O) and 19500 mmol
NH4VO3 was dissolved in 1500 ml MQ water at 80degC The solution was cooled to 40degC
and 14950 mmol solid Te(OH)6 was added to it and dissolved 8125 mmol
NH4[NbO(C2O4)2]middotxH2O was dissolved in 500 ml MQ water at 40degC The two solutions
were mixed up and diluted to a total volume of 2500 ml by MQ water giving a solution
with a nominal metal ion concentrations normalized to molybdenum equal to
MoVTeNb=10300230125 This solution was stirred for 30 min at 40degC then spray-
dried in a Buumlchi B-191 spray-dryer The resulting solid material was calcined at 275 degC
for 1 h in synthetic air flow of 100 mlnmin followed by annealing in a Xerion rotary
tube furnace 600 degC for 2 hours in Ar flow (100 mlnmin) [2 8] A crystalline phase
mixture was produced (internal identification number 6057) consisting of 63 M1 and
37 M2 phase The BET surface area was found to be 5 m2g while the SEM indicated
large spherical aggregates The M2 phase was dissolved by treatment with 15 H2O2
solution and stirring for 24 hours After washing by distilled water and drying the
remaining solid (internal identification number 6058) was a phase pure M1 material with
a surface area of 19 m2g The SEM revealed rod-like morphology while aggregate
formation was not characteristic to this sample The shape of the ab plane is ill defined
and rather porous Finally the washed sample was activated at 600degC for 2 hours in the
rotary tube furnace under argon flow
62
Table 231 The properties of the phase-pure M1 catalysts 6059 6902 and 8947
6059 6902 8947
BET SA (m2g) 88 75 102
Phase comp M1 M1 M1
Unit cell
parameters (Aring)
Pba2 (no 32)
a=211255(2)
b=266145(2)
c=40137(2)
a=211201(1)
b=266088(2)
c=4015342)
a=211462(2)
b=266312(3)
c=401454(3)
Elem Comp MoV026Te010Nb022Ox MoV023Te010Nb024Ox --
Figure 231 The TEM image of the catalyst 6059
The resulting material (internal identification number 6059) exhibited a BET surface
area of 9 m2g The nitrogen adsorption isotherm is of type III characteristic to a
macroporous material (isotherm not shown) Because there are no meso- or micropores
internal mass transport limitation is not expected to occur In the section 223 it is shown
that the effectiveness factor is above 095 which proves that the internal mass transport
limitation is indeed negligible
63
In the XRD pattern the reflections corresponded to the phase-pure M1 material (ICSD
55097) (Figure 232) The degree of crystallinity was found to be ca 85 using rutile
TiO2 SRM 674b as internal standard The lattice parameters were determined after
Rietveld refinement (Table 231)
The TEM images revealed rod-like morphology (Figure 231)
A second batch activated from sample 6058 got the internal identification number of
8947 This showed very similar XRD pattern and catalytic properties to that of 6059
0 10 20 30 40 50 60
Intensity (au)
2 Θ Θ Θ Θ (deg)
6059 6902 8947
Figure 232 The XRD pattern of 6059 6902 and 8947
A repeated synthesis gave the sample 6902 with a similar physico-chemical and
catalytic properties with the 6059 sample This suggests the reproducibility and
reliability of the relatively large scale synthesis method reported by Kolen`ko et al [8]
References Chapter 2
1 L C Jozefowincz H G Karge E NacuteCoker J Phys Chem 98 (1994) 8053 2 M Haumlvecker S Wrabetz J Kroumlhnert L I Csepei R Naumann dacuteAlnoncourt
Yu V Kolenacuteko F Girgsdies R Schloumlgl A Trunschke J Catal submitted 3 M Baerns et al Technische Chemie Wiley-VCH 2006 145-193 4 E A Burgermeister W von Muench E Pettenpaul J Appl Phys 50 9 (1979)
5790-5794
64
5 M Baerns H Hofmann A Renken Chemische Reaktionstechnik Lehrbuch der Chemie Volume 1 Georg Thieme Verlag 3rd Edition 1999
6 I Griszligtede Die partielle Oxidation von Propan zu Acrlysaumlure Bestimmung der Reaktionskinetik und in-situ Charakterisierung des Katalysators unter Betriebsbedingungen Dissertation Universitaumlt Karlsruhe 2004 Universitaumltsverlag Karlsruhe ISBN 3-937300-17-1
7 R L Grob E F Barry Modern practice of gas chromatography 4th Ed 2004 25-65 A Braithwaite Chromatographic methods 5th Ed Kluwer Acedamic Publishers 1999 17-40
8 Yu V Kolen`ko W Zhang R Naumann d`Alnoncourt F Girgsdies T W Hansen T Wolfram R Schloumlgl A Trunschke submitted ChemCatChem 2011
9 T Ushikubo K Oshima A Kayou M Hatano X Can Li Stud Surf Sci and Catal 112 (1997) 473-480
10 M Baca J M M Millet Appl Catal A General 279 (2005) 67-77 11 wwwfluidatcom
65
Chapter 3 Structural stability of the M1 MoVTeNbOx catalyst
under propane oxidation conditions
31 Abstract
In this section the details and results of the in-situ XRD experiment are described in
which the bulk structural stability of the phase-pure M1 MoVTeNbOx under real reaction
conditions catalyst was addressed XRD diffractograms were recorded during the long
term catalytic experiment on propane oxidation reaction whereby different conditions
(steam containing and steam free net reducing stoichiometric and net oxidizing feed
compositions) The evaluation of the XRD patterns revealed that the catalyst phase purity
was not affected under any of the conditions Therefore the bulk structure of the catalyst
is stable and constant during the propane oxidation reaction
32 Introduction
Upon reviewing the literature of propane oxidation on Mo and V based oxides only a few
studies were found which addressed the question of bulk structural stability of the
catalyst under working conditions However the information concerning structural
stability under reaction conditions is an absolute prerequisite for proper catalytic kinetic
and structure-activity relationship studies
The stability of the catalyst might be influenced by different factors
bull The temperature is one of the most important ones Upon the catalyst formulation
usually the thermal treatment or activation is the last step when the desired
crystal structure is developed The activation is usually carried out at higher
temperature than the reaction temperature Therefore it is not expected that under
reaction conditions the temperature plays a role in the stability provided that the
reaction is carried out isothermally and hot-spots do not form on the catalyst
surface However because the activation is carried out in inert atmosphere (argon
or helium) and it is not evident that the catalyst is stable in presence of feed at
66
reaction conditions even if the reaction temperature is inferior to the activation
temperature
bull The redox potential When a reducing feed is used the catalyst might be reduced
which leads to change in the composition and in severe cases to the
transformation of the crystal structure On the other hand when oxidizing feed is
used and if the constituting metal ions are not in the highest oxidation state these
ions may be oxidized which also may induce phase change if the structure is not
flexible enough Grasselli et al carried out redox pulse experiments using a
phase-pure M1 MoV025Te011Nb012Ox catalyst By applying 120 pulses consisting
of C3H8 and NH3 the catalyst could be reduced as deep as 70 atomic layers of the
lattice and then reoxidized by oxygen without structural collapse [1] This showed
the stability of the catalyst bulk structure under reducing conditions Of course
under reducing conditions the product distribution changed and the propylene
formation prevailed However it was not shown whether the reoxidized catalyst
shows the same conversion and selectivity or not Zenkovets et al has also shown
that the (MoVW)5O14 may be reduced by hydrogen without structural
transformation [2]
bull The presence or absence of steam in the feed Water is a reaction product of
oxidation catalysis However frequently a high steam content (20-40 vol) is
needed to introduce in the feed for optimal catalytic performance Novakova et al
observed that in absence of the steam the catalytic performance of the
MoV03Sb025Nb008Ox (mixture of (MoVNb)5O14 (MoV)5O14 MoNbOx and
SbVOx phases) drops and the phase composition also changes [3] Upon re-
introducing the steam in the feed neither the initial phase composition nor the
catalytic performance was established Griszligtede noted that the pretreatment of the
MoV033Nb017Te025Ox catalyst at 140degC for 24 hours in the reactor using a gas
mixture consisting of 50 vol steam and 50 vol nitrogen is necessary to achieve
high selectivity (69) When the pretreatment was done with a mixture
containing only 10 vol steam the highest selectivity was around 40 Without
evidences from XRD measurements it was assumed that the steam promotes the
formation of the selective phase [4] Recknagel also supposed that the better
67
catalytic performance in acrolein oxidation to acrylic acid is due to phase change
induced by steam [5]
bull Griszligtede noted that when propane was switched to propylene in the feed the
conversion and selectivities reached the steady state only after 72 hours time on
stream Without further experimental evidences (eg XRD) this observation was
also accounted for the altering of the phase composition
bull The formation of the selective VPO phase (documented by XRD study) was
described under propane oxidation conditions by feeding propane and oxygen at
430degC then decreasing the temperature to 400degC and introducing steam [6-8]
As shown in the above enlisted literature sources there is not enough information
concerning to the
bull bulk structural stability of the phase pure Mo and V based oxide catalysts under
various reaction conditions (steam containing and dry feed low and high oxygen
content and switching from propane to propylene as educt)
bull eventual coupling between kinetics of the solid state transformation and the
kinetics of the surface catalyzed reaction
Therefore within this work foremost the above open questions were addressed In order
to find out whether under real reaction conditions phase transformation occurs or not an
in-situ XRD experiment was carried out at different steam contents and oxygen
concentrations In the section 33 the results of this experiment are summarized
For the study of the effect of steam and oxygen content on the stability under reaction
conditions experiments were carried out to vary these parameters in the fixed bed reactor
as well The catalytic performance was found to be constant over the time at any steam
content (including dry feed) and any initial oxygen concentration (sections 422 and
424) The reaction was followed for relatively long time (up to 4 hours at every space
velocity) and neither deactivation in time nor change in the selectivity was observed The
conversion measured in dry feed was found to be lower compared to the steam containing
feed Upon switching back from dry feed to the steam containing feed the catalytic
68
properties were found to be the same as before (section 422) Therefore in contrast to
the finding of Novakova et al [3] reported for the MoVSbNbOx catalyst the catalytic
properties of MoVTeNbOx are reversible when exposing it to dry feed
When the reaction was operated under reducing conditions the propane conversion was
found to be lower than in the case of stoichiometric or net oxidizing feed After
performing the reaction under reducing conditions stoichiometric feed was used again
The conversion and selectivity was comparable to that measured under reducing
conditions but it converged slowly to the value measured before exposing the catalyst to
reducing conditions (section 424 and 431)
33 In-situ XRD study on the effect of steam and oxygen
The experiment was carried out using a STOE Stadi P type diffractometer in a theta-theta
arrangement equipped with a Cu Kα1 radiation source (wavelength=154060 Aring) and a
scintillation detector A mass of 02107 g catalyst was placed in the sample holder of the
XRD setup The feed consisting of steam propane oxygen and balance helium was
supplied via heated stainless steel tubing in order to avoid condensation of the steam For
the introduction of the steam a bubbler attached to a HAAKEreg thermostat was used The
total flow rate was always 176 mlnmin giving a gas hourly space velocity of 5000 h-1
The rationale behind choosing this space velocity is that the maximum productivity in the
fixed bed reactor experiments was observed between 4500 and 9000 h-1 space velocity
(described in detail in sections 421 422) Therefore the bulk structure was envisaged to
be probed by XRD under the highest performance of the catalyst The gas mixture
leaving the XRD cell was analyzed by an OmnistarTM mass spectrometer The following
fragments were monitored in time 12 13 14 16 17 18 28 29 30 31 32 40 41 42
43 44 45 56 60 and 72
69
XRD scans were performed under every condition as follows
1 in helium (100) at room temperature
2 in helium (100) at 400degC
3 C3H8O2H2OHe=362071 vol 400degC
4 C3H8O2H2OHe=33094 vol 400degC
5 C3H8O2H2OHe=3450925 vol 400degC
6 C3H8O2H2OHe=36091 vol 400degC
7 C3H8O2H2OHe=39088 vol 400degC
8 C3H8O2H2OHe=312085 vol 400degC
9 C3H8O2H2OHe=312580 vol 400degC
10 C3H8O2H2OHe=30592 vol 400degC
11 C3H8O2H2OHe=30097 vol 400degC
12 C3H8O2H2OHe=30097 vol 400degC scan performed after long time on
stream (24 hours) under this strongly reducing condition
13 in helium (100) at room temperature
Repeated scans were performed at every condition in order to be able to observe if
eventually slow solid state transformation occurs The second reason for repeated
acquisition of the patterns is that to improve the data quality for the Rietveld refinement
The total length of the experiment was 2 weeks
First scans were made at room temperature and 400degC as well in pure helium (condition
1 and 2) Then a measurement was performed using stoichiometric feed and 20 vol
steam (condition 3) In the next step both the oxygen and steam was changed to 3 and 0
vol respectively (condition 4) In the next four conditions (5 6 7 and 8) the oxygen
content was increased from 45 (reducing) to 6 (stoichiometric) to 9 and 12 (net
oxidizing) in dry feed In the next condition 5 vol steam was introduced while keeping
the initial oxygen concentration at 12 vol The condition 10 corresponds to strongly
reducing feed (0 vol O2) in presence of 5 vol steam while in the last condition (11)
the feeding of steam was also stopped The scanning was continued while exposing the
catalyst to this extreme condition (12) for long time (ca 24 hours) After this the propane
was switched off and the final scans were recorded at room temperature in helium flow
70
The XRD patterns shown in Figure 331 indicated that under reaction conditions from 3
to 11 no new peak appeared ie no new phase was developed irrespective of the steam
content or the redox potential of the gas mixture Only slight changes were observed in
the peak intensities and positions More pronounced decrease in the peak intensity was
observed upon exposing the catalyst to extreme reducing condition (propane in helium)
for long time but the absence of a new peak suggested that no new phase was formed
The XRD patterns were evaluated quantitatively as well Rietveld refinement showed that
all the patterns correspond to phase-pure M1 MoVTeNbOx therefore phase
transformation during all the above conditions could be ruled out The lattice parameters
are shown in Figure 332
1 2 3 4 5 6 7 8 9 10 11 12 13
10
20
30
40
50
60
2 Theta (deg)
Condition
Figure 331 The XRD patterns recorded under different reaction conditions
71
0 1 2 3 4 5 6 7 8 9 10 11 12 13 14
0200400
212502150021750
267527002725
396400404
T (degC
)a (Aring)
b (Aring)
c (Aring)
Figure 332 The lattice constants determined for every condition
First it can be seen that upon heating up the catalyst in helium anisotropic lattice
expansion occurs ie the thermal expansion occured preferentially along the c and a axis
while the b lattice parameter was unaffected Under reaction conditions ranging from 3-
11 no change was observed in any of the lattice constants irrespectively of the steam
content or the redox potential However upon exposing the catalyst to extreme reducing
conditions for long time the a and b lattice constants were increasing while the c was
decreasing Finally anisotropic contraction along the c axis was observed also upon
cooling down the catalyst in inert atmosphere
The mass spectrometric data recorded during the in-situ XRD experiment was also
evaluated Because the sensitivity of a mass spectrometer changes over the time the
conversion and selectivity data could not be determined with the usual precision obtained
at the PropOx-1 fixed bed reactor setup Therefore the current of mz=72 fragment
corresponding to the acrylic acid was normalized with respect to helium The signal was
averaged over the time for every condition (Figure 333) For comparison the
concentration of the acrylic acid determined in PropOx-1 setup corresponding to three of
the conditions is shown in the same graph It can be observed that the results are
72
comparable The differences may be accounted to the fact that the MS data is only semi-
quantitative while the GC-MS data is quantitative (section 22) Furthermore the other
reason might be that the sample holder cell o the in-situ XRD setup has a very different
geometry compared to the PropOx-1 setup described in the section 22
1 2 3 4 5 6 7 8 9 10 11 12 13
0000
0002
0004
00
02
04
06
Norm
alized average intensity m
z=72 (au)
Condition
Concentration of AA Propox1 (vol
)
Figure 333 The normalized average intensity corresponding to acrylic acid during the in-situ XRD
experiment monitored by on-line MS (black squares) The concentration of acrylic acid determined in the PropOx-1 fixed bed reactor (blue dots)
34 STEM analysis of the catalyst before and after
the in-situ XRD experiment
The catalyst sample was analyzed by means of scanning transmission electron
microscopy (STEM) before and after the in-situ XRD experiment The elemental analysis
was performed by EDX at selected spots
The STEM images are shown in Figure 341 It can be observed that the particle size was
not affected by the reaction However the images corresponding to the post-catalytic
sample revealed pitting-like holes on the particles The occurrence of the voids is
statistically distributed and the void size is approximately the same This suggests that the
transformation from the initial to the final state of the catalyst is not a topotactic
transformation (ie no reaction front can be observed)
73
Before reaction
After reaction
Figure 341 STEM images of the catalyst before and after the in-situ XRD experiment
The elemental mapping of the particles before reaction showed homogeneous distribution
of all the constituting elements (Figure 342) In contrast to this the post catalytic sample
showed a very heterogeneous distribution of the oxygen supporting the fact that the
catalyst was indeed reduced Depletion of the tellurium content was also observed in the
spots marked with red crosses in the Figure 343
100 nm100 nm100 nm100 nm100 nm
100 nm 20 nm20 nm20 nm20 nm20 nm
20 nm
50 nm50 nm50 nm50 nm50 nm
100 nm 20 nm20 nm20 nm20 nm20 nm
20 nm
74
Figure 342 The elemental mapping of the catalyst before reaction
Figure 343 The elemental mapping of the catalyst after reaction
O Nb
Te V Mo
Mo V Te
Nb O
75
35 Conclusions
Upon reviewing the literature dealing with selective oxidation of propane to acrylic acid
it was found that the information concerning the structural stability or instability of the
catalyst is seldom reported Novakova et al has shown that the deactivation of the
MoVSbNbOx phase mixture in dry feed is irreversible and it is a consequence of
irreversible change in the phase composition Griszligtede also reported the decay of the
catalytic performance over the MoVTeNbOx catalyst but no information was provided
about the phase composition either before or after the catalytic experiments
The motivation for the work presented in this section is the fact that the structural
stability of a catalyst under various reaction conditions is a criterion for the proper
catalytic and kinetic study
In-situ XRD study was performed on the effect of steam and the oxygen concentration
using a phase-pure MoVTeNbOx catalyst The measurements were done at the space
velocity corresponding to the maximum productivity of the catalyst The steam content
was varied between 20 and 0 vol while the redox potential of the feed between net
oxidizing stoichiometric moderately reducing conditions Neither the XRD patterns nor
the lattice parameters were changing significantly under these conditions suggesting that
the catalyst bulk structure is robust enough to withstand the variation of the parameters in
such a broad interval At the end very strongly reducing feed (3 vol propane and 97
vol helium) was applied for long time on stream as well No new peak appeared in the
XRD pattern indicating that no new phase appeared but the lattice constants changed
under this extreme condition Additionally the STEMEDX analysis of the spent catalyst
revealed that pitting-like holes appeared on the catalyst particles and depletion of the
tellurium content was also noted
However the bulk structure of the used phase-pure M1 MoVTeNbOx catalyst is stable
under conditions relevant to catalytic applications Therefore the kinetics of the
heterogeneously catalyzed reaction is not coupled with any solid-state transformation
The next chapter reports the catalytic and kinetic study of propane oxidation over the
phase-pure M1 MoVTeNbOx catalyst
76
References Chapter 3
1 R K Grasselli D J Buttrey J D Burrington A Andersson J Holmberg W Ueda J Kubo C G Lungmair A F Volpe Top Catal 38 (2006) 7-16
2 G A Zenkovets G N Kryukova V Yu Gavrilov S V Tsybulya V A Anufrienko T A Larina D F Khabibulin O B Lapina E Roumldel A Trunschke T Ressler R Schloumlgl Materials Chemistry and Physics 103 (2007) 295-304
3 E K Novakova J C Veacutedrine E G Derouane Catalysis Letters 83 3-4 (2002) 177-182
4 I Griszligtede Die partielle Oxidation von Propan zu Acrylsaumlure Bestimmung der Reaktionskinetik und in-situ Characterisierung des Katalysators unter Betriebsbedingungen Dissertation Universitaumlt Karlsruhe 2004 Universitaumltsverlag Karlsruhe ISBN 3-937300-17-1
5 R Recknagel Chemische Technik 46 6 (1994) 324-331 6 G Landi L Lisi J C Volta Chem Commun 9 4 (2003) 492-493 7 G Landi L Lisi J-C Volta J Mol Catal A 222 (2004) 175-181 8 G Landi L Lisi J C Volta Catal Today 91-92 (2004) 275-279
77
Chapter 4 Kinetic studies of propane oxidation to acrylic acid on a phase-pure
MoVTeNbOx catalyst
41 Abstract
A detailed kinetic study is presented for the phase pure M1 MoVTeNbOx catalyst
Kinetic studies including the effect of temperature steam- propane- and oxygen content
variation were performed The oxidation of propylene acrolein carbon monoxide and
water gas shift reaction gave important additional information concerning the reactivity
of the intermediates and reaction pathways respectively Catalytic experiments were
performed also in a two-stage reactor system consisting of two reactor tubes connected
serially
42 Kinetic studies on phase-pure M1 MoVTeNbOx
According to the motivation of the present work a phase-pure and structurally stable
MoVTeNbOx catalyst was envisaged for detailed kinetic study in the propane oxidation
reaction The exceptional stability of the phase-pure M1 MoVTeNbOx catalyst under
catalytically relevant reaction conditions was evidenced in the Chapter 3 In this chapter
the results of the kinetic and catalytic experiments are presented The temperature
propane- oxygen- and steam contents were varied Furthermore the reactivity of the
oxidation in propylene intermediate was carried out in the temperature interval
corresponding to propane oxidation reaction (360-400degC) and high space velocity
(typically 20000 and 80000 h-1) The effect of steam on propylene oxidation was also
studied
Acrolein oxidation was carried out in the typical temperature interval corresponding to
propane oxidation and very high space velocity (GHSV=250000 h-1)
CO oxidation and water gas shift reaction was carried out in the temperature interval of
propane oxidation for revealing the secondary pathways that CO might be involved in
On the other hand the CO oxidation activity was used as a proxy for the amount of
electrophilic oxygen species on the catalyst surface
A two-stage reactor system was used for studying the effect of stage-wise addition of
different gases (O2 N2O C3H6 CO and CO2)
78
The oxygen addition in the two-stage reactor design revealed that the acrylic acid yield
can be increased in contrast to the oxygen content variation in the conventional single-
tube fixed bed reactor
Nitrous oxide addition showed no effect on the reactivity Moreover the nitrous oxide
conversion was found to be zero under every condition suggesting that the phase pure
M1 MoVTeNbOx catalyst is not reoxidized by N2O
The product distribution upon propylene addition in the two-stage reactor revealed that
acrylic acid acetic acid carbon monoxide and carbon dioxide are formed from
propylene
Upon addition of CO in the two stage reactor no change in the catalytic activity was
observed CO was not further oxidized which suggests that this is an inert end product
besides the CO2 Furthermore this experiment indicated a very low abundance of the
electrophilic oxygen species during propane oxidation reaction
The addition of CO2 in the two-stage reactor showed also no influence on the product
distribution of propane oxidation reaction
421 Variation of the contact time and temperature
For the kinetic study the contact time was varied up to 202 gsml by changing the flow
rate and the catalyst mass The experiments were performed at 360 380 and 400degC The
feed composition was kept constant at C3H8O2H2ON2=364051 vol
The dimensionless concentration profiles corresponding to all the detectable compounds
(propane propylene acrylic and acetic acid CO and CO2 respectively) are presented in
the Figure 421 The normalization of the concentrations was done by dividing the actual
concentrations with the initial concentration of propane By numerical differentiation of
the concentration-contact time curves it is possible to obtain the rates of propane
consumption and the rates of product formation respectively Strictly speaking the rates
can be obtained only in the differential regime because by definition within the
differential regime the concentrations change linearly with the contact time In the
integral regime the curves deviate from linearity therefore the rates depend on the extent
of the reaction Highly nonlinear concentration profiles can be observed for the reaction
79
products above 01 gsml contact time Though for the qualitative description of the
kinetic curves the rate of propane consumption and product formation is considered
irrespective of the integral or differential mode
The highest acrylic acid productivity is observed in the integral regime For this reason
in order to find out the effect of operational variables (temperature redox potential and
the steam content) and optimize the acrylic acid yield it was necessary to carry out the
experiment also in the integral mode
In this section the effect of temperature on the catalytic properties and kinetic rate
constants are presented
Qualitatively the concentration profiles can be described as follows
The propane consumption rate increases with temperature
Propylene is the first intermediate of the reaction as indicated by a curve that passes
through a maximum
The CO2 and CO formation rate increases with the temperature However the CO
formation rate was found to be higher than the CO2 formation rate Thermodynamically
the carbon monoxide may be further oxidized to CO2 This could mean that possibly CO
is formed first and in a consecutive step it may be oxidized to the thermodynamically
favored product CO2 If CO would be readily further oxidized to CO2 a maximum
would be observable in the CO concentration profile However in the studied contact time
interval the CO concentration profile does not show a maximum at any temperature
Measurements at higher contact times were avoided because of complete oxygen
conversion Therefore from these data the CO oxidation can neither be stated nor refuted
The reactivity in CO oxidation over MoVTeNbOx catalyst was addressed in a separate
series of experiments The results are presented in detail in subchapter 427 As it is
shown there the CO oxidation and water gas shift activity is negligible under the reaction
conditions relevant for the selective oxidation reactions Therefore CO and CO2 are
formed in independent pathways during the propane propylene and acrolein oxidation
reactions
The acetic acid is a minor byproduct which appears at contact times higher than 01
gsml No maximum can be observed on the concentration profile though it can not be
stated whether it is a relatively stable end product or it is further oxidized to CO or CO2
80
00 05 10 15 2000
02
04
06
08
10
12
360degC
380degC
400degCy C
3H8
WF (gsml)
00 05 10 15 20
000
001
002
003
004
005
006 360degC
380degC
400degC
y C
3H6
WF (gsml)
C3H8 C3H6
00 05 10 15 20
00
01
02
03
04
05 360degC
380degC
400degC
y AA
WF (gsml)
00 05 10 15 20 25
000
004
008
012
016
020 360degC
380degC
400degC
yHAc
WF (gsml)
AA HAc
00 05 10 15 20 25
00
01
02
03
04
05 360degC
380degC
400degC
y CO
WF (gsml)
00 05 10 15 20 25
00
01
02
03
04
05 360degC
380degC
400degC
y CO2
WF (gsml)
CO CO2
Figure 421 The evolution of concentrations with the residence time at different temperatures Squares ndash experimental data dashed curves ndash fitted kinetic curves based on reaction model 1 (for modeling see
section 64) Feed composition C3H8O2H2ON2=364051 vol Catalyst ID=6059
81
The acrylic acid is the desired product of the reaction Its concentration ndash therefore its
formation rate as well ndash increase with the contact time and reaction temperature
However above 15 gsml contact time the conversion of oxygen approaches 100
which leads to a high redox potential gradient along the reactor High oxygen conversions
were avoided because the catalyst particles in the bottom of the catalytic bed are reduced
and the kinetics may change with the reduction degree of the catalyst surface The
maximum acrylic acid yield was 25-30 depending on the temperature
422 Variation of the steam content
The steam content variation was performed in the interval between 0 and 40vol and for
a contact time up to 090 gsml (GHSV=4500 h-1) The feed consisted in every case of 3
vol propane and 6 vol oxygen The steam content was decreased from 40 to 0 vol
by steps of 10 vol the balance being N2 at a reaction temperature of 400degC
The experiments presented here were started up with steam containing feed (40 vol)
then the steam content was then reduced by 10 vol The catalytic properties were
measured for relatively long time in dry feed in order to be able to observe if deactivation
occurs Subsequently the catalytic performance was re-measured using 20 vol steam
containing feed
The ldquoreasonably long term stabilityrdquo of the catalytic properties in steam free feed is
demonstrated in Figure 422 The adjective of reasonability in the context of long term
stability is related here to the time resolution of the used analytical methods As shown in
the Experimental part (section 225) the gas chromatographic setup has a time
resolution of one injection17 minutes On the other hand in situ XRD experiments were
carried out on the effect of oxygen and steam (Chapter 3) The time resolution of the
XRD setup is several hoursscan
As shown by Figure 422 the stability in time of the catalytic performance exceeds
satisfactorily the gas chromatographic analysis time Neither catalyst deactivation nor
change in the selectivity was observed within the studied time on stream intervals up to 4
hours at different space velocities The stability of catalytic performance makes possible
to perform the kinetic study of propane oxidation also under steam free feed conditions
82
It has to be emphasized that even if no steam is fed in the reactor water is produced by
the reaction on the active sites of the catalyst Therefore it would be improper to state
that the experiments were carried out under dry conditions Moreover there is a gradient
of produced water concentration along the catalytic bed Indeed the chromatographic
analysis of the reactor effluent gas showed a detectable amount of water However due to
highly asymmetric peak shape and low peak area the quantification of the formed water
was difficult
It is important to notice that at a contact time of 0227 gsml (GHSV=18000 h-1) the
conversion is low and at the limit of the differential operation mode The most abundant
product is propylene with a selectivity of ca 50 The acrylic acid selectivity is quite
low and acetic acid is not produced at all
At lower space velocities the conversion increases and the selectivity to acrylic acid
becomes higher than the propylene selectivity Additionally acetic acid appears as
byproduct Below the space velocity of 9000 h-1 the selectivity to acrylic acid decreases
due to total oxidation In every case however the selectivity to CO was higher than the
selectivity to CO2
0 100 200 300 400 500 600 700
0
10
20
30
40
50
60
70
80
90
100
GHSV=
2500h-1
GHSV=
4500h-1GHSV=9000h
-1
Conversion Selectivity Yield ()
X C3H8 X O2 S AA S CO2 S C3H6 S HAc S CO Y AA C-bal
TOS (min)
GHSV=18000h-1
Figure 422 The stability of catalytic performance in steam-free feed
83
After performing the catalytic performance in dry feed the catalytic properties were re-
measured using a feed mixture containing 20 vol steam Upon immediate switching
from dry feed to steam containing feed the conversions and selectivities were found to be
constant over the time on stream within experimental errors Moreover the catalytic
performance was the same as before exposing the catalyst to dry feed (Figure 423)
This suggests that the catalyst responds dynamically to the changes of the steam content
in the feed The changes are completely reversible and faster than the gas
chromatographic analysis time of 17 minutes The productivity of the catalyst expressed
in terms of conversion of propane the selectivity and yield to acrylic acid is displayed on
Figure 423 at a space velocity of 18000 9000 and 4500 h-1 (WF=0228 0455 and
0904 gsml respectively)
In the concentration interval between 20 and 40 vol the catalytic performance is not
influenced significantly by the steam
Below a steam content of 20 vol both the conversion and selectivity drops
dramatically Nevertheless in contrast to the observation reported by Novakova et al [1]
this drop is reversible after switching back to the feed containing 20 vol steam the
conversions and selectivities were comparable to those determined before exposing the
catalyst to dry feed
20 0 20 400
20
40
60
80
100
Conversion Selectivity ()
H2O concentration in feed mixture (vol)
XC3H8 GHSV=4500h-1
XC3H8 GHSV=9000h-1
XC3H8 GHSV=18000h-1
SAA GHSV=4500h-1
SAA GHSV=9000h-1
SAA GHSV=18000h-1
20 0 20 400
5
10
15
20
25
30
Yield ()
H2O concentration in feed mixture (vol)
YAA GHSV=4500 h-1
YAA GHSV=9000 h-1
YAA GHSV=18000 h-1
Figure 423 The effect of steam on the acrylic acid productivity at GHSV=4500 9000 and 18000 h-1
84
The temperature variation between 360 and 400degC using reaction mixtures containing 0
10 and 40 vol steam was also performed The catalytic properties expressed in terms of
propane conversion acrylic acid selectivity and yield are summarized in the Figure 424
Similarly to the trend demonstrated in Figure 423 the conversion of propane and the
selectivity to acrylic acid is positively influenced at every temperature (Figure 424)
Although the conversion rises and the selectivity decreases slightly the yield to acrylic
acid levels off at around 380degC
360 380 4000
20
40
60
80
100
Conversion Selectivity ()
T (degC)
XC3H8 0vol H2O GHSV=4500h-1
XC3H8 10 vol H2O GHSV=4500h-1
XC3H8 40vol H2O GHSV=5000h-1
SAA 0vol H2O GHSV=4500h-1
SAA 10vol H2O GHSV=4500h-1
SAA 40vol H2O GHSV=5000h-1
360 380 400
0
10
20
30
40
50
Yield ()
T (degC)
YAA 0vol H2O GHSV=4500h-1
YAA 10vol H2O GHSV=4500h
-1
YAA 40vol H2O GHSV=5000h
-1
Figure424 The effect of temperature on the catalytic performance at 0 10 and 40 vol steam content Catalyst 6059
The activation parameters (apparent activation energy logarithm of the pre-exponential
factor activation enthalpy and entropy respectively) were calculated using the linearized
form of the Arrhenius- and Polanyi-Eyring equations The numerical values of these
activation parameters are summarized in Table 421
It can be observed that in the presence of steam the apparent activation energy is reduced
significantly by a factor of 24 when 40 vol steam is present in the feed mixture The
logarithm of the pre-exponential factor and the activation entropy decreases as well
indicating that in presence of steam both the number of collisions per unit surface and
also the structure of the activated complex is influenced On the other hand the activation
enthalpy is larger when steam is present in the feed
85
Table 421 The activation parameters of propane consumption at different steam contents
Activation
parameter
C3H8 consumption
0 vol H2O 10 vol H2O 40 vol H2O
Ea (kJmol) 95 plusmn 13 76 plusmn 7 39 plusmn 8
lnA 20 plusmn 2 17 plusmn 1 11 plusmn 1
∆H (kJmol) -8970 plusmn 002 -7026 plusmn 001 -3349 plusmn 001
∆S (JmolK) -9258 plusmn 003 -11836 plusmn 002 -16822 plusmn 002
A decreasing trend in the apparent activation energy of propane oxidation on
MoVSbNbOx catalyst was reported by Novakova et al In dry feed the apparent activation
energy was found to be 68 kJmol while only 50 kJmol at 25 vol steam content [1]
However in the work reported by Novakova et al the MoVNbSbOx catalyst was
deactivating and the bulk structure was altered irreversible in steam-free feed Therefore
the apparent activation energy of 68 kJmol was probably not determined under steady-
state conditions
The concentration profiles from contact time variation at different steam concentrations
are presented in Figure 425 In the following the qualitative information arising from
these plots are summarized
The propane consumption rate depends on the steam content of the feed The lowest
consumption rate was observed in a steam free feed The presence of steam enhances the
consumption rate however this positive effect levels off above the concentration of 20
vol
This observation is in accordance with the trends reported by Novakova et al and
Griszligtede [1-4]
The propylene concentration profile is similar at all steam contents However the contact
time (WFmax) corresponding to the maximum propylene concentration shows the
following dependence on the steam content 0272 gsml at 0 vol steam 0227 gsml at
10 vol steam and 0185 gsml for 20 30 and 40 vol steam The value of WFmax is
related to the formation and consumption rate constant of propylene In case of the first
86
order consecutive reactions the WFmax is equal to the logarithmic average of the rate
constants of the steps involving the intermediate product
Figure 425 The effect of steam on the concentration profiles
00 02 04 06 08 1000
02
04
06
08
10
12 0 vol H
2O
10 vol H2O
20 vol H2O
30 vol H2O
40 vol H2O
y C3H8
WF (gsml)
00 02 04 06 08 10000
002
004
006 0 vol H
2O
10 vol H2O
20 vol H2O
30 vol H2O
40 vol H2O
y C3H6
WF (gsml)
C3H8 C3H6
00 02 04 06 08 1000
01
02
03
04 0 vol H
2O
10 vol H2O
20 vol H2O
30 vol H2O
40 vol H2O
y CO2
WF (gsml)
00 02 04 06 08 1000
01
02
03
04 0 vol H
2O
10 vol H2O
20 vol H2O
30 vol H2O
40 vol H2O
yCO
WF (gsml)
CO2 CO
00 02 04 06 08 10000
002
004
006
008
010 0 vol H
2O
10 vol H2O
20 vol H2O
30 vol H2O
40 vol H2O
y HAc
WF (gsml)
00 02 04 06 08 10000
005
010
015
020
025
030 0 vol H2O
10 vol H2O
20 vol H2O
30 vol H2O
40 vol H2O
y O2
WF (gsml)
CH3COOH CH2CHCOOH
87
The decrease of WFmax suggests that presence of steam increases the increase of the ratio
between the consumption and the formation rate constant of propyleneOn the other hand
not only the position of the maximum is related to the formation and consumption rate
constants but the actual concentration of the intermediate product as well At high
contact times the decay of propylene concentration is more enhanced in presence of
steam This also suggests that steam increases the rate constant of further oxidation of
propylene [5]
The CO and CO2 concentration profiles share the same qualitative features compared to
the dry feed both the CO and CO2 formation rates are reduced already in the presence of
10 vol steam
A further increase of steam concentration does not further reduce the rates of CO and
CO2 formation It is also notable that the rate of CO formation is higher than CO2
formation rate under every condition Nevertheless the concentration profile does not
reveal more information about the steps by which these total oxidation products are
formed Therefore it could not be established whether CO was formed as a first total
oxidation product and then further oxidized to CO2 or they are products of parallel and
independent steps This issue was addressed and elaborated in subchapters 427 and
433 where results concerning the CO oxidation water gas shift reaction and addition of
CO in the two-stage reactor are presented respectively
The formation rate of acrylic acid and acetic acid is enhanced significantly in presence of
steam in the feed in accordance with the observations of Griszligtede [2 3] Novakova et al
[1] Dubois et al [6] and Zheng et al [7] The maximum formation rates are observed at
20 and 30 vol steam concentration At 40 vol water content the acetic and acrylic acid
concentrations are slightly lower compared to those determined at 20 and 30 vol steam
content especially at contact times close to 10 gsml
Neither the acetic acid nor the acrylic acid concentration passes a maximum in the
studied contact time interval The only exception is the measurement carried out without
steam in the feed in this measurement the concentration profiles of acetic acid and
acrylic acid are flattened at high contact times but no net decay can be observed This
shows that both acids are relatively stable against further oxidation
88
423 Variation of the propane content
The propane concentration variation was performed in the interval between 1 and 3 vol
for the determination of the partial order with respect to propane For this purpose the
concentration of oxygen and steam was kept constant at 6 and 40 vol respectively the
nitrogen making up the balance (Figure 426)
1 2 3 40
20
40
60
80
100
X C3H8 X O2 S AA S CO2 S C3H6 S HAc S CO C-∆∆∆∆
Conversion Selectivity ()
x=C3H
8 concentration (vol)
Figure 426 The effect of the propane concentration on the catalytic performance
C3H8O2H2ON2=x640(54-x) vol T=400degC GHSV= 34280 h-1 WF=011 gsml Catalyst 6059
Because the propane concentration was varied at constant oxygen concentration the
redox potential was stoichiometric with respect to the propane to acrylic acid reaction (in
the case of the feed C3H8O2=36 vol) and net oxidizing (in the case of C3H8O2=26
and 16 vol feeds respectively) The experiment was performed at 400degC and a contact
time of 011 gsml
The propane conversion is relatively independent on the initial propane concentration
Propylene is the main product while other products in the order of abundance are acrylic
acid CO CO2 and acetic acid In case of slightly oxidizing feed (C3H8O2=26 vol) the
selectivities were very similar to that obtained for stoichiometric feed while in case of
89
strongly oxidizing feed (6-fold excess of oxygen) the propylene selectivity increased
slightly at the expense of acrylic acid selectivity
For kinetic modeling the partial order with respect to reactants propane and oxygen
were determined using a power rate equation This power rate equation contains two
independent variables the concentrations of propane and oxygen respectively (Equation
421) Because of this the reaction order with respect to both components can be
obtained by partial derivation of the rate equation if both concentrations are varied
simultaneously in the experiments (Equations 422 and 423) On the other hand if the
concentration of one component is kept constant the rate law is simplified Since the
initial oxygen concentration was 6 vol in all the experiments the two constant terms on
the right hand side of the power law can be contracted into a single apparent rate constant
kacute (Equation 424) Then the power law will contain only one variable The reaction
order m can be determined from the slope of the straight line of the double-logarithmic
plot according to the linearized equation 425 (Figure 427) [8 9]
)524 ( lnlnln
)424 (
)324 ( ln
ln
)224 ( ln
ln
)124 (
08383
08383
02
083
02083
Equationcmkr
Equationckr
Equationc
rn
Equationc
rm
Equationcckr
HCHC
m
HCHC
O
HC
n
O
m
HC
sdot+=
sdot=
partpart
=
partpart
=
sdotsdot=
The slope of the above plot shown below is equal to 110plusmn001 and consequently the
reaction is first order with respect to propane
The application of the integral method supported that the reaction is first order with
respect to propane the simulated concentration profile based on the integrated rate
equations containing a first order step with respect to propane is in good agreement with
the experimentally determined profile over a wide contact time interval (Figure 421)
This is an indication that first order kinetics is valid under both differential and integral
regimes [8]
90
-50 -45 -40 -35 -30-10
-08
-06
-04
-02
00
02
04
ln rC3H8
ln(cC3H8)ττττ=0
Figure 427 Determination of the reaction order with respect to propane
424 Variation of the oxygen content
The effect of the initial oxygen concentration was also studied The initial oxygen
concentration was varied in the interval from 4 to 15 vol keeping the initial propane
concentration constant at 3 vol Thus the catalytic experiments were performed under
three redox potentials of the gas mixture
i) reducing at 4 vol O2
ii) stoichiometric at 6 vol O2 and
iii) net oxidizing at 9 12 and 15vol O2 respectively
91
4 6 8 10 12 14 160
20
40
60
80
100
y=O2 concentration (vol)
Conversion Selectivity ()
X C3H8 X O2 S AA S CO2 S C3H6 S HAc S CO Y AA
Figure 428 The effect of the oxygen concentration on catalytic performance
C3H8O2H2ON2=3y40(57-y) vol T=400degC GHSV= 4500 h-1 WF=0904 gsml catalyst 6059
The redox potential in terms of reducing stoichiometric and oxidizing feed was defined
with respect of the stoichiometry of 12 with respect to propane and oxygen
corresponding to the propane to acrylic acid transformation
Under reducing conditions both the conversion and selectivity to acrylic acid were found
to be slightly lower compared to the catalytic performance observed at stoichiometric and
oxidizing conditions However the conversion selectivity and consequently also the
yield to acrylic acid levels off at 6 vol O2 as demonstrated in Figure 428 The fact that
the propane conversion does not depend on the initial oxygen concentration under
stoichiometric and oxidizing conditions suggests that the O2 activation is not rate
limiting
For the determination of the reaction order with respect to oxygen the power rate law
was considered
427)(Equation lnlnln
426)(Equation
022
022
OO
n
OO
cnkr
ckr
sdot+=
sdot=
92
-40 -35 -30 -25 -20 -15 -10000
025
050
075
100
125
ln rO2
ln (cO2)ττττ=0
Figure 429 Determination of the reaction order with respect to oxygen Cat 6059
Since the initial propane concentration was constant at 3 vol in all the experiments the
first two terms in the right hand side of the power law were contracted into a single
apparent rate constant ḱ The reaction order was determined from the slope of the straight
line of the double-logarithmic plot (Figure 429) according to the linearized equation
427
The integral oxygen consumption rate was calculated as the product between the
fractional conversion (xO2) and the molar flow of oxygen in the feed (uO2) expressed in
micromolgs Weighted linear regression of the double-logarithmic plot gave a reaction order
with respect to oxygen equal to nO2=0512plusmn0002
Griszligtede and Balcells et al reported similar catalytic properties to that shown on Figure
428 [2 3] Under net oxidizing conditions (C3H8O2 ratio ranging from 26 to 220) the
propane conversion and product selectivities were the same for every oxygen
concentration and contact time [2 3 10] Balcells et al used reducing stoichiometric and
oxidizing feed the C3H8O2 ratio being between 115 and 14 The propane consumption
rate and acrylic acid formation rate leveled off at the molar ratio of C3H8O2=12 [2]
93
In contrast Zheng et al noted an increase in the propane conversion with the C3H8O2
molar ratio varied between 11 and 15 The highest selectivity and yield of acrylic acid
was observed at a molar ratio of 13 [7]
425 Propylene oxidation
Upon analyzing the concentrationndashresidence time plot propylene presents the first
maximum This means that it is an intermediate in the direct oxidation of propane to
acrylic acid The application of the delplot technique (section 64) also supported that
propylene is an intermediate At higher contact times where the acrylic acid selectivity is
higher the propylene selectivity is low usually less than 10 On the other hand
propylene is known to be more reactive in oxidation reactions
The selective oxidation of propylene is usually carried out at lower temperatures (325-
350degC) than propane oxidation [11] For these reasons the authors stated that the
oxidative dehydrogenation is the rate determining step in propane oxidation to acrylic
acid arguing that once the propylene is formed it reacts readily further to acrylic acid
and byproducts Griszligtede also reported the propylene oxidation over M1 and M2 phase
mixture MoVTeNbOx on steatite balls The reaction was performed at a lower
temperature interval (310-330degC) because at higher temperature the propane conversion
was nearly 100 Kinetic experiments on propylene oxidation were done at 360degC
However it may be inappropriate to extrapolate the reactivity and reaction kinetic data
from 310-360deg to 360-400degC [3]
A possible strategy for unraveling the pathways and kinetics of a complex reaction such
as propane oxidation is the bottom to top approach According to this approach catalytic
reaction is carried out using the reaction products and intermediates as educts The
product distribution gives information concerning the reaction pathways while the rates
show the relative reactivity of all the compounds However the reaction conditions
(temperature redox potential) should be chosen in such a way to approach those of the
one-step propane oxidation conditions in order to avoid an unjustifiable extrapolation
94
In order to explain the reactivity difference in propylene oxidation the results of two sets
of experiment are presented here
(a) at low GHSV of 5000 h-1 (WF=072 gsml) and in a low temperature interval
(230-270degC) (Figure 4210 top)
(b) at higher GHSV of 20000h-1 (WF=0018 gsml) and in the temperature
interval between 360 and 400degC (Figure 4210 bottom)
230 240 250 260 270
0
20
40
60
80
100
X C3H6 X O2 S AA S CO2 S Ace S HAc S CO C-bal
Conversion Selectivity ()
T (degC)
360 370 380 390 400
0
20
40
60
80
100
X C3H6 X O2 S AA S CO2 S Ace S HAc S CO C- bal
Conversion Selectivity ()
T (degC)
Figure 4210 Propylene oxidation with 6902 Feed composition C3H6O2H2ON2=364051 vol Top
GHSV=5000 h-1 bottom GHSV=20000 h-1 Catalyst 6902
95
In both experiments the feed composition was the following
C3H6O2H2ON2=364051vol The oxygen and steam contents were chosen to be
equal with that of the feed for propane oxidation on this catalyst
In the case (a) the propylene conversion was high despite of the low temperature
suggesting the high activity of the catalyst The main product was acetone its substantial
selectivity dropped approximately linearly with the temperature The selectivity of acrylic
acid - the second most abundant product - showed an increasing trend with the
temperature
The CO2 CO and acetic acid were found to be minor products the maximum selectivities
being 43 36 and 23 respectively Surprisingly maleic anhydride was also produced in
quite significant amounts as identified on the chromatogram by the mass spectrometric
detector
However the quantification of this product was not possible because of the very broad
and irreproducible peak shape in the chromatogram One reason for the scarce
reproducibility is that the maleic anhydride is a larger molecule and more polar than
acrylic acid The second difficulty is related to the fact that maleic anhydride hydrolyzes
to maleic acid in presence of the high steam content of the feed Hydrolysis may happen
in the downstream tubing of the reactor system as well as in the DB-1 column gas
chromatograph causing broad peaks with irreproducible peak areas
The temperature interval in case (b) was identical with that used for the propane
oxidation reaction Almost complete propylene conversion was achieved at a relatively
high space velocity of 20000 h-1 In contrast to the low space velocity ndash low temperature
experiment in this case the acrylic acid is the most abundant product with a maximum
selectivity at a reaction temperature of 380degC
A small amount of acetone is also produced during the reaction but its selectivity sinks
strongly with increasing reaction temperature CO2 CO and acetic acid are produced in a
higher amount than in the experiment carried out at low space-velocity and low
temperature An inversion can be observed in the selectivity ratio between the CO2 and
CO compared to the experiment done in the low temperature interval with five times
longer contact time
96
It is notable that a substantial amount of maleic anhydride was also produced but the
quantification problem was more severe than is case (a) Therefore the maleic acid
selectivity was not calculated in any of the above two cases which led to a systematic
error in the carbon balance as shown in the Figure 4210 Nevertheless the formation of
maleic acid a four carbon atom containing product from propylene is indeed not
straightforward One possible explanation is that hydrogen radical was removed from the
methyl group of propylene Then two allyl radicals recombined to benzene which finally
was oxidized to maleic acid
Because the propylene conversion at 270degC GHSV=5000h-1 and 360degC 20000h-1 are
very similar the selectivities obtained under these two conditions can readily be
compared It is to be observed that the product distribution is very different In the low
space velocityndashlow temperature experiment acetone is the most abundant product
followed by acrylic acid while in the higher space velocityndashhigher temperature
experiment these selectivities were inverted On the other hand during propane
oxidation reaction acetone is not produced in detectable amounts even if propylene is an
intermediate product Also the CO and CO2 selectivity ratio is inverted in the low
temperature interval
Therefore this experiment exemplifies that the catalytic and kinetic experiments of
propylene and other intermediate oxidation should be performed in the temperature
interval which is identical to that used for propane oxidation
The effect of steam on the catalytic performance of propylene oxidation over phase pure
MoVTeNbOx was also investigated (Figure 4211) The steam content variation was
performed using the same procedure as in the case of propane oxidation The steam
content was reduced from 40vol to 0 vol by 10 vol steps No deactivation was
observed in absence of steam After exposing the catalyst to dry feed the catalytic
performance was re-measured at 20 vol steam content
97
20 10 0 10 20 30 40
0
20
40
60
80
100
Conversion Selectivity () X C3H6
X O2 S AA S CO2 S Ace S HAc S CO C-bal Y AA
z=H2O concentration in feed mixture (vol)
Figure 4211 The effect of H2O on propylene oxidation Feed composition C3H6O2H2ON2=36z(91-z)
vol GHSV=80000 h-1 T=400degC Catalyst 6902
The reaction temperature was set to 400degC which is identical with the temperature where
the steam content variation for propane oxidation was carried out Since in the
temperature variation at a space velocity of 20000 h-1 almost 100 propylene conversion
was observed at 400degC the steam content variation was carried out at a space velocity of
80000 h-1 (WF= 0045 gsml) At this high space velocity the highest conversion was
approximately 40 between 20 and 40 vol steam content
Similarly to the observations for the steam content variation in the propane oxidation the
conversion decreased continuously below 30 vol steam content while a significant
drop below 20 vol steam concentration also for propylene oxidation The acrylic acid
selectivity did not change significantly upon decreasing the steam content of the feed
However the acetone selectivity decreased dramatically at 0 vol steam content no
detectable amount of acetone was formed This suggests the involvement of steam in
acetone formation according to the oxy-hydration pathway [12-16]
It is notable that in absence of co-fed steam the selectivity to total oxidation products
increased and the ratio between the COCO2 selectivities was inverted compared with
experiments carried out in the steam-containing feed Since the propylene conversion was
relatively low maleic anhydride formation was also lower which led to a better carbon
balance than that reported for the space velocity of 20000 h-1
98
Upon re-measuring the catalytic performance in 20 vol steam the catalytic
performance was found to be identical with the one determined before measuring in a dry
feed The reversibility of both the conversion and selectivity with the steam content is
similar to that observed in the case of propane oxidation
426 Acrolein oxidation
Propylene was found to be the first intermediate in propane selective oxidation It is
supposed that the oxidation of propylene to acrylic acid proceeds through allyl alcohol
and acrolein intermediates This assertion was supported by the fact that the oxidation of
propylene to acrylic acid in a single elementary step is not probable because such a
transformation would require the elimination of two hydrogen atoms and insertion of two
oxygen atoms
Postulated reaction pathways take into consideration acrolein and sometimes allyl-
alcohol formation as well although only in a few studies is their detection reported under
catalytic conditions [16-21]
Concepcioacuten et al reported the detection of a π-allylic intermediate (CH2=CH-CH2-O-) by
means of FTIR spectroscopy on MoVTeNbOx catalyst [22] It was suggested that this
surface intermediate of the propylene oxidation is transformed to acrylic acid by a redox
mechanism via acrolein However in the gas phase no acrolein was detected
In the propane and propylene oxidation experiments described above neither allyl
alcohol nor acrolein was formed at any space velocity andor feed composition in the
temperature interval between 360 and 400degC
The purpose of this experiment was to determine the reactivity and product distribution in
acrolein oxidation over the phase-pure MoVTeNbOx catalyst
For the catalytic experiment a feed with the following composition was used
acroleinO2H2ON2=36091vol at a weight hourly space velocity of 250000 mlgh
(WF=0014 gsml) The temperature was varied between 360 and 400degC (Figure 4212)
99
360 370 380 390 4000
10
20
70
80
90
100
Conversion Selectivity ()
T (degC)
X Acr X O2 S AA S CO2 S HAc S CO
Figure 4212 The effect of temperature on acrolein oxidation Catalyst 6059
As seen in Figure 4213 the catalyst is very active in acrolein oxidation even at very
high space velocity The highest acrylic acid selectivity was attained at 380degC while the
highest yield of 89 at 400degC
Acetic acid was found to be a by-product its selectivity decreased with increasing
temperature Literature sources also reported the production of acetic acid during the
oxidation of acrolein Without experimental evidence Lin et al explained the appearance
of acetic acid byproduct as due to oxidative degradation of acrylic acid at temperatures
close to 400degC [23] However both the acrolein and acrylic acid contain only sp2 carbon
atoms while acetic acid contains a sp3 carbon atom as well This would imply that the
C=C bond is saturated upon oxidation of acrylic acid (ie the formal charge of -2 is
reduced to -3) Such saturation (reduction) is uncommon in oxidation reactions A
possible explanation might be the intra-molecular transposition of a hydrogen atom from
the carbonyl- or carboxyl group to the methylene group
An increasing trend was observed for CO and CO2 the latter total oxidation product
being produced in larger amount than CO
From the Arrhenius- and Eyring-Polanyi plots the activation parameters of acrolein and
oxygen consumption were determined (Table 422)
100
Table 422 The activation parameters of acrolein oxidation on 6059 catalyst
Parameter Acrolein Oxygen
Ea (kJmol) 255 plusmn 14 249 plusmn 20
lnA 915 plusmn 02 75 plusmn 04
∆H (kJmol) -20129 plusmn 0002 -183617 plusmn 0003
∆S (JmolK) -183617 plusmn 0003 -197160 plusmn 0003
427 CO oxidation and water gas shift reaction
As observed at the kinetic study of propane oxidation (421 and 422 subchapters) the
CO formation rate was always higher than the CO2 formation rate in the studied contact
time interval independently of the temperature and steam content This raised the
question whether first the CO is produced which upon further oxidation is converted to
CO2 The delplots indicate that both CO and CO2 are mainly second rank products
(Section 64) However the delplot technique relies on extrapolation of the dependent
variable to zero propane conversion This implies that strictly speaking the rank order is
valid only in the differential regime
The CO concentration profile steadily increased in the studied contact time interval
without showing a maximum characteristic to an intermediate product (Figure 421 and
425) Because of these reasons it was not possible to state or to refute whether CO is
further oxidized On the other hand the oxidation of CO by water known as water gas
shift reaction could neither be confirmed nor denied based on the kinetic data of propane
oxidation
To answer the above questions CO oxidation experiments were carried out In order to
get more insights in the reaction kinetics possible reaction pathways and oxygen species
on the catalyst surface the reactivity of CO oxidation was screened in the following
order
i) CO oxidation in absence of steam using stoichiometric and oxidizing feed
(COO2N2=315955 vol and COO2N2=3691 vol respectively)
ii) Water-gas shift reaction with a feed containing 40 vol steam
(COO2H2ON2=304054 vol)
101
iii) CO oxidation in absence of steam using oxidizing (COO2H2ON2=364051
vol) feed
The steam-free feed resembles to propane oxidation carried out in absence of water The
choice of COO2=315 and 36 covers a wide range of redox potentials which occur
under propane oxidation conditions
In the presence of oxygen and water the CO oxidation by oxygen and the water gas shift
reaction may occur simultaneously
)224 (Re
)124 (Re 2
1
222
22
actionHCOOHCO
actionCOOCO
+rarr+
rarr+
This would lead to an ambiguity in deciding which reaction is actually taking place On
the other hand the contribution of each to the overall CO oxidation reactivity is also
difficult because the above mentioned parallel reaction steps involve the same educt and
the same product Therefore it was necessary to perform separately the water gas shift
reaction and the CO oxidation reaction in presence of steam The conditions of these two
reactions were also chosen in such a way to cover the relevant conditions of propane
oxidation reaction
Since the CO oxidation and water gas shift activity of MoVTeNbOx mixed metal oxide
catalysts was not reported up to now the reactivity screening started with an exploratory
measurement performed in a wide range of temperature (from 150 to 400degC) and two
space velocities (3000 h-1 and 12000 h-1 respectively) in dry feed The product appeared
only at temperatures higher than 250degC at low space velocity (Figure 4214) However
the highest conversion of CO was only 1 At the space velocity of 12000 h-1 no
reactivity was observed below 350degC
102
150 200 250 300 350 400
000
001
002
003
004
005
CO2 concentration (vol
)
T (degC)
COO2H2ON2=3150955vol GHSV=3000h-1
COO2H2ON2=36091vol GHSV=3000h-1
COO2H2ON2=3150955volGHSV=12000h-1
Figure 4213 CO oxidation at different temperatures space velocities in stoichiometric and oxidizing
feed Catalyst 8947
The activation parameters of CO oxidation reaction have been determined based on the
linearized Arrhenius- and Polanyi-Eyring plots The results are summarized in Table
423
Table 423 The activation parameters of CO oxidation in dry feed
Feed Stoichiometric
COO2=21
Oxidizing
COO2=12
lnA 75plusmn12 92plusmn12
Ea (kJmol) 41plusmn7 52plusmn2
∆H (kJmol) -36plusmn7 -46plusmn2
∆S (JmolK) -197plusmn10 -183plusmn3
After performing the above exploratory experiment the space velocity variation was
carried out for CO oxidation in dry feed for the water gas shift reaction and CO
oxidation in presence of steam The catalytic data are summarized in Figure 4214 This
plot reveals the least reactivity in the water gas shift reaction the highest CO conversion
being 05 in the studied contact time interval
103
The CO oxidation activity in dry feed was higher than the water gas shift reaction For
the CO oxidation in dry feed the CO conversion was found to be the same
independently on whether the feed was stoichiometric or oxidizing
The highest activity was observed in the case of CO oxidation in presence of 40 vol
steam It should be mentioned that the reactivity in this latter reaction is not a simple
algebraic sum of the CO oxidation in dry feed and the water gas shift reactions
However in all these reactions the conversion of CO to CO2 is far below 2 These
observations show that the CO oxidation and water gas shift reaction are negligible
reaction steps under the propane oxidation reaction conditions It is also to be mentioned
that the kinetic study of propane oxidation was carried out in the space velocity interval
between 66000-4500 h-1 (WF=005-090 gsml)
00 02 04 06 08 10 12 14
000
001
002
003
004
COO2H
2ON
2=3150955vol
COO2H
2ON
2=36091 vol
COO2H
2ON
2=364051 vol
COO2H
2ON
2=304057 vol
CO2 concentration (vol
)
WF (gsml)
Figure 42 14 Space velocity variation for CO oxidation and water gas shift reaction
The low reactivity in CO oxidation reaction has two implications with respect to the
propane oxidation
The first is related to the reaction pathways involving CO and CO2 The above
experiments revealed that the CO is not further oxidized to CO2 under any conditions
This suggests that in the propane oxidation reaction CO and CO2 are formed in two
different and independent pathways
104
The second implication is related to the nature of oxygen species As it was described in
the introduction the CO oxidation activity is related to the presence of the electrophilic
oxygen species on the catalyst surface [24]
Although quantitative correlations were not done because of the lack of calibration
standards based on the negligible CO oxidation activity it can be stated that the
electrophilic oxygen species are not abundant on the phase-pure MoVTeNbOx catalyst
under propane oxidation conditions
428 Comparison of the reactivity of propane propylene acrolein and carbon
monoxide oxidation reactions
The activity of phase pure MoVTeNbOx catalyst in propane propylene acrolein and
carbon monoxide oxidation is summarized and presented on Figure 4215 Because the
reactivity of propylene and acrolein is higher the space velocity was adjusted in such a
way that the conversion is below 100 Therefore the propylene oxidation was carried
out at a space velocity of 20000 h-1 while in the case of acrolein oxidation a much higher
space velocity of 250000 h-1 was used
Because the conversions at different space velocities are difficult to compare the
consumption rates of the four educts were calculated and plotted versus the reaction
temperature
The reactivity increases in the following order carbon
monoxideltltpropaneltpropyleneltltacrolein The reactivity ranking order of propane
propylene and acrolein is similar to that reported by Ai [19] and Lin et al [23] However
in these literature sources the reactivity ranking order was established by performing the
reactions at the same space velocity and varying the reaction temperature
105
360 380 4000
2
4
660
70
80
90
100 rC3H8 GHSV=5000h-1 H2O=40vol 6902
rC3H6 GHSV=20000h-1 H2O=40vol 6902
rAcr GHSV=250000h-1 H2O=0vol 6059
r ( micromicro micromicromolgs)
T (K)
200 250 300 350 400000
001
002
05
10
15
20
rC3H8 GHSV=5000h-1 H2O=40vol 6902
rC3H8 GHSV=5000h-1 H2O=40vol 8947
rCO GHSV=3000h-1 H2O=0vol 8947
rCO GHSV=4500h-1 H2O=0vol 8947
rCO GHSV=4500h-1 H2O=40vol 8947
rWGS GHSV=4500h-1 H2O=40vol 8947
r ( micromicro micromicromolgs)
T (degC)
Figure 4215 Comparison of the propane propylene acrolein (top) propane CO oxidation and water gas
shift activity (bottom) of the catalyst
As Figure 4216 indicates the reaction rates span over four orders of magnitude The
relative rate of propylene consumption with respect to propane consumption is equal to
66 at the reaction temperature of 400degC On the other hand the relative rate of acrolein
oxidation at 400degC is 944 The relative rate of CO oxidation with respect to propane was
106
0016 and 0011 in dry feed and 40 vol steam containing feed respectively The lowest
relative rate of 0006 was observed for the water gas shift reaction on the MoVTeNbOx
catalyst
43 Two-stage reactor used as a distributor of oxidizing and reducing gases
The dosing of oxygen in catalytic membrane reactors and multi-tubular reactors were
reported to give better catalytic performance compared to the conventional single tube
fixed bed reactor design [25-31] The ODH of propane and ethane was extensively
studied by Seidel-Morgenstern et al [31] The ODH and selective oxidation reaction to
acrylic acid share the same steps of propane activation to propylene therefore
qualitatively these two reactions are similar The oxidation of propane to acrolein [32]
and acrylic acid [33] was reported by employing a dual-bed sytem whereby in the first
reactor ODH proceeded while in the second reactor the propylene was further oxidized
In contrast to these above mentioned catalyst systems the MoVTeNbOx is able to
oxidize directly the propane to acrylic acid Therefore in the present section the selective
oxidation of propane is reported over a phase-pure M1 MoVTeNbOx catalyst in a two-
stage reactor
The stage-wise addition of oxygen and other gases was performed in a system consisting
of two reactor tubes connected serially (two-stage reactor TSR) The addition of gases
was technically realized by means of a T-junction installed on the tubing that connects
the two reactor tubes (section 224 Figure 223)
The reactors were loaded with the same amount of catalyst phase-pure M1 MoVTeNbOx
catalyst (02400 g or 02667 ml sieve fraction of sample 6059) mixed with SiC diluent
The initial concentration of the feed components entering the first reactor was kept
constant (C3H8O2H2ON2=364051vol) while different gases (O2 N2O C3H6 CO
and CO2) were added to the gas mixture entering the second reactor tube The
temperature of both reactors was set to 400degC A total flow rate of 40 mlnmin
corresponds to a space velocity of 9000 h-1 in each reactor tube while the overall space
velocity is 4500 h-1
107
431 Addition of O2 and N2O
The variation of oxygen concentration in a single tube reactor revealed that the catalytic
performance is neither enhanced nor reduced by up to a five-fold oxygen excess
compared to the stoichiometric feed The effect of the redox potential was studied also in
the two-stage reactor setup
Additionally the potential applicability of N2O as an oxidant was examined The
motivation for this was the numerous reports in the literature about the successful
application of nitrous-oxide as oxidant instead of molecular oxygen in heterogeneously
catalyzed reactions (ie the industrial oxidation of benzene to phenol over FeZSM-5
catalyst alkane oxidative dehydrogenation propylene epoxidation hydroxylation of
chlorobenzene fluorobenzene phenol biphenyl [34]) Also N2O was found to be an
applicable oxidant in propane oxidative dehydrogenation on VOx on MCM-41 [35] SiO2
and γ-Al2O3 [36] supports Markedly higher propylene selectivity was reported when
N2O was using as oxidant compared to the catalytic data obtained with O2 This was
explained by the slower reoxidation kinetics observed in case of N2O More recently
Kondratenko et al reported two different surface species as probed by in-situ EPR
spectroscopy and postulated two different reoxidation mechanisms of the VOxMCM-41
catalyst by O2 and N2O respectively In the case of reoxidation by O2 the Vn+hellipO-
species was identified which was assumed to give rise to O- electrophilic species leading
to total oxidation [37]
However no reports were found about the potential application of N2O in the oxidation
of propane to acrylic acid
The staged addition of oxygen was performed as follows First the propane oxidation
reaction was performed at a space velocity of 9000 h-1 using the feed of
C3H8O2H2ON2=364051vol in a single-tube operation mode The oxygen content of
the effluent mixture was found to be 4 vol Therefore in the two-stage operation mode
the initial oxygen concentration in the second reactor tube is equal to 4 vol without
addition of oxygen
108
-05 00 05 10 15 20 25 3009
10
11
12
4000
4250
4500
4750
5000
0
3
6
9
12
15
Overall GHSV (h-1)
Dilution ratio
added O2 flow rate (mlnmin)
O2 concentration that enters in R2 (vol)
overall O2 concentration in R1+R2 (vol)
O2 concentration (vol
)
Figure 431 The dilution ratios (black squares) overall space velocities (black dots) and the oxygen
concentrations (empty and full blue triangles) in function of the flow rate of the added oxygen
To the effluent gas mixture leaving the first reactor tube pure oxygen gas was added
through the T-junction in order to achieve initial oxygen concentrations of 6 8 and 10
vol O2 in the second reactor tube
The overall oxygen concentration in the two reactor tubes was 6 8 10 and 12 vol
respectively Because of the oxygen addition the total flow rate increased in the second
reactor tube and in the same time the reaction mixture was diluted The dilution factor
the overall space velocity the oxygen concentration at the inlet of the second reactor tube
and the overall oxygen concentration in the two-stage reactor in function of the flow rate
of added oxygen gas is displayed in Figure 431 The dilution factor and the space
velocity change were taken into account for the calculation of the conversion selectivity
and reaction rates
The reaction rates obtained at a space velocity of 4500 h-1 in the single-tube mode and
two-stage mode without addition of oxygen between the two reactor tubes were very
similar (Figure 432) In contrast to the oxygen content variation experiments performed
in the single tube reactor (Figure 428 in subchapter 424) the staged addition of oxygen
in relatively high concentration positively influenced the catalytic properties
109
4 6 8 1000
04
08
12
00 05 10 15 20 25
6 8 10 12
O2 concentration in mixture that enters in R2 (vol)
Rates (
micromicro micromicromolgs)
r C3H8 r C3H6 r CO2 r CO r HAc r AA
no O2
additionaddition of O2
Added O2 between R1 and R2 reactors (mlnmin)
Overall O2 concentration (vol)
Figure 432 The effect of oxygen addition in the two-stage reactor
At the oxygen content of 8 and 10 vol in the second reactor (10 and 12 vol overall
oxygen content) the overall rate of propane consumption increased slightly compared to
measurements with lower oxygen concentrations (Figure 432)
The rate of acrylic acid formation was observed to increase at 8 and 10 vol oxygen
concentrations in the second reactor The rate of CO and CO2 production increased only
marginally upon oxygen addition while the rate of propylene and acetic acid formation
was not influenced by the oxygen concentration
When the catalytic properties obtained in the two-stage reactor and single-tube reactors
were compared in terms of conversion selectivity and yield two cases could be
distinguished (Figure 433) Both reactor systems performed similarly at 6 and 8 vol
overall oxygen concentration However the catalytic performance in the two-stage
reactor is superior to the single-tube reactor above 8 vol overall oxygen content A net
increase of 11 in the propane conversion and an increase of 47 in the acrylic acid
selectivity was determined at an overall oxygen content of 10 vol compared to the
110
single-tube reactor experiment Therefore by employing the two-stage reactor the acrylic
acid yield could be increased by 53
4 6 8 10 12 14 16 180
20
40
60
80
100Conversion Selectivity Yield ()
Overall O2 concentration (vol)
XC3H8 TSR
XC3H8 STR
SAA TSR
SAA STR
YAA TSR
YAA STR
0 10 20 30 40 50 60 70 80 90 1000
20
40
60
80
100
SAA ()
XC3H8 ()
STR 6 vol O2 GHSV var
STR O2 var GHSV=4500h
-1
TSR O2 var GHSV=4500h
-1
Figure 433 Comparison of the catalytic performance in the single-tube reactor (STR) and two-stage
reactor (TSR)
As already mentioned above the oxygen addition diluted the reacting gas mixture and
also increased the space velocity However the conversion and selectivity also depends
on the space velocity Firstly it can be ruled out that the slight enhancement of propane
111
conversion is due to the increase of space velocity from oxygen addition because the
conversion decreases with increasing space velocity
In order to rule out that the positive effect of oxygen addition on the selectivity is an
artifact due to the minor increase of space velocity a conversion-selectivity plot was
constructed displaying all the STR and TSR data (Figure 433 bottom) On this plot the
selectivity to acrylic acid determined at 6 vol initial oxygen concentration in the STR
passed through a maximum at a conversion of ca 55 Despite varying the oxygen
content variation in the STR operation mode the selectivity could not be improved On
the other hand upon oxygen addition in the TSR both the conversion and the selectivity
increased the data points were above the maximum of the conversion-selectivity curve
corresponding to the conventional STR system This revealed that the increase in the
selectivity is not an artifact due to the change of the space velocity by oxygen addition
The feasibility of application of N2O as an oxidant was also studied in the two-stage
reactor The N2O concentration was varied from 05 vol up to 40 vol in the second
reactor keeping constant the gas mixture composition of C3H8O2H2ON2=364051
vol in the first reactor The catalytic properties were found to be the same in the
presence of N2O irrespective of its concentration (Figure 434) Moreover the N2O
conversion was found to be zero indicating that N2O has no effect on the reaction when
dioxygen is also present in the gas mixture Then the initial oxygen concentration fed in
the first reactor was reduced from 60 to 40 vol and in the same time 4 vol N2O was
fed in the second reactor respectively (Figure 434 condition noted with ) Under this
condition total O2 consumption was observed accompanied by a slight decrease of the
propane conversion and a significant decrease of the acrylic acid selectivity At the same
time the propylene acetic acid and carbon dioxide selectivities are increasing slightly
Under reducing condition the N2O conversion was also found to be zero similarly for
the catalytic runs performed in presence of dioxygen In terms of oxygen atoms 4 vol
N2O is equivalent with 2 vol O2 Therefore feeding 4 vol oxygen and 4 vol N2O in
the two-stage reactor is equivalent to 6 vol oxygen with respect to oxygen atoms The
fact that the N2O conversion was zero throughout all the above described conditions led
112
to the conclusion that N2O does not reoxidize the phase-pure MoVTeNbOx catalyst under
propane oxidation conditions The explanation for this observation could be that either
the N2O does not adsorb on the surface of the catalyst or the catalyst in unable to activate
the N-O bond while there is no such a constraint in dioxygen adsorption and the
activation of the O=O bond
0 1 2 3 4 5 6
0
20
40
60
80
100
added N2O (vol)
X C3H8 X O2 X N2O S AA S CO2 S C3H6 S HAc S CO C-Bal Y AA
Conversion Selectivity Yield ()
Figure 434 Addition of N2O in the two-stage reactor Conditions noted with stars - 40 vol O2
introduced in R1 reactor and 40 vol N2O in R2 reactor - 6 vol O2 introduced in R1 reactor and 00 vol N2O in R2 reactor
Nitrous oxide may undergo thermal dissociation leading to N2 and O The oxygen free
radicals may induce radical homogeneous reactions under propane oxidation conditions
Although as it is shown above the product distribution is independent on the
concentration of added N2O it was necessary to assess the amount of the highly reactive
oxygen radical the new oxygen species introduced in the system by the addition of N2O
Based on the kinetic data published by Allen et al [38] on thermal dissociation of N2O
the maximum concentration of the gas phase oxygen radical was found to be 54108
radicalscm-3 (in the order of 10-15 mol radicalcm-3) The calculated conversion of N2O
towards N2 and O was extremely low in the order of magnitude of 10-8 This is in
accordance with the observed zero conversion of N2O during the addition experiments
113
Therefore this calculation proves that the thermal dissociation of N2O and the appearance
of oxygen radicals are negligible under propane oxidation conditions
After the N2O was switched off and 6 vol O2 was fed in the first reactor in the
beginning the conversion of propane and the selectivity of acrylic acid were as low as in
the case of 4 vol O2 in the first reactor and 4 vol N2O in the second reactor
0 100 200 300 4000
20
40
60
80
100
X C3H8 X O2 S AA S CO2 S C3H6 S HAc S CO C-bal Y AA
Conversion Selectivity Yield ()
TOS (min)
before after the N2O-addition experiment in TSR
Figure 435 Reactivation of the catalyst after exposing to reducing conditions
The catalytic properties converged slowly (in ca 8 hours time on stream) to the initial
values (ldquoreactivation during catalytic reactionrdquo) (Figure 435) This suggests the
reversibility of the decay in catalytic performance when operating the reaction under
reducing conditions for short time on stream (1 hour)
432 Addition of propylene
In the previous section it was shown that the staged addition of the oxygen can increase
the catalytic performance The effect of added reducing agents was also studied
The reducing agent was chosen based on the following considerations
i) the added compound should neither produce compounds which may poison the
catalyst nor react in homogeneous or heterogeneous pathways with the intermediates or
products of propane oxidation reaction
114
ii) it should present a reasonably high reduction potential and
iii) it should not introduce additional complexity in the reaction pathways of
propane oxidation
Hydrogen was not applied because of the i) and ii) criteria Firstly it may hydrogenate
the propylene and acrylic acid at 400degC Secondly the onset temperature of H2-TPR of
the catalyst was at around 370degC whith the peak maximum at 450degC (data not shown)
therefore is not a very strong reducing agent Ethylene the C1-C3 alcohols and aldehydes
were excluded based on the iii) criterion because all of these compounds are oxidized to
aldehydes or acids and undergo total oxidation pathways as well The remaining options
were propylene and carbon monoxide
However both of these compounds are also reaction products in the propane oxidation
reaction Being an intermediate propylene is further oxidized to acrylic acid acetic acid
and carbon oxides
In the following the addition of propylene in the two-stage reactor is presented (Figure
436) Upon addition of 050 and 075 vol propylene between the two reactors the
global rate of propane consumption was constant within experimental errors However
the propylene concentration monitored at the outlet of the second reactor was constant
irrespective of the added amount of propylene between the two reactors The global rate
of propylene formation was constant in spite of addition This means that the whole
amount of added propylene completely was completely consumed The oxidation of the
added propylene was well reflected in the enhancement of the global rates of acrylic acid
acetic acid and carbon monoxide and carbon dioxide formation It is notable that upon
propylene addition in the two-stage reactor no other product (ie acetone) was detected
by the GC-MS setup like in the case of propylene oxidation
The significant increase of the oxygen consumption rate attests that the added propylene
indeed acts as a strong reducing agent Addition of propylene in higher concentration
than 075 vol was avoided in order to keep the oxygen conversion below 100
Upon switching off the propylene addition the catalytic properties were remeasured
Because the catalyst was not exposed to very reducing conditions (XO2lt100) the
catalytic performance was found to be constant over time (ie no ldquoreactive reactivation
was observed like in the case shown on Figure 436) The rates of propane consumption
115
and the product formation were found to be very similar to the values determined before
the addition of propylene (Figure 436) This also supports the observed reversibility of
the catalytic properties after operating the reaction under reducing conditions
000 025 050 075 10000
02
04
06
0818
20
22
24
26
28
30
noaddition
C3H6addition
000
Rates (
micromicro micromicromolgs)
added C3H6 in R2 (vol)
r C3H8 r O2 r C3H6 r CO2 r CO r HAc r AA
noaddition
Figure 436 The effect of C3H6 addition of in the two-stage reactor
A very slight decrease of the propane consumption rate was observed upon propylene
addition This may suggest that there is a slight competition between propane and
propylene on the adsorption sites Microcalorimetric experiments on propane and
propylene adsorption showed that a larger amount of propylene can be adsorbed
compared to propane at the same equilibrium pressure [39] On the other hand the
additional propylene may be adsorbed on the sites which are energetically less favored
for propane adsorption
In turn the results may be interpreted as there are two active sites One of them is
performing the oxidative dehydrogenation of propane while the other one oxidizes
further the propylene The slight reduction of the propane consumption rate may be a
consequence of the higher reduction degree of the catalyst surface
116
433 Addition of CO
In the 427 section it is shown that CO oxidation reactivity over MoVTeNbOx catalyst is
a negligible even though CO is known to be a reducing compound This can be attributed
to low abundance of electrophilic oxygen species on the surface
However because of the very low reactivity in CO oxidation the surface redox property
of the MoVTeNbOx catalyst certainly does not change significantly during one catalytic
cycle On the other hand the catalyst showed ca 80 times higher reactivity in propane
oxidation (Figure 4215) therefore in this reaction the reduction degree is expected to be
changed more significantly during one catalytic cycle [40] Upon such significant
changes of the oxidation states the nature and the abundance of the surface oxygen
species might be different Because the CO oxidation reaction is suitable for semi-
quantitative estimation of the electrophilic oxygen species the CO addition in the two-
stage reactor was performed in order to probe the changes of the abundance of active
oxygen species during propane oxidation reaction
000 025 050 075 10000
02
04
06
0816
18
20
22
24
26CO addition
no addition
r C3H8 r O2 r C3H6 r CO2 r CO r HAc r AAR
ates (
micromicro micromicromolgs)
added CO in R2 (vol)
0
no addition
Figure 437 The effect of CO addition in the two-stage reactor
Upon addition of 05 vol CO to the mixture that enters the second reactor no change in
the propane and oxygen consumption was observed (Figure 437) This suggests that CO
117
does not compete with propane for adsorption sites and is not further oxidized to CO2
The added CO concentration was subtracted from the concentration measured at the
outlet of the second reactor The resulting value was found to be identical with the CO
concentration measured without addition Moreover the CO2 formation was also not
affected by the CO addition These latter observations also support the fact that the CO
oxidation during propane selective oxidation reaction is negligible independent of the
surface redox potential changes of the catalyst in the catalytic cycle
The formation of propylene acetic acid and acrylic acid was also not affected by the CO
addition revealing that the CO is an inert end-product
This experiment confirmed that the electrophilic oxygen species are not abundant on the
catalyst surface under working conditions
434 Addition of CO2
Carbon dioxide is the thermodynamically favored end product of the propane oxidation
reaction Although it is often considered to be an inert product CO2 may play different
roles in heterogeneous catalysis
bull competitively adsorb with educt or intermediates on the active sites
bull it was reported to increase the conversion in the dehydrogenation reaction
of isobutane [41]
bull the presence of CO2 was found to be beneficial for propane oxidation
reaction over MoVTeNbOx catalyst The obtained catalytic results
revealed a linear increase of yield of acrylic acid with the CO2 content in
the feed [42]
The microcalorimetric experiment on CO2 adsorption revealed that the density of sites
interacting with CO2 is higher than the density of sites available for propane adsorption
On the other hand the initial differential heat of adsorption of CO2 was found to be ca 30
kJmol while for propane adsorption a value of 40 kJmol was determined on catalyst
6059 after propane oxidation reaction The heat profile corresponding to the CO2
adsorption on the used catalyst indicated a relatively homogeneous distribution of the
surface basic sites
118
CO2 addition in the two-stage reactor system was performed in order to find out whether
it competitively adsorbs with propane on the active sites of the catalyst Up to 20 vol
CO2 was added to the gas mixture leaving the first reactor tube (Figure 438)
00 05 10 15 20 25 3000
02
04
06
08
18
20
22
24
26no
add
00
Rates (
micromicro micromicromolgs)
added CO2 in R2 (vol)
r C3H8 r O2 r C3H6 r CO2 r CO r HAc r AA
CO2 additionno
add
Figure 438 The effect of CO2 addition in the two-stage reactor
Because the added CO2 is a non-reactive gas added to the mixture a mass balance
equation was set in order to calculate the amount of CO2 produced in the reaction Figure
438 displays the rates of educt consumption and product formation as a function of the
concentration of the added CO2 No significant changes could be observed in the propane
and oxygen consumption rate
The propylene and acrylic acid formation rate is insensitive to the addition of CO2 This
suggests that carbon dioxide does not adsorb competitively either with propane or with
propylene on the active sites of the catalyst A slight increase in the CO formation rate
could be observed when 10 vol CO2 was added to the reacting mixture On the other
hand CO2 formation rate was slightly reduced when 20 vol CO2 was added while
acetic acid formation was slightly enhanced by the presence of carbon dioxide
119
44 Conclusions
Catalytic and kinetic studies on propane oxidation to acrylic acid were carried out using a
high performing phase-pure M1 MoVTeNbOx catalyst The reaction temperature redox
potential of the gas phase and the steam content of the feed was varied The highest
acrylic acid yield of ca 30 was attained at 400degC and stoichiometric feed containing 40
vol steam A reversible drop of the catalytic performance was observed when the steam
concentration was decreased to 0 vol Neither the conversion nor the selectivity was
increased or decreased in oxidizing feed (up to five-fold excess of oxygen)
The oxidation of intermediates (propylene and acrolein) and CO over the phase-pure M1
catalyst was also performed at the same temperature interval where propane oxidation is
carried out in order to establish the reactivity ranking product distribution and to probe
the reaction pathways
The catalyst was found to be ca 6 times more active in propylene oxidation compared to
propane oxidation at a temperature of 400degC the main product being acrylic acid The
acrolein oxidation rate was ca 100 times higher compared to the propane oxidation at
400degC while the acrylic acid yield was over 90 On the other hand the rate of CO
oxidation and water gas shift reaction was found to be ca 100 times lower compared to
the propane oxidation The low reactivity in CO oxidation suggested low abundance of
electrophilic oxygen species Additionally this finding suggested that the CO and CO2
are produced in independent pathways during the propane propylene and acrolein
oxidation reactions
Staged addition of oxidizing and reducing agents (O2 N2O C3H6 CO and CO2) was
performed in a setup consisting of two serially connected reactor tubes The oxygen
content variation in this arrangement lead to increase in the propane conversion and
acrylic acid selectivity giving an improvement of the acrylic acid yield by 5 compared
to the conventional fixed bed reactor Additionally it was found that N2O is an inert gas
in the propane oxidation reaction This lead to the conclusion that the phase-pure
MoVTeNbOx catalyst in unable to activate the N2O molecule
Upon addition of propylene the formation rate of acrylic acid acetic acid CO and CO2
products increased
120
The addition of CO did not influence the consumption rate of propane and oxygen and
the formation rate of any product This suggested that the CO does not adsorb
competitively with propane or any intermediates on the active sites Additionally this
experiment proved that the CO oxidation activity is very low during propane oxidation
reaction therefore indirectly also proved that the CO2 is produced independently from
CO in the propane oxidation reaction The observation concerning the low abundance of
electrophilic oxygen species irrespectively on the degree of reduction of the catalyst
surface within one catalytic cycle was also supported by the results of this experiment
The CO2 addition in relatively low concentration also did not influence the rates
significantly suggesting that the thermodynamically favored end product does not adsorb
competitively with the educt or intermediates on the active sites of the catalyst
References Chapter 4
1 E Novakova E G Derouane J Veacutedrine Catal Lett 83 3-4 (2002) 177-182 2 E Balcells F Borgmeier I Griszligtede H-G Lintz Catal Lett 87 (2003) 195 3 I Griszligtede Die Partielle Oxidation von Propan zu Acrylsaumlure Bestimmung der
Reaktionskinetik und in-situ characterisierung des Katalysators unter Betriebsbedingungen Dissertation Universitaumlt Karlsruhe 2004 Universitaumltsverlag Karlsruhe ISBN 3-937300-17-1 E Balcells
4 F Borgmeier I Griszligtede H-G Lintz F Rosowski Appl Catal A General 266 (2004) 211
5 J B Butt Reaction kinetics and reactor design 2nd Ed Marcel Dekker Inc 2000 pp 25-35
6 J L Dubois D Garrait A Le Gall G Bazin S Serreau FR Patent WO 2006072682 A1 2006
7 W Zheng Zh Yu P Zhang Y Zhang H Fu X Zhang Q Sun X Hu J Natural Gas Chemistry 17 (2008) 191-194
8 Ch G Hill An Introduction to Chemical Engineering Kinetics and Reactor Design John Wiley and Sons 1977 24-74
9 R W Missen Ch A Mims B A Saville Introduction to Chemical Reaction Engineering and Kinetics John Wiley and Sons 1999 49-55
10 I Griszligtede H-G Lintz Catal Lett 87 (2003) 195 11 G Centi F Cavani F Trifiro Selective oxidation by heterogeneous catalysis
Kluwer AcademicPlenum Publishers 2001 363-384 12 M Ai J Catal 101 (1986) 473-483 13 Y Moro-oka Appl Catal A General 181 (1999) 323-329 14 L Luo PhD thesis California Institute of Technology Pasadena California 2001 15 J C Veacutedrine E K Novakova E G Derouane Catal Today 81 (2003) 247-262 16 H-G Lintz S P Muumlller Applied Catal A General 357 (2009) 178-183
121
17 M M Lin Appl Catal A 207 (2001) 1-16 18 E K Novakova J C Vedrine Propane selective oxidation to propene and
oxygenates on metal oxides in Metal Oxides - Chemistry and applications JGL Fierro (Ed) 2006 CRC Press pp 414-461
19 M Ai Catal Today 13 (1992) 679-684 20 M Ai J Catal 101 (1986) 389-395 21 J C Veacutedrine E K Novakova E G Derouane Catal Today 81 (2003) 247-262 22 P Concepcioacuten P Botella J M Loacutepez Nieto Appl Catal A General 278 (2004)
45-56 23 M Lin T B Desai F W Kaiser P D Klugherz Catal Today 61 (2000) 223-
229 24 J Hermann Catal Today 112 (2006) 73-77 25 ST Oyama X Zhang J Lu Y Gu T Fujitani J Catal 257 (2008) 1-4 26 G Campanelli A Bottino D Romano O Montinelli A Servida F Cavani S
Rossini Stud in Surf Sci and Catal 119 (1998) 423-428 27 A Bottino G Campanelli A Comite J Membr Sci 197 1-2 (2002) 75-88 28 G Campanelli E Carosini F Cavani O Monticelli F Trifiro Chem Eng Sci
51 10 (1996) 1817-1826 29 J A Dalmon A Cruz-Lopez D Farruseng N Guilhaume E Iojoiu J-Ch
Jalibert S Miachon C Mirodatos A Pantazidis M Rebeilleau-Dassonneville Y Schuurman A C van Veen Appl Catal A General 325 2 15 (2007) 198-204
30 H-G Lintz A Reitzmann Catalysis Reviews Science and Engineering 49 1 (2007) 1-32
31 C Hamel Aacute Toacuteta F Klose F Tsotsas A Seidel-Morgenstern Chem Eng Res Design 86 (2008) 753-764 C O`Neill E E Wolf Catal Today 156 (2010) 124-131 W Fang Q-J Ge J-F Yu H-Y Xu Ind Eng Chem Res 50 (2011) 1962ndash1967
32 C O`Neill E E Wolf Catal Today 156 (2010) 124-131 33 W Fang Q-J Ge J-F Yu H-Y Xu Ind Eng Chem Res 50 (4) (2011)
1962ndash1967 34 V N Parmon G I Panov A Uriarte A S Noskov Catal Today 100 (2005)
115-131 35 E V Kondratenko M Cherian M Baerns D Su R Schloumlgl X Wang I E
Wachs J Catal 234 (2005) 131ndash142 36 E V Kondratenko M Cherian M Baerns D Su R Schloumlgl X Wang I E
Wachs J Catal 234 (2005) 131ndash142 37 E V Kondratenko A Bruumlckner J Catal 274 (2010) 111ndash116 38 M T Allen R A Setter F L Dryer Int J Chem Kinet 27 (1995) 883-909 39 M Haumlvecker S Wrabetz J Kroumlhnert L Csepei R Naumann Yu V Kolen`ko
F Girgsdies R Schloumlgl A Trunschke J Catal submitted 40 J M Loacutepez-Nieto B Solsona P Concepcioacuten F Ivars A Dejoz M I Vaacutezquez
Catal Today 157 (2010) 291-296 41 J Ogonovski E Skrzynska Cat Comm 11 (2009) 132-136 42 R Fushimi S O Sekhtman A Gaffney S Han G Yablonsky J T Gleaves
Ind Eng Chem Res 44 (2005) 6310-6319
122
Chapter 5 Post synthesis treatment of the phase-pure M1 MoVTeNbOx catalyst
511 Abstract
Post-synthesis treatment of the phase-pure M1 MoVTeNbOx catalyst with
different aqueous solutions at room temperature is presented in this chapter The
modifying agents were selected in such a way to cover all the chemical effects (neutral
acidic basic oxidizing and reducing respectively) Catalytic experiments on propane and
propylene oxidation showed that the chemical treatment of the phase-pure M1
MoVTeNbOx sample with neutral acidic basic and reducing solution leads to a marginal
improvement in the activity while the acrylic acid yield is not significantly influenced
On the other hand the treatment with oxidizing solution leads to a very dramatic decrease
in activity and selectivity and alters the homogeneous energetic distribution of propane
adsorption sites probed by adsorption microcalorimetry The acrylic acid selectivity at the
same propane conversion was found to correlate with the surface Te content and TeV
ratio The phase purity was not affected either by the chemical treatment or the catalytic
reaction of propane and propylene oxidation suggesting the exceptional bulk structural
robustness of the M1 MoVTeNbOx catalyst
512 Introduction
The as prepared mixed metal oxide catalysts are seldom phase pure materials The
synthesis of MoVTeNbOx catalyst often leads to M1+M2 phase mixtures
In the patent literature several methods are claimed for the selective removal of the M2
phase The Japanese Laid-Open Patent Application No 10-330343 claimed a single and a
dual stage washing procedure using aqueous oxalic acid ethylene glycol and hydrogen-
peroxide solutions aiming at modification of the crystalline phase composition of
MoVSb based oxide catalysts Treatments of the same oxide catalyst with organic acid
alcohol inorganic acid and hydrogen peroxide are claimed as well [1]
Washing of MoVTeNbO and related oxide catalysts using organic acids alcohols
inorganic acids and hydrogen peroxide has been claimed by the patent literature for
selective removal of the M2 phase [2 3] Oxalic acid and ethylene diol were claimed to
123
be the most effective agents in removal of the M2 phase None of the listed inorganic
acids was highlighted as preferred washing agent Higher temperatures were suggested to
be favorable for faster removal of the M2 phase However the results concerning the
phase composition are described only qualitatively by the term ldquosubstantially free of
hexagonal phaserdquo Changes in the bulk andor surface elemental composition were not
monitored and the results of catalytic experiments are completely missing
Guliants et al reported that the treatment of phase pure MoVOx catalyst by anhydrous 2-
propanol leads to significant change in the surface elemental composition as probed by
LEIS study [4] The as prepared material exhibited a surface composition of MoV019Ox
while in case of the treated sample the enrichment of vanadium was observed the
composition being MoV069Ox On the other hand the bulk composition and M1 phase
was unaffected by the treatment The 2-propanol treated sample however showed an
improved selectivity to acrylic acid and a lower propane apparent activation energy
compared to the as prepared MoVOx catalyst
Baca et al reported complete removal of M2 phase by washing with 15 hydrogen-
peroxide containing solution from a M1+M2 phase mixture [5]
Due to the lack of any quantitative data reported in the patent literature it is not known
whether the claimed positive effect of solution treatment applied to a phase mixture is
due exclusively to the selective dissolution of the M2 phase or it might be related to the
possible change in the surface composition as well similarly to the data reported by
Guliants et al [4]
Therefore in this chapter the effect of different selected solutions (neutral acidic basic
complexing oxidizing and reducing) on the phase pure M1 MoVTeNbOx catalyst is
addressed in order to sort out their effect on the
bull Bulk structure phase purity
bull Surfacebulk composition
bull Catalytic properties
124
52 Modifying agents and procedure
The starting material (called also parent sample) was a phase-pure M1 MoVNbOx
catalyst with the internal identification number 6902 This was subjected to modification
procedure by washing in solutions The systhesis and characterization of the original
sample is described in detail in chapter 23
Modification procedure 20 g of parent sample was dispersed in 50 ml of the solutions
listed below The suspension was shaked at room temperature for 3 hours Then the solid
sample was separated from the liquid by vacuum filtration Finally the sample was dried
in a vacuum desiccator Although in the literature a heat treatment step is also
recommended after performing the modification procedure in the present study the final
calcination was not performed The reason for avoiding heat treatment is the evidence of
surface reconstruction of a hydrogen-peroxide treated sample given by Kolenrsquoko et al
[6]
The modifying solutions were as follows
1 Distilled water Chemical effect neutral The rationale of using pure water was
that to sort out the effect of the solvent on the catalyst since all the other modifying
agents were used as aqueous solutions The distilled water treated sample got the internal
identification number of 7797
The pH of the filtrate solution was 19 Since the catalyst does not contain hydrogen ions
bound in the structure the surprisingly high pH change of 51 was a consequence of
metal ion leaching The metal ions leached out from the sample may undergo hydrolysis
and form hydroxides and oxo-ions The consumption of hydroxyl ions in the hydrolysis is
reflected in the drop of the pH
2 01M phosphoric acid H3PO4 This compound has acidic and complexing
properties The pH of the 01 M H3PO4 solution was 17 while the pH of the filtrate after
treatment was 27 Even though phosphoric acid is a relatively strong acid the pH of the
filtrate is higher by 18 compared to the pH of the filtrate from the water treated sample
This might be due to the fact that the leached metal ions form complexes with phosphate
ions and hydrolysis is suppressed To the phosphoric acid solution treated sample the
internal number of 7798 was assigned
125
3 01 M tetramethylethylenediamine (CH3)2NCH2CH2N(CH3)2 (TMEDA) This
compound has basic (pH=109) and complexing effects Upon treating the MoVTeNbOx
with this solution the pH of the filtrate decreased to 41 The solid sample after treatment
got the number of 7799
4 01 M sodium bromate NaBrO3 The bromate ion presents oxidizing properties
which potentially may oxidize the elements of the sample in the intermediate oxidation
states The pH change of the solution was from 69 to 30 The sample was got the
internal identification number of 7798
5 01 M hydrazine N2H4H2O This compound with reducing properties was
selected in order to try to reduce some elements in the highest or intermediate oxidation
states The initial pH of the 01 M N2H4 solution was 98 while the pH of the filtrate was
found to be 93 The hydrazine treated sample got the internal identification number of
8113
In the liquid filtrate four types of equilibria involving the leached metal ions may
proceed One of them is hydrolysis and precipitation formation From the literature only
limited information is available about the solubility of the molybdenum vanadium
tellurium and niobium hydroxides The solubility product of VO(OH)2 is 59middot10-23 while
of Te(OH)4 is equal to 3middot10-54 [8] The calculated pH of a solution that contains Te(OH)4
in equilibrium is 33 while hydrolysis of vanadyl ion leads to a solution with pH of 66
None of these pH values matches with the pH of the filtrate resulting from the water
treated 6902 sample suggesting a complicated hydrolysisprecipitation equilibrium
Based on the Pourbaix-diagrams of Mo- V- Nb- and Te-species [7-10] in aqueous
solution at the pH of 19 the following species are stable MoO3 VO2+VO2+V3+
(depending on redox potential) Nb2O5 HTeO2-Te2
2-TeO33H2OTeO32-
H2TeO4HTeO2+ (depending on the redox potential)
The second equilibrium is condensation of hydrated metal ions and formation of oligo-
and polymetallates
The third equilibrium is the complex formation involving the leached metal cations and
the inorganicorganic ligands (H3PO4 TMEDA and N2H4 respectively) from the washing
solutions
126
Finally the fourth equilibrium is the redox reaction between the redox active transitional
metal ions with bromate and hydrazine
200 300 400 500 600 700 800
0
1
2
3
4
Absorbance
wavelength (nm)
7797 - water 7798 - 01 M H3PO4 7799 - 01 M TMEDA 7800 - 01 M NaBrO3 8113 - 01 M N2H4
Figure 521 The UV-Vis spectra of the filtrate solutions
As a result of these equilibria a multitude of cationic and anionic transitional metal
containing species may exist in the filtrate solutions The UV-Vis spectra of the filtrate
solutions were found to be different from each other indicating that different species are
present in all the solutions (Figure 521) Because of the complexity of the reactions that
may occur in the liquid phase and consequently the formation of large number of
species it was not possible to assign directly the bands to the species
However the composition and catalytic properties of the solid material after the liquid
treatment is more important rather than the qualitative and quantitative identification of
the ions leached out upon the above described liquid treatments Therefore the next
sections are focused on the characterization of the solid material after the liquid
treamtment Furthermore catalytic data are presented on propane and propylene
oxidation using the modified samples The reaction pathway analysis of propane
oxidation was performed Different pathways were found therefore a preliminary kinetic
analysis of the propane and oxygen partial order and consumption rate constant was
127
evaluated Furthermore the rate constant of propylene consumption was also determined
for every modified catalyst
53 Characterization of the modified samples
531 N2 physisorption
The nitrogen adsorption isotherms determined at the temperature of liquid nitrogen are
shown in Figure 531
Table 531 The BET surface area of the samples
Sample number Treatment BET surface area (m2g)
6902 None 75 7797 H2O 128 7798 H3PO4 113 7799 TMEDA 55 7800 NaBrO3 50 8113 N2H4 116
In case of the water treated sample the surface area increased by about 70 while upon
phosphoric acid and the hydrazine treatment the surface are increased by about 50 On
the other hand in the case of the tetramethylethylenediamin and bromate treatment the
surface area decreased by about 30 compared to the parent sample
532 X-ray diffraction
The parent and the as prepared modified samples were subjected to XRD measurements
between 2Θ=2deg and 2Θ=80deg XRD measurements were performed on samples after the
catalytic experiments on propane and propylene oxidation
Rietveld refinement performed on the patterns showed that the phase purity was not
affected irrespective of the nature of the chemical treatment The quantitative Rietveld
analysis was obtained using the crystal structure of M1 MoVTeNbOx (ICSD 55097)
[11] This observation suggests that the bulk structure of the phase-pure MoVTeNbOx
catalyst is robust enough to withstand treatment with the above listed solutions No phase
change has happened under propane and propylene oxidation reaction conditions in
128
contrast to the phase alteration when switching from propane to propylene educt
speculated by Griszligtede [12]
Table 532 The lattice parameters of the catalysts before and after catalytic oxidation of propane and propylene
Catalyst ID
Latt const
6902 7797 7798 7799 7800 8113
a (Aring) 21146 21138 21126 21127 21143 21143 b (Aring) 26641 26630 26615 26615 26640 26633 c (Aring) 40161 40169 4015 40153 4018 40151 B
efor
e re
acti
on
V (Aring3) 22624 22612 22576 22577 22628 22609 a (Aring) 21139 21142 21145 21134 21162 21144 b (Aring) 26628 26631 26640 26632 26654 26632 c (Aring) 40146 40123 4013 4010 4013 40133 A
fter
re
acti
on
V (Aring3) 22598 22590 22607 22570 22635 22599
The lattice constants were extracted for all the samples before and after catalytic reaction
They are listed in Table 532 It can be observed that by treatment the lattice constants
are only slightly affected The lattice parameters are also slightly changing during the
propane and propylene oxidation reaction
533 SEMEDX
The SEM images of the parent and modified samples are shown in Figure 531
The SEM micrograph of the parent sample is a homogeneous material but consists of
irregularly shaped rod-like particles with length up to 500 nm and diameter between 50
and 100 nm
Water treatment leads to a wider distribution of particle diameter but the predominant
rod-like shape of the parent sample is conserved
Upon phosphoric acid treatment the particles loose their rod-like shape and their size is
reduced Aggregates of particles with ill defined shape can also be observed
Treatment by tetramethylethylenediamin leads to a rather wide distribution of particle
size The shape varies from plate-like to needles and also particles with aspect ratio close
to unity can be observed
129
Figure 531 The SEM picture of the catalysts 6902 (parent sample) 7797 (water treated sample) 7798 (H3PO4 treated sample) 7799 (TMEDA treated sample) 7800 (NaBrO3 treated sample) 8113 (N2H4
treated sample)
Also in the bromate treated sample a broad shape and size distribution can be observed
In the hydrazine treated sample the predominant shape of needle-like morphology from
the parent sample is conserved however particles with not well defined shape between
50-100 nm intervals can also be observed
130
original water H3PO4 TMEDA NaBrO3Hydrazine0
10
20
30
40
50
60
70
80
content [
]
sample
Nb
Mo
Te
V
Figure 532 The elemental composition of the original and the modified catalysts as probed by EDX
The bulk elemental composition of all the samples was determined by means of EDX
(Figure 532) The parent sample (6902) consists of 6244 at Mo 1627 atV 689
at Te and 1440 at Nb which corresponds to a formula of MoV026Te011Nb023Ox
In the distilled water treated sample (7797) the enrichment of Mo and V (6261 at and
1728 at) and depletion of Te and Nb (647 at and 1365 at respectively) was
observed leading to a formula of MoV028Te010Nb022Ox
The phosphoric acid treatment leads to slight decrease of Mo V and Te content in the
sample 7798 (6064 at 1516 at and 550 at respectively) balanced by the
enrichment of Nb (187 at)
Upon tetramethylethylenediamine treatment the Mo and Te content is increasing (to
6294 at and 727 at) while the V and Nb content decreases (1607 and 1372 at)
giving a sample of 7799 with the formula MoV026Te012Nb022Ox
Bromate treatment leads to the most significant depletion of Mo (to 5994 at) while V
Te and Nb are enriched (1699 704 and 1663 at) This sample with number 7800 has
the formula of MoV028Te012Nb028Ox
Upon hydrazine treatment the Mo and Te content decreases (6045at and 637 at)
while V and Nb are enriched compared to the parent sample (1784 at and 1534at)
The formula of the sample 8113 is MoV030Te011Nb025Ox
131
534 XAS and XPS
X-ray photoelectron spectroscopy (XPS) spectra were recorded at the synchrotron
radiation facility BESSY II for each modified samples The high pressure XPS spectra
were recorded at room temperature and in the presence of about 025 mbar oxygen
pressure in order to avoid the beam-induced reduction of the tellurium
No significant difference was observed between the X-ray absorption spectra (XAS)
corresponding to the original material water- phosphoric acid-
tetramethylethylenediamine- and hydrazine treated samples This suggests that no
significant changes happened in the average oxidation state or coordination geometry of
the metals upon treatment with the above named modifiers On the other hand the
difference spectra between the bromate treated sample (7800) and the original material
corresponding to the vanadium L3 edge showed a similarity with the V5+ reference
spectrum (Figure 535) This suggests that the bromate treatment lead to partial oxidation
of the V4+ ions to V5+
The survey photoelectron spectra showed that phosphorous- nitrogen- and bromide
containing species are absent in all the samples This suggests that none of the modifying
agents or their eventual reaction products (complexes reduced or oxidized forms of
bromate and hydrazine respectively) were bound to the catalyst
533 NEXAFS spectra of the bromate treated sample( 7800) the parent sample (6902) the difference
spectrum and the V5+ reference spectrum
132
Therefore the contamination of the M1 structure with different molecular or ionic
species from the chemical treatment can be ruled out
Core level photoelectron spectra of O1s V2p (32) Mo3d (52) Nd3d (52) and Te3d
(52) were recorded at different kinetic energies Low kinetic energy (165 170 and 180
eV) was applied for surface sensitive mode while higher kinetic energy (465 470 and
480 eV) for the bulk sensitive mode
The binding energy (BE) of Mo3d (52) are slightly lower compared to the typical value
of 2326 eV reported for MoO3 standard compound [5 13 14] The Mo3d peak is likely
composed of three peaks corresponding to a binding energy of 2310 2320 and the
highest component of 2326 eV Therefore the predominant oxidation state of
molybdenum is 6+ with minor contribution of 5+ and 4+ The presence of low
abundance of Mo5+ oxidation state has also been reported [14 15]
Table 533 The binding energies corresponding to every catalyst
Sample O1s
(eV)
V2p (32)
(eV)
Mo3d (52)
(eV)
Nb3d (52)
(eV)
Te3d
(52)
(eV)
6902 parent 5303 5163 2321 2064 5762 5733
7797 H2O 530-5301 516-5161 2320-2321 2063 576-5762 573-5732
7798 H3PO4 5299-5301 516-5162 2321 2063 576-5761 573-5731
7799 TMEDA 5301-5302 5161-5162
~2322 2064-2065 576-5761
573
7800 NaBrO3 ~5303 ~5164-5162
~2322 ~2065 5764-5762
~5733 8113
N2H4H2O 5301- 5302
5162-5163
2322 2065 5763 5733
The binding energy of Nb3d (52) was close to the value of 2072 reported for 5+
oxidation state while the binding energy of tellurium indicated the oxidation state of 4+
On the other hand the vanadium oxidation state was found to be 4+ As identified by
XAS in the bromate treated sample a small amount of V5+ was also present
133
The surface and bulk elemental composition was quantified from the spectra obtained at
low and high kinetic energy respectively The bulk elemental composition showed a
good agreement with the values determined by multi-spot EDX analysis
Figure 534 Normalized surface concentrations Correlation of Te content and TeV ratio with the
normalized selectivity to acrylic acid (bar-graph)
For a correlation between the elemental composition and the elemental composition and
the catalytic properties the surface concentration of the constituents corresponding to
every catalyst was normalized to the water treated sample 7797 (Figure 534)
Similarly the selectivity to acrylic acid determined at a propane conversion of 22plusmn2
was normalized to the selectivity of the water treated sample More detailed description
about catalytic oxidation of propane can be found in the subchapter 541 A good
correlation was found between the tellurium and the normalized selectivity The same
trend can be observed for between the tellurium to vanadium ratio and the normalized
selectivity This observation is in accordance with that reported by Haumlvecker et al [15]
134
535 Microcalorimetry
Adsorption microcalorimetry was employed to determine the number strength and
energy distribution of the adsorption sites on the catalyst Among the possible probe
molecules applicable in microcalorimetry propane and propylene were used to determine
the adsorption heat of educt on the catalyst On the other hand CO and NH3 probe
molecules were applied in order to characterize the acid-base properties of the sample
The interaction of these latter molecules with the catalyst was monitored also by means
of FTIR spectroscopy
A detailed microcalorimetric experiment using propane and propylene as probe
molecules was carried out on the original catalyst (6059) the results serving as
reference for the modified and spent catalysts The term ldquospent catalystrdquo refers to a
sample which has been used for catalytic reaction of propane and propylene oxidation
Since the aim of the study was to determine adsorption properties the temperature was
chosen low enough (40degC) to avoid chemical reaction on the catalyst surface
The Figure 535 displays the adsorption isotherm and the differential heat of propane
adsorption on the original material before and after catalytic reaction
Adsoprtion isotherm Differential heats as a function of coverage Figure 535 Adsorption of propane (educt of the catalytic reaction) at 313 K on fresh (dots) and used M1
(triangle) activated at 423 K under vacuum
The adsorption isotherm was fitted with a Langmuir model A fit up to 25 mbar
equilibrium pressure corresponding to the monolayer coverage yielded an adsorption
order of 106 on the fresh catalyst The adsorption equilibrium constant was found to be
135
0080 On the other hand the amount of adsorbed propane on the spent catalyst is lower
at every equilibrium pressure compared to the fresh catalyst The Langmuir fit gave an
adsorption order of 104 The adsorption order close to unity suggests non dissociative
adsorption
The initial differential heat of propane adsorption on the fresh M1 MoVTeNbOx is
constant at approximately 57 kJmol This indicates homogeneous distribution of
energetically uniform adsorption sites Additionally FTIR spectroscopy of ammonia
adsorption showed the presence of both Broslashnsted and Lewis acid sites However the ratio
between the Broslashnsted and Lewis acid sites was found to be equal to 234 [15]
The monolayer is completed at 35 micromolm2 propane coverage corresponding to an
equilibrium pressure of 25 mbar Above this coverage the differential heat of adsorption
decreases linearly with the amount of adsorbed propane suggesting the absence of
interaction between adsorbed molecules A saturation value of adsorption is reached at
about 52 micromolm2 and 22 kJmol enthalpy
Upon desorption of propane by evacuation at 40degC the integral signal of desorption was
recorded The integration of this signal gave the integral heat of desorption The absolute
value of the sum of differential heat of adsorption is comparable to the integral heat of
desorption (Table 534) indicating that the propane adsorption is a reversible process
Additionally the individual differential adsorption signals did not deviate from the
baseline suggesting that the process is pure adsorption The time constant of the stepwise
adsorption was found to be close to the time constant determined in the calibration of the
calorimetric cell (250-350 s) This also supports the absence of an additional process (eg
chemical reaction) besides the adsorption
A repeated experiment (re-adsorption after desorption Table 534) showed that the
isotherm and the differential adsorption heats are reproducible
Table 534 Adsorption and desorption heats corresponding to different coverages
Experiment (J) 1
)int(sum=
n
i
adsiq (J) )int( desiqminus
Adsorption of 0006 mmolm2 C3H8 789 656
Re-adsorption of 0004 mmolm2 C3H8 156 153
136
The initial differential heat of propane adsorption was constant also on the spent 6059
catalyst indicating homogeneous distribution of adsorption sites Nevertheless the initial
differential adsorption heat determined for on the spent catalyst was lower compared to
the fresh catalyst it is only ca 40 kJmol Similarly to the fresh catalyst the monolayer
was completed at a coverage of 35 micromolm2 coverage on the spent catalyst as well Since
the monolayer coverage is the same like on the fresh catalyst the number of adsorption
sites does not change during catalytic reaction but the strength of the interaction
decreases by ca 30
The linear decay of the differential heat of adsorption after completion of the monolayer
suggests that there are no significant interaction forces between the adsorbed molecules
The reversibility of the propane adsorption on the spent catalyst was proven by the good
agreement between the sum of integral heats corresponding to the individual adsorption
steps and the integral heat of desorption
The propylene adsorption isotherms and heat profiles determined at 40degC corresponding
to the fresh and spent 6059 catalyst are displayed on Figure 536 For comparison the
propane adsorption isotherms and heat profiles are also included in the plot
Adsorption isotherm Differential heats as a function of coverage Figure 536 Adsorption of propylene at 313 K on fresh (dots) and used M1 (triangle) activated at 423 K
under vacuum
The propylene adsorption isotherms indicate that a larger amount of propylene can be
adsorbed than propane on the fresh and used catalyst at the same equilibrium pressure
137
Similarly to propane adsorption the spent catalyst adsorbs a lower amount of propylene
compared to the fresh catalyst
The heat profile of propylene adsorption on fresh catalyst reflects the formation of two
different adsorption complexes due to energetically different adsorption sites Below the
coverage of 2 micromolm2 the differential heats are constant at ca 54 kJmol which is
comparable to the propane differential adsorption heat
The second plateau on the heat profile is between 25 and 42 micromolm2 where the
differential adsorption heat is around 41 kJmol Above the coverage of 42 micromolm2 the
differential heat of propylene adsorption decays linearly indicating no interaction
between the adsorbed molecules
Upon evacuation at 40degC the signal corresponding to the propylene desorption was
recorded The integral desorption heat was found to be 10 J while the sum of the
individual integral heats was 20 J The large difference between the adsorption and
desorption heats suggests that the propylene adsorption is not a fully reversible process
in contrast to propane adsorption On the other hand the time constant was between 400
and 550 seconds for the low propylene coverage This exceeds significantly the time
constant of 250-350 seconds determined for the empty calorimeter indicating irreversible
adsorption Nevertheless at higher propylene coverage the time constant of the
adsorption was comparable to that determined for the empty calorimeter
The partial irreversibility of propylene adsorption might be assigned to partial physical
blockage of adsorption sites or irreversible changes of these sites In order to find out
which of these possibilities is the reason for the observed irreversibility the adsorption
properties were re-measured with propane as probe molecule
After desorption of propylene from the fresh 6059 sample propane was re-adsorbed at
40degC The adsorption isotherm of propane re-adsorption performed after propylene
adsorption-desorption cycle showed a very significant difference in comparison to the
propane adsorption on the fresh 6059 sample (Figure 538) The amount of re-adsorbed
propane was significantly lower at any equilibrium pressure indicating that the number
138
of available adsorption sites was reduced during propylene adsorption-desorption
experiment
On the heat profile corresponding to the propane re-adsorption an initial plateau at 57
kJmol was observed
Adsorption isotherm Differential heats as a function of coverage Figure 537 Adsorption of propane at 313 K after propylene adsorption on fresh (open dots) M1 activated
at 423 K under vacuum For comparison the propane adsorption isotherm and differential heat profile if propane firstly adsorbed on the fresh M1 (dots)
This differential adsorption heat of propane is equal to the value determined on the fresh
catalyst suggesting that the energetics of propane adsorption is the same The
homogeneous distribution of the propane adsorption sites was not altered by the
preceding propylene adsorption-desorption process Nevertheless the monolayer
completion occurred already at around 03 micromolm2 coverage indicating that the number
of adsorption sites was reduced very significantly by ca 90 upon propylene
adsorption-desorption This confirms the observation made by comparing the adsorption
isotherms shown on Figure 536
The heat profile corresponding to propylene adsorption on the spent catalyst showed
three plateaus which is an indication of three groups of energetically equivalent
adsorption sites The initial differential adsorption heat determined up to 1 micromolm2
coverage is 55 kJmol This is identical with the initial adsorption heat on the fresh
sample but also similar to the propane initial adsorption heat on the fresh sample
Between 1 and 3 micromolm2 coverage the propylene adsorption heat is 41 kJ which is
139
equal to that determined for the fresh catalyst The third group of energetically equivalent
adsorption sites characterized by an adsorption heat of 37 kJmol can be observed
between 3 and 6 micromolm2 coverage
Propane adsorption experiment was carried out also on the fresh and spent bromate
treated M1 sample (7800) Compared to the original sample the modified catalyst
(7800) adsorbed a lower amount of propane at any equilibrium pressure The same trend
could be observed upon comparing the adsorption isotherms of the spent original and
spent bromate modified (7800) samples (Figure 539)
On the heat profile the fresh bromate treated sample shows an initial linear decay of the
differential heat of adsorption The differential adsorption heat is constant at 33 kJmol
between 22 and 35 micromolm2 coverage This plateau indicates the presence of Broslashnsted
acid sites After the decaying trend a second plateau can be observed between 4 and 5
micromolm2 coverage
FTIR study on ammonia adsorption supported the presence of both acid sites and
revealed a ratio of Broslashnsted to Lewis acid sites equal to 229 [15] This number is lower
compared to that one determined on the original material (234) indicating that indeed
and the density of Lewis acid sites is increasing upon bromate treatment
Additionally the spent bromate treated sample showed a decaying heat profile with no
plateau
Adsorption Isotherm Differential heats as a function of coverage Figure 538 Microcalorimetry on the bromate-treated phase-pure M1 catalyst (7800) before and after
catalytic experiment
140
The quantities of propane adsorption determined from the three-variable Langmuir fit
(adsorption order n monolayer coverage Nmono and the equilibrium constant of
adsorption K) are summarized in Table 535 The propane adsorption equilibrium
constant decreases for both catalysts during the reaction
The surface area available for propane adsorption was calculated based on the monolayer
coverage assuming one-to-one adsorption stoechiometry and propane cross sectional
area of 355Aring2 The surface areas determined by propane and propylene adsorption are in
good agreement with the surface area determined by nitrogen physisorption
Table 535 The adsorption order monolayer coverage and adsorption constant of propane adsorption for the 6059 and bromate treated sample (7800)
Surface area (m2g) Probe
molecule
Catalyst
state
Catalyst
ID n
Nmono
(mmolg)
K
(hPa-1) Langmuir BET
6059 107(1) 00485(8) 0078(3) 104 879 Fresh
7800 128(4) 00561(1) 0006(2) 132 504
6059 113(6) 0048(7) 0022(6) 114 nd C3H8
Spent 7800 099(8) 0044(3) 0005(4) 103 nd
Therefore the main difference between the original and the bromate treated sample
probed by adsorption microcalorimetry are the following
bull the fresh original catalyst exhibits homogeneously distributed energetically
equivalent adsorption sites for propane adsorption while upon bromate treatment
energetic heterogeneity
bull the energetic homogeneity of the adsorption sites is conserved for the original
material during the propane oxidation reaction but the reaction induces reduction
of the differential adsorption heat compared to the fresh catalyst In contrast to
this the heat profile of the spent bromate treated material shows a high degree of
heterogeneity the LewisBroslashnsted acid site ratio changes as observed by FTIR
study on ammonia adsorption
141
54 Catalytic experiments
541 Propane oxidation
Prior to catalytic tests the samples were pressed with 15 tons of force for 1 minute in a
pressing tool with 13 mm die Then the pellet was crushed gently in an agate mortar A
sieve fraction between 250 and 355 microm was used for catalytic experiments An amount of
ca 024 g sieve fraction was mixed with SiC (particle size between 315 and 400 microm) and
loaded in the isothermal zone of the reactor tube
Constant feed composition was used (C3H8O2H2ON2=364051 vol) while the space
velocity was varied between 20000 and 3000 h-1 at a reaction temperature of 400degC
The propane conversion at different space velocities is shown in Figure 541 The
activity of H3PO4- H2O- and TMEDA treated samples are slightly higher compared to
the parent sample However the differences are becoming less significant in the integral
operation mode between 30 and 80 conversion On the other hand the activity of the
bromate treated sample was significantly below the parent- and other modified samples
20000 15000 10000 50000
20
40
60
80
100
X C3H8 ()
GHSV (h-1)
6902 - original 7797 - H
2O mod 6902
7798 - H3PO
4 mod 6902
7799 - TMEDA mod 6902 7800 - NaBrO
3 mod 6902
8113 - N2H
4 mod 6902
Figure 541 The activity of the catalysts
The hydrazine treated sample showed lower activity at a space velocity compared to the
parent sample The activity becomes the same in the space velocity interval between
15000 and 5000 h-1 At GHSV=3000 h-1 the oxygen conversion reached 100 for this
catalyst and consequently the propane conversion was lower compared to the other
142
catalysts After performing the measurement at GHSV=3000 h-1 the catalytic properties
were re-measured at a space velocity of 5000 h-1 These results are summarized in Table
541 The data show that the catalytic properties are reversible after performing the
reaction under partly reducing conditions (100 oxygen conversion) This is in
accordance with the observations reported in the subchapter 431 In case of all the other
catalysts the highest oxygen conversion was ca 95 The selectivity to acrylic acid of all
the catalysts is plotted against the space velocity (Figure 542 left) The highest
selectivity was reached on the parent sample (6902) at the space velocity of 10000 h-1
Compared to this the selectivity on H2O- H3PO4 and TMEDA are slightly lower at
space velocities above 10000 h-1 and more significantly lower below GHSV=10000 h-1
The selectivity of the hydrazine and bromate treated samples is significantly below the
parent sample
Table 541 The catalytic performance of the hydrazine treated catalyst (8113) compared before and after the complete oxygen conversion experiment
Catalytic
Property GHSV=5000 h
-1 GHSV=3000 h
-1 GHSV=5000 h
-1
remeasured
XC3H8 () 589 plusmn 22 651 plusmn 61 589 plusmn 41 XO2 () 769 plusmn 22 100 778 plusmn 20 SAA () 314 plusmn 17 149 plusmn 21 279 plusmn 11 SCO2 () 286 plusmn 11 383 plusmn 17 292 plusmn 28 SC3H6 () 47 plusmn 04 34 plusmn 04 55 plusmn 05 SHAc () 88 plusmn 06 100 plusmn 13 120 plusmn 16 SCO () 265 plusmn 10 335 plusmn 15 278 plusmn 23
C-bal () 790 plusmn 11 908 plusmn 106 829 plusmn 40
The yield to acrylic acid at every space velocity is shown in Figure 542 (right) The
maximum yield of ca 26 has been attained on the parent sample and the TMEDA
treated sample at the space velocity of 5000 h-1 For the H2O- H3PO4 and N2H4 modified
samples the maximum yield of ca 20 was also at the space velocity of 5000 h-1 This
suggests that the kinetics of the reaction might be similar on these catalysts though the
rate constants may differ slightly
143
20000 15000 10000 50000
20
40
60
80
100 6902 - original 7797 - H
2O mod 6902
7798 - H3PO
4 mod 6902
7799 - TMEDA mod 6902 7800 - NaBrO
3 mod 6902
8113 - N2H
4 mod 6902
Selectivity to AA ()
GHSV (h-1)
20000 15000 10000 50000
10
20
30
40
50 6902 - original 7797 - H
2O mod 6902
7798 - H3PO
4 mod 6902
7799 - TMEDA mod 6902 7800 - NaBrO
3 mod 6902
8113 - N2H
4 mod 6902
GHSV (h-1)
Yield AA ()
Figure 542 The selectivity and yield of the catalysts
The conversion selectivity and yield profile of the bromate treated sample however
differs very much from all the other catalysts which suggests that the kinetics of propane
oxidation is significantly different
6902 7797 7798 7799 7800 811320
40
60
80
1006902 - original7797 - H
2O mod 6902
7798 - H3PO
4 mod 6902
7799 - TMEDA mod 69027800 - NaBrO
3 mod 6902
8113 - N2H
4 mod 6902
Apparent activation energy (kJm
ol)
Catalyst sample number
Figure 543 The apparent activation energy of propane activation over the catalysts
The temperature variation in 20degC steps between 360 and 400degC was carried out at a
space velocity of 5000 h-1 The apparent activation energy of propane consumption has
been determined from the Arrhenius plots Similar activation energies have been found
for the parent sample and the H2O- H3PO4- TMEDA and N2H4 treated samples
144
However the apparent activation energy of propane on the bromate and hydrazine treated
sample was significantly higher than for the other samples
542 Kinetic analysis of propane oxidation over the modified catalysts
The primary analysis of the activity and selectivity to acrylic acid on different catalysts
showed that only the bromate and the hydrazine treated samples are behaving different in
propane oxidation reaction The product rank analysis revealed that the reaction pathways
are also different although in every case the catalyst was M1 MoVTeNbOx with slightly
different surface and bulk elemental composition (Appendix 51) In this subchapter the
kinetic analysis of propane oxidation is presented
In section 423 and 424 it is shown that the reaction is first order with respect to
propane and 05th order with respect to oxygen Prior to kinetic modeling the verification
of first order kinetics with respect to propane and half-order kinetics with respect to
oxygen was verified using the integral method [16-17] For this purpose the integrated
rate laws were considered (Equations 541 and 542)
)245 ( 2
)145 ( lnln
222
8383
083
83
50
050
Equationkcc
Equationkyc
c
OappOO
HCappHC
HC
HC
τ
τ
sdotsdot+=
sdotminus==
The logarithm of the dimensionless propane concentration was plotted against the contact
time leading to straight lines This indicates that on every catalyst the reaction order with
respect of propane is equal to one According to the integrated rate law corresponding to
oxygen the square root of the oxygen concentration was represented in function of the
contact time No curvature was observed on the plots which supports that the reaction
order with respect to oxygen is 05 for all the catalysts
145
00 04 08 12 16 20-20
-16
-12
-08
-04
00
04 6902 7797 7798 7799 7800 8113
ln(yC3H8)
WF (gsml)
00 04 08 12 16 20
000
005
010
015
020
025
030 6902 7797 7798 7799 7800 8113
sqrt(cO2)
WF (gsml)
C3H8 O2
Figure 544 The linear representation of the rate law with respect to propane and oxygen 6902 ndash original 7797 ndash H2O modified 7798 ndash H3PO4 modified 7799 ndash TMEDA modified 7800 ndash NaBrO3
modified 8113 ndash N2H4 modified sample
The slopes of the linear regressions are collected in the Table 543 These slopes
correspond to the apparent rate constants of propane and oxygen consumption
respectively The apparent rate constant of propane activation is very similar for all the
catalysts except for the bromate treated sample which is less active by a factor of 27
compared to the parent sample
Table 542 The apparent rate constants of propane and oxygen consumption
C3H8 O2 Catalyst
-slope (mlgs) RN -slope (mlgs) RN
6902 119 plusmn 005 -09973 5 072 plusmn 001 -09999 5 7797 112 plusmn 009 -09955 5 068 plusmn 001 -09993 5 7798 116 plusmn 004 -09945 5 060 plusmn 001 -09995 5 7799 112 plusmn 004 -09854 5 074 plusmn 001 -09998 5 7800 044 plusmn 002 -09971 5 019plusmn 001 -09901 5 8113 114 plusmn 002 -09923 4 080 plusmn 005 -09989 5
Propylene was found to be an intermediate product The reaction pathways involving
propylene was approximated by the following scheme
)145 (Re Pr6383 actionoductsHCHC rarrrarr
146
The rate constant of propylene formation is k1 while the cumulative rate constant of
propylene further oxidation is k2 The differential equations corresponding to this scheme
are the following
)445 (
)345 (
63283163
83183
Equationckckdt
dc
Equationckdt
dc
HCHCHC
HCHC
sdotminussdot=
sdot=minus
By dividing the above two differential equations the derivative of time (dt term) is
cancelled and resulting differential equation contains only concentrations (Equation
545) Solving this differential equation leads to the equation involving the dimensionless
concentrations of propane and propylene and the dimensionless ratio of the rate constants
(κ=k2k1) (Equations 546 and 547)
[ ]
)845 ( )(
)745 ( 1
1
)645 (
)545 (
2
163exp63
838363
083
83
083
83
12
1
083
63
831
632831
83
63
1
2
Equationn
yy
S
Equationyyy
Equationc
c
c
c
kk
k
c
c
Equationck
ckck
dc
dc
n
i
calcdHCHC
HCHCHC
k
k
HC
HC
HC
HC
HC
HC
HC
HCHC
HC
HC
sum=
minus=
minussdotminus
=
minussdot
minus=
sdotminussdotminussdot
=
κ
κ
Iterative nonlinear fitting procedure was employed for the determination of the
dimensionless rate constant (Figure 545) A plausible value of κ was chosen and then
the value of yC3H6 was calculated For the objective function of the fitting the standard
deviation between the measured and calculated propylene dimensionless concentration
has been considered (Equation 548) The iteration was continued until the minimum of
the objective function was found (dSdκ=0) (Figure 545 right)
147
yC3H6 vs WF plot Standard deviation vs κ
00 02 04 06 08 10 12 14 16
000
001
002
003
004
005 y
C3H6 experimental
yC3H6
calculated κ=30
y C3H6
WF (gsml)
24 26 28 30 32
00000
00002
00004
00006
00008
00010
00012
00014
Standard deviation
κ
Figure 545 Plot of the experimental with calculated yC3H6 data for catalyst 6902
The dimensionless rate constant κ for each catalyst was determined using the above
described procedure The numerical values are collected in Table 543
Table 543 The rate constants of propane and propylene consumption
Catalyst ID k1
(mlgs) κκκκ k2
(mlgs) ττττmax
(gsml)
6902 119 300 3570 010 7797 112 225 2520 013 7798 116 234 2714 012 7799 112 225 2520 013 7800 044 232 1021 032 8113 114 220 2508 013
The κ values may be compared to literature results
Griszligtede reported a propane consumption rate constant of 084 gsml a propylene partial
oxidation rate constant to acrylic acid equal to 17 gsml and a rate constant of 34 gsml
towards byproducts (CO CO2 and acetic acid) formation on a MoV033Te025Nb017Ox
catalyst [12 18] The global consumption rate of propylene is therefore 204 gsml The
ratio of propylene consumption and propane consumption rate is 204084=243
Loacutepez-Nieto et al reported a value of ca 24 on a predominantly M1 phase containing
MoVTeNbOx catalyst [19]
148
Naraschewski et al reported a value of 25 for MoVTeNbOx catalysts with ten different
elemental- and phase compositions [20] However the fitting was made in case of one of
the catalyst the κ value for each catalyst was not quantified
From the κ and the k1 data the k2 was also calculated and shown in the Table 544
Additionally the contact time corresponding to the maximum propylene concentration
was also calculated (Table 543)
)945 ( ln)1(
1ln
1
11
2
12max Equation
kk
k
kkκ
κτ
minus=
minus=
It can be seen that the maximum propylene concentration is at around 012 gsml for most
of the catalysts This low contact time was not covered in the experiments On the
bromate treated sample (7800) the calculated τmax is equal to 032 while the
experimental value lies around 033 which is in good agreement with the calculated one
543 Propylene oxidation
Catalytic testing in propylene oxidation reaction has also been carried out using the
parent sample and all the modified descendant catalysts
The feed composition was the following C3H6O2H2ON2=364051vol According to
the reasoning in section 425 the temperature interval between 360-400degC was chosen
which corresponds to the temperature interval for the propane oxidation The space
velocity was kept at 20000 h-1 in order to achieve propylene conversions below 100
The ranking order of the catalysts in the activity of propylene activity resembles the
activity in propane oxidation the tetramethylethylenediamine treated sample showed the
highest activity followed by the original the water- the phosphoric acid hydrazine and
the bromate treated samples Similarly to the propane oxidation reaction the propylene
conversion was also significantly lower on the bromate treated sample compared to the
other catalysts
149
360 370 380 390 400
40
60
80
100
6902 7797 7798 7799 7800 8113
X C3H6 ()
T (degC)
Figure 546 The activity of the catalysts in propane oxidation reaction 6902 ndash original 7797 ndash H2O
modified 7798 ndash H3PO4 modified 7799 ndash TMEDA modified 7800 ndash NaBrO3 modified 8113 ndash N2H4 modified sample
360 370 380 390 4000
20
40
60
80
100
6902 7797 7798 7799 7800 8113
S AA ()
T (degC)
360 370 380 390 4000
20
40
60
80
6902 7797 7798 7799 7800 8113
Y AA ()
T (degC)
Figure 547 The selectivity and yield of the catalysts in propane oxidation reaction 6902 ndash original 7797 ndash H2O modified 7798 ndash H3PO4 modified 7799 ndash TMEDA modified 7800 ndash NaBrO3 modified
8113 ndash N2H4 modified sample
The acrylic acid selectivity was found to be the highest on the bromate treated sample
followed by the hydrazine treated sample (Figure 547) The higher selectivity however
may be attributed to the fact that these catalysts are less active than the others The
150
acrylic acid selectivity on other catalysts was lower and similar to each other with a
maximum at 380degC
When the the acrylic acid yield is compared the highest performing catalyst is hydrazine
treated sample All the other catalysts show a similar yield at every temperature except
for the bromate treated sample which has the lowest performance (Figure 547)
It is notable that the ratio between the CO and CO2 selectivity is higher than one for the
parent- H2O- TMEDA- and treated samples while for the H3PO4- NaBrO3 and N2H4-
treated samples this ratio is statistically close to one
544 CO oxidation and water gas shift reaction
CO oxidation reaction as a test reaction for electrophilic oxygen species on the catalyst
surface was also performed [21] The reaction was carried out in dry and in 40vol
steam containing feed Besides this water gas shift reaction was also carried out using a
40 vol steam containing feed The same experimental procedure was applied as it was
described in the section 427
150 200 250 300 350 400
000
001
002
003
004
005
006 8947 7800 8113
CO2 concentration (vol
)
T (degC)
000 025 050 075 100 125 150
0000
0005
0010
0015
0020
0025 8947 7800 8113
yCO2
WF (gsml)
CO2 production vs temperature yCO2 vs contact time at 400degC
Figure 548 The CO oxidation activity at different temperatures and GHSV=3000 h-1 (left) The kinetic curves of CO2 formation at 400degC (right) Conditions COO2H2ON2=36091 vol Catalysts 8947 ndash
as prepared M1 MoVTeNbOx 7800 ndash NaBrO3 treated 6902 8113 ndash N2H4 treated 6902
151
CO oxidation carried out in steam free oxidizing feed (GHSV=3000h-1) at different
temperatures revealed that for all the catalysts the onset temperature is between 250 and
300degC The ranking order in CO oxidation activity at 400degC is the following hydrazine
treated sample (8113) the bromate treated material (7800) and original sample
(8947) Therefore the abundance of electrophilic oxygen species is decreasing in this
order of the catalysts [26] It is also notable that the CO conversion was far below the
equilibrium conversion for both the CO oxidation and water gas shift reactions (100
and 996 respectively) calculated from the thermodynamic data of CO CO2 H2 and
H2O (Table 545)
Table 544 Activation energy of CO oxidation Feed composition COO2H2ON2=36091 vol 8947 ndash as prepared M1 MoVTeNbOx 7800 ndash NaBrO3 treated 6902 8113 ndash N2H4 treated 6902
Catalyst ID Ea (kJmol)
8947 51 plusmn 2 7800 55 plusmn 7 8113 54 plusmn 7
Because the CO conversion is very low (below 3) all the data are in the differential
operation regime Therefore the rate constant of CO2 formation is equal to the slope of
the straight line of the dimensionless concentration of CO2 represented in function of the
contact time (Figure 548 and 549) Since there is no other product than CO2 the rate
and rate constant of CO consumption is equal to the rate and rate constant of CO2
formation The activation energy of CO oxidation determined from the Arrhenius-plot is
statistically similar on the three catalysts (Table 544)
In case of all the three catalysts the water gas shift reaction had the lowest conversion
and rate constant followed by the CO oxidation in dry feed (Table 545 and 546) The
highest CO conversion was observed in the case of CO oxidation in presence of 40 vol
steam in the feed This suggests that CO oxidation and water gas shift reactions are
parallel reaction steps However it is notable that the CO oxidation activity in presence
of 40 vol steam is less than the algebraic sum of the CO conversions determined in the
CO oxidation in dry feed and the water gas shift reaction in presence of 40 vol steam
152
000 025 050 075 100 125 150
0000
0005
0010
0015
0020
0025
0030 8947 7800 8113
yCO2
WF (gsml)
000 025 050 075 100 125 150
00000
00025
00050
00075
00100
00125
00150
yCO2
8947 7800 8113
WF (gsml)
CO oxidation in presence of steam
COO2H2ON2=364051 vol 400degC Water gas shift reaction
COO2H2ON2=304057 vol 400degC Figure 549 Kinetic curves for CO2 formation for the CO oxidation in presence of steam and for the water
gas shift reactions Catalysts 6902 minus as prepared M1 MoVTeNbOx) 7800 minus NaBrO3 treated sample 8113 minus N2H4 treated sample
Table 545 The CO conversion at GHSV=3000 h-1 and 400degC
Catalyst ID
XCO () CO oxidation
COO2H2ON2= 36091 vol
XCO () CO oxidation
COO2H2ON2= 364051 vol
XCO () water gas shift
COO2H2ON2= 304057 vol
8947 114plusmn012 146plusmn004 074plusmn004 7800 186plusmn004 239plusmn002 099plusmn012 8113 215plusmn012 227plusmn004 132plusmn008
Equilibrium 100 100 996
The rate constant of CO oxidation or water gas shift reaction was found to be very low in
the order of magnitude of 10-2 mlgs The same trends of the rate constant with respect of
the catalyst and the feed composition can be observed like in the activity expressed by
CO conversion (Table 546) The difference between the rate constant of CO oxidation in
dry feed and the sum of the rate constants CO oxidation in dry feed and the water gas
shift reaction suggests that these reactions may run in parallel but their contribution is
not the same
153
Table 546 Rate constants of CO2 formation at 400degC
Catalyst ID
kCO2 (mlgs) CO oxidation
COO2H2ON2= 36091 vol
kCO2 (mlgs) CO oxidation
COO2H2ON2= 364051 vol
kCO2 (mlgs) water gas shift
COO2H2ON2= 304057 vol
8947 (104plusmn04)10-3 (127plusmn03)10-3 (62plusmn02)10-3 7800 (148plusmn02)10-3 (192plusmn02)10-3 (87plusmn08)10-3 8113 (164plusmn04)10-3 (184plusmn03)10-3 (89plusmn05)10-3
The very low reactivity in CO oxidation and water gas shift reaction supports the fact that
during the propane oxidation the CO2 is formed in reaction steps which are independent
on the CO formation steps
55 Conclusions
The chemical treatment of the phase-pure MoVTeNbOx catalyst (referred to as parent or
original sample) with distilled water and solutions of phosphoric acid
tetramethylethylenediamin sodium-bromate and hydrazine was carried out at room
temperature The solutions were chosen in such a way to cover all the chemical effects
neutral acidic and complexing basic and complexing oxidizing and reducing None of
these treatments altered the M1 phase as probed by XRD The surface area was only
marginally affected by the treatment as shown by N2 physisorption
The morphology did not change significantly upon water treatment of the M1 material
However the treatment by all other solutions changed more significantly the shape of the
particles and the aspect ratio In contrast to the literature evidence [4] not only the
surface composition but also the bulk elemental composition was slightly affected by
chemical treatments with different solutions Nevertheless the M1 phase was kept intact
which showed that the crystal structure is robust enough to withstand minor changes in
the elemental composition upon leaching with the above mentioned solutions Besides
leaching of ions the oxidation of V4+ to V5+ during bromate treatment was also observed
No detectable change of the oxidation states has been observed for the other modified
catalysts
All the modified samples were tested for propane and propylene oxidation reaction Only
marginal improvements were observed in the propane conversion for the H2O- H3PO4
and the TMEDA-treated samples accompanied by a slight decrease in the acrylic acid
154
selectivity On the other hand the hydrazine treatment reduced slightly while the
bromate treatment reduces significantly both the conversion and the acrylic acid
selectivity at any space velocity For these two latter catalysts the apparent activation
energy was found to be higher than for all the other samples The reaction pathway
analysis using the delplot technique revealed that propylene is a first rank product in
every case The acrylic acid CO CO2 and acetic acid were found to be mixed rank
products (including primary secondary and tertiary ranks the main rank being
secondary) The only exception is the hydrazine treated sample on which all products
were found to be of first rank This sample is the only one which exhibited COCO2
selectivity ratio smaller than one
The first order kinetics with respect to propane and half order kinetics with respect to
oxygen was conserved in all the modified catalysts The ratio of propylene formation and
its further consumption is the highest (κ=30) for the parent sample This ratio is lower
for the modified catalysts the lowest value of 22 being determined for the hydrazine
treated sample
The ranking order for catalytic performance of propylene oxidation resembles to the trend
observed in propane oxidation
CO oxidation reaction was carried out on selected catalysts as a semi-quantitative
indicator-reaction for electrophilic oxygen species The semi-quantitative character of
this test reaction is derived from the fact that no standards were used with known
abundance of electrophilic oxygen species on the surface but rather the parent sample
was used as a reference catalyst The CO oxidation activity of the bromate and hydrazine
treated samples were determined because these showed markedly different catalytic
behavior both in propane and propylene oxidation reactions The ranking order in CO
oxidation activity showed that the hydrazine treated sample exhibits the highest
abundance of electrophilic oxygen species followed by the bromate treated sample and
the original catalyst
Furthermore water gas shift reaction and CO oxidation in presence of steam was also
carried out on these catalysts The CO conversion was found to be below 25 at the
space velocity of 3000 h-1 and a reaction temperature of 400 degC The low rate of CO2
production indicated that under propane oxidation conditions the CO oxidation and water
155
gas shift reactions are negligible Therefore this experiment proved that CO and CO2
byproducts are formed independently on each other in different pathways
The XRD patterns of the samples after propane and propylene oxidation reaction showed
that there was no phase change re-confirming the robustness of the M1 phase under
propane and propylene oxidation reaction conditions
References Chapter 5
1 Japanese Laid-Open Patent Application No 10-330343 2 L E Bogdan European Patent 1254707 A1 assigned to Rohm and Haas
Company 2002 3 4 LE Bogdan D A Bors F A Pessoa Cavalcanti M Bruce Clark A M
Gaffney S Han US Patent 7326668 B2 assigned to Rohm and Haas Company 5 V V Guliants R Bhandari B Swaminathan V K Vasudevan H H
Brongersma A Knoester A M Gaffney S Han J Phys Chem B 109 (2005) 24046-24055
6 M Baca J M M Millet Appl Catal A General 279 (2005) 67-77 7 Yu V Kolenrsquoko T Wolfram F Girgsdies W Zhang T W Hansen D Su A
Trunschke R Schloumlgl Chem Cat Comm accepted for publication 8 I H Warren DC Reid Chemistry and materials science Metallurgical and
materials transaction B Vol 13 No 4 565-570 9 D Langmuir P Chrostowksi R Chaney B Vigneault Issue Paper on the
environmental chemistry of metals US Environmental Protection Agency August 2003
10 E Asselin T M Ahmed A Alfantazi Corrosion Science 49 2 (2007) 694-710 11 M Bouroushian Electrochemistry of metal chalcogenides Monographs in
Electrochemistry (Ed F Scholz) Springer 2010 Page 65-69 12 P DeSanto DJ Buttrey RK Grasselli CG Lugmair AF Volpe BH Toby
T Vogt Z Krist 219 (2004) 152-165 13 I Griszligtede Die Partielle Oxidation von Propan zu Acrylsaumlure Bestimmung der
Reaktionskinetik und in-situ characterisierung des Katalysators unter Betriebsbedingungen Dissertation Universitaumlt Karlsruhe 2004 Universitaumltsverlag Karlsruhe ISBN 3-937300-17-1
14 J F Moulder W F Strickle P E Sobol K D Bomben Handbook of XPS spectroscopy Perkin-Elmer USA 1992
15 A Celaya Sanfiz T W Hansen D Teschner P Schnoumlrch F Girgsdies A Trunschke R Schloumlgl M H Looi S B A Hamid Journal of Physical Chemistry C 114 (2010) 1912
16 M Haumlvecker S Wrabetz J Kroumlhnert LI Csepei R Naumann dacuteAlnoncourt Yu V Kolenacuteko F Girgsdies R Schloumlgl A Trunschke J Catal submitted
17 Ch G Hill An introduction to chemical reaction engineering kinetics and reactor design John Wiley and Sons 1977 24-74
156
18 R W Missen Ch A Mims B A Saville Introduction to chemical reaction engineering and kinetics John Wiley and Sons 1999 49-55
19 E Balcells F Borgmeier I Griszligtede H G Lintz F Rosowski Appl Catal A General 266 (2004) 211
20 J M Loacutepez-Nieto B Solsona P Concepcioacuten F Ivars A Dejoz M I Vaacutezquez Catal Today 157 (2010) 291-296
21 F N Naraschewski C P Kumar A Jentys J A Lercher Appl Catal A General 391 1-2 (2011) 63-69
22 J Hermann Catal Today 2006 (112) 73-77
157
Chapter 6 Exploratory experiments
61 Introduction
In the literature many catalyst systems are reported for the selective oxidation of propane
to acrylic acid These can be classified into heteropolyacids and their salts phosphates
and molybdenum based mixed oxides [1 2] A strict delimitation between these classes
can not be made because under reaction conditions the heteropolyacids may transform
into oxides or phosphates [3] In general the performance of catalysts belonging to the
first two classes is rather poor Ai reported that an acid yield of ca 12 mol V2O5-P2O5
with a PV ratio equal to 100 while the yield decreased strongly with increasing PV
ratio
Upon incorporation of H3PMo12O40 heteropoly acid and Te in the V2O5-P2O5 the yield
could be increased The addition of SO3 barely had any effect while in presence of
H3PW12O40 Nb2O5 Sb2O3 SiO2 and B2O3 the yield decreased significantly [4 5]
The most prominent catalysts are the molybdenum and vanadium based mixed oxides
Katou et al reported the hydrothermal synthesis of orthorhombic and amorphous MoVOx
and MoVTeOx catalysts with surface areas up to 10 m2g [6] The catalytic experiments
were carried out in the narrow temperature interval between 343 and 354 degC A rather
reducing feed with the composition of C3H8O2H2ON2=651045385 vol was used
Propane conversions below 30 were reported on these catalysts at a single space
velocity of 2400 h-1 The products were acrylic acid propylene acetic acid acetone and
carbon oxides The acrylic acid selectivity was found to be around 6 for the crystalline
MoVOx catalyst In comparison to that the acrylic acid selectivity on the amorphous
catalyst was below 4 even at low propane conversion The quaternary orthorhombic
MoVTeOx oxide was found to be the best performing catalyst a selectivity of 493 was
reported at a conversion of 256 This led to the conclusion that tellurium promotes the
selective pathway towards acrylic acid The CO2 selectivity was in every case higher
than the CO selectivity On the other hand the acetic acid selectivity was also significant
above 15 However the product selectivities were compared at different conversions
for each catalyst Because of the fact that the selectivity depends on the conversion any
kind of comparison or ranking of selectivities made at different conversions might be
misleading Ueda et al addressed the question of catalytic function of each element of
158
MoVTeNbOx in the selective oxidation of propane to acrylic acid [7 8] Catalytic
experiments were carried out at different temperatures on hydrothermally prepared single
phase orthorhombic MoVOx MoVTeOx and MoVTeNbOx catalysts using a more
reducing feed (C3H8O2H2ON2=8104537 vol) than that reported by Katou et al [6]
The propane conversion was found to be very similar over all the catalysts at every
temperature below 380degC Although activation parameters were not calculated the very
similar temperature-conversion curve indicated that the activation energy indeed did not
depend on the presence and the quality of the third and fourth element Based on this fact
the authors claimed that Mo and V are the sole elements responsible for propane
activation On the other hand a rather poor selectivity (below 10) to acrylic acid was
reported for MoVOx at every temperature while the incorporation of tellurium lead to a
major increase in the selectivity to over 40 In the presence of niobium the highest
selectivity exceeded 60 indicating that both tellurium and niobium are indispensable
components of a high performing propane oxidation catalyst The positive effect of
tellurium was ascribed to its promoting effect on propylene further oxidation to acrylic
acid On the other hand the positive effect of niobium was ascribed for preventing the
acrylic acid over-oxidation One possible explanation was given by the site isolation
concept introduced by Grasselli [9] Without experimental evidence the modulation of
the redox couplings by Nb5+ in the MoVTeNbOx was highlighted as second possibility
for the beneficial effect of niobium on the catalytic performance
Guliants et al reported the surface promotion of hydrothermally synthesized
orthorhombic MoVOx catalyst [10] The tellurium antimony and niobium promoters lead
to increased activity and selectivity to acrylic acid The mixed Nb+Te and Sb+Nb
promoted catalysts showed the highest performance in accordance with the observations
on bulk mixed oxide catalysts
62 Propane oxidation reactivity on different Mo and V based catalysts
In the present study the catalytic testing in propane oxidation reaction to acrylic acid was
carried out on different ternary quaternary and quinternary Mo and V based mixed metal
oxide catalysts These are summarized in Table 621
159
In order to compare the catalytic data with literature results for the ternary and
quaternary oxides the experiments were performed under identical conditions with
respect to feed composition and contact time (C3H8O2H2ON2=651045385 vol
GHSV=2400 h-1 WF=150 gsml) with that used by Katou et al [6]
Table 621 The used catalysts and reaction conditions Catalyst preparation methods SD ndash spray drying HT ndash hydrothermal
Sample
ID
Composition
(EDX analysis)
Prep
Meth
C3H8O2H2ON2
(vol)
GHSV
(h-1
)
T
(degC)
1862 (Mo093V007)5O14 SD 36091 5000 400-
450
6142 MoV031Ox HT 651045385 2400 280-
320
8103 MoV034Ox HT 364051 9000-
42000 400
6274 MoV029P013Ox HT 651045385 2400 320-
360
6619 MoV044P005Ox HT 651045385 2400 300-
340
6683 MoV03Te003Ox HT 651045385 2400 300-
340
6059 MoV026Te010Nb022Ox HT 364051 5000-
66000
360-
400
The activities of the catalysts were found to be different under identical space velocity
and temperature Therefore the temperature was varied in 20degC steps in order to achieve
similar conversions of propane on the above named ternary and quaternary oxides In
case of 6274 the temperature was varied between 320 and 360degC while in case of 6619
and 6683 the reaction temperatures were between 300 and 340degC Among this set of
catalysts the MoVOx 6142 showed the highest activity thus the temperature was varied
between 280 and 320degC
160
Most of the catalytic studies in propane oxidation are performed under a different
condition that that reported by Katou et al [6] The typical feed composition is
C3H8O2H2ON2=364051vol and the temperature between 360 and 400degC For the
purpose of comparison the reactivity of MoVOx 8103 catalyst was tested using the
latter feed composition at 400degC In order to achieve different conversion of propane
which are comparable to those determined for the previously mentioned catalysts the
contact time was varied between 0075 and 0400 gsml (GHSV=48000 and 9000h-1)
Table 622 Comparison of the catalytic performance of MoVTeNbOx (6059) and MoVOx (8103) samples at 400degC feed composition C3H8O2H2ON2=364051 vol
6059 8103 GHSV (h
-1)
XC3H8 () SAA () XC3H8 () SAA ()
9000 381 plusmn 04 513 plusmn 13 436 plusmn 07 050 plusmn 002
24000 153 plusmn 04 392 plusmn 06 230 plusmn 05 18 plusmn 02
Upon comparing the conversions of propane under identical conditions with respect to
the feed composition temperature and space velocity it was found that MoVOx 8103 is
more active than MoVTeNbOx 6059 (Table 621) in contrast to the observation of
Ueda et al [6] On the other hand the significantly lower selectivity towards acrylic acid
of the MoVOx is in accordance with the trend reported by Ueda et al [6]
For comparison of the catalytic performance of phase-pure M1 MoVOx and Mo5O14-type
structure the (Mo093V007)5O14 oxide catalyst (1862) was also tested for propane
oxidation The (Mo093V007)5O14 catalyst was found to be rather inactive at 400degC and a
contact time of 072 gsml the conversion being only 04 and propylene selectivity of
48 At a reaction temperature of 450degC a propane conversion of 21 was achieved
while the propylene selectivity decreased to 29 Contrary to the experiment using M1
MoVOx catalysts no oxygenates were detected either in steam containing feed or in dry
feed Under every condition only propylene CO and CO2 were produced Therefore this
oxide acts only as an oxidative dehydrogenation catalyst This observation indicated that
besides the elemental composition the crystal structure has a decisive role both in
propane activation and reaction pathways
161
The Mo and V containing M1 catalyst (8103) was very active at 400degC while the
(Mo093V007)5O14 structure was much less active In contrast to the MoVOx M1 structure
the (Mo093V007)5O14 is unable to insert oxygen in the C-H bond to form oxygenates The
different reactivity of M1 MoVOx and (Mo093V007)5O14 is certainly related to the
different termination of the different bulk structures
The low propane oxidation activity of (Mo093V007)5O14 (1862) sample is in accordance
with the literature Baca et al reported a propane conversion of 08 and acrylic acid
selectivity of 6 on (Mo093V007)5O14 at 410degC On the other hand the (Mo093V097)5O14
exhibited a conversion of 26 at 410degC with 0 selectivity to acrylic acid [11]
For the comparison of the catalytic property of the catalysts the acrylic acid selectivity
was plotted versus the conversion (Figure 621) which allows a better comparison of the
performance rather than comparing selectivities at different conversions
The performances of all the ternary and quaternary catalysts were spread in the low
conversion-low selectivity quartile of the conversion-selectivity plot On the other hand
the phase pure MoVTeNbOx catalyst can be found in both the low conversion ndash high
selectivity and the high conversion ndash high selectivity quartile Therefore the rather
complex phase pure MoVTeNbOx is the best performing catalyst since the selectivity is
markedly higher than for all the other studied catalysts
The MoVOx 6142 catalyst exhibited a highest selectivity to acrylic acid of 25plusmn02
determined at a conversion of propane equal to 185plusmn20 the maximum yield being
05plusmn01 The most abundant product at this conversion was CO almost independently
on the reaction temperature (S=435plusmn08) followed by CO2 with a selectivity of
253plusmn05 A significant amount of acetic acid was also formed (SHAc=217plusmn08)
while propylene was a relatively minor product with a selectivity of 80plusmn03 The
selectivity to propylene acrylic acid and acetic acid decreased with increasing
temperature while the CO2 selectivity increased significantly with increasing reaction
temperature
The inclusion of tellurium in the MoVOx structure (6683) led to a slightly reduced
selectivity to acrylic acid compared to the pure MoVOx catalyst Similarly to the MoVOx
162
catalyst CO was the most abundant product with selectivity of ca 46 and almost
independently of the temperature
0 10 20 30 40 50 60 70 800
10
20
30
40
50
60
70
80
6619 - MoVPOx
6683 - MoVTeOx
6274 - MoVPOx
6142 - MoVOx
8103 - MoVOx
6059 - MoVTeNbOx
SAA ()
XC3H8 ()
Figure 621 Catalytic performance of different phase-pure Mo and V based oxides
The second most abundant byproduct was CO2 Its selectivity increased with the
temperature from 290plusmn07 to 360plusmn04 Acetic acid was formed in quite important
amounts (S=155plusmn16) while propylene was formed only in 68plusmn02
The inclusion of small amount of phosphorous in the MoVOx structure (6619) led to the
increase in the selectivity to acrylic acid to 47plusmn07 measured at the propane conversion
of 157plusmn35 The main product was CO its selectivity being over 40 Carbon dioxide
was the second most abundant product with selectivities above 28 The propylene
selectivity was situated between 111plusmn04 and 62plusmn04 while acetic acid between
124plusmn15 and 106plusmn07 depending on the temperature
A higher phosphorous content in the catalyst 6274 was beneficial for the increase of the
selectivity to acrylic to (obtained at 181plusmn10 propane conversion)
Among the studied ternary and quaternary catalysts this one exhibited the highest
selectivity (156plusmn03 obtained at a conversion of 181plusmn10) and yield of 33plusmn03
This yield is higher than the best value reported by Katou et al [6] Similarly to the other
163
catalysts the total oxidation products are the most abundant ones The propylene and
acetic acid selectivity was 122plusmn02 and 176plusmn01 respectively
The apparent activation parameters (activation energy Ea logarithm of the preexponential
factor lnA activation enthalpy ∆H and activation entropy ∆S) of propane and oxygen
conversion were calculated based on the linearized Arrhenius- and Eyring-Polanyi
equations In the literature the activation enthalpy and entropy is seldom considered
although these quantities also give an important insight into the activation of molecules
involved in the reaction
Figure 622 The activation parameters of the propane and oxygen conversion on the MoV(Te)(P)(Nb)Ox catalysts
The highest propane activation energy of ca 60 kJmol was observed for MoVOx
catalyst Statistically similar activation energy was determined for the phosphorous
containing catalysts However in the case of tellurium inclusion the activation energy of
propane is reduced significantly by ca 20 kJmol compared to MoVOx This observation
is in contradiction with that reported by Ueda et al namely that the presence of the
tellurium and niobium does not affect the propane activation [6-8]
The logarithm of the pre-exponential factor is also different for all the catalysts The
apparent activation energy and the pre-exponential factor of oxygen consumption differ
for the individual catalysts It is remarkable that the highest oxygen activation energy is
associated to the catalyst 6274 with the highest acrylic acid selectivity However the
6142 6274 6619 6683 60590
20
40
60
80
100 Ea C3H8 (kJmol)
lnA C3H8
Ea O2 (kJmol)
lnA O2
Ea lnA
Catalyst
Activation energy pre-exponential factor Activation enthalpy and entropy
6142 6274 6619 6683 60590
-50
-100
-150
-200
-250 ∆∆∆∆H
C3H8 (kJmol)
∆∆∆∆S C3H8 (JmolK)
∆∆∆∆H O
2 (kJmol)
∆∆∆∆S O
2 (JmolK)
∆∆ ∆∆H (kJm
ol)
∆∆ ∆∆S (J
molK)
Catalyst
164
active surface oxygen species are involved in many reaction steps including the
dehydrogenation of propane to propylene the oxidation of propylene to acrylic and acetic
acids and eventually the combustion steps Certainly the global oxygen consumption is
the sum of the amount of oxygen species consumed in all these steps
The negative activation entropy of both propane and oxygen activation suggests that
these are involved in associative steps in the formation of the transitional state More
negative activation entropy indicates a more rigid transitional state The most negative
activation entropy was observed on 6683 MoVTeOx while the least negative on 6142
MoVOx
Table 623 summarizes the catalytic performance of some selected catalysts reported in
the literature The literature search data serves as a basis for comparison of the catalytic
performance for the catalysts reported in the present work
The first and second column contains information concerning the catalyst composition
and preparation method respectively Very different preparation methods (including
slurry- hydrothermal- solid-solid reaction impregnation- and spray drying) were used
On the other hand the extent of characterization reported by the literature sources also
differs very much
For instance the elemental composition reported by Ai refers to preparative composition
[4 5] In contrast to that in the more recent studies a thorough characterization of the
catalysts (including surface and bulk sensitive analytical methods) is documented
Very different reaction conditions were used by the different authors Ai used highly
oxidizing feed (O2C3H8=40) without employing inert gas (balance gas) besides steam
[4 5] A reducing feed was used by Ueda et al Baca et al Guliants et al [7 8 10]
while Celaya Sanfiz et al worked with stoichiometric feed [12] As it is shown in Table
623 in the present work both reducing and stoichiometric feed were used
Table 623 summarizes the catalytic performance of some selected catalysts reported in
the literature The literature search data serves as a basis for comparison of the catalytic
performance for the catalysts reported in the present work
165
Table 623 Comparison of the performance of selected catalysts Composition as determined by (a) stoichiometry (b) ICP (c) EDX (d) LEIS-surface Preparation method slurry (Sl) hydrothermal (Ht)
Solid-solid (Ss) Incipient impregnation (Ii) Spray drying (Sd) (P) ndash present work Catalyst Prep
meth C3H8O2H2Oinert
(vol) GHSVWF-1τ (h-1gsml-1s)
T (degC)
XC3H8
() SAA
() YAA
() EaC3H8
(kJmol-
1) Ref
VPOa 380 281 na na 126plusmn8 VPO+H3PMo12O40
a 380 348 na na 113plusmn9 VPO+ H3PW12O40
a 370 294 na na 195 VPO+ SO3
a 380 330 na na 79plusmn11 VPO+TeO2
a 380 246 na na 109plusmn4 VPO+Nb2O5
a 360 342 na na 74 VPO+Sb2O3
a 380 332 na na 88 VPO+SiO2
a 385 171 na na 107plusmn7 VPO+B2O3
a
Sl 19762210
--9
400 236 na na 126
4
VP115Te015Oa 340 18 46 8 na
VP115Te015Nb01Oa 340 25 32 8 na
VP115Te015Zr01Oa
Sl 19762210
340 42 16 7 na
5
MoV034Ob 379 327 34 1 na
MoV044Te01Ob 380 362 466 17 na
MoV025Te011Nb012Ob
Ht 8104537 240015-
380 334 624 21 na 6
MoV023Te011Nb014Oc
(M1) Ht 380 299 52 16
58 plusmn04
MoV03Te032Nb007Oc
(M2) Ss 410 06 22 01 na
MoV033Te022Nb011Oc Sl 380 349 53 19 58plusmn18
MoV05Te022Nb011Oc Sl
6104341 2500--
400 253 46 12 648
Mo097V095O5c Ht
651045385 3300--
410 264 0 0 26plusmn1
11
MoV019Od 400 47 4 02 168plusmn18
MoV068Od 400 114 4 05 68plusmn6
MoV036Te007Od 400 111 8 09 48
MoV03Nb013Od 400 136 20 27 72plusmn12
MoV02Sb007Od 400 181 19 34 67plusmn23
MoV069Te004Nb013Od 400 102 29 30 108plusmn13
MoV031Nb014Sb002Od
Ht
MoV
O
Ii M
Ox
639447337 -125-
400 181 19 34 79plusmn18
10
MoV026Te017Nb029O 400 56 79 44 na MoV026Te017Nb029O
Ht 364051 -075 3- 400 49 73 36 na
12
MoV031Oc 300 279 17 05 59plusmn8
MoV029P013Oc 320 272 84 23 47plusmn4
MoV044P005Oc 320 233 36 08 53plusmn11
MoV03Te003Oc H
t M
oVO
Ii
EO
x
6104539 240015-
320 371 21 08 38plusmn8 MoV026Te010Nb022O
c 400 607 582 35 56plusmn3 MoV034O
c Ht
400 23 17 04 na (Mo093V007)5O14
c Sd
364051 4500 24000--
450 21 0 0 125plusmn14
(P)
166
The first and second column contains information concerning the catalyst composition
and preparation method respectively Very different preparation methods (including
slurry- hydrothermal- solid-solid reaction impregnation- and spray drying) were used
On the other hand the extent of characterization reported by the literature sources also
differs very much
For instance the elemental composition reported by Ai refers to preparative composition
[4 5] In contrast to that in the more recent studies a thorough characterization of the
catalysts (including surface and bulk sensitive analytical methods) is documented
Very different reaction conditions were used by the different authors Ai used highly
oxidizing feed (O2C3H8=40) without employing inert gas (balance gas) besides steam
[4 5] A reducing feed was used by Ueda et al Baca et al Guliants et al [7 8 10]
while Celaya Sanfiz et al worked with stoichiometric feed [12] As it is shown in Table
623 in the present work both reducing and stoichiometric feed were used
The conversion selectivity and yield were listed at the given temperature The apparent
activation energy of propane consumption was either taken from the publications or
calculated based on the reported catalytic data in the cited sources
Due to the fact that the reaction conditions used by different groups are different it is
difficult or even impossible to compare directly the catalytic data A general observation
is however that both niobium and tellurium are indispensable elements for a high
performing Mo and V based catalyst
63 Propylene oxidation reactivity on different Mo and V based catalysts
Besides the phase-pure M1 MoVTeNbOx other Mo and V based oxides were tested for
propylene oxidation These catalysts were
bull MoV03Te003Ox (6683)
bull (Mo093V007)5O14 (1862) and
bull (Mo068V023W009)5O14 (1401)
167
The results of the catalytic tests are summarized in the following
Propylene oxidation was performed on MoV03Te003Ox 6683 using the following feed
C3H6O2H2ON2=57545385 vol The catalyst was very active at a temperature
interval between 180 and 250degC conversions between 30 and 80 were measured at a
space velocity of 2400 h-1 (WF=150 gsml) (Table 631) Similarly to the experiments
performed on MoVTeNbOx 6902 (section 425) the production of maleic anhydride
was also observed
Compared to MoVTeOx and MoVTeNbOx catalysts the (Mo093V007)5O14 was found to
be a less active propylene oxidation catalyst In the 300-420degC temperature interval 10-
50 conversion was observed for a space velocity of 5000 h-1 (Figure 631)
When steam was not introduced in the feed the main product was found to be acrolein
Interestingly maleic anhydryde was formed in a quite high amount at a reaction
temperature of 350degC at the expense of acrolein formation In this case the quantitation
of maleic anhydride was possible because in absence of the co-fed steam no hydrolysis
occurred It should be noted however that the peak shape of maleic anhydride was
highly asymmetric but quantifiable Therefore the carbon balance approached
satisfyingly 100 The acrolein selectivity peaked at ca 70 at a reaction temperature of
400degC The acrylic acid selectivity was below 10 while acetic acid and acetone were
produced in traces
In presence of 40 vol steam in the feed the propylene conversion and acrylic acid
selectivity was slightly increased The positive effect of steam on the productivity was in
accordance with the observation of steam effect on propane and propylene oxidation over
the phase pure M1 MoVTeNbOx catalyst (6902)
Similarly to the experiment carried out on catalyst 6902 acetone was the main product
at low temperatures when steam containing feed was applied The acetone selectivity
dropped according to a sigmoidal curve with increasing temperature
The acrolein selectivity increased and reached a plateau at 70 in the temperature
interval between 400 and 420degC The CO and CO2 production was not influenced very
significantly by the presence of steam On the other hand the maleic acid was also
produced but its quantification was not possible because of the problems related to
hydrolysis However because the mass balance was as high as 95 it can be concluded
168
that in presence of steam the maleic acid production was suppressed compared to the
experiment carried out in absence of steam
300 350 400 450
0
20
40
60
80
100
Conversion Selectivity ()
T (degC)
X C3H6 XO2 S AA S CO2 S Ace S Acr S HAc S MAnh S CO C-bal
250 300 350 400 450
0
20
40
60
80
100 X C3H6 X O2 S AA S CO2 S Ace S Acr S HAc S CO C-balC
onversion Selectivity ()
T (degC)
C3H6O2H2ON2=510085 vol
WHSV=5000 h-1 WF=072 gsml
C3H6O2H2ON2=5104045 vol
WHSV=5000 h-1 WF=072 gsml
Figure 631 Propylene oxidation over (Mo093V007)5O14 catalyst (1862)
The reactivity of MoVTeNbOx MoVTeOx and (Mo093V007)5O14 in propylene oxidation
reaction is summarized in the Table 631
The reactivity ranking is the following (Mo093V007)5O14 lt (Mo068V023W009)5O14 lt
MoV03Te003Ox ~MoVTeNbOx
As it can be seen there is a very large difference of about one order of magnitude
between the apparent activation energy of propylene activation on Mo5O14 structures and
phase pure M1 Mo and V based oxide catalysts
The co-fed steam induced a significant decrease of about 50 kJmol in the apparent
activation energy of propylene over the (Mo093V007)5O14 catalyst In presence of steam
the activation energy was similar on (Mo093V007)5O14 and (Mo068V023W009)5O14
catalysts
As it can be seen there is a very large difference of about one order of magnitude
between the apparent activation energy of propylene activation on Mo5O14 structures and
phase pure M1 Mo and V based oxide catalysts
169
Table 631 Propylene oxidation reactivity on different catalysts
Catalyst Feed
GHSV
T
(degC)
XC3H6
()
SAA
()
YAA
()
rC3H6
(micromicromicromicromolgs)
EA
(kJmol)
510085
5000 400 344plusmn03 44plusmn01 15plusmn01 098 140plusmn3
(Mo093V007)5O14
1862 5104045
5000 400 416plusmn03 83plusmn04 35plusmn02 118 93plusmn2
(Mo068V023W009)5O14
1401
510085
5000 400 592plusmn03 83plusmn01 49plusmn01 168 92plusmn2
MoV03Te003Ox
6683
57545385
2400 220 727plusmn03 26plusmn3 19plusmn2 099 22plusmn2
MoVTeNbOx
6902
364051
20000 400 947plusmn02 63plusmn1 60plusmn1 583 15plusmn1
The co-fed steam induced a significant decrease of about 50 kJmol in the apparent
activation energy of propylene over the (Mo093V007)5O14 catalyst In presence of steam
the activation energy was similar on (Mo093V007)5O14 and (Mo068V023W009)5O14
catalysts
Rather low apparent activation energies (22 and 15 kJmol) were found for the
MoV03Te003Ox and the MoVTeNbOx catalysts
64 Exploratory reaction pathway analysis of propane oxidation on phase-pure M1
catalyst
The kinetic modeling of a complex reaction involves two main steps The first step is the
discrimination between possible networks of reaction pathway
The second step constitutes the discrimination between rate expressions and fitting the
kinetic equations to the experimental data [13-15]
The proposed pathways in the literature state that the oxidative dehydrogenation of
propane is the first step The formed propylene may undergo oxidation to acrolein and
then to acrylic acid Parallel to these steps in presence of steam propylene is hydrated to
acetone followed by oxidation to acetic acid [4 5 11 16 17] Some proposed pathways
170
include the oxidation of propane to 1-propanol and 2-propanol in the scheme in
competition with the propane oxidative dehydrogenation step [1 2 16 17] However
these compounds are seldom reported to be detectable reaction products at high
temperature (350-400degC) Additionally the propylene formation is more favored
thermodynamically than the formation of 1-propanol and 2-propanol
The common feature of all the proposed pathways is that the CO and CO2 are shown to
be produced by total oxidation of acrylic acid and acetic acid However the propylene
and other undetectable intermediates (acrolein acetone etc) are reactive compounds
which are prone to undergo total combustion reaction pathways Also in the literature
there is frequently no discrimination between CO and CO2 both oxidation products being
designated as COx In the model proposed by Grisstede the CO CO2 and acetic acid is
merged under the term ldquobyproductsrdquo [18-20]
Due to the above described inconsistencies of the proposed models in this section the
identification of reaction pathways and the kinetic modeling based on the reaction
pathways is presented
Among the numerous methods for reaction pathway discrimination described in the
literature the delplot technique was claimed to be one of the most efficient and reliable
This is because its application is not limited to primary products or by reaction orders
[15] This technique is based on the relationships between the conversion (X) and yield
(Y) respectively The mathematical derivation of the formulas corresponding to the
YXn=f(X) n-th order delplots is presented in detail in the cited source [15]
Historically the plot of product selectivity in function of the conversion is the most
widely applied which is equivalent with a first rank delplot This plot is a measure of
reaction economics because it directly provides information concerning the maximum
productivity In addition to this the discrimination of primary products from non-primary
products is possible based on this plot The extrapolation of the curves corresponding to
the products towards zero conversion gives an intercept with the selectivity axis If the
intercept is a finite number the respective product is a primary or first rank product The
products with a zero intercept are non-primary or higher rank products
To discriminate between secondary tertiary etc rank products higher rank delplots are
used The second rank delplot represents the yield divided by the square of the
171
conversion in function of the conversion (YX2=f(X)) A diverging curve on this plot is
characteristic of a primary product A finite intercept indicates secondary product while
the curves with zero intercept correspond to product rank higher than two
On the third rank delplot the YX3 ratio is represented in function of the conversion (X)
A diverging curve on the third rank delplot indicates product with a ranking order lower
than two A curve with finite intercept corresponds to a third rank product while zero
intercept indicates a product with higher rank This method can be continued until all the
product ranks are sorted out
The delplot technique is applied to catalytic data determined for the propane oxidation
over the phase pure MoVTeNbOx catalyst in order to sort out the reaction product ranks
In the paper published by Bhore et al the YXn ratio is plotted in function of the
conversion where n is the rank of the delplot Because the yield is the product of
conversion and selectivity the SXn-1 quantity is equivalent with the YXn quantity
Therefore here the SXn-1=f(X) plots are considered in the following
Figure 641 displays the delplots corresponding to the experiment carried out at 400degC
using a feed composition of C3H8O2H2ON2=364051 vol
On the first rank delplot the curve corresponding to propylene has a finite intercept which
is close to 90 indicating a first rank product The acrylic acid and carbon monoxide
show an intercept statistically around 3 This may imply that both are second rank
products Carbon dioxide and acetic acid show statistically zero intercept which indicates
that these are higher rank products
On the second rank delplot the propylene curve is diverging which supports that this is a
primary product On the other hand acrylic acid carbon monoxide carbon dioxide and
acetic acid show finite intercept indicating that all these are secondary products
On the third and fourth rank delplots the curves corresponding to propylene and acrylic
acid are diverging Upon magnification it becomes visible that the curves of acetic acid
carbon monoxide and dioxide are diverging as well indicating that their rank is below
three and four Due to the fact that there are no curves with zero intercept on the third and
fourth rank delplots all product ranks are discriminated by the first and second rank
plots
172
0 20 40 60 80 100
0
20
40
60
80
100
AA
CO2
C3H
6
HAc
CO
S ()
X C3H8
()
0 20 40 60 80 100
0
5
10
15
20
25
AA
CO2
C3H
6
HAc
CO
SX
C3H
8
X C3H8
()
1st rank delplot 2nd rank delplot
0 20 40 60 80 100
0
1
2
3
4 AA
CO2
C3H6
HAc
CO
SX2
X C3H8
()
0 20 40 60 80 100
00
02
04
06
08
10 AA
CO2
C3H
6
HAc
COSX3
X C3H8
()
3rd rank delplot 4th rank delplot
Figure 641 Delplots for propane oxidation using the feed C3H8O2H2ON2=364051vol at T=400degC Catalyst ID 6059
In contrast to the reaction pathways proposed in the literature the total oxidation products
are not formed only in the combustion steps of acrylic acid and acetic acid because their
main rank is two However due to the limitation of the delplot technique ndash that it uses
extrapolation of the curves toward zero educt conversion ndash it is not possible to
discriminate whether a product is purely a second rank product or it has a multiple rank
of two and three The third rank delplot diverges in case of a product which has a rank of
two and three suggesting only second rank Consequently this method is not applicable
to discriminate products with superimposed ranks (Appendix 61)
173
For this reason the total oxidation products should not be considered to be only second
rank products as the delplots indicate Due to the fact that acrylic acid as a mainly second
rank product is also prone to combustion the resulting CO and CO2 are third rank
products
Table 641 Product ranks at different temperatures For multiple rank products the main ranks are highlighted by bold letter P-primary S-secondary
Product rank T (degC)
C3H6 AA HAc CO CO2
360 P P S S P S S 380 P P S S P S S 400 P P S S P S S
The product ranks at different temperatures are the same as Table 641 demonstrates
This indicates that the reaction network is the same in the temperature interval between
360 and 400degC
The Figure 642 displays the delplots corresponding to the experiment carried out in
absence of steam in the feed at 400degC
On the first rank delplot the propylene appears to be a first rank product However in
contrast to the experiment carried out in presence of steam the acrylic acid has a
statistically zero intercept indicating a higher rank than one Both the CO and CO2 show
low finite intercepts suggesting that they are minor first rank products The curve
corresponding to acetic acid has a zero intercept
On the second rank delplot the propylene curve is diverging The curves corresponding to
acrylic acid acetic acid CO and CO2 show finite intercepts Therefore all these products
are second rank products
The higher rank delplots are diverging similarly to the experiment carried out in presence
of steam
174
0 20 40 60 80 100
0
20
40
60
80
100
S ()
XC3H8 ()
AA
CO2
C3H
6
HAc
CO
0 20 40 60 80 100
0
2
4
6
8
AA
CO2
C3H
6
HAc
CO
SX
XC3H8 ()
1st rank delplot 2nd rank delplot
0 20 40 60 80 100
00
02
04
06
08
10
AA
CO2
C3H
6
HAc
CO
SX2
X C3H8 ()
0 20 40 60 80 100
000
002
004
006
008
AA
CO2
C3H
6
HAc
CO
SX3
XC3H8 ()
3rd rank delplot 4th rank delplot
Figure 642 Delplots for propane oxidation using the feed C3H8O2H2ON2=36091vol at T=400degC Catalyst ID 6059
The product ranks for the steam content variation experiment are summarized in Table
642 Between 10 and 40 vol steam content the ranks are the same suggesting the
same reaction pathway However in absence of steam the acrylic acid is purely a second
rank product while carbon dioxide has a minor primary rank as well The difference
between the product ranks indicates that the reaction pathways are different in presence
and in absence of steam
175
Table 642 Product ranks at different steam contents For multiple rank products the main ranks are highlighted by bold letter P-primary S-secondary rank
Product rank H2O content
(vol) C3H6 AA HAc CO CO2
0 P S S P S P S 10 P P S S P S S 20 P P S S P S S 30 P P S S P S S 40 P P S S P S S
Taking into account the reaction product ranks the main reaction pathway was found to
be propanerarrpropylenerarracrylic acid Due to the fact that acetic acid is a secondary
product it is formed in a parallel step with respect to acrylic acid Separated CO and CO2
production pathways were included on the main pathways (Figure 4219 and 4220) As
the CO oxidation and water gas shift activity of the catalyst is found to be negligible (see
subchapter 427 and 433) the inclusion of these steps was omitted in the first approach
of kinetic modeling
Alternative reaction models including the following steps
bull coupled production of CO and CO2 from propylene acrylic acid and acetic
acid
bull coupled production of acetic acid and CO
bull coupled production of acetic acid and CO2
bull production of acrylic acid in a single step from propane and in a secondary
step from propylene (cf minor first rank component of acrylic acid in
presence of steam in the feed)
bull simultaneous production of acetic acid from propylene and acrylic acid
followed by combustion to CO
bull simultaneous production of acetic acid from propylene and acrylic acid
followed by slow combustion to CO2
were disregarded because the simulated concentration profiles did not match up with the
experimental profiles
176
The kinetic modeling was performed in Berkeley Madonna software First order rate
equations were set up with respect to each compound The first order kinetics with
respect to propane was experimentally verified (subchapter 423)
For the integration of the differential equations system corresponding to the reaction
models the fourth order Runge-Kutta method numerical method (RK4) was used The
calculated dimensionless concentration profiles of the products and educt were compared
to the experimental dimensionless concentration profiles The dimensionless
concentration of any compound i was calculated as the ratio between the molar
concentration of i species and the initial molar concentration of propane
)146 ( 083
Equationc
cy
HC
i
i =
The best correlation of the simulated concentration profiles with the experimental data
was found to be in the case of the model shown in Figure 643 This is highlighted as
model 1 This model was found to be applicable for the experiments carried out in the
temperature interval between 360 and 400degC and 40 vol steam content and also for the
experiments using 10 20 30 and 40 vol steam in the feed at a reaction temperature of
400degC
Figure 643 Reaction model 1 for propane oxidation
CH2=CH-COOH C3H8 C3H6
CH3COOH+CO2 CO2
CO CO CO
k1 k2
k3
k4
k5
k6
k7
177
The set of differential equations corresponding to model 1 are shown below
)646 (
)546 (
)446 ( )(
)346 ( )(
)246 ( )(
6634
75633
65632
6343283163
838183
2
83
Equationykykdt
dy
Equationykykykdt
dy
Equationykkykdt
dy
Equationykkkykdt
dy
Equationykkdt
dy
AAHC
CO
HCAAHCCO
AAHCAA
HCHC
HC
HC
HC
sdot+sdot=
sdot+sdot+sdot=
sdot+minussdot=
sdot++minussdot=
sdot+=minus
On the other hand for the experiment carried out in dry feed delplot technique indicated
that CO2 is also a minor primary product besides propylene and CO Therefore in the
model valid for the steam free conditions is shown in the Figure 644
Figure 644 The reaction model 2
Including in the reaction model the total oxidation step of propane to carbon dioxide
leads to the following set of differential equations
CH2=CH-COOH C3H8 C3H6
CH3COOH+CO2 CO2
CO CO CO
k1 k3
k4
k5
k5
k6
k2
CO2
k8
178
)1146 (
)1046 (
)946 ( )(
)846 ( )(
)746 ( )(
8386634
75633
65632
6343283163
8387183
2
83
Equationykykykdt
dy
Equationykykykdt
dy
Equationykkykdt
dy
Equationykkkykdt
dy
Equationykkkdt
dy
HCAAHC
CO
HCAAHCCO
AAHCAA
HCHC
HC
HC
HC
sdot+sdot+sdot=
sdot+sdot+sdot=
sdot+minussdot=
sdot++minussdot=
sdot++=minus
The implementation in the Berkeley Madonna software of the differential equations corresponding to Model 1 and Model 2 is shown in Appendix 62
65 Exploratory kinetic modeling on propane oxidation on phase-pure MoVTeNbOx
catalyst
651 The effect of temperature
The kinetic modeling based on reaction model 1 (section 64) lead to the rate constants
which are summarized in the Table 651 The model one contains seven reaction steps as
follows propane is oxidatively dehydrogenated to propylene and oxidized in parallel to
carbon monoxide The formed propylene undergoes oxidation to acrylic acid carbon
monoxide and in a coupled step to acetic acid and carbon dioxide Finally the acrylic
acid undergoes total oxidation as well to carbon monoxide and dioxide
Propane undergoes mainly oxidative dehydrogenation to propylene Oxidation of propane
to carbon monoxide also takes place but the rate constant (k7) of this step is very low in
the order of magnitude of 10-6 mlgs The low rate constant of propane total combustion
is in accordance with the low CO selectivity determined at low propane conversion On
the other hand the low value of the intercept on the first rank delplot also suggests low
total oxidation activity towards carbon monoxide
Propylene is a highly reactive intermediate as demonstrated by the high values of rate
constants of oxidation to acrylic acid (k2) acetic acid and total oxidation products (k3 and
k4) The ratio between the propylene consumption rate constants (k2+k3+k4) and the
179
propylene formation rate constant is 198 210 and 178 respectively at 360 380 and
400degC These are in good accordance with the values reported in the literature
Loacutepez-Nieto et al reported a value of ca 24 on a predominantly M1 phase containing
MoV024Te024Nb013Ox catalyst [21]
Naraschewski et al reported a value of 25 for MoVTeNbOx catalysts with ten different
elemental- and phase compositions However the fitting was made in case of one of the
catalyst the value for each catalyst was not quantified [22]
Grisstede reported a propane consumption rate constant of 084 gsml and a global
consumption rate of propylene of 204 gsml on a MoV033Te025Nb017Ox catalyst at
400degC The ratio of propylene consumption and formation rate constant is therefore
204084=243 [18-20]
Acrylic acid is also prone to further oxidation mainly to carbon dioxide (k6) and in very
minor proportions to carbon monoxide (k5)
It is remarkable that the highest rate constant in the reaction model corresponds to the
selective oxidation step of propylene to acrylic acid
Table 651 The rate constants corresponding to the steps of the reaction model 1
T (degC) k1
(mlgs)
k2
(mlgs)
k3
(mlgs)
k4
(mlgs)
k5
(mlgs)
k6
(mlgs)
k7
(mlgs)
360 0519 7443 2401 0451 501 10-4 0684 597 10-7
380 0650 8806 4211 0642 817 10-4 0912 120 10-6
400 0871 9244 5195 1093 162 10-3 1089 216 10-6
The activation parameters determined from the above data based on the Arrhenius-plot
are shown in Table 422
Table 652 The activation energy and preexponential factor of the individual reaction steps
Reaction step 1 2 3 4 5 6 7
Ea (kJmol) 46plusmn4 19plusmn6 69plusmn17 78plusmn10 104plusmn12 41plusmn5 114plusmn4
lnA 80plusmn08 57plusmn11 139plusmn31 140plusmn19 121plusmn22 75plusmn09 73plusmn07
180
The activation energy of propane to propylene transformation is in good agreement with
the value of 53plusmn8 kJmol (section 424) determined from the temperature dependence of
propane conversion
652 The effect of steam
Reaction kinetic modeling was performed using model 1 for the concentration profiles
determined using steam containing feed Due to the fact that in absence of steam carbon
dioxide was also a primary product an additional total oxidation pathway involving
propane was taken into account (model 2) The reaction steps of the models are
propanerarrpropylenerarracrylic acid as main pathway to which k1 and k2 rate constants are
associated The unselective pathway involving propane is oxidation to CO (in steam
containing feed characterized by the rate constant k7) and CO2 (in dry feed characterized
by rate constant k8) One of the unselective pathways starting from propylene
intermediate gives carbon monoxide (k3) while the other yields acetic acid and carbon
dioxide (k4) The two unselective pathways involving acrylic acid are the total oxidation
to CO (k5) and CO2 (k6) The reaction models are described in more detail in subchapter
429
Table 653 The rate constants of the individual steps as determined based on model 1 and model 2
H2O
content
(vol)
0 10 20 30 40
k1 (mlgs) 0431 0650 0711 0821 0870
k2 (mlgs) 7772 7195 8395 9394 9244
k3 (mlgs) 0736 3896 4595 4395 5194
k4 (mlgs) 0675 1490 1283 1589 1093
k5 (mlgs) 0668 00074 000144 00076 000162
k6 (mlgs) 0538 0935 1037 0962 1089
k7 (mlgs) 00241 849middot10-6 334middot10-6 288middot10-6 316middot10-6
k8 (mlgs) 00057 - - - -
181
The rate constants obtained from the kinetic modeling using reaction model 1 for the
steam containing feed and reaction model 2 for the steam free feed are compiled in Table
653
In accordance with the catalytic data shown on Figure 425 the propane consumption
rate constant (k1) increases when steam is added to the feed and it levels off above the
concentration of 20 vol Addition of steam increases also the rate constant of propylene
selective oxidation to acrylic acid (k2) The same trends were reported by Grisstede [18
19]
In presence of steam the rate constants of acetic acid and total oxidation product
formation from propylene intermediate are also increased dramatically (k3 and k4)
The increasing steam content may promote the propylene hydration to isopropanol [23
26] Further oxidation of isopropanol gives acetone and finally acetic acid and total
oxidation products However neither the isopropanol nor acetone was detected in the
reaction mixture suggesting that these products are further oxidized rapidly without
desorption
In the presence of steam the oxidation of acrylic acid to carbon dioxide is increased
(reaction step 6) however the total oxidation of propane to carbon monoxide- and
dioxide is very significantly suppressed (reaction steps 7 and 8)
Some literature source assigns the positive effect of steam on the catalytic performance to
the better heat transfer properties of the steam containing feed [27] Due to the fact that
the propane oxidation reaction is a rather exothermic reaction the real temperature of the
active site might be higher than the measured (macroscopic) temperature of the catalytic
bed Zheng et al [27) 191-194] speculated that the steam containing feed more efficiently
removes the reaction heat preventing overheating of the active sites and therefore total
combustion is prevented However according to the calculation of Grisstede the
maximum temperature increase above the setpoint temperature due to reaction heat is 2degC
[19]
The heat capacity and heat conductivity of the feed indeed decreases linearly with the
decreasing steam content (Appendix 63) Nevertheless the propane conversion and
acrylic acid selectivity is not influenced significantly in the 20-40 vol steam content
182
interval while both catalytic properties are decreasing below 20 vol steam
concentration If in absence of steam the reaction heat would not be removed efficiently
and the catalyst surface would be overheated the propane conversion would not drop
(Figure 423) but it would increase below 20 vol steam content (Appendix 63)
Therefore it can be excluded that the only effect of steam is that to improve the thermal
properties of the feed with respect to heat transfer
References Chapter 6
1 M M Lin Appl Catal A 207 (2001) 1-16 2 E K Novakova J C Vedrine Propane selective oxidation to propene and
oxygenates on metal oxides in Metal Oxides - Chemistry and applications JGL Fierro (Ed) 2006 CRC Press pp 414-461
3 A Trunschke Propane selective oxidation to acrylic acid in Nanostructured Catalysts Selective oxidation reactions Ch Hess R Schloumlgl (Eds) RCS Cambridge in press
4 M Ai Catal Today 13 (1992) 679-684 5 M Ai J Catal 101 (1986) 389-395 6 T Katou D Vitry W Ueda Catal Today 91-92 (2004) 237-240 7 W Ueda D Vitry T Katou Catal Today 96 (2004) 235-240 8 D Vitry Y Morikawa J L Dubois W Ueda Appl Catal A 251 (2003) 411-
424 9 R K Grasselli Top Catal 15 (2001) 5 10 V V Guliants R B Bhandari B Swaminathan V K Vasudevan H H
Brongersma A Knoester A M Gaffney S Han J Phys Chem B 109 (2005) 24046-24055
11 M Baca A Pigamo J L Dubois J M M Millet Top Catal 23 (2003) 39-46 12 A Celaya Sanfiz T W Hansen D Teschner P Schnoumlrch F Girgsdies A
Trunschke R Schloumlgl M H Looi S B A Hamid J Phys Chem C 114 (2010) 1912-1921
13 J R Kittrell Adv in Chem Eng 8 (1970) 97-183 14 P G Ashmore A Jones Reaction Kinetics RSC Specialist Periodical Reports 1
(1975) 291-308 15 N A Bhore M T Klein K B Bishoff Ind Eng Chem Res 29 (1990) 313-
316 16 M Lin T B Desai F W Kaiser P D Klugherz Catal Today 61 (2000) 223-
229 17 R Fushimi S O Shekhtman A Gaffney S Han G Yablonsky J T Gleaves
Ind Eng Chem Res 44 (2005) 6310-6319 18 E Balcells F Borgmeier I Grisstede H-G Lintz Catal Lett 87 (2003) 195 19 I Grisstede Die Partielle Oxidation von Propan zu Acrylsaumlure Bestimmung der
Reaktionskinetik und in-situ characterisierung des Katalysators unter
183
Betriebsbedingungen Dissertation Universitaumlt Karlsruhe 2004 Universitaumltsverlag Karlsruhe ISBN 3-937300-17-1
20 E Balcells F Borgmeier I Grisstede H-G Lintz F Rosowski Appl Catal A General 266 (2004) 211
21 J M Loacutepez-Nieto B Solsona P Concepcioacuten F Ivars A Dejoz M I Vaacutezquez Catal Today 157 (2010) 291-296
22 F N Naraschewski C P Kumar A Jentys J A Lercher Appl Catal A General 391 1-2 (2011) 63-69
23 Y Moro-oka Appl Catal A General 181 (1999) 323-329 24 L Luo PhD thesis California Institute of Technology Pasadena California 2001 25 J C Veacutedrine E K Novakova E G Derouane Catal Today 81 (2003) 26 247-262 H-G Lintz S P Muumlller Applied Catal A General 357 (2009) 178-
183 27 W Zheng Zh Yu P Zhang Y Zhang H Fu X Zhang Q Sun X Hu J
Natural Gas Chemistry 17 (2008) 191-194
184
General Conclusions and Outlook
The present work was centered on the systematic kinetic study of the selective oxidation
of propane to acrylic acid using a well defined mixed oxide catalyst
A well characterized phase-pure M1 MoVTeNbOx catalyst was used for the studies
which was synthesized reproducibly on the multi-gram scale
The objectives were to
bull Study the bulk structural stability of the catalyst under the reaction conditions
whereby the kinetic experiments are carried out
bull Study the effect of the reaction variables (temperature steam content redox
potential) on the catalytic performance and the kinetics of the propane selective
oxidation reaction
bull Study the catalytic oxidation propylene acrolein and carbon monoxide under
identical conditions corresponding to the propane oxidation in order to determine
the relative reactivity and product distributions
bull Study the effect of stage-wise addition of oxidizing gases (oxygen nitrous oxide)
in order to verify whether the multi-tubular reactor arrangement is suitable to
increase the catalytic performance compared to the conventional single-tube fixed
bed reactor
bull Study the addition of propylene carbon monoxide and carbon dioxide in order to
gain more information about the reaction pathways and identify whether these
compounds adsorb competitively on the active sites of the catalyst with propane
or other intermediates
bull Study the effect of post synthesis treatment employing different solutions (neutral
acidic basic complexing oxidizing and reducing) on the bulk structure
surfacebulk composition and catalytic performance of the phase-pure M1
MoVTeNbOx catalyst
The knowledge of the stability is an absolute criterion for the proper catalytic kinetic and
structure-relationship studies and mechanistic understanding of the reaction The
structural stability was addressed in a long term in-situ XRD experiment The feed
185
composition was varied in such a way that the conditions covered all the relevant ones for
catalytic and kinetic experiments (ie steam containing and steam free mixture net
oxidizing stoichiometric and net reducing) The phase purity of the used catalyst is not
affected under any of the conditions The Rietveld refinement revealed that the lattice
constants are not affected by the reaction conditions ranging from net oxidizing to net
reducing feed irrespective of the steam content When the catalyst was exposed to
strongly reducing conditions (3 vol propane in nitrogen) for long time (24 hours) the
lattice constants changed but no new phase could be detected The STEM analysis of the
sample after in-situ reaction showed pitting-like holes on the particles The voids and
their sizes were statistically distributed which suggests that the recrystallization which
occurred upon exposing the catalyst to extreme reducing conditions was controlled by
diffusion as no reaction front could be observed The EDX analysis performed
complementary to the STEM imaging revealed tellurium and oxygen depletion The
results show that the catalyst bulk structure is stable and homogeneous under reaction
conditions unless it is exposed to extremely strong reducing conditions for long time
Therefore the reactivity is detemined by the surface properties The exceptional bulk
structural stability permitted the kinetic study of the reaction variables
The effect of reaction variables was studied in a conventional fixed bed reactor The
detectable products were propylene acrylic acid acetic acid CO and CO2 The
temperature was varied between 360 and 400degC in 20degC steps The highest acrylic acid
productivity was observed at 400degC The steam content was varied between 40 and 0
vol in 10 vol steps A decrease of the propane conversion and acrylic acid selectivity
was observed below 20 vol steam content Stable operation (ie no deactivation) was
observed in steam free feed Upon reintroducing the steam in the feed the same catalytic
performance was attained as before exposing the catalyst to dry feed This shows that the
change of the catalytic performance with the steam content is fully reversible
The redox potential variation covered reducing stoichiometric and oxidizing conditions
(up to 5-fold oxygen excess) Under oxidizing conditions the same conversion and
selectivity was observed as in stoichiometric feed while under reducing condition the
conversion and selectivity to acrylic acid was slightly lower Cycling experiments
186
showed reversibility of the catalytic performance upon exposing the catalyst to net
reducing conditions However the stady state was restored slower (ca 8 hours time on
stream) compared to the the steam content variation variation experiment whereby the
steady state operation was achieved within minutes
The catalytic oxidation of other substrates (propylene acrolein and CO) was performed
in order to gain more insight into reactivity of these intermediates and the reaction
pathways they might be involved in
The propylene was found to be ca 7 times more reactive than propane at 400degC and it
produced mainly acrylic acid It was notable that acetone was also produced in significant
amounts while this compound was not detected at all under propane oxidation
conditions even though propylene is a reaction intermediate
The acrolein was found to be 94 times more reactive compared to propane at 400degC The
reaction products were acrylic acid (with a yield up to 89) acetic acid and carbon
oxides
The CO oxidation performed under stoichiometric and oxidizing conditions in dry and
steam-containing feed revealed a very low activity the highest conversion being below
1 at a space velocity of 3000h-1 at 400degC Additionally the water gas shift activity was
found to be even lower compared to the CO oxidation activity The CO oxidation and
water gas shift activity was 80 to 100 times lower compared to the propane oxidation
activity These results suggested that under propane oxidation conditions (400degC GHSV
between 4500 and 66000 h-1) the formed CO2 is not formed via CO oxidation or water
gas shift reaction Given this fact the formation of CO and CO2 during the propane
oxidation reaction occurs in two different pathways that are independent on each other
which may suggest the existence of two different active sites whereby combustion
pathways occur Based on this finding the reaction networks proposed in the literature
according to which the total oxidation products are merged together as COX=CO+CO2
may be improved Furthermore the CO oxidation activity may be used as a proxy for the
abundance of the electrophilic oxygen species on the surface The low CO oxidation
activity suggested low abundance of electrophilic oxygen which activates electron rich
centers (such as C=C bond) of the molecule and lead to unselective pathways in
nucleophilic oxidation reactions such as propane oxidation to acrylic acid
187
The stage-wise addition of oxygen lead to an improvement of the acrylic acid yield by
5 when compared to the catalytic data obtained in the conventional single-tube reactor
Upon dosing O2 in the first reactor tube and N2O in the second reactor tube of the two-
stage setup it was observed that N2O is not consumed at all even if the conditions were
chosen in such a way that the oxygen was consumed completely This suggests that the
phase-pure M1 MoVTeNbOx is not reoxidized by N2O
Upon addition of propylene in the second reactor tube revealed a slight competition of
propane and propylene on the active sites or for the available oxygen active species all
the added propylene was oxidized to acrylic acid acetic acid CO and CO2 It is notable
that in contrast to the propylene oxidation experiments no acetone formation was
observed
Neither the CO nor the CO2 influenced the product distribution of propane oxidation
reaction This suggested that none of these gases were competitively adsorbed on the
active sites with the educt or intermediates The added CO was not oxidized to CO2
which confirmed the negligible activity observed for the separate CO oxidation
experiments
In a series of experiments carried out separately from the above described ones the
phase-pure M1 MoVTeNbOx was subjected to treatment with solutions os different
nature (neutral acidic basic complexing oxidizing and reducing) at room temperature
The bulk structure was not affected by any of these treatments as probed by the XRD
measurement The bulk composition varied only marginally as probed by EDX while
the morphology and the surface composition changed more significantly upon the
chemical treatment The samples treated by neutral acidic basic complexing and
reducing solutions exhibited similar catalytic properties in propane and propylene
oxidation with the original untreated sample However the treatment by an oxidizing
solution led to a dramatic decrease in the activity and the selectivity to acrylic acid in the
propane oxidation reaction
188
The findings of the above summarized experiments on the well defined structurally
exceptionally stable catalyst suggest that the catalyst surface responds dynamically to the
changes in the chemical potential of the feed mixture under real reaction conditions The
dynamics is reflected in the changes of the reactivity This study may contribute to the
better understanding of the kinetics and the mechanism of the propane selective oxidation
reaction
189
Appendices
Appendix 51 Reaction networks of propane oxidation over the modified catalysts
To find out the reaction pathways on modified catalysts the delplot technique was applied as it was described in the section 64 The delplots corresponding to the catalytic measurements with H2O- NaBrO3 and N2H4- treated samples are presented below The H2O-treated sample behaves similarly to the parent sample As it is shown on the Figure A511 the first rank delplot gives a fairly high intercept for propylene and acrylic acid (35 and 65 respectively) indicating that these are primary products Since the extrapolation is made over a large interval of conversion the rank of acrylic acid is uncertain
First rank delplot Second rank delplot
0 10 20 30 40 50 60 70 80 90 1000
20
40
60
80
100
S ()
X C3H8 ()
AA CO2 C3H6 HAc CO
0 10 20 30 40 50 60 70 80 90 100
00
05
10
15
20
25
30 AA CO2 C3H6 HAc CO
SX
XC3H8 ()
Third rank delplot Fourth rank delplot
0 10 20 30 40 50 60 70 80 90 100
000
002
004
006
008
010
012
SX2
X C3H8 ()
AA CO2 C3H6 HAc CO
0 10 20 30 40 50 60 70 80 90 100
0000
0001
0002
0003
0004
0005
0006
SX3
X C3H8 ()
AA CO2 C3H6 HAc CO
Figure A511 The delplots corresponding to the propane oxidation using the H2O modified sample
(7797) Feed composition C3H8O2H2ON2=364051 vol T=400degC Extrapolation over the differential operation is suggested Usually the conversion-selectivity curve corresponding to acrylic acid goes through a maximum The increasing
190
segment of such a curve lies in the low conversion interval The intercepts corresponding to other products (CO CO2 and acetic acid) are low statistically close to zero on the first rank delplot suggesting that these are not primary products On the second rank delplot the curves of propylene and acrylic acid are diverging which indicate that the rank of these are primary products The divergent curves on the third and fourth rank delplots indicate that all the product ranks are less than three and four The total oxidation products and acetic acid have a finite intercept suggesting that these are secondary products The bromate treated sample (7800) was less active than the other samples at any space velocity The lowest conversions were in the differential operation mode On the first rank delplot finite intercepts were observed for propylene acrylic acid CO and CO2 indicating that all of these are first rank products On the second rank delplot the propylene and acrylic acid curves are diverging strongly (Figure A512)
First rank delplot Second rank delplot
0 10 20 30 40 500
20
40
60
80
100 AA CO
2
C3H
6
HAc CO
S ()
XC3H8 ()
0 10 20 30 40 50
0
10
20
30
40
50 AA CO2 C3H6 HAc CO
SX
XC3H8 ()
Third rank delplot Fourth rank delplot
0 10 20 30 40 50
0
3
6
9
12
15
SX2
X C3H8 ()
AA CO2 C3H6 HAc CO
0 10 20 30 40 50
0
2
4
6
8
10
SX3
X C3H8 ()
AA CO2 C3H6 HAc CO
Figure A512 The delplots corresponding to the propane oxidation using the NaBrO3 modified sample
(7800) Feed composition C3H8O2H2ON2=364051 vol T=400degC
191
The slight divergence of CO and CO2 indicate that these products are mainly first rank products but a small second rank component can not be excluded The acetic acid is a second rank product Similarly to the previous cases the higher rank delplots lead to diverging curves for all the products
First rank delplot Second rank delplot
0 20 40 60 80 1000
20
40
60
80
100 AA CO2 C3H6 HAc CO
S ()
XC3H8 ()
0 20 40 60 80 1000
1
2
3
4
5 AA CO2 C3H6 HAc CO
SX
XC3H8 ()
Third rank delplot Fourth rank delplot
0 20 40 60 80 100
00
01
02
03
04
SX2
X C3H8 ()
AA CO2 C3H6 HAc CO
0 20 40 60 80 100
0000
0005
0010
0015
0020
0025
SX3
X C3H8 ()
AA CO2 C3H6 HAc CO
Figure A513 The delplots corresponding to the propane oxidation using the hydrazine modified sample
(8113) Feed composition C3H8O2H2ON2=364051 vol T=400degC Differences were noted also in the catalytic properties of the hydrazine treated sample (8113) compared to the parent and other modified catalysts The activity differences were significant only at low conversions close to the differential operation mode Nevertheless the product distribution also differs from all the other catalysts In case of the parent sample and all the other modified the selectivity of CO and CO2 was higher than one except the measurement at the lowest space velocity of 3000 h-1 whereby
192
almost complete oxygen conversion (95) was attained Compared to these catalysts on the hydrazine treated sample the ratio between the CO and CO2 selectivity is inverted at any conversion On the first rank delplot corresponding to catalyst 8113 every compound had a nonzero positive intercept indicating that all are first rank products (Figure A513) The strongly diverging curves on the second third and fourth rank delplot confirmed that every product is mainly a primary product The product ranks corresponding to every catalyst mentioned in this chapter are summarized in Table A511 It can be observed that propylene is a primary product on all the catalysts Acrylic acid showed a primary and secondary component in case of the parent sample and the tetramethylethylenediamine treated sample while for the rest of the samples it was a primary product A mixed rank for CO and CO2 was found except for the water treated sample (7797) where these were only secondary products while on the hydrazine treated sample (8113) only primary products The acetic acid was mainly a secondary product except for the 7797 where a primary rank could not be excluded and for 8113 where first rank was observed Table A511 Product ranks on the different catalysts P-primary S-secondary Catalyst 6902 7797 7798 7799 7800 8113
C3H6 rank P P P P P P AA rank P S P P P S P P CO rank P S S P S P S P S P CO2 rank P S S S P S P S P HAc rank S P S S S S P
Certainly the CO and CO2 are multiple rank products and according to the rationale described in the section 427 and Appendix 52 the tertiary rank can not be excluded However in Table A511 only those ranks were listed which resulted from the delplots Upon summarizing the results of catalytic experiments on propane oxidation over the modified samples the most striking differences were noted The bromate treated sample (7800) shows the
bull lowest activity and selectivity in propane oxidation bull highest apparent activation energy bull mainly primary rank toward acrylic acid
The hydrazine treated sample (8113) is unique among the studied catalysts with respect to the followings
bull the ratio of COCO2 selectivity was below one for all the conditions bull all products were found to be mainly primary products
193
Appendix 61 Modeling the delplots for a reaction pathway that contains multiple
rank product
The applicability of the delplot technique introduced by Bhore et al was demonstrated on a reaction pathway consisting of one intermediate and two end products This technique is easily applicable for discernment of product ranks for a network of serial and parallel steps such as isomerisation reactions However in the case of oxidation reactions such as propane oxidation the educt the intermediate (propylene acrolein) and the product (acrylic acid) may undergo total oxidation pathways as well leading to CO and CO2 (cf section 64 and Appendix 51) In most of the proposed networks in the literature the total oxidation products appear only as end products from oxidation of acrylic acid and acetic acid respectively If this would be true the CO and CO2 rank would be quaternary As it was demonstrated by the delplots (subchapter 429) the curves corresponding to CO and CO2 on the third and fourth rank delplot are diverging which indicate that the rank of products are less than three and four It was found that these products are mainly secondary products and sometimes they appear also as minor products depending on the reaction conditions and the catalyst To tackle the above noted apparent inconsistency the delplot technique was applied to a reaction network that contains products with superposed or multiple ranks (primary secondary and tertiary) The simplest model for such a network consists of two parallel steps involving the reactant A (Figure A611) In one of the steps A is converted to intermediate B which undergoes a transformation to C In parallel to this sequence A is transformed directly to the C species
Figure A611 Reaction network containing a superposed primary and secondary rank end product
Therefore the C species is secondary product in the upper pathway and a primary product in the lower pathway This simple model resembles the oxidative dehydrogenation reactions with the simplification that only one total oxidation product is taken into account (CO or CO2) The simplification was made only for the purpose of easier mathematical handling of the kinetic modelThe differential equations corresponding to this model are the following
A B C
A C
k1 k2
k3
194
)316 (
)216 (
)116 ( )(
32
21
31
AEquationykykdt
dy
AEquationykykdt
dy
AEquationykkdt
dy
AB
C
BAB
AA
+=
minus=
+=minus
This set of differential equations is analytically solvable but because of the fact that the integrated rate equations are rather complicated they are not shown here Moreover the analytical equation for the calculation of the intercept is even more complicated the limit of the function can be obtained only by applying the lrsquoHospitalrsquos rule Therefore the set of differential equations was solved numerically in the Berkeley Madonna software using time steps of 002 s
0 20 40 60 80 1000
20
40
60
80
100
k3=02 gsml
k3=05 gsml
k3=10 gsml
k3=60 gsml
SB ()
X A ()
k1=10 gsml
k2=50 gsml
0 20 40 60 80 1000
20
40
60
80
100
k1=10 gsml
k2=50 gsml
k3=02 gsml
k3=05 gsml
k3=10 gsml
k3=60 gsml
SC ()
X A ()
First rank delplot species B First rank delplot species C
0 20 40 60 80 100
0
10
20
30
40
50
k1=10 gsml
k2=50 gsml
k3=02 gsml
k3=05 gsml
k3=10 gsml
k3=60 gsml
SBXA
X A ()
0 20 40 60 80 1000
1
2
3
4
5
6
k1=10 gsml
k2=50 gsml
k3=02 gsml
k3=05 gsml
k3=10 gsml
k3=60 gsml
SCXA
X A ()
Second rank delplot species B Second rank delplot species C
Figure A612 The delplot for B and C species corresponding to the reaction pathway depicted on Figure A611
The k1 rate constant was fixed to 10 gsml while k2 to 50 gsml Four different values were tried for k3 as follows 02 05 10 and 60 respectively The conversion and selectivities were calculated from the concentrations obtained from the numerical
195
solution of the differential equations Then the first and second rank delplots were constructed for the B and C species (Figure A612) The finite intercept on the first rank delplot corresponding to B species indicated first rank product On the other hand the first rank delplot corresponding to C shows an intercept close to zero at low values of k3 (02 and 05) while in the case of higher k3 values the intercept is above zero (around 2) This suggests that at higher k3 the C species is clearly a first rank product The divergent curves corresponding to the B species on the second rank delplot indicated that B is a primary product However the curves corresponding to the C species are diverging in the second rank delplot A slight divergence can be observed for low k3 values (02 and 05) while the divergence at high rate constants (10 and 60) is very pronounced Therefore based on exclusively the delplots one would erroneously conclude that the B and C species are primary products
A more complicated reaction network is depicted on Figure A613 This consists of two parallel pathways involving the reactant A producing the B and D species The B intermediate species is also involved in two parallel steps In one of them it is transformed to C while the other represents transformation to the D product Finally the C is transformed to D product Therefore according to the scheme B is a primary product C is a secondary product while the D is a primary secondary and a tertiary product as well This resembles to a simplified network for the oxidation of propane to acrylic acid The B stands for propylene the C is acrylic acid while D represents one of the total oxidation products (CO or CO2) The simplification consists of neglecting the pathway leading to acetic acid and considering of only one total oxidation product
Figure A613 Reaction network containing a superposed primary secondary and tertiary end product
The differential equations corresponding to this reaction network is shown below This set of differential equations was solved using the Berkeley Madonna software Since the case of simultaneous formation of a primary and secondary product with different rate constant of the second rank product formation was discussed on the Figure A612 in the present case the rate constant of the tertiary product formation (k5) was varied between 005 and 300 gsml while all the other rate constants were kept constant (k1=100 gsml k2=500 gsml k3=005 gsml k4=005 gsml)
A B C k1 k2
k3
D
k4 k5
196
)716 (
)616 (
)516 ( )(
)416 ( )(
543
52
422
31
AEquationykykykdt
dy
AEquationykykdt
dy
AEquationykkykdt
dy
AEquationykkdt
dy
CBAD
CB
C
BAB
AA
++=
minus=
+minus=
+=minus
Because the B was only a primary product the delplots corresponding to this species are not shown Only the delplots corresponding to the C and D products are analyzed in the following The first rank delplot corresponding to C and D exhibits a low but nonzero intercept (2 and 4 respectively) This suggests that both are primary products The D is indeed a primary product on the reaction scheme however the C is a secondary product The inconsistency in the rank of C determined from the delplot is due to systematic error introduced by extrapolation On the other hand the second rank delplot corresponding to C confirms that this species is a secondary product independently on the value of the k5 rate constant The third rank delplot showed that indeed the C has a lower rank than three The highly divergent curves corresponding D species on the second rank delplot suggests that this is only a primary product in contrast to the reaction scheme Finally the third rank delplot for the D species are strongly diverging indicating lower ranks than three However according to the reaction scheme D is a tertiary product as we ll As demonstrated by the above two simulated cases when a reaction network contains a product that is formed in two or more steps (multiple rank product) the delplot technique is not always suitable to find out the ranks Usually the lowest rank can be identified but the higher ranks are not identifiable due to diverging curves (these ranks being ldquomaskedrdquo by the lowest rank) The curvature strongly depends on the rate constants of the individual reaction steps Therefore in real applications a great care should be taken when discriminating the pathways leading to potentially multiple rank products such as CO and CO2 in oxidation catalysis For the identification of the pathways the ldquochemical knowledgerdquo arising from reactivity studies involving the reaction intermediates should also be taken into account besides the mathematics of the delplot technique
197
0 20 40 60 80 1000
20
40
60
80
100 k
5=005 gsml
k5=020 gsml
k5=100 gsml
k5=300 gsml
SC ()
X A ()
0 20 40 60 80 1000
20
40
60
80
100 k
5=005 gsml
k5=020 gsml
k5=100 gsm
k5=300 gsml
S D ()
X A ()
First rank delplot species C First rank delplot species D
0 20 40 60 80 10000
05
10
15
20
25
30
k5=005 gsml
k5=020 gsml
k5=100 gsm
k5=300 gsml
SCXA
X A ()
0 20 40 60 80 10000
05
10
15
20
25
30 k
5=005 gsml
k5=020 gsml
k5=100 gsm
k5=300 gsml
SDXA
X A ()
Second rank delplot species C Second rank delplot species D
0 20 40 60 80 100
00
01
02
03
04
05
06 k5=005 gsml
k5=020 gsml
k5=100 gsm
k5=300 gsml
SCXA2
X A ()
0 20 40 60 80 100
00
01
02
03
04
05
06 k
5=005 gsml
k5=020 gsml
k5=100 gsm
k5=300 gsml
SDXA2
X A ()
Third rank delplot species C Third rank delplot species D
Figure A614 The delplots for C and D species corresponding to the parallel-consecutive reaction network depicted on Figure A613
198
Appendix 62 The kinetic models implemented in the Berkeley Madonna software
Program for implementing Model 1 in Berkeley Madonna Rxn1a1=k1yC3H8 k1=12 rxn1a2=k2yC3H6 k2=12 rxn1a3=k3yC3H6 k3=1 rxn1a4=k4yC3H6 k4=1 rxn1a5=k5yAA k5=1 rxn1a6=k6yAA k6=1 rxn1a7=k7yC3H8 k7=1 INIT yC3H8=1 INIT yC3H6=0 INIT yAA=0 INIT yHAc=0 INIT yCO=0 INIT yCO2=0 ddt(yC3H8)=-rxn1a1-rxn1a7 ddt(yC3H6)=rxn1a1-(rxn1a2+rxn1a3+rxn1a4) ddt(yAA)=rxn1a2-(rxn1a5+rxn1a6) ddt(yHAc)=rxn1a4 ddt(yCO)=rxn1a3+rxn1a5+rxn1a7 ddt(yCO2)=rxn1a4+rxn1a6 METHOD RK4 STARTTIME = 0 STOPTIME=2 DT = 002
Program for implementing Model 2 in Berkeley Madonna rxn2a1=k1yC3H8 k1=12 rxn2a2=k2yC3H6 k2=12 rxn2a3=k3yC3H6 k3=1 rxn2a4=k4yC3H6 k4=1 rxn2a5=k5yAA k5=1 rxn2a6=k6yAA k6=1 rxn2a7=k7yC3H8 k7=1 rxn2a8=k8yC3H8 k8=1 INIT yC3H8=1 INIT yC3H6=0
199
INIT yAA=0 INIT yHAc=0 INIT yCO=0 INIT yCO2=0 ddt(yC3H8)=-rxn2a1-rxn2a7-rxn2a8 ddt(yC3H6)=rxn2a1-(rxn2a2+rxn2a3+rxn2a4) ddt(yAA)=rxn2a2-(rxn2a5+rxn2a6) ddt(yHAc)=rxn2a4 ddt(yCO)=rxn2a3+rxn2a5+rxn2a7 ddt(yCO2)=rxn2a4+rxn2a6+rxn2a8 METHOD RK4 STARTTIME = 0 STOPTIME=2 DT = 002
Appendix 63 The physical properties of the gas mixtures with different steam
contents
The selected physical properties (such as density heat capacity heat conductivity and kinematic viscosity) of mixtures containing C3H8 H2O O2 and N2 are shown in the Table A631 The mixtures correspond to the feed compositions used for the steam content variation presented in section 422 The physical properties were calculated at a temperature of 400degC using the Fluidatreg on the Net on-line calculator (wwwfluidatcom) provided by Bronkhorst For the estimation of the eventual hot-spot formation on the catalyst surface all the above mentioned physical properties are needed Semi-quantitatively the data may be interpreted as follows if in absence of steam hot-spot formation would occur the propane conversion would increase and the selectivity would decrease Since in absence of steam the conversion decreases (Figure A 631) the hot-spot formation is not likely to occur Therefore isothermal operation mode may be assumed Table A631 Physical properties of different feed mixtures Mixture 1 C3H8O2H2ON2=364051 vol Mixture 2 C3H8O2H2ON2=363061 vol Mixture 3 C3H8O2H2ON2=362071 vol Mixture 4 C3H8O2H2ON2=361081 vol Mixture 5 C3H8O2H2ON2=36091 vol
Property Mixture
1
Mixture
2
Mixture
3
Mixture
4
Mixture
5
Density (kgm3) 044 046 048 049 051 Heat capacity
(kJkgmiddotK) 1482 1399 1322 1250 1184
Heat conductivity102 (WmK)
634 610 582 551 527
Kinematic viscositymiddot105 (m2s)
654 640 624 609 604
200
0 10 20 30 40000
004
008
1200
1400
1600
0
20
40
60
80
100 HeatCapacity (kJkgK)
HeatConductivity (WmK)
Therm
al property
H2O content (vol)
Conversion Selectivity ()
X C3H8
S AA
Figure A 631 Plot of thermal properties of the feed mixture and the catalytic properties in function of the
steam content
201
Acknowledgements for permission to reprint published materials
1 Robert K Grasselli J D Burrington D J Buttrey P DeSanto C G Lungmair A F Volpe Jr T Weignand Multifunctionality of Active Centers in (Amm)oxidation Catalysts From BindashMondashOx to MondashVndashNbndash(Te Sb)ndashOx Topics in Catalysis 23 (2003) 5 with permission from Springer
2 MM Bettahar G Costentin L Savary JC Lavalley On the partial oxidation of propane and propylene on mixed metal oxide catalysts Applied Catalysis A General 145 (1996) 1-48 with permission from Elsevier
3 Gang Fu X Xu X Lu H Wan Mechanisms of Initial Propane Activation on Molybdenum Oxides A Density Functional Theory Study Journal of Physical Chemistry B 109 2005 6416-6421 with permission from the American Chemical Society
4 Manhua Lin Tejal B Desai Frederick W Kaiser Peter D Klugherz Reaction pathways in the selective oxidation of propane over a mixed metal oxide catalyst Catalysis Today 61 (2000) 223-229 with permission from Elsevier
5 R Fushimi S O Shekhtman A Gaffney S Han G S Yablonsky J T Gleaves Industrial amp Engineering Chemistry Research 44 (2005) 6310-6319 with permission from the American Chemical Society
6 P Botella J M Loacutepez Nieto B Solsona A Mifsud F Maacuterquez The Preparation Characterization and Catalytic Behavior of MoVTeNbO Catalysts Prepared by Hydrothermal Synthesis Journal of Catalysis 209 (2002) 445-455 with permission from Elsevier
7 C Hamel Aacute Toacuteta F Klose E Tsotsas A Seidel-Morgenstern Analysis of single and multi-stage membrane reactors for the oxidation of short-chain alkanesmdashSimulation study and pilot scale experiments Chemical Engineering Research and Design 86 (2008) 753-764 with permission from Elsevier
202
List of abbreviations
AA ndash acrylic acid
Ace ndash acetone
Acr ndash acrolein
AHM ndash ammonium heptamolybdate
at - atomic percentage
BESSY ndash Berliner Elektronenspeicherring-Gesellschaft fuumlr Synchrotronstrahlung
BET ndash Brunauer Emmett Teller method
C-bal ndash carbon balance
CSTR ndash continuous-flow stirred tank reactor
DFT ndash density functional theory
dpmax ndash the maximum particle diameter of the sieve fraction
dpmin ndash the minimum particle diameter of the sieve fraction
dr ndash the inner diameter of the reactor tube
Ea Eaapp ndash apparent activation energy
EDX ndash energy dispersive X-ray analysis
ESR ndash electron spin resonance
FBR ndash fixed bed reactor
FTIR ndash Fourier transform infrared spectroscopy
GC-MS ndash gas chromatograph coupled to mass spectrometer
GHSV ndash gas hourly space velocity
HAc ndash acetic acid
HPC ndash heteropoly-compounds
k ndash rate constant
LEIS ndash low energy ion scattering
MAnh ndash malonic anhydride
MFC ndash mass flow controller
MMO ndash multi-metal oxide
MSD ndash mass spectrometric detector
ODH ndash oxidative dehydrogenation
203
P ndash primary product
PFR ndash plug-flow reactor
PI ndash pressure indicator
r ndash reaction rate
R1 R2 ndash reactor tubes of the two-stage reactor
S ndash secondary product
SEM ndash scanning electron microscopy
Si ndash selectivity to the product appearing in the index
STEM ndash scanning transmission electronmicroscopy
STR ndash single-tube reactor
TCD ndash temperature conductivity detector
TIC ndash temperature indicator and controller
TMEDA ndash tetramethylethylenediamine
TSR ndash two-stage reactor
UV-Vis ndash ultraviolet-visible spectroscopy
VPO ndash vanadium-phosphorous oxides
WF ndash weight per flow contact time
WGS ndash water gas shift reaction
WHSV ndash weight hourly space velocity
XAS ndash X-ray absorption spectroscopy
Xi ndash conversion of the species in the index
XPS ndash X-ray photoelectron spectroscopy
XRD ndash X-ray diffraction
Yi ndash yield of the species in the index
yi ndash dimensionless concentration
∆H ndash enthalpy change
∆H ndash activation enthalpy
∆S ndash entropy change
∆S ndash activation entropy
204
List of figures
Chapter 1 Introduction and motivation Figure 121 Propylene oxidation and ammoxidation mechanism over bismuth molybdate catalysts as proposed by Grasselli et al [9]helliphelliphelliphelliphelliphelliphelliphelliphelliphelliphelliphelliphelliphelliphelliphelliphelliphelliphelliphelliphelliphelliphelliphelliphelliphelliphelliphelliphelliphellip4 Figure 122 Mechanism of propylene oxidation by consecutive acid-base and redox steps as proposed by Bettahar et al [12]helliphelliphelliphelliphelliphelliphelliphelliphelliphelliphelliphelliphelliphelliphelliphelliphelliphelliphelliphelliphelliphelliphelliphelliphelliphelliphelliphelliphelliphelliphelliphelliphelliphelliphellip5 Figure 123 Some examples of the possible transitional states of hydrogen atom abstraction according to[18] The numbers on the figures correspond to the calculated bond lengthshelliphelliphelliphelliphelliphelliphelliphelliphelliphelliphellip11 Figure 124 Reaction network of propane oxidation according to Bettahar et al [12]helliphelliphelliphelliphelliphelliphellip14 Figure 125 The relative oxidative stability of several intermediates at different temperatures [22]helliphellip15 Figure 126 Oxidation pathways of propane according to [22]helliphelliphelliphelliphelliphelliphelliphelliphelliphelliphelliphelliphelliphelliphelliphellip16 Figure 127 Effect of CO2 on the acrylic acid yield [30]helliphelliphelliphelliphelliphelliphelliphelliphelliphelliphelliphelliphelliphelliphelliphelliphelliphelliphellip20
Figure 128 Reaction steps and nature of active and selective sites in the oxidation of propane to acrylic acid on MoVTeNbOx catalysts [35]helliphelliphelliphelliphelliphelliphelliphelliphelliphelliphelliphelliphelliphelliphelliphelliphelliphelliphelliphelliphelliphelliphelliphelliphelliphelliphellip21 Figure129 The flow rate (left) and concentration distribution of oxygen (right) in the catalytic membrane reactor without reaction taking place The blue and green curves correspond to different reactor geometries (aspect ratios) The profile corresponding to fixed bed reactor (FBR) is indicated by orange line [61]helliphellip34 Figure 1210 (a) Selectivity of propylene vs propane conversion (b) selectivity of propylene vs temperature Conditions xC3H8
in=1 O2C3H8=1 and WHSV=100 and 400 kgsm3 [61]helliphelliphelliphelliphelliphelliphellip35
Chapter 2 Experimental methods Fig 221 The experimental setup denominated as PropOx-1helliphelliphelliphelliphelliphelliphelliphelliphelliphelliphelliphelliphelliphelliphelliphelliphellip47 Figure 222 The temperature profile of the reactor tube Zero centimeter corresponds to the bottom of the heating cartridge The delimitation of the isothermal zone is marked by blue lineshelliphelliphelliphelliphelliphelliphelliphelliphellip49 Figure 223 The gas tubing connection of the two stage reactorhelliphelliphelliphelliphelliphelliphelliphelliphelliphelliphelliphelliphelliphelliphelliphellip53 Figure 224 The dilution ratio in the second reactor (red dots) and the overall space velocity (black squares) change upon oxygen addition in the two-stage reactor systemhelliphelliphelliphelliphelliphelliphelliphelliphelliphelliphelliphelliphelliphellip54 Figure 225 Detection at the MSD 1 acetic acid 2 acrylic acid helliphelliphelliphelliphelliphelliphelliphelliphelliphelliphelliphelliphelliphelliphellip56 Figure 226 Detection at the TCD 1 carbon- dioxide 2 water 3 propylene 4 propane 5 oxygen 6 nitrogen 7 carbon-monoxide valve switching helliphelliphelliphelliphelliphelliphelliphelliphelliphelliphelliphelliphelliphelliphelliphelliphelliphellip56 Figure 227 Calibration graphs helliphelliphelliphelliphelliphelliphelliphelliphelliphelliphelliphelliphelliphelliphelliphelliphelliphelliphelliphelliphelliphelliphelliphelliphelliphelliphelliphellip58 Figure 231 The TEM image of the catalyst 6059 helliphelliphelliphelliphelliphelliphelliphelliphelliphelliphelliphelliphelliphelliphelliphelliphelliphelliphelliphellip62 Figure 232 The XRD pattern of 6059 6902 and 8947helliphelliphelliphelliphelliphelliphelliphelliphelliphelliphelliphelliphelliphelliphelliphelliphelliphellip63
Chapter 3 Structural stability of the M1 MoVTeNbOx catalyst under propane
oxidation conditions Figure 331 The XRD patterns recorded under different reaction conditionshelliphelliphelliphelliphelliphelliphelliphelliphelliphelliphellip70 Figure 332 The lattice constants determined for every conditionhelliphelliphelliphelliphelliphelliphelliphelliphelliphelliphelliphelliphelliphelliphellip71 Figure 333 The normalized average intensity corresponding to acrylic acid during the in-situ XRD experiment monitored by on-line MS (black squares) The concentration of acrylic acid determined in the PropOx-1 fixed bed reactor (blue dots)helliphelliphelliphelliphelliphelliphelliphelliphelliphelliphelliphelliphelliphelliphelliphelliphelliphelliphelliphelliphelliphelliphelliphelliphelliphellip72 Figure 341 STEM images of the catalyst before and after the in-situ XRD experimenthelliphelliphelliphelliphelliphellip73 Figure 342 The elemental mapping of the catalyst before reactionhelliphelliphelliphelliphelliphelliphelliphelliphelliphelliphelliphelliphelliphellip74 Figure 343 The elemental mapping of the catalyst after reactionhelliphelliphelliphelliphelliphelliphelliphelliphelliphelliphelliphelliphelliphelliphellip74
Chapter 4 Kinetic studies of propane oxidation to acrylic acid on a phase-pure
MoVTeNbOx catalyst Figure 421 The evolution of concentrations with the residence time at different temperatures Squares ndash experimental data dashed curves ndash fitted kinetic curves based on reaction model 1 (for modeling see section 64) Feed composition C3H8O2H2ON2=364051 vol Catalyst ID=6059helliphelliphelliphelliphelliphelliphellip80
205
Figure 422 The stability of catalytic performance in steam-free feedhelliphelliphelliphelliphelliphelliphelliphelliphelliphelliphelliphelliphelliphellip82 Figure 423 The effect of steam on the acrylic acid productivity at GHSV=4500 9000 and 18000 h-1hellip83
Figure424 The effect of temperature on the catalytic performance at 0 10 and 40 vol steam content Catalyst 6059helliphelliphelliphelliphelliphelliphelliphelliphelliphelliphelliphelliphelliphelliphelliphelliphelliphelliphelliphelliphelliphelliphelliphelliphelliphelliphelliphelliphelliphelliphelliphelliphelliphelliphelliphellip84
Figure 425 The effect of steam on the concentration profileshelliphelliphelliphelliphelliphelliphelliphelliphelliphelliphelliphelliphelliphelliphelliphelliphellip86 Figure 426 The effect of the propane concentration on the catalytic performance C3H8O2H2ON2=x640(54-x) vol T=400degC GHSV= 34280 h-1 WF=011 gsml Catalyst 6059hellip88 Figure 427 Determination of the reaction order with respect to propanehelliphelliphelliphelliphelliphelliphelliphelliphelliphelliphelliphellip90 Figure 428 The effect of the oxygen concentration on catalytic performance C3H8O2H2ON2=3y40(57-y) vol T=400degC GHSV= 4500 h-1 WF=0904 gsml catalyst 605991 Figure 429 Determination of the reaction order with respect to oxygen Cat 6059helliphelliphelliphelliphelliphelliphelliphellip92 Figure 4210 Propylene oxidation with 6902 Feed composition C3H6O2H2ON2=364051 vol Top GHSV=5000 h-1 bottom GHSV=20000 h-1 Catalyst 6902helliphelliphelliphelliphelliphelliphelliphelliphelliphelliphelliphelliphelliphelliphelliphelliphellip94 Figure 4211 The effect of H2O on propylene oxidation Feed composition C3H6O2H2ON2=36z(91-z) vol GHSV=80000 h-1 T=400degC Catalyst 690297 Figure 4212 The effect of temperature on acrolein oxidation Catalyst 6059helliphelliphelliphelliphelliphelliphelliphelliphelliphellip99
Figure 4213 CO oxidation at different temperatures space velocities in stoichiometric and oxidizing feed Catalyst 8947helliphelliphelliphelliphelliphelliphelliphelliphelliphelliphelliphelliphelliphelliphelliphelliphelliphelliphelliphelliphelliphelliphelliphelliphelliphelliphelliphelliphelliphelliphelliphelliphellip102 Figure 42 14 Space velocity variation for CO oxidation and water gas shift reactionhelliphelliphelliphelliphelliphelliphellip103 Figure 4215 Comparison of the propane propylene acrolein (top) propane CO oxidation and water gas shift activity (bottom) of the catalyst helliphelliphelliphelliphelliphelliphelliphelliphelliphelliphelliphelliphelliphelliphelliphelliphelliphelliphelliphelliphelliphelliphelliphelliphelliphellip105
Figure 431 The dilution ratios (black squares) overall space velocities (black dots) and the oxygen concentrations (empty and full blue triangles) in function of the flow rate of the added oxygenhelliphelliphelliphellip108 Figure 432 The effect of oxygen addition in the two-stage reactorhelliphelliphelliphelliphelliphelliphelliphelliphelliphelliphelliphelliphelliphellip109 Figure 433 Comparison of the catalytic performance in the single-tube reactor (STR) and two-stage reactor (TSR)helliphelliphelliphelliphelliphelliphelliphelliphelliphelliphelliphelliphelliphelliphelliphelliphelliphelliphelliphelliphelliphelliphelliphelliphelliphelliphelliphelliphelliphelliphelliphelliphelliphelliphelliphellip110 Figure 434 Addition of N2O in the two-stage reactor Conditions noted with stars - 40 vol O2 introduced in R1 reactor and 40 vol N2O in R2 reactor - 6 vol O2 introduced in R1 reactor and 00 vol N2O in R2 reactorhelliphelliphelliphelliphelliphelliphelliphelliphelliphelliphelliphelliphelliphelliphelliphelliphelliphelliphelliphelliphelliphelliphelliphelliphelliphelliphelliphelliphelliphelliphelliphellip112 Figure 435 Reactivation of the catalyst after exposing to reducing conditionshelliphelliphelliphelliphelliphelliphelliphelliphelliphellip113 Figure 436 The effect of C3H6 addition of in the two-stage reactorhelliphelliphelliphelliphelliphelliphelliphelliphelliphelliphelliphelliphelliphellip115 Figure 437 The effect of CO addition in the two-stage reactorhelliphelliphelliphelliphelliphelliphelliphelliphelliphelliphelliphelliphelliphelliphelliphellip116 Figure 438 The effect of CO2 addition in the two-stage reactorhelliphelliphelliphelliphelliphelliphelliphelliphelliphelliphelliphelliphelliphelliphellip118
Chapter 5 Post synthesis treatment of the phase-pure M1 MoVTeNbOx catalyst Figure 521 The UV-Vis spectra of the filtrate solutionshelliphelliphelliphelliphelliphelliphelliphelliphelliphelliphelliphelliphelliphelliphelliphelliphelliphellip126
Figure 531 The SEM picture of the catalysts 6902 (parent sample) 7797 (water treated sample) 7798 (H3PO4 treated sample) 7799 (TMEDA treated sample) 7800 (NaBrO3 treated sample) 8113 (N2H4 treated sample)helliphelliphelliphelliphelliphelliphelliphelliphelliphelliphelliphelliphelliphelliphelliphelliphelliphelliphelliphelliphelliphelliphelliphelliphelliphelliphelliphelliphelliphelliphelliphelliphelliphelliphellip129 Figure 532 The elemental composition of the original and the modified catalysts as probed by EDX130
533 NEXAFS spectra of the bromate treated sample( 7800) the parent sample (6902) the difference spectrum and the V5+ reference spectrumhelliphelliphelliphelliphelliphelliphelliphelliphelliphelliphelliphelliphelliphelliphelliphelliphelliphelliphelliphelliphelliphelliphelliphelliphellip131 Figure 534 Normalized surface concentrations Correlation of Te content and TeV ratio with the normalized selectivity to acrylic acid (bar-graph)helliphelliphelliphelliphelliphelliphelliphelliphelliphelliphelliphelliphelliphelliphelliphelliphelliphelliphelliphelliphelliphellip133 Figure 535 Adsorption of propane (educt of the catalytic reaction) at 313 K on fresh (dots) and used M1 (triangle) activated at 423 K under vacuumhelliphelliphelliphelliphelliphelliphelliphelliphelliphelliphelliphelliphelliphelliphelliphelliphelliphelliphelliphelliphelliphelliphelliphellip134 Figure 536 Adsorption of propylene at 313 K on fresh (dots) and used M1 (triangle) activated at 423 K under vacuumhelliphelliphelliphelliphelliphelliphelliphelliphelliphelliphelliphelliphelliphelliphelliphelliphelliphelliphelliphelliphelliphelliphelliphelliphelliphelliphelliphelliphelliphelliphelliphelliphelliphelliphelliphellip136 Figure 537 Adsorption of propane at 313 K after propylene adsorption on fresh (open dots) M1 activated at 423 K under vacuum For comparison the propane adsorption isotherm and differential heat profile if propane firstly adsorbed on the fresh M1 (dots)helliphelliphelliphelliphelliphelliphelliphelliphelliphelliphelliphelliphelliphelliphelliphelliphelliphelliphelliphelliphelliphellip138 Figure 538 Microcalorimetry on the bromate-treated phase-pure M1 catalyst (7800) before and after catalytic experimenthelliphelliphelliphelliphelliphelliphelliphelliphelliphelliphelliphelliphelliphelliphelliphelliphelliphelliphelliphelliphelliphelliphelliphelliphelliphelliphelliphelliphelliphelliphelliphelliphellip139 Figure 541 The activity of the catalystshelliphelliphelliphelliphelliphelliphelliphelliphelliphelliphelliphelliphelliphelliphelliphelliphelliphelliphelliphelliphelliphelliphelliphelliphellip141 Figure 542 The selectivity and yield of the catalystshelliphelliphelliphelliphelliphelliphelliphelliphelliphelliphelliphelliphelliphelliphelliphelliphelliphelliphelliphellip143
206
Figure 543 The apparent activation energy of propane activation over the catalystshelliphelliphelliphelliphelliphelliphellip143 Figure 544 The linear representation of the rate law with respect to propane and oxygen 6902 ndash original 7797 ndash H2O modified 7798 ndash H3PO4 modified 7799 ndash TMEDA modified 7800 ndash NaBrO3 modified 8113 ndash N2H4 modified samplehelliphelliphelliphelliphelliphelliphelliphelliphelliphelliphelliphelliphelliphelliphelliphelliphelliphelliphelliphelliphelliphelliphelliphelliphellip145 Figure 545 Plot of the experimental with calculated yC3H6 data for catalyst 6902helliphelliphelliphelliphelliphelliphelliphellip147 Figure 546 The activity of the catalysts in propane oxidation reaction 6902 ndash original 7797 ndash H2O modified 7798 ndash H3PO4 modified 7799 ndash TMEDA modified 7800 ndash NaBrO3 modified 8113 ndash N2H4 modified samplehelliphelliphelliphelliphelliphelliphelliphelliphelliphelliphelliphelliphelliphelliphelliphelliphelliphelliphelliphelliphelliphelliphelliphelliphelliphelliphelliphelliphelliphelliphelliphelliphelliphelliphellip149 Figure 547 The selectivity and yield of the catalysts in propane oxidation reaction 6902 ndash original 7797 ndash H2O modified 7798 ndash H3PO4 modified 7799 ndash TMEDA modified 7800 ndash NaBrO3 modified 8113 ndash N2H4 modified samplehelliphelliphelliphelliphelliphelliphelliphelliphelliphelliphelliphelliphelliphelliphelliphelliphelliphelliphelliphelliphelliphelliphelliphelliphelliphelliphelliphelliphellip149 Figure 548 The CO oxidation activity at different temperatures and GHSV=3000 h-1 (left) The kinetic curves of CO2 formation at 400degC (right) Conditions COO2H2ON2=36091 vol Catalysts 8947 ndash as prepared M1 MoVTeNbOx 7800 ndash NaBrO3 treated 6902 8113 ndash N2H4 treated 6902helliphelliphelliphelliphellip150
Figure 549 Kinetic curves for CO2 formation for the CO oxidation in presence of steam and for the water gas shift reactions Catalysts 6902 minus as prepared M1 MoVTeNbOx) 7800 minus NaBrO3 treated sample 8113 minus N2H4 treated samplehelliphelliphelliphelliphelliphelliphelliphelliphelliphelliphelliphelliphelliphelliphelliphelliphelliphelliphelliphelliphelliphelliphelliphelliphelliphelliphelliphelliphellip152
Chapter 6 Exploratory experiments Figure 621 Catalytic performance of different phase-pure Mo and V based oxideshelliphelliphelliphelliphelliphelliphelliphellip162
Figure 622 The activation parameters of the propane and oxygen conversion on the MoV(Te)(P)(Nb)Ox catalystshelliphelliphelliphelliphelliphelliphelliphelliphelliphelliphelliphelliphelliphelliphelliphelliphelliphelliphelliphelliphelliphelliphelliphelliphelliphelliphelliphelliphelliphelliphelliphelliphelliphelliphelliphelliphelliphellip163 Figure 631 Propylene oxidation over (Mo093V007)5O14 catalyst (1862)helliphelliphelliphelliphelliphelliphelliphelliphelliphelliphelliphellip168 Figure 641 Delplots for propane oxidation using the feed C3H8O2H2ON2=364051vol at T=400degC Catalyst ID 6059helliphelliphelliphelliphelliphelliphelliphelliphelliphelliphelliphelliphelliphelliphelliphelliphelliphelliphelliphelliphelliphelliphelliphelliphelliphelliphelliphelliphelliphelliphelliphelliphelliphellip172 Figure 642 Delplots for propane oxidation using the feed C3H8O2H2ON2=36091vol at T=400degC Catalyst ID 6059helliphelliphelliphelliphelliphelliphelliphelliphelliphelliphelliphelliphelliphelliphelliphelliphelliphelliphelliphelliphelliphelliphelliphelliphelliphelliphelliphelliphelliphelliphelliphelliphelliphellip174 Figure 643 Reaction model 1 for propane oxidationhelliphelliphelliphelliphelliphelliphelliphelliphelliphelliphelliphelliphelliphelliphelliphelliphelliphelliphelliphellip176 Figure 644 The reaction model 2helliphelliphelliphelliphelliphelliphelliphelliphelliphelliphelliphelliphelliphelliphelliphelliphelliphelliphelliphelliphelliphelliphelliphelliphelliphelliphellip177
Appendices
Appendix 51 Reaction networks of propane oxidation over the modified catalysts
Figure A511 The delplots corresponding to the propane oxidation using the H2O modified sample (7797) Feed composition C3H8O2H2ON2=364051 vol T=400degC189 Figure A512 The delplots corresponding to the propane oxidation using the NaBrO3 modified sample (7800) Feed composition C3H8O2H2ON2=364051 vol T=400degC190
Figure A513 The delplots corresponding to the propane oxidation using the hydrazine modified sample (8113) Feed composition C3H8O2H2ON2=364051 vol T=400deghelliphelliphelliphelliphelliphelliphelliphelliphelliphelliphelliphelliphellip191
Appendix 61 Modeling the delplots for a reaction pathway that contains multiple
rank product Figure A611 Reaction network containing a superposed primary and secondary rank end producthellip193 Figure A612 The delplot for B and C species corresponding to the reaction pathway depicted on Figure A611helliphelliphelliphelliphelliphelliphelliphelliphelliphelliphelliphelliphelliphelliphelliphelliphelliphelliphelliphelliphelliphelliphelliphelliphelliphelliphelliphelliphelliphelliphelliphelliphelliphelliphelliphelliphelliphellip194 Figure A613 Reaction network containing a superposed primary secondary and tertiary end product195 Figure A614 The delplots for C and D species corresponding to the parallel-consecutive reaction network depicted on Figure A613helliphelliphelliphelliphelliphelliphelliphelliphelliphelliphelliphelliphelliphelliphelliphelliphelliphelliphelliphelliphelliphelliphelliphelliphelliphelliphellip197 Figure A 631 Plot of thermal properties of the feed mixture and the catalytic properties in function of the steam contenthelliphelliphelliphelliphelliphelliphelliphelliphelliphelliphelliphelliphelliphelliphelliphelliphelliphelliphelliphelliphelliphelliphelliphelliphelliphelliphelliphelliphelliphelliphelliphelliphelliphelliphelliphellip200
207
List of tables
Chapter 1 Introduction and motivation Table 121 The characteristics of catalysts studied in [14 ]helliphelliphelliphelliphelliphelliphelliphelliphelliphelliphelliphelliphelliphelliphelliphelliphelliphellip8 Table 122 The calculated thermodynamic quantities of the supposed hydrogen atom abstraction pathways in comparison with the experimentally determined values [18]helliphelliphelliphelliphelliphelliphelliphelliphelliphelliphelliphelliphellip12 Table 123 Optimized catalytic performance of VPO HPC and MMO catalyst systems for oxidation of propane to acrylic acid as summarized based on references [2] and [4]helliphelliphelliphelliphelliphelliphelliphelliphelliphelliphelliphelliphellip13 Table 124 Catalytic effect of the individual phases of the mixture in the propane partial oxidation [2]21 Table 125 Activation energy of propane partial oxidation on different surface-promoted catalysts [36]23
Chapter 2 Experimental methods Table221 The Ψ Φ and η dimensionless numbers corresponding to propane oxidation reactionhelliphellip52 Table 222 The resolution for the peak-pairs which elute close to each otherhelliphelliphelliphelliphelliphelliphelliphelliphelliphelliphellip57 Table223 Vapor pressures of acetic- and acrylic acid at around room temperature [11]helliphelliphelliphelliphelliphellip58 Table 231 The properties of the phase-pure M1 catalysts 6059 6902 and 8947helliphelliphelliphelliphelliphelliphelliphellip62
Chapter 4 Kinetic studies of propane oxidation to acrylic acid on a phase-pure
MoVTeNbOx catalyst Table 421 The activation parameters of propane consumption at different steam contentshelliphelliphelliphelliphellip85
Table 422 The activation parameters of acrolein oxidation on 6059 catalysthelliphelliphelliphelliphelliphelliphelliphelliphelliphellip100
Table 423 The activation parameters of CO oxidation in dry feedhelliphelliphelliphelliphelliphelliphelliphelliphelliphelliphelliphelliphelliphellip102
Chapter 5 Post synthesis treatment of the phase-pure M1 MoVTeNbOx catalyst Table 531 The BET surface area of the sampleshelliphelliphelliphelliphelliphelliphelliphelliphelliphelliphelliphelliphelliphelliphelliphelliphelliphelliphelliphelliphellip127 Table 532 The lattice parameters of the catalysts before and after catalytic oxidation of propane and propylenehelliphelliphelliphelliphelliphelliphelliphelliphelliphelliphelliphelliphelliphelliphelliphelliphelliphelliphelliphelliphelliphelliphelliphelliphelliphelliphelliphelliphelliphelliphellip128 Table 533 The binding energies corresponding to every catalyst helliphelliphelliphelliphelliphelliphelliphelliphelliphelliphelliphelliphelliphellip132
Table 534 Adsorption and desorption heats corresponding to different coverageshelliphelliphelliphelliphelliphelliphelliphellip135
Table 535 The adsorption order monolayer coverage and adsorption constant of propane adsorption for the 6059 and bromate treated sample (7800) helliphelliphelliphelliphelliphelliphelliphelliphelliphelliphelliphelliphelliphelliphelliphelliphelliphelliphelliphelliphelliphellip140
Table 541 The catalytic performance of the hydrazine treated catalyst (8113) compared before and after the complete oxygen conversion experimenthelliphelliphelliphelliphelliphelliphelliphelliphelliphelliphelliphelliphelliphelliphelliphelliphelliphelliphelliphelliphelliphelliphellip142 Table 542 The apparent rate constants of propane and oxygen consumptionhelliphelliphelliphelliphelliphelliphelliphelliphelliphellip145 Table 543 The rate constants of propane and propylene consumptionhelliphelliphelliphelliphelliphelliphelliphelliphelliphelliphelliphelliphellip147 Table 544 Activation energy of CO oxidation Feed composition COO2H2ON2=36091 vol 8947 ndash as prepared M1 MoVTeNbOx 7800 ndash NaBrO3 treated 6902 8113 ndash N2H4 treated 6902helliphelliphelliphellip151
Table 545 The CO conversion at GHSV=3000 h-1 and 400degChelliphelliphelliphelliphelliphelliphelliphelliphelliphelliphelliphelliphelliphelliphelliphellip152
Table 546 Rate constants of CO2 formation at 400degChelliphelliphelliphelliphelliphelliphelliphelliphelliphelliphelliphelliphelliphelliphelliphelliphelliphelliphellip153
Chapter 6 Exploratory experiments Table 621 The used catalysts and reaction conditions Catalyst preparation methods SD ndash spray drying HT ndash hydrothermalhelliphelliphelliphelliphelliphelliphelliphelliphelliphelliphelliphelliphelliphelliphelliphelliphelliphelliphelliphelliphelliphelliphelliphelliphelliphelliphelliphelliphelliphelliphelliphelliphellip159 Table 622 Comparison of the catalytic performance of MoVTeNbOx (6059) and MoVOx (8103) samples at 400degC feed composition C3H8O2H2ON2=364051 vol helliphelliphelliphelliphelliphelliphelliphelliphelliphelliphelliphellip160
Table 623 Comparison of the performance of selected catalysts Composition as determined by (a) stoichiometry (b) ICP (c) EDX (d) LEIS-surface Preparation method slurry (Sl) hydrothermal (Ht) Solid-solid (Ss) Incipient impregnation (Ii) Spray drying (Sd) (P) ndash present workhelliphelliphelliphelliphelliphelliphellip165
Table 631 Propylene oxidation reactivity on different catalysts helliphelliphelliphelliphelliphelliphelliphelliphelliphelliphelliphelliphelliphelliphellip169
Table 641 Product ranks at different temperatures For multiple rank products the main ranks are highlighted by bold letter P-primary S-secondaryhelliphelliphelliphelliphelliphelliphelliphelliphelliphelliphelliphelliphelliphelliphelliphelliphelliphelliphelliphelliphellip173
208
Table 642 Product ranks at different steam contents For multiple rank products the main ranks are highlighted by bold letter P-primary S-secondary rankhelliphelliphelliphelliphelliphelliphelliphelliphelliphelliphelliphelliphelliphelliphelliphelliphelliphelliphellip175
Table 651 The rate constants corresponding to the steps of the reaction model 1helliphelliphelliphelliphelliphelliphelliphellip179
Table 652 The activation energy and preexponential factor of the individual reaction stepshelliphelliphelliphellip179
Table 653 The rate constants of the individual steps as determined based on model 1 and model 2hellip180
Appendices
Appendix 51 Reaction networks of propane oxidation over the modified catalysts
Table A511 Product ranks on the different catalysts P-primary S-secondaryhelliphelliphelliphelliphelliphelliphelliphelliphellip192
Appendix 63 The physical properties of the gas mixtures with different steam
contents Table A631 Physical properties of different feed mixtures Mixture 1 C3H8O2H2ON2=364051 vol Mixture 2 C3H8O2H2ON2=363061 vol Mixture 3 C3H8O2H2ON2=362071 vol Mixture 4 C3H8O2H2ON2=361081 vol Mixture 5 C3H8O2H2ON2=36091 vol199