Embed Size (px)
Citation preview

Keystone Exams: Algebra I Assessment Anchors and Eligible Content
Pennsylvania Department of Education
www.education.state.pa.us 2010
Pennsylvania Department of Education Keystone Exams: Algebra I – Page 2 Assessment Anchors and Eligible Content Final—March 1, 2010
PENNSYLVANIA DEPARTMENT OF EDUCATION
General Introduction to the Keystone Exam Assessment Anchors
Introduction Since the introduction of the Keystone Exams, the Pennsylvania Department of Education (PDE) has been working to create a set of tools designed to help educators improve instructional practices and better understand the Keystone Exams. The Assessment Anchors, as defined by the Eligible Content, are one of the many tools the Department believes will better align curriculum, instruction, and assessment practices throughout the commonwealth. Without this alignment, it will not be possible to significantly improve student achievement across the Commonwealth. How were Keystone Exam Assessment Anchors developed? Prior to the development of the Assessment Anchors, multiple groups of PA educators convened to create a set of standards for each of the Keystone Exams. Enhanced standards, derived from a review of existing standards, focused on what students need to know and be able to do in order to be college and career ready. Additionally, the Assessment Anchors and Eligible Content statements were created by other groups of educators charged with the task of clarifying the standards assessed on the Keystone Exams. The Assessment Anchors, as defined by the Eligible Content, have been designed to hold together or anchor the state assessment system and curriculum/instructional practices in schools. Assessment Anchors, as defined by the Eligible Content, were created with the following design parameters:
Clear: The Assessment Anchors are easy to read and are user friendly; they clearly detail which standards are assessed on the Keystone Exams.
Focused: The Assessment Anchors identify a core set of standards that could be reasonably assessed on a large‐scale assessment, which will keep educators from having to guess which standards are critical.
Rigorous: The Assessment Anchors support the rigor of the state standards by assessing higher‐order and reasoning skills. Manageable: The Assessment Anchors define the standards in a way that can be easily incorporated into a course to prepare students for success.
How can teachers, administrators, schools, and districts use these Assessment Anchors? The Assessment Anchors, as defined by the Eligible Content, can help focus teaching and learning because they are clear, manageable, and closely aligned with the Keystone Exams. Teachers and administrators will be better informed about which standards will be assessed. The Assessment Anchors and Eligible Content should be used along with the Standards and the Curriculum Framework of the Standards Aligned System (SAS) to build curriculum, design lessons, and support student achievement.
Pennsylvania Department of Education Keystone Exams: Algebra I – Page 3 Assessment Anchors and Eligible Content Final—March 1, 2010
The Assessment Anchors and Eligible Content are designed to enable educators to determine when they feel students are prepared to be successful in the Keystone Exams. An evaluation of current course offerings, through the lens of what is assessed on those particular Keystone Exams may provide an opportunity for an alignment to ensure student preparedness.
How are the Assessment Anchors organized? The Assessment Anchors, as defined by the Eligible Content, are organized into cohesive blueprints, each structured with a common labeling system that can be read like an outline. This framework is organized first by module, then by Assessment Anchor, followed by Anchor Descriptor, and then finally, at the greatest level of detail, by an Eligible Content statement. The common format of this outline is followed across the Keystone Exams. Here is a description of each level in the labeling system for the Keystone Exams:
Module: The Assessment Anchors are organized into two thematic modules for each of the Keystone Exams. The module title appears at the top of each page. The module level is important because the Keystone Exams are built using a module format, with each of the Keystone Exams divided into two equally‐sized test modules. Each module is made up of two or more Assessment Anchors.
Assessment Anchor: The Assessment Anchor appears in the shaded bar across the top of each Assessment Anchor table. The Assessment Anchors represent categories of subject matter that anchor the content of the Keystone Exams. Each Assessment Anchor is part of a module and has one or more Anchor Descriptors unified under it.
Anchor Descriptor: Below each Assessment Anchor is a specific Anchor Descriptor. The Anchor Descriptor level provides further details that delineate the scope of content covered by the Assessment Anchor. Each Anchor Descriptor is part of an Assessment Anchor and has one or more Eligible Content unified under it.
Eligible Content: The column to the right of the Anchor Descriptor contains the Eligible Content statements. The Eligible Content is the most specific description of the content that is assessed on the Keystone Exams. This level is considered the assessment limit and helps educators identify the range of the content covered on the Keystone Exams.
Enhanced Standard: In the column to the right of each Eligible Content statement is a code representing one or more Enhanced Standards that correlate to the Eligible Content statement. Some Eligible Content statements include annotations that indicate certain clarifications about the scope of an eligible content.
o “e.g.” (“for example”) —sample approach, but not a limit to the eligible content. o “i.e.” (“that is”) —specific limit to the eligible content. o “Note” —content exclusions or definable range of the eligible content.
What impact will the implementation of the K–12 Common Core Standards have on the content of this document? It is anticipated that there will be significant alignment between PA’s Academic Standards and the Common Core. Every effort will be made to ensure that the alignment of the standards to the Assessment Anchors and Eligible Content is maintained. As more information becomes available, PDE will inform state educators.
Standards Aligned System — http://www.pdesas.org/ Pennsylvania Department of Education — www.education.state.pa.us
Cover photo © Hill Street Studios/Harmik Nazarian/Blend Images/Corbis.
Keystone Exam: Algebra I
MODULE 1—Operations and Linear Equations & Inequalities FINAL—March 1, 2010
Pennsylvania Department of Education Keystone Exams: Algebra I – Page 4 Assessment Anchors and Eligible Content Final—March 1, 2010
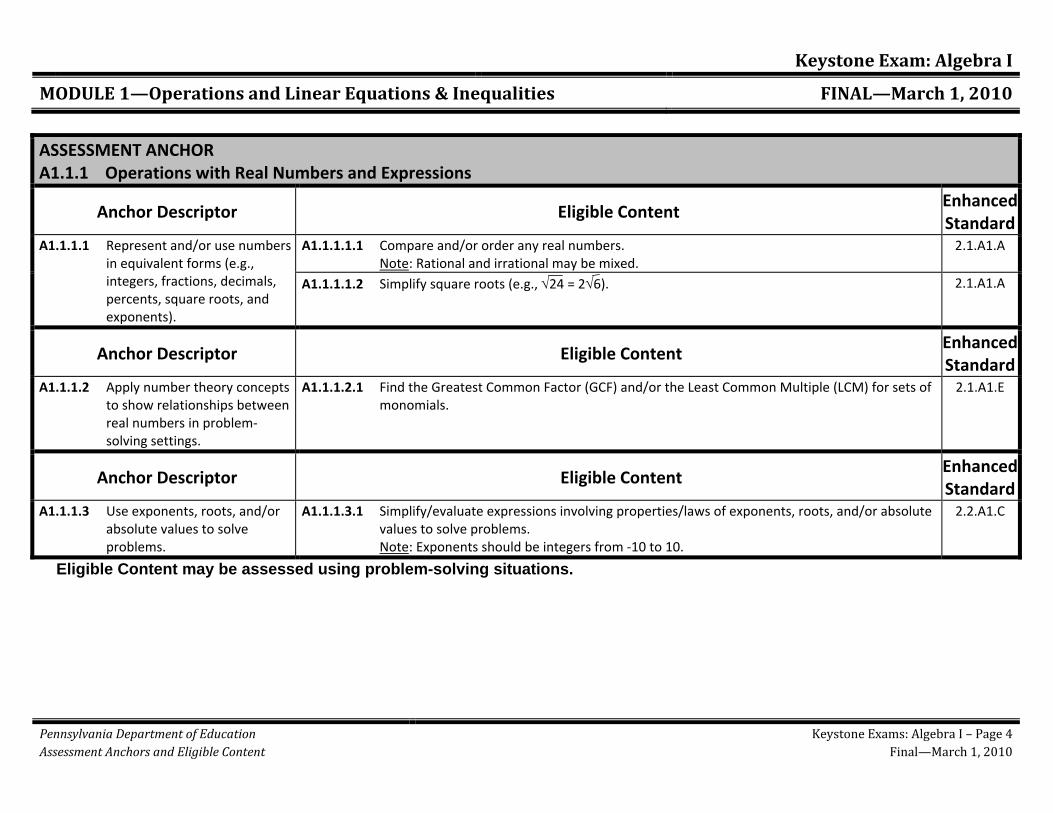
ASSESSMENT ANCHOR A1.1.1 Operations with Real Numbers and Expressions
Anchor Descriptor Eligible Content Enhanced Standard
A1.1.1.1 Represent and/or use numbers in equivalent forms (e.g., integers, fractions, decimals, percents, square roots, and exponents).
A1.1.1.1.1 Compare and/or order any real numbers. Note: Rational and irrational may be mixed.
2.1.A1.A
A1.1.1.1.2 Simplify square roots (e.g., √24 = 2√6). 2.1.A1.A
Anchor Descriptor Eligible Content Enhanced Standard
A1.1.1.2 Apply number theory concepts to show relationships between real numbers in problem‐solving settings.
A1.1.1.2.1 Find the Greatest Common Factor (GCF) and/or the Least Common Multiple (LCM) for sets of monomials.
2.1.A1.E
Anchor Descriptor Eligible Content Enhanced Standard
A1.1.1.3 Use exponents, roots, and/or absolute values to solve problems.
A1.1.1.3.1 Simplify/evaluate expressions involving properties/laws of exponents, roots, and/or absolute values to solve problems.
Note: Exponents should be integers from ‐10 to 10.
2.2.A1.C
Eligible Content may be assessed using problem-solving situations.
Keystone Exam: Algebra I
MODULE 1—Operations and Linear Equations & Inequalities FINAL—March 1, 2010
Pennsylvania Department of Education Keystone Exams: Algebra I – Page 5 Assessment Anchors and Eligible Content Final—March 1, 2010
Anchor Descriptor Eligible Content Enhanced Standard
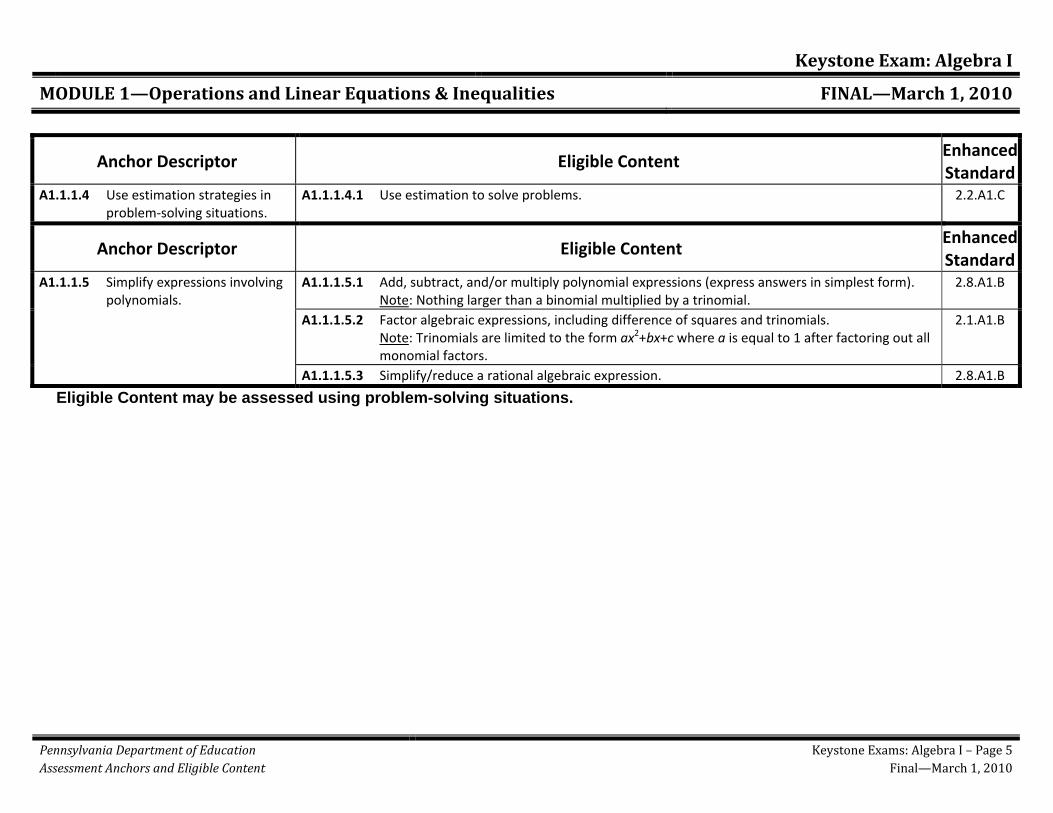
A1.1.1.4 Use estimation strategies in problem‐solving situations.
A1.1.1.4.1 Use estimation to solve problems. 2.2.A1.C
Anchor Descriptor Eligible Content Enhanced Standard
A1.1.1.5 Simplify expressions involving polynomials.
A1.1.1.5.1 Add, subtract, and/or multiply polynomial expressions (express answers in simplest form). Note: Nothing larger than a binomial multiplied by a trinomial.
2.8.A1.B
A1.1.1.5.2 Factor algebraic expressions, including difference of squares and trinomials. Note: Trinomials are limited to the form ax2+bx+c where a is equal to 1 after factoring out all
monomial factors.
2.1.A1.B
A1.1.1.5.3 Simplify/reduce a rational algebraic expression. 2.8.A1.B
Eligible Content may be assessed using problem-solving situations.
Keystone Exam: Algebra I
MODULE 1—Operations and Linear Equations & Inequalities FINAL—March 1, 2010
Pennsylvania Department of Education Keystone Exams: Algebra I – Page 6 Assessment Anchors and Eligible Content Final—March 1, 2010
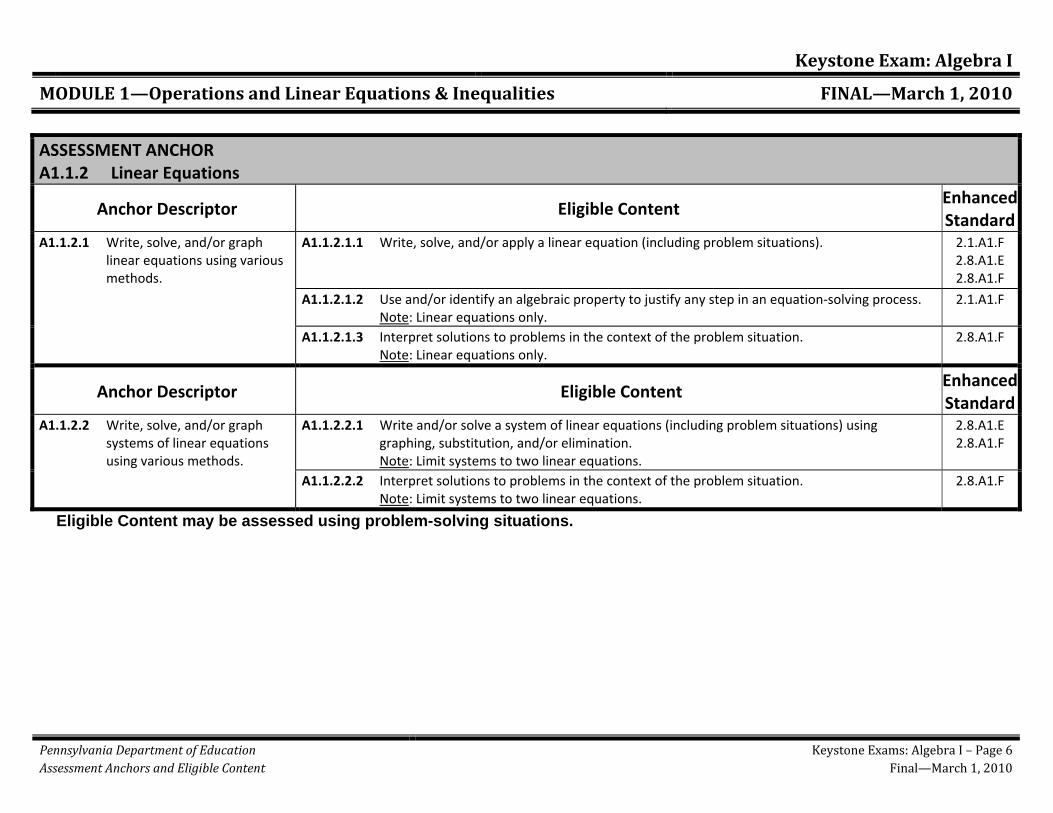
ASSESSMENT ANCHOR A1.1.2 Linear Equations
Anchor Descriptor Eligible Content Enhanced Standard
A1.1.2.1 Write, solve, and/or graph linear equations using various methods.
A1.1.2.1.1 Write, solve, and/or apply a linear equation (including problem situations). 2.1.A1.F 2.8.A1.E 2.8.A1.F
A1.1.2.1.2 Use and/or identify an algebraic property to justify any step in an equation‐solving process. Note: Linear equations only.
2.1.A1.F
A1.1.2.1.3 Interpret solutions to problems in the context of the problem situation. Note: Linear equations only.
2.8.A1.F
Anchor Descriptor Eligible Content Enhanced Standard
A1.1.2.2 Write, solve, and/or graph systems of linear equations using various methods.
A1.1.2.2.1 Write and/or solve a system of linear equations (including problem situations) using graphing, substitution, and/or elimination.
Note: Limit systems to two linear equations.
2.8.A1.E 2.8.A1.F
A1.1.2.2.2 Interpret solutions to problems in the context of the problem situation. Note: Limit systems to two linear equations.
2.8.A1.F
Eligible Content may be assessed using problem-solving situations.
Keystone Exam: Algebra I
MODULE 1—Operations and Linear Equations & Inequalities FINAL—March 1, 2010
Pennsylvania Department of Education Keystone Exams: Algebra I – Page 7 Assessment Anchors and Eligible Content Final—March 1, 2010
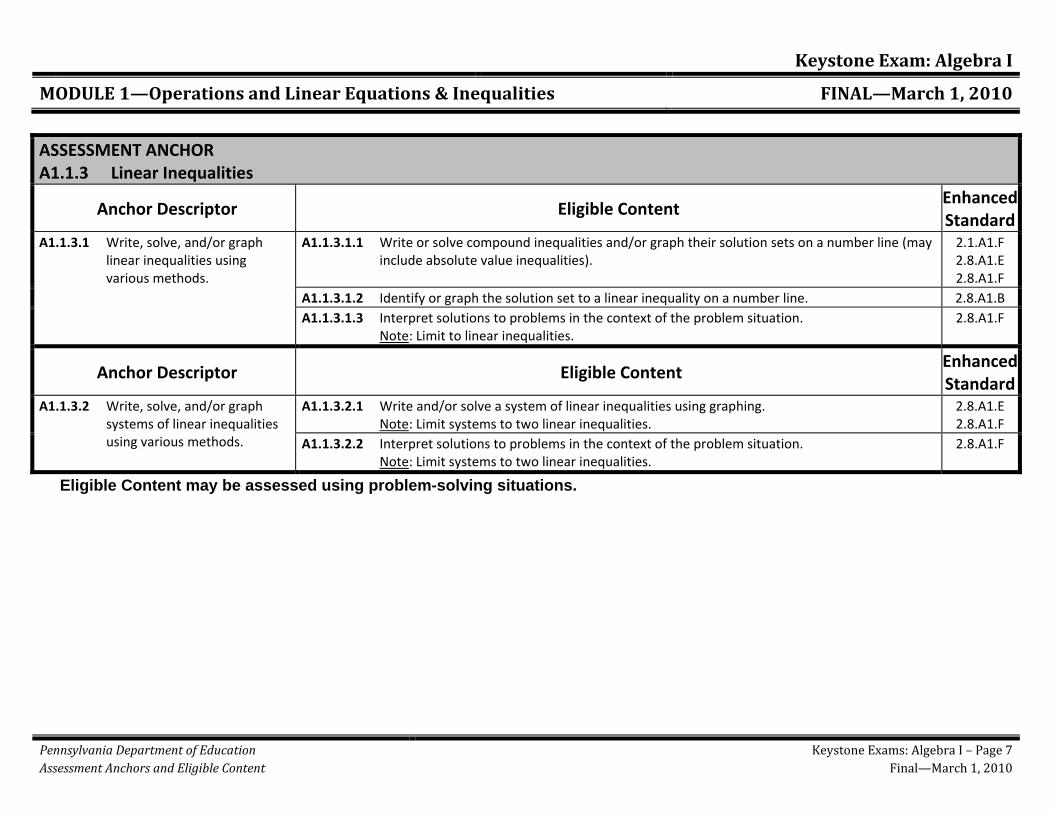
ASSESSMENT ANCHOR A1.1.3 Linear Inequalities
Anchor Descriptor Eligible Content Enhanced Standard
A1.1.3.1 Write, solve, and/or graph linear inequalities using various methods.
A1.1.3.1.1 Write or solve compound inequalities and/or graph their solution sets on a number line (may include absolute value inequalities).
2.1.A1.F 2.8.A1.E 2.8.A1.F
A1.1.3.1.2 Identify or graph the solution set to a linear inequality on a number line. 2.8.A1.B A1.1.3.1.3 Interpret solutions to problems in the context of the problem situation.
Note: Limit to linear inequalities. 2.8.A1.F
Anchor Descriptor Eligible Content Enhanced Standard
A1.1.3.2 Write, solve, and/or graph systems of linear inequalities using various methods.
A1.1.3.2.1 Write and/or solve a system of linear inequalities using graphing. Note: Limit systems to two linear inequalities.
2.8.A1.E 2.8.A1.F
A1.1.3.2.2 Interpret solutions to problems in the context of the problem situation. Note: Limit systems to two linear inequalities.
2.8.A1.F
Eligible Content may be assessed using problem-solving situations.
Keystone Exam: Algebra I
MODULE 2—Linear Functions and Data Organizations FINAL—March 1, 2010
Pennsylvania Department of Education Keystone Exams: Algebra I – Page 8 Assessment Anchors and Eligible Content Final—March 1, 2010
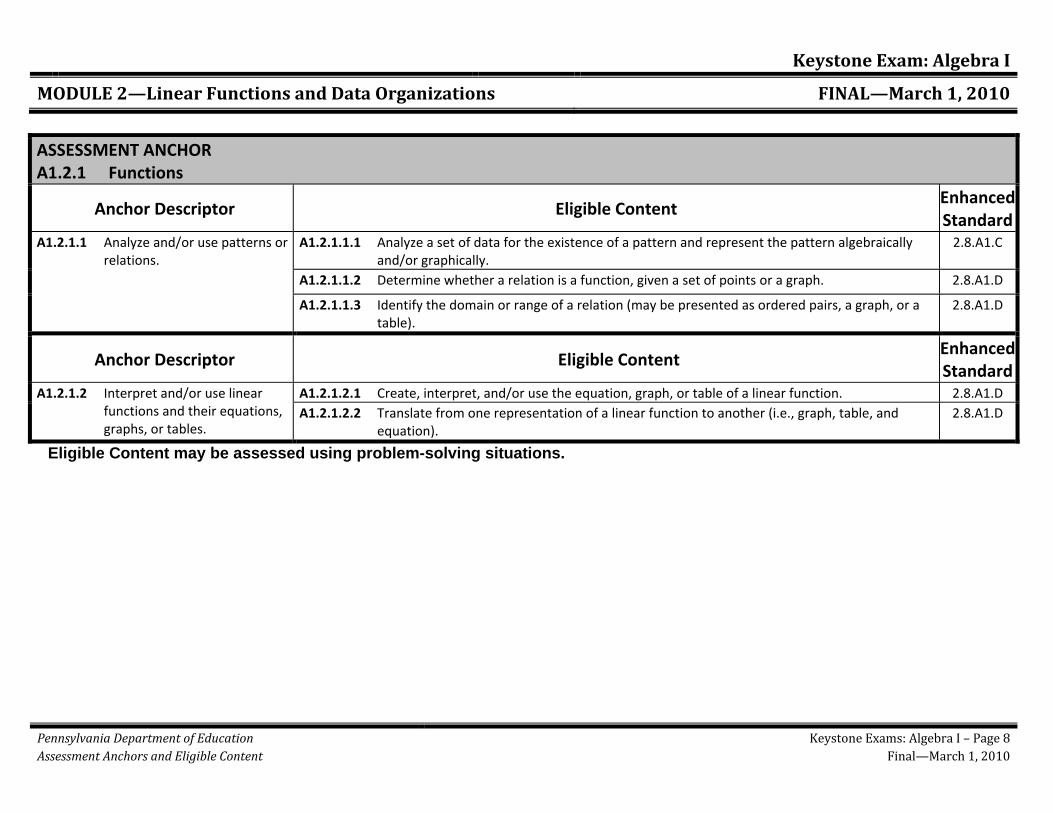
ASSESSMENT ANCHOR A1.2.1 Functions
Anchor Descriptor Eligible Content Enhanced Standard
A1.2.1.1 Analyze and/or use patterns or relations.
A1.2.1.1.1 Analyze a set of data for the existence of a pattern and represent the pattern algebraically and/or graphically.
2.8.A1.C
A1.2.1.1.2 Determine whether a relation is a function, given a set of points or a graph. 2.8.A1.D
A1.2.1.1.3 Identify the domain or range of a relation (may be presented as ordered pairs, a graph, or a table).
2.8.A1.D
Anchor Descriptor Eligible Content Enhanced Standard
A1.2.1.2 Interpret and/or use linear functions and their equations, graphs, or tables.
A1.2.1.2.1 Create, interpret, and/or use the equation, graph, or table of a linear function. 2.8.A1.D A1.2.1.2.2 Translate from one representation of a linear function to another (i.e., graph, table, and
equation). 2.8.A1.D
Eligible Content may be assessed using problem-solving situations.
Keystone Exam: Algebra I
MODULE 2—Linear Functions and Data Organizations FINAL—March 1, 2010
Pennsylvania Department of Education Keystone Exams: Algebra I – Page 9 Assessment Anchors and Eligible Content Final—March 1, 2010
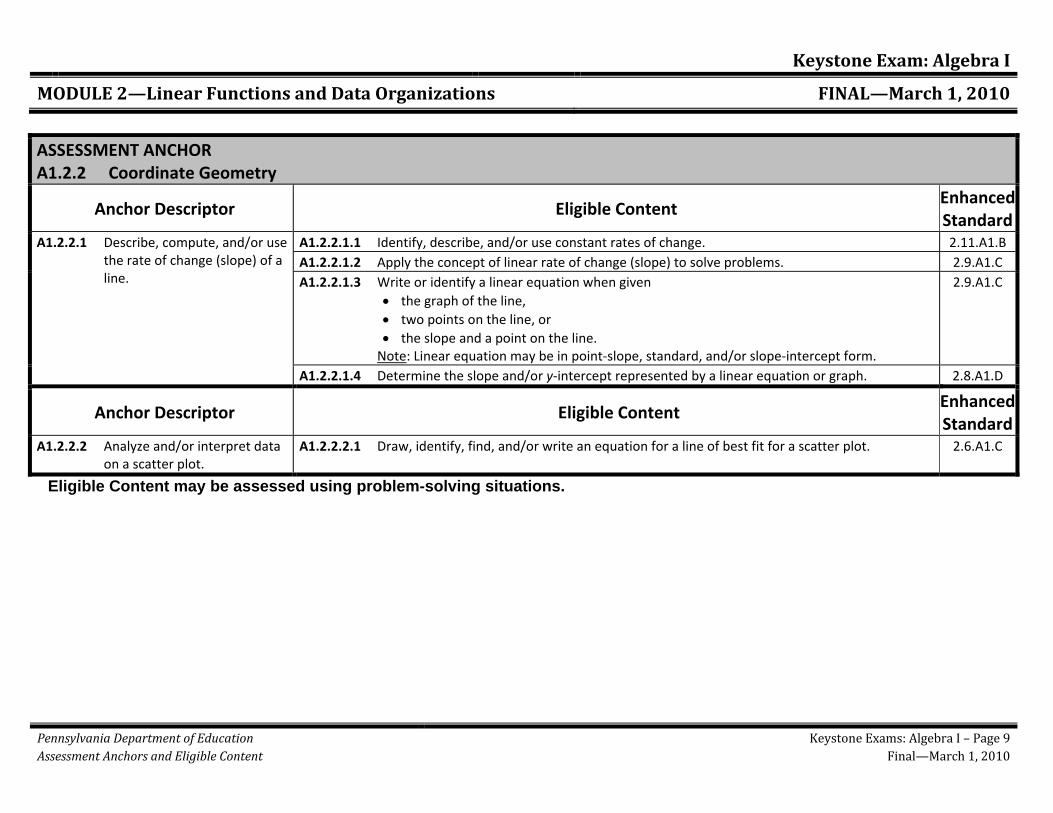
ASSESSMENT ANCHOR A1.2.2 Coordinate Geometry
Anchor Descriptor Eligible Content Enhanced Standard
A1.2.2.1 Describe, compute, and/or use the rate of change (slope) of a line.
A1.2.2.1.1 Identify, describe, and/or use constant rates of change. 2.11.A1.B A1.2.2.1.2 Apply the concept of linear rate of change (slope) to solve problems. 2.9.A1.C A1.2.2.1.3 Write or identify a linear equation when given
• the graph of the line, • two points on the line, or • the slope and a point on the line.
Note: Linear equation may be in point‐slope, standard, and/or slope‐intercept form.
2.9.A1.C
A1.2.2.1.4 Determine the slope and/or y‐intercept represented by a linear equation or graph. 2.8.A1.D
Anchor Descriptor Eligible Content Enhanced Standard
A1.2.2.2 Analyze and/or interpret data on a scatter plot.
A1.2.2.2.1 Draw, identify, find, and/or write an equation for a line of best fit for a scatter plot. 2.6.A1.C
Eligible Content may be assessed using problem-solving situations.
Keystone Exam: Algebra I
MODULE 2—Linear Functions and Data Organizations FINAL—March 1, 2010
Pennsylvania Department of Education Keystone Exams: Algebra I – Page 10 Assessment Anchors and Eligible Content Final—March 1, 2010
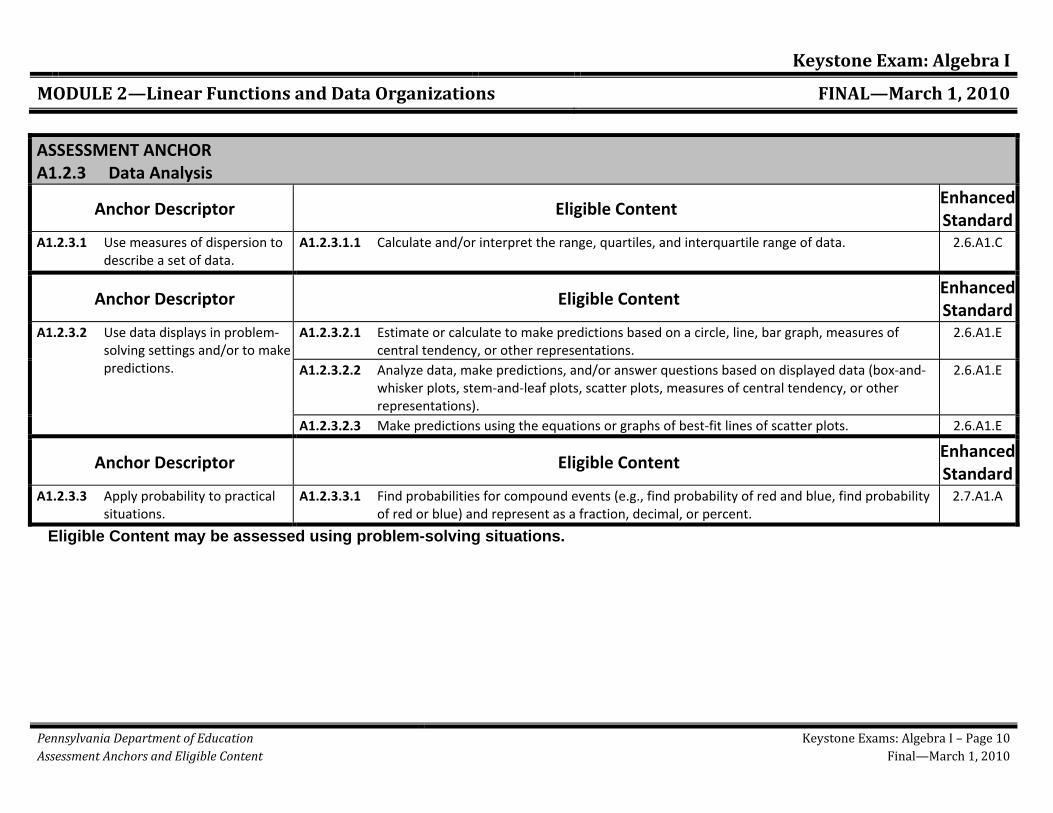
ASSESSMENT ANCHOR A1.2.3 Data Analysis
Anchor Descriptor Eligible Content Enhanced Standard
A1.2.3.1 Use measures of dispersion to describe a set of data.
A1.2.3.1.1 Calculate and/or interpret the range, quartiles, and interquartile range of data. 2.6.A1.C
Anchor Descriptor Eligible Content Enhanced Standard
A1.2.3.2 Use data displays in problem‐solving settings and/or to make predictions.
A1.2.3.2.1 Estimate or calculate to make predictions based on a circle, line, bar graph, measures of central tendency, or other representations.
2.6.A1.E
A1.2.3.2.2 Analyze data, make predictions, and/or answer questions based on displayed data (box‐and‐whisker plots, stem‐and‐leaf plots, scatter plots, measures of central tendency, or other representations).
2.6.A1.E
A1.2.3.2.3 Make predictions using the equations or graphs of best‐fit lines of scatter plots. 2.6.A1.E
Anchor Descriptor Eligible Content Enhanced Standard
A1.2.3.3 Apply probability to practical situations.
A1.2.3.3.1 Find probabilities for compound events (e.g., find probability of red and blue, find probability of red or blue) and represent as a fraction, decimal, or percent.
2.7.A1.A
Eligible Content may be assessed using problem-solving situations.

Algebra I
Item and Scoring Sampler
2011
Pennsylvania Keystone Algebra I Item Sampler 2011 2
KEYSTONE
ALGEBRA I
SAMPLER
Table of Contents
I. INFORMATION ABOUT ALGEBRA I
INTRODUCTION ............................................................................................................................. 3
ABOUT THE KEYSTONE EXAMS ........................................................................................................ 3
ALIGNMENT ................................................................................................................................... 3
KEYSTONE EXAM FORMAT ............................................................................................................... 4
GENERAL DESCRIPTION OF SCORING GUIDELINES FOR ALGEBRA I ...................................................... 5
FORMULA SHEET ............................................................................................................................ 6
II. MODULE 1
MULTIPLE-CHOICE QUESTIONS ....................................................................................................... 7
CONSTRUCTED-RESPONSE QUESTIONS ............................................................................................ 16
III. MODULE 2
MULTIPLE-CHOICE QUESTIONS ....................................................................................................... 56
CONSTRUCTED-RESPONSE QUESTIONS ............................................................................................ 66
Pennsylvania Keystone Algebra I Item Sampler 2011 3
ALGEBRA IKEYSTONE
ALGEBRA I
SAMPLER
Information About Algebra I
INTRODUCTION
The Pennsylvania Department of Educati on (PDE) provides districts and schools with tools to assist in delivering focused instructi onal programs aligned to the state assessment system. These tools include assessment anchor documents, assessment handbooks, and content-based item and scoring samplers. This 2011 Algebra I Item and Scoring Sampler is a useful tool for Pennsylvania educators in the preparati on of local instructi onal programs and in preparing students for the Keystone Exams.
This Item and Scoring Sampler contains multi ple-choice questi ons and constructed-response questi ons that are aligned to the Keystone Assessment Anchors and Eligible Content. They provide examples of the types of questi ons that will appear on the operati onal Spring 2011 Keystone Exams. Each questi on has been through a rigorous review process to ensure alignment with the Assessment Anchors and Eligible Content.
The questi ons in this sampler may be used as examples for creati ng assessment questi ons at the classroom level, and they may also be copied and used as part of a local instructi onal program.1 Classroom teachers may fi nd it benefi cial to have students respond to the constructed-response questi ons in this sampler. Educators can then use the sampler as a guide to score the responses either independently or together with colleagues within a school or district.
ABOUT THE KEYSTONE EXAMS
The Keystone Exams are end-of-course assessments designed to assess profi ciency in various subject areas, including Algebra I, Alge bra II, Biology, Chemistry, Civics and Government, English Compositi on, Geometry, Literature, U.S. History, and World History. The Keystone Exams are just one component of Pennsylvania’s high school graduati on requirements. Students must also earn state-specifi ed credits, fulfi ll the state’s service-learning and att endance requirements, and complete any additi onal local school system requirements to receive a Pennsylvania high school diploma.
For detailed informati on about how the Keystone Exams are being integrated into the Pennsylvania graduati on require ments, please contact the Pennsylvania Department of Educa ti on or visit the PDE Web site atwww.pdesas.org.
ALIGNMENT
The Algebra I Keystone Exam consists of exam questi ons arranged into two modules: Operati ons and Linear Equati ons & Inequaliti es and Linear Functi ons and Data Organizati ons. Each module corresponds to specifi c content aligned to statements and specifi cati ons included in the course-specifi c assessment anchor documents. The Algebra I content included in the Keystone Algebra I multi ple-choice questi ons will align with the Assessment Anchors as defi ned by the Eligible Content statements. The process skills, directi ves, and acti on statements will also specifi cally align with the Assessment Anchors as defi ned by the Eligible Content statements.
The content included in Algebra I constructed-response questi ons aligns with content included in the Eligible Content statements. The process skills, directi ves, and acti on statements included in the performance demands of the Algebra I constructed-response questi ons align with specifi cati ons included in the Assessment Anchor statements, the Anchor Descriptor statements, and/or the Eligible Content statements. In other words, the verbs or acti on statements used in the constructed-response questi ons or stems can come from the Eligible Content, Anchor Descriptor, or Assessment Anchor statements.
1 The permission to copy and/or use these materials does not extend to commercial purposes.
Pennsylvania Keystone Algebra I Item Sampler 2011 4
KEYSTONE
ALGEBRA I
SAMPLER
Information About Algebra I
KEYSTONE EXAM FORMAT
The Algebra I Keystone Exam includes questi ons that require students to select the best answer from four possible answer opti ons. Students read each questi on and record their answers in the space provided. The correct answer for each multi ple-choice questi on is worth one point.
The Algebra I Keystone Exam also includes questi ons that require students to write responses. Students read the questi on and write their responses in the spaces provided. Each constructed-response questi on is designed to take about ten minutes to complete. During an actual exam administrati on, students are given additi onal ti me as necessary to complete the exam. Each constructed-response questi on in Algebra I is scored using an item-specifi c scoring guideline based on a 0–4 point scale. In this sampler, each item-specifi c scoring guideline is combined with sample student responses representi ng each score point to form a practi cal, item-specifi c scoring guide.
The sampler also includes the General Descripti on of Scoring Guidelines for Algebra I used to develop the item-specifi c scoring guidelines. These general guidelines should be used if any additi onal item-specifi c scoring guidelines are created for use within local instructi onal programs.
Pennsylvania Keystone Algebra I Item Sampler 2011 5
ALGEBRA IKEYSTONE
ALGEBRA I
SAMPLER
Information About Algebra I
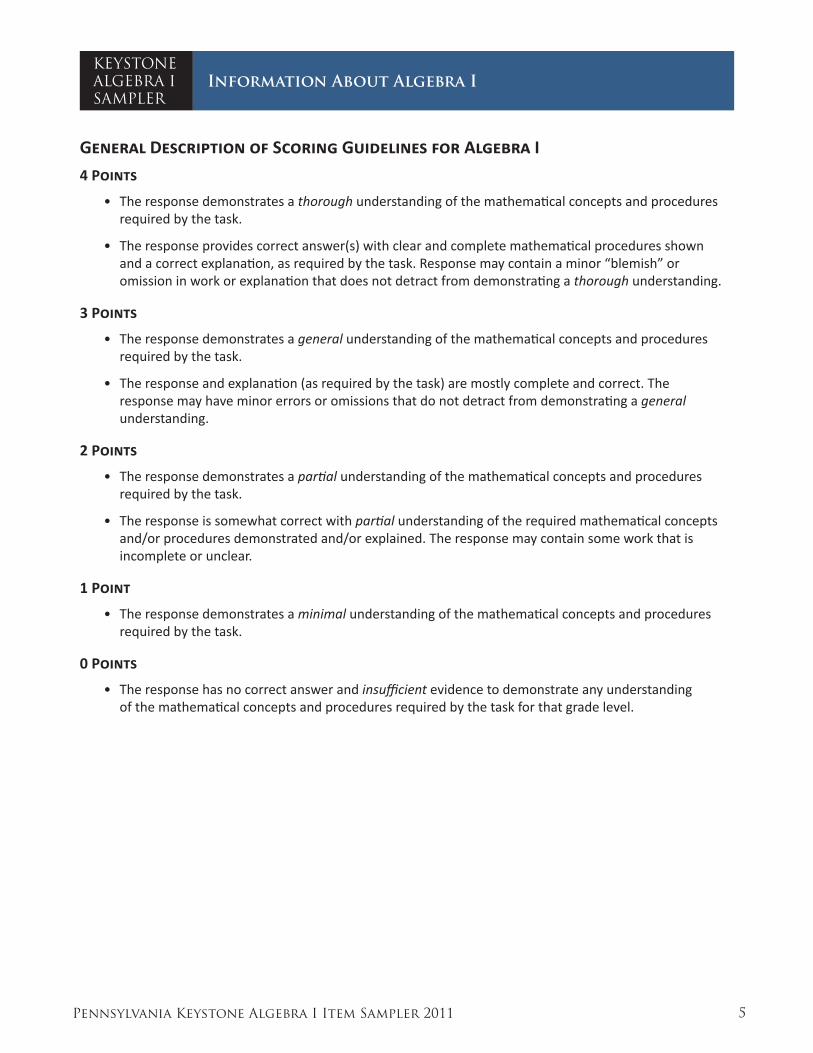
GENERAL DESCRIPTION OF SCORING GUIDELINES FOR ALGEBRA I
4 POINTS
• The response demonstrates a thorough understanding of the mathemati cal concepts and procedures required by the task.
• The response provides correct answer(s) with clear and complete mathemati cal procedures shown and a correct explanati on, as required by the task. Response may contain a minor “blemish” or omission in work or explanati on that does not detract from demonstrati ng a thorough understanding.
3 POINTS
• The response demonstrates a general understanding of the mathemati cal concepts and procedures required by the task.
• The response and explanati on (as required by the task) are mostly complete and correct. The response may have minor errors or omissions that do not detract from demonstrati ng a general understanding.
2 POINTS
• The response demonstrates a parti al understanding of the mathemati cal concepts and procedures required by the task.
• The response is somewhat correct with parti al understanding of the required mathemati cal concepts and/or procedures demonstrated and/or explained. The response may contain some work that is incomplete or unclear.
1 POINT
• The response demonstrates a minimal understanding of the mathemati cal concepts and procedures required by the task.
0 POINTS
• The response has no correct answer and insuffi cient evidence to demonstrate any understanding of the mathemati cal concepts and procedures required by the task for that grade level.
Pennsylvania Keystone Algebra I Item Sampler 2011 6
KEYSTONE
ALGEBRA I
SAMPLER
Information About Algebra I
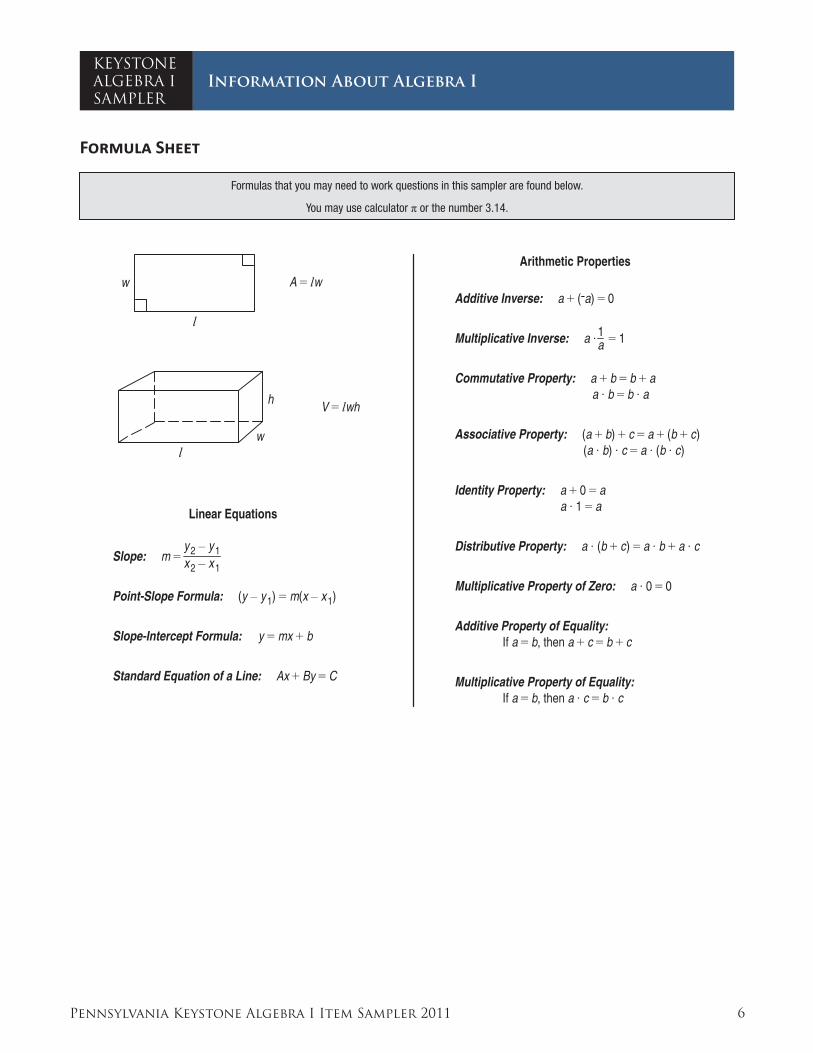
FORMULA SHEET
Formulas that you may need to work questions in this sampler are found below.
You may use calculator π or the number 3.14.
A = lw
l
w
V = lwh
lw
h
Arithmetic Properties
Additive Inverse: a + (ˉa) = 0
Multiplicative Inverse: a · = 1
Commutative Property: a + b = b + a a · b = b · a
Associative Property: (a + b) + c = a + (b + c) (a · b) · c = a · (b · c)
Identity Property: a + 0 = a a · 1 = a
Distributive Property: a · (b + c) = a · b + a · c
Multiplicative Property of Zero: a · 0 = 0
Additive Property of Equality: If a = b, then a + c = b + c
Multiplicative Property of Equality: If a = b, then a · c = b · c
1a
Linear Equations
Slope: m =
Point-Slope Formula: (y – y 1) = m(x – x 1)
Slope-Intercept Formula: y = mx + b
Standard Equation of a Line: Ax + By = C
y 2 – y 1x 2 – x 1
Pennsylvania Keystone Algebra I Item Sampler 2011 7
ALGEBRA I MODULE 1
MULTIPLE-CHOICE QUESTIONS
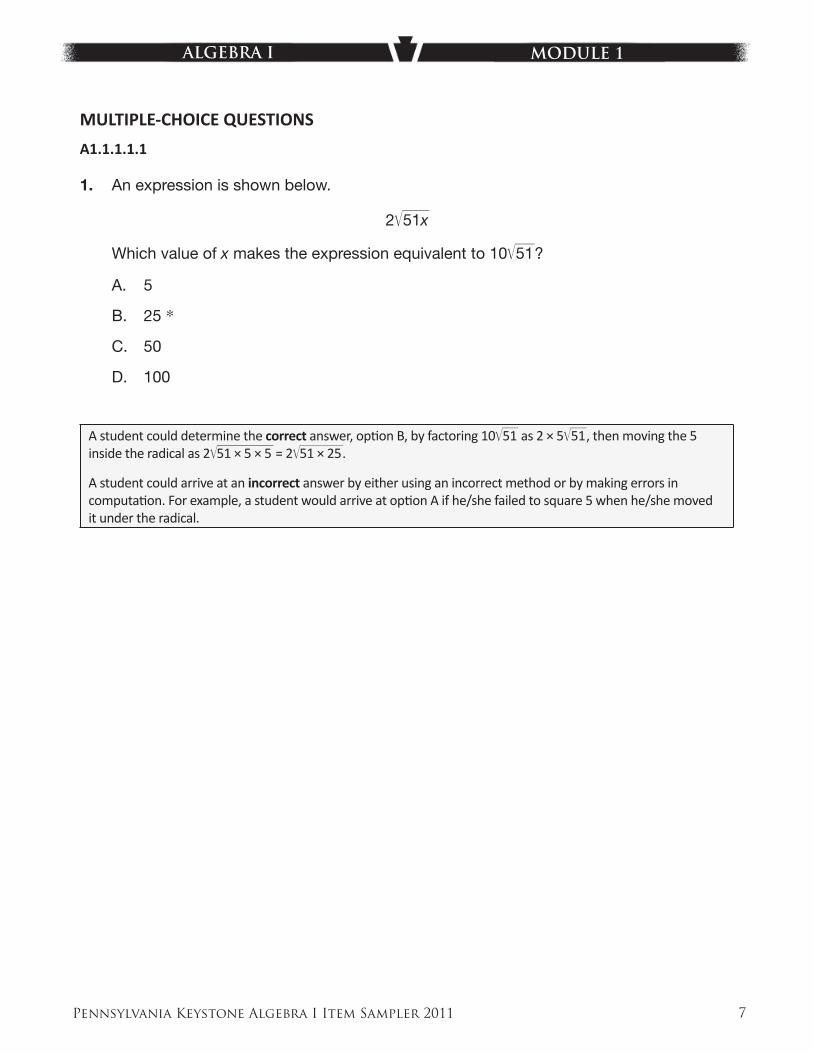
A1.1.1.1.1
1. An expression is shown below.
2 Ï}
51x
Which value of x makes the expression equivalent to 10 Ï}
51 ?
A. 5
B. 25 *
C. 50
D. 100
629542
A student could determine the correct answer, opti on B, by factoring 10 Ï}
51 as 2 × 5 Ï}
51 , then moving the 5 inside the radical as 2 Ï
} 51 × 5 × 5 = 2 Ï
} 51 × 25 .
A student could arrive at an incorrect answer by either using an incorrect method or by making errors in computati on. For example, a student would arrive at opti on A if he/she failed to square 5 when he/she moved it under the radical.
Pennsylvania Keystone Algebra I Item Sampler 2011 8
ALGEBRA I MODULE 1
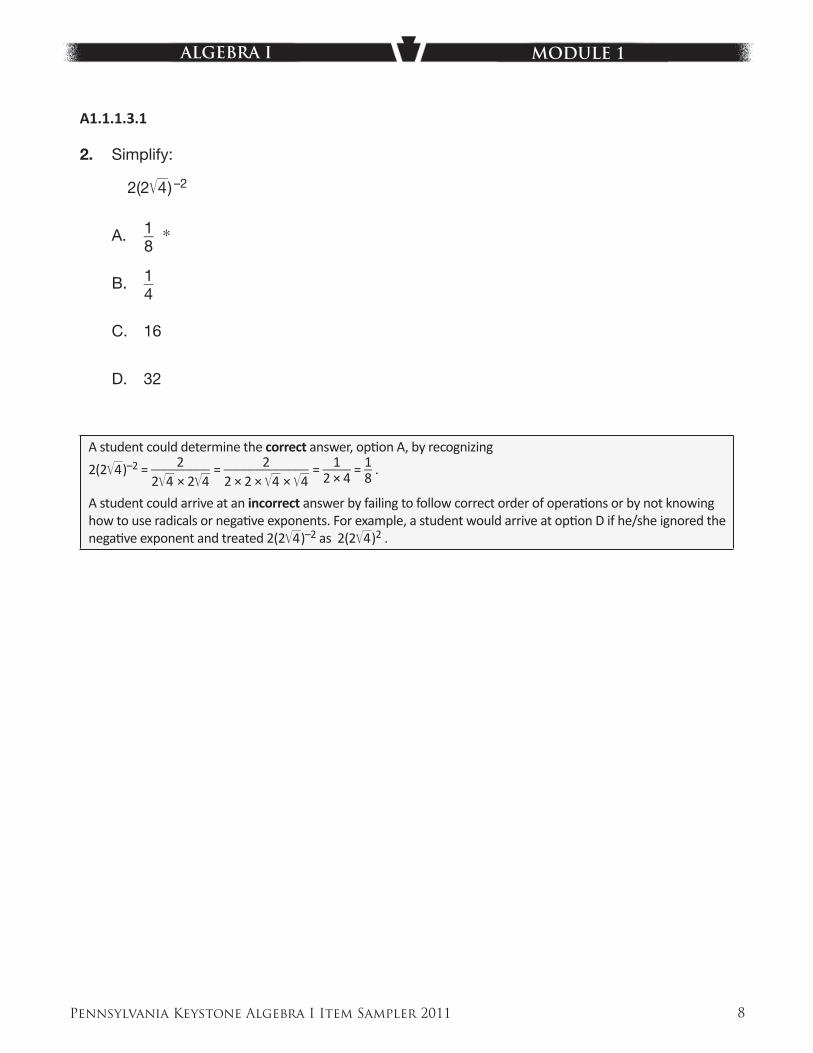
A1.1.1.3.1
2. Simplify:
2(2 Ï}
4 ) –2
A. 1 __ 8 *
B. 1 __ 4
C. 16
D. 32
629546
A student could determine the correct answer, opti on A, by recognizing
2(2 Ï}
4 )–2 = 2 _________ 2 Ï
} 4 × 2 Ï
} 4 = 2 _____________
2 × 2 × Ï}
4 × Ï}
4 = 1 _____
2 × 4 = 1 __
8 .
A student could arrive at an incorrect answer by failing to follow correct order of operati ons or by not knowing how to use radicals or negati ve exponents. For example, a student would arrive at opti on D if he/she ignored the negati ve exponent and treated 2(2 Ï
} 4 )–2 as 2(2 Ï
} 4 )2 .
Pennsylvania Keystone Algebra I Item Sampler 2011 9
ALGEBRA I MODULE 1
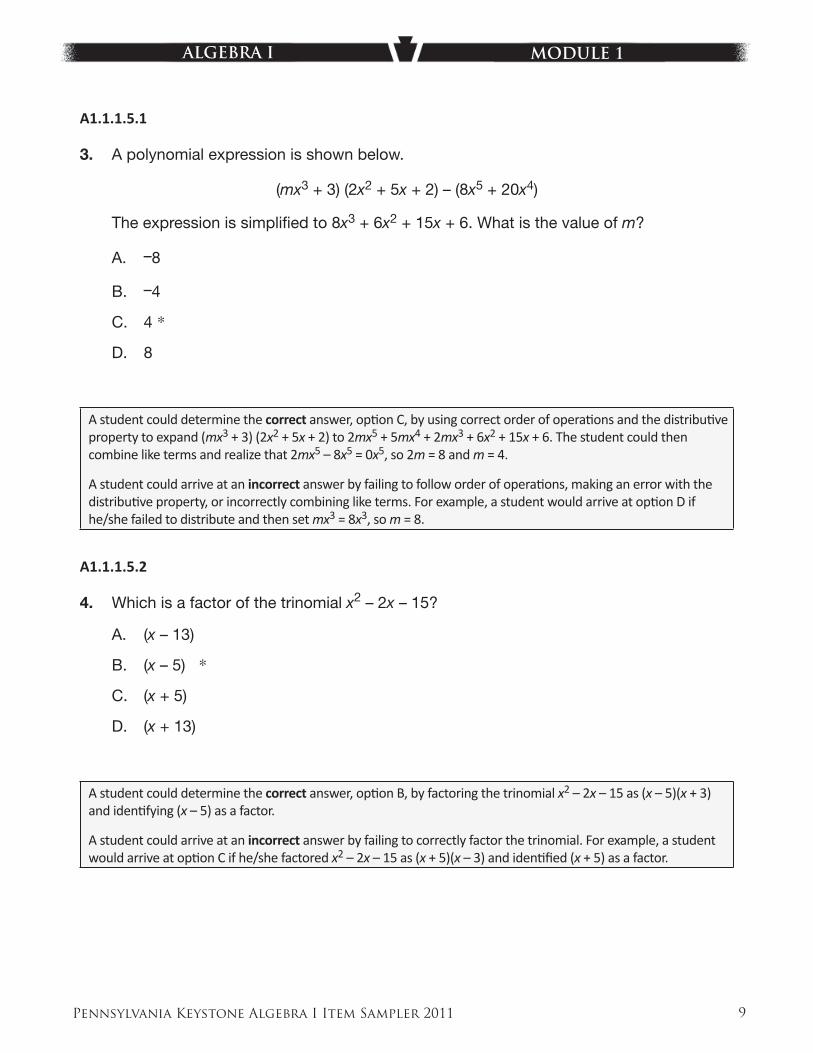
A1.1.1.5.1
3. A polynomial expression is shown below.
(mx3 + 3) (2x2 + 5x + 2) – (8x5 + 20x4)
The expression is simplifi ed to 8x3 + 6x2 + 15x + 6. What is the value of m?
A. –8
B. –4
C. 4 *
D. 8
630048
A student could determine the correct answer, opti on C, by using correct order of operati ons and the distributi ve property to expand (mx3 + 3) (2x2 + 5x + 2) to 2mx5 + 5mx4 + 2mx3 + 6x2 + 15x + 6. The student could then combine like terms and realize that 2mx5 – 8x5 = 0x5, so 2m = 8 and m = 4.
A student could arrive at an incorrect answer by failing to follow order of operati ons, making an error with the distributi ve property, or incorrectly combining like terms. For example, a student would arrive at opti on D if he/she failed to distribute and then set mx3 = 8x3, so m = 8.
A1.1.1.5.2
4. Which is a factor of the trinomial x2 – 2x – 15?
A. (x – 13)
B. (x – 5) *
C. (x + 5)
D. (x + 13)
632306
A student could determine the correct answer, opti on B, by factoring the trinomial x2 – 2x – 15 as (x – 5)(x + 3) and identi fying (x – 5) as a factor.
A student could arrive at an incorrect answer by failing to correctly factor the trinomial. For example, a student would arrive at opti on C if he/she factored x2 – 2x – 15 as (x + 5)(x – 3) and identi fi ed (x + 5) as a factor.
Pennsylvania Keystone Algebra I Item Sampler 2011 10
ALGEBRA I MODULE 1
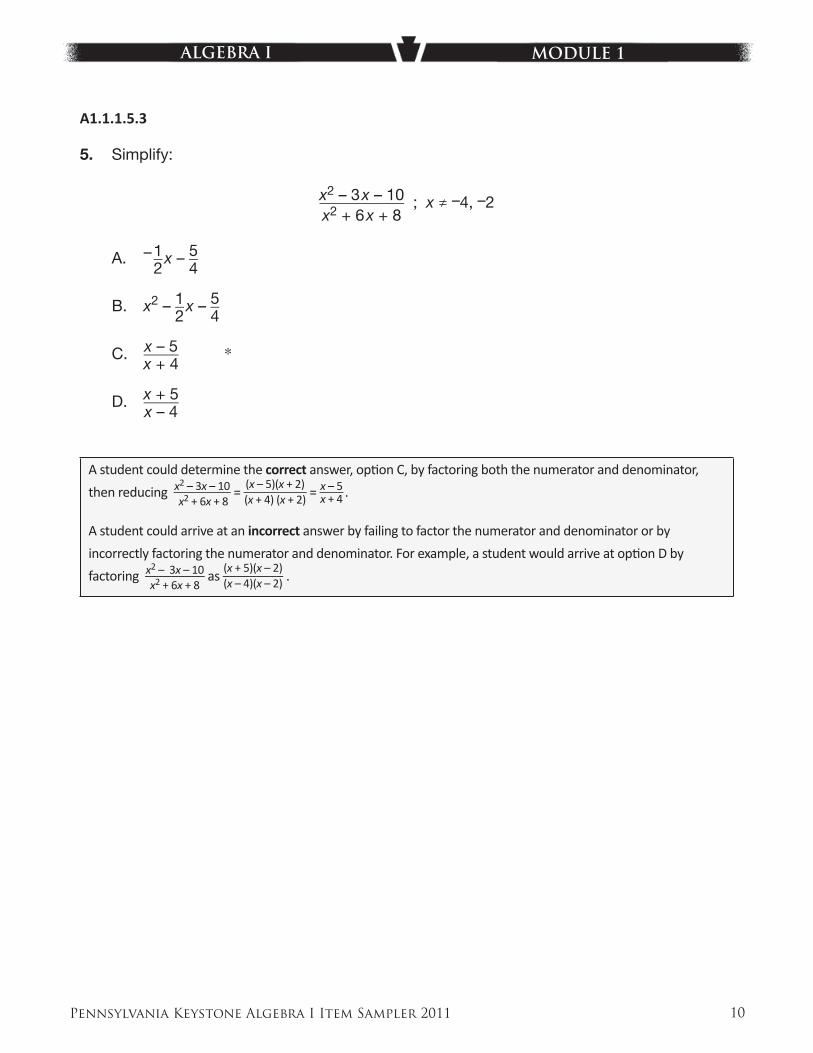
A1.1.1.5.3
5. Simplify:
x2 – 3 x – 10 }}
x2 + 6 x + 8 ; x ≠ –4, –2
A. – 1 } 2 x – 5 }
4
B. x2 – 1 } 2 x – 5 }
4
C. x – 5 } x + 4
*
D. x + 5 } x – 4
632307
A student could determine the correct answer, opti on C, by factoring both the numerator and denominator,
then reducing x2 – 3x – 10 _________
x2 + 6x + 8 =
(x – 5)(x + 2) _________ (x + 4) (x + 2) = x – 5 ____ x + 4 .
A student could arrive at an incorrect answer by failing to factor the numerator and denominator or by
incorrectly factoring the numerator and denominator. For example, a student would arrive at opti on D by
factoring x2 – 3x – 10 _________ x2 + 6x + 8
as (x + 5)(x – 2)
_________ (x – 4)(x – 2) .
Pennsylvania Keystone Algebra I Item Sampler 2011 11
ALGEBRA I MODULE 1
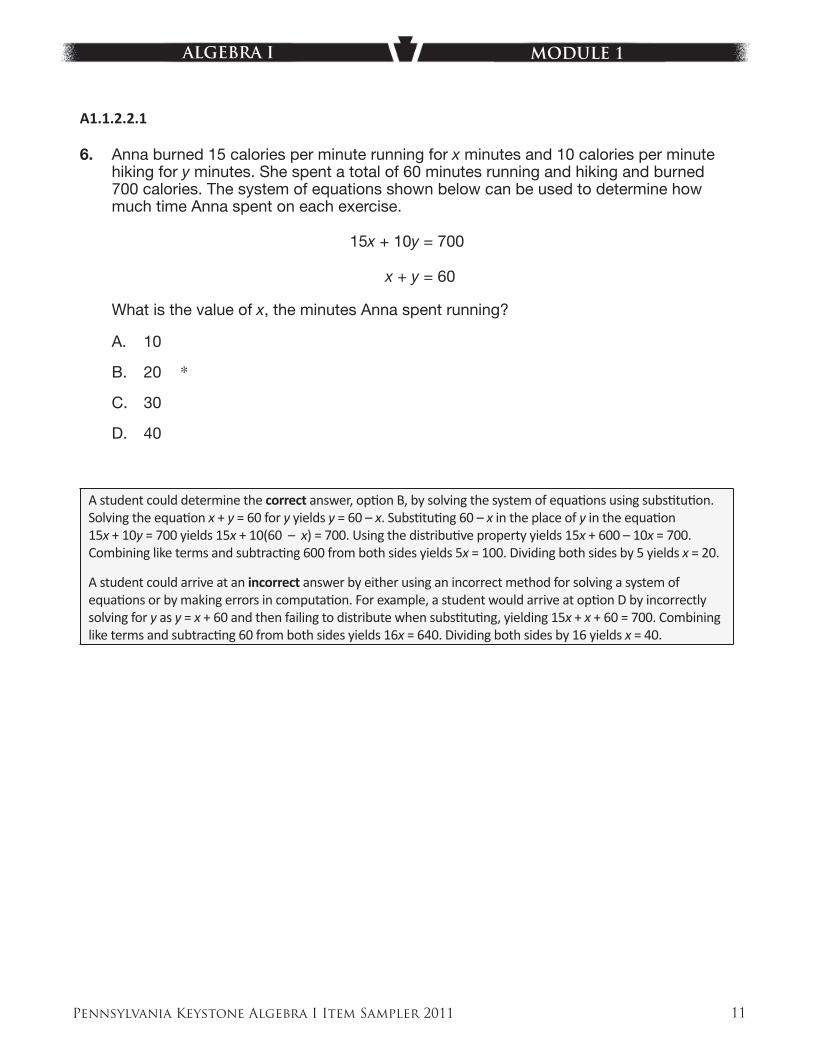
A1.1.2.2.1
6. Anna burned 15 calories per minute running for x minutes and 10 calories per minute hiking for y minutes. She spent a total of 60 minutes running and hiking and burned 700 calories. The system of equations shown below can be used to determine how much time Anna spent on each exercise.
15x + 10y = 700
x + y = 60
What is the value of x, the minutes Anna spent running?
A. 10
B. 20 *
C. 30
D. 40
632311
A student could determine the correct answer, opti on B, by solving the system of equati ons using substi tuti on. Solving the equati on x + y = 60 for y yields y = 60 – x. Substi tuti ng 60 – x in the place of y in the equati on 15x + 10y = 700 yields 15x + 10(60 – x) = 700. Using the distributi ve property yields 15x + 600 – 10x = 700. Combining like terms and subtracti ng 600 from both sides yields 5x = 100. Dividing both sides by 5 yields x = 20.
A student could arrive at an incorrect answer by either using an incorrect method for solving a system of equati ons or by making errors in computati on. For example, a student would arrive at opti on D by incorrectly solving for y as y = x + 60 and then failing to distribute when substi tuti ng, yielding 15x + x + 60 = 700. Combining like terms and subtracti ng 60 from both sides yields 16x = 640. Dividing both sides by 16 yields x = 40.
Pennsylvania Keystone Algebra I Item Sampler 2011 12
ALGEBRA I MODULE 1
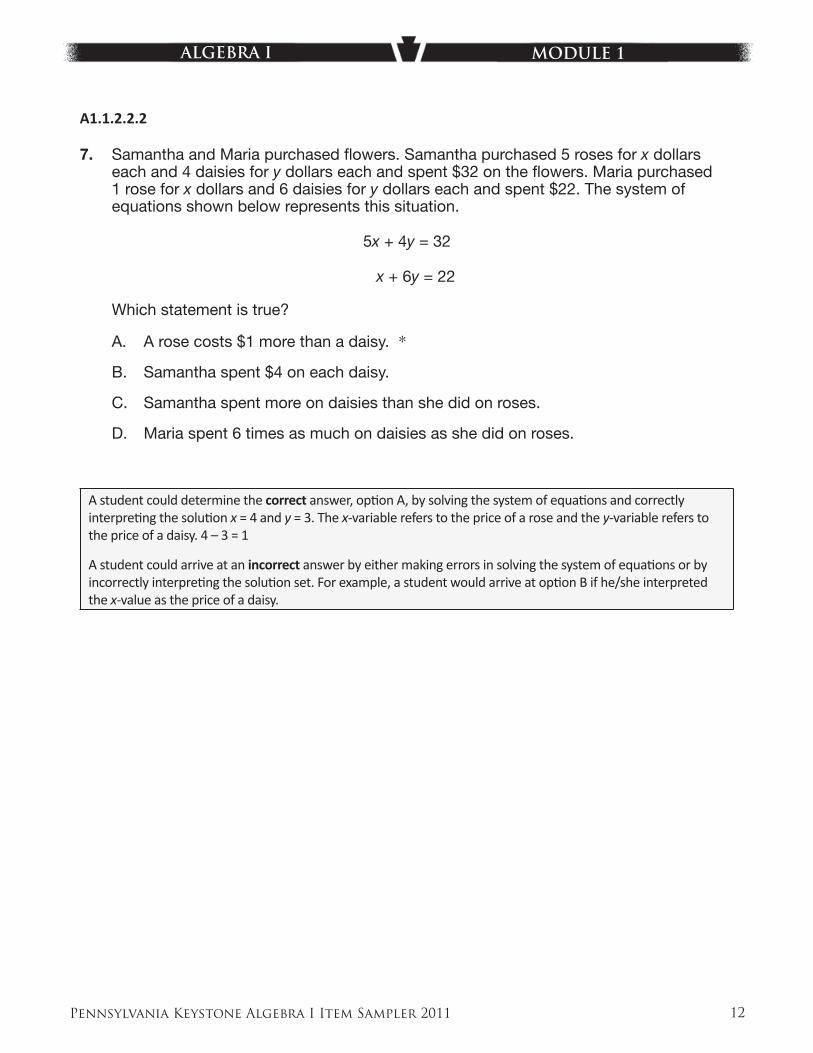
A1.1.2.2.2
7. Samantha and Maria purchased fl owers. Samantha purchased 5 roses for x dollars each and 4 daisies for y dollars each and spent $32 on the fl owers. Maria purchased 1 rose for x dollars and 6 daisies for y dollars each and spent $22. The system of equations shown below represents this situation.
5x + 4y = 32
x + 6y = 22
Which statement is true?
A. A rose costs $1 more than a daisy. *
B. Samantha spent $4 on each daisy.
C. Samantha spent more on daisies than she did on roses.
D. Maria spent 6 times as much on daisies as she did on roses.
A student could determine the correct answer, opti on A, by solving the system of equati ons and correctly interpreti ng the soluti on x = 4 and y = 3. The x-variable refers to the price of a rose and the y-variable refers to the price of a daisy. 4 – 3 = 1
A student could arrive at an incorrect answer by either making errors in solving the system of equati ons or byincorrectly interpreti ng the soluti on set. For example, a student would arrive at opti on B if he/she interpreted the x-value as the price of a daisy.
Pennsylvania Keystone Algebra I Item Sampler 2011 13
ALGEBRA I MODULE 1
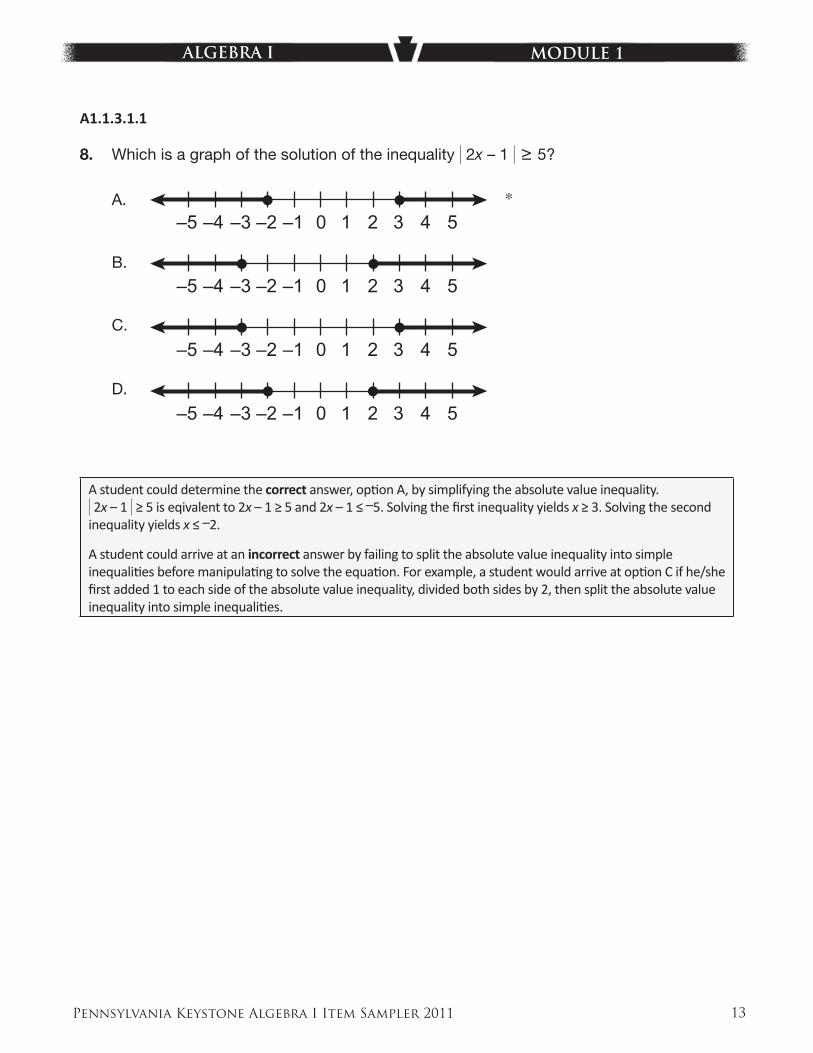
A1.1.3.1.1
8. Which is a graph of the solution of the inequality ) 2x – 1 ) ≥ 5?
A.
B.
C.
D.
4–5 –2 –1 0 1 2 3 5–4 –3
4–5 –2 –1 0 1 2 3 5–4 –3
4–5 –2 –1 0 1 2 3 5–4 –3
4–5 –2 –1 0 1 2 3 5–4 –3
640351
A student could determine the correct answer, opti on A, by simplifying the absolute value inequality. ) 2x – 1 ) ≥ 5 is eqivalent to 2x – 1 ≥ 5 and 2x – 1 ≤ –5. Solving the fi rst inequality yields x ≥ 3. Solving the second inequality yields x ≤ –2.
A student could arrive at an incorrect answer by failing to split the absolute value inequality into simple inequaliti es before manipulati ng to solve the equati on. For example, a student would arrive at opti on C if he/she fi rst added 1 to each side of the absolute value inequality, divided both sides by 2, then split the absolute value inequality into simple inequaliti es.
*
Pennsylvania Keystone Algebra I Item Sampler 2011 14
ALGEBRA I MODULE 1
A1.1.3.1.3
9. A baseball team had $1,000 to spend on supplies. The team spent $185 on a new bat. New baseballs cost $4 each. The inequality 185 + 4b ≤ 1,000 can be used to determine the number of new baseballs (b) that the team can purchase. Which statement about the number of new baseballs that can be purchased is true?
A. The team can purchase 204 new baseballs.
B. The minimum number of new baseballs that can be purchased is 185.
C. The maximum number of new baseballs that can be purchased is 185.
D. The team can purchase 185 new baseballs, but this number is neither the maximum nor the minimum. *
631099
A student could determine the correct answer, opti on D, by solving the inequality and interpreti ng the soluti on b ≤ 203.75. The variable b represents the number of baseballs that can be purchased. It is a true statement that 185 ≤ 203.75.
A student could arrive at an incorrect answer by either making errors in solving the system of equati ons or by incorrectly interpreti ng the soluti on set. For example, a student would arrive at opti on A if he/she switched the sign of the inequality when dividing by 4.
Pennsylvania Keystone Algebra I Item Sampler 2011 15
ALGEBRA I MODULE 1
A1.1.3.2.2
10. Tyreke always leaves a tip of between 8% and 20% for the server when he pays for his dinner. This can be represented by the system of inequalities shown below, where y is the amount of tip and x is the cost of dinner.
y > 0.08x
y < 0.2x
Which of the following is a true statement?
A. When the cost of dinner, x, is $10 the amount of tip, y, must be between $2 and $8.
B. When the cost of dinner, x, is $15 the amount of tip, y, must be between $1.20 and $3.00. *
C. When the tip, y, is $3, the cost of dinner, x, must be between $11 and $23.
D. When the tip, y, is $2.40, the cost of dinner, x, must be between $3 and $6.
631101
A student could determine the correct answer, opti on B, by interpreti ng the system of inequaliti es in the context of the problem situati on. When 15 is substi tuted for the x-variable, y > 0.08(15) or y > 1.2 and y < 0.2(15) or y < 3.
A student could arrive at an incorrect answer by either making errors in computati on or in interpretati on of the system of inequaliti es. For example, a student would arrive at opti on A if he/she incorrectly calculated 0.08(10) as 8 and switched the signs of both inequaliti es.
Pennsylvania Keystone Algebra I Item Sampler 2011 16
ALGEBRA I MODULE 1
CONSTRUCTED-RESPONSE QUESTIONS
A1.1.1
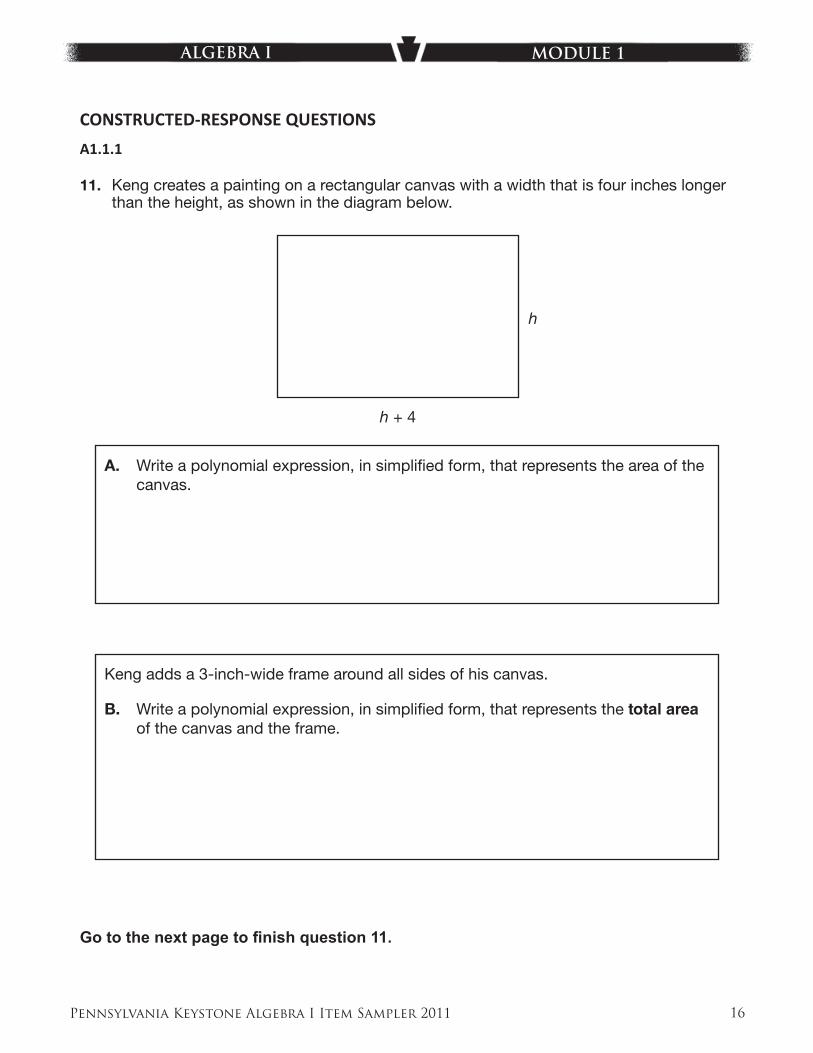
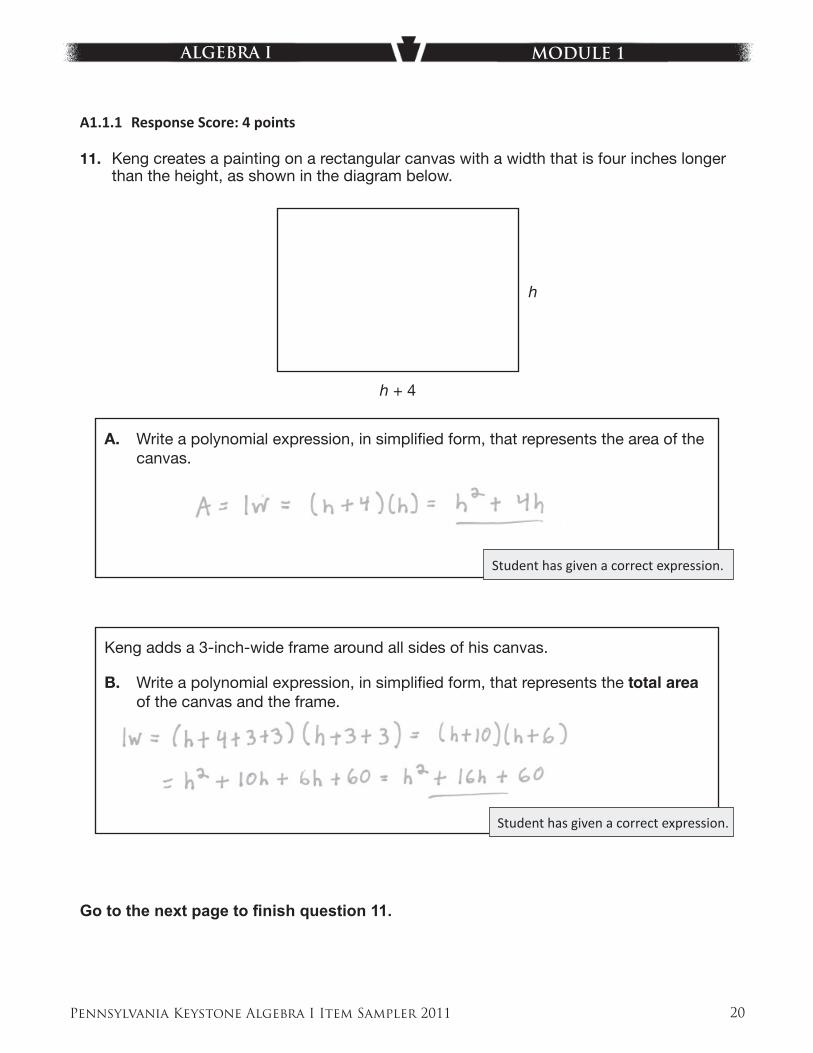
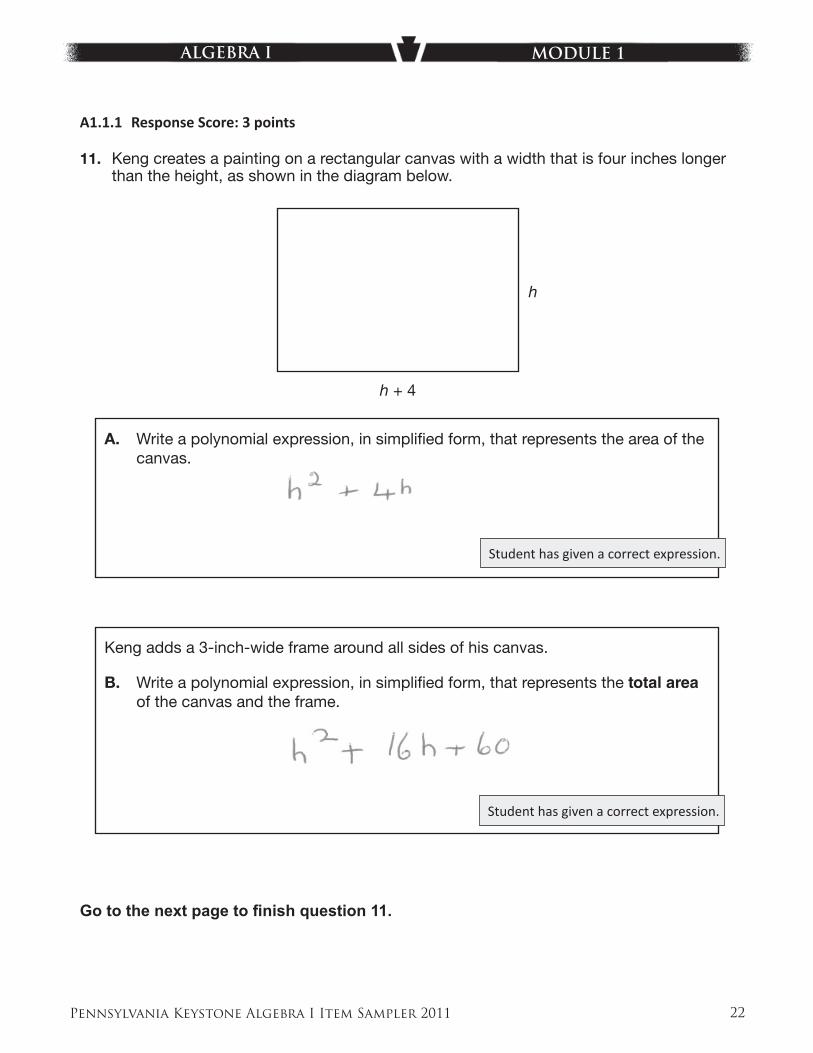
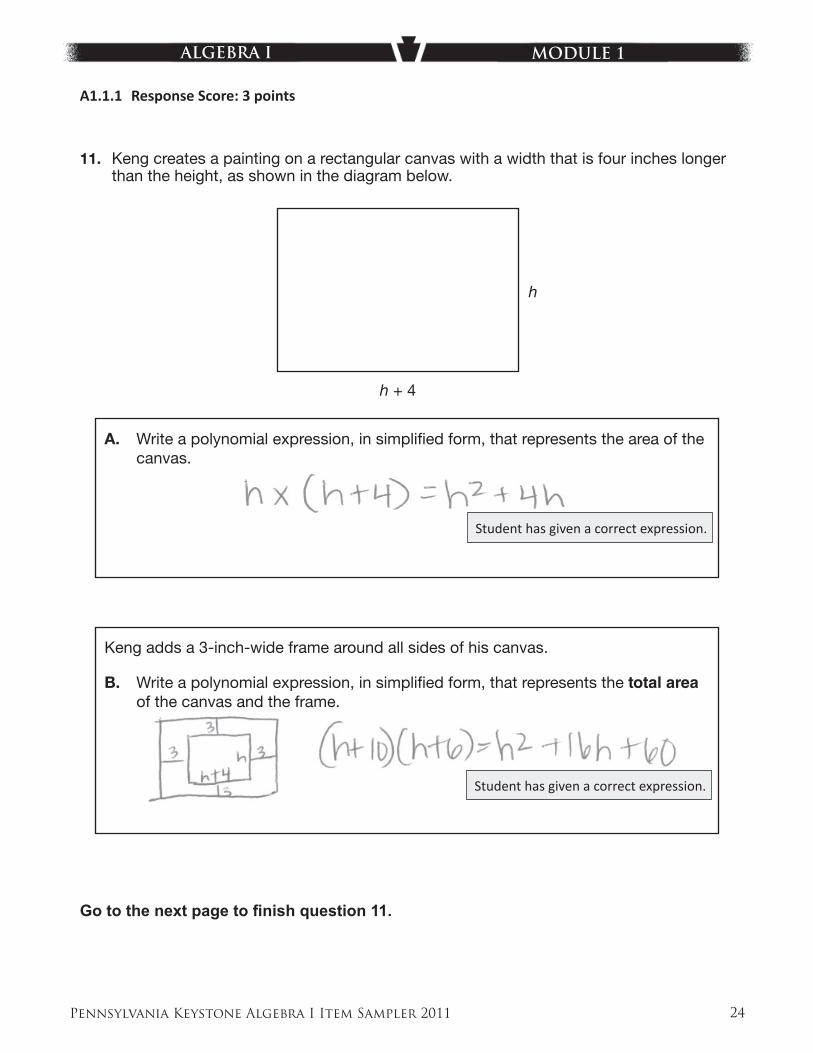
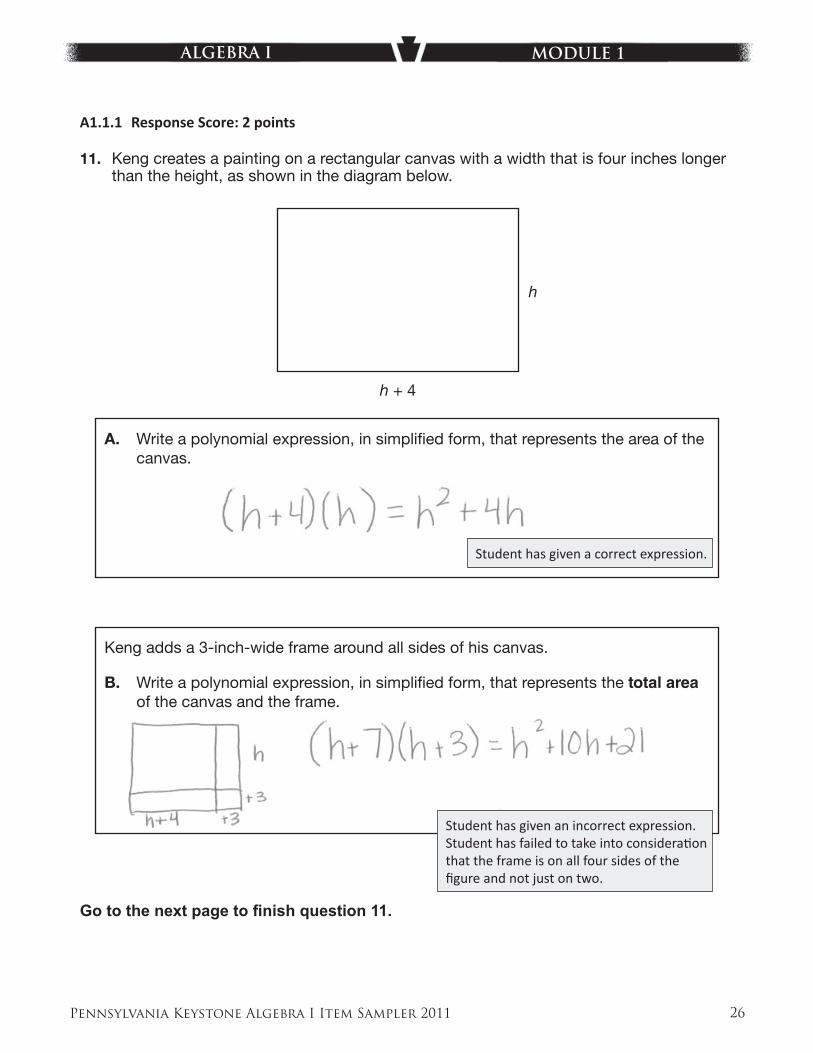
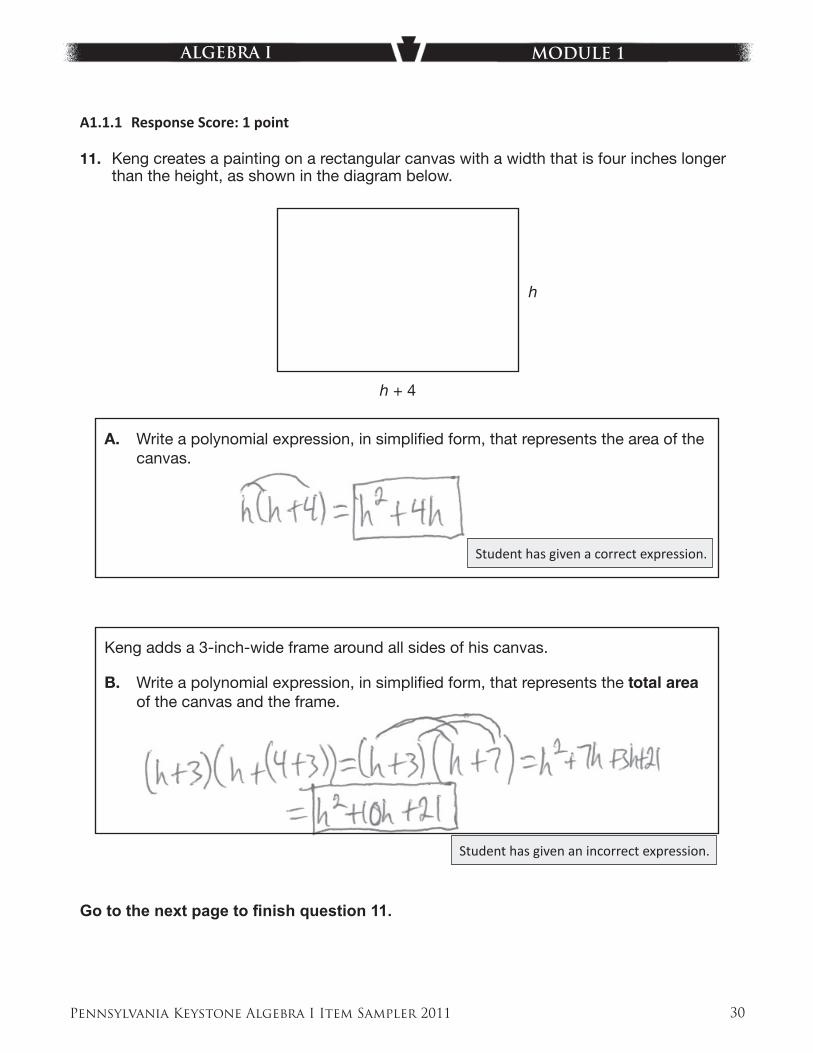
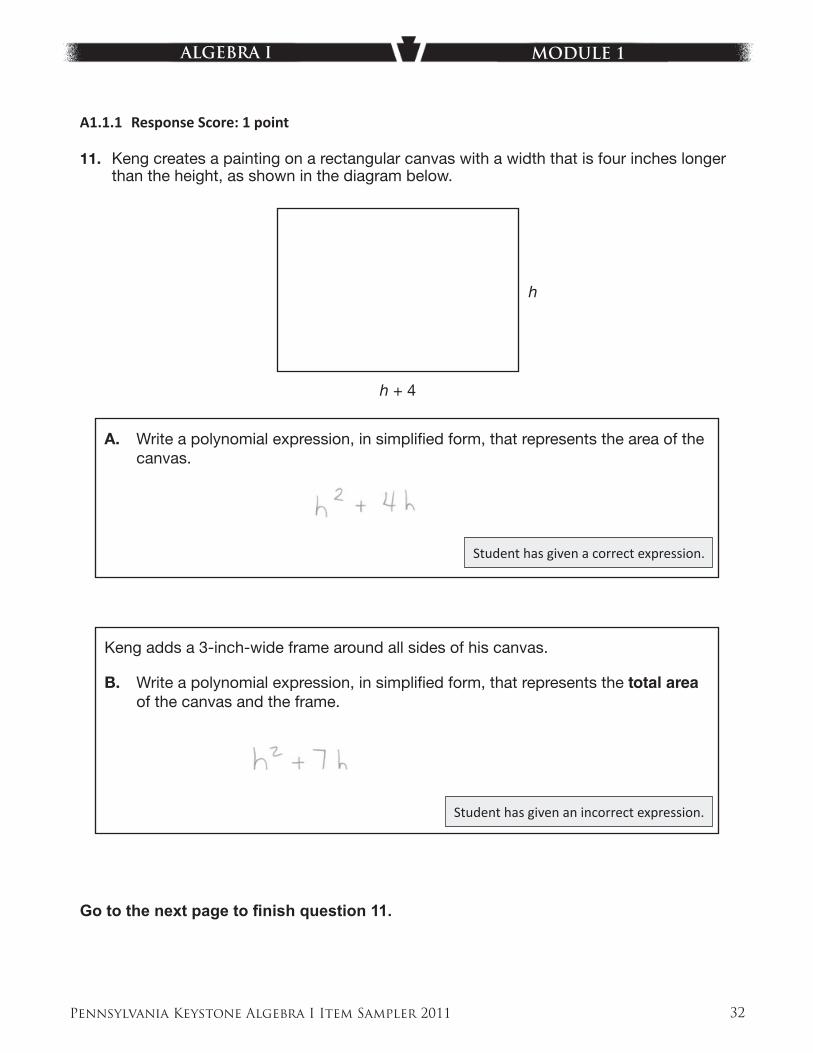
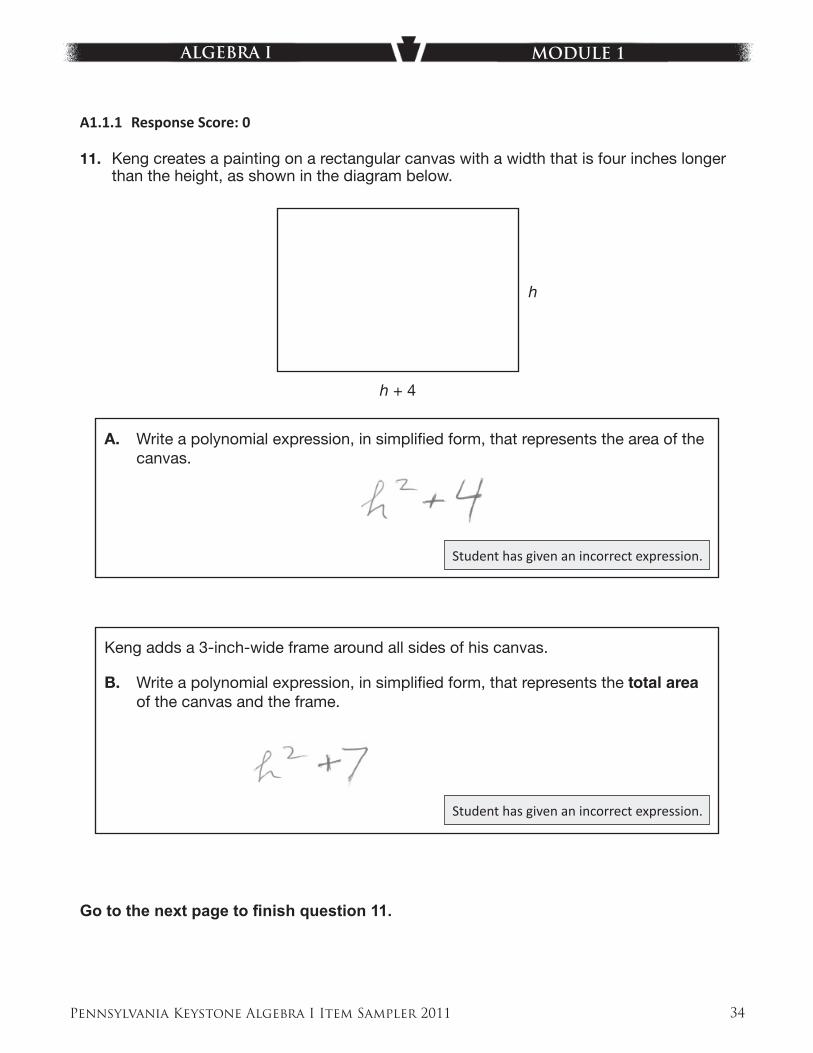
11. Keng creates a painting on a rectangular canvas with a width that is four inches longer than the height, as shown in the diagram below.
h
h + 4
A. Write a polynomial expression, in simplifi ed form, that represents the area of the canvas.
Keng adds a 3-inch-wide frame around all sides of his canvas.
B. Write a polynomial expression, in simplifi ed form, that represents the total area of the canvas and the frame.
Go to the next page to fi nish question 11.
Pennsylvania Keystone Algebra I Item Sampler 2011 17
ALGEBRA I MODULE 1
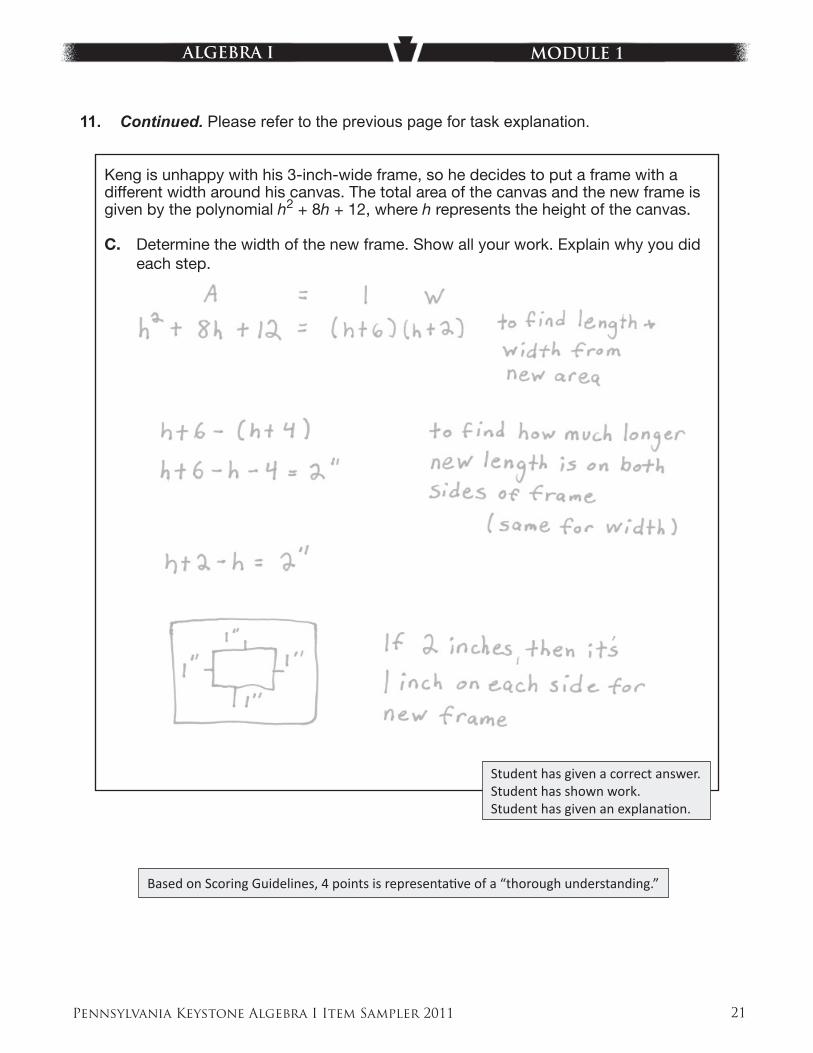
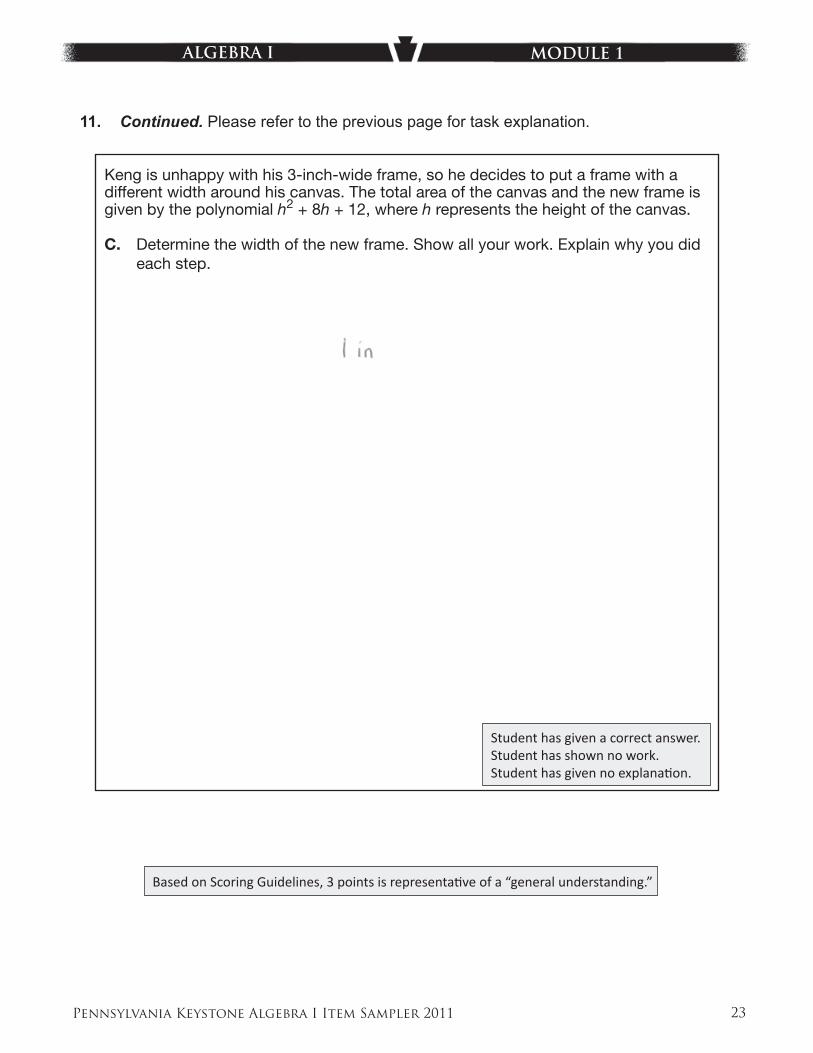
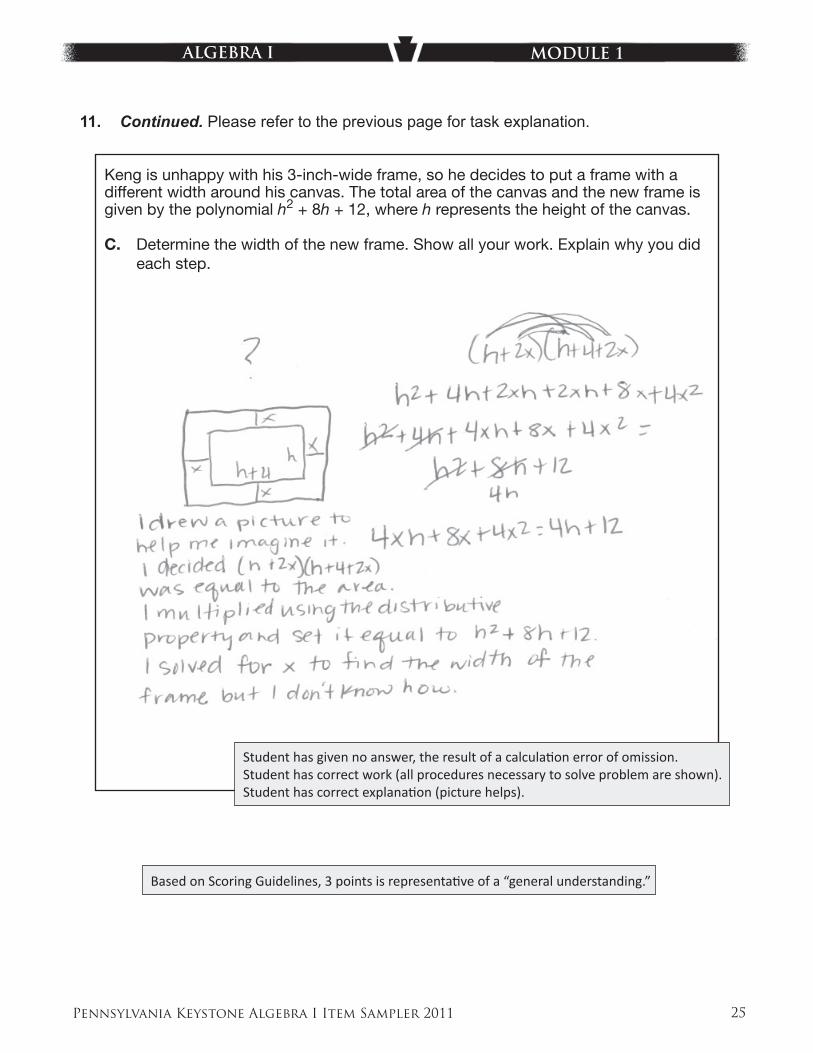
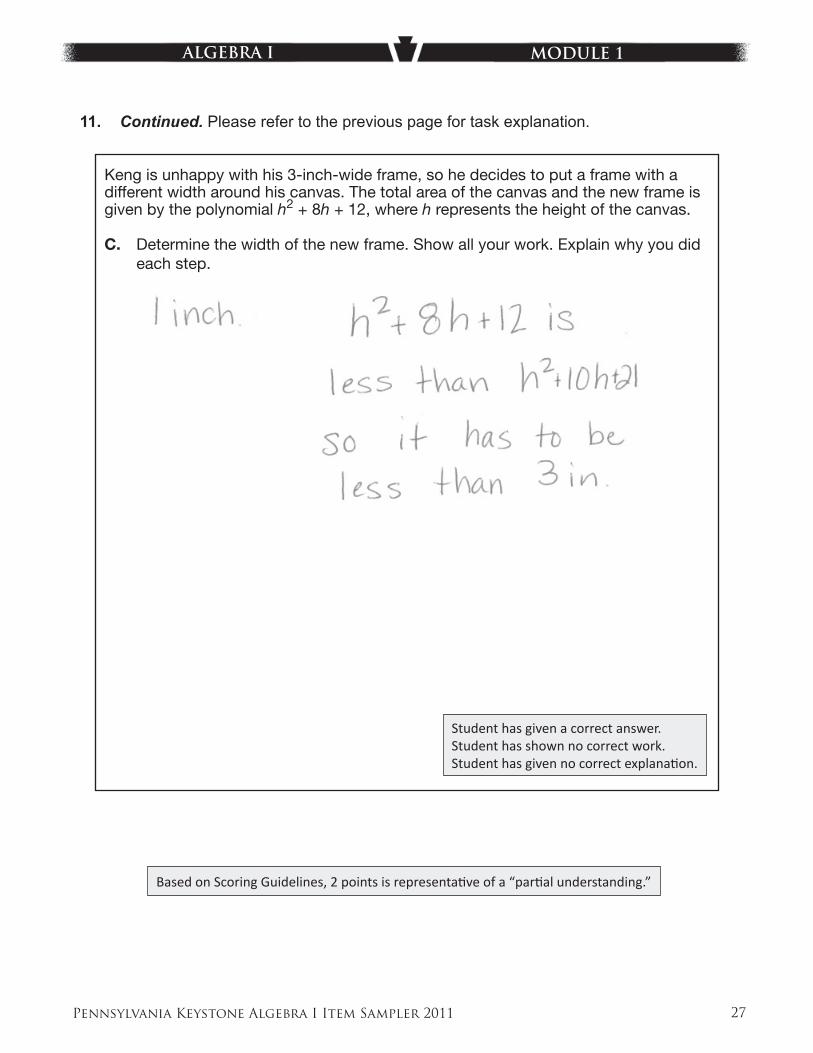
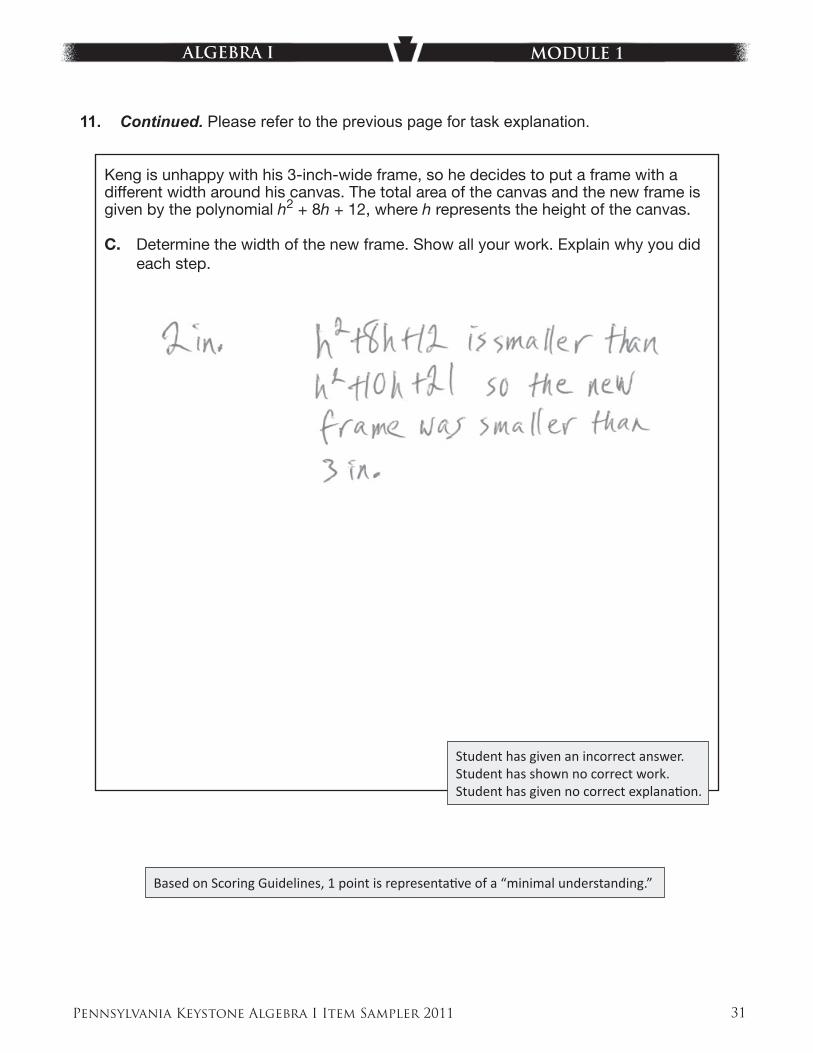
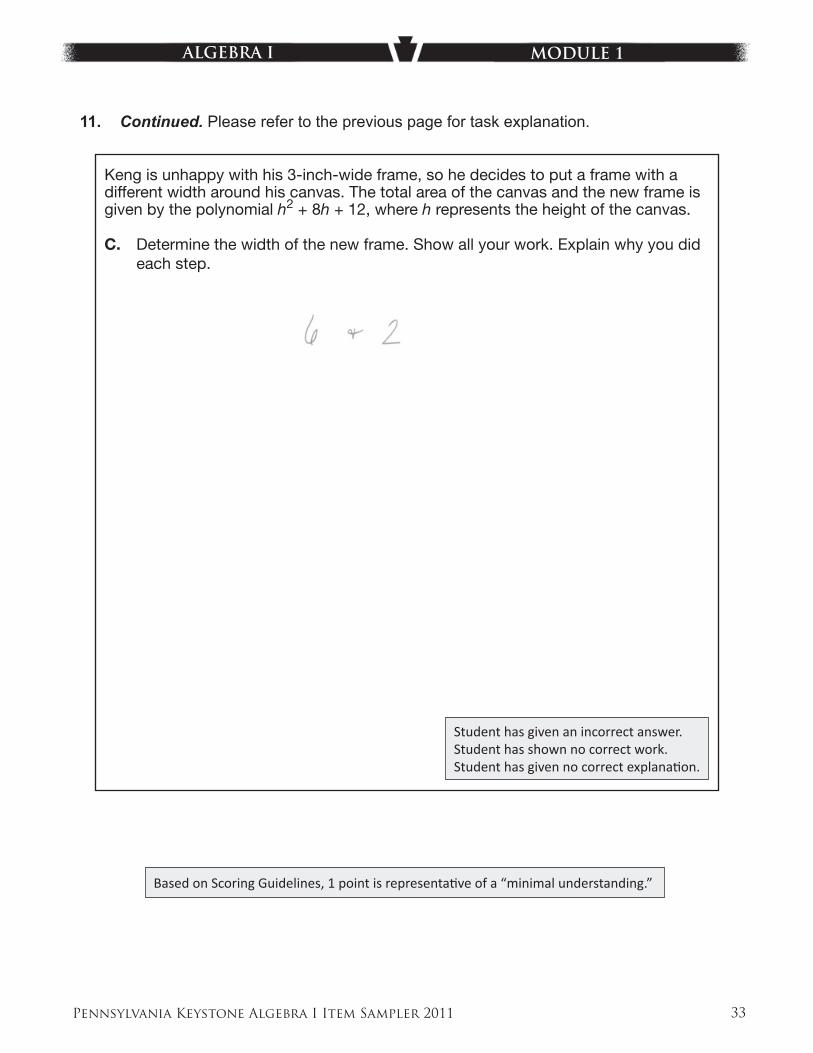
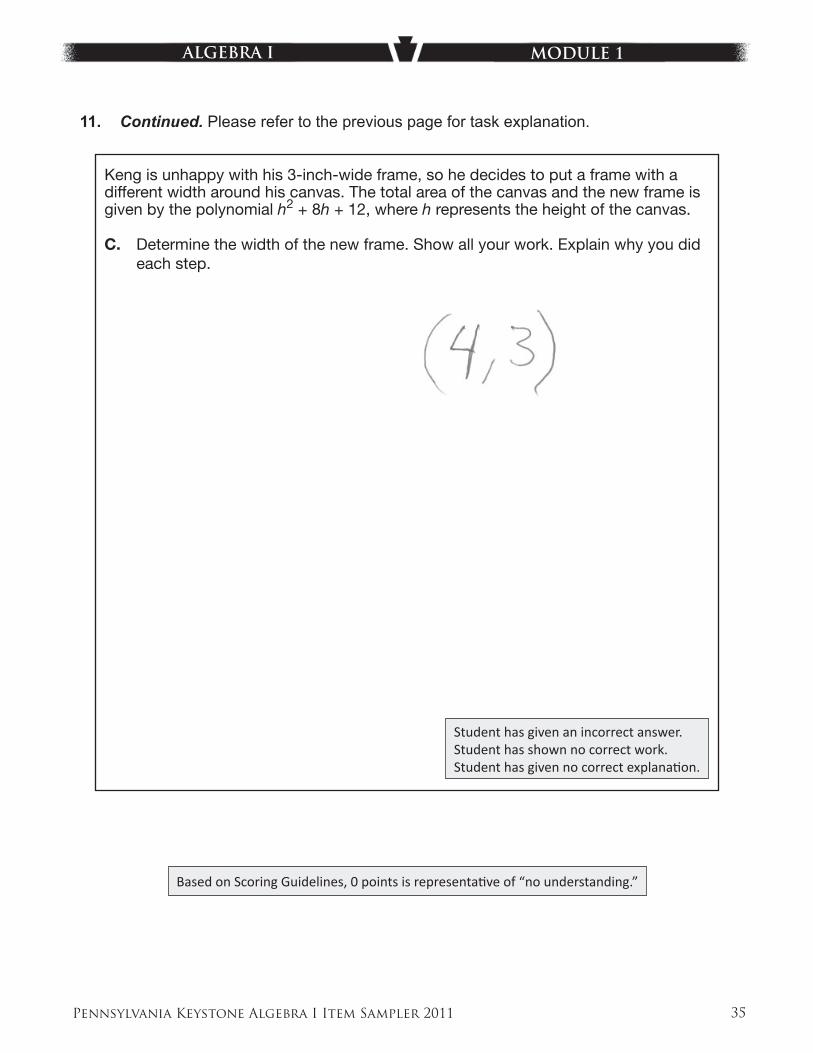
11. Continued. Please refer to the previous page for task explanation.
Keng is unhappy with his 3-inch-wide frame, so he decides to put a frame with a different width around his canvas. The total area of the canvas and the new frame is given by the polynomial h2 + 8h + 12, where h represents the height of the canvas.
C. Determine the width of the new frame. Show all your work. Explain why you did each step.
610626
Pennsylvania Keystone Algebra I Item Sampler 2011 18
ALGEBRA I MODULE 1
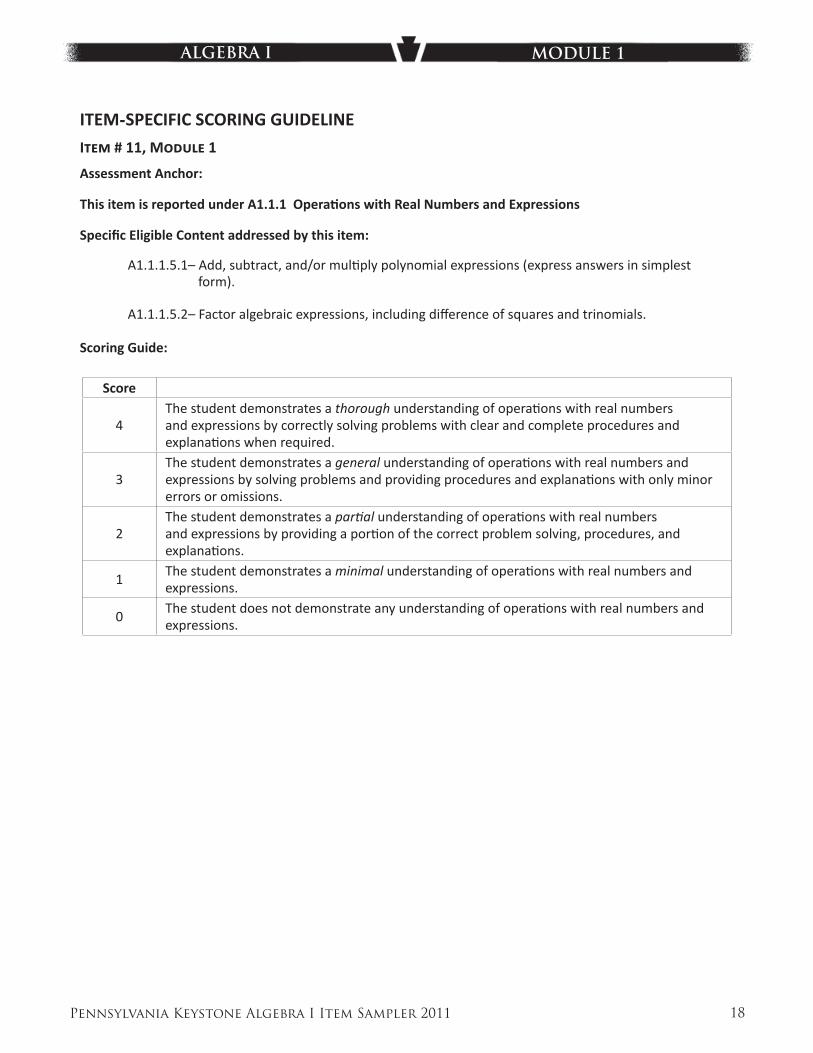
ITEM-SPECIFIC SCORING GUIDELINE
ITEM # 11, MODULE 1
Assessment Anchor:
This item is reported under A1.1.1 Operati ons with Real Numbers and Expressions
Specifi c Eligible Content addressed by this item:
A1.1.1.5.1– Add, subtract, and/or multi ply polynomial expressions (express answers in simplest form).
A1.1.1.5.2– Factor algebraic expressions, including diff erence of squares and trinomials.
Scoring Guide:
Score
4The student demonstrates a thorough understanding of operati ons with real numbers and expressions by correctly solving problems with clear and complete procedures and explanati ons when required.
3The student demonstrates a general understanding of operati ons with real numbers and expressions by solving problems and providing procedures and explanati ons with only minor errors or omissions.
2The student demonstrates a parti al understanding of operati ons with real numbers and expressions by providing a porti on of the correct problem solving, procedures, and explanati ons.
1The student demonstrates a minimal understanding of operati ons with real numbers and expressions.
0The student does not demonstrate any understanding of operati ons with real numbers and expressions.
Pennsylvania Keystone Algebra I Item Sampler 2011 19
ALGEBRA I MODULE 1
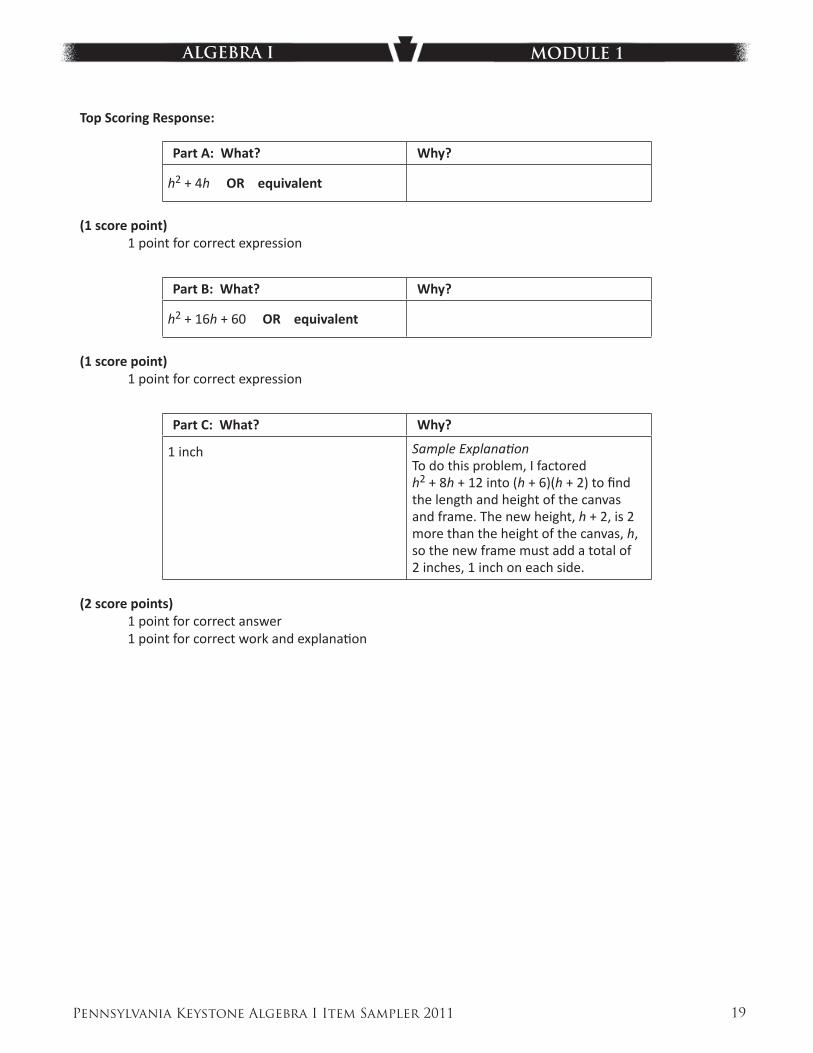
Top Scoring Response:
Part A: What? Why?
h2 + 4h OR equivalent
(1 score point)1 point for correct expression
Part B: What? Why?
h2 + 16h + 60 OR equivalent
(1 score point)1 point for correct expression
Part C: What? Why?
1 inch Sample Explanati onTo do this problem, I factored h2 + 8h + 12 into (h + 6)(h + 2) to fi nd the length and height of the canvas and frame. The new height, h + 2, is 2 more than the height of the canvas, h, so the new frame must add a total of 2 inches, 1 inch on each side.
(2 score points)1 point for correct answer1 point for correct work and explanati on
Pennsylvania Keystone Algebra I Item Sampler 2011 20
ALGEBRA I MODULE 1
11. Keng creates a painting on a rectangular canvas with a width that is four inches longer than the height, as shown in the diagram below.
h
h + 4
A. Write a polynomial expression, in simplifi ed form, that represents the area of the canvas.
Keng adds a 3-inch-wide frame around all sides of his canvas.
B. Write a polynomial expression, in simplifi ed form, that represents the total area of the canvas and the frame.
Go to the next page to fi nish question 11.
A1.1.1 Response Score: 4 points
Student has given a correct expression.
Student has given a correct expression.
Pennsylvania Keystone Algebra I Item Sampler 2011 21
ALGEBRA I MODULE 1
11. Continued. Please refer to the previous page for task explanation.
Keng is unhappy with his 3-inch-wide frame, so he decides to put a frame with a different width around his canvas. The total area of the canvas and the new frame is given by the polynomial h2 + 8h + 12, where h represents the height of the canvas.
C. Determine the width of the new frame. Show all your work. Explain why you did each step.
610626
Student has given a correct answer.Student has shown work.Student has given an explanati on.
Based on Scoring Guidelines, 4 points is representati ve of a “thorough understanding.”
Pennsylvania Keystone Algebra I Item Sampler 2011 22
ALGEBRA I MODULE 1
11. Keng creates a painting on a rectangular canvas with a width that is four inches longer than the height, as shown in the diagram below.
h
h + 4
A. Write a polynomial expression, in simplifi ed form, that represents the area of the canvas.
Keng adds a 3-inch-wide frame around all sides of his canvas.
B. Write a polynomial expression, in simplifi ed form, that represents the total area of the canvas and the frame.
Go to the next page to fi nish question 11.
A1.1.1 Response Score: 3 points
Student has given a correct expression.
Student has given a correct expression.
Pennsylvania Keystone Algebra I Item Sampler 2011 23
ALGEBRA I MODULE 1
11. Continued. Please refer to the previous page for task explanation.
Keng is unhappy with his 3-inch-wide frame, so he decides to put a frame with a different width around his canvas. The total area of the canvas and the new frame is given by the polynomial h2 + 8h + 12, where h represents the height of the canvas.
C. Determine the width of the new frame. Show all your work. Explain why you did each step.
610626
Student has given a correct answer.Student has shown no work.Student has given no explanati on.
Based on Scoring Guidelines, 3 points is representati ve of a “general understanding.”
Student has given a correct expression.
Student has given a correct expression.
Pennsylvania Keystone Algebra I Item Sampler 2011 24
ALGEBRA I MODULE 1
11. Keng creates a painting on a rectangular canvas with a width that is four inches longer than the height, as shown in the diagram below.
h
h + 4
A. Write a polynomial expression, in simplifi ed form, that represents the area of the canvas.
Keng adds a 3-inch-wide frame around all sides of his canvas.
B. Write a polynomial expression, in simplifi ed form, that represents the total area of the canvas and the frame.
Go to the next page to fi nish question 11.
A1.1.1 Response Score: 3 points
Pennsylvania Keystone Algebra I Item Sampler 2011 25
ALGEBRA I MODULE 1
11. Continued. Please refer to the previous page for task explanation.
Keng is unhappy with his 3-inch-wide frame, so he decides to put a frame with a different width around his canvas. The total area of the canvas and the new frame is given by the polynomial h2 + 8h + 12, where h represents the height of the canvas.
C. Determine the width of the new frame. Show all your work. Explain why you did each step.
610626
Student has given no answer, the result of a calculati on error of omission.Student has correct work (all procedures necessary to solve problem are shown).Student has correct explanati on (picture helps).
Based on Scoring Guidelines, 3 points is representati ve of a “general understanding.”
Pennsylvania Keystone Algebra I Item Sampler 2011 26
ALGEBRA I MODULE 1
11. Keng creates a painting on a rectangular canvas with a width that is four inches longer than the height, as shown in the diagram below.
h
h + 4
A. Write a polynomial expression, in simplifi ed form, that represents the area of the canvas.
Keng adds a 3-inch-wide frame around all sides of his canvas.
B. Write a polynomial expression, in simplifi ed form, that represents the total area of the canvas and the frame.
Go to the next page to fi nish question 11.
A1.1.1 Response Score: 2 points
Student has given a correct expression.
Student has given an incorrect expression. Student has failed to take into considerati on that the frame is on all four sides of the fi gure and not just on two.
Pennsylvania Keystone Algebra I Item Sampler 2011 27
ALGEBRA I MODULE 1
11. Continued. Please refer to the previous page for task explanation.
Keng is unhappy with his 3-inch-wide frame, so he decides to put a frame with a different width around his canvas. The total area of the canvas and the new frame is given by the polynomial h2 + 8h + 12, where h represents the height of the canvas.
C. Determine the width of the new frame. Show all your work. Explain why you did each step.
610626
Student has given a correct answer.Student has shown no correct work.Student has given no correct explanati on.
Based on Scoring Guidelines, 2 points is representati ve of a “parti al understanding.”
Pennsylvania Keystone Algebra I Item Sampler 2011 28
ALGEBRA I MODULE 1
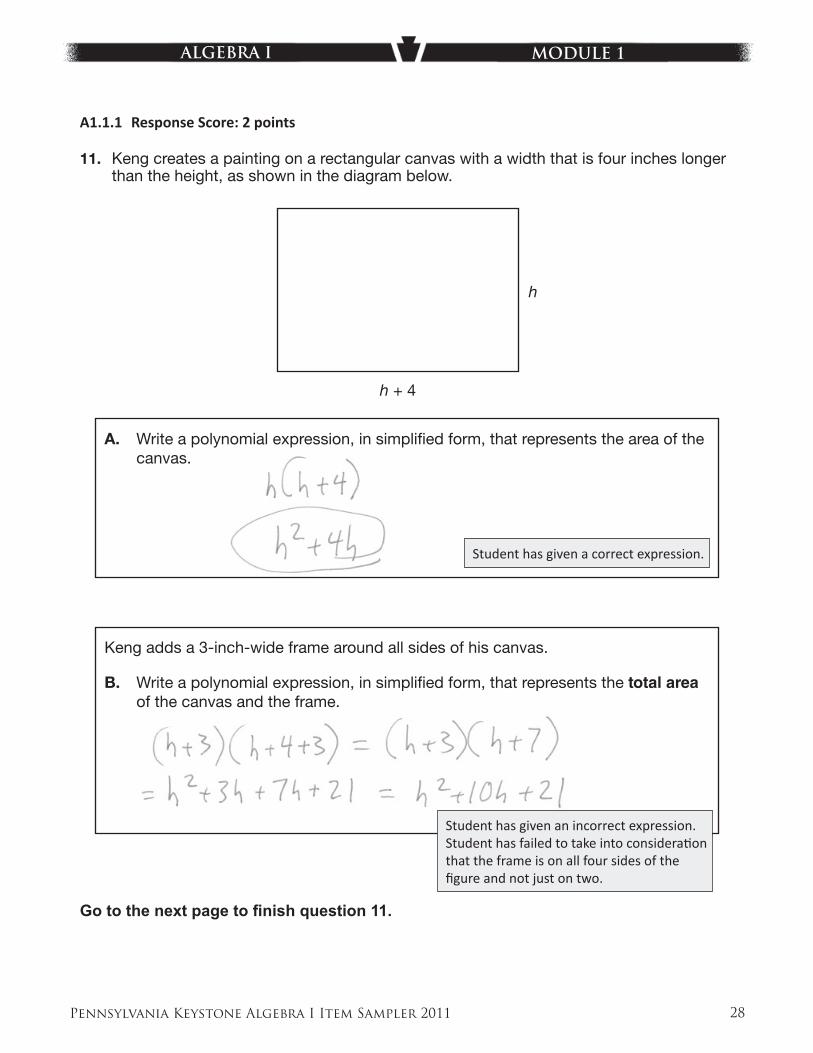
11. Keng creates a painting on a rectangular canvas with a width that is four inches longer than the height, as shown in the diagram below.
h
h + 4
A. Write a polynomial expression, in simplifi ed form, that represents the area of the canvas.
Keng adds a 3-inch-wide frame around all sides of his canvas.
B. Write a polynomial expression, in simplifi ed form, that represents the total area of the canvas and the frame.
Go to the next page to fi nish question 11.
A1.1.1 Response Score: 2 points
Student has given a correct expression.
Student has given an incorrect expression. Student has failed to take into considerati on that the frame is on all four sides of the fi gure and not just on two.
Pennsylvania Keystone Algebra I Item Sampler 2011 29
ALGEBRA I MODULE 1
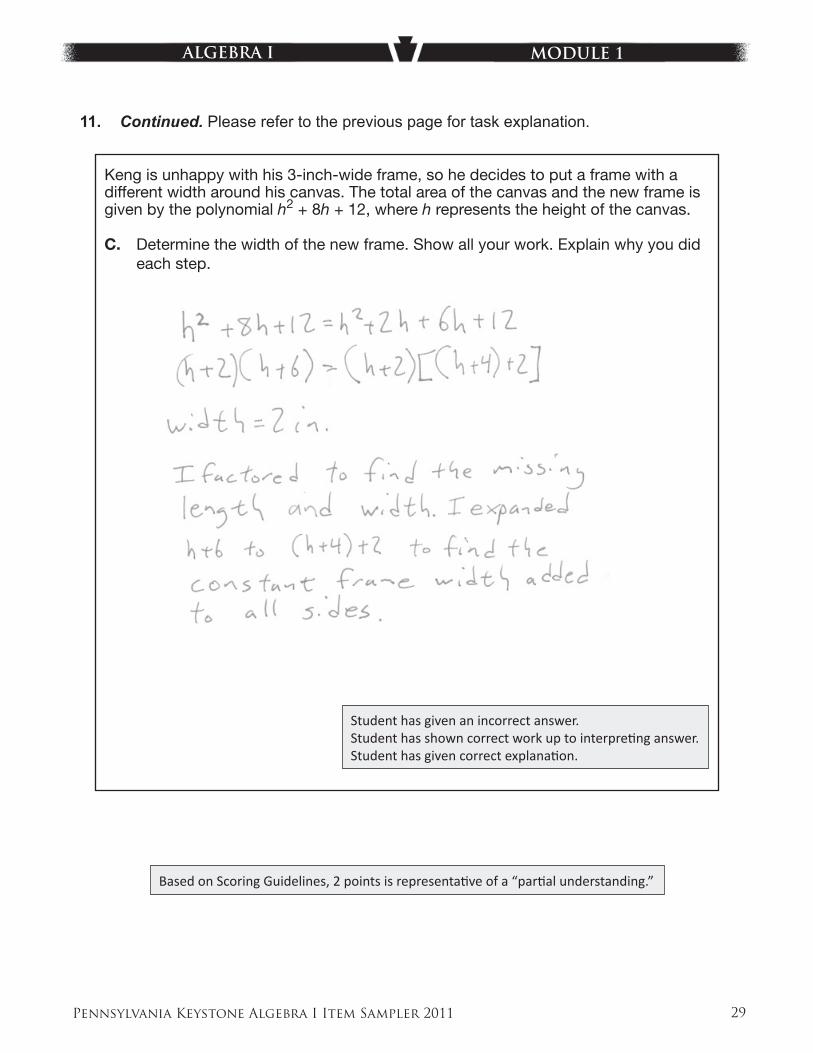
11. Continued. Please refer to the previous page for task explanation.
Keng is unhappy with his 3-inch-wide frame, so he decides to put a frame with a different width around his canvas. The total area of the canvas and the new frame is given by the polynomial h2 + 8h + 12, where h represents the height of the canvas.
C. Determine the width of the new frame. Show all your work. Explain why you did each step.
610626
Student has given an incorrect answer. Student has shown correct work up to interpreti ng answer.Student has given correct explanati on.
Based on Scoring Guidelines, 2 points is representati ve of a “parti al understanding.”
Pennsylvania Keystone Algebra I Item Sampler 2011 30
ALGEBRA I MODULE 1
11. Keng creates a painting on a rectangular canvas with a width that is four inches longer than the height, as shown in the diagram below.
h
h + 4
A. Write a polynomial expression, in simplifi ed form, that represents the area of the canvas.
Keng adds a 3-inch-wide frame around all sides of his canvas.
B. Write a polynomial expression, in simplifi ed form, that represents the total area of the canvas and the frame.
Go to the next page to fi nish question 11.
A1.1.1 Response Score: 1 point
Student has given a correct expression.
Student has given an incorrect expression.
Pennsylvania Keystone Algebra I Item Sampler 2011 31
ALGEBRA I MODULE 1
11. Continued. Please refer to the previous page for task explanation.
Keng is unhappy with his 3-inch-wide frame, so he decides to put a frame with a different width around his canvas. The total area of the canvas and the new frame is given by the polynomial h2 + 8h + 12, where h represents the height of the canvas.
C. Determine the width of the new frame. Show all your work. Explain why you did each step.
610626
Student has given an incorrect answer.Student has shown no correct work.Student has given no correct explanati on.
Based on Scoring Guidelines, 1 point is representati ve of a “minimal understanding.”
Pennsylvania Keystone Algebra I Item Sampler 2011 32
ALGEBRA I MODULE 1
11. Keng creates a painting on a rectangular canvas with a width that is four inches longer than the height, as shown in the diagram below.
h
h + 4
A. Write a polynomial expression, in simplifi ed form, that represents the area of the canvas.
Keng adds a 3-inch-wide frame around all sides of his canvas.
B. Write a polynomial expression, in simplifi ed form, that represents the total area of the canvas and the frame.
Go to the next page to fi nish question 11.
A1.1.1 Response Score: 1 point
Student has given an incorrect expression.
Student has given a correct expression.
Pennsylvania Keystone Algebra I Item Sampler 2011 33
ALGEBRA I MODULE 1
11. Continued. Please refer to the previous page for task explanation.
Keng is unhappy with his 3-inch-wide frame, so he decides to put a frame with a different width around his canvas. The total area of the canvas and the new frame is given by the polynomial h2 + 8h + 12, where h represents the height of the canvas.
C. Determine the width of the new frame. Show all your work. Explain why you did each step.
610626
Student has given an incorrect answer.Student has shown no correct work.Student has given no correct explanati on.
Based on Scoring Guidelines, 1 point is representati ve of a “minimal understanding.”
Pennsylvania Keystone Algebra I Item Sampler 2011 34
ALGEBRA I MODULE 1
11. Keng creates a painting on a rectangular canvas with a width that is four inches longer than the height, as shown in the diagram below.
h
h + 4
A. Write a polynomial expression, in simplifi ed form, that represents the area of the canvas.
Keng adds a 3-inch-wide frame around all sides of his canvas.
B. Write a polynomial expression, in simplifi ed form, that represents the total area of the canvas and the frame.
Go to the next page to fi nish question 11.
A1.1.1 Response Score: 0
Student has given an incorrect expression.
Student has given an incorrect expression.
Pennsylvania Keystone Algebra I Item Sampler 2011 35
ALGEBRA I MODULE 1
11. Continued. Please refer to the previous page for task explanation.
Keng is unhappy with his 3-inch-wide frame, so he decides to put a frame with a different width around his canvas. The total area of the canvas and the new frame is given by the polynomial h2 + 8h + 12, where h represents the height of the canvas.
C. Determine the width of the new frame. Show all your work. Explain why you did each step.
610626
Student has given an incorrect answer.Student has shown no correct work.Student has given no correct explanati on.
Based on Scoring Guidelines, 0 points is representati ve of “no understanding.”
Pennsylvania Keystone Algebra I Item Sampler 2011 36
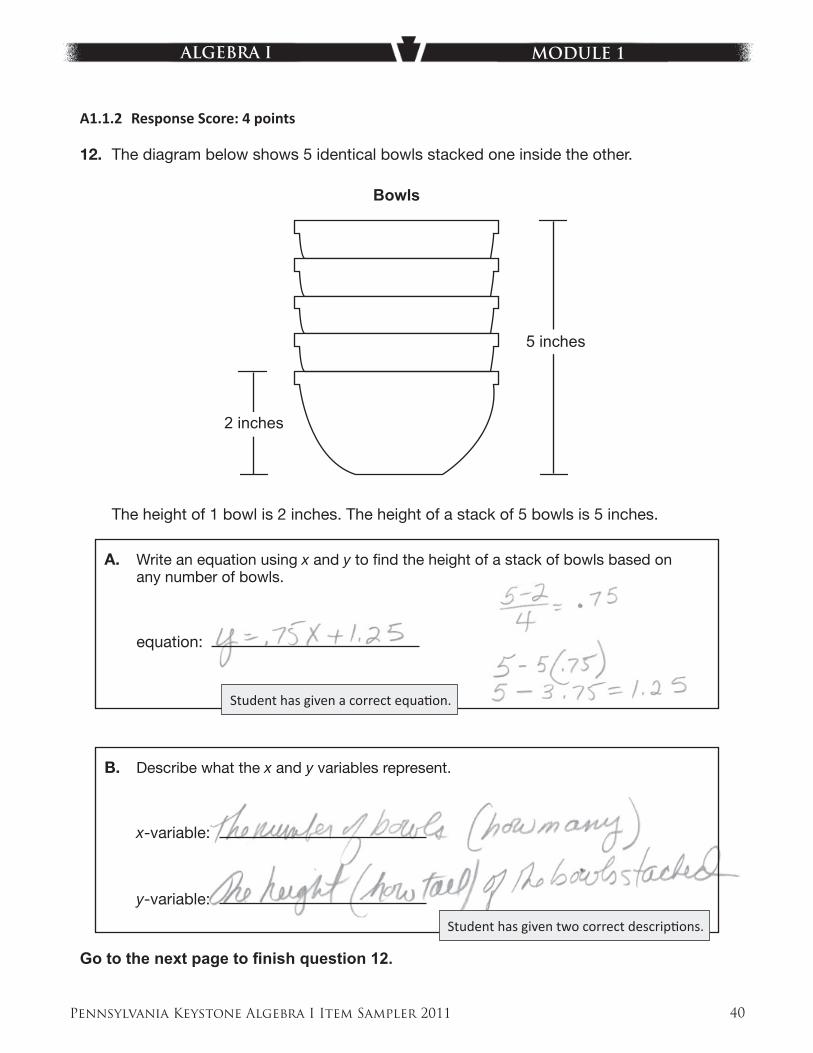
ALGEBRA I MODULE 1
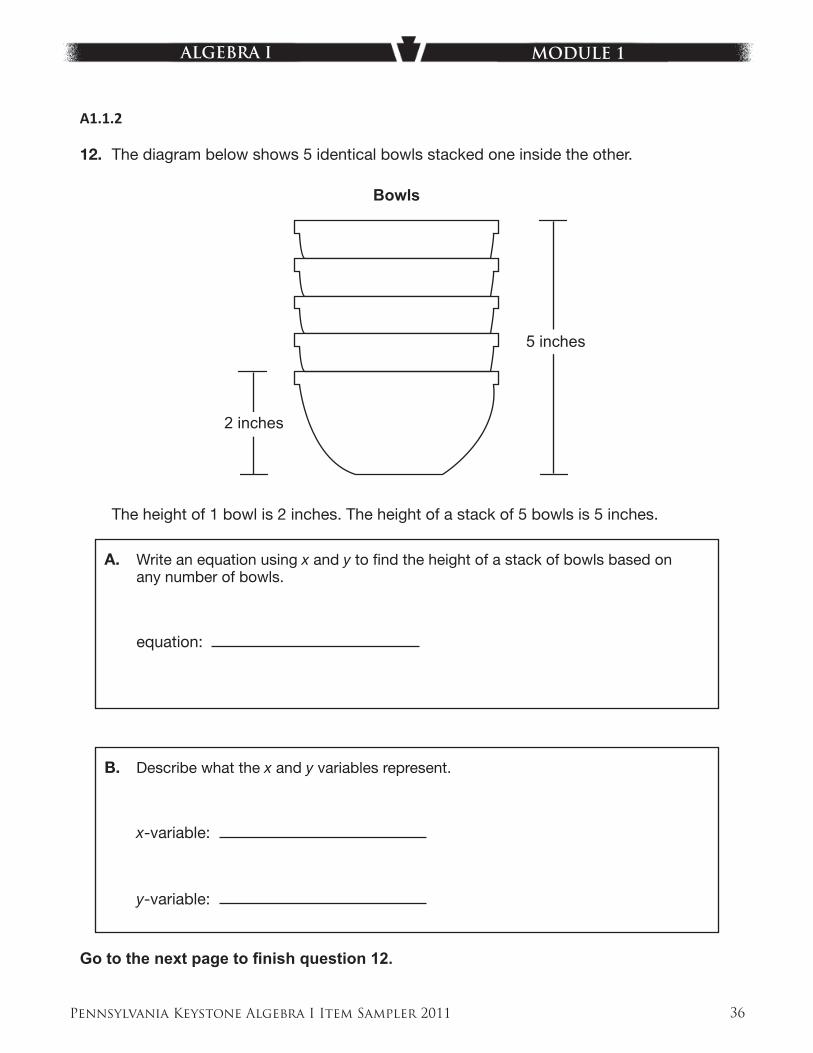
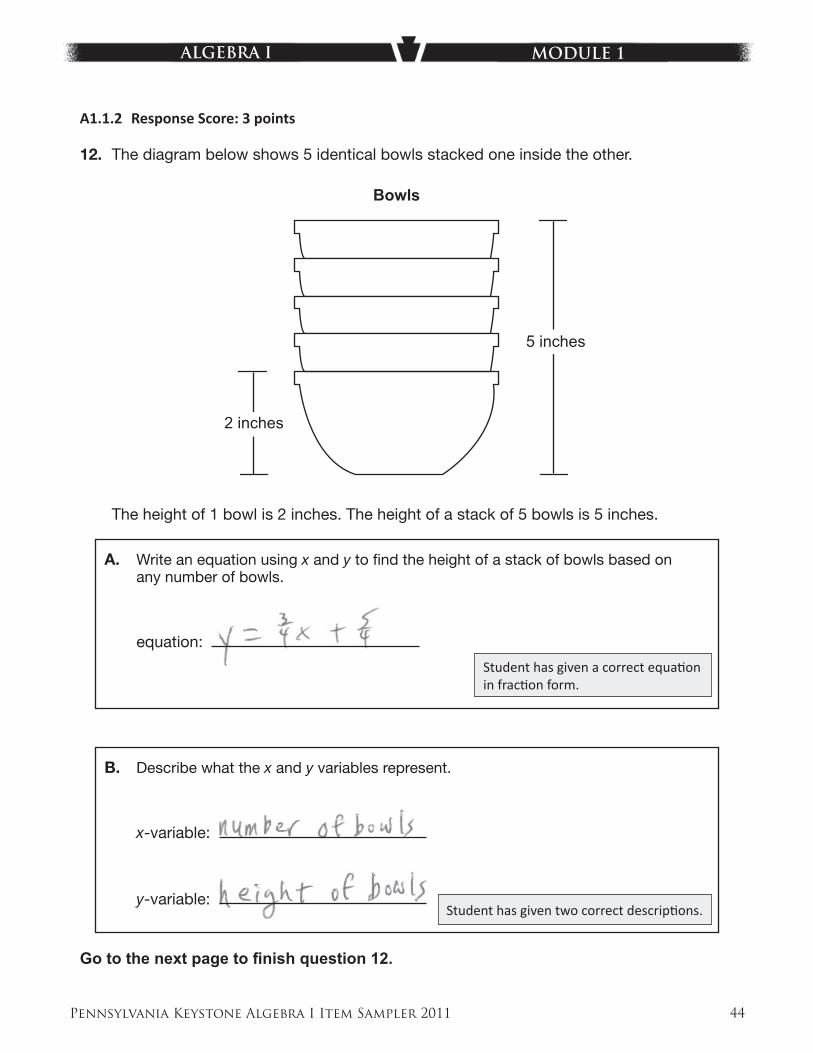
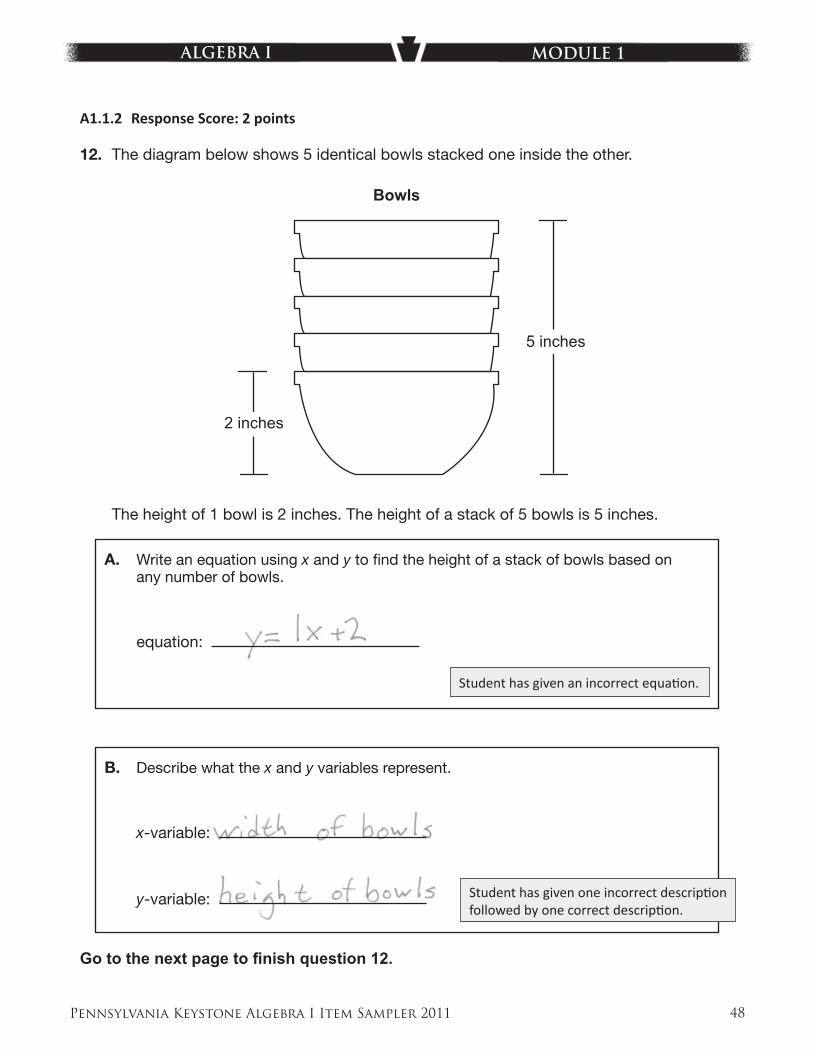
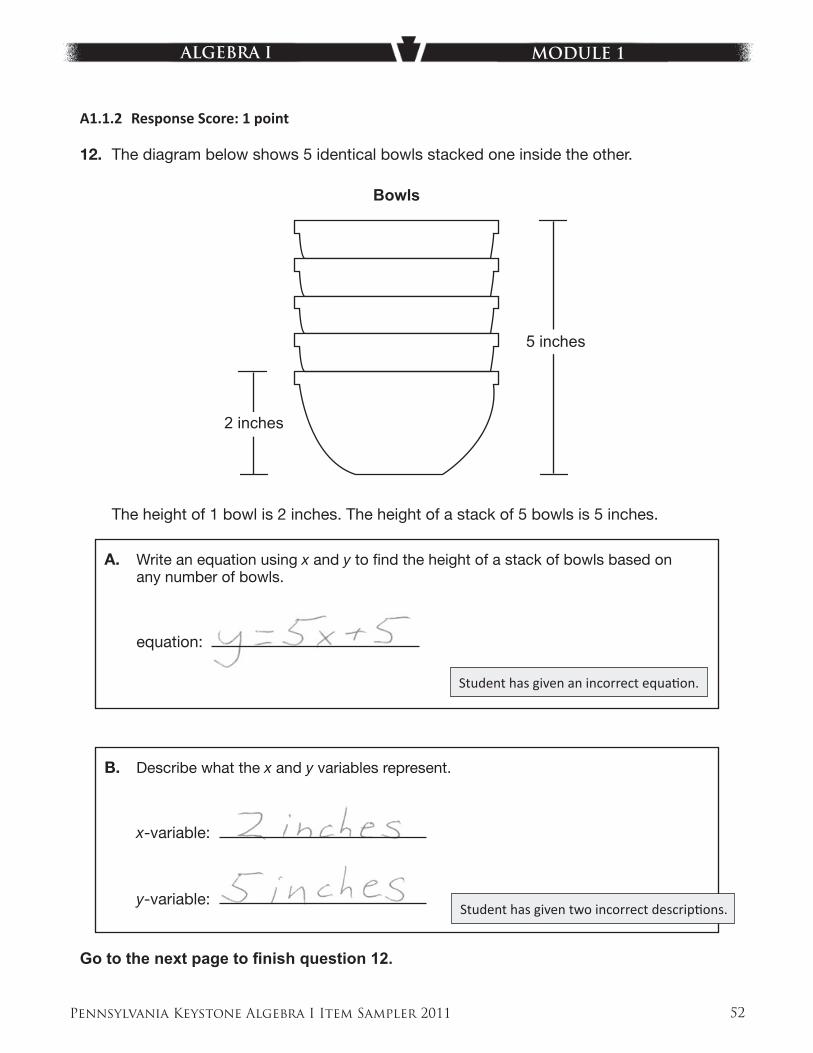
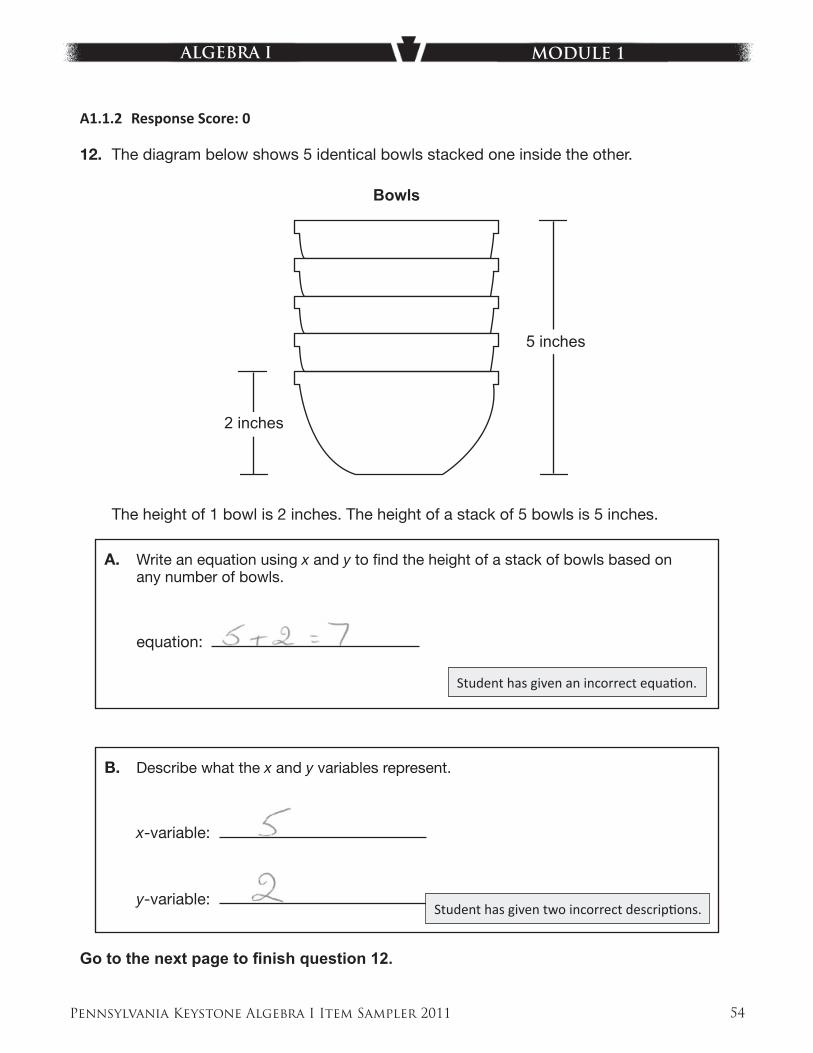
12. The diagram below shows 5 identical bowls stacked one inside the other.
2 inches
5 inches
Bowls
The height of 1 bowl is 2 inches. The height of a stack of 5 bowls is 5 inches.
A. Write an equation using x and y to fi nd the height of a stack of bowls based on any number of bowls.
equation:
B. Describe what the x and y variables represent.
x-variable:
y-variable:
Go to the next page to fi nish question 12.
A1.1.2
Pennsylvania Keystone Algebra I Item Sampler 2011 37
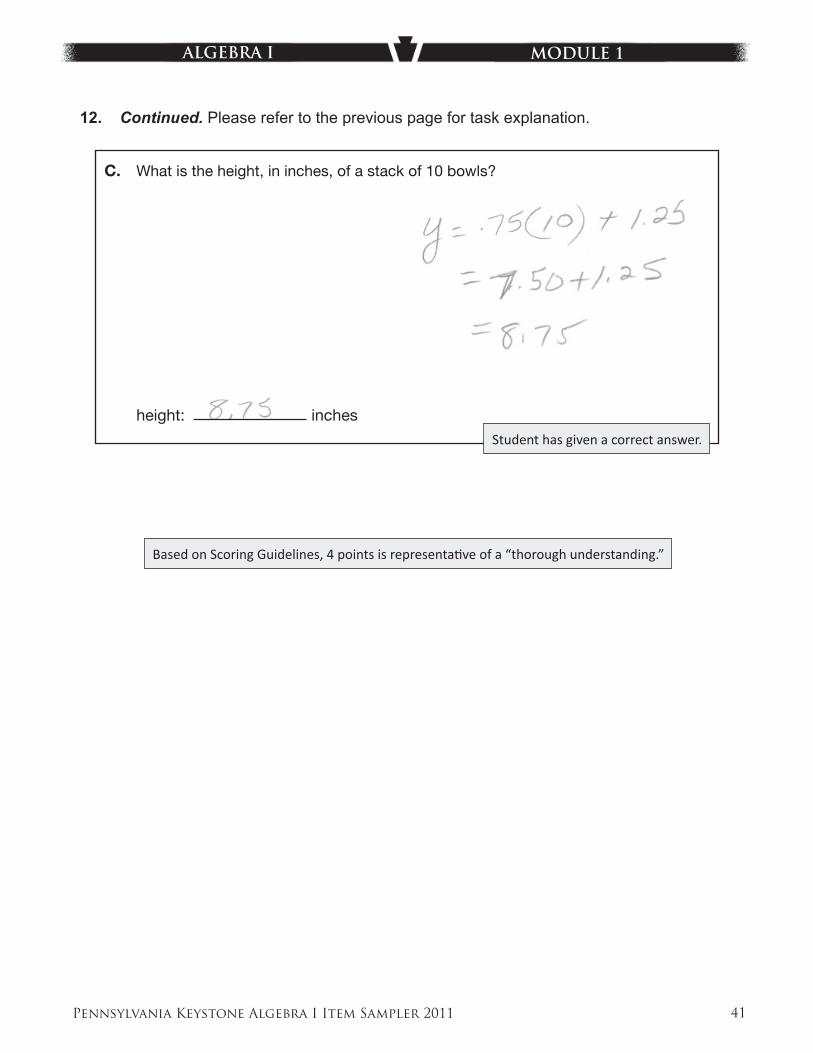
ALGEBRA I MODULE 1
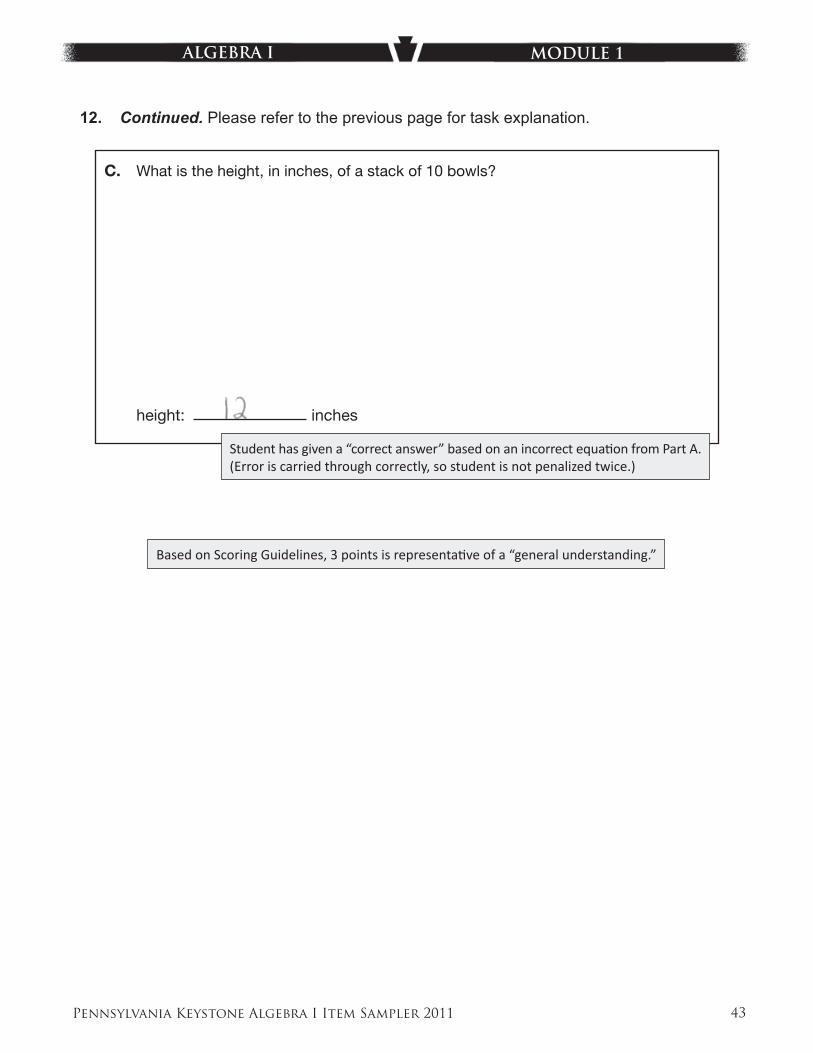
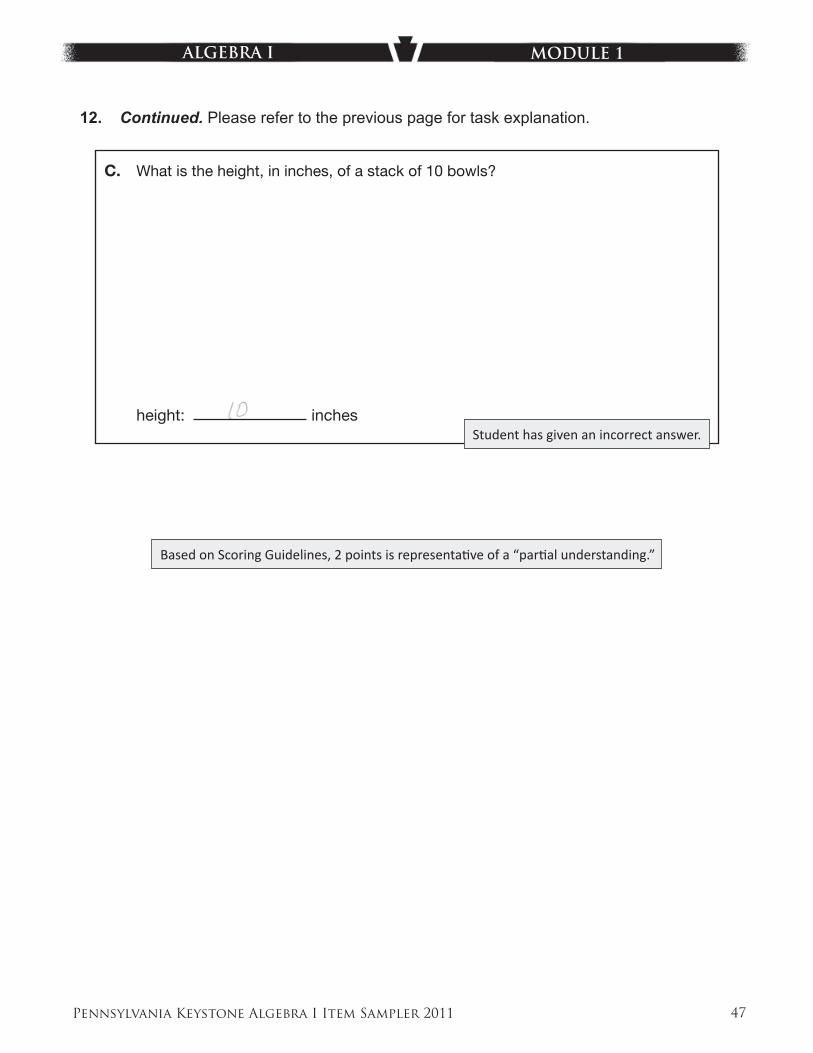
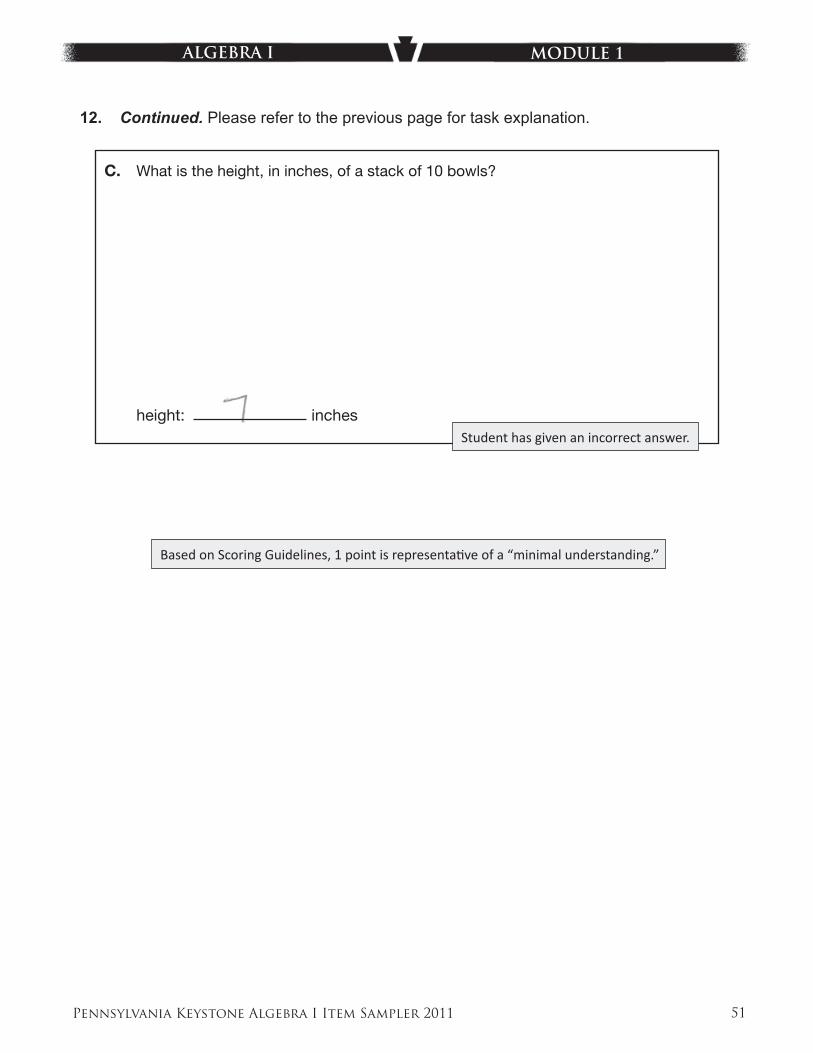
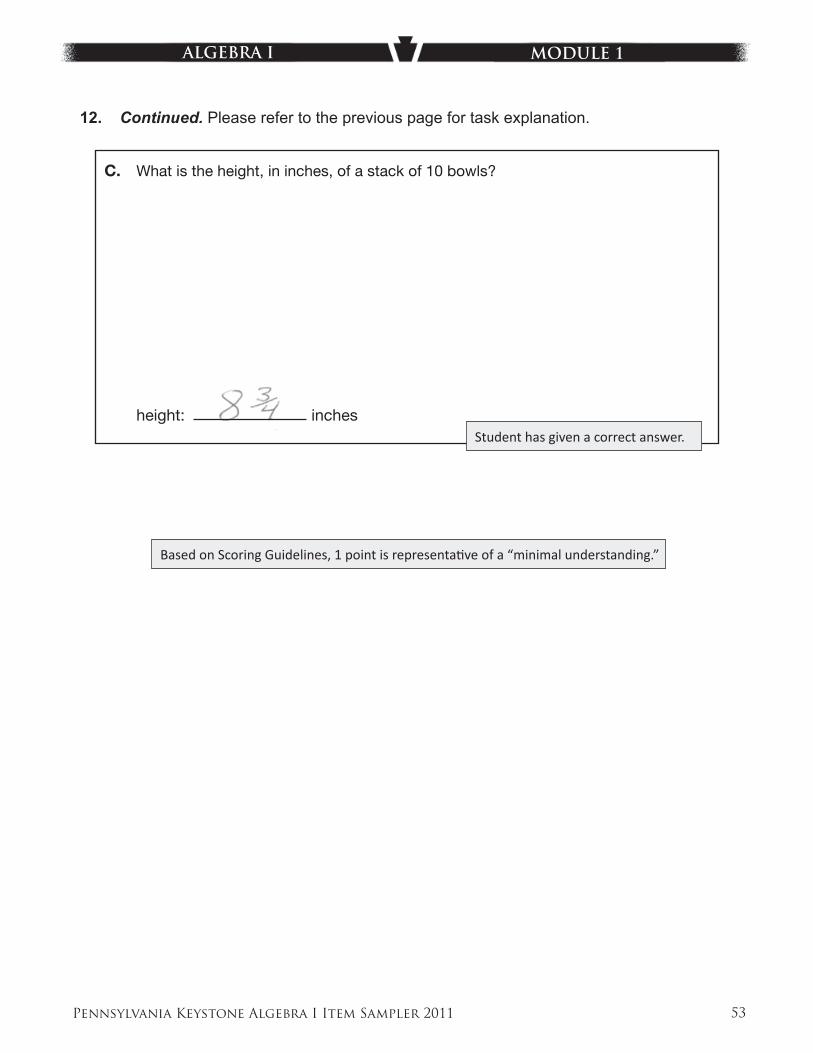
12. Continued. Please refer to the previous page for task explanation.
C. What is the height, in inches, of a stack of 10 bowls?
height: inches
631389
Pennsylvania Keystone Algebra I Item Sampler 2011 38
ALGEBRA I MODULE 1
ITEM-SPECIFIC SCORING GUIDELINE
ITEM # 12, MODULE 1
Assessment Anchor:
This item is reported under A1.1.2 Linear Equati ons
Specifi c Eligible Content addressed by this item:
A1.1.2.1.1– Write, solve, and/or apply a linear equati on (including problem situati ons).
A1.1.2.1.3– Interpret soluti ons to problems in the context of the problem situati on (linear equati ons only).
Scoring Guide:
Score
4The student demonstrates a thorough understanding of linear equati ons by correctly solving problems.
3The student demonstrates a general understanding of linear equati ons by solving problems with only minor errors or omissions.
2The student demonstrates a parti al understanding of linear equati ons by providing a porti on of the correct problem solving.
1 The student demonstrates a minimal understanding of linear equati ons.0 The student does not demonstrate any understanding of linear equati ons.
Pennsylvania Keystone Algebra I Item Sampler 2011 39
ALGEBRA I MODULE 1
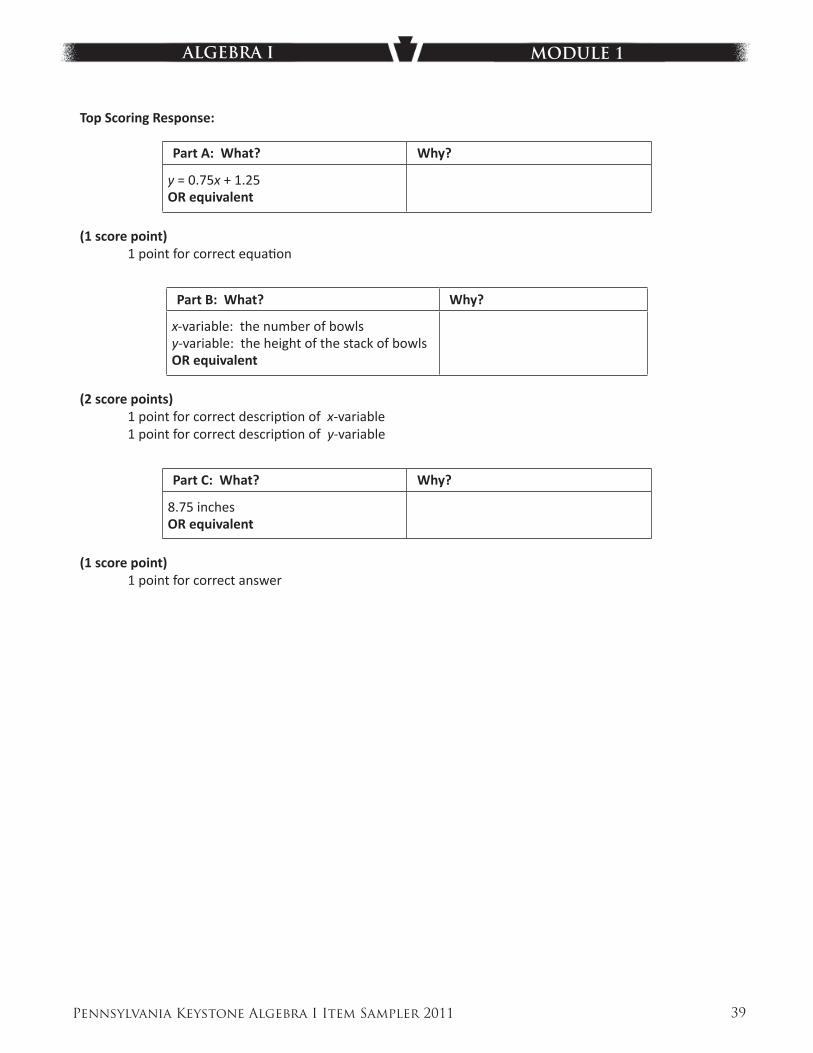
Top Scoring Response:
Part A: What? Why?
y = 0.75x + 1.25OR equivalent
(1 score point)1 point for correct equati on
Part B: What? Why?
x-variable: the number of bowlsy-variable: the height of the stack of bowlsOR equivalent
(2 score points)1 point for correct descripti on of x-variable 1 point for correct descripti on of y-variable
Part C: What? Why?
8.75 inchesOR equivalent
(1 score point)1 point for correct answer
Pennsylvania Keystone Algebra I Item Sampler 2011 40
ALGEBRA I MODULE 1
12. The diagram below shows 5 identical bowls stacked one inside the other.
2 inches
5 inches
Bowls
The height of 1 bowl is 2 inches. The height of a stack of 5 bowls is 5 inches.
A. Write an equation using x and y to fi nd the height of a stack of bowls based on any number of bowls.
equation:
B. Describe what the x and y variables represent.
x-variable:
y-variable:
Go to the next page to fi nish question 12.
A1.1.2 Response Score: 4 points
Student has given two correct descripti ons.
Student has given a correct equati on.
Pennsylvania Keystone Algebra I Item Sampler 2011 41
ALGEBRA I MODULE 1
12. Continued. Please refer to the previous page for task explanation.
C. What is the height, in inches, of a stack of 10 bowls?
height: inches
631389
Student has given a correct answer.
Based on Scoring Guidelines, 4 points is representati ve of a “thorough understanding.”

Pennsylvania Keystone Algebra I Item Sampler 2011 42
ALGEBRA I MODULE 1
12. The diagram below shows 5 identical bowls stacked one inside the other.
2 inches
5 inches
Bowls
The height of 1 bowl is 2 inches. The height of a stack of 5 bowls is 5 inches.
A. Write an equation using x and y to fi nd the height of a stack of bowls based on any number of bowls.
equation:
B. Describe what the x and y variables represent.
x-variable:
y-variable:
Go to the next page to fi nish question 12.
A1.1.2 Response Score: 3 points
Student has given two correct descripti ons.
Student has given an incorrect equati on.
Pennsylvania Keystone Algebra I Item Sampler 2011 43
ALGEBRA I MODULE 1
12. Continued. Please refer to the previous page for task explanation.
C. What is the height, in inches, of a stack of 10 bowls?
height: inches
631389
Student has given a “correct answer” based on an incorrect equati on from Part A. (Error is carried through correctly, so student is not penalized twice.)
Based on Scoring Guidelines, 3 points is representati ve of a “general understanding.”
Pennsylvania Keystone Algebra I Item Sampler 2011 44
ALGEBRA I MODULE 1
12. The diagram below shows 5 identical bowls stacked one inside the other.
2 inches
5 inches
Bowls
The height of 1 bowl is 2 inches. The height of a stack of 5 bowls is 5 inches.
A. Write an equation using x and y to fi nd the height of a stack of bowls based on any number of bowls.
equation:
B. Describe what the x and y variables represent.
x-variable:
y-variable:
Go to the next page to fi nish question 12.
A1.1.2 Response Score: 3 points
Student has given two correct descripti ons.
Student has given a correct equati on in fracti on form.
Pennsylvania Keystone Algebra I Item Sampler 2011 45
ALGEBRA I MODULE 1
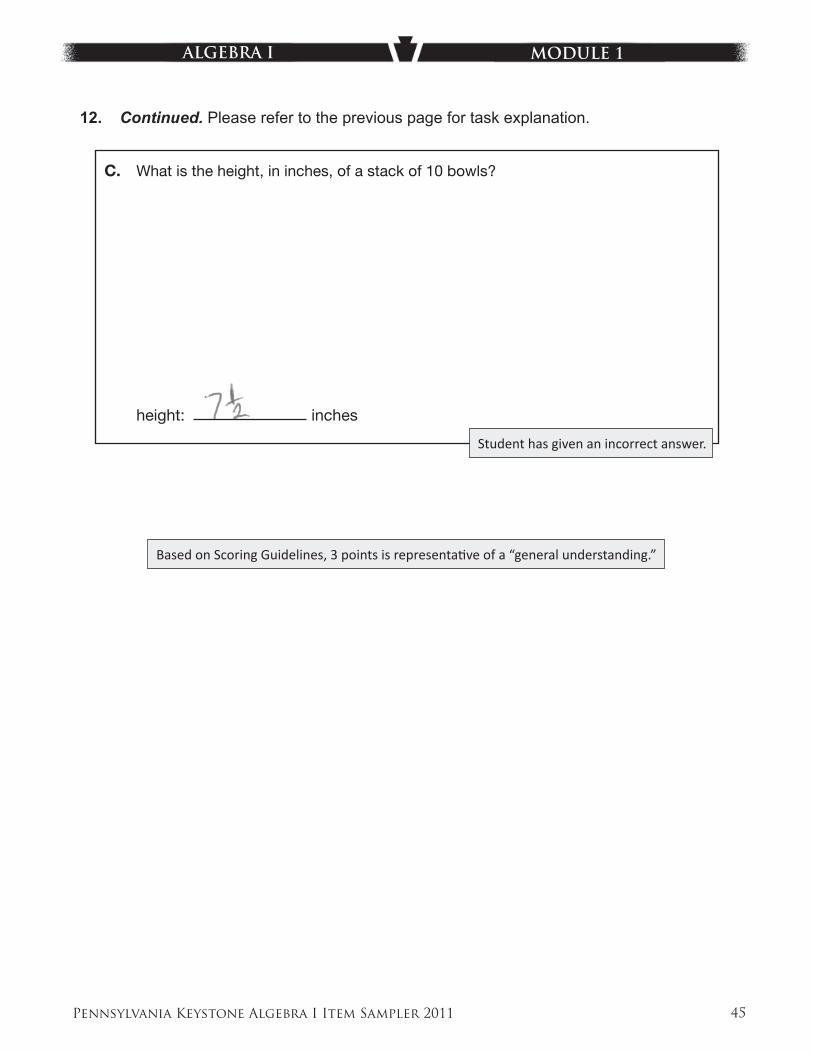
12. Continued. Please refer to the previous page for task explanation.
C. What is the height, in inches, of a stack of 10 bowls?
height: inches
631389
Student has given an incorrect answer.
Based on Scoring Guidelines, 3 points is representati ve of a “general understanding.”
Pennsylvania Keystone Algebra I Item Sampler 2011 46
ALGEBRA I MODULE 1
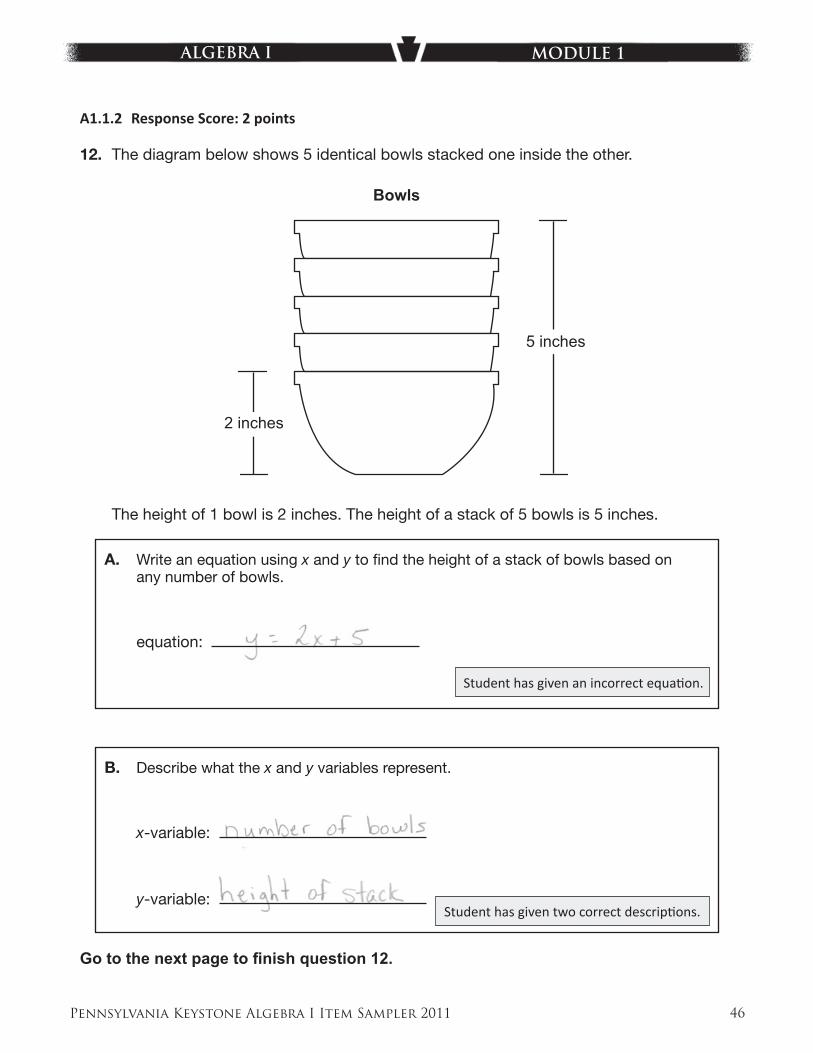
12. The diagram below shows 5 identical bowls stacked one inside the other.
2 inches
5 inches
Bowls
The height of 1 bowl is 2 inches. The height of a stack of 5 bowls is 5 inches.
A. Write an equation using x and y to fi nd the height of a stack of bowls based on any number of bowls.
equation:
B. Describe what the x and y variables represent.
x-variable:
y-variable:
Go to the next page to fi nish question 12.
A1.1.2 Response Score: 2 points
Student has given two correct descripti ons.
Student has given an incorrect equati on.
Pennsylvania Keystone Algebra I Item Sampler 2011 47
ALGEBRA I MODULE 1
12. Continued. Please refer to the previous page for task explanation.
C. What is the height, in inches, of a stack of 10 bowls?
height: inches
631389
Based on Scoring Guidelines, 2 points is representati ve of a “parti al understanding.”
Student has given an incorrect answer.
Pennsylvania Keystone Algebra I Item Sampler 2011 48
ALGEBRA I MODULE 1
12. The diagram below shows 5 identical bowls stacked one inside the other.
2 inches
5 inches
Bowls
The height of 1 bowl is 2 inches. The height of a stack of 5 bowls is 5 inches.
A. Write an equation using x and y to fi nd the height of a stack of bowls based on any number of bowls.
equation:
B. Describe what the x and y variables represent.
x-variable:
y-variable:
Go to the next page to fi nish question 12.
A1.1.2 Response Score: 2 points
Student has given one incorrect descripti on followed by one correct descripti on.
Student has given an incorrect equati on.
Pennsylvania Keystone Algebra I Item Sampler 2011 49
ALGEBRA I MODULE 1
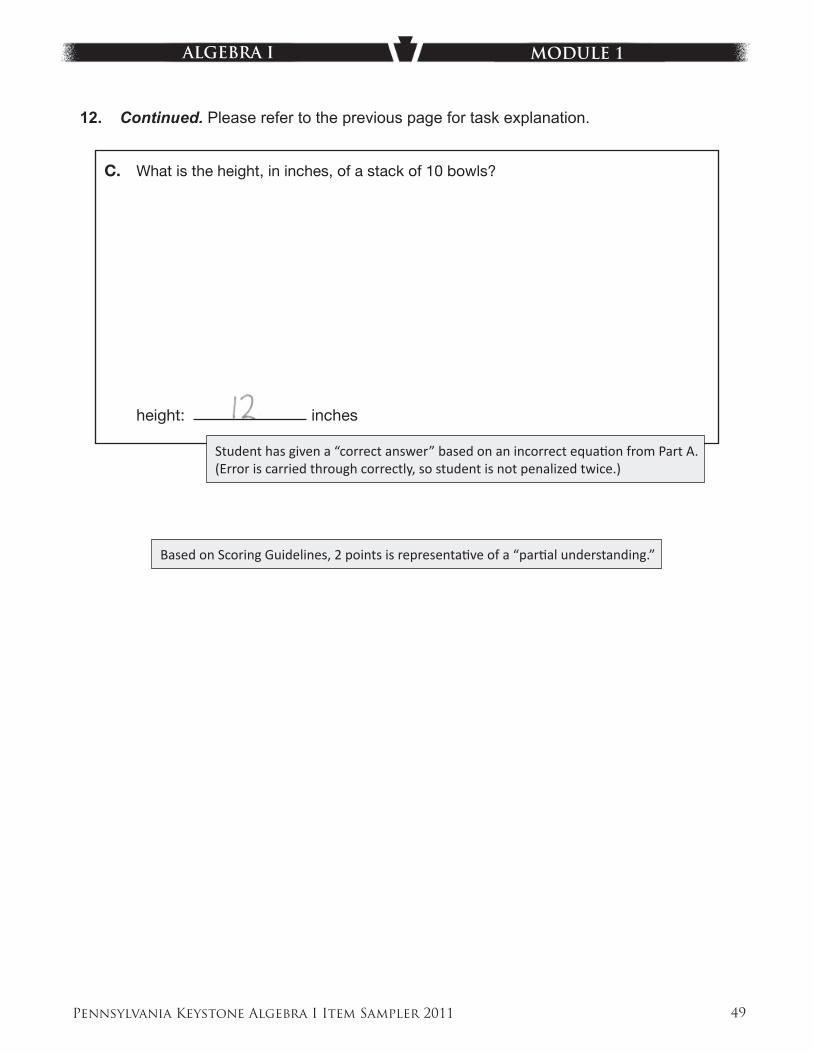
12. Continued. Please refer to the previous page for task explanation.
C. What is the height, in inches, of a stack of 10 bowls?
height: inches
631389
Based on Scoring Guidelines, 2 points is representati ve of a “parti al understanding.”
Student has given a “correct answer” based on an incorrect equati on from Part A. (Error is carried through correctly, so student is not penalized twice.)
Pennsylvania Keystone Algebra I Item Sampler 2011 50
ALGEBRA I MODULE 1
12. The diagram below shows 5 identical bowls stacked one inside the other.
2 inches
5 inches
Bowls
The height of 1 bowl is 2 inches. The height of a stack of 5 bowls is 5 inches.
A. Write an equation using x and y to fi nd the height of a stack of bowls based on any number of bowls.
equation:
B. Describe what the x and y variables represent.
x-variable:
y-variable:
Go to the next page to fi nish question 12.
A1.1.2 Response Score: 1 point
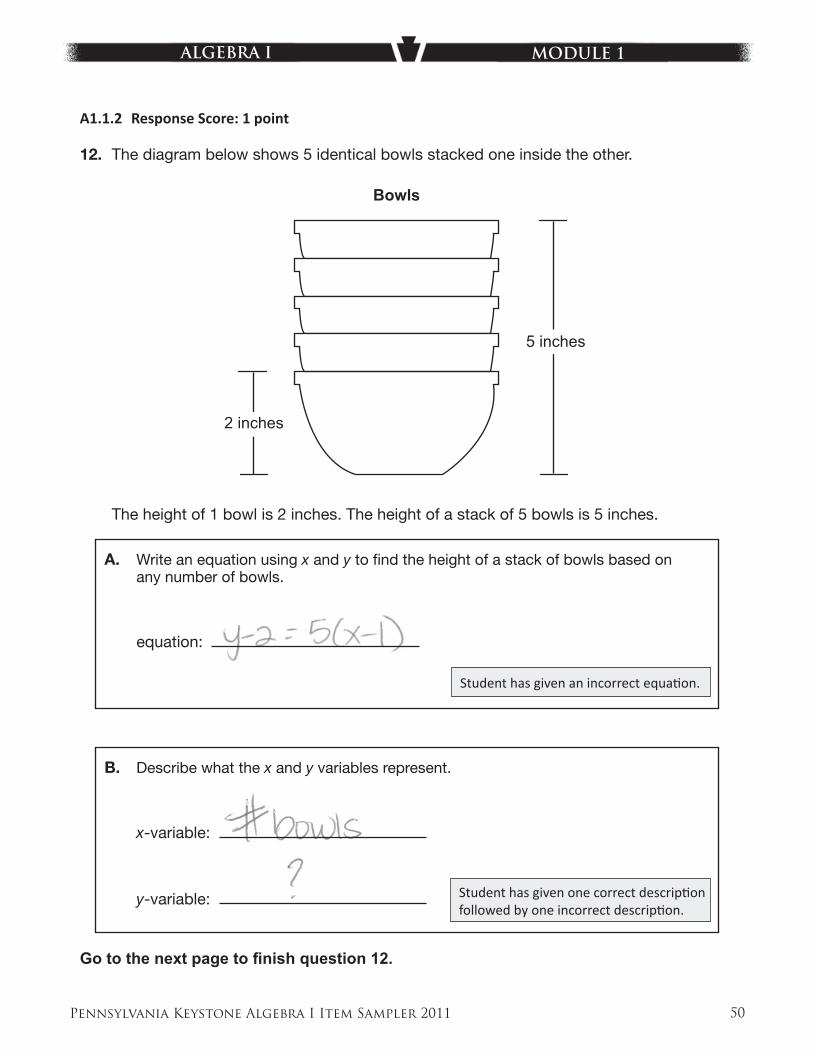
Student has given one correct descripti on followed by one incorrect descripti on.
Student has given an incorrect equati on.
Pennsylvania Keystone Algebra I Item Sampler 2011 51
ALGEBRA I MODULE 1
12. Continued. Please refer to the previous page for task explanation.
C. What is the height, in inches, of a stack of 10 bowls?
height: inches
631389
Student has given an incorrect answer.
Based on Scoring Guidelines, 1 point is representati ve of a “minimal understanding.”
Pennsylvania Keystone Algebra I Item Sampler 2011 52
ALGEBRA I MODULE 1
12. The diagram below shows 5 identical bowls stacked one inside the other.
2 inches
5 inches
Bowls
The height of 1 bowl is 2 inches. The height of a stack of 5 bowls is 5 inches.
A. Write an equation using x and y to fi nd the height of a stack of bowls based on any number of bowls.
equation:
B. Describe what the x and y variables represent.
x-variable:
y-variable:
Go to the next page to fi nish question 12.
A1.1.2 Response Score: 1 point
Student has given an incorrect equati on.
Student has given two incorrect descripti ons.
Pennsylvania Keystone Algebra I Item Sampler 2011 53
ALGEBRA I MODULE 1
12. Continued. Please refer to the previous page for task explanation.
C. What is the height, in inches, of a stack of 10 bowls?
height: inches
631389
Based on Scoring Guidelines, 1 point is representati ve of a “minimal understanding.”
Student has given a correct answer.
Pennsylvania Keystone Algebra I Item Sampler 2011 54
ALGEBRA I MODULE 1
12. The diagram below shows 5 identical bowls stacked one inside the other.
2 inches
5 inches
Bowls
The height of 1 bowl is 2 inches. The height of a stack of 5 bowls is 5 inches.
A. Write an equation using x and y to fi nd the height of a stack of bowls based on any number of bowls.
equation:
B. Describe what the x and y variables represent.
x-variable:
y-variable:
Go to the next page to fi nish question 12.
A1.1.2 Response Score: 0
Student has given an incorrect equati on.
Student has given two incorrect descripti ons.

Pennsylvania Keystone Algebra I Item Sampler 2011 55
ALGEBRA I MODULE 1
12. Continued. Please refer to the previous page for task explanation.
C. What is the height, in inches, of a stack of 10 bowls?
height: inches
631389
Based on Scoring Guidelines, 0 points is representati ve of “no understanding.”
Student has given an incorrect answer.
Pennsylvania Keystone Algebra I Item Sampler 2011 56
ALGEBRA I MODULE 2
MULTIPLE-CHOICE QUESTIONS
A1.2.1.1.2
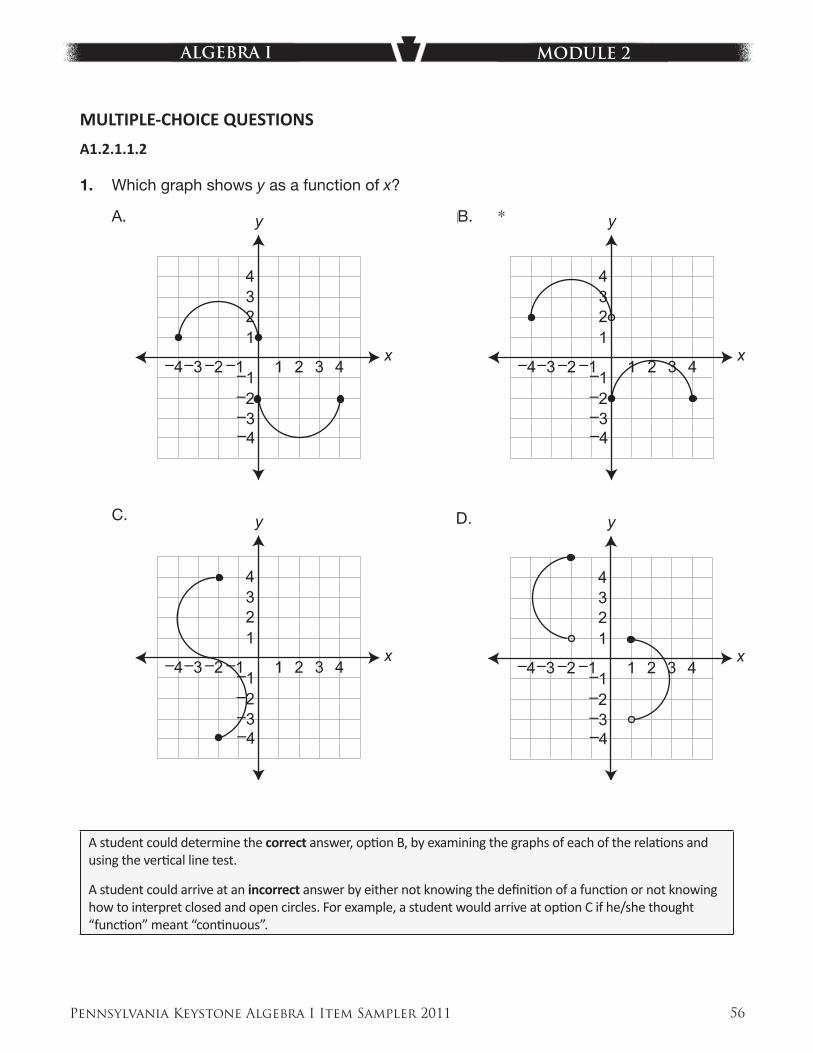
1. Which graph shows y as a function of x?
A.
C.
x
y
21 3 4–2–3–4
–4–3–2
1234
–1–1
B.
x
y
21 3 4–2–3–4
–4–3–2
1234
–1–1
x
y
21 3 4–2–3–4
–4–3–2
1234
–1–1
D.
x
y
21 3 4–2–3–4
–4–3–2
1234
–1–1
B. *
631372
A student could determine the correct answer, opti on B, by examining the graphs of each of the relati ons and using the verti cal line test.
A student could arrive at an incorrect answer by either not knowing the defi niti on of a functi on or not knowing how to interpret closed and open circles. For example, a student would arrive at opti on C if he/she thought “functi on” meant “conti nuous”.
Pennsylvania Keystone Algebra I Item Sampler 2011 57
ALGEBRA I MODULE 2
A1.2.1.1.3
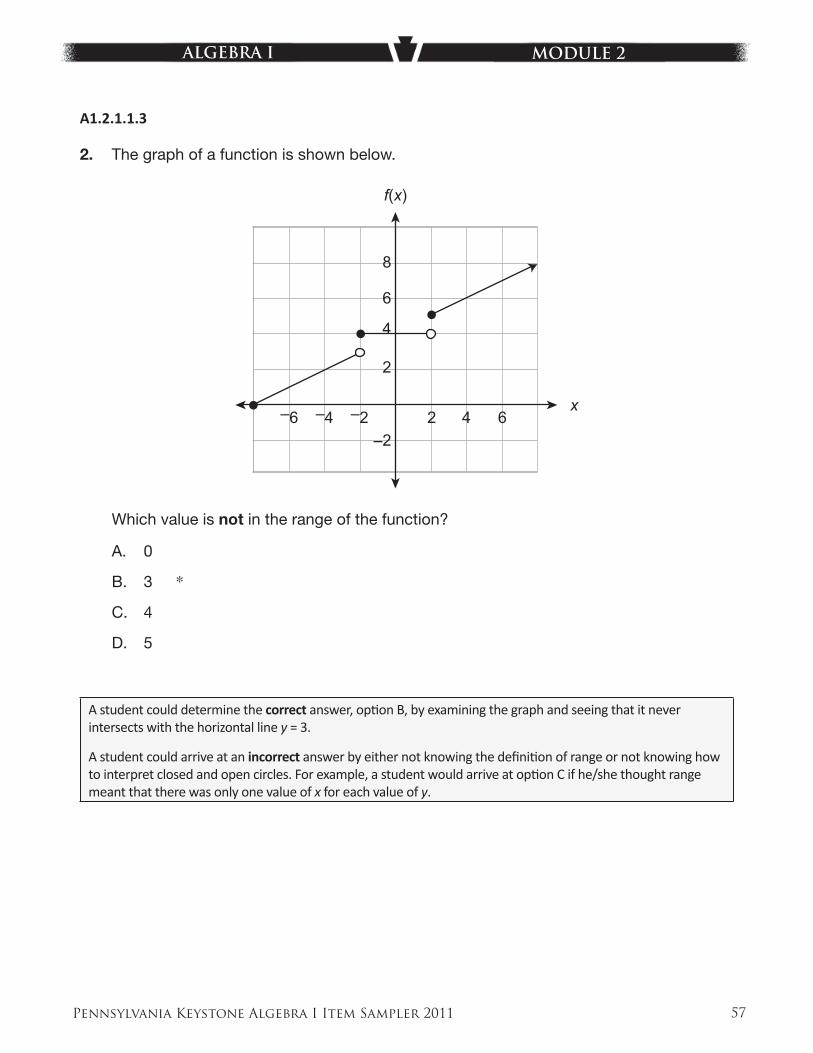
2. The graph of a function is shown below.
x2 4 6–6 –4 –2
8
6
4
2
–2
f(x)
Which value is not in the range of the function?
A. 0
B. 3 *
C. 4
D. 5
631104
A student could determine the correct answer, opti on B, by examining the graph and seeing that it never intersects with the horizontal line y = 3.
A student could arrive at an incorrect answer by either not knowing the defi niti on of range or not knowing how to interpret closed and open circles. For example, a student would arrive at opti on C if he/she thought range meant that there was only one value of x for each value of y.
Pennsylvania Keystone Algebra I Item Sampler 2011 58
ALGEBRA I MODULE 2
A1.2.1.2.1
3. A pizza restaurant charges for pizzas and adds a delivery fee. The cost (c), in dollars, to have any number of pizzas (p) delivered to a home is described by the function c = 8p + 3. Which statement is true?
A. The cost of 8 pizzas is $11.
B. The cost of 3 pizzas is $14.
C. Each pizza costs $8 and the delivery fee is $3. *
D. Each pizza costs $3 and the delivery fee is $8.
631373
A student could determine the correct answer, opti on C, by interpreti ng the linear equati on c = 8p + 3 in the context of the problem situati on.
A student could arrive at an incorrect answer by misinterpreti ng the linear equati on c = 8p + 3 in the context of the problem situati on. For example, a student would arrive at opti on D if he/she interpreted the cost of a pizza to be the y-intercept and the delivery fee to be the slope.
Pennsylvania Keystone Algebra I Item Sampler 2011 59
ALGEBRA I MODULE 2
A1.2.1.2.2
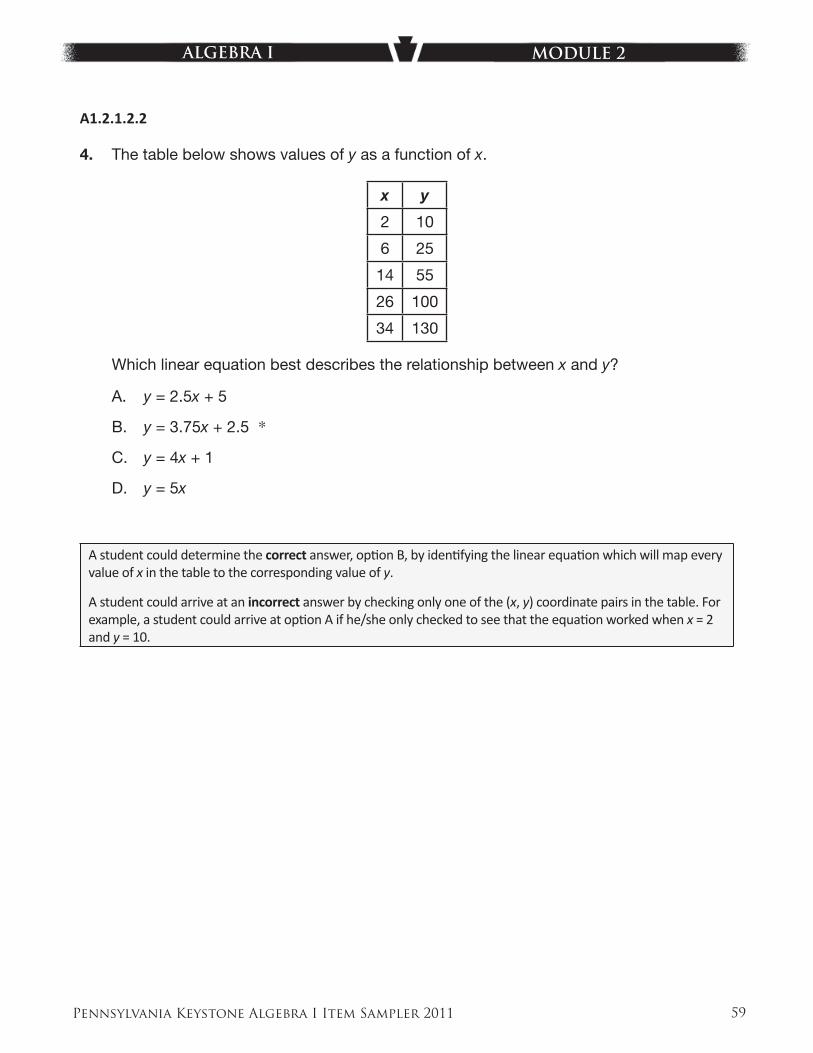
4. The table below shows values of y as a function of x.
x y
2 10
6 25
14 55
26 100
34 130
Which linear equation best describes the relationship between x and y?
A. y = 2.5x + 5
B. y = 3.75x + 2.5 *
C. y = 4x + 1
D. y = 5x
631106
A student could determine the correct answer, opti on B, by identi fying the linear equati on which will map every value of x in the table to the corresponding value of y.
A student could arrive at an incorrect answer by checking only one of the (x, y) coordinate pairs in the table. For example, a student could arrive at opti on A if he/she only checked to see that the equati on worked when x = 2 and y = 10.
Pennsylvania Keystone Algebra I Item Sampler 2011 60
ALGEBRA I MODULE 2
A1.2.2.1.1
5. Jeff’s restaurant sells hamburgers. The amount charged for a hamburger, h, is based on the cost for a plain hamburger plus an additional charge for each topping, t, as shown in the equation below.
h = 0.60t + 5
What does the number 0.60 represent in the equation?
A. the number of toppings
B. the cost of a plain hamburger
C. the additional cost for each topping *
D. the cost of a hamburger with 1 topping
629129
A student could determine the correct answer, opti on C, by interpreti ng the linear equati on h = 0.60t + 5 in the context of the problem situati on.
A student could arrive at an incorrect answer by misinterpreti ng the linear equati on h = 0.60t + 5 in the context of the problem situati on. For example, a student would arrive at opti on A if he/she interpreted the number of toppings to be the rate of change.
Pennsylvania Keystone Algebra I Item Sampler 2011 61
ALGEBRA I MODULE 2
A1.2.2.1.3
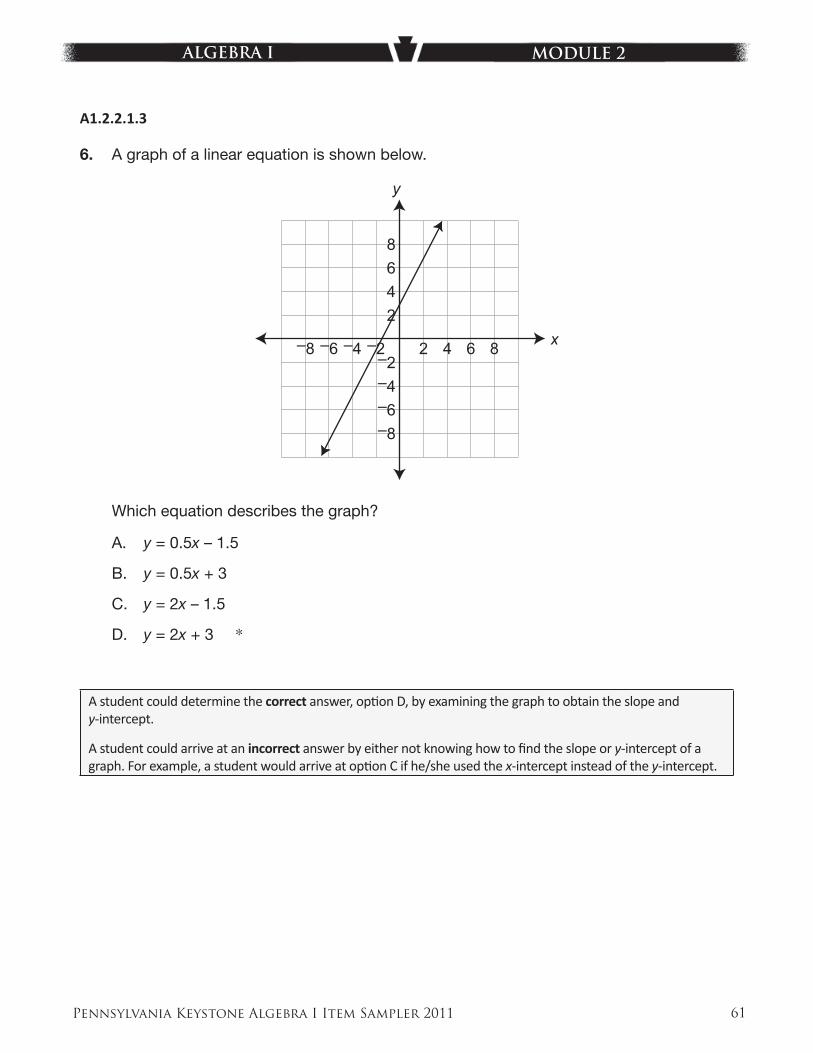
6. A graph of a linear equation is shown below.
x
y
8642
–2–4–6–8
2 4 6 8–8 –6 –4 –2
Which equation describes the graph?
A. y = 0.5x – 1.5
B. y = 0.5x + 3
C. y = 2x – 1.5
D. y = 2x + 3 *
629131
A student could determine the correct answer, opti on D, by examining the graph to obtain the slope and y-intercept.
A student could arrive at an incorrect answer by either not knowing how to fi nd the slope or y-intercept of a graph. For example, a student would arrive at opti on C if he/she used the x-intercept instead of the y-intercept.
Pennsylvania Keystone Algebra I Item Sampler 2011 62
ALGEBRA I MODULE 2
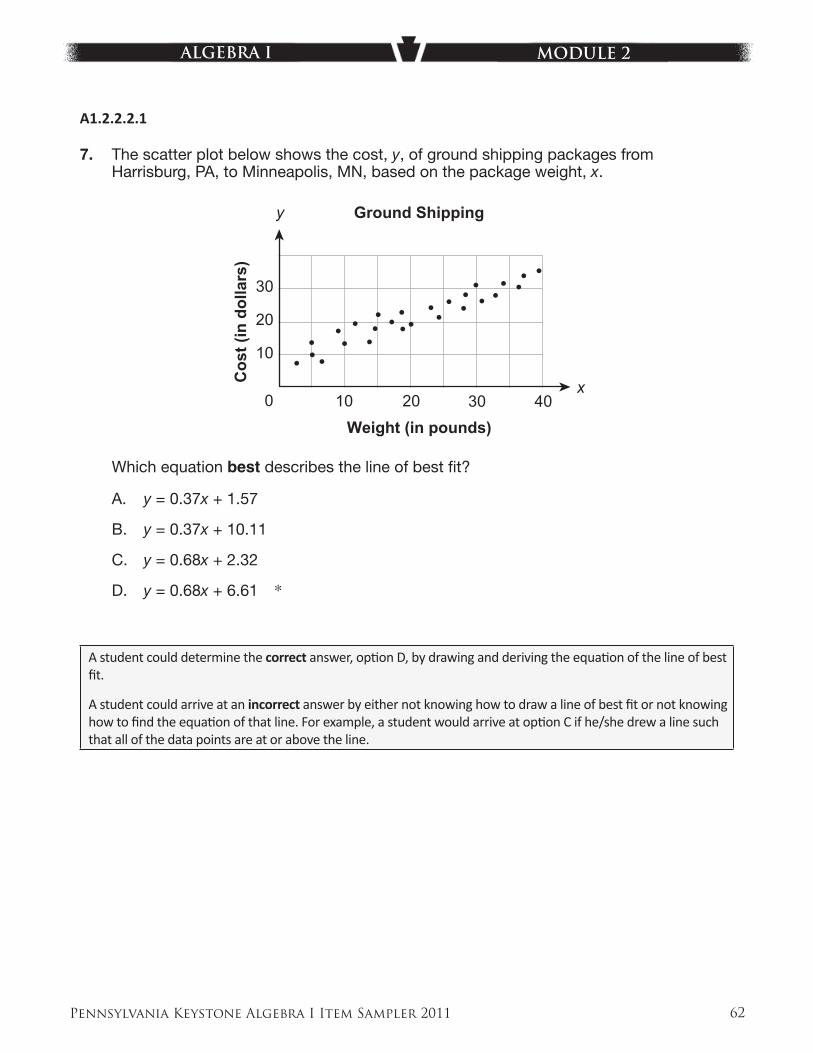
A1.2.2.2.1
7. The scatter plot below shows the cost, y, of ground shipping packages from Harrisburg, PA, to Minneapolis, MN, based on the package weight, x.
x
y
Weight (in pounds)
Cos
t (in
dol
lars
)
10 20 30 40
Ground Shipping
0
30
20
10
Which equation best describes the line of best fi t?
A. y = 0.37x + 1.57
B. y = 0.37x + 10.11
C. y = 0.68x + 2.32
D. y = 0.68x + 6.61 *
630642
A student could determine the correct answer, opti on D, by drawing and deriving the equati on of the line of best fi t.
A student could arrive at an incorrect answer by either not knowing how to draw a line of best fi t or not knowing how to fi nd the equati on of that line. For example, a student would arrive at opti on C if he/she drew a line such that all of the data points are at or above the line.
Pennsylvania Keystone Algebra I Item Sampler 2011 63
ALGEBRA I MODULE 2
A1.2.3.1.1
8. The daily high temperatures in degrees Fahrenheit in Allentown, PA, for a period of 10 days are shown below.
76 80 89 96 98 100 98 91 89 82
Which statement correctly describes the data?
A. The median value is 98.
B. The interquartile range is 16. *
C. The lower quartile value is 76.
D. The upper quartile value is 96.
630643
A student could determine the correct answer, opti on B, by fi nding the diff erence between the third and fi rst quarti le. Arranging the data from lowest to highest shows that the median value is the average of 89 and 91. The third quarti le value is the median of the upper half of the data, 98, and the fi rst quarti le value is the median of the lower half of the data, 82. 98 – 82 = 16.
A student could arrive at an incorrect answer by not knowing how to use or compute median or interquarti le range. For example, a student would arrive at opti on A if he/she confused median and mode.
Pennsylvania Keystone Algebra I Item Sampler 2011 64
ALGEBRA I MODULE 2
A1.2.3.2.1
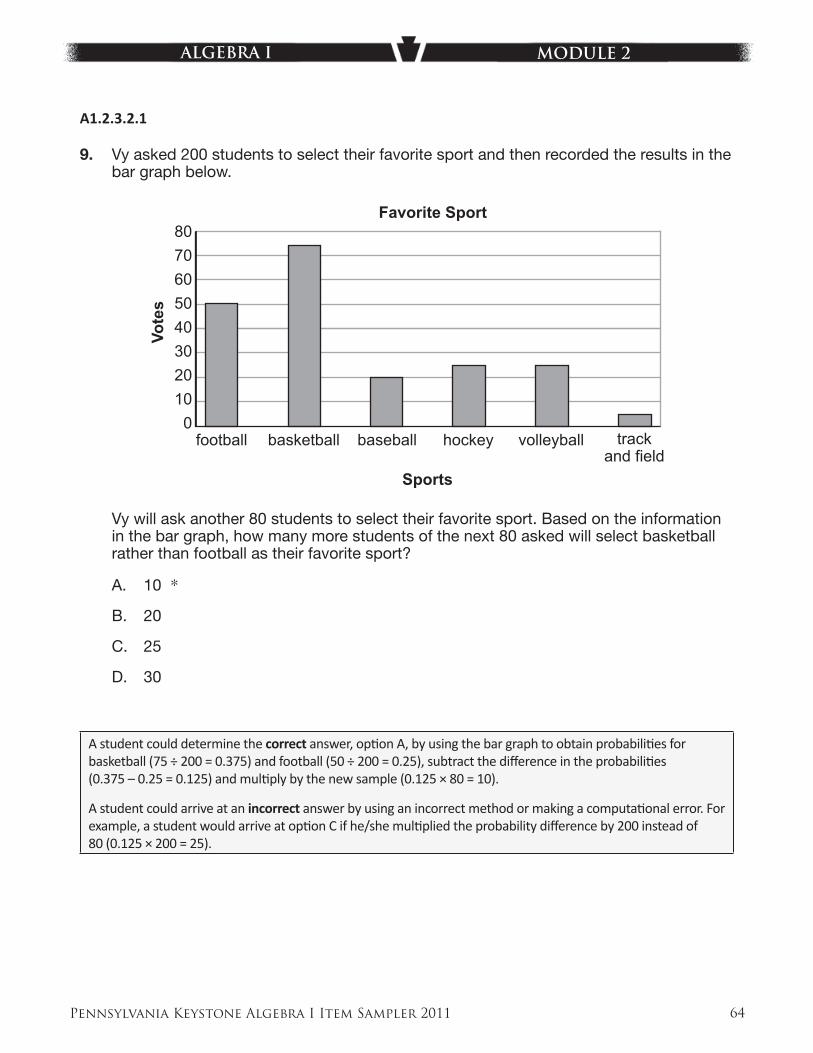
9. Vy asked 200 students to select their favorite sport and then recorded the results in the bar graph below.
Favorite Sport
Sports
Vote
s
8070605040302010
0football basketball baseball hockey volleyball track
and field
Vy will ask another 80 students to select their favorite sport. Based on the information in the bar graph, how many more students of the next 80 asked will select basketball rather than football as their favorite sport?
A. 10 *
B. 20
C. 25
D. 30
630644
A student could determine the correct answer, opti on A, by using the bar graph to obtain probabiliti es for basketball (75 ÷ 200 = 0.375) and football (50 ÷ 200 = 0.25), subtract the diff erence in the probabiliti es (0.375 – 0.25 = 0.125) and multi ply by the new sample (0.125 × 80 = 10).
A student could arrive at an incorrect answer by using an incorrect method or making a computati onal error. For example, a student would arrive at opti on C if he/she multi plied the probability diff erence by 200 instead of 80 (0.125 × 200 = 25).
Pennsylvania Keystone Algebra I Item Sampler 2011 65
ALGEBRA I MODULE 2
A1.2.3.3.1
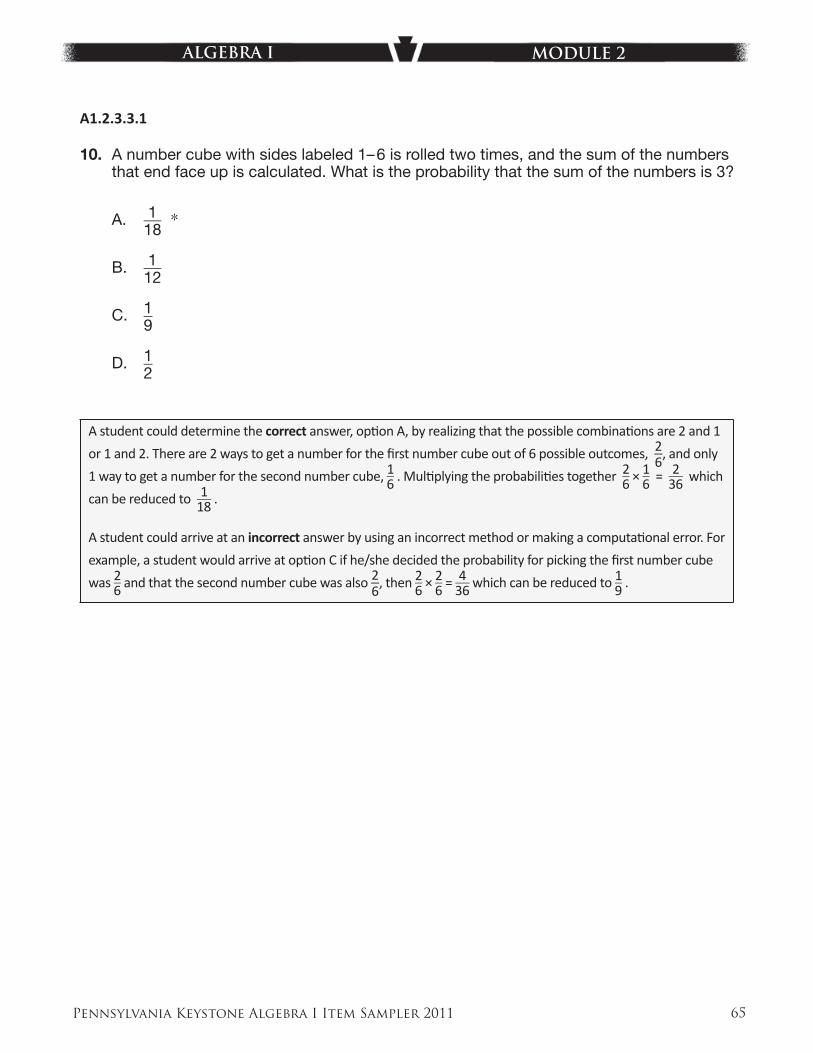
10. A number cube with sides labeled 1– 6 is rolled two times, and the sum of the numbers that end face up is calculated. What is the probability that the sum of the numbers is 3?
A. 1 } 18
*
B. 1 } 12
C. 1 } 9
D. 1 } 2
629138
A student could determine the correct answer, opti on A, by realizing that the possible combinati ons are 2 and 1
or 1 and 2. There are 2 ways to get a number for the fi rst number cube out of 6 possible outcomes, 2 __ 6
, and only
1 way to get a number for the second number cube, 1 } 6 . Multi plying the probabiliti es together 2 } 6 × 1 } 6 = 2 } 36 which
can be reduced to 1 } 18 .
A student could arrive at an incorrect answer by using an incorrect method or making a computati onal error. For
example, a student would arrive at opti on C if he/she decided the probability for picking the fi rst number cube
was 2 } 6 and that the second number cube was also 2 __ 6
, then 2 } 6 × 2 } 6 = 4 } 36 which can be reduced to 1 } 9 .
Pennsylvania Keystone Algebra I Item Sampler 2011 66
ALGEBRA I MODULE 2
CONSTRUCTED-RESPONSE QUESTIONS
A1.2.1
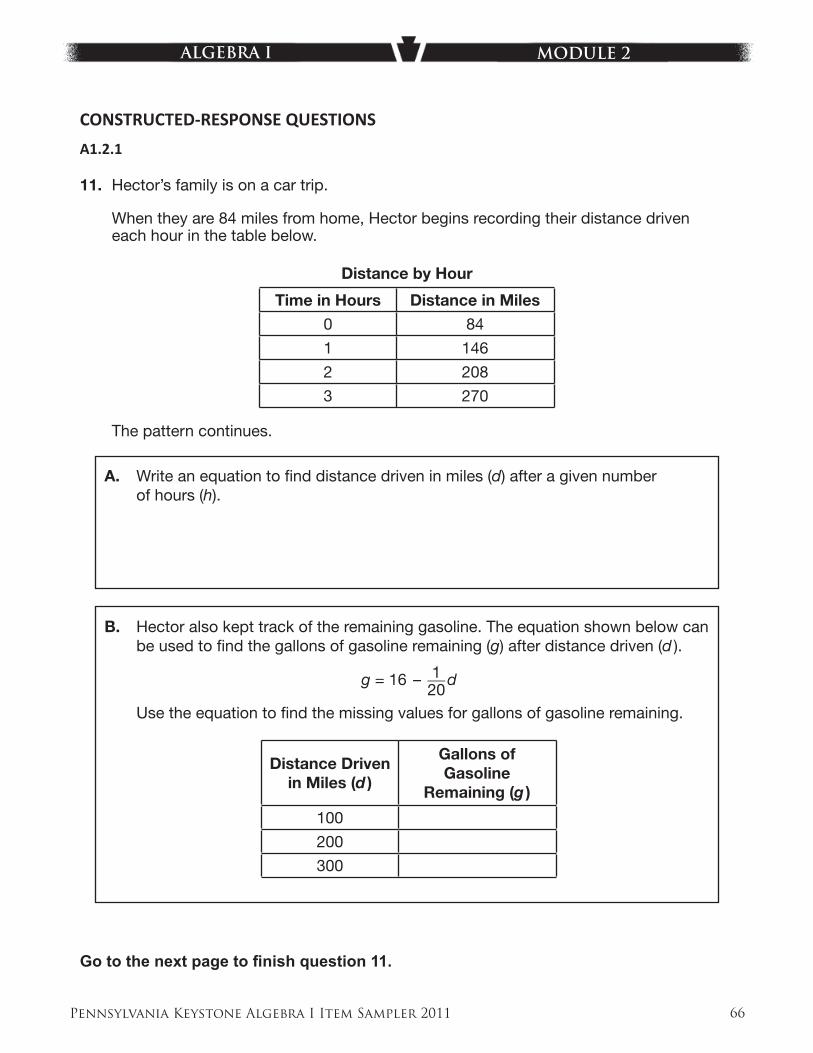
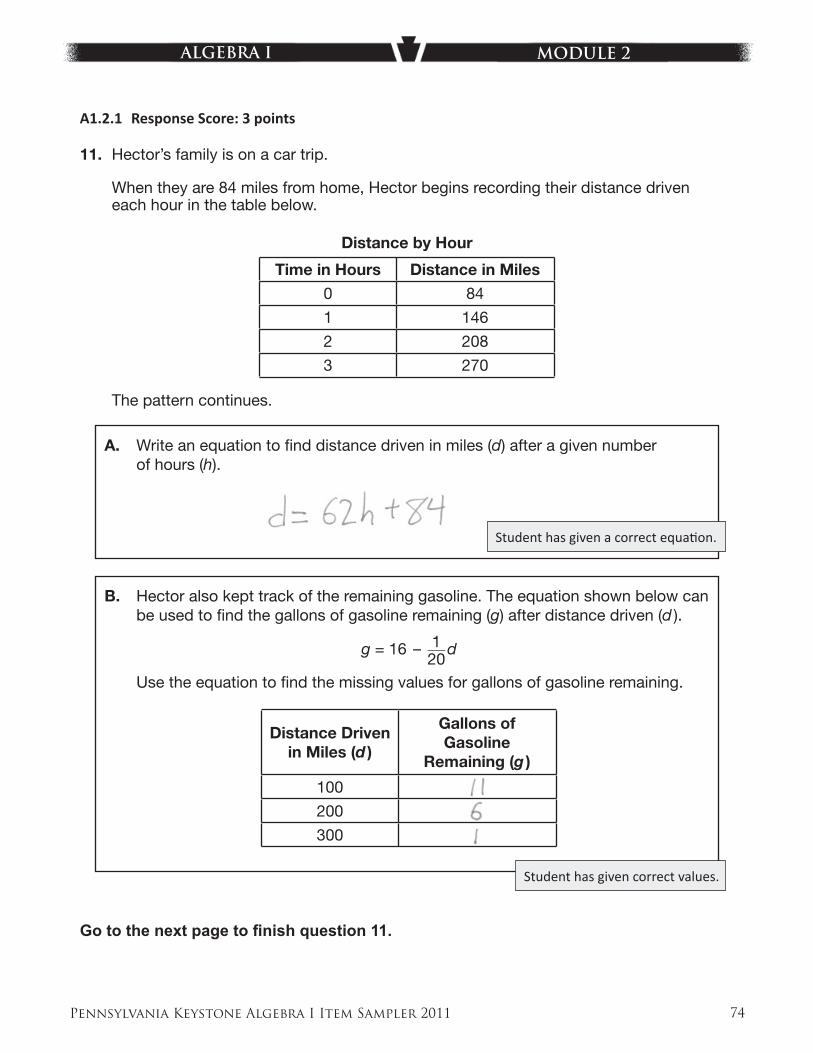
11. Hector’s family is on a car trip.
When they are 84 miles from home, Hector begins recording their distance driven each hour in the table below.
Distance by Hour
Time in Hours Distance in Miles
0 84
1 146
2 208
3 270
The pattern continues.
A. Write an equation to fi nd distance driven in miles (d) after a given number of hours (h).
B. Hector also kept track of the remaining gasoline. The equation shown below can be used to fi nd the gallons of gasoline remaining (g) after distance driven (d ).
g = 16 – 1 } 20
d
Use the equation to fi nd the missing values for gallons of gasoline remaining.
Distance Drivenin Miles (d )
Gallons of Gasoline
Remaining (g )
100
200
300
Go to the next page to fi nish question 11.
Pennsylvania Keystone Algebra I Item Sampler 2011 67
ALGEBRA I MODULE 2
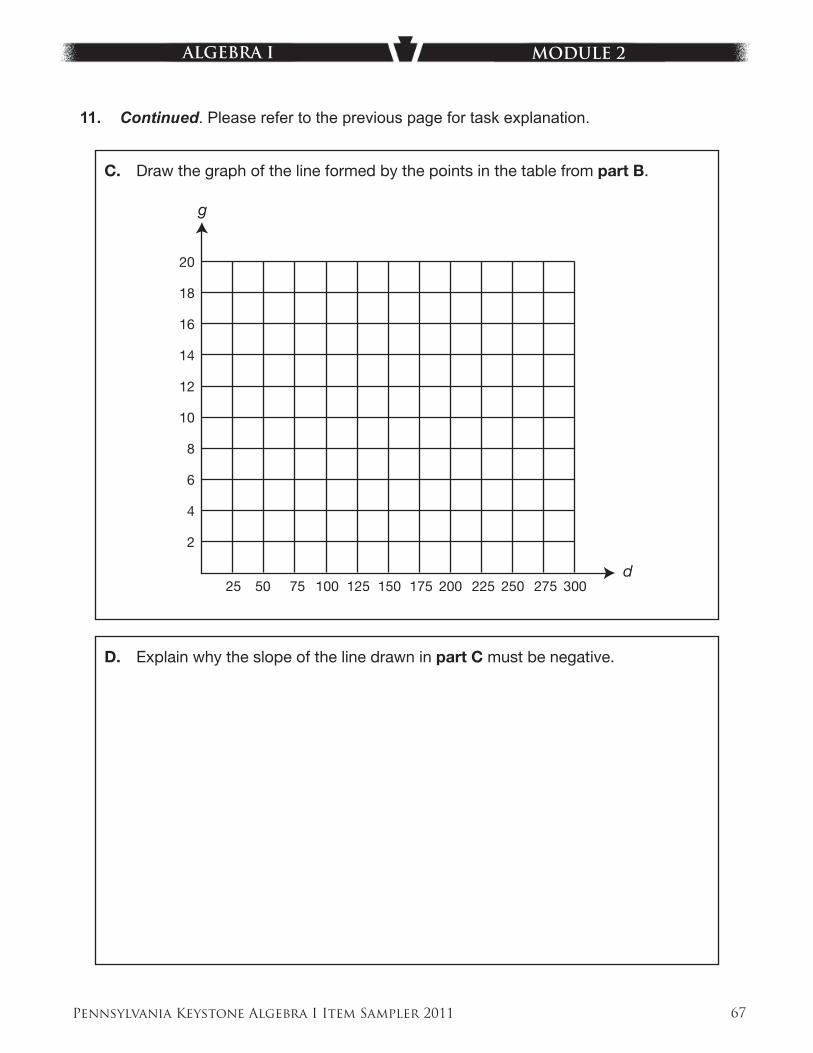
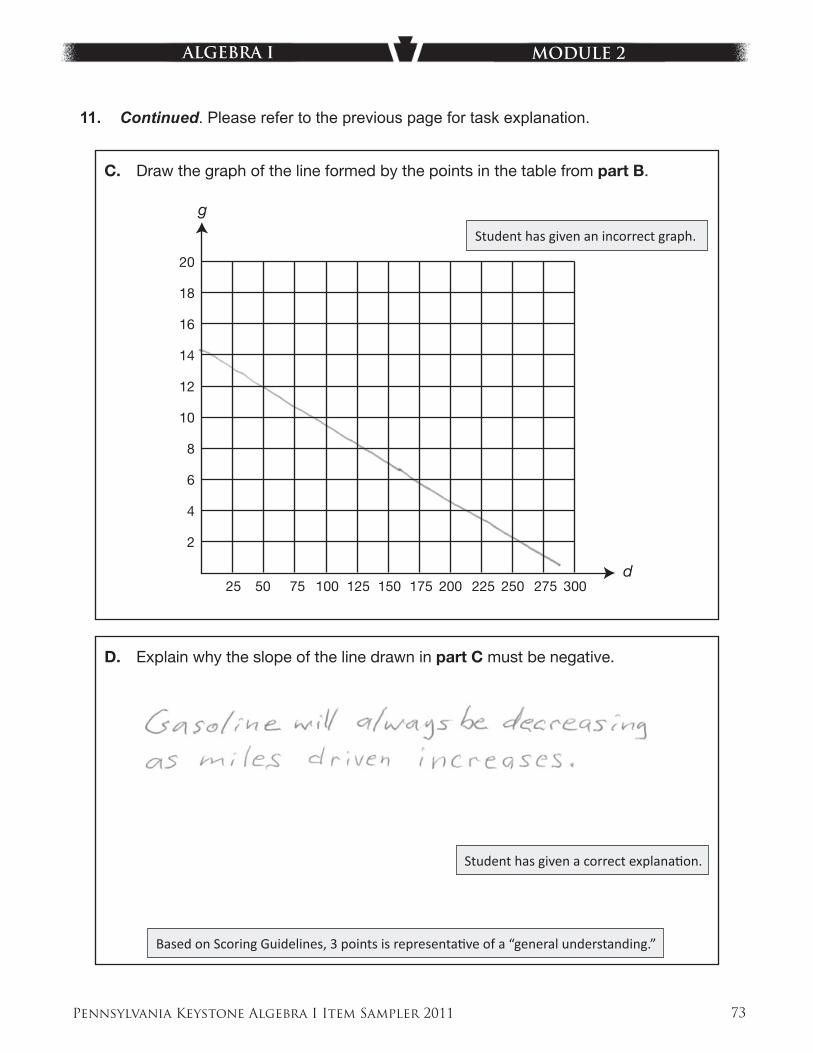
11. Continued. Please refer to the previous page for task explanation.
C. Draw the graph of the line formed by the points in the table from part B.
g
d25 50 75 100 125 150 175 200 225 250 275 300
20
18
16
14
12
10
8
6
4
2
D. Explain why the slope of the line drawn in part C must be negative.
610629
Pennsylvania Keystone Algebra I Item Sampler 2011 68
ALGEBRA I MODULE 2
ITEM-SPECIFIC SCORING GUIDELINE
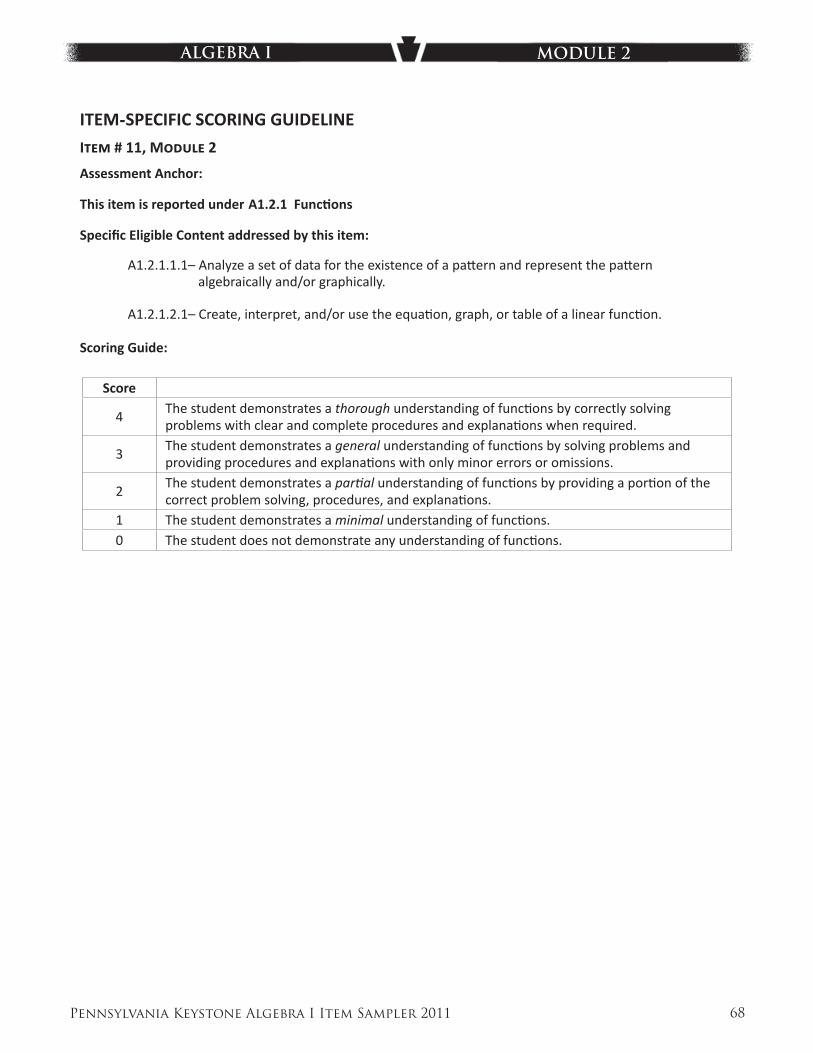
ITEM # 11, MODULE 2
Assessment Anchor:
This item is reported under A1.2.1 Functi ons
Specifi c Eligible Content addressed by this item:
A1.2.1.1.1– Analyze a set of data for the existence of a patt ern and represent the patt ern algebraically and/or graphically.
A1.2.1.2.1– Create, interpret, and/or use the equati on, graph, or table of a linear functi on.
Scoring Guide:
Score
4The student demonstrates a thorough understanding of functi ons by correctly solving problems with clear and complete procedures and explanati ons when required.
3The student demonstrates a general understanding of functi ons by solving problems and providing procedures and explanati ons with only minor errors or omissions.
2The student demonstrates a parti al understanding of functi ons by providing a porti on of the correct problem solving, procedures, and explanati ons.
1 The student demonstrates a minimal understanding of functi ons.0 The student does not demonstrate any understanding of functi ons.
Pennsylvania Keystone Algebra I Item Sampler 2011 69
ALGEBRA I MODULE 2
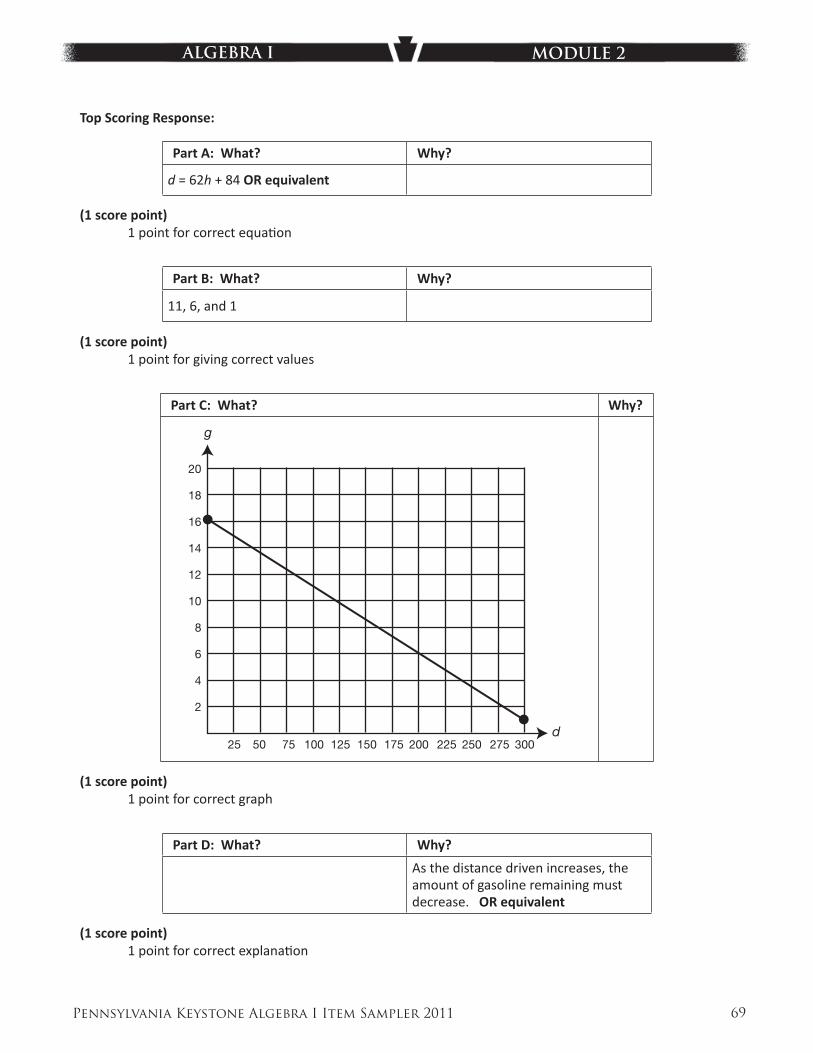
Top Scoring Response:
Part A: What? Why?
d = 62h + 84 OR equivalent
(1 score point)1 point for correct equati on
Part B: What? Why?
11, 6, and 1
(1 score point)1 point for giving correct values
Part C: What? Why?
g
d25 50 75 100 125 150 175 200 225 250 275 300
20
18
16
14
12
10
8
6
4
2
(1 score point)1 point for correct graph
Part D: What? Why?
As the distance driven increases, the amount of gasoline remaining must decrease. OR equivalent
(1 score point)1 point for correct explanati on
Pennsylvania Keystone Algebra I Item Sampler 2011 70
ALGEBRA I MODULE 2
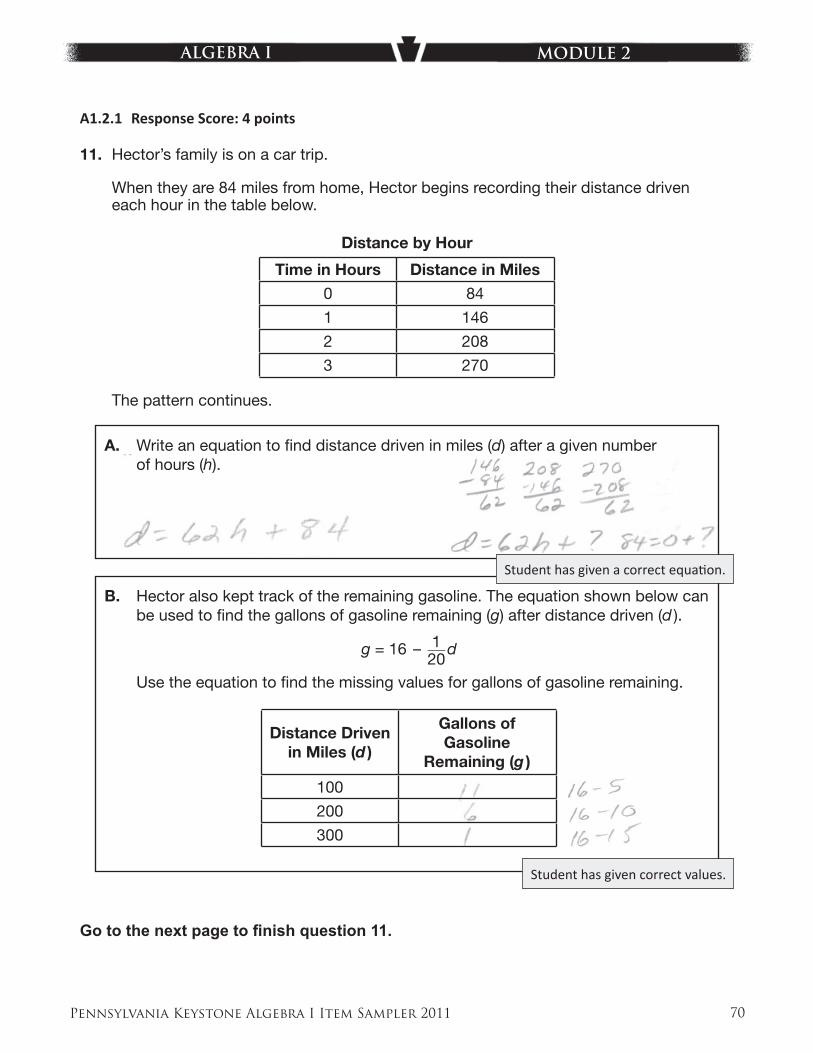
11. Hector’s family is on a car trip.
When they are 84 miles from home, Hector begins recording their distance driven each hour in the table below.
Distance by Hour
Time in Hours Distance in Miles
0 84
1 146
2 208
3 270
The pattern continues.
A. Write an equation to fi nd distance driven in miles (d) after a given number of hours (h).
B. Hector also kept track of the remaining gasoline. The equation shown below can be used to fi nd the gallons of gasoline remaining (g) after distance driven (d ).
g = 16 – 1 } 20
d
Use the equation to fi nd the missing values for gallons of gasoline remaining.
Distance Drivenin Miles (d )
Gallons of Gasoline
Remaining (g )
100
200
300
Go to the next page to fi nish question 11.
A1.2.1 Response Score: 4 points
Student has given a correct equati on.
Student has given correct values.
Pennsylvania Keystone Algebra I Item Sampler 2011 71
ALGEBRA I MODULE 2
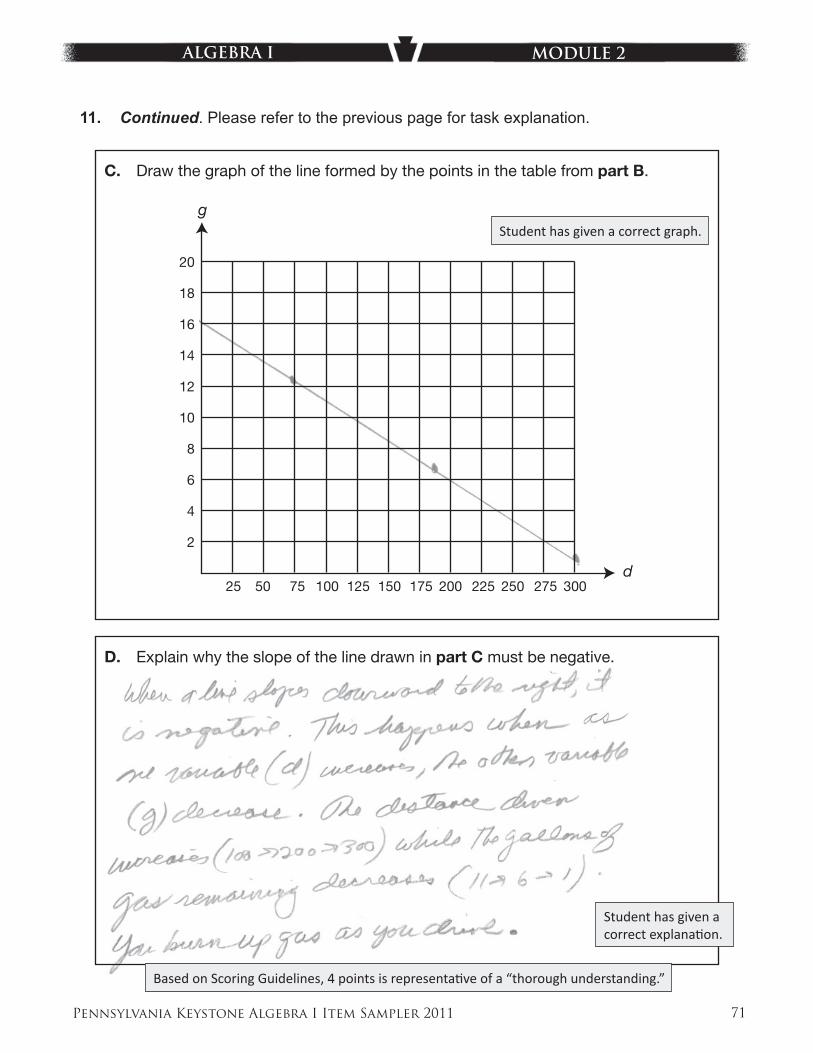
11. Continued. Please refer to the previous page for task explanation.
C. Draw the graph of the line formed by the points in the table from part B.
g
d25 50 75 100 125 150 175 200 225 250 275 300
20
18
16
14
12
10
8
6
4
2
D. Explain why the slope of the line drawn in part C must be negative.
Based on Scoring Guidelines, 4 points is representati ve of a “thorough understanding.”
Student has given a correct graph.
Student has given a correct explanati on.

Pennsylvania Keystone Algebra I Item Sampler 2011 72
ALGEBRA I MODULE 2
11. Hector’s family is on a car trip.
When they are 84 miles from home, Hector begins recording their distance driven each hour in the table below.
Distance by Hour
Time in Hours Distance in Miles
0 84
1 146
2 208
3 270
The pattern continues.
A. Write an equation to fi nd distance driven in miles (d) after a given number of hours (h).
B. Hector also kept track of the remaining gasoline. The equation shown below can be used to fi nd the gallons of gasoline remaining (g) after distance driven (d ).
g = 16 – 1 } 20
d
Use the equation to fi nd the missing values for gallons of gasoline remaining.
Distance Drivenin Miles (d )
Gallons of Gasoline
Remaining (g )
100
200
300
Go to the next page to fi nish question 11.
A1.2.1 Response Score: 3 points
Student has given a correct equati on.
Student has given correct values.
Pennsylvania Keystone Algebra I Item Sampler 2011 73
ALGEBRA I MODULE 2
11. Continued. Please refer to the previous page for task explanation.
C. Draw the graph of the line formed by the points in the table from part B.
g
d25 50 75 100 125 150 175 200 225 250 275 300
20
18
16
14
12
10
8
6
4
2
D. Explain why the slope of the line drawn in part C must be negative.
Student has given a correct explanati on.
Student has given an incorrect graph.
Based on Scoring Guidelines, 3 points is representati ve of a “general understanding.”
Pennsylvania Keystone Algebra I Item Sampler 2011 74
ALGEBRA I MODULE 2
11. Hector’s family is on a car trip.
When they are 84 miles from home, Hector begins recording their distance driven each hour in the table below.
Distance by Hour
Time in Hours Distance in Miles
0 84
1 146
2 208
3 270
The pattern continues.
A. Write an equation to fi nd distance driven in miles (d) after a given number of hours (h).
B. Hector also kept track of the remaining gasoline. The equation shown below can be used to fi nd the gallons of gasoline remaining (g) after distance driven (d ).
g = 16 – 1 } 20
d
Use the equation to fi nd the missing values for gallons of gasoline remaining.
Distance Drivenin Miles (d )
Gallons of Gasoline
Remaining (g )
100
200
300
Go to the next page to fi nish question 11.
A1.2.1 Response Score: 3 points
Student has given a correct equati on.
Student has given correct values.
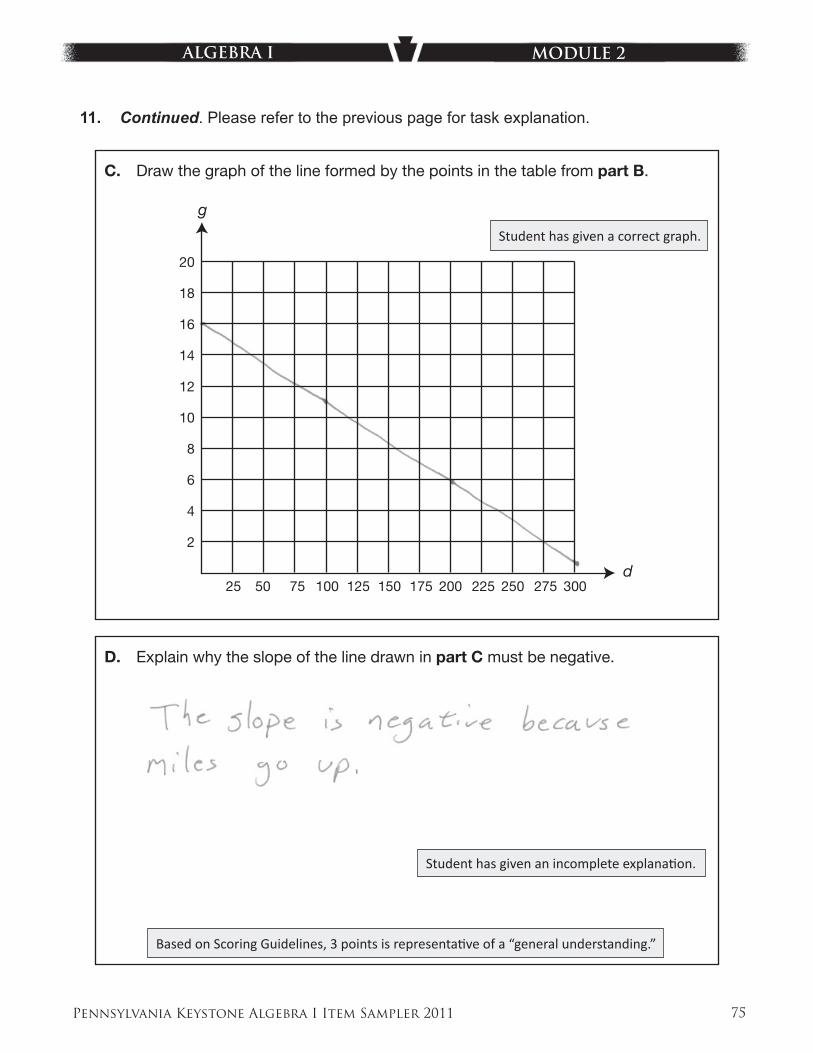
Pennsylvania Keystone Algebra I Item Sampler 2011 75
ALGEBRA I MODULE 2
11. Continued. Please refer to the previous page for task explanation.
C. Draw the graph of the line formed by the points in the table from part B.
g
d25 50 75 100 125 150 175 200 225 250 275 300
20
18
16
14
12
10
8
6
4
2
D. Explain why the slope of the line drawn in part C must be negative.
Student has given a correct graph.
Student has given an incomplete explanati on.
Based on Scoring Guidelines, 3 points is representati ve of a “general understanding.”
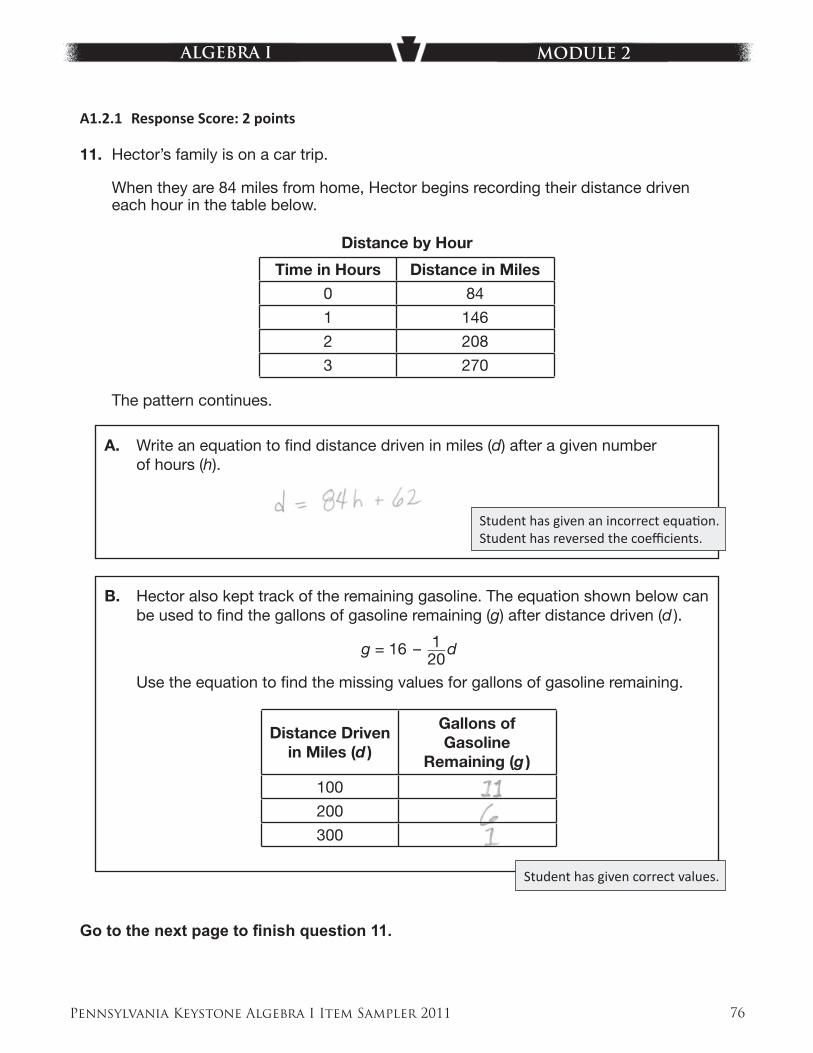
Pennsylvania Keystone Algebra I Item Sampler 2011 76
ALGEBRA I MODULE 2
11. Hector’s family is on a car trip.
When they are 84 miles from home, Hector begins recording their distance driven each hour in the table below.
Distance by Hour
Time in Hours Distance in Miles
0 84
1 146
2 208
3 270
The pattern continues.
A. Write an equation to fi nd distance driven in miles (d) after a given number of hours (h).
B. Hector also kept track of the remaining gasoline. The equation shown below can be used to fi nd the gallons of gasoline remaining (g) after distance driven (d ).
g = 16 – 1 } 20
d
Use the equation to fi nd the missing values for gallons of gasoline remaining.
Distance Drivenin Miles (d )
Gallons of Gasoline
Remaining (g )
100
200
300
Go to the next page to fi nish question 11.
A1.2.1 Response Score: 2 points
Student has given an incorrect equati on. Student has reversed the coeffi cients.
Student has given correct values.
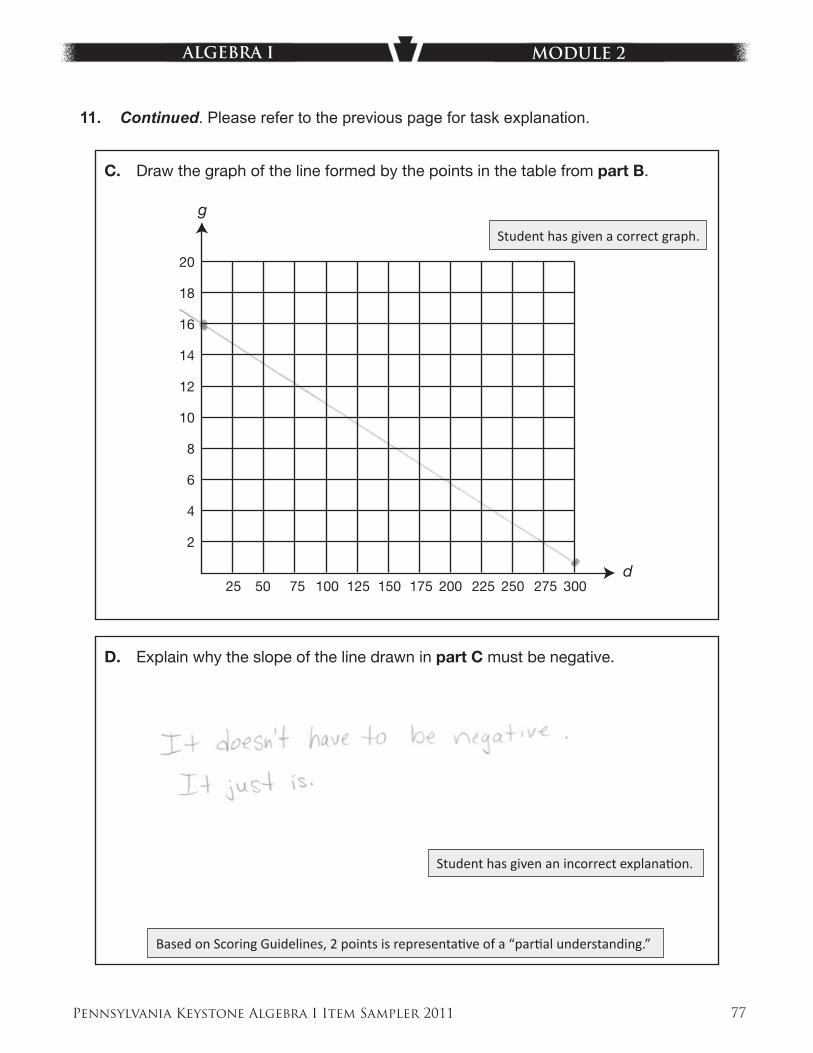
Pennsylvania Keystone Algebra I Item Sampler 2011 77
ALGEBRA I MODULE 2
11. Continued. Please refer to the previous page for task explanation.
C. Draw the graph of the line formed by the points in the table from part B.
g
d25 50 75 100 125 150 175 200 225 250 275 300
20
18
16
14
12
10
8
6
4
2
D. Explain why the slope of the line drawn in part C must be negative.
Student has given a correct graph.
Student has given an incorrect explanati on.
Based on Scoring Guidelines, 2 points is representati ve of a “parti al understanding.”
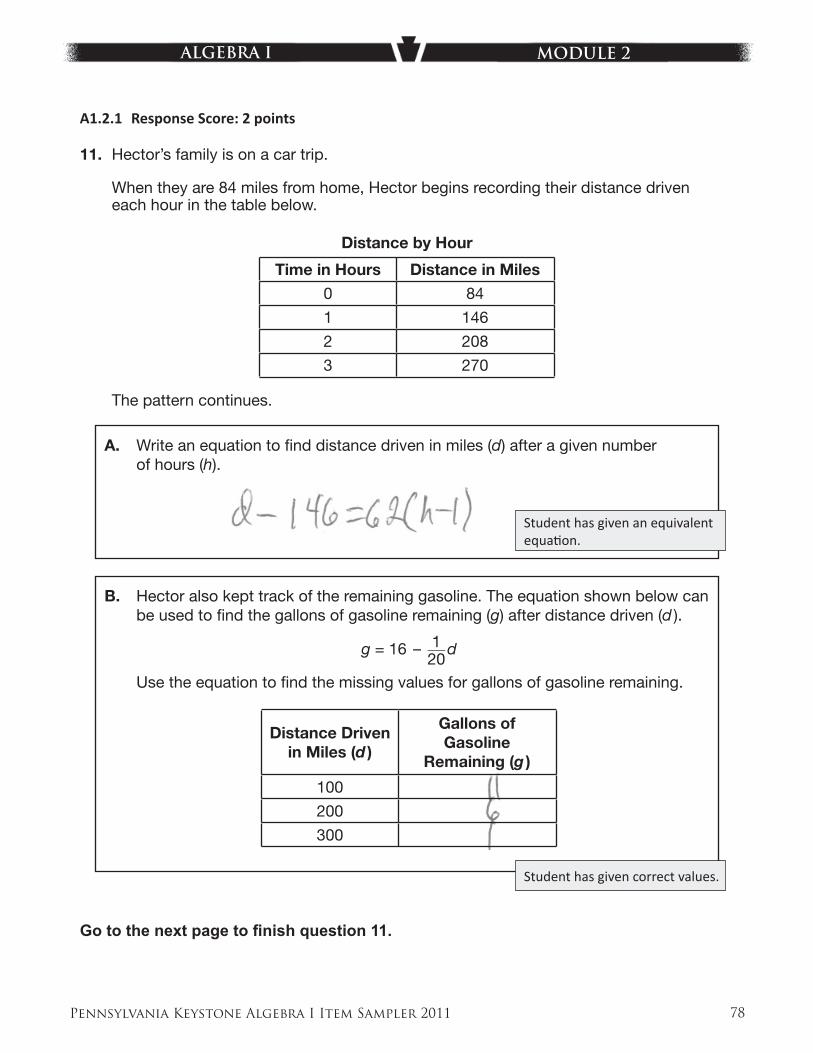
Pennsylvania Keystone Algebra I Item Sampler 2011 78
ALGEBRA I MODULE 2
11. Hector’s family is on a car trip.
When they are 84 miles from home, Hector begins recording their distance driven each hour in the table below.
Distance by Hour
Time in Hours Distance in Miles
0 84
1 146
2 208
3 270
The pattern continues.
A. Write an equation to fi nd distance driven in miles (d) after a given number of hours (h).
B. Hector also kept track of the remaining gasoline. The equation shown below can be used to fi nd the gallons of gasoline remaining (g) after distance driven (d ).
g = 16 – 1 } 20
d
Use the equation to fi nd the missing values for gallons of gasoline remaining.
Distance Drivenin Miles (d )
Gallons of Gasoline
Remaining (g )
100
200
300
Go to the next page to fi nish question 11.
A1.2.1 Response Score: 2 points
Student has given correct values.
Student has given an equivalent equati on.
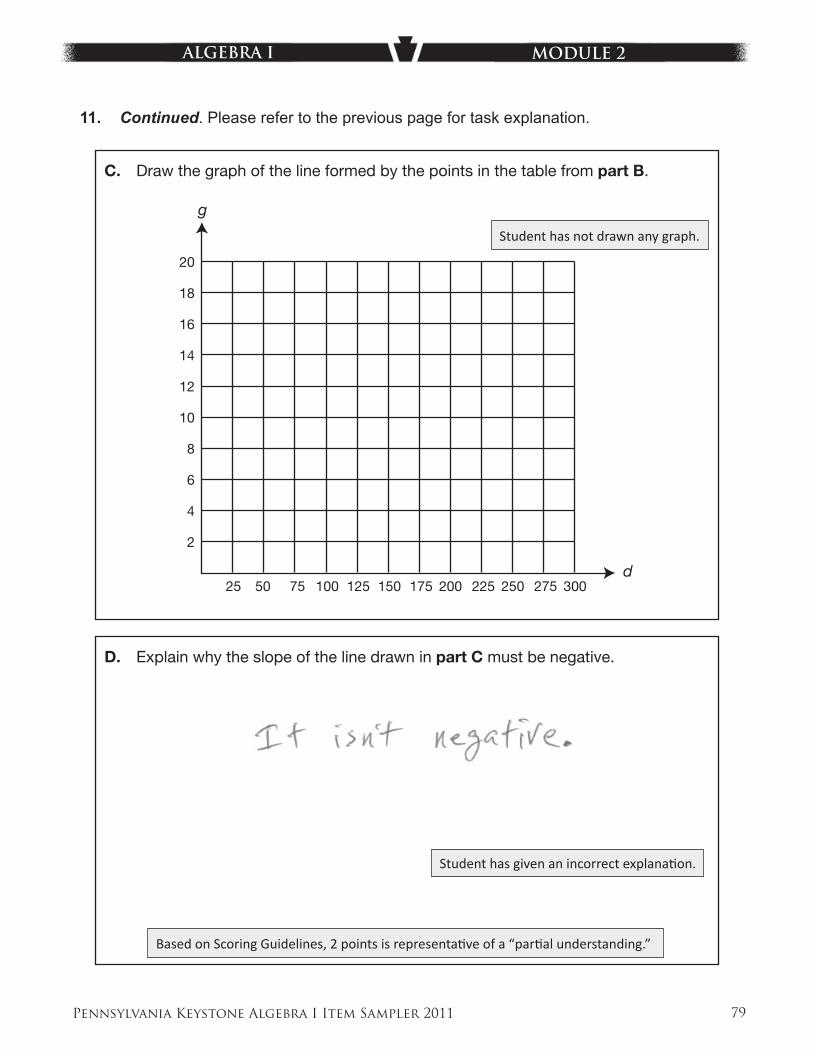
Pennsylvania Keystone Algebra I Item Sampler 2011 79
ALGEBRA I MODULE 2
11. Continued. Please refer to the previous page for task explanation.
C. Draw the graph of the line formed by the points in the table from part B.
g
d25 50 75 100 125 150 175 200 225 250 275 300
20
18
16
14
12
10
8
6
4
2
D. Explain why the slope of the line drawn in part C must be negative.
Student has not drawn any graph.
Student has given an incorrect explanati on.
Based on Scoring Guidelines, 2 points is representati ve of a “parti al understanding.”
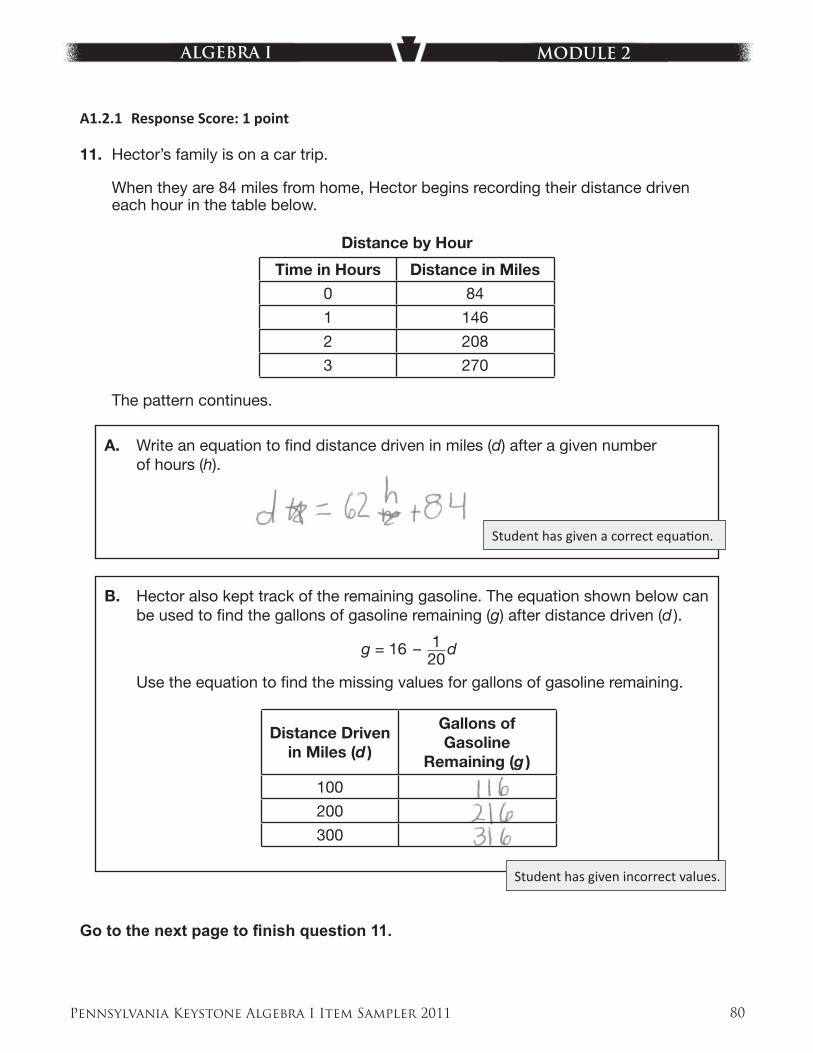
Pennsylvania Keystone Algebra I Item Sampler 2011 80
ALGEBRA I MODULE 2
11. Hector’s family is on a car trip.
When they are 84 miles from home, Hector begins recording their distance driven each hour in the table below.
Distance by Hour
Time in Hours Distance in Miles
0 84
1 146
2 208
3 270
The pattern continues.
A. Write an equation to fi nd distance driven in miles (d) after a given number of hours (h).
B. Hector also kept track of the remaining gasoline. The equation shown below can be used to fi nd the gallons of gasoline remaining (g) after distance driven (d ).
g = 16 – 1 } 20
d
Use the equation to fi nd the missing values for gallons of gasoline remaining.
Distance Drivenin Miles (d )
Gallons of Gasoline
Remaining (g )
100
200
300
Go to the next page to fi nish question 11.
A1.2.1 Response Score: 1 point
Student has given incorrect values.
Student has given a correct equati on.
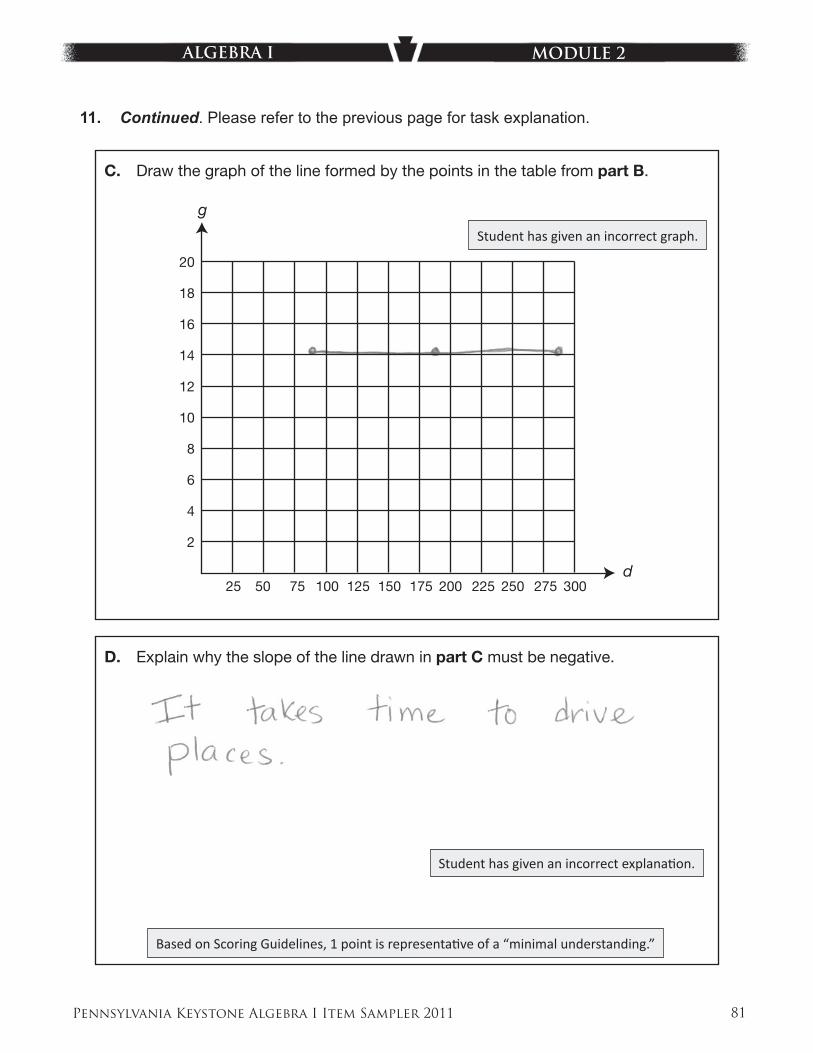
Pennsylvania Keystone Algebra I Item Sampler 2011 81
ALGEBRA I MODULE 2
11. Continued. Please refer to the previous page for task explanation.
C. Draw the graph of the line formed by the points in the table from part B.
g
d25 50 75 100 125 150 175 200 225 250 275 300
20
18
16
14
12
10
8
6
4
2
D. Explain why the slope of the line drawn in part C must be negative.
Student has given an incorrect graph.
Student has given an incorrect explanati on.
Based on Scoring Guidelines, 1 point is representati ve of a “minimal understanding.”
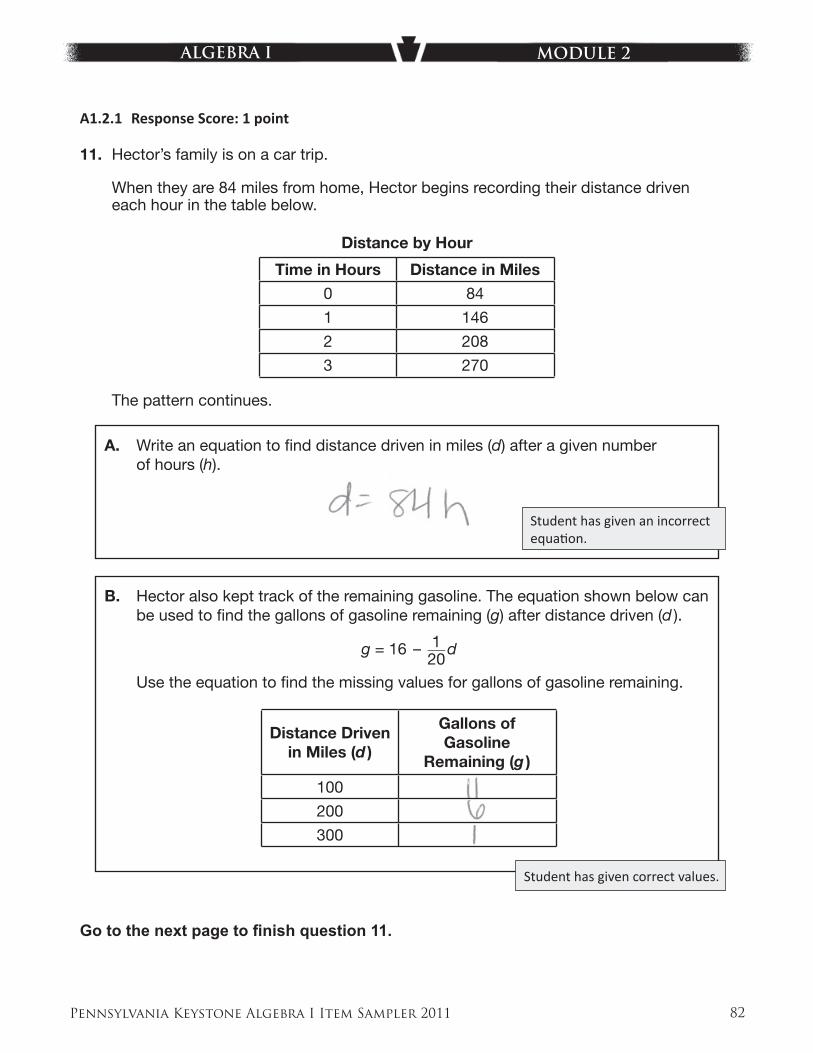
Pennsylvania Keystone Algebra I Item Sampler 2011 82
ALGEBRA I MODULE 2
11. Hector’s family is on a car trip.
When they are 84 miles from home, Hector begins recording their distance driven each hour in the table below.
Distance by Hour
Time in Hours Distance in Miles
0 84
1 146
2 208
3 270
The pattern continues.
A. Write an equation to fi nd distance driven in miles (d) after a given number of hours (h).
B. Hector also kept track of the remaining gasoline. The equation shown below can be used to fi nd the gallons of gasoline remaining (g) after distance driven (d ).
g = 16 – 1 } 20
d
Use the equation to fi nd the missing values for gallons of gasoline remaining.
Distance Drivenin Miles (d )
Gallons of Gasoline
Remaining (g )
100
200
300
Go to the next page to fi nish question 11.
A1.2.1 Response Score: 1 point
Student has given correct values.
Student has given an incorrect equati on.
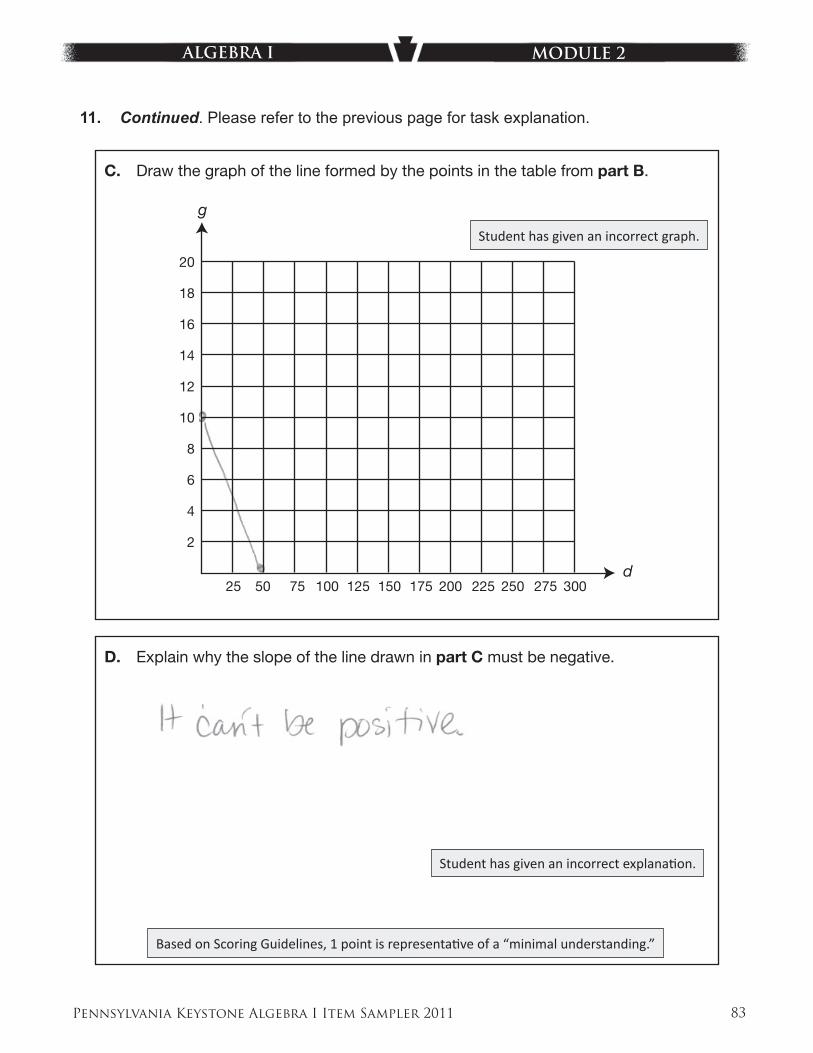
Pennsylvania Keystone Algebra I Item Sampler 2011 83
ALGEBRA I MODULE 2
11. Continued. Please refer to the previous page for task explanation.
C. Draw the graph of the line formed by the points in the table from part B.
g
d25 50 75 100 125 150 175 200 225 250 275 300
20
18
16
14
12
10
8
6
4
2
D. Explain why the slope of the line drawn in part C must be negative.
Student has given an incorrect graph.
Student has given an incorrect explanati on.
Based on Scoring Guidelines, 1 point is representati ve of a “minimal understanding.”
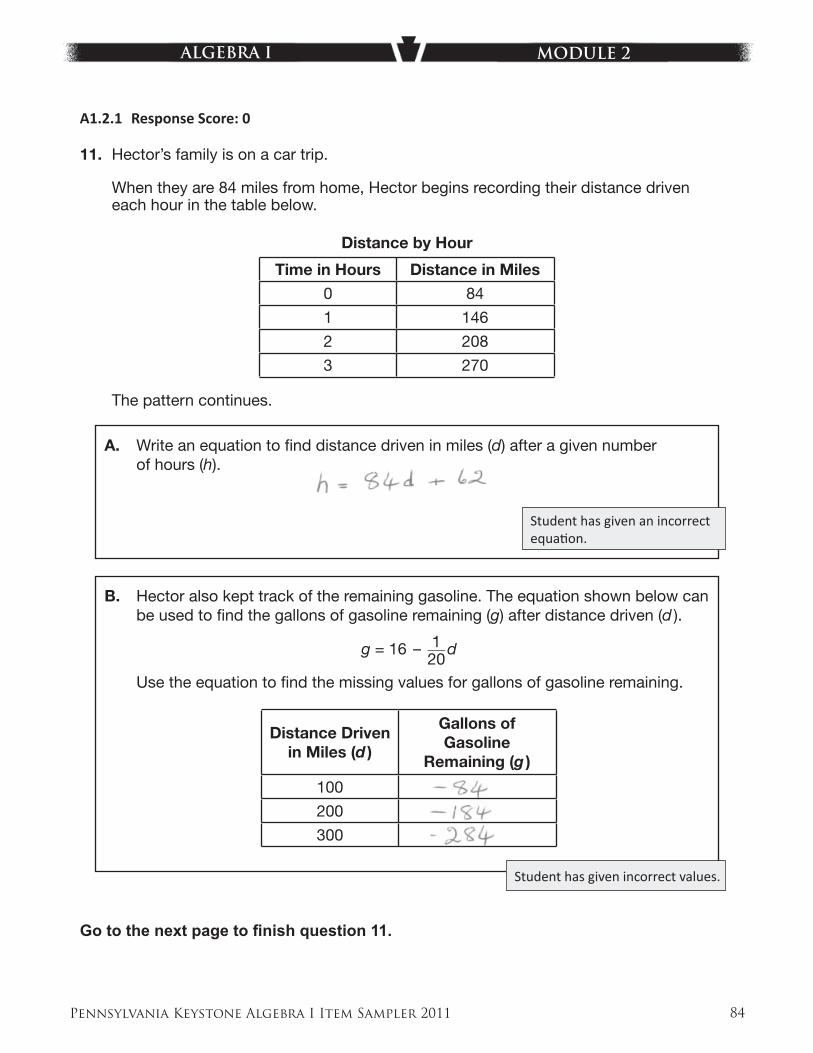
Pennsylvania Keystone Algebra I Item Sampler 2011 84
ALGEBRA I MODULE 2
11. Hector’s family is on a car trip.
When they are 84 miles from home, Hector begins recording their distance driven each hour in the table below.
Distance by Hour
Time in Hours Distance in Miles
0 84
1 146
2 208
3 270
The pattern continues.
A. Write an equation to fi nd distance driven in miles (d) after a given number of hours (h).
B. Hector also kept track of the remaining gasoline. The equation shown below can be used to fi nd the gallons of gasoline remaining (g) after distance driven (d ).
g = 16 – 1 } 20
d
Use the equation to fi nd the missing values for gallons of gasoline remaining.
Distance Drivenin Miles (d )
Gallons of Gasoline
Remaining (g )
100
200
300
Go to the next page to fi nish question 11.
A1.2.1 Response Score: 0
Student has given incorrect values.
Student has given an incorrect equati on.
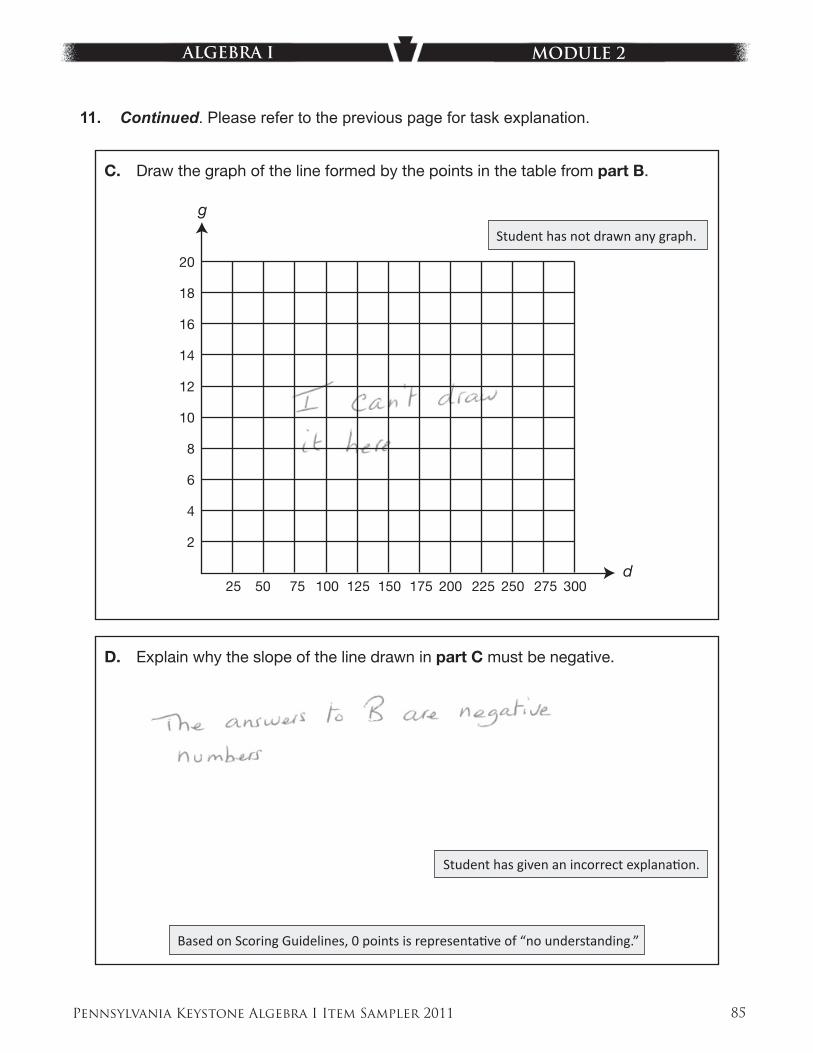
Pennsylvania Keystone Algebra I Item Sampler 2011 85
ALGEBRA I MODULE 2
11. Continued. Please refer to the previous page for task explanation.
C. Draw the graph of the line formed by the points in the table from part B.
g
d25 50 75 100 125 150 175 200 225 250 275 300
20
18
16
14
12
10
8
6
4
2
D. Explain why the slope of the line drawn in part C must be negative.
Student has not drawn any graph.
Student has given an incorrect explanati on.
Based on Scoring Guidelines, 0 points is representati ve of “no understanding.”
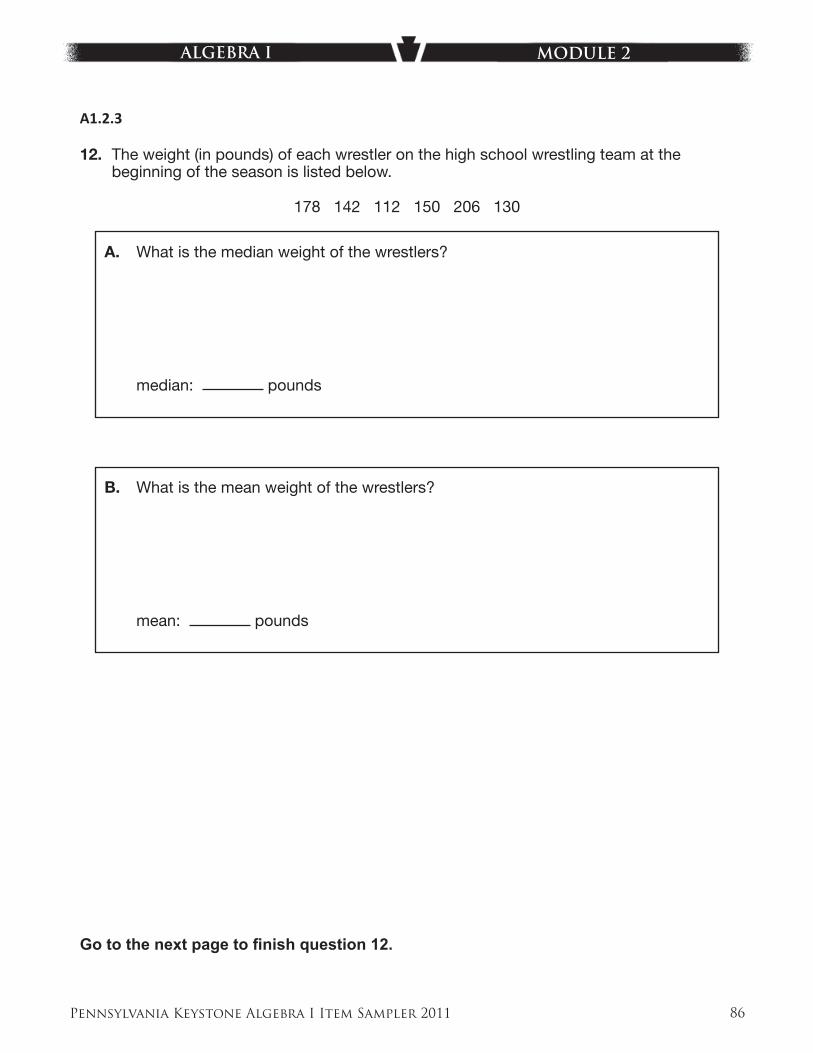
Pennsylvania Keystone Algebra I Item Sampler 2011 86
ALGEBRA I MODULE 2
A1.2.3
12. The weight (in pounds) of each wrestler on the high school wrestling team at the beginning of the season is listed below.
178 142 112 150 206 130
A. What is the median weight of the wrestlers?
median: pounds
B. What is the mean weight of the wrestlers?
mean: pounds
Go to the next page to fi nish question 12.
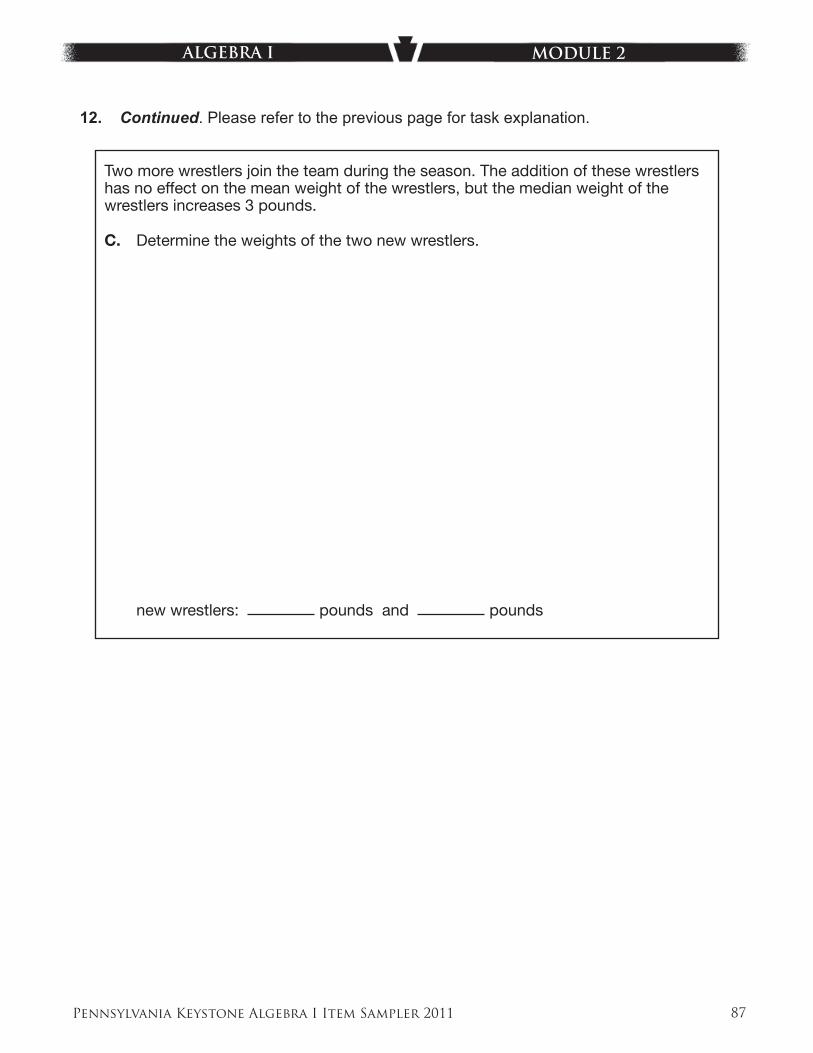
Pennsylvania Keystone Algebra I Item Sampler 2011 87
ALGEBRA I MODULE 2
12. Continued. Please refer to the previous page for task explanation.
Two more wrestlers join the team during the season. The addition of these wrestlers has no effect on the mean weight of the wrestlers, but the median weight of the wrestlers increases 3 pounds.
C. Determine the weights of the two new wrestlers.
new wrestlers: pounds and pounds
635765
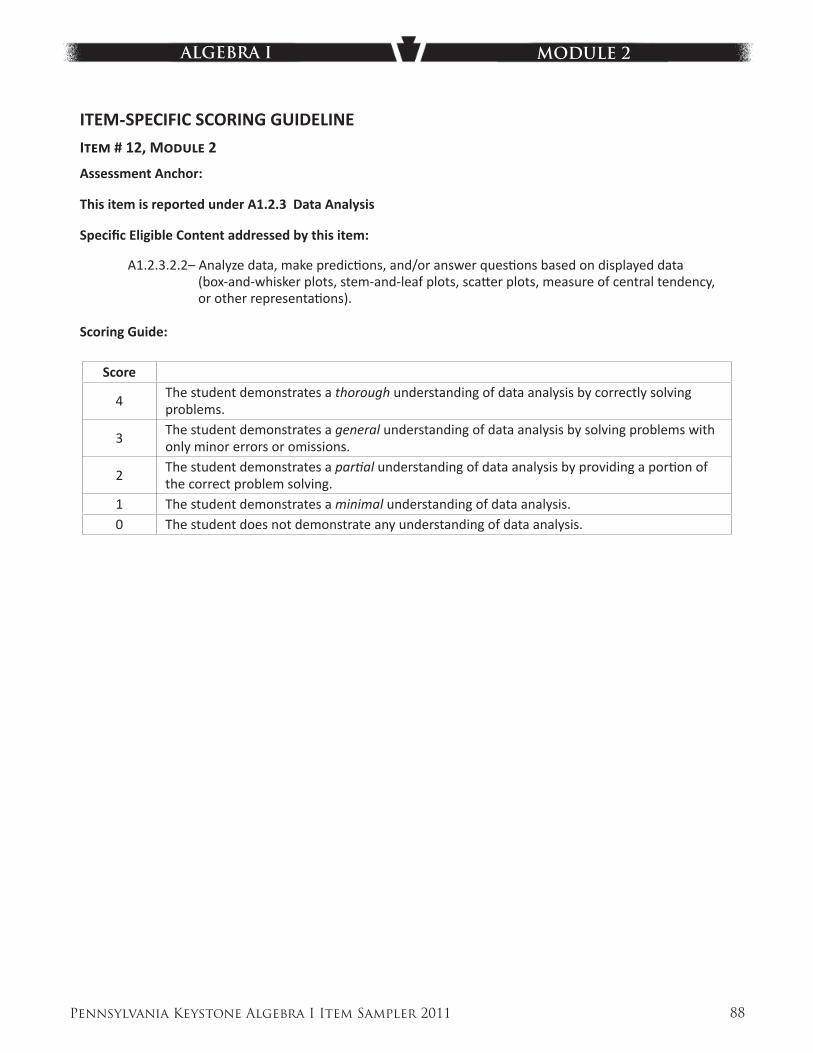
Pennsylvania Keystone Algebra I Item Sampler 2011 88
ALGEBRA I MODULE 2
ITEM-SPECIFIC SCORING GUIDELINE
ITEM # 12, MODULE 2
Assessment Anchor:
This item is reported under A1.2.3 Data Analysis
Specifi c Eligible Content addressed by this item:
A1.2.3.2.2– Analyze data, make predicti ons, and/or answer questi ons based on displayed data (box-and-whisker plots, stem-and-leaf plots, scatt er plots, measure of central tendency, or other representati ons).
Scoring Guide:
Score
4The student demonstrates a thorough understanding of data analysis by correctly solving problems.
3The student demonstrates a general understanding of data analysis by solving problems with only minor errors or omissions.
2The student demonstrates a parti al understanding of data analysis by providing a porti on of the correct problem solving.
1 The student demonstrates a minimal understanding of data analysis.0 The student does not demonstrate any understanding of data analysis.
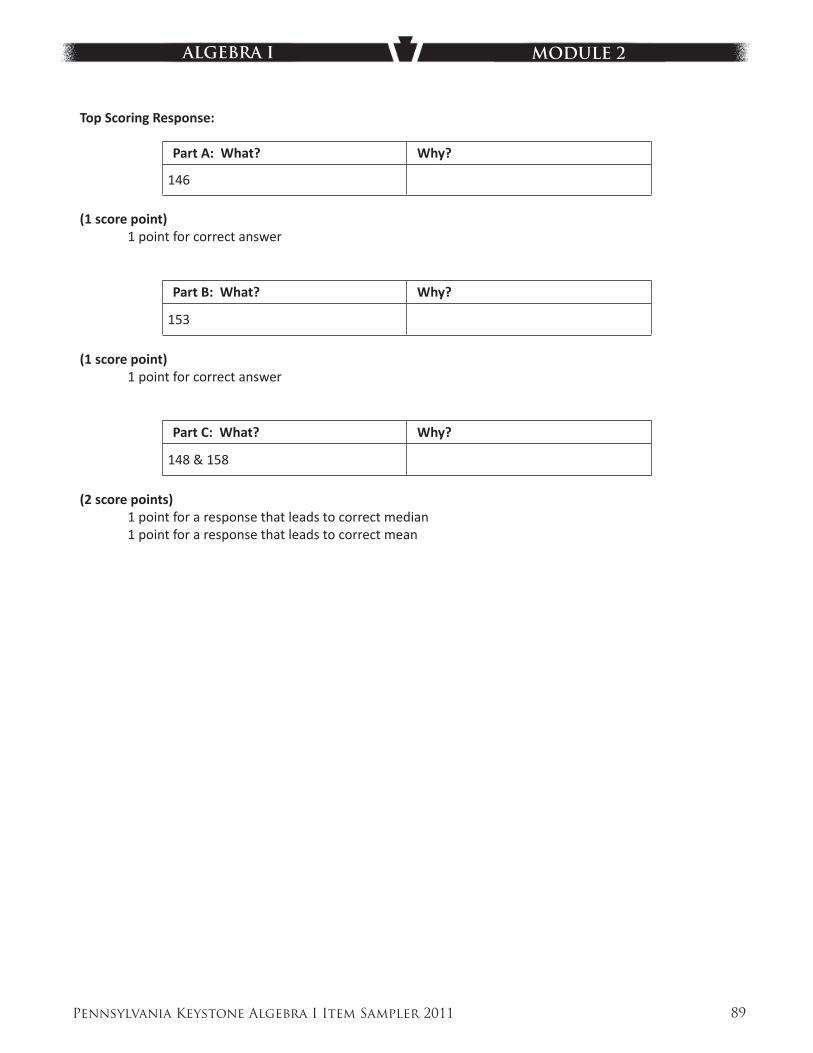
Pennsylvania Keystone Algebra I Item Sampler 2011 89
ALGEBRA I MODULE 2
Top Scoring Response:
Part A: What? Why?
146
(1 score point)1 point for correct answer
Part B: What? Why?
153
(1 score point)1 point for correct answer
Part C: What? Why?
148 & 158
(2 score points)1 point for a response that leads to correct median1 point for a response that leads to correct mean
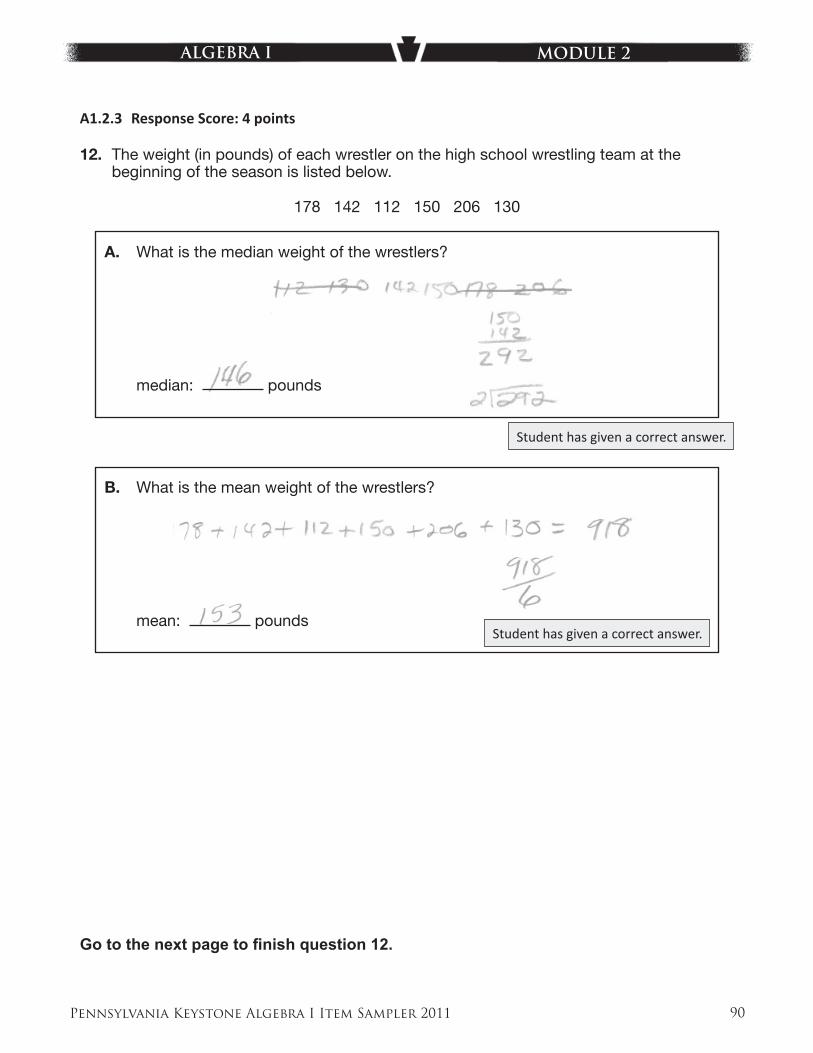
Pennsylvania Keystone Algebra I Item Sampler 2011 90
ALGEBRA I MODULE 2
12. The weight (in pounds) of each wrestler on the high school wrestling team at the beginning of the season is listed below.
178 142 112 150 206 130
A. What is the median weight of the wrestlers?
median: pounds
B. What is the mean weight of the wrestlers?
mean: pounds
Go to the next page to fi nish question 12.
A1.2.3 Response Score: 4 points
Student has given a correct answer.
Student has given a correct answer.
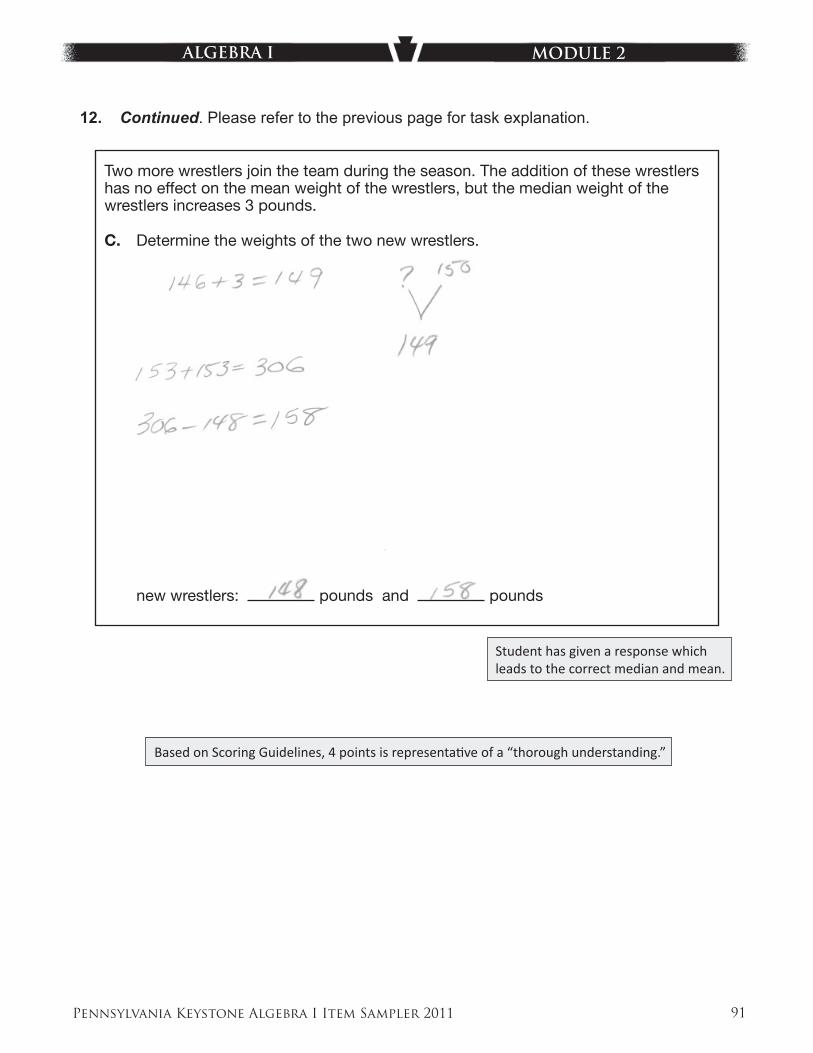
Pennsylvania Keystone Algebra I Item Sampler 2011 91
ALGEBRA I MODULE 2
12. Continued. Please refer to the previous page for task explanation.
Two more wrestlers join the team during the season. The addition of these wrestlers has no effect on the mean weight of the wrestlers, but the median weight of the wrestlers increases 3 pounds.
C. Determine the weights of the two new wrestlers.
new wrestlers: pounds and pounds
635765
Based on Scoring Guidelines, 4 points is representati ve of a “thorough understanding.”
Student has given a response which leads to the correct median and mean.
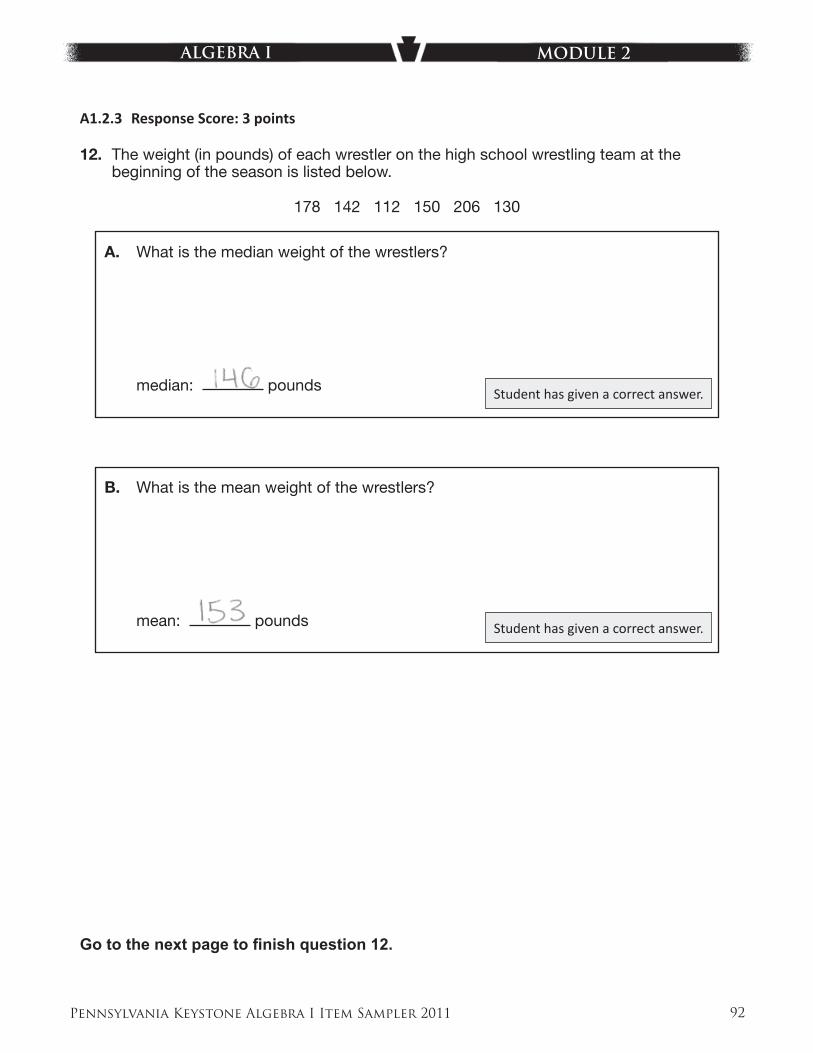
Pennsylvania Keystone Algebra I Item Sampler 2011 92
ALGEBRA I MODULE 2
12. The weight (in pounds) of each wrestler on the high school wrestling team at the beginning of the season is listed below.
178 142 112 150 206 130
A. What is the median weight of the wrestlers?
median: pounds
B. What is the mean weight of the wrestlers?
mean: pounds
Go to the next page to fi nish question 12.
A1.2.3 Response Score: 3 points
Student has given a correct answer.
Student has given a correct answer.

Pennsylvania Keystone Algebra I Item Sampler 2011 93
ALGEBRA I MODULE 2
12. Continued. Please refer to the previous page for task explanation.
Two more wrestlers join the team during the season. The addition of these wrestlers has no effect on the mean weight of the wrestlers, but the median weight of the wrestlers increases 3 pounds.
C. Determine the weights of the two new wrestlers.
new wrestlers: pounds and pounds
635765 Student has given a response that leads to a correct mean.Student has given a response that does not lead to a correct median.
Based on Scoring Guidelines, 3 points is representati ve of a “general understanding.”

Pennsylvania Keystone Algebra I Item Sampler 2011 94
ALGEBRA I MODULE 2
12. The weight (in pounds) of each wrestler on the high school wrestling team at the beginning of the season is listed below.
178 142 112 150 206 130
A. What is the median weight of the wrestlers?
median: pounds
B. What is the mean weight of the wrestlers?
mean: pounds
Go to the next page to fi nish question 12.
A1.2.3 Response Score: 3 points
Student has given a correct answer.
Student has given a correct answer.

Pennsylvania Keystone Algebra I Item Sampler 2011 95
ALGEBRA I MODULE 2
12. Continued. Please refer to the previous page for task explanation.
Two more wrestlers join the team during the season. The addition of these wrestlers has no effect on the mean weight of the wrestlers, but the median weight of the wrestlers increases 3 pounds.
C. Determine the weights of the two new wrestlers.
new wrestlers: pounds and pounds
635765 Student has given a response that does not lead to a correct mean.Student has given a response that leads to a correct median.
Based on Scoring Guidelines, 3 points is representati ve of a “general understanding.”
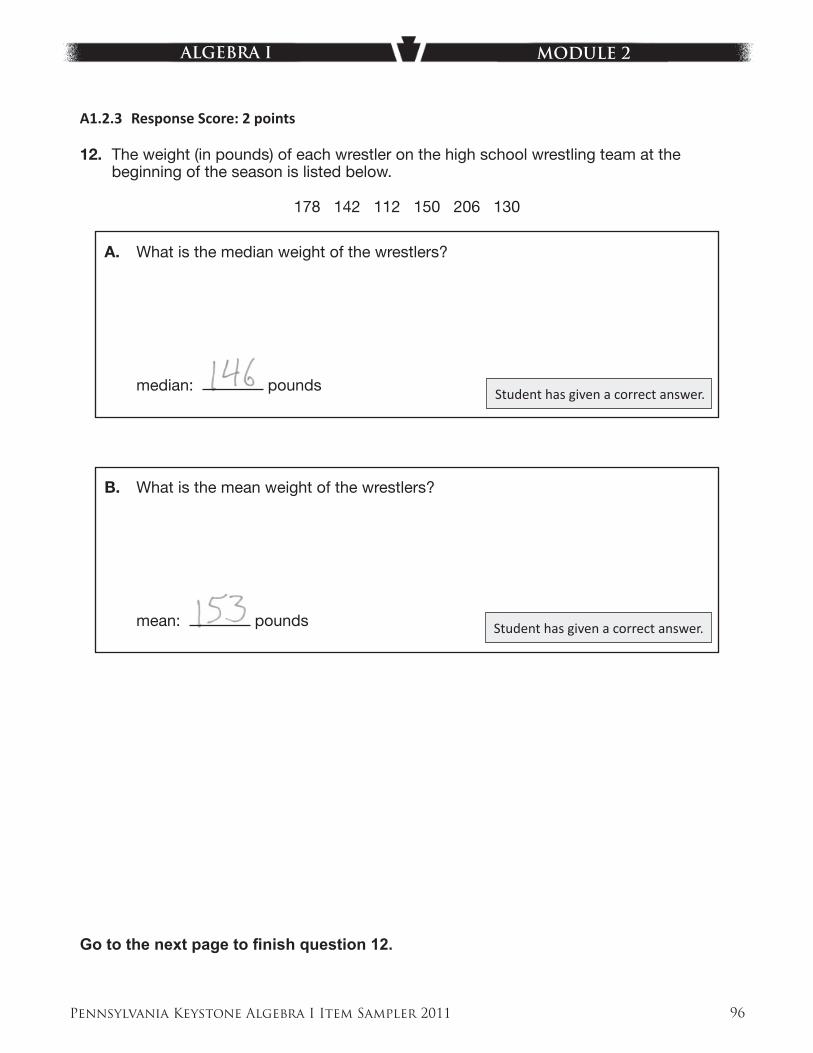
Pennsylvania Keystone Algebra I Item Sampler 2011 96
ALGEBRA I MODULE 2
12. The weight (in pounds) of each wrestler on the high school wrestling team at the beginning of the season is listed below.
178 142 112 150 206 130
A. What is the median weight of the wrestlers?
median: pounds
B. What is the mean weight of the wrestlers?
mean: pounds
Go to the next page to fi nish question 12.
A1.2.3 Response Score: 2 points
Student has given a correct answer.
Student has given a correct answer.

Pennsylvania Keystone Algebra I Item Sampler 2011 97
ALGEBRA I MODULE 2
12. Continued. Please refer to the previous page for task explanation.
Two more wrestlers join the team during the season. The addition of these wrestlers has no effect on the mean weight of the wrestlers, but the median weight of the wrestlers increases 3 pounds.
C. Determine the weights of the two new wrestlers.
new wrestlers: pounds and pounds
635765 Student has given a response that does not lead to a correct mean.Student has given a response that does not lead to a correct median.
Based on Scoring Guidelines, 2 points is representati ve of a “parti al understanding.”

Pennsylvania Keystone Algebra I Item Sampler 2011 98
ALGEBRA I MODULE 2
12. The weight (in pounds) of each wrestler on the high school wrestling team at the beginning of the season is listed below.
178 142 112 150 206 130
A. What is the median weight of the wrestlers?
median: pounds
B. What is the mean weight of the wrestlers?
mean: pounds
Go to the next page to fi nish question 12.
A1.2.3 Response Score: 2 points
Student has given a correct answer.
Student has given an incorrect answer.
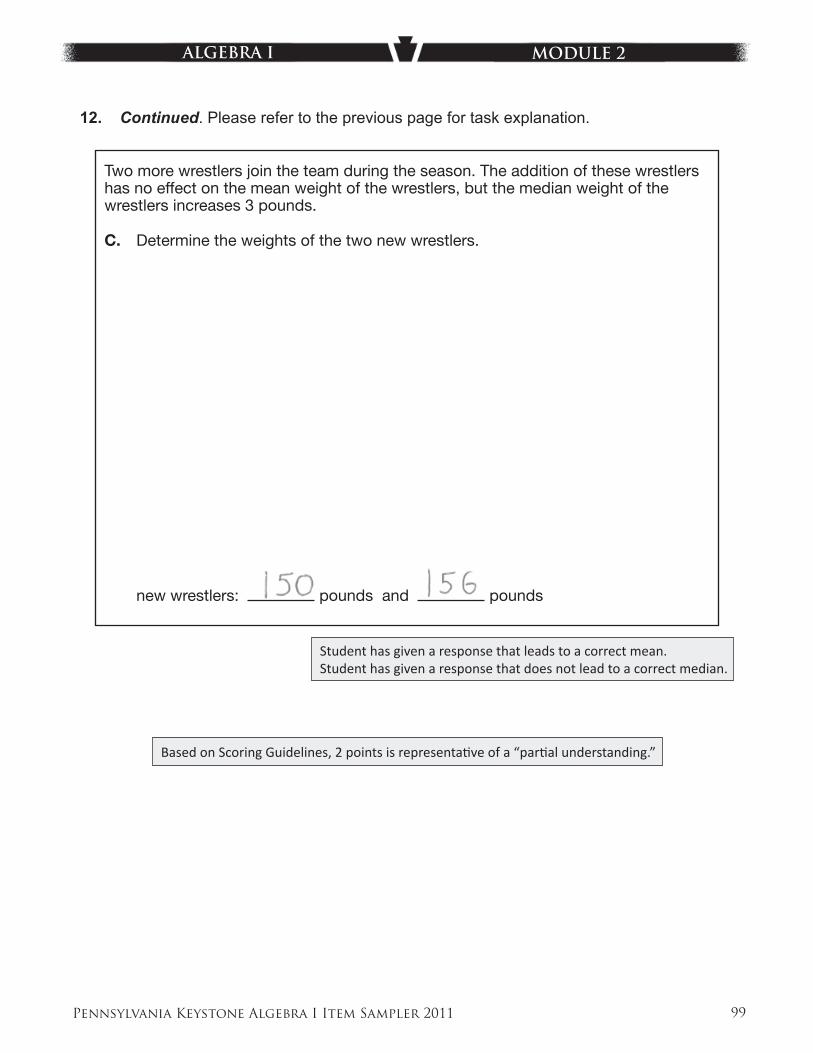
Pennsylvania Keystone Algebra I Item Sampler 2011 99
ALGEBRA I MODULE 2
12. Continued. Please refer to the previous page for task explanation.
Two more wrestlers join the team during the season. The addition of these wrestlers has no effect on the mean weight of the wrestlers, but the median weight of the wrestlers increases 3 pounds.
C. Determine the weights of the two new wrestlers.
new wrestlers: pounds and pounds
635765 Student has given a response that leads to a correct mean.Student has given a response that does not lead to a correct median.
Based on Scoring Guidelines, 2 points is representati ve of a “parti al understanding.”

Pennsylvania Keystone Algebra I Item Sampler 2011 100
ALGEBRA I MODULE 2
12. The weight (in pounds) of each wrestler on the high school wrestling team at the beginning of the season is listed below.
178 142 112 150 206 130
A. What is the median weight of the wrestlers?
median: pounds
B. What is the mean weight of the wrestlers?
mean: pounds
Go to the next page to fi nish question 12.
A1.2.3 Response Score: 1 point
Student has given a correct answer.
Student has given an incorrect answer.

Pennsylvania Keystone Algebra I Item Sampler 2011 101
ALGEBRA I MODULE 2
12. Continued. Please refer to the previous page for task explanation.
Two more wrestlers join the team during the season. The addition of these wrestlers has no effect on the mean weight of the wrestlers, but the median weight of the wrestlers increases 3 pounds.
C. Determine the weights of the two new wrestlers.
new wrestlers: pounds and pounds
635765 Student has given a response that does not lead to a correct mean.Student has given a response that does not lead to a correct median.
Based on Scoring Guidelines, 1 point is representati ve of a “minimal understanding.”

Pennsylvania Keystone Algebra I Item Sampler 2011 102
ALGEBRA I MODULE 2
12. The weight (in pounds) of each wrestler on the high school wrestling team at the beginning of the season is listed below.
178 142 112 150 206 130
A. What is the median weight of the wrestlers?
median: pounds
B. What is the mean weight of the wrestlers?
mean: pounds
Go to the next page to fi nish question 12.
A1.2.3 Response Score: 1 point
Student has given a correct answer.
Student has given an incorrect answer.
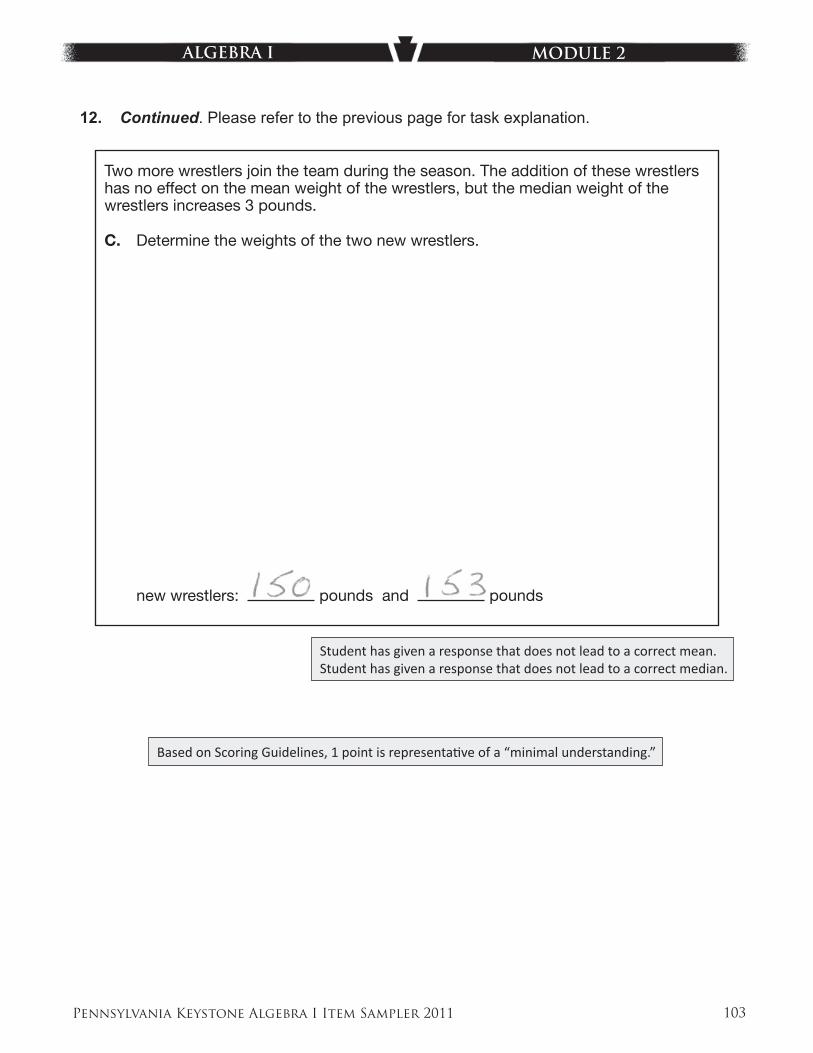
Pennsylvania Keystone Algebra I Item Sampler 2011 103
ALGEBRA I MODULE 2
12. Continued. Please refer to the previous page for task explanation.
Two more wrestlers join the team during the season. The addition of these wrestlers has no effect on the mean weight of the wrestlers, but the median weight of the wrestlers increases 3 pounds.
C. Determine the weights of the two new wrestlers.
new wrestlers: pounds and pounds
635765 Student has given a response that does not lead to a correct mean.Student has given a response that does not lead to a correct median.
Based on Scoring Guidelines, 1 point is representati ve of a “minimal understanding.”
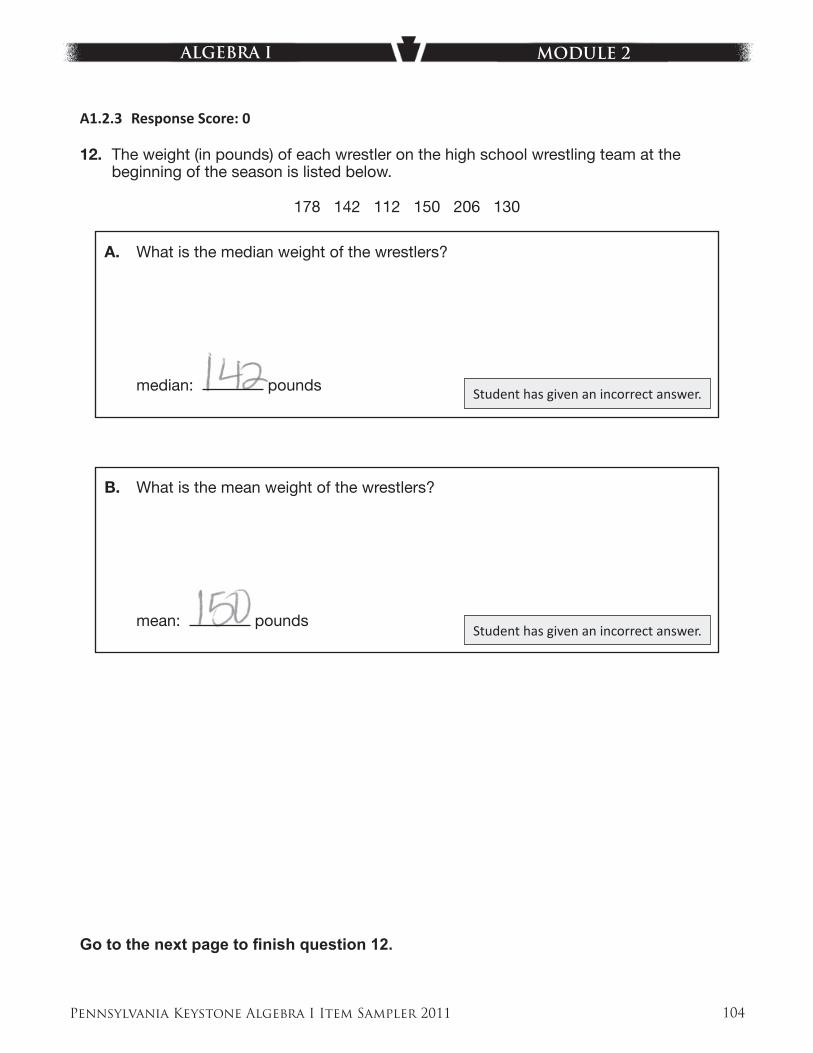
Pennsylvania Keystone Algebra I Item Sampler 2011 104
ALGEBRA I MODULE 2
12. The weight (in pounds) of each wrestler on the high school wrestling team at the beginning of the season is listed below.
178 142 112 150 206 130
A. What is the median weight of the wrestlers?
median: pounds
B. What is the mean weight of the wrestlers?
mean: pounds
Go to the next page to fi nish question 12.
A1.2.3 Response Score: 0
Student has given an incorrect answer.
Student has given an incorrect answer.
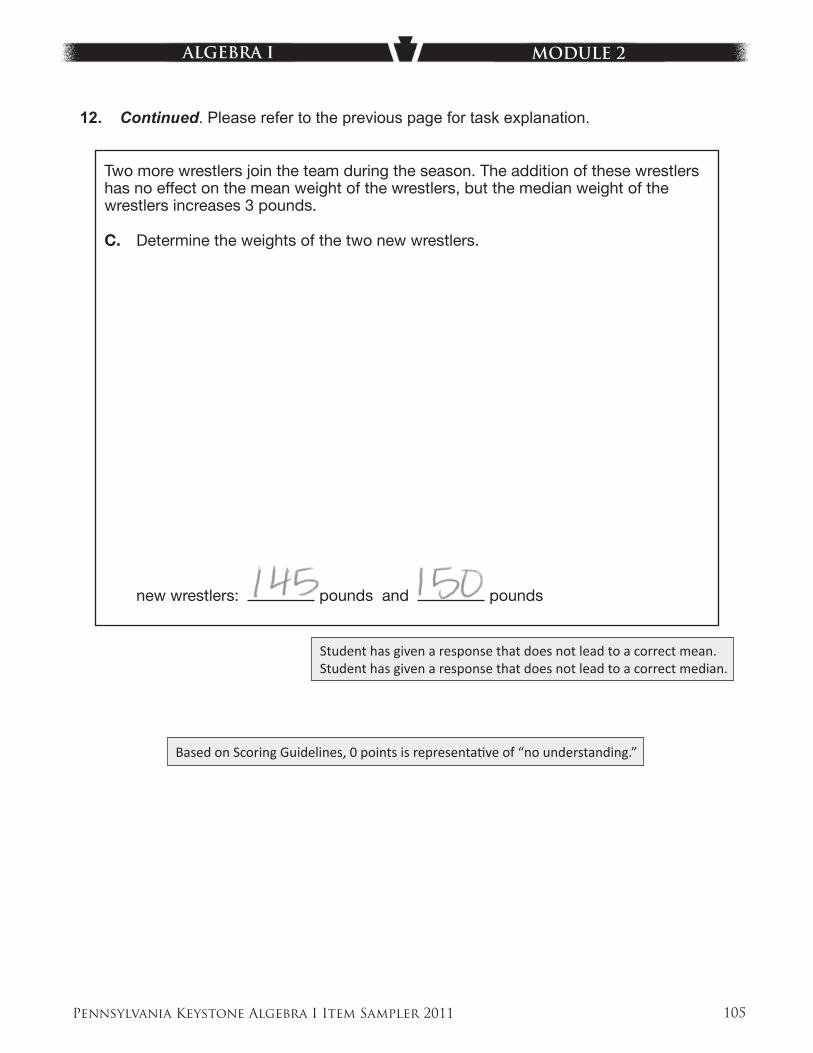
Pennsylvania Keystone Algebra I Item Sampler 2011 105
ALGEBRA I MODULE 2
12. Continued. Please refer to the previous page for task explanation.
Two more wrestlers join the team during the season. The addition of these wrestlers has no effect on the mean weight of the wrestlers, but the median weight of the wrestlers increases 3 pounds.
C. Determine the weights of the two new wrestlers.
new wrestlers: pounds and pounds
635765 Student has given a response that does not lead to a correct mean.Student has given a response that does not lead to a correct median.
Based on Scoring Guidelines, 0 points is representati ve of “no understanding.”
Keystone Exams
Algebra I
2011
Item and Scoring Sampler
Pennsylvania Department of Education Item and Scoring Sampler
Copyright © 2011 by the Pennsylvania Department of Education. The materials contained in this publication may be duplicated by Pennsylvania educators for local classroom use. This permission does not extend to the duplication of materials for commercial use.
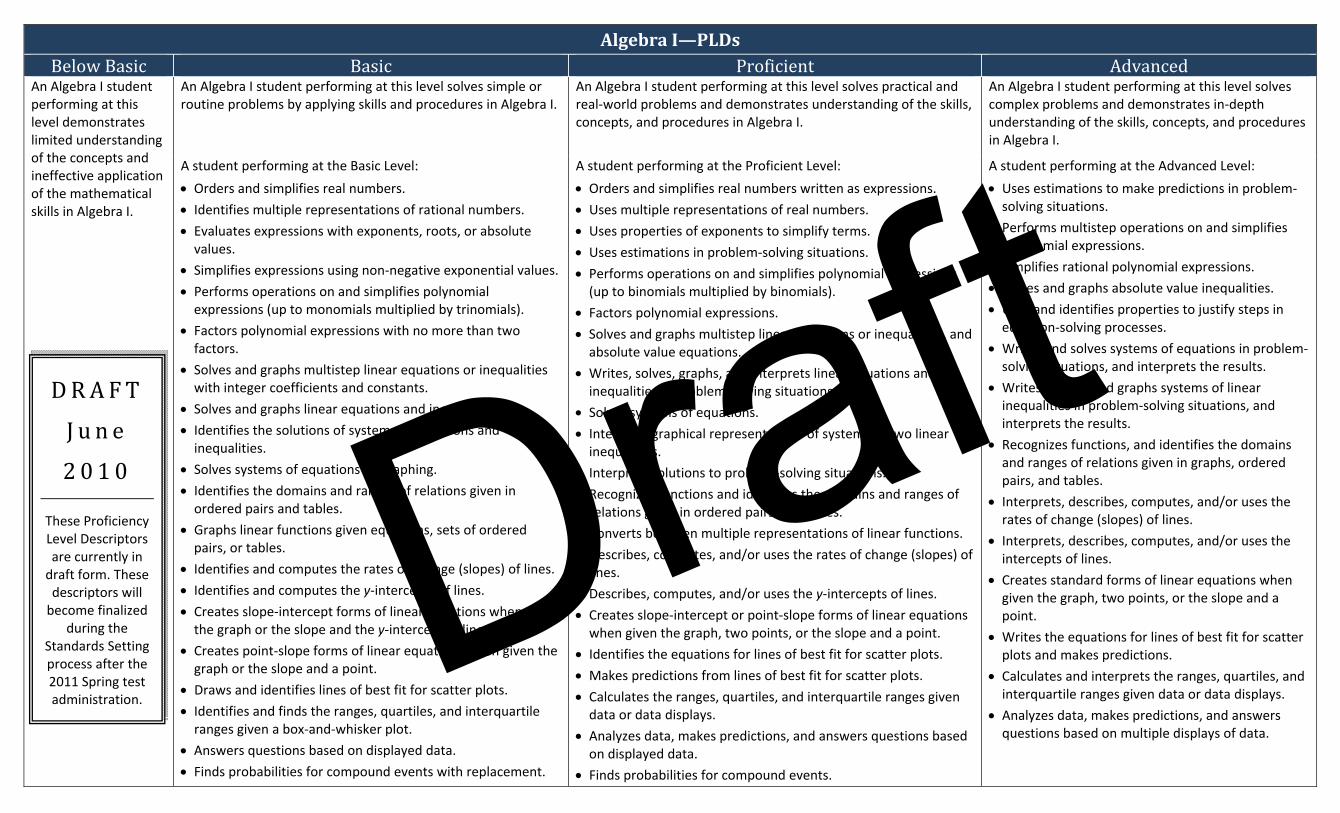
Algebra I—PLDs Below Basic Basic Proficient Advanced
An Algebra I student performing at this level demonstrates limited understanding of the concepts and ineffective application of the mathematical skills in Algebra I.
An Algebra I student performing at this level solves simple or routine problems by applying skills and procedures in Algebra I.
An Algebra I student performing at this level solves practical and real‐world problems and demonstrates understanding of the skills, concepts, and procedures in Algebra I.
An Algebra I student performing at this level solves complex problems and demonstrates in‐depth understanding of the skills, concepts, and procedures in Algebra I.
A student performing at the Basic Level:
• Orders and simplifies real numbers.
• Identifies multiple representations of rational numbers.
• Evaluates expressions with exponents, roots, or absolute values.
• Simplifies expressions using non‐negative exponential values.
• Performs operations on and simplifies polynomial expressions (up to monomials multiplied by trinomials).
• Factors polynomial expressions with no more than two factors.
• Solves and graphs multistep linear equations or inequalities with integer coefficients and constants.
• Solves and graphs linear equations and inequalities. • Identifies the solutions of systems of equations and inequalities.
• Solves systems of equations by graphing.
• Identifies the domains and ranges of relations given in ordered pairs and tables.
• Graphs linear functions given equations, sets of ordered pairs, or tables.
• Identifies and computes the rates of change (slopes) of lines.
• Identifies and computes the y‐intercepts of lines.
• Creates slope‐intercept forms of linear equations when given the graph or the slope and the y‐intercept of lines.
• Creates point‐slope forms of linear equations when given the graph or the slope and a point.
• Draws and identifies lines of best fit for scatter plots. • Identifies and finds the ranges, quartiles, and interquartile ranges given a box‐and‐whisker plot.
• Answers questions based on displayed data. • Finds probabilities for compound events with replacement.
A student performing at the Proficient Level:
• Orders and simplifies real numbers written as expressions.
• Uses multiple representations of real numbers.
• Uses properties of exponents to simplify terms.
• Uses estimations in problem‐solving situations.
• Performs operations on and simplifies polynomial expressions (up to binomials multiplied by binomials).
• Factors polynomial expressions.
• Solves and graphs multistep linear equations or inequalities, and absolute value equations.
• Writes, solves, graphs, and interprets linear equations and inequalities in problem‐solving situations.
• Solves systems of equations.
• Interprets graphical representations of systems of two linear inequalities.
• Interprets solutions to problem‐solving situations.
• Recognizes functions and identifies the domains and ranges of relations given in ordered pairs and tables.
• Converts between multiple representations of linear functions.
• Describes, computes, and/or uses the rates of change (slopes) of lines.
• Describes, computes, and/or uses the y‐intercepts of lines.
• Creates slope‐intercept or point‐slope forms of linear equations when given the graph, two points, or the slope and a point.
• Identifies the equations for lines of best fit for scatter plots. • Makes predictions from lines of best fit for scatter plots.
• Calculates the ranges, quartiles, and interquartile ranges given data or data displays.
• Analyzes data, makes predictions, and answers questions based on displayed data.
• Finds probabilities for compound events.
A student performing at the Advanced Level:
• Uses estimations to make predictions in problem‐solving situations.
• Performs multistep operations on and simplifies polynomial expressions.
• Simplifies rational polynomial expressions.
• Solves and graphs absolute value inequalities. • Uses and identifies properties to justify steps in equation‐solving processes.
• Writes and solves systems of equations in problem‐solving situations, and interprets the results.
• Writes, solves, and graphs systems of linear inequalities in problem‐solving situations, and interprets the results.
• Recognizes functions, and identifies the domains and ranges of relations given in graphs, ordered pairs, and tables.
• Interprets, describes, computes, and/or uses the rates of change (slopes) of lines.
• Interprets, describes, computes, and/or uses the intercepts of lines.
• Creates standard forms of linear equations when given the graph, two points, or the slope and a point.
• Writes the equations for lines of best fit for scatter plots and makes predictions.
• Calculates and interprets the ranges, quartiles, and interquartile ranges given data or data displays.
• Analyzes data, makes predictions, and answers questions based on multiple displays of data.
DRAFT
J u n e
2 0 1 0
These Proficiency Level Descriptors are currently in draft form. These descriptors will become finalized
during the Standards Setting process after the 2011 Spring test administration.
Draft
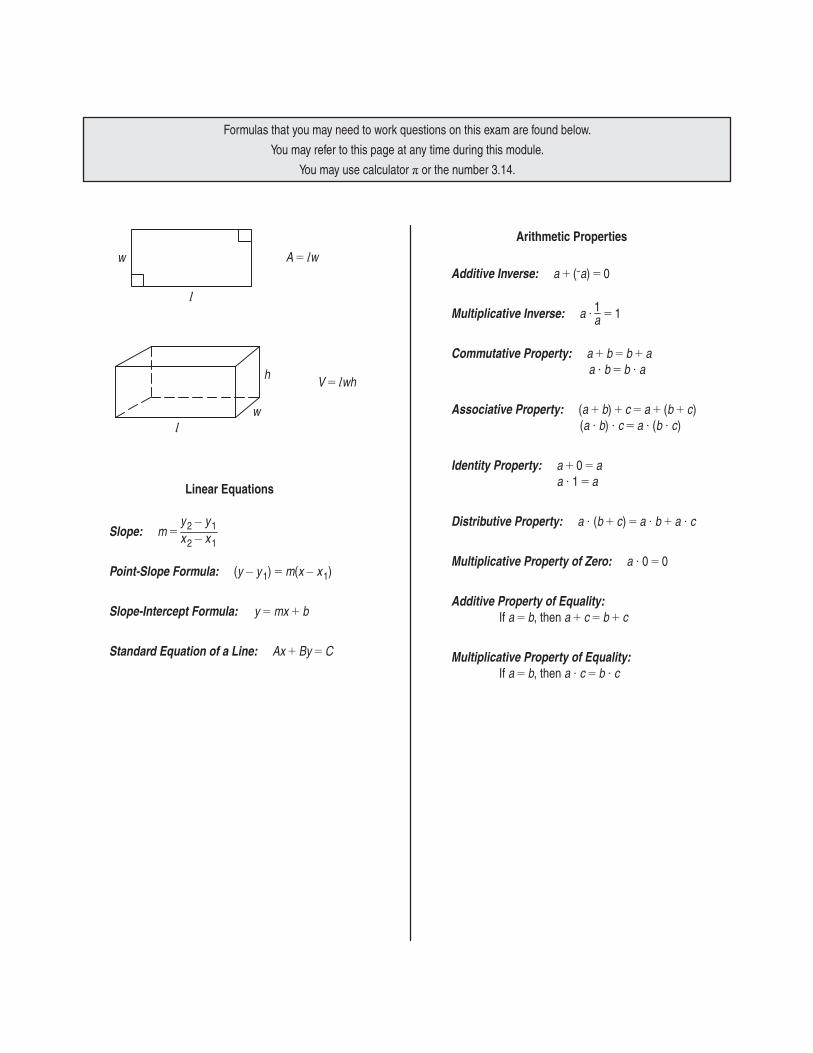
Formulas that you may need to work questions on this exam are found below.
You may refer to this page at any time during this module.
You may use calculator or the number 3.14.
A lw
l
w
V lwh
lw
h
Arithmetic Properties
Additive Inverse: a (¯a) 0
Multiplicative Inverse: a 1
Commutative Property: a b b a a b b a
Associative Property: (a b) c a (b c) (a b) c a (b c)
Identity Property: a 0 a a 1 a
Distributive Property: a (b c) a b a c
Multiplicative Property of Zero: a 0 0
Additive Property of Equality: If a b, then a c b c
Multiplicative Property of Equality: If a b, then a c b c
1a
Linear Equations
Slope: m
Point-Slope Formula: (y y 1) m(x x 1)
Slope-Intercept Formula: y mx b
Standard Equation of a Line: Ax By C
y 2 y 1x 2 x 1