Embed Size (px)
Citation preview

Functions and Graphs (2)4
4.1 Solving Inequalities by the Graphical Method
4.2 Finding Optimum Values of Quadratic Functions by the Algebraic Method
Chapter Summary
Case Study
4.3 Transformation on the Graphs of Functions

P. 2
Case Study
A satellite dish is apowerful antenna. Its cross-section is in the shape of a parabola.
How deep is this satellite dish?
If you want to know the answer, you should consider the shape of the dish first.
To find the depth of the dish, we may make use of the quadratic graph.
Suppose the shape of the dish can be represented by a quadratic graph y ax2 b with respect to the axes shown in the figure.
As y is minimum when x 0, we can find out the depth of the dish if we know the value of b.

P. 3
4.1 Solving Inequalities by the4.1 Solving Inequalities by the Graphical Method Graphical Method
If a function y f (x) is given, then we can use the graph of y f (x) to solve the inequalities f (x) k and f (x) k.
Consider a quadratic function y f (x), whose graph opens upward.
If we add a straight line y k onto the graph, we observe that the line divides the graph of y f (x) into three parts.
f (x) k: the left part (where x a) orthe right part (where x b)
f (x) k: the middle part (where a x b)
For a quadratic function y f (x) whose graph opens upwards, 1. f (x) k for x a or x b or 2. f (x) k for a x b,if k is greater than the y-coordinate of the vertex of f (x).

P. 4
4.1 Solving Inequalities by the4.1 Solving Inequalities by the Graphical Method Graphical Method
If the graph of a quadratic function function y f (x) opens downwards, we have similar conclusions:
For a quadratic function y f (x) whose graph opens downwards, 1. f (x) k for a x b or2. f (x) k for x a or x b,if k is less than the y-coordinate of the vertex of f (x).

P. 5
Example 4.1T
Solution:
(a) Plot the graph of y 2x2 7x 3 for 2 x 6.(b) Using the graph, solve the following inequalities:
(i) 2x2 7x 3 7 (ii) 2x2 7x 3 0 (iii) 2x2 7x 1 2
(b) (i) From the graph, the solution is
4.1 Solving Inequalities by the4.1 Solving Inequalities by the Graphical Method Graphical Method
(a)y 2x2 7x 3
y 7
0.5 x 4.
(ii) From the graph, the solution is0.5 x 3.
(iii) 2x2 7x 1 2 can be written as2x2 7x 3 0.
∴ The solution is x 0.5 or x 3.
x –2 –1 0 1 2 3 4 5 6y 25 12 3 –2 –3 0 7 18 33

P. 6
The graphical method of solving quadratic inequalities is also applicable to solve inequalities involving other functions.
Consider the graph of y f (x) in the following figure.
4.1 Solving Inequalities by the4.1 Solving Inequalities by the Graphical Method Graphical Method
In order to solve f (x) k or f (x) k, we draw a line y k on the graph first and then find the corresponding value of x (x a).
For f (x) k, the solution is x a.For f (x) k, the solution is x a.

P. 7
Example 4.2T
Solution:(a)
(a) Plot the graph of y x3 2x for 2 x 2.(b) Using the graph, solve x3 2x 0.(c) Draw the line y 0.4 and hence solve x3 2x 0.4.(Give the answer correct to 1 decimal place.)
(b) The solution is x 1.4 or0 x 1.4. (cor. to 1 d. p.)
(c) The solution is x 1.3 or0.2 x 1.5. (cor. to 1 d. p.)
y 0.4
x –2 –1 0 1 2y 4 –1 0 1 –4
4.1 Solving Inequalities by the4.1 Solving Inequalities by the Graphical Method Graphical Method
y x3 2x
P. 8
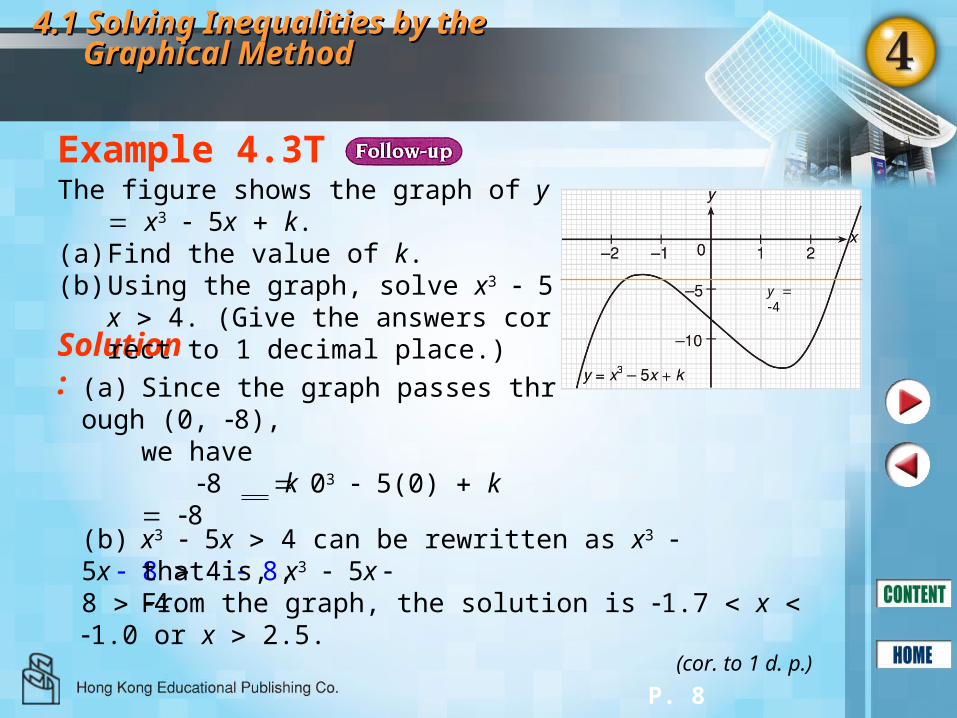
Example 4.3T
Solution:(a) Since the graph passes through (0, 8),
we have 8 03 5(0) k
(b) x3 5x 4 can be rewritten as x3 5x 8 4 8,
The figure shows the graph of y x3 5x k.(a) Find the value of k.(b) Using the graph, solve x3 5x 4. (Give t
he answers correct to 1 decimal place.)
4.1 Solving Inequalities by the4.1 Solving Inequalities by the Graphical Method Graphical Method
k 8
that is, x3 5x 8 4.
y 4
From the graph, the solution is 1.7 x 1.0 or x 2.5.(cor. to 1 d. p.)
P. 9
4.2 Finding the Optimum Values of Quadratic4.2 Finding the Optimum Values of Quadratic Functions by the Algebraic MethodFunctions by the Algebraic Method
A. PropertiesA. Properties ofof QuadraticQuadratic Function Function yy aa((xx hh))22 kk
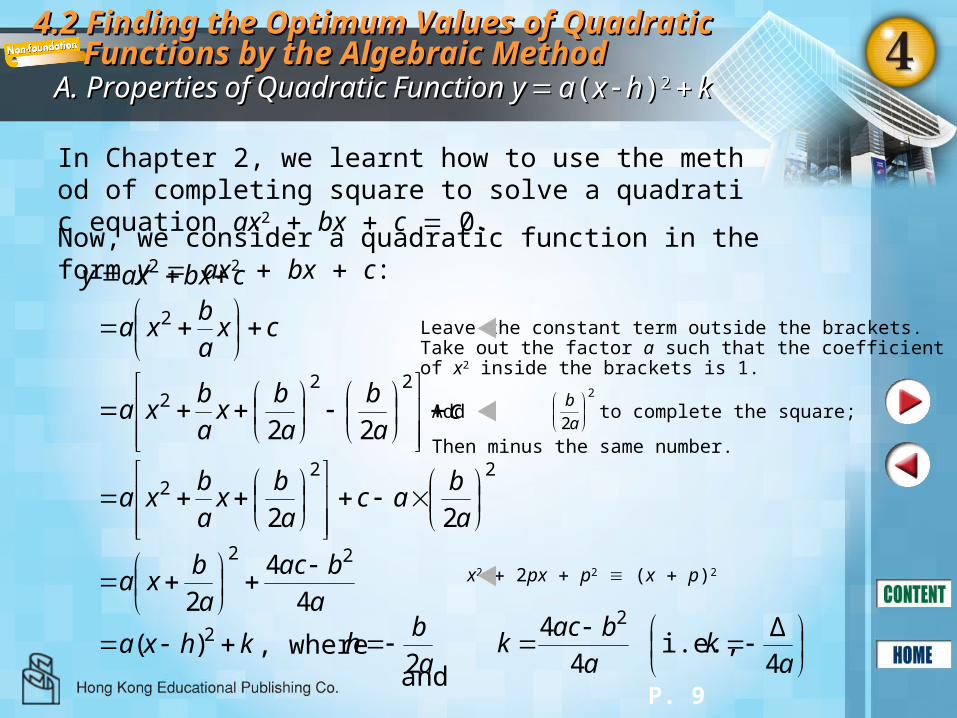
In Chapter 2, we learnt how to use the method of completing square to solve a quadratic equation ax2 bx c 0.
Now, we consider a quadratic function in the form y ax2 bx c:
cxa
bxa
2
ca
b
a
bx
a
bxa
222
2222
2
22
a
bac
a
bx
a
bxa
a
bac
a
bxa
4
4
2
22
cbxaxy 2
khxa 2)( , where anda
bh
2
a
back
4
4 2
Leave the constant term outside the brackets.Take out the factor a such that the coefficientof x2 inside the brackets is 1.
Add to complete the square;
Then minus the same number.
2
2
a
b
x2 2px p2 (x p)2
ak
4
Δ i.e.,
P. 10
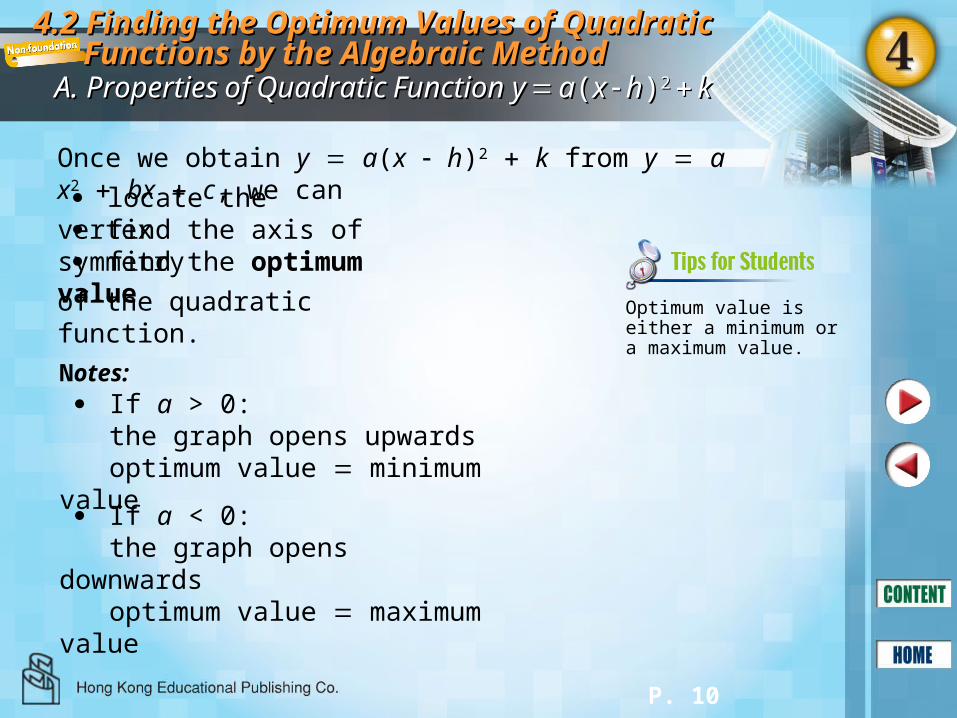
Once we obtain y a(x h)2 k from y ax2 bx c, we can
4.2 Finding the Optimum Values of Quadratic4.2 Finding the Optimum Values of Quadratic Functions by the Algebraic MethodFunctions by the Algebraic Method
A. PropertiesA. Properties ofof QuadraticQuadratic Function Function yy aa((xx hh))22 kk
locate the vertex find the axis of symmetry find the optimum value
of the quadratic function. Optimum value is either a minimum or a maximum value.
Notes: If a > 0:
the graph opens upwardsoptimum value minimum value
If a < 0:the graph opens downwardsoptimum value maximum value

P. 11
Consider the quadratic function y a(x h)2 k.
4.2 Finding the Optimum Values of Quadratic4.2 Finding the Optimum Values of Quadratic Functions by the Algebraic MethodFunctions by the Algebraic Method
A. PropertiesA. Properties ofof QuadraticQuadratic Function Function yy aa((xx hh))22 kk
Since (x h)2 0 for all values of x,
If a 0,
If a 0,
a(x h)2 0 a(x h)2 k k for all values of x
a(x h)2 0 a(x h)2 k k for all values of x
∴ Minimum value kat x h
∴ Maximum value kat x h
P. 12
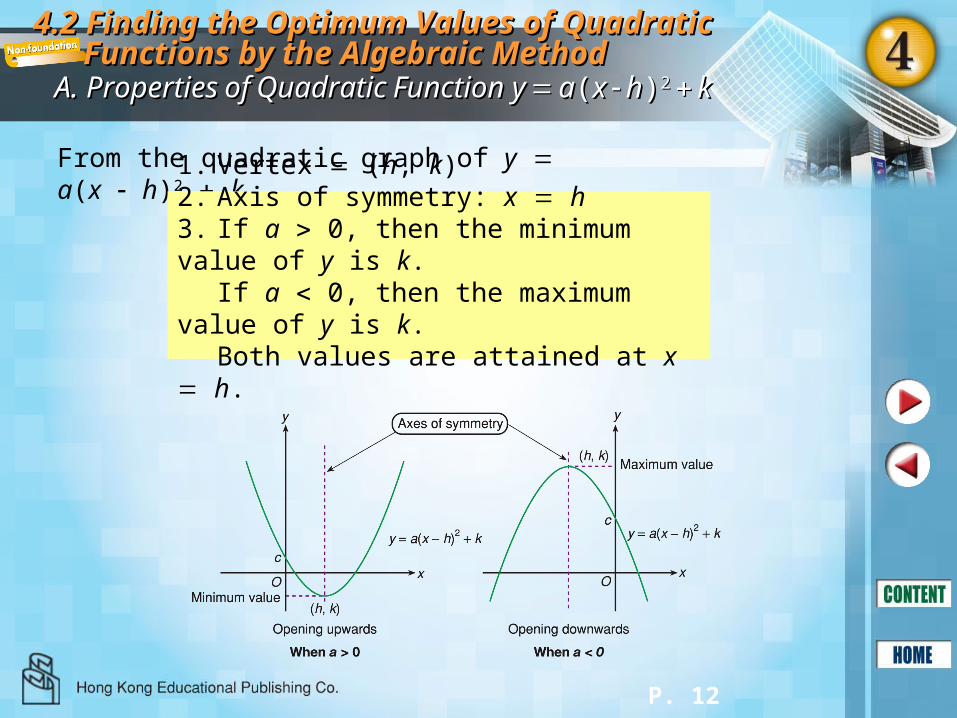
From the quadratic graph of y a(x h)2 k,
4.2 Finding the Optimum Values of Quadratic4.2 Finding the Optimum Values of Quadratic Functions by the Algebraic MethodFunctions by the Algebraic Method
A. PropertiesA. Properties ofof QuadraticQuadratic Function Function yy aa((xx hh))22 kk
1. Vertex (h, k) 2. Axis of symmetry: x h3. If a 0, then the minimum value of y is k.
If a 0, then the maximum value of y is k.Both values are attained at x h.
P. 13
Example 4.4T
Solution:
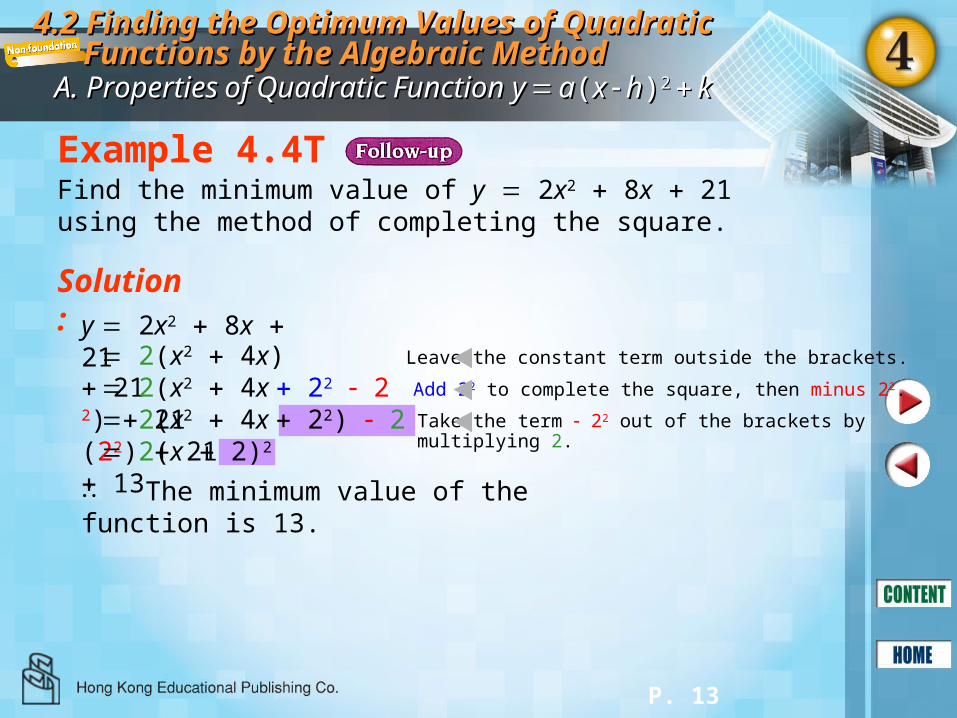
Find the minimum value of y 2x2 8x 21 using the method of completing the square.
y 2x2 8x 21Leave the constant term outside the brackets.
Add 22 to complete the square, then minus 22.
4.2 Finding the Optimum Values of Quadratic4.2 Finding the Optimum Values of Quadratic Functions by the Algebraic MethodFunctions by the Algebraic Method
A. PropertiesA. Properties ofof QuadraticQuadratic Function Function yy aa((xx hh))22 kk
2(x2 4x) 21 2(x2 4x 22 22) 21 2(x2 4x 22) 2(22) 2
1Take the term 22 out of the brackets bymultiplying 2. 2(x 2)2 13
∴ The minimum value of the function is 13.

P. 14
Solution:
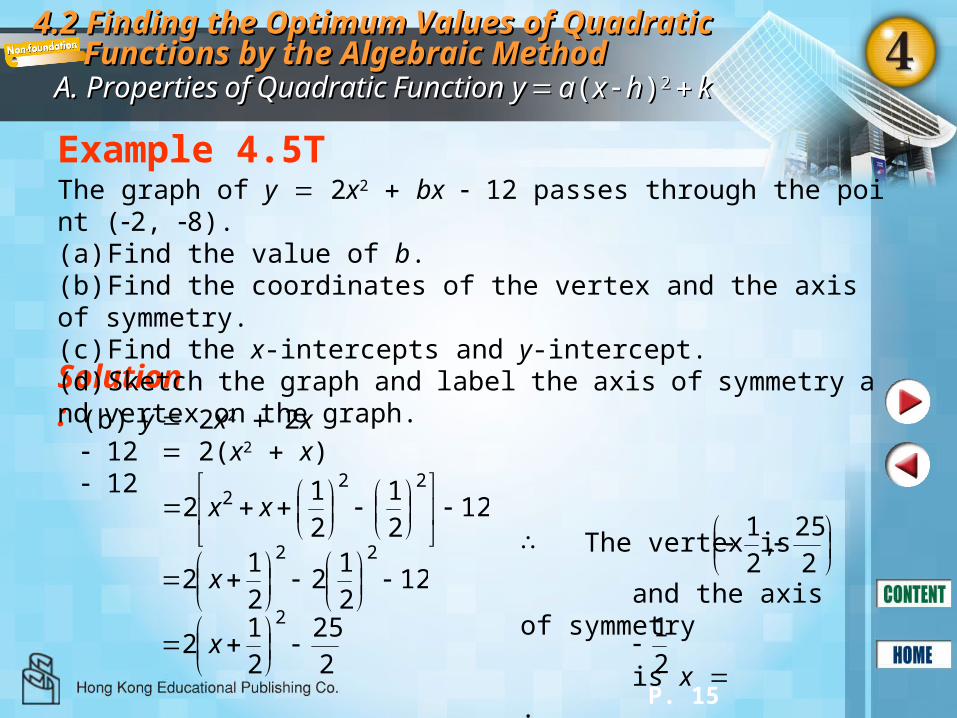
The graph of y 2x2 bx 12 passes through the point (2, 8).(a) Find the value of b.(b) Find the coordinates of the vertex and the axis of symmetry.(c) Find the x-intercepts and y-intercept.(d) Sketch the graph and label the axis of symmetry and vertex on the graph.
(a) Substituting x 2 and y 8 into the given equation,we obtain
8 2(2)2 b(2) 12
4.2 Finding the Optimum Values of Quadratic4.2 Finding the Optimum Values of Quadratic Functions by the Algebraic MethodFunctions by the Algebraic Method
A. PropertiesA. Properties ofof QuadraticQuadratic Function Function yy aa((xx hh))22 kk
Example 4.5T
8 4 2b b 2
P. 15
Solution:
The graph of y 2x2 bx 12 passes through the point (2, 8).(a) Find the value of b.(b) Find the coordinates of the vertex and the axis of symmetry.(c) Find the x-intercepts and y-intercept.(d) Sketch the graph and label the axis of symmetry and vertex on the graph.
4.2 Finding the Optimum Values of Quadratic4.2 Finding the Optimum Values of Quadratic Functions by the Algebraic MethodFunctions by the Algebraic Method
A. PropertiesA. Properties ofof QuadraticQuadratic Function Function yy aa((xx hh))22 kk
Example 4.5T
2
25
2
12
2
x
(b) y 2x2 2x 12 2(x2 x) 12
122
1
2
12
222
xx
122
12
2
12
22
x
∴ The vertex is
and the axis of symmetry
is x .
2
25 ,
2
1
2
1

P. 16
Example 4.5T
4.2 Finding the Optimum Values of Quadratic4.2 Finding the Optimum Values of Quadratic Functions by the Algebraic MethodFunctions by the Algebraic Method
A. PropertiesA. Properties ofof QuadraticQuadratic Function Function yy aa((xx hh))22 kk
Solution:
The graph of y 2x2 bx 12 passes through the point (2, 8).(a) Find the value of b.(b) Find the coordinates of the vertex and the axis of symmetry.(c) Find the x-intercepts and y-intercept.(d) Sketch the graph and label the axis of symmetry and vertex on the graph.
(c) When y 0,2x2 2x 12 0 x2 x 6 0
∴ The x-intercepts are 3 and 2.
y-intercept 2(0)2 2(0) 12 12
(d)
(x 3)(x 2) 0 x 3 or 2
P. 17
In real life situation, we can find the solutions of many problems by solving relevant quadratic functions, as illustrated in Example 4.6T and Example 4.7T.
4.2 Finding the Optimum Values of Quadratic4.2 Finding the Optimum Values of Quadratic Functions by the Algebraic MethodFunctions by the Algebraic Method
B. PracticalB. Practical ProblemsProblems RelatedRelated toto OptimumOptimum ValuesValues

P. 18
Example 4.6T
Solution:
A man throws a stone upwards from the roof of a building. The height of the stone after t seconds from the ground s m can be expressed as
s 40 12t 2t2.(a) When s 8, find the value of t.(b) What is the maximum height that the stone can reach?
(a) When s 8,
4.2 Finding the Optimum Values of Quadratic4.2 Finding the Optimum Values of Quadratic Functions by the Algebraic MethodFunctions by the Algebraic Method
B. PracticalB. Practical ProblemsProblems RelatedRelated toto OptimumOptimum ValuesValues
8 40 12t 2t2
2t2 12t 32 0 t2 6t 16 0 (t 8)(t 2) 0 t 8 or 2 (rejected)
(b) s 40 12t 2t2
2(t2 6t) 40 2(t2 6t 32 32) 40 2(t 3)2 2(32) 40 2(t 3)2 58 ∴ The maximum height
that the stone can reach is 58 m.

P. 19
Example 4.7T
4.2 Finding the Optimum Values of Quadratic4.2 Finding the Optimum Values of Quadratic Functions by the Algebraic MethodFunctions by the Algebraic Method
B. PracticalB. Practical ProblemsProblems RelatedRelated toto OptimumOptimum ValuesValues
Solution:
The base and the height of a triangle are (x 20) cm and (50 x) cm respectively. Let A cm2 be the area of the triangle.(a) Express A in terms of x.(b) Find the maximum area of the triangle.
(a) A )50)(20(2
1xx
)100030(2
1 2 xx
500152
1 2 xx
(b) A 500152
1 2 xx
500)30(2
1 2 xx
500)151530(2
1 222 xx
5.612)15(2
1 2 x
∴ The maximum area of the triangle is 612.5 cm2.
P. 20
4.3 Transformation on the Graphs of4.3 Transformation on the Graphs of FunctionsFunctions
A. TranslationA. Translation
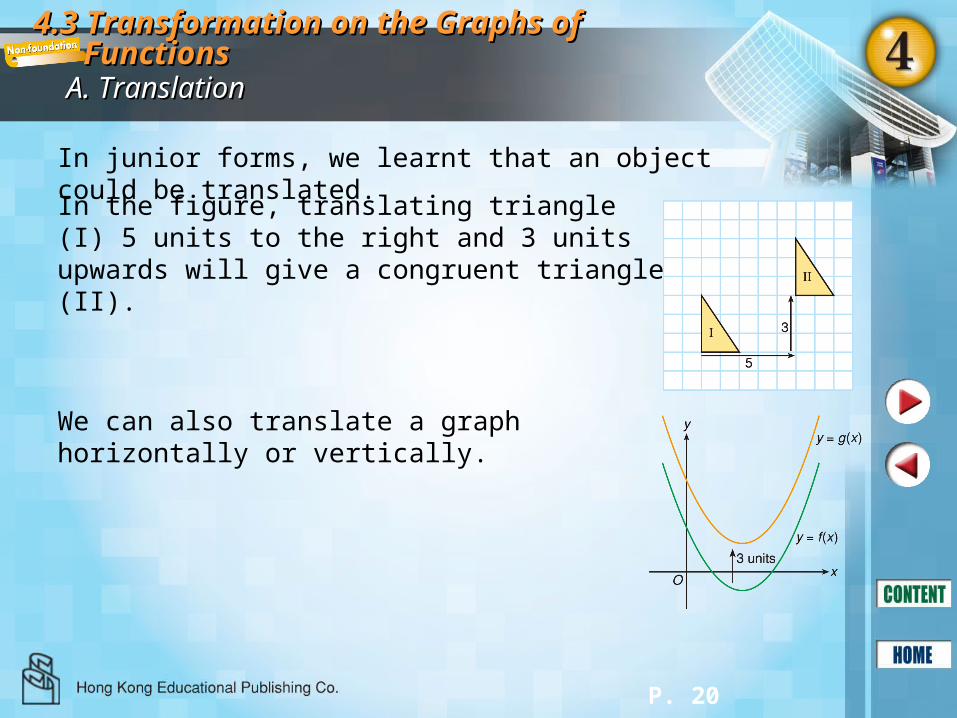
In junior forms, we learnt that an object could be translated.
In the figure, translating triangle (I) 5 units to the right and 3 units upwards will give a congruent triangle (II).
We can also translate a graph horizontally or vertically.

P. 21
4.3 Transformation on the Graphs of4.3 Transformation on the Graphs of FunctionsFunctions
A. TranslationA. Translation
The figure shows the graph of y x2.
Let f (x) x2, g1(x) x2 3 and g2(x) x2 2.
74347g1(x)2–1–2–12g2(x)
41014f (x)210–1–2x
y f (x) is translated 3 units upwards to become y g1(x).
y f (x) is translated 2 units downwards to become y g2(x).
From the graph,
y x2 3
y x2 2

P. 22
4.3 Transformation on the Graphs of4.3 Transformation on the Graphs of FunctionsFunctions
A. TranslationA. Translation
The figure shows the graph of y x2.
Let f (x) x2, h1(x) (x 1)2 and h2(x) (x 1)2.
10149h1(x)94101h2(x)
41014f (x)210–1–2x
y f (x) is translated 1 unit to the right to become y h1(x).
y f (x) is translated 1 unit to the left to become y h2(x).
From the graph,
y (x 1)2 y (x 1)2
P. 23
4.3 Transformation on the Graphs of4.3 Transformation on the Graphs of FunctionsFunctions
A. TranslationA. Translation
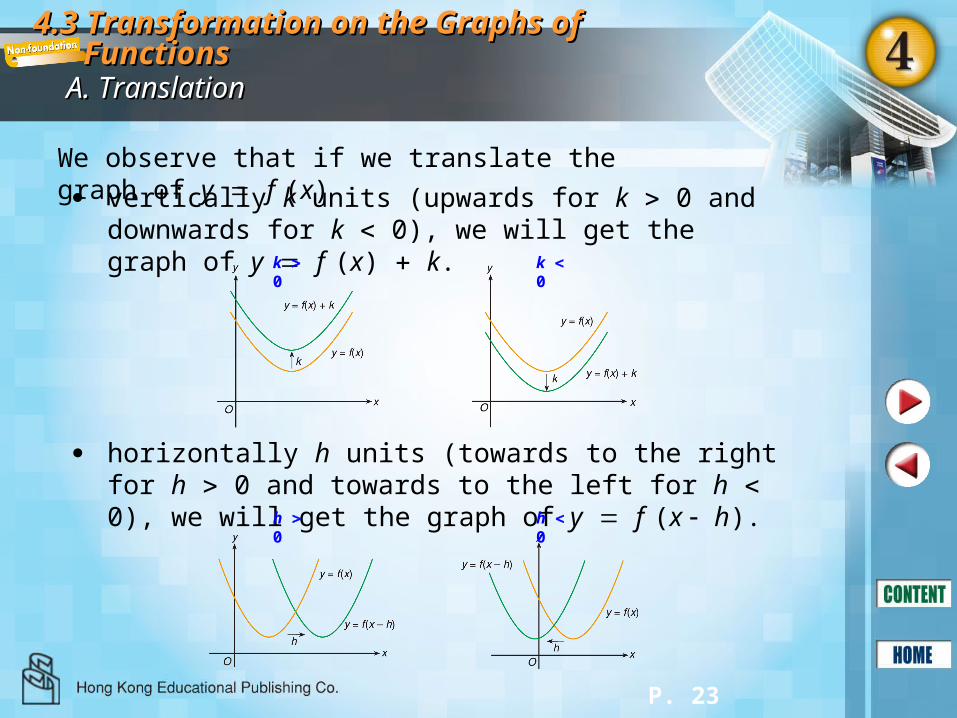
We observe that if we translate the graph of y f (x)
vertically k units (upwards for k 0 and downwards for k 0), we will get the graph of y f (x) k.
horizontally h units (towards to the right for h 0 and towards to the left for h 0), we will get the graph of y f (x h).
k 0 k 0
h 0 h 0

P. 24
4.3 Transformation on the Graphs of4.3 Transformation on the Graphs of FunctionsFunctions
A. TranslationA. Translation
In the figure, the graph of y g(x) is obtained by translating the graph of y f (x) 3 units upwards.
∴ g(x) f (x) 3
In general, we can translate the graph of y f (x) vertically by k units and horizontally by h units to get the graph of y f (x h) k.

P. 25
4.3 Transformation on the Graphs of4.3 Transformation on the Graphs of FunctionsFunctions
A. TranslationA. Translation
Example 4.8T
Solution:
y x2 6x 14 (x2 6x 10) 4
Describe the transformation between the graph of y x2 6x 10 and y x2 6x 14.
∴ A translation of 4 units upwards of the graph of y x2 6x 10 will obtain the graph of y x2 6x 14.

P. 26
4.3 Transformation on the Graphs of4.3 Transformation on the Graphs of FunctionsFunctions
A. TranslationA. Translation
Example 4.9T
Solution:
(a) 2(x 1)2 16 f (x 1)
Consider the graph of f (x) 2x2 16. Describe the transformation between the graph of y f (x) and each of the following functions.(a) y 2(x 1)2 16(b) y 2(x 3)2 16
(b) 2(x 3)2 16 f (x 3)
∴ A translation of 1 unit to the right of the graph of y f (x) will obtain the graph of y 2(x 1)2 16.
∴ A translation of 3 units to the left of the graph of y f (x) will obtain the graph of y 2(x 3)2 16.

P. 27
4.3 Transformation on the Graphs of4.3 Transformation on the Graphs of FunctionsFunctions
B. ReflectionB. Reflection
Let f (x) x2 10x 26.Then f (x) x2 10x 26.
Moreover, if the graph of y f (x) is reflected about the y-axis, then we will get the graph of y f (x).
If f (x) x(x 3),then f (x) x(x 3)
x(x 3)
If the graph of y f (x) is reflected about the x-axis, then we will get the graph of y f (x).
52125f (x)52125f (x)76543x
x-intercepts: 0 and 3
x-intercepts: 0 and 3
P. 28
4.3 Transformation on the Graphs of4.3 Transformation on the Graphs of FunctionsFunctions
B. ReflectionB. Reflection
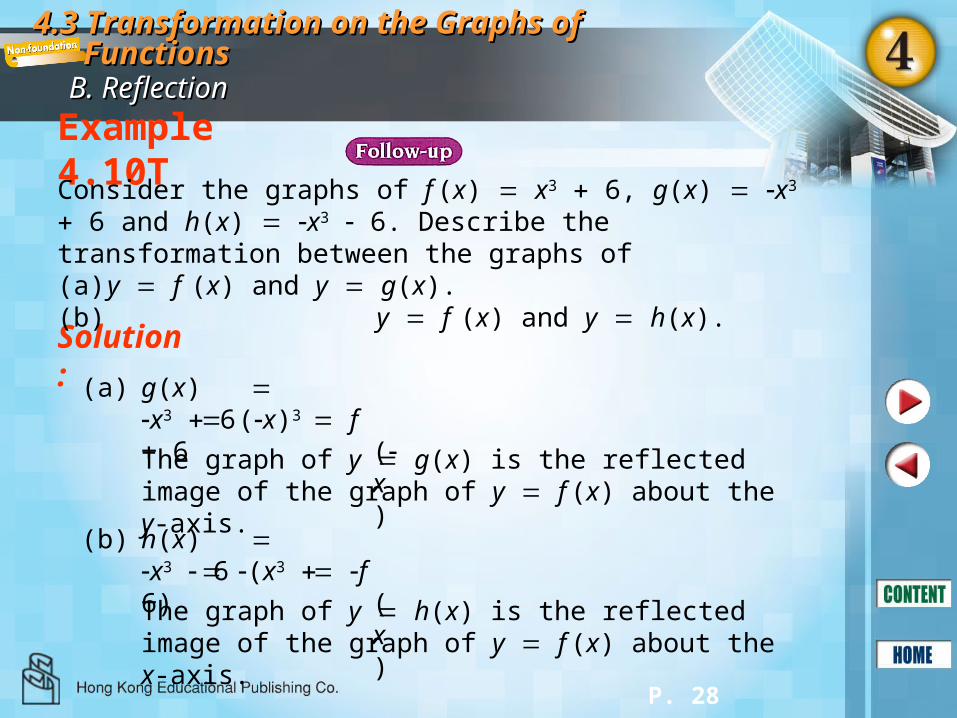
Example 4.10T
Solution:
The graph of y g(x) is the reflected image of the graph of y f (x) about the y-axis.
Consider the graphs of f (x) x3 6, g(x) x3 6 and h(x) x3 6. Describe the transformation between the graphs of (a) y f (x) and y g(x).(b) y f (x) and y h(x).
The graph of y h(x) is the reflected image of the graph of y f (x) about the x-axis.
(a) g(x) x3 6 (x)3
6 f (x)
(b) h(x) x3 6 (x3
6) f (x)

P. 29
240–16–24–24–16024g(x)
–6 –4 0 6–6–406h(x)
4.3 Transformation on the Graphs of4.3 Transformation on the Graphs of FunctionsFunctions
C. Enlargement or ReductionC. Enlargement or Reduction
The figure shows the graph of y f (x), where f (x) 2x2 10x
2x(x 5)Let g(x) 2 f (x) and h(x) 0.5 f (x) 4x(x 5) x(x 5)
120–8–12–12–8012f (x)
3 4 5 6210–1x
y g(x)
y h(x)
The graph of y f (x) enlarged to y g(x) or reduced to y h(x) along the y-axis (the vertical direction) to give y kf
(x) for different values of k (for k 0).
P. 30
4.3 Transformation on the Graphs of4.3 Transformation on the Graphs of FunctionsFunctions
C. Enlargement or ReductionC. Enlargement or Reduction
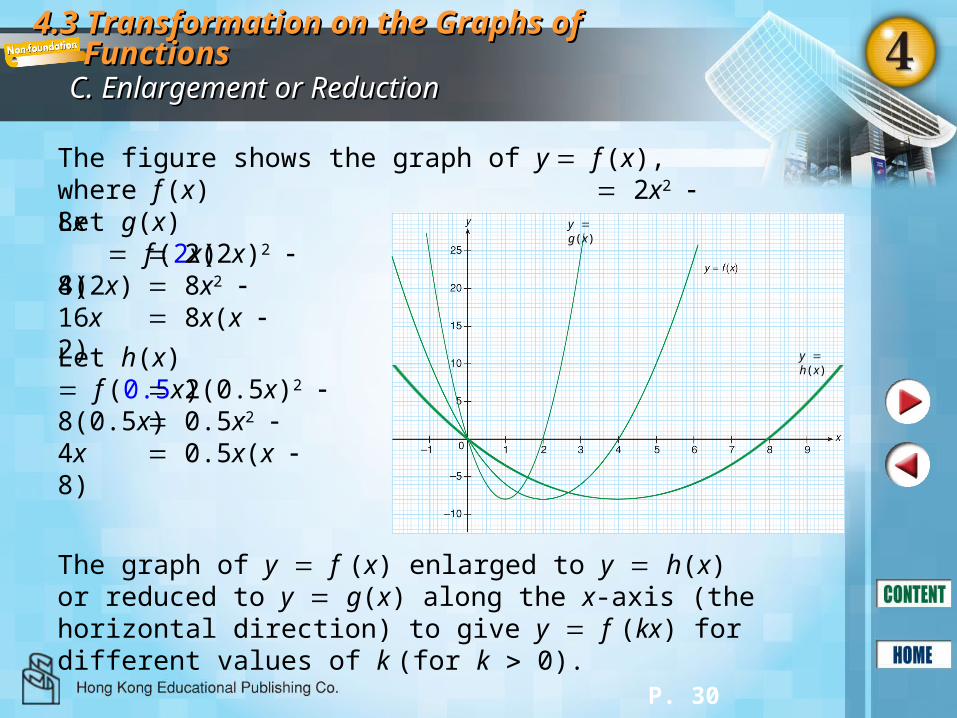
The figure shows the graph of y f (x), where f (x) 2x2 8x
2x(x 4)Let g(x) f (2x) 2(2x)2 8(2x) 8x2 16x 8x(x 2)
Let h(x) f (0.5x) 2(0.5x)2 8(0.5
x) 0.5x2 4x 0.5x(x 8)
The graph of y f (x) enlarged to y h(x) or reduced to y g(x) along the x-axis (the horizontal direction) to give y f (kx) for different values of k (for k 0).
y g(x)
y h(x)

P. 31
4.3 Transformation on the Graphs of4.3 Transformation on the Graphs of FunctionsFunctions
C. Enlargement or ReductionC. Enlargement or Reduction
Consider the graphs of y f (x) and y kf (x), where k 0. Enlarge (for k 1) or reduce (for k 1) the graph of y f (x) along
the y-axis k times to obtain y kf (x).
fixed point aty-intercept
Enlarge (for k 1) or reduce (for k 1) the graph of y f (x) along
the x-axis times to obtain y f (kx).k
1
fixed point(s) atx-intercept(s)

P. 32
4.3 Transformation on the Graphs of4.3 Transformation on the Graphs of FunctionsFunctions
C. Enlargement or ReductionC. Enlargement or Reduction
Example 4.11T
Solution:(a) Refer to the figure on the right.
The figure shows the graph of y f (x).(a) Sketch the graph of each of the following
functions:
(i) y f (x) (ii) y f (2x)
(b) Describe the transformations between the graphof y f (x) and each of the graphs in (a).
4
1y f(2x)
y f(x)14
The graph of y f (x) is reduced to half of the original graph along the x-axis to give the graph of y f (2x).
(b) The graph of y f (x) is reduced to times of the original
graph along the y-axis to give the graph of y f (x).4
1
4
1

P. 33
4.1 Solving Inequalities by the Graphical Method
Chapter Summary
To solve the inequality of f (x) k (or f (x) k) by the graphical method, we can draw the line y k on the same diagram of the graph of y f (x). From the points of intersection of the graphs, determine the range of values of x such that f f (x) k (or f (x) k).
P. 34
Chapter Summary4.2 Finding the Optimum Values of Quadratic Functions by the Algebraic Method
For y a(x h)2 k, if a 0, then y has the minimum value, that is k;if a 0, then y has the maximum value, that is k.

P. 35
Chapter Summary
1. If we translate the graph of y f (x) vertically k units (upwards for k 0; downwards for k 0), we will get the graph of y f (x) k.
4.3 Transformation on the Graphs of Functions
horizontally h units (to the right for h 0; to the left for h 0), we will get the graph of y f (x h).
2. If we reflect the graph of y f (x) about the y-axis, we will get the graph of y f
(x). the x-axis, we will get the graph of y f
(x).3. For k 0, the graph of y f (x) is
enlarged (k 1) or reduced (k 1) k times of the original one along the y-axis to give the graph of y kf (x).
enlarged (k 1) or reduced (k 1) times of the
original one along the x-axis to give the graph of y f (kx).k
1