Embed Size (px)
Citation preview

Key Policies Improving Business and Investment Climate
Presenter:Governor CBBH: Kemal Kozarić, MA

Content
Introduction through macroeconmic frameworkTrade deficitRecommendationsForeign direct investmentCBBH expectationConclusion

Introduction
There are many preconditions for the growth of one small open economy as it is economy of BH, but some of the main preconditions are:
Good business environmentFinancial stability of the countryLegal frameStabile exchange rate

Introduction
Year 1998 1999 2000 2001 2002 2003 2004 2005 2006
Nominal GDP in KM billions 7,2 9,7 10,7 11,6 12,8 13,4 14,6 15,8 17,9*
Retail price growth (%) 13.3 3.7 4.8 3.1 0.4 0.6 0.4 3.8 7.4**
Foreign reserves in KM millions 283 866 1021 2696 2464 2781 3457 4195 5400
Foreign reserves in months of imports 0.5 1.4 1.5 3.6 3.2 3.4 3.9 4.2 5.4
Trade deficit in KM millions -5,482 -6,053 -5,868 -6,470 -6,892 -7,180 -7,193 -7,834 -6,655
Achieved results in referred period:
*Estimate CBBH** Inflation in Janury was 1.2%

Trade deficit
17
19
21
23
25
27
29
31
2001 2002 2003 2004 2005 2006
Foreign reserves
2
2,53
3,54
4,5
55,5
6
2001 2002 2003 2004 2005 2006
Foreign reserves in months of imports
Goods Services IncomeCurrent
Transfers TotalCapital Account
Financial Account Total
1998. -75.7% 4.6% 19.7% 43.0% -8.4% 12.0% -7.3% 4.8% 3.6%
1999. -62.1% 3.4% 13.7% 35.5% -9.4% 11.8% -6.9% 4.8% 4.6%
2000. -54.8% 3.7% 11.7% 31.5% -7.8% 10.8% 0.1% 10.9% -3.1%
2001. -55.8% 4.3% 10.0% 27.4% -14.1% 7.5% 4.5% 12.0% 2.0%
2002. -53.7% 3.5% 8.2% 22.9% -19.1% 6.6% 10.8% 17.4% 1.7%
2003. -53.4% 4.3% 6.9% 21.3% -20.9% 6.0% 11.1% 17.0% 3.9%
2004. -49.0% 4.6% 5.2% 20.0% -19.2% 4.6% 10.2% 14.9% 4.4%
2005. -49.6% 4.9% 4.5% 18.9% -21.3% 4.1% 12.8% 16.9% 4.3%
2006 -37.1% 5.3% 4.0% 16.4% -11.4% 3.0% 4.0% 7.0% 4.4%
YearCurrent Account Capital and Financial Account Net Errors
and Omissions
GDP%
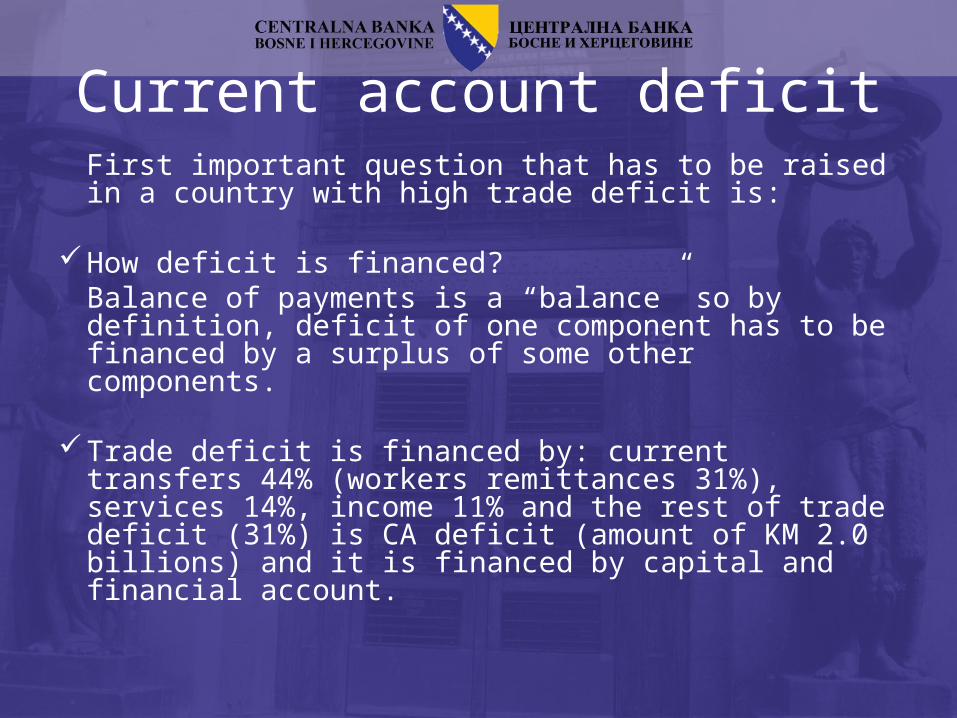
Current account deficitFirst important question that has to be raised in a country with high trade deficit is:
How deficit is financed? Balance of payments is a “balance” so by definition, deficit of one component has to be financed by a surplus of some other components.
Trade deficit is financed by: current transfers 44% (workers remittances 31%), services 14%, income 11% and the rest of trade deficit (31%) is CA deficit (amount of KM 2.0 billions) and it is financed by capital and financial account.

Current account deficitHow CA deficit is financed and is it sustainable?
If currency crisis and foreign debt crisis are not a threat for the country, CA deficit is sustainable.
CA deficit is financed by: capital transfers to public sector 21%, FDI 27% and other investments 51%.
In some economies deficit is financed by foreign reserves reduction. In BH CA deficit is not followed by foreign reserves reduction.
In BH foreign reserves are growing and in 2006 foreign reserves increased by KM 1.2 billions.

Foreign reserves CBBH
DATE FOREIGN ASSETS MONETARY LIABILITIES FREE RESERVES
DEC. 1997. 144,1 160,3 - 16,2
DEC. 1998. 283,3 253,9 29,4
DEC. 1999. 865,7 836,7 29,0
DEC. 2000. 1021,4 973,2 48,0
DEC. 2001. 2696,5 2591,6 75,0
DEC. 2002. 2464,4 2345,2 118,1
DEC. 2003. 2.780,6 2.626,3 153,3
DEC. 2004. 3.457,5 3.283,5 173,0
DEC. 2005. 4.195,9 4.007,8 187,1
DEC. 2006. 5.400,4 5.178,0 221,4
End of period in millions of KM

Current account deficitSecond important question that has to be raised in a country with high trade deficit is:
What is a reason behind trade deficit increase? Undertake adequat steps.

Exports
• Analyze refers to the commodities that BH exports the most .• About 4500 commodities were used. Only 22 commodities that contribute to export growth with more than KM 36 million per year were closely analyzed• 22 commodities explain 49 % of total exports in 2006.
Total value of Coverage exports for countries Five countries
Aluminum Alloys 476,676,032.47 Croatia 38.8% Italy 25.0% Austria 21.2% Slovenia 4.8% Poland 3.1% 92.8%Parts of Compression-ignition Internal Combustion Piston Engines
313,420,420.61 Hungary 39.5% Slovenija 39.2% Germany 20.8% Croatia 0.1% S and MN 0.1% 99.7%
Electrical Energy 252,027,032.13 Croatia 45.8% Switzerland 27.8% Slovenia 13.8% Czech. R 7.5% Germany 4.4% 99.2%Other Aluminium Oxide 195,785,699.67 USA 84.9% Poland 9.3% Romenia 4.6% Slovenia 0.7% S and MN 0.0% 99.6%Parts of Seats Other than Dentists' 160,491,132.69 Germany 51.2% France 12.8% Slovenia 5.2% Hungary 1.2% S and MN 0.1% 70.6%Concrete reinforcing bars and rods, Hot-rolled, Hot-drawn, Hot-extruded
149,396,336.41 Slovenia 43.8% Croatia 33.9% S and MN 20.9% Hungary 0.9% Italy 0.0% 99.5%
Iron Ores and Concentrates (Non-agglomerated) 118,438,666.27 Romania 41.2% Poland 36.6% Czech. R 15.7% Italy 6.5% USA 0.0% 100.0%Coke, Semi-coke of Coal, of Lignite, of Peat; Retort Carbon 109,376,070.02 S and MN 67.8% Croatia 2.1% Macedonia 0.8% Italy 0.4% Slovenija 0.3% 71.4%Coniferous 93,390,529.62 S and MN 57.3% Slovenia 3.5% Austria 3.2% Italy 0.9% Slovenia 0.2% 65.1%Bars and Rods Of circular cross section measuring less than 14 mm (0.55 inch) in diameter
91,479,122.33 S and MN 42.1% Macedonia 30.0% Croatia 14.0% Italy 8.9% Macedonia 0.8% 95.8%
Of beech (Fagus spp) 84,085,035.87 Croatia 21.4% Italy 18.3% Slovenia 16.7% Austria 9.7% Germany 9.6% 75.6%Uppers and Parts Thereof, Other than Stiffeners 62,123,145.81 Germany 31.8% Italy 29.6% Slovenia 18.7% Austria 15.3% Croatia 0.7% 96.1%Seats, With Wooden Frames, Upholstered 62,053,049.47 Germany 43.9% Croatia 21.2% Italy 11.9% Austria 5.1% S and MN 4.9% 87.0%Other Structures and Parts of Structures, of Iron or Steel 57,117,100.90 Croatia 46.2% UK 13.0% Germany 12.1% Slovenia 8.2% Austria 4.7% 84.3%Other Wooden Furniture 52,077,835.09 Germany 36.7% S and MN 18.9% S and MN 18.1% France 6.2% Slovenia 5.2% 85.0%
Equipment for scaffolding, shuttering, propping or pit-propping 50,030,296.33 Italy 62.0% Croatia 9.4% Croatia 5.9% Romenia 3.3% Austria 1.0% 81.6%
Footwear, Covering the Ankle, With Uppers of Leather 49,390,399.92 Italy 77.6% S and MN 2.4% Austria 2.4% France 2.0% Russia 1.3% 85.8%Copper waste and scrap 43,761,655.83 Germany 70.5% Slovenia 27.1% Italy 2.1% Switzerland 0.1% n/a* 99.8%Grill, netting and fencing, welded at the inter-section, of wire with a maximum cross-sectional dimension of 3 mm or more and having a mesh size of 100 cm2
39,900,661.13 Croatia 74.8% Croatia 6.0% n/a* n/a* n/a* 80.8%
Other Electric Conductors, Fitted With Connectors, Voltage 80-1, 000v854459 Other Electric Conductors, Exceeding 80v But Not Exceeding 1, 000v
39,375,025.93 S and MN 34.7% Slovenia 32.7% Slovenia 23.8% Macedonia 4.5% Hungary 0.9% 96.7%
Whole Hides and Skins of Bovine Animals (Fresh or Wet-salted) 37,366,997.89 Austria 45.3% Holland 0.6% Germany 0.2% Turkey 0.2% n/a* 46.3%
Silicon 36,480,534.52 Italy 79.3% Hungary 5.5% Slovenia 3.7% Germany 3.3% Poland 2.1% 93.8%
Top five BH exportersCommodity
1 2 3 4 5

Imports
• Analyze refers to the commodities that BH imports the most .• About 4500 commodities were used. Only 19 commodities that contribute to imports growth with more than KM 65 million per year were closely analyzed• 19 commodities explain 36,8 % of deficit in 2006 and their total participation in imports during 2006 is 27%.
Total value of Coverageimports for countries Five countries
Other oils 896,137,203.39 Croatia 59.3% Slovenia 15.4% Hungary 7.3% Austria 6.4% S and MN 5.3% 93.7%Petroleum Oils, Oils Obtained from Bituminous Minerals
310,951,343.56 Croatia 65.0% Slovenia 14.5% Hungary 11.2% S and MN 4.6% Austria 3.3% 98.6%
Parts of Compression-ignition Internal Combustion Piston Engines
203,338,340.88 Germany 97.5% S and MN 0.6% Italy 0.3% Switzerland 0.3% Slovenia 0.2% 99.0%
Other Vehicles, Spark-ignition Engine Of a cylinder capacity exceeding 1,500 cc but not exceeding 2,500 cc
196,150,326.60 Germany 40.0% Czech. R 16.8% Slovenija 5.0% Austria 4.2% Slovakia 3.8% 69.7%
Natural Gas 145,512,021.87 Russia 100.0% n/a n/a n/a n/a n/a 100.0%Other Medicaments 145,134,757.56 Slovenia 22.1% Croatia 17.6% S and MN 17.5% Switzerland 6.0% Macedonia 5.2% 68.5%Other Aluminium Oxide 130,459,666.04 Switzerland 99.6% Germany 0.4% Slovenia 0.0% Italy 0.0% Holand 0.0% 100.0%Bituminous Coal 123,612,472.27 Czech. R 42.3% UK 27.5% USA 26.0% Russia 1.5% Croatia 0.3% 97.6%Cigarettes (Containing Tobacco) 119,212,684.46 Croatia 66.7% Switzerland 12.8% Germany 7.2% Austria 5.7% Macedonia 3.0% 95.3%Beer Made from Malt 111,723,042.79 S and MN 50.2% Croatia 43.1% Slovenia 6.4% Austria 0.1% Germany 0.1% 99.7%Electrical Energy 107,658,661.90 Switzerland 50.6% Slovakia 26.9% Czech. R 19.8% S and MN 1.2% Croatia 1.1% 99.7%Other Vehicles, Spark-ignition Engine Of a cylinder capacity exceeding 1,000 cc but not exceeding 1,500 cc
100,002,206.77 Czech. R 43.8% Germany 15.7% Croatia 13.7% Italy 7.3% Slovenia 4.8% 85.3%
Parts of Air or Vacuum Pumps 86,170,429.56 Austria 44.9% Germany 23.6% France 12.5% Slovenia 11.7% Hungary 3.1% 95.8%Seed, White, Other 77,980,437.48 Hungary 75.6% Croatia 16.5% S and MN 7.2% Austria 0.4% USA 0.2% 99.9%Other Food Preparations 75,862,455.80 Slovenia 27.7% Croatia 26.9% Germany 6.8% Hungary 5.3% Italy 5.2% 72.0%Other Ferrous Waste and Scrap 75,010,288.44 S and MN 40.4% Croatia 25.3% Romenia 13.7% Germany 8.6% Macedonia 8.4% 96.6%Organic Surface-active Agents, Washing and Cleaning Preparations for Retail Sale
71,577,928.40 Croatia 39.6% Romenia 24.4% Czech. R 18.5% Switzerland 4.3% Italy 4.0% 90.9%
Other Cane or Beet Sugar 70,557,045.76 Croatia 43.4% Austria 17.5% Czech. R 7.6% Hungary 5.3% S and MN 4.8% 78.6%Other Non-alcoholic Beverages 66,545,154.62 S and MN 38.3% Croatia 25.6% Slovenia 23.4% Macedonia 5.4% Austria 2.3% 95.0%
Top five BH importersCommodity
1 2 3 4 5
Bilješka:Analiza se odnosi na proizvode koje BiH najviše uvozi i koji samim tim doprinose produbljenju trgovinskog deficita. Korišteno je nešto više od 4500 proizvoda i izdvojeno je devetnaest proizvoda koje BiH uvozi u ukupnom iznosu, po proizvodu tokom 2006. godine, većem od 65 miliona KM. Ovih izdvojenih devetnaest proizvoda objašnjavaju 36,8 % deficita u 2006. godini, a njihovo ukupno učešće u uvozu tokom 2006. godine iznosi 27%. Pošto uporedimo uvoz svakog u tabeli izdvojenog proizvoda i sa vrijednošću izvoza po odgovarajućoj tarifnoj oznaci, dolazimo do zaključka da sa šesnaest proizvoda ostvarujemo deficit dok samo sa tri proizvoda ostvarujemo suficit. Proizvodi sa kojima ostvarujemo suficit su: električna energija (144,4 miliona KM suficita), aluminijev oksid osim umjetnog korunda (65,3 miliona KM suficita) i ostali proizvodi isključivo namjenjeni za motore tarifnog broja 8407 i 8408 (grupe klipnih motora sa unutrašnjim sagorijevanjem) gdje suficit ostvaren po ovoj grupi proizvoda iznosi 110,1 milion KM.

Recommendations In order to improve external trade situation in BH it would be
recommended to conduct a detailed micro analyze of goods that have the highest influence on BH import increase by identifying all main trading partners in foreign trade exchange, as well as, their price, quantity and type of imported goods.
Improve BH agriculture policy by promoting BH agriculture on international market and especially by solving internal limitations and obstacles for the exports.
Special attention should be given to development of export capacities of the country and especially to the component of raw materials which should not be exploit. Focus for development should be on export of final goods and products.
Encourage infrastructure development in the field of quality standard certification in accordance with EU rules.

Foreign direct investmentDuring 2006 FDI inflow continued but with a weaker intensity compared to 2005.
Estimated FDI inflow in 2006 is about KM 661* million.
-19.1% -20.9%-19.2%
-21.3%
-11.2%
4.9% 5.2% 3.7%
8.5%12.2%
6.0%4.3%
7.1%4.5%
7.7%
-25.0%
-20.0%
-15.0%
-10.0%
-5.0%
0.0%
5.0%
10.0%
15.0%
2002 2003 2004 2005 2006
CA Deficit Direct investment Other investment
FDI in GDP%
*Final data on FDI for 2006, based on CBBH survey will be available in August 2007

Foreign direct investment By survey that CBBH conducts on regular basis, FDI for the first nine months of 2006 reached amount of KM
428.7 millions.
CBBH conducts regular quartarly (150 companies) and yearly (around 700 companies) survey on FDI and collects data on companies and banks with foreign investments in BH in accordance with interantional methodology.
Based on survey highest investment capital in the first nine months of 2006 came from Austria 50.6%, then follows Slovenia 27.3%, Serbia and MN 5.3% and Croatia with 4.9%.

Foreign direct investment Regarding the sectorial structure the highest investment were
recorded in banking sector 51%, manufacturing sector 21% and non-banking financial enterprises 15% out of total FDI.
In tourism sector which presents one of the potentials for BH development, according to survey, no significant improvement has been done in regards to increase in investment inflow that would indicate a better perception of BH by potential foreign investors.
Already announced higher future investments in energy sector and privatization of telecom operators are expected to have a significant influence in BH investment position in 2007.

Foreign direct investment
State of foreign investments : Is a separate statistical category and it does not represent a sum
of all previous flows, but also other changes such as exchange rate differentials, accounting changes, etc.
Foreign investments at the end of 2005 amounted to KM 7.3 billion.
Foreign direct investment amount to KM 4.4 billion, and portfolio and other investments to KM 2.9 billion.
Total foreign investment in 2005 increased by 26% compared to 2004.

Foreign direct investments
When compared to the region and thinking of a size of BH economy, it can be seen from the graph and estimated that BH is reciving a significant inflow of FDI*.
Source: data from "Transition report 2006" and CBBH estimates for 2006
*Final data on FDI for 2006, based on CBBH survey will be available in August 2007
-1000
100200300400500600700800
Rom
enia
Bul
garia
Hun
gary
Cro
atia
Ser
bia
Mon
tene
gro
BH
Mac
edon
ia
Alb
ania
Mol
dova
Slo
veni
a
2003 2004 2005 2006
FDI per capita in USD

CBBH expectations• Presented data are showing that there is a space for investment
inflow in BH to come, but in order for investments to come promotion of investment and necessary conditions preparation requires more aggressive approach and the best way is through efficiency in reform scenario implementation.
• Political stability, economic progress, as well as, country’s image, represents the key elements for FDI inflow in single economy.
• Economic growth can be achieved through intensive development of the real sector of the economy, through efficiency in reform implementation and especially through fiscal reforms and through setting up the conditions for strengthening of the business environment.

CBBH expectationsThe part that is related to fiscal reforms is mainly related to:
Adequate allocation of public revenues Decrease public spending Improve transparency and responsibility in collection and spending of
the public revenues Support development of entrepreneurship and encourage growth of the
private sector and work on constant decrease of the political risk
Establish business environment Strengthening of a single economic space in BH Improve efficiency of the legal system Establish legal and institutional framework for free competition and
consumer protection Stimulate regional economic development Increase mobility of the labor force Remove all administrative barriers to domestic and foreign investments

Conclusion• There is still a lot of work on which country as a whole needs to
work more on its way toward stability.
• Macroeconomic frame is very important, economic activity has to be measured in details by sectors and the rate of growth, as well as, productivity, competitiveness, real effective exchange rate, transparency etc.
• Potential of the real sector of the economy has to be used for future development of BH economy.
• This should be recognized by all levels of the government, as well as, by appropriate institutions which should work together continuously on the implementation of reforms that will lead BH towards a road of a desired development.