Embed Size (px)
Citation preview
K
PN
a
ARAA
KVTSSAPLRLLRR
1
suteldcrid
s&atp
a
1d
Journal of Chromatography B, 877 (2009) 2224–2234
Contents lists available at ScienceDirect
Journal of Chromatography B
journa l homepage: www.e lsev ier .com/ locate /chromb
ey aspects of analytical method validation and linearity evaluation�
edro Araujo ∗
ational Institute of Nutrition and Seafood Research (NIFES), PO Box 2029, Nordnes, N-5817 Bergen, Norway
r t i c l e i n f o
rticle history:eceived 2 July 2008ccepted 29 September 2008vailable online 2 October 2008
eywords:alidationerminologyelectivitypecificity
a b s t r a c t
Method validation may be regarded as one of the most well-known areas in analytical chemistry as isreflected in the substantial number of articles submitted and published in peer review journals everyyear. However, some of the relevant parameters recommended by regulatory bodies are often used inter-changeably and incorrectly or are miscalculated, due to few references to evaluate some of the termsas well as wrong application of the mathematical and statistical approaches used in their estimation.These mistakes have led to misinterpretation and ambiguity in the terminology and in some instancesto wrong scientific conclusions. In this article, the definitions of various relevant performance indicatorssuch as selectivity, specificity, accuracy, precision, linearity, range, limit of detection, limit of quantitation,ruggedness, and robustness are critically discussed with a view to prevent their erroneous usage and
ccuracyrecisioninear function analysisangeimit of detectionimit of quantitation
ensure scientific correctness and consistency among publications.© 2008 Elsevier B.V. All rights reserved.
cgIs[idlacmtims
uggednessobustness
. Introduction
The word validation originates from the Latin validus meaningtrong, and suggests that something has been proved to be true,seful and of an acceptable standard. The International Organiza-ion for Standardization defines validation as the confirmation byxamination and provision of objective evidence that the particu-ar requirements for a specified intended use are fulfilled [1]. Thisefinition primarily implies that a detailed investigation has beenarried out and gives evidence that an analytical method, when cor-ectly applied, produces results that are fit for purpose as well ast confirms the effectiveness of the analytical method with a highegree of accuracy.
The importance of method validation has been emphasisedince the late 40’s when the American Chemical Society and Merck
Co., raised the issue of how mathematics and statistics arenecessary prerequisite to successful development and adapta-
ion of new analytical methods [2,3]. By that time a survey ofapers on development of analytical methods revealed that no
� This paper is part of a special issue entitled “Method Validation, Comparisonnd Transfer”, guest edited by Serge Rudaz and Philippe Hubert.∗ Tel.: +47 95285039; fax: +47 55905299.
E-mail address: [email protected].
oASMmTa(tn
570-0232/$ – see front matter © 2008 Elsevier B.V. All rights reserved.oi:10.1016/j.jchromb.2008.09.030
omparisons were carried out with other or similar methodolo-ies in order to check for accuracy in the reviewed articles [4].n addition, it was pointed out that statistical data analysis was aubject neglected by chemists developing experimental methods3]. In the early 70’s a series of articles were published stress-ng the need of implementing a consistent set of definitions foretermining the performance-characteristics of developed ana-
ytical methods and comparing unambiguously the advantagesnd disadvantages of the increasing volume of reported analyti-al methods [5–8]. This paved the way for the implementation ofethod validation in analytical laboratories since the late 70’s and
he current worldwide recognition that method validation is anmportant component in any laboratory engaged in the develop-
ent and establishment of standard methods. Nowadays, there areeveral international renowned organisations offering guidelinesn method validation and related topics. Basic references are thessociation of Official Analytical Chemists (AOAC), the Americanociety for Testing and Material (ASTM), the Codex Committee onethods of Analysis and Sampling (CCMAS), the European Com-ittee for Normalization (CEN), the Cooperation on International
raceability in Analytical Chemistry (CITAC), the European Cooper-tion for Accreditation (EA), the Food and Agricultural OrganizationFAO), the United States Food and Drug Administration (FDA),he International Conference on Harmonization (ICH), the Inter-ational Laboratory Accreditation Cooperation (ILAC), The World
r. B 87
HSCl
ieemppmt
scis
ates
2
ss
2
trehtpes
2
ftiimtee
2
d6lwsls
2
iaaeatcats
2
gsia
3
citaEisTmala
3
iwitpmtiUtststsibt
P. Araujo / J. Chromatog
ealth Organization (WHO), the International Organization fortandardization (ISO), the International Union of Pure and Appliedhemistry (IUPAC), the United States Pharmacopeia (USP), The ana-
ytical chemistry group EURACHEM, etc.Articles are submitted for publication every year highlight-
ng the determination of the parameters for method validationnforced by any of the above-mentioned regulatory bodies. How-ver, in spite of the volume of articles submitted and publishedisinterpretation and miscalculation still persists due to some
revailing ambiguity in the definitions of some of the validationarameters, few existing guidelines to estimate some of them, andost importantly lack of attention to the mathematical and statis-
ical tools involved in their calculation.This article discusses some key aspects that should be con-
idered when validating analytical methods, especially thoseoncerning chromatography methods, in order to derive usefulnformation from experimental data and to draw robust conclu-ions about the validity of the method.
Although the aspects described in this article apply to all types ofnalytical methods, in some instances they may not be applicableo certain analytical procedures. For instance, some animal mod-ls bioassays or some immunoassays have unique features whichhould be considered before submitting a validation report.
. The general method validation steps
In a general context, method validation is a process that con-ists of at least five distinct steps, namely: system qualifications,ampling, sample preparation, analysis and data evaluation.
.1. System qualifications
A general evaluation of system qualifications allows to verifyhat the instrument is suitable for the intended analysis, the mate-ials (reagents, certified references, external and internal standards,tc) are suitable for use in analytical determinations, the analystsave the proper training and qualifications and previous documen-ation such as analytical procedures, proper approved protocol withre-established acceptance criteria has been reviewed. If the gen-ral qualifications of a system are ignored and a problem arises, theource of the problem will be difficult to identify [9].
.2. Sampling
The sampling step assists in the selection of a representativeraction of the material which is subsequently subjected to inves-igation. The choice of an appropriate sampling method is of greatmportance because it provides assurances that the sample selecteds truly representative of the material as a whole for the purpose of
eaningful statistical inferences. Within the statistical literature,here is a substantial body of work on sampling strategies, how-ver the relative costs and time involved in each strategy should bevaluated in advance.
.3. Sample preparation
Sample preparation is a key element to successful method vali-ation. It has been pointed out that sample preparation represents
0–80% of the work activity and operating costs in an analyticalaboratory [10]. The literature on sample preparation is ample andell documented. However, the analyst should remember that the
election of a specific preparation procedure depends upon the ana-ytes, the analytical concentrations, the sample matrix, the sampleize and the instrumental technique.
fii
3
c
7 (2009) 2224–2234 2225
.4. Analysis
The analysis is related to the instrument used to extract qual-tative or quantitative information from the samples with ancceptable uncertainty level. The analysis could be visualised, inbroad sense, as a system possessing three interconnected basic
lements, namely input → converter → output. In general, the inputnd output are designated by the letters x and y and they representhe concentration and the experimental response respectively. Thehoice of a particular analysis is based on many considerations, suchs the chemical properties of the analytical species, the concentra-ion of the analytes in the sample, the matrix of the sample, thepeed and cost, etc.
.5. Data evaluation
The main purpose of data evaluation is to summarise andain insight into a particular data set by using mathematical andtatistical approaches. Data evaluation allows extracting usefulnformation and drawing conclusions about the inputs and outputs,nd most importantly about the validation process in general.
. Validation method parameters
In the early 80’s, it was pointed out that the definition of theharacteristic parameters for method validation and related top-cs were different between the existing organizations [11]. In 1990,he International Conference on Harmonization (ICH) was createds a unique project to bring together the regulatory authorities ofurope, Japan and the United States with the objective of achiev-
ng greater harmonization of parameters, requirements and, toome extent, also methodology for analytical method validation.he key criteria defined by the ICH and by other industrial com-ittess and regulatory agencies around the world for evaluating
nalytical methods are: selectivity/specificity, accuracy, precision,inearity, range, limit of detection, limit of quantitation, ruggedness,nd robustness.
.1. Selectivity and specificity
The terms selectivity and specificity have been the subject ofntensive critical comments essentially focusing on the ways in
hich they are often defined by analysts working in method val-dation [12–15]. By definition the selectivity refers to the extento which a method can determine a particular analyte in a com-lex mixture without interference from other components in theixture [16]. This definition is often wrongly used as equivalent
o specificity, which is considered to be the ultimate in selectiv-ty; it means that no interferences are supposed to occur [12].nfortunately, an inspection of the literature on method valida-
ion revealed that both terms are still used without distinction byome authors, even though by consulting the dictionary it is clearhat these terms should not be used interchangeably. Selectivityhould be connected with the word ‘choose’ while specificity withhe word ‘exact’. In this context, it is incorrectly to grade the termpecificity (either you have it or you do not). An analyst involvedn method validation should always remember that selectivity cane graded as low, high, bad, partial, good, etc., in order to choosehe appropriate category for a particular purpose. The term speci-city refers always to 100% selectivity [13,17,18] or, conversely, 0%
nterferences.
.1.1. Experimental approaches to assess selectivityDuring the last decade, some researchers have expressed con-
ern about the lack of comprehensive recommendations from
2226 P. Araujo / J. Chromatogr. B 877 (2009) 2224–2234
pectro
atpip
2
3
23
gpehatdtpadAoqampcFsaau
ie
3
verence value. It has been pointed out that the accuracy is the mostcrucial aspect that any analytical method should address [23]. Thedetermination of this parameter allows estimating the extent towhich systematic errors affect a particular method. The preced-ing definition of accuracy is in accordance with several regulatory
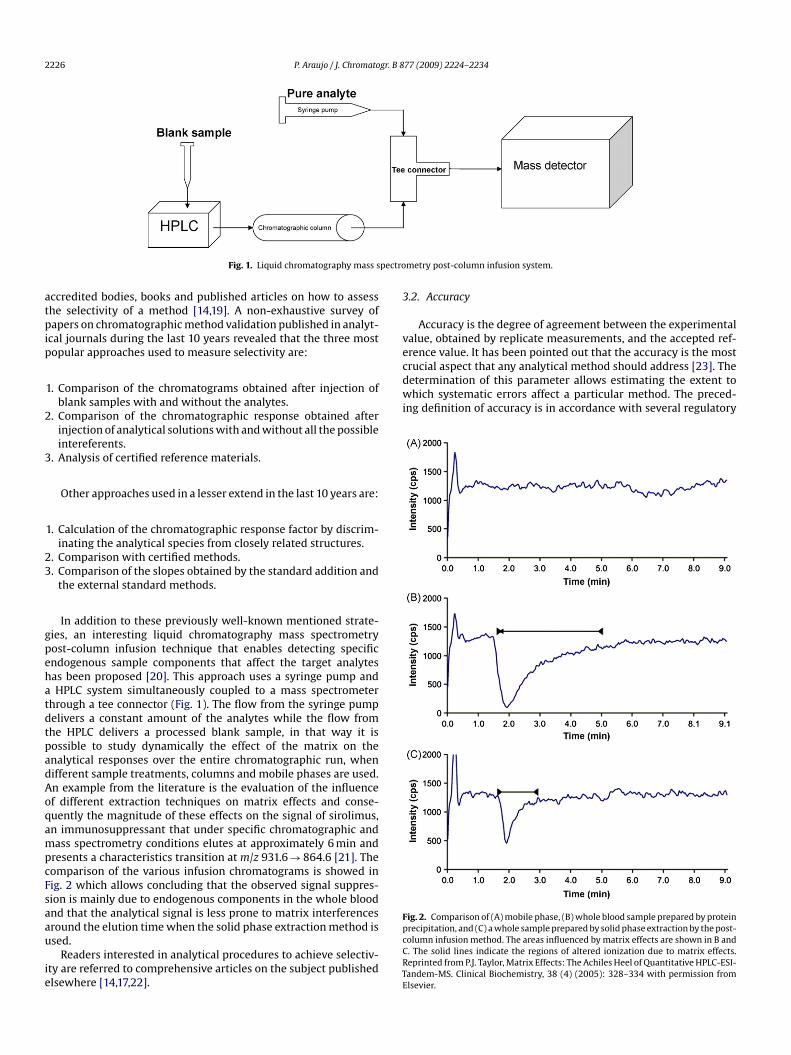
Fig. 1. Liquid chromatography mass s
ccredited bodies, books and published articles on how to assesshe selectivity of a method [14,19]. A non-exhaustive survey ofapers on chromatographic method validation published in analyt-
cal journals during the last 10 years revealed that the three mostopular approaches used to measure selectivity are:
1. Comparison of the chromatograms obtained after injection ofblank samples with and without the analytes.
. Comparison of the chromatographic response obtained afterinjection of analytical solutions with and without all the possibleintereferents.
. Analysis of certified reference materials.
Other approaches used in a lesser extend in the last 10 years are:
1. Calculation of the chromatographic response factor by discrim-inating the analytical species from closely related structures.
. Comparison with certified methods.
. Comparison of the slopes obtained by the standard addition andthe external standard methods.
In addition to these previously well-known mentioned strate-ies, an interesting liquid chromatography mass spectrometryost-column infusion technique that enables detecting specificndogenous sample components that affect the target analytesas been proposed [20]. This approach uses a syringe pump andHPLC system simultaneously coupled to a mass spectrometer
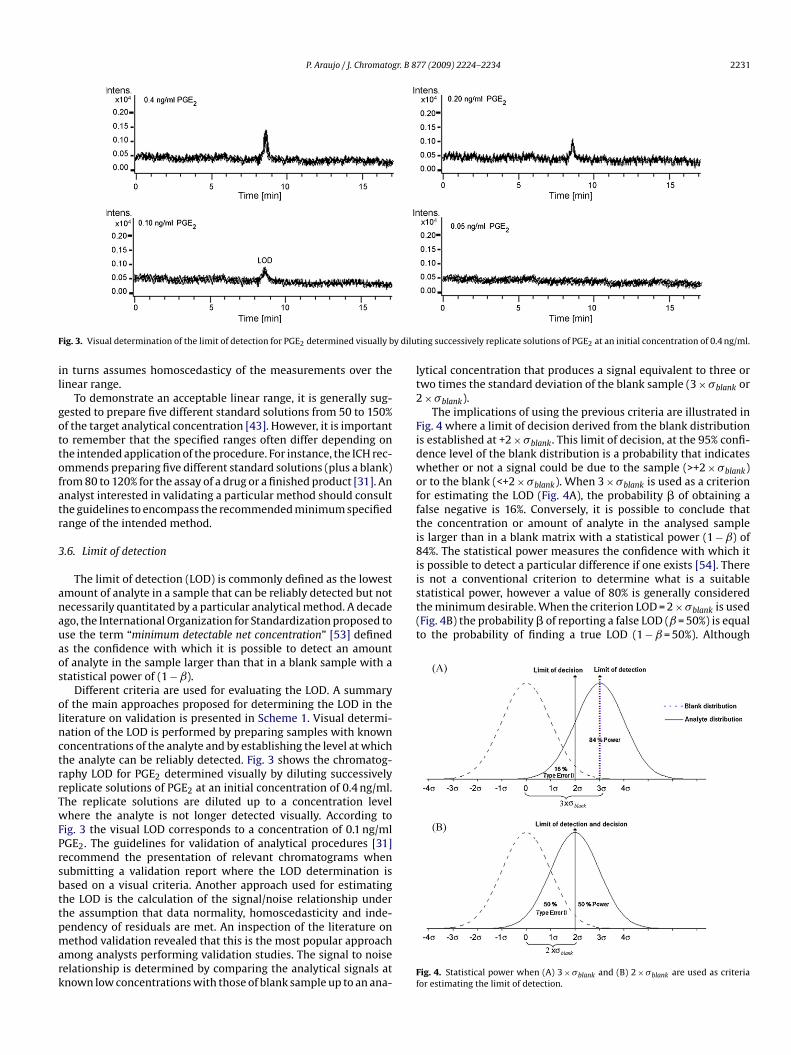
hrough a tee connector (Fig. 1). The flow from the syringe pumpelivers a constant amount of the analytes while the flow fromhe HPLC delivers a processed blank sample, in that way it isossible to study dynamically the effect of the matrix on thenalytical responses over the entire chromatographic run, whenifferent sample treatments, columns and mobile phases are used.n example from the literature is the evaluation of the influencef different extraction techniques on matrix effects and conse-uently the magnitude of these effects on the signal of sirolimus,n immunosuppressant that under specific chromatographic andass spectrometry conditions elutes at approximately 6 min and
resents a characteristics transition at m/z 931.6 → 864.6 [21]. Theomparison of the various infusion chromatograms is showed inig. 2 which allows concluding that the observed signal suppres-
ion is mainly due to endogenous components in the whole bloodnd that the analytical signal is less prone to matrix interferencesround the elution time when the solid phase extraction method issed.Readers interested in analytical procedures to achieve selectiv-ty are referred to comprehensive articles on the subject publishedlsewhere [14,17,22].
FpcCRTE
metry post-column infusion system.
.2. Accuracy
Accuracy is the degree of agreement between the experimentalalue, obtained by replicate measurements, and the accepted ref-
ig. 2. Comparison of (A) mobile phase, (B) whole blood sample prepared by proteinrecipitation, and (C) a whole sample prepared by solid phase extraction by the post-olumn infusion method. The areas influenced by matrix effects are shown in B and. The solid lines indicate the regions of altered ionization due to matrix effects.eprinted from P.J. Taylor, Matrix Effects: The Achiles Heel of Quantitative HPLC-ESI-andem-MS. Clinical Biochemistry, 38 (4) (2005): 328–334 with permission fromlsevier.

P. Araujo / J. Chromatogr. B 877 (2009) 2224–2234 2227
Table 1Requested conditions to measure the different precision components according to the ISO/DGuide 99999 [33].
bticcic[Ui“5dw
ra
2
3
4
cs
tadpmTill
td
p
brvntcaacm
bmcwlmmafap(
3
uccTpvtmt
alo
*One or more conditions should be changed.
odies (ICH, FDA, and USP) and the IUPAC. However, it is importanto mention that this definition is acknowledged by other accred-ted organisations as trueness or bias and the term accuracy as theombination of trueness and precision (ISO, EURACHEM, AMC). Theoncept of trueness as is stated in ISO-5725-1 has been inventedn order to address some philosophical objections among medi-al and legal practitioners regarding the concept of statistical bias24,25]. In this article, the term accuracy as defined by ICH, FAD,SP and IUPAC is used because it seems to be the preferred term
n scientific journals. A ScienceDirect search using the keywordsvalidation trueness” and “validation accuracy” showed that only5 articles used the former keywords while 3876 the latter. Theifference becomes more dramatic when the search is performedithout using the word “validation”.
Several approaches have been suggested to evaluate the accu-acy of a method. The main strategies currently used to assess theccuracy are:
1. Measuring the analyte in a particular reference material andcomparing the result with the certified value.
. Measuring the analyte in blank matrix samples spiked withknown analytical concentrations and determining the percent-age of recovery.
. Comparing the results from the method under validation withthose from a reference method.
. Determining the analytical concentration in the sample bymeans of the standard addition technique.
The first strategy should be used as long as the reference materiallosely resembles the analytical concentration and the matrix of theample under investigation.
The second strategy, despite its popularity, it has the disadvan-age that the accuracy can be misestimated if the spiked analytend the analyte contained in the sample behave differently due toissimilarities in their chemical form and reactivity. For speciationurposes this approach is not recommended [26]. The IUPAC Har-onised Guidelines for In-House Validation of Methods of Analysis
echnical Report recommends the use of the second approach onlyn cases where the method under validation is intended either foriquid samples or samples subjected to total destruction or disso-ution [27].
A ‘reference method’ in the context of the third strategy referso a nationally or an internationally fully validated method withifferent or similar measurement principles and sources of errors.
The fourth strategy is generally used in cases where blank sam-les are unavailable.
tratu
Another reported strategy to assess the accuracy of a method haseen taking part in proficiency test schemes in order to compare theesults of a particular method under validation with the consensusalue obtained by the participating laboratories [28,29]. Unfortu-ately, the seconders of this proposal have not taken into accounthat proficiency testing is aimed at monitoring performance andompetence of individual accredited laboratories [30] rather thanssessing the accuracy of newly developed methods. It is irrational,nd contrary to the general requirements for participating in profi-iency testing, to take part in such schemes without a fully validatedethod.
The guidance for validation of analytical procedures issuedy the ICH recommends checking the accuracy by performing ainimum of nine determinations over a minimum of three con-
entration levels (low, medium and high) corresponding to thehole analytical range investigated (3 levels × 3 replicates per
evel = 9 determinations) [31]. Although, this minimum require-ent is suitable in general for chromatographic or spectroscopyethods, the analyst should follow the recommendations suit-
ble for his/her particular method. For instance, the FDA guidanceor validation of bioanalytical methods suggests evaluating theccuracy by measuring a minimum of three concentration levelsrepared in pentaplicate in the range of expected concentrations3 levels × 5 replicates per level = 15 determinations) [32].
.3. Precision
The term precision is defined by the ISO International Vocab-lary of Basic and General Terms in Metrology (ISO-VIM) as theloseness of agreement between quantity values obtained by repli-ate measurements of a quantity under specified conditions [33].he determination of this parameter is one of the basic steps in therocess of achieving repeatability and reproducibility in methodalidation. Assessing the precision implies expressing numericallyhe random error or the degree of dispersion of a set of individual
easurements by means of the standard deviation, the variance orhe coefficient of variation.
The regulatory bodies emphasize that the terms precision andccuracy should not be used as synonyms. A literature review of theast decade demonstrated that analysts engaged in validating meth-ds are well aware of the difference between these terms. However,
he review revealed that in many instances, the terms repeatability,eproducibility and intermediate precision are used interchange-bly. The reader should keep in mind that the word repeatability inhe present context, refers to obtaining the magnitude of a partic-lar property of a sample more than once by keeping constant the
2 gr. B 8
gcrcetmges
•
•
•
•
ompu[tpcb
3
ont(
E
waFdt(mdiictl
E
E
o
E
ittfruraaceee
eaIsa
3
ttqtv
tHaemrtmbn
•
•
•
mvi5a
228 P. Araujo / J. Chromato
lobal factors (human, preparation, instrumental and geographi-al) over a short period of time; the term reproducibility refers toeproduce the magnitude of an already measured property byhanging one or more of the global factors over a short or anxtended period of time; and the term intermediate precision referso obtaining the magnitude of a particular property of a sample
ore than once by using the same preparation, instrumental andeographical condition over an extended period of time. The differ-nces between the three above mentioned precision componentshowed in Table 1 allow to derive the following conclusions:
It is wrong to report a so-called “inter-day repeatability” term.Such a term should never be used in method validation.The term inter-day variation should be connected with interme-diate precision or in some circumstances with reproducibility.The repeatability always ensures that the variability of the resultsremains constant under identical conditions and also that factorssuch as analyst, procedures, instrumental conditions, laborato-ries, and time have a negligible contribution to the variability ofthe results.The reproducibility always makes certain that the variability ofthe results remains constant under different conditions and thatthe variation of one or more factors does not contribute signifi-cantly to the variability of the results.
For validation of chromatographic methods, it is generally rec-mmended checking the precision component by measuring ainimum of three concentration levels (low, medium and high)
repared in triplicate and covering the whole analytical rangender study (3 levels × 3 replicates per level = 9 determinations)30]. However, as was mentioned before, the readers must considerhat minimum criteria vary according to the nature of the analyticalrocedures. For instance, the minimum number determinations toheck the precision of a biological or a biotechnological method maye different from the minimum established in the present article.
.3.1. Total errorTotal error, a concept introduced 34 years ago, describes the
verall error that may occur in a test result due to the simulta-eous contribution of random and systematic error components ofhe measurement procedure [34]. In general terms, the total errorEtotal) could be defined by the expression:
total = Esystematic + Erandom
here the term E represents the error and the associated system-tic and random subscripts define the individual error contribution.rom the previous expression, it is evident that the mentionedifferences between the regulatory bodies regarding the defini-ion of the parameter that allows to estimate the systematic errorsEsystematic), termed for instance “accuracy” or “trueness”, make
andatory the use of appropriate documentation of the particularefinition used in the calculation of the total error. By document-
ng the specific definition used to express the systematic errorst is possible to derive alternative expressions for total error andonsequently avoid ambiguities between definitions. For instance,he following alternative expressions can be found in the currentiterature on validation:
total = Accuracy + Precision (using ICH terminology);
total = Trueness + Precision
r
total = Accuracy (using ISO terminology).
far
au
77 (2009) 2224–2234
The importance of estimating a total error in validation studiess that it provides a measure of quality that can be compared tohe intended analytical quality of a test, which can be described inerms of an allowable total error [35] which sets a nominal limitor the total error tolerable in a single measurement or single testesult. It is advisable, when determining the total error of a partic-lar assay, to follow the recommended criteria. For instance, recenteports addressing the issue of best practices for ligand bindingssays have established a nominal total error of 30% for this kind ofssays based on their inherent variability [36,37]. In addition, it isompulsory to include all assay runs in the calculation of the totalrror. Rejection of particular assay runs in the calculation of the totalrror is allowed only in cases, where obvious and well-documentedrrors arise [36].
An important consideration is that total error is a quality param-ter derived from two performance parameters (precision andccuracy) which contribute mutually to the quality of a test result.t is desirable to set goals for the allowable total error, rather thanet individual goals for the allowable standard deviation and thellowable bias.
.3.2. UncertaintyThe uncertainty of measurement is a parameter, associated with
he result of a measurement that characterises the dispersion ofhe values that could reasonably be attributed to measurand (theuantity being measured) [33]. This parameter is estimated in ordero judge the adequacy of a result for its intended purpose and toerify its consistency with other similar results.
Countless studies have reported the determination of the uncer-ainty of measurement results by using different approaches.owever, the lack of consensus among the various approacheslong with the absence of a worldwide-accepted criterion for thestimation and notation of measurement uncertainty were theain driving factors behind the development in 1980 of the general
ecommendation INC-1 for the expression of experimental uncer-ainties [33]. INC-1 states that the uncertainty in the results of a
easurement generally consists of several components which maye grouped into two categories according to the way in which theirumerical value is estimated.
Uncertainty Type A is the evaluation of uncertainty by statisti-cal methods. The components of this category are determined bymeans of the variances or standard deviations. The evaluation ofthis uncertainty applies to random and systematic errors.Uncertainty Type B is the evaluation of uncertainty by othermeans. The components of this category are usually based onscientific judgement using all the relevant information available.For instance, uncertainty assigned to reference data taken fromhandbooks, reference standards certificates, etc.Combined uncertainty is characterised by the summation of theType A and Type B variances and expressed as standard devia-tions.
The task of determining the uncertainty of a particular measure-ent method requires the participation of experts familiar with the
arious aspects involved in the recommendations issued by accred-ted bodies. For instance, a laboratory interested in applying ISO725-3 recommendation [38] in the evaluation of the uncertainty ofchromatographic method will require the assistance of an expert
amiliar with the measurement method and its application and also
n expert with experience in the implementation of the guidanceecommended fully nested design and its statistical analysis.It should be noted that even though the author of the presentrticle has reported several studies on the determination of thencertainty in linear calibration, central composite designs and

r. B 87
npi[
3
itcda
tititn
cctAaiaoCud
orat
wicatvl“rrhaonttael
3
y
wata
ttsarnbvitf
3beeach2iitoseMtcaltsetdatclilc
3cJt(e
P. Araujo / J. Chromatog
ested designs for proficiency testing, it is not his intention toresent a detailed coverage of the subject. The interested reader
s referred to the comprehensive work on uncertainty by Kimothi39].
.4. Linear function analysis
Linear function analysis is an area familiar to everyone involvedn calibration experiments and perhaps this familiarity has ledo the introduction of some fatal flaws when the linearity of aalibration is assessed. Nowadays, such erroneous procedures areescribed in oral presentations, laboratory reports and papers andccepted as correct.
Linearity, in the context of the previously described analysis sys-em consisting of the basic elements input → converter → output,s the assumption that there is a straight line relationship betweenhe input (x) and output (y) variables that can be written mathemat-cally by the expression y = f(x) if the straight line crosses throughhe origin or by the expression y = f(x) + ı if the straight line doesot cross through the origin.
It is common practice to check the linearity of a calibrationurve by inspection of the correlation coefficient r. A correlationoefficient close to unity (r = 1) is considered sufficient evidenceo conclude that the experimenter has a perfect linear calibration.lthough the Analytical Methods Committee and some articles onnalytical validation discouraged using the correlation coefficientn the context of testing for linearity [40–43], many laboratoriesround the world base the linearity of their instrumental meth-ds on a so-called (by the author of the present article) “r-test”.ountless published papers reinforce the idea, perhaps indirectly, ofsing the r-test to check for linearity by reporting in their abstracts,iscussions and conclusions statements such as
“This method has a linear calibration range of 1.00–1000 ng/mlwith a correlation coefficient of 0.9999.”“The calibration graphs were linear with correlation coefficientsgreater than 0.999 for all compounds.”“It was clear that the calibration was linear as a result of a corre-lation coefficient close to 1 (rexperimental = 0.9996).”
The author of the present article is not stating that the previ-us quotations are incorrect, however it must be said that in someespect they are misleading in the context of linearity evaluation. Inddition, they fail to indicate which statistical methods were usedo evaluate their linear relationship.
The FDA guidance for validation of analytical procedures [31]hich is based on the Text on Validation of Analytical Procedures
ssued by the ICH [44], recommends that the correlation coeffi-ient should be submitted when evaluating a linear relationshipnd that the linearity should be evaluated by appropriate statis-ical methods. This guidance does not suggest that the numericalalue of r can be interpreted in terms of degrees of deviation frominearity. Hence, it is extremely important to emphasise that anr-test” to check for linearity does not exist. We cannot say that= 0.999 is more linear than r = 0.997. It is surprising that despite theecommendations of the accredited bodies, few published articlesave reported the use of statistical methods for linearity evalu-tion. This observation seems to indicate that the issue, pointedut over half a century ago, about statistical data analysis being aeglected subject by practitioners validating methods [3] is still a
opic of contemporary relevance that needs an imperative atten-ion by those currently engaged in validation of analytical methodsnd by those responsible for educating and training people to bembarked upon the various aspects of this important area of ana-ytical chemistry.f
S
7 (2009) 2224–2234 2229
.4.1. Linear calibration functionThe expression y = f(x) + ı can be rewritten as
ˆ i = �xi + ı (1)
here yi and xi represent the estimated experimental responsend the analytical concentration respectively, both at a concentra-ion level i. The coefficients � and ı represent the sensitivity of thenalysis and the intercept respectively.
The calibration function described by Eq. (1) must have an r closeo 1 but the condition given by “if linear, then r = 1” is not equivalento “if r = 1, then linear”. In logical analysis terms, the best strategy tohow that a condition is not equivalent to its converse is to providecounterexample to it. To find a counterexample to “if linear, then= 1” it suffices to show that there is something that has r = 1 but it isot linear. Appendix A provides a comprehensive counterexampleased on statistical analysis of the various error sum squares andariance components from a linear calibration data set reportedn the literature [45]. Before studying Appendix A, some impor-ant aspects such as replication, error sum squares and degrees ofreedom should be discussed in advance.
.4.1.1. Replication. Replication is an important aspect that muste considered when the experimenter wants to test if a particularxperimental calibration model, for instance Eq. (1), is linear. Thexperimenter must have a reasonable number of standard solutionsnd instrumental replicates. It has been pointed out that the bestalibration strategies are those with standard solution replicatesigher than instrumental replicates [42,46]. A preparation error6 times higher than the instrumental error has been reported
n calibration experiments of triacylglycerols by LCMS [47]. Thismplies that the most serious problems are related to prepara-ion and not to instrumental stability. Calibration experiments withnly one standard per concentration level are a poor calibrationtrategy and must be avoided unless the standard solutions areffectively error-free. For the establishing of linearity the Analyticalethods Committee suggests preparing a minimum of six concen-
ration levels in duplicates [42]. Even though duplication at eachoncentration level is considered an optimal design strategy by thisccredited organisation, it is a poor approach that should not be fol-owed. A study of the behaviour of the uncertainty as a function ofhe number of replicates for the model described by Eq. (1) demon-trated that performing between four and six replicates at eachxperimental level decreases the uncertainty significantly alonghe experimental range and produces a uniform confidence pre-iction region around the centre of the calibration graph which isn important feature for quantification experiments [48]. Based onhe reported behaviour of the uncertainty as a function of the repli-ation and considering that the minimum number of concentrationevels proposed by various guidelines and articles on analytical val-dation varies between five and six, it is reasonable to measure theinearity of a calibration function by preparing a minimum of fiveoncentration levels in triplicates [31,43].
.4.1.2. Error sum squares. After selecting a sensible number ofoncentration levels (I) and replicating every concentration level-times in a particular calibration experiment, the summation ofhree squared differences, namely the residual error sum of squaresSSr) pure experimental error sum of squares (SSε) and lack-of-fitrror sum of squares (SSlof), must be calculated according to the
ollowing equations:Sr =I∑
i=1
Ji∑
j=1
(yij − yi)2 (2)

2 gr. B 8
S
S
mr
3t
D
D
D
Edab
y
bc
lia
3psiea
AaT
•
•
•
rl
3
aldermod
230 P. Araujo / J. Chromato
Sε =I∑
i=1
Ji∑
j=1
(yij − yi)2 (3)
Slof = SSr − SSε =I∑
i=1
(yi − yi)2 (4)
The term yij represents the experimental response, yi is the esti-ated response obtained by using Eq. (1), and yi is the average
esponse at every concentration level.
.4.1.3. Degrees of freedom. The degrees of freedom (DF) associatedo Eqs. (2)–(4) are respectively:
Fr = (IJ − 2) (5)
Fε = (IJ − I) (6)
Flof = (I − 2) (7)
The bracketed number 2 in Eqs. (5) and (7) and associated withqs. (2) and (4) respectively, represents the number of parametersescribed by Eq. (1) (the � slope + the ı intercept = 2 parameters). Ifmodel with a different number of parameters to those describedy Eq. (1) were studied, for instance:
ˆ i = �xi + ϕx2i + ı (8)
The degrees of freedom associated with Eqs. (2) and (4) woulde (IJ – 3) and (I – 3) respectively. The bracketed number 3 in thisase, represents the three parameters (� + ϕ + ı) of Eq. (8).
By using Eq. (1) and the minimum criteria of five concentrationevels (I = 5) in triplicates (J = 3) established in the previous section,t is possible to estimate 13, 10 and 3 degrees of freedom for SSr, SSε
nd SSlof respectively.
.4.1.4. Acceptability of linearity data. A ScienceDirect search was
erformed using the keywords “linearity test” and revealed thateveral articles used these two words as a true measure of linearityn chromatography method validation. It has been reported repeat-dly that an analyst engaged in any analytical validation should beware that there is no test for linearity as such [42,43,49–51]. ThetcTdu
Scheme 1. Main approaches proposed in the litera
77 (2009) 2224–2234
nalytical Method Committee suggests using the F-test as a reli-ble approach to check the linearity of any calibration function.he procedure is as follows:
The purely experimental variance and lack-of-fit variance desig-nated by �2
ε and �2lof
are estimated by computing the quotientsSSε/(IJ − I) and SSlof/(I − 2) respectively.The calculated �2
ε and �2lof
variance terms are used to calculatethe Fisher variance ratio or F-test by the expression:
F(I−2)/(IJ−I) =�2
lof
�2ε
(9)
The value of F(I–2)/(IJ–I) calculated experimentally is comparedagainst the critical value of F found in statistical tables, generallyat the 95% confidence level for I − 2 and IJ − J degrees of freedom inthe numerator and denominator respectively. If the experimentaldata set describes a genuine linear calibration of the form givenby Eq. (1) then the condition Ftabulated > F(I–2)/(IJ–I) must be fulfilled.Otherwise there are grounds to suspect that a different model tothe described by Eq. (1) must be proposed.
The estimation of the various error sum squares and the Fisheratio for testing the acceptability of a linear model proposed in theiterature is discussed in Appendix A.
.5. Range
In general, the range of an analytical procedure can be defineds the interval between the upper and lower concentration of ana-yte for which suitable precision, accuracy and linearity have beenemonstrated. The literature on method validation describes differ-nt ranges. For instance, linear range, analytical range, calibrationange, dynamic range, working range. However, they can be sum-
arised as working (or analytical) range and linear (or calibration,r dynamic) range. The former range which is wider than the latter,escribes the interval between the lowest (limit of detection) and
he highest concentration where the signal can be related to theoncentration for the evaluation of random and systematic errors.he linear range corresponds to the valid interval of functionalependence of the signal on concentration or mass [52] which issually determined by using the method of least squares, whichture for determining the limit of detection.
P. Araujo / J. Chromatogr. B 877 (2009) 2224–2234 2231
F y dilu
il
gottofatr
3
anauaos
olnctrrTwFPrsbttpmark
lt2
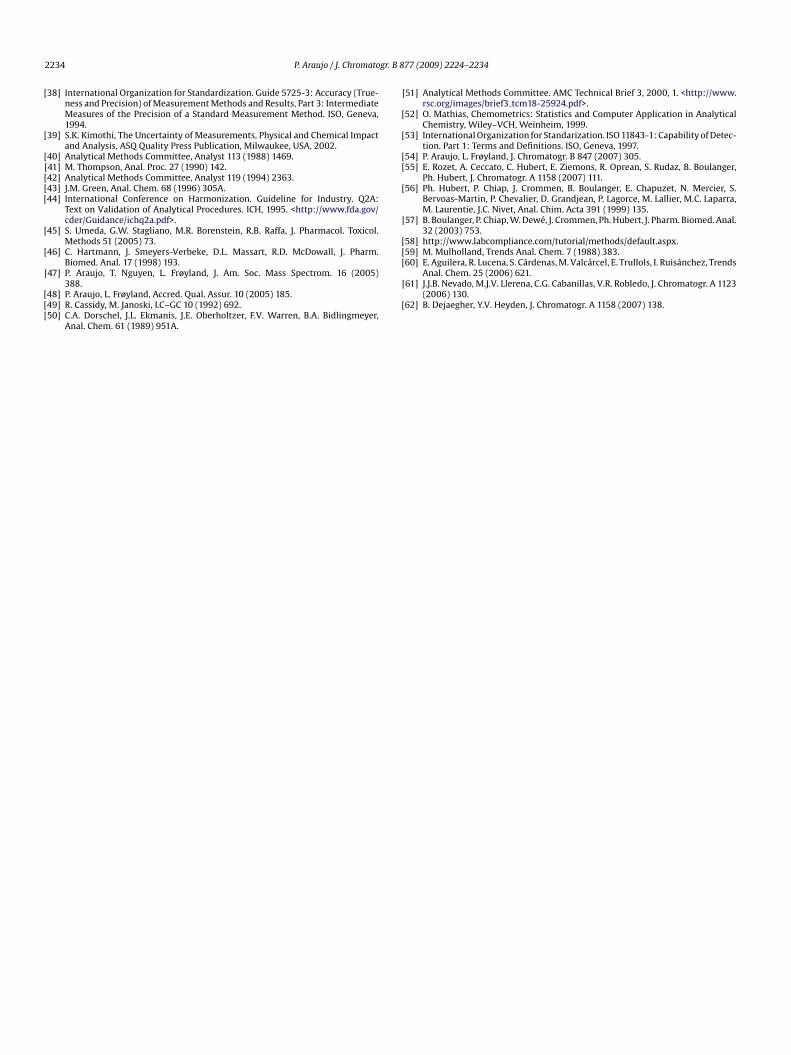
Fidwoffti8iis not a conventional criterion to determine what is a suitablestatistical power, however a value of 80% is generally consideredthe minimum desirable. When the criterion LOD = 2 × �blank is used(Fig. 4B) the probability � of reporting a false LOD (ˇ = 50%) is equalto the probability of finding a true LOD (1 − ˇ = 50%). Although
ig. 3. Visual determination of the limit of detection for PGE2 determined visually b
n turns assumes homoscedasticy of the measurements over theinear range.
To demonstrate an acceptable linear range, it is generally sug-ested to prepare five different standard solutions from 50 to 150%f the target analytical concentration [43]. However, it is importanto remember that the specified ranges often differ depending onhe intended application of the procedure. For instance, the ICH rec-mmends preparing five different standard solutions (plus a blank)rom 80 to 120% for the assay of a drug or a finished product [31]. Annalyst interested in validating a particular method should consulthe guidelines to encompass the recommended minimum specifiedange of the intended method.
.6. Limit of detection
The limit of detection (LOD) is commonly defined as the lowestmount of analyte in a sample that can be reliably detected but notecessarily quantitated by a particular analytical method. A decadego, the International Organization for Standardization proposed tose the term “minimum detectable net concentration” [53] defineds the confidence with which it is possible to detect an amountf analyte in the sample larger than that in a blank sample with atatistical power of (1 − ˇ).
Different criteria are used for evaluating the LOD. A summaryf the main approaches proposed for determining the LOD in the
iterature on validation is presented in Scheme 1. Visual determi-ation of the LOD is performed by preparing samples with knownoncentrations of the analyte and by establishing the level at whichhe analyte can be reliably detected. Fig. 3 shows the chromatog-aphy LOD for PGE2 determined visually by diluting successivelyeplicate solutions of PGE2 at an initial concentration of 0.4 ng/ml.he replicate solutions are diluted up to a concentration levelhere the analyte is not longer detected visually. According to
ig. 3 the visual LOD corresponds to a concentration of 0.1 ng/mlGE2. The guidelines for validation of analytical procedures [31]ecommend the presentation of relevant chromatograms whenubmitting a validation report where the LOD determination isased on a visual criteria. Another approach used for estimatinghe LOD is the calculation of the signal/noise relationship underhe assumption that data normality, homoscedasticity and inde-
endency of residuals are met. An inspection of the literature onethod validation revealed that this is the most popular approachmong analysts performing validation studies. The signal to noiseelationship is determined by comparing the analytical signals atnown low concentrations with those of blank sample up to an ana-
Ff
ting successively replicate solutions of PGE2 at an initial concentration of 0.4 ng/ml.
ytical concentration that produces a signal equivalent to three orwo times the standard deviation of the blank sample (3 × �blank or× �blank).
The implications of using the previous criteria are illustrated inig. 4 where a limit of decision derived from the blank distributions established at +2 × �blank. This limit of decision, at the 95% confi-ence level of the blank distribution is a probability that indicateshether or not a signal could be due to the sample (>+2 × �blank)
r to the blank (<+2 × �blank). When 3 × �blank is used as a criterionor estimating the LOD (Fig. 4A), the probability � of obtaining aalse negative is 16%. Conversely, it is possible to conclude thathe concentration or amount of analyte in the analysed samples larger than in a blank matrix with a statistical power (1 − ˇ) of4%. The statistical power measures the confidence with which it
s possible to detect a particular difference if one exists [54]. There
ig. 4. Statistical power when (A) 3 × �blank and (B) 2 × �blank are used as criteriaor estimating the limit of detection.

2 gr. B 8
terws
t(p(oTpre
3
cai
2
3
taL
di
etaiitpac
3
edfmolss
3
irsvg
dieptm
aepr
4
twdHrptcs
232 P. Araujo / J. Chromato
he minimum number of independent determinations required tostablish the LOD is 10, it is advisable to increase the number ofeplicates when the LOD is defined as 2 × �blank to avoid reachingrong conclusions. Both LOD criteria (3 × �blank or 2 × �blank)
hould be justified by presenting the relevant chromatograms.The final approach described in Scheme 1 is based on the quo-
ient of two analytical parameters, namely the standard deviation�) and the slope of a regression curve (� as in Eq. (1)). The formerarameter could be expressed as the standard deviation of the blank�blank), as the residual standard deviation of the calibration curver as standard deviation of the intercept of the calibration curve.he guidelines on method validation do not express any particularreference for the approaches described in Scheme 1, however theyecommend that when reporting the LOD the definition used in itsvaluation should be stated.
.7. Limit of quantitation
The limit of quantification (LOQ) is defined as the lowest con-entration or amount of analyte that can be determined with ancceptable level of precision and accuracy [9]. Similarly to LOD, LOQs evaluated by using different approaches, that is:
1. Visual evaluation: samples with known analytical concentrationare prepared and the minimum level at which the analyte can bequantified with an acceptable level of uncertainty is established.
. Signal/noise ratio: the signals of samples with known analyticalconcentrations are compared with those of blank samples up toan analytical concentration that produces a signal equivalent to10 times the standard deviation of the blank sample (10 × �blank).
. Standard-deviation/slope ratio (LOQ = 10 × �/�): the parameters �and � are calculated in the same fashion as LOD.
The second approach, which is the most used in the litera-ure, could be defined in a more general context as the lowestmount of analyte that can be reproducibly quantified above theOD (LOQ = n × LOD).
Other definitions to express the LOQ different from thoseescribed above could be used, provided that the definition used
n its evaluation is stated.It is important to note that the discussed approaches for the
valuation of the LOQ do not demonstrate that at the LOQ concen-ration there is an adequate accuracy and precision. The differentpproaches proposed in the literature have been critically revisedn an article which advocates using the accuracy profile approach
n order to estimate an LOQ more in accordance with its contex-ual definition [55]. The reader interested in applying the accuracyrofile approach is referred to the articles of Hubert et al. [56]nd Boulanger et al. [57] who were the first to introduce thisoncept.vfoea
77 (2009) 2224–2234
.8. Ruggedness
This parameter evaluates the constancy of the results whenxternal factors such as analyst, instruments, laboratories, reagents,ays are varied deliberately. By considering these critical external
actors and inspecting Table 1, it is evident that ruggedness is aeasure of reproducibility of test results under normal, expected
perational conditions from laboratory to laboratory and from ana-yst to analyst [58]. Ruggedness cannot be erroneously used as aynonymous of robustness as it is going to be explained in the nextection.
.9. Robustness
This parameter evaluates the constancy of the results whennternal factors (no external factors as in ruggedness) such as flowate, column temperature, injection volume, mobile phase compo-ition or any other variable inherent to the method of analysis arearied deliberately. It is generally not considered in most validationuidelines [46].
Although robustness and ruggedness aim at testing the repro-ucibility of the test results regardless of internal or external
nfluences respectively, the literature on method validation bearsvidence that both terms are used interchangeably. The analysterforming a method validation should distinguish the similari-ies and differences between these validation parameters and avoid
isconstruing ruggedness as robustness.Classical and multivariate methodologies such as the one-factor-
t-the time approach or a factorial design have been proposed tovaluate both ruggedness and robustness. However for more com-rehensive studies on robustness and ruggedness evaluation theeader is referred to [59–62].
. Final remarks
Method validation has evolved rapidly over the last half a cen-ury from being a neglected area of many scientific disciplines into aidely recognized process used to confirm that an analytical proce-
ure employed for a specific test is appropriate for its intended use.owever, despite this rapid evolution and the efforts of different
egulatory bodies to reach greater harmonization of the relevanterformance indicators commonly evaluated in method valida-ion, some relentless inconsistencies in relation to their definitions,alculation and interpretation are repeatedly used. Practitionershould be vigilant over the herein described key aspects of method
alidation and bear in mind that their misapplication goes muchurther than a simple rejection of a submitted report or a wastef money, time and resources. The acceptance and application ofrroneous terminology can have serious implications in results reli-bility, laboratory performance and institution credibility.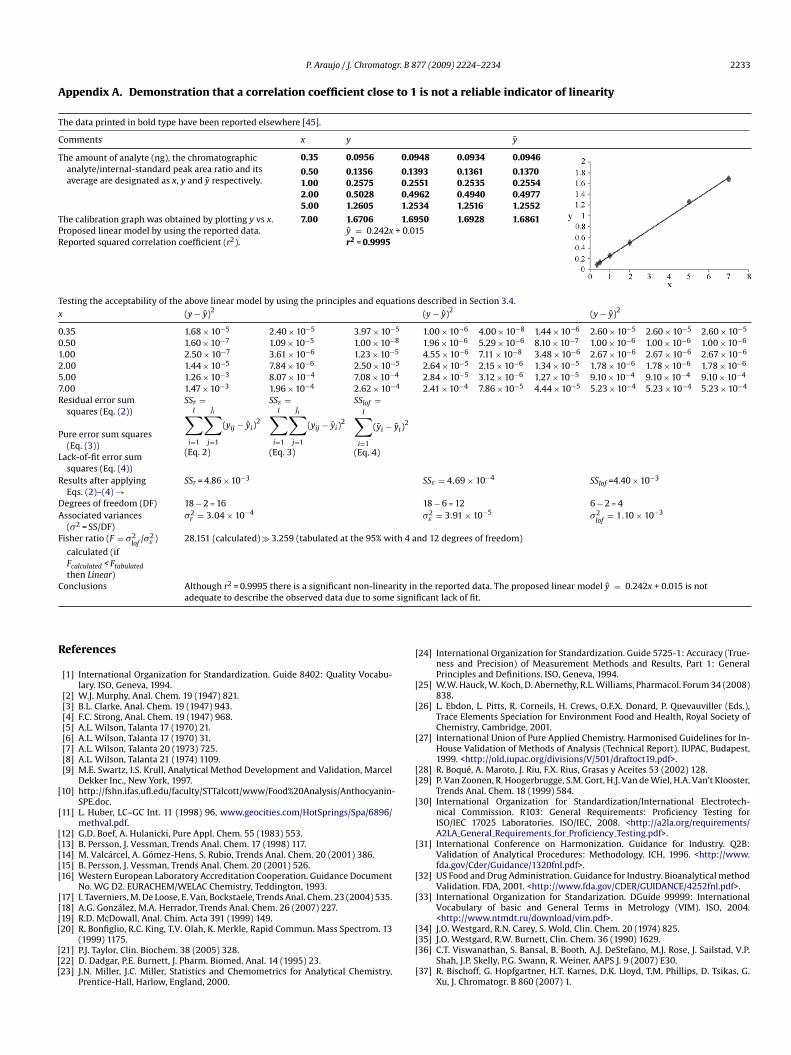
r. B 87
A to 1
T
C
T 0.09
0.130.250.491.25
T 1.69P + 0.01R
T tionsx
0 5
0 8
1 5
2 5
5 4
7 4
R
yi)2
P
L
R
DA
F th 4 a
C rity insignifi
R
[
[
[[[[[
[[[[
[[[
[
[
[
[
[[
[
[
[
[
P. Araujo / J. Chromatog
ppendix A. Demonstration that a correlation coefficient close
he data printed in bold type have been reported elsewhere [45].
omments x y
he amount of analyte (ng), the chromatographicanalyte/internal-standard peak area ratio and itsaverage are designated as x, y and y respectively.
0.35 0.0956
0.50 0.13561.00 0.25752.00 0.50285.00 1.2605
he calibration graph was obtained by plotting y vs x. 7.00 1.6706roposed linear model by using the reported data. y = 0.242xeported squared correlation coefficient (r2). r2 = 0.9995
esting the acceptability of the above linear model by using the principles and equa(y − y)2
.35 1.68 × 10⁻⁵ 2.40 × 10⁻⁵ 3.97 × 10−
.50 1.60 × 10⁻⁷ 1.09 × 10⁻⁵ 1.00 × 10−
.00 2.50 × 10⁻⁷ 3.61 × 10⁻⁶ 1.23 × 10−
.00 1.44 × 10⁻⁵ 7.84 × 10⁻⁶ 2.50 × 10−
.00 1.26 × 10⁻³ 8.07 × 10⁻⁴ 7.08 × 10−
.00 1.47 × 10⁻³ 1.96 × 10⁻⁴ 2.62 × 10−esidual error sumsquares (Eq. (2))
SSr =I∑
i=1
Ji∑
j=1
(yij − yi)2
(Eq. 2)
SSε =I∑
i=1
Ji∑
j=1
(yij − yi)2
(Eq. 3)
SSlof =I∑
i=1
(yi −
(Eq. 4)
ure error sum squares(Eq. (3))
ack-of-fit error sumsquares (Eq. (4))
esults after applyingEqs. (2)–(4) →
SSr = 4.86 × 10⁻³
egrees of freedom (DF) 18 − 2 = 16ssociated variances(�2 = SS/DF)
�2r = 3.04 × 10⁻⁴
isher ratio (F = �2lof
/�2ε )
calculated (ifFcalculated < Ftabulatedthen Linear)
28.151 (calculated) � 3.259 (tabulated at the 95% wi
onclusions Although r2 = 0.9995 there is a significant non-lineaadequate to describe the observed data due to some
eferences
[1] International Organization for Standardization. Guide 8402: Quality Vocabu-lary. ISO, Geneva, 1994.
[2] W.J. Murphy, Anal. Chem. 19 (1947) 821.[3] B.L. Clarke, Anal. Chem. 19 (1947) 943.[4] F.C. Strong, Anal. Chem. 19 (1947) 968.[5] A.L. Wilson, Talanta 17 (1970) 21.[6] A.L. Wilson, Talanta 17 (1970) 31.[7] A.L. Wilson, Talanta 20 (1973) 725.[8] A.L. Wilson, Talanta 21 (1974) 1109.[9] M.E. Swartz, I.S. Krull, Analytical Method Development and Validation, Marcel
Dekker Inc., New York, 1997.10] http://fshn.ifas.ufl.edu/faculty/STTalcott/www/Food%20Analysis/Anthocyanin-
SPE.doc.11] L. Huber, LC–GC Int. 11 (1998) 96, www.geocities.com/HotSprings/Spa/6896/
methval.pdf.12] G.D. Boef, A. Hulanicki, Pure Appl. Chem. 55 (1983) 553.13] B. Persson, J. Vessman, Trends Anal. Chem. 17 (1998) 117.14] M. Valcárcel, A. Gómez-Hens, S. Rubio, Trends Anal. Chem. 20 (2001) 386.15] B. Persson, J. Vessman, Trends Anal. Chem. 20 (2001) 526.16] Western European Laboratory Accreditation Cooperation. Guidance Document
No. WG D2. EURACHEM/WELAC Chemistry, Teddington, 1993.17] I. Taverniers, M. De Loose, E. Van, Bockstaele, Trends Anal. Chem. 23 (2004) 535.18] A.G. González, M.A. Herrador, Trends Anal. Chem. 26 (2007) 227.19] R.D. McDowall, Anal. Chim. Acta 391 (1999) 149.
20] R. Bonfiglio, R.C. King, T.V. Olah, K. Merkle, Rapid Commun. Mass Spectrom. 13(1999) 1175.21] P.J. Taylor, Clin. Biochem. 38 (2005) 328.22] D. Dadgar, P.E. Burnett, J. Pharm. Biomed. Anal. 14 (1995) 23.23] J.N. Miller, J.C. Miller, Statistics and Chemometrics for Analytical Chemistry,
Prentice-Hall, Harlow, England, 2000.
[[[
[
7 (2009) 2224–2234 2233
is not a reliable indicator of linearity
y
48 0.0934 0.0946
93 0.1361 0.137051 0.2535 0.255462 0.4940 0.497734 1.2516 1.2552
50 1.6928 1.68615
described in Section 3.4.(y − y)2 (y − y)2
1.00 × 10⁻⁶ 4.00 × 10⁻⁸ 1.44 × 10⁻⁶ 2.60 × 10⁻⁵ 2.60 × 10⁻⁵ 2.60 × 10⁻⁵
1.96 × 10⁻⁶ 5.29 × 10⁻⁶ 8.10 × 10⁻⁷ 1.00 × 10⁻⁶ 1.00 × 10⁻⁶ 1.00 × 10⁻⁶
4.55 × 10⁻⁶ 7.11 × 10⁻⁸ 3.48 × 10⁻⁶ 2.67 × 10⁻⁶ 2.67 × 10⁻⁶ 2.67 × 10⁻⁶
2.64 × 10⁻⁵ 2.15 × 10⁻⁶ 1.34 × 10⁻⁵ 1.78 × 10⁻⁶ 1.78 × 10⁻⁶ 1.78 × 10⁻⁶
2.84 × 10⁻⁵ 3.12 × 10⁻⁶ 1.27 × 10⁻⁵ 9.10 × 10⁻⁴ 9.10 × 10⁻⁴ 9.10 × 10⁻⁴
2.41 × 10⁻⁴ 7.86 × 10⁻⁵ 4.44 × 10⁻⁵ 5.23 × 10⁻⁴ 5.23 × 10⁻⁴ 5.23 × 10⁻⁴
SSε = 4.69 × 10⁻⁴ SSlof =4.40 × 10⁻³
18 − 6 = 12 6 − 2 = 4�2
ε = 3.91 × 10⁻⁵ �2lof
= 1.10 × 10⁻³
nd 12 degrees of freedom)
the reported data. The proposed linear model y = 0.242x + 0.015 is notcant lack of fit.
24] International Organization for Standardization. Guide 5725-1: Accuracy (True-ness and Precision) of Measurement Methods and Results, Part 1: GeneralPrinciples and Definitions. ISO, Geneva, 1994.
25] W.W. Hauck, W. Koch, D. Abernethy, R.L. Williams, Pharmacol. Forum 34 (2008)838.
26] L. Ebdon, L. Pitts, R. Corneils, H. Crews, O.F.X. Donard, P. Quevauviller (Eds.),Trace Elements Speciation for Environment Food and Health, Royal Society ofChemistry, Cambridge, 2001.
27] International Union of Pure Applied Chemistry. Harmonised Guidelines for In-House Validation of Methods of Analysis (Technical Report). IUPAC, Budapest,1999. <http://old.iupac.org/divisions/V/501/draftoct19.pdf>.
28] R. Boqué, A. Maroto, J. Riu, F.X. Rius, Grasas y Aceites 53 (2002) 128.29] P. Van Zoonen, R. Hoogerbrugge, S.M. Gort, H.J. Van de Wiel, H.A. Van’t Klooster,
Trends Anal. Chem. 18 (1999) 584.30] International Organization for Standardization/International Electrotech-
nical Commission. R103: General Requirements: Proficiency Testing forISO/IEC 17025 Laboratories. ISO/IEC, 2008. <http://a2la.org/requirements/A2LA General Requirements for Proficiency Testing.pdf>.
31] International Conference on Harmonization. Guidance for Industry. Q2B:Validation of Analytical Procedures: Methodology. ICH, 1996. <http://www.fda.gov/Cder/Guidance/1320fnl.pdf>.
32] US Food and Drug Administration. Guidance for Industry. Bioanalytical methodValidation. FDA, 2001. <http://www.fda.gov/CDER/GUIDANCE/4252fnl.pdf>.
33] International Organization for Standarization. DGuide 99999: InternationalVocabulary of basic and General Terms in Metrology (VIM). ISO, 2004.<http://www.ntmdt.ru/download/vim.pdf>.
34] J.O. Westgard, R.N. Carey, S. Wold, Clin. Chem. 20 (1974) 825.
35] J.O. Westgard, R.W. Burnett, Clin. Chem. 36 (1990) 1629.36] C.T. Viswanathan, S. Bansal, B. Booth, A.J. DeStefano, M.J. Rose, J. Sailstad, V.P.Shah, J.P. Skelly, P.G. Swann, R. Weiner, AAPS J. 9 (2007) E30.37] R. Bischoff, G. Hopfgartner, H.T. Karnes, D.K. Lloyd, T.M. Phillips, D. Tsikas, G.
Xu, J. Chromatogr. B 860 (2007) 1.
2 gr. B 8
[
[
[[[[[
[
[
[
[[[
[
[
[
[[
[
[
[[59] M. Mulholland, Trends Anal. Chem. 7 (1988) 383.[60] E. Aguilera, R. Lucena, S. Cárdenas, M. Valcárcel, E. Trullols, I. Ruisánchez, Trends
234 P. Araujo / J. Chromato
38] International Organization for Standardization. Guide 5725-3: Accuracy (True-ness and Precision) of Measurement Methods and Results, Part 3: IntermediateMeasures of the Precision of a Standard Measurement Method. ISO, Geneva,1994.
39] S.K. Kimothi, The Uncertainty of Measurements, Physical and Chemical Impactand Analysis, ASQ Quality Press Publication, Milwaukee, USA, 2002.
40] Analytical Methods Committee, Analyst 113 (1988) 1469.41] M. Thompson, Anal. Proc. 27 (1990) 142.42] Analytical Methods Committee, Analyst 119 (1994) 2363.43] J.M. Green, Anal. Chem. 68 (1996) 305A.44] International Conference on Harmonization. Guideline for Industry. Q2A:
Text on Validation of Analytical Procedures. ICH, 1995. <http://www.fda.gov/cder/Guidance/ichq2a.pdf>.
45] S. Umeda, G.W. Stagliano, M.R. Borenstein, R.B. Raffa, J. Pharmacol. Toxicol.Methods 51 (2005) 73.
46] C. Hartmann, J. Smeyers-Verbeke, D.L. Massart, R.D. McDowall, J. Pharm.Biomed. Anal. 17 (1998) 193.
47] P. Araujo, T. Nguyen, L. Frøyland, J. Am. Soc. Mass Spectrom. 16 (2005)388.
48] P. Araujo, L. Frøyland, Accred. Qual. Assur. 10 (2005) 185.49] R. Cassidy, M. Janoski, LC–GC 10 (1992) 692.50] C.A. Dorschel, J.L. Ekmanis, J.E. Oberholtzer, F.V. Warren, B.A. Bidlingmeyer,
Anal. Chem. 61 (1989) 951A.
[
[
77 (2009) 2224–2234
51] Analytical Methods Committee. AMC Technical Brief 3, 2000, 1. <http://www.rsc.org/images/brief3 tcm18-25924.pdf>.
52] O. Mathias, Chemometrics: Statistics and Computer Application in AnalyticalChemistry, Wiley–VCH, Weinheim, 1999.
53] International Organization for Standarization. ISO 11843-1: Capability of Detec-tion. Part 1: Terms and Definitions. ISO, Geneva, 1997.
54] P. Araujo, L. Frøyland, J. Chromatogr. B 847 (2007) 305.55] E. Rozet, A. Ceccato, C. Hubert, E. Ziemons, R. Oprean, S. Rudaz, B. Boulanger,
Ph. Hubert, J. Chromatogr. A 1158 (2007) 111.56] Ph. Hubert, P. Chiap, J. Crommen, B. Boulanger, E. Chapuzet, N. Mercier, S.
Bervoas-Martin, P. Chevalier, D. Grandjean, P. Lagorce, M. Lallier, M.C. Laparra,M. Laurentie, J.C. Nivet, Anal. Chim. Acta 391 (1999) 135.
57] B. Boulanger, P. Chiap, W. Dewé, J. Crommen, Ph. Hubert, J. Pharm. Biomed. Anal.32 (2003) 753.
58] http://www.labcompliance.com/tutorial/methods/default.aspx.
Anal. Chem. 25 (2006) 621.61] J.J.B. Nevado, M.J.V. Llerena, C.G. Cabanillas, V.R. Robledo, J. Chromatogr. A 1123
(2006) 130.62] B. Dejaegher, Y.V. Heyden, J. Chromatogr. A 1158 (2007) 138.