Embed Size (px)
Citation preview
www.wjpps.com Vol 9, Issue 6, 2020.
1133
Harmani et al. World Journal of Pharmacy and Pharmaceutical Sciences
STABILITY INDICATING ANALYTICAL METHOD DEVELOPMENT
AND VALIDATION FOR THE ESTIMATION OF DAROLUTAMIDE IN
PHARMACEUTICAL DOSAGE FORM
Nirav J. Harmani*, Ojas B. Patel, Neha S. Patel and Dr. Harsha U. Patel
Faculty of Pharmacy-Shree Satsangi Saketdham ―RAM ASHRAM‖ Group of Institution,
Gujarat Technological University, Mehsana-382708, Gujarat, India.
ABSTRACT
A simple, rapid, economical, precise and accurate RP-HPLC
method for Darolutamide in its Pharmaceutical Dosage Form has
been developed. A reverse phase high performance liquid
chromatographic method was developed for the Darolutamide in its
Pharmaceutical Dosage Form. The separation was achieved by
Hypersil BDS C18 (250 mm x 4..6 mm, 5µ) column and Acetonitrile:
Phosphate Buffer, pH 3.0 (20:80) as mobile phase, at a flow rate of
1 mL/min. Detection was carried out at 242 nm. Retention time of
Darolutamide was found to be 10.303 min. The method has been
validated for linearity, accuracy and precision. Linearity observed for
Darolutamide 25-75 μg/mL. Developed method was found to be
accurate, precise and rapid for estimation of Darolutamide in its
Dosage Form. The drug was subjected to stress condition of
hydrolysis, oxidation, photolysis and Thermal degradation, Considerable Degradation was
found in alkaline degradation. The proposed method was successfully applied for the
estimation of Darolutamide in Pharmaceutical dosage form.
KEYWORDS: Darolutamide, Stability Indicating RP-HPLC Method, Validation.
1. INTRODUCTION
Prostate cancer is the cancer that occurs in the prostate gland — a small walnut-shaped gland
in men from that the seminal fluid generated which promotes and carries sperm. When some
cells of the prostate become atypical, atypical cells develop and split faster than normal cell
WORLD JOURNAL OF PHARMACY AND PHARMACEUTICAL SCIENCES
SJIF Impact Factor 7.632
Volume 9, Issue 6, 1133-1146 Research Article ISSN 2278 – 4357
*Corresponding Author
Nirav J. Harmani
Faculty of Pharmacy-Shree
Satsangi Saketdham "RAM
ASHRAM" Group of
Institution, Gujarat
Technological University,
Mehsana-382708, Gujarat,
India.
Article Received on
25 March 2020,
Revised on 15 April 2020,
Accepted on 06 May 2020
DOI: 10.20959/wjpps20206-16238
www.wjpps.com Vol 9, Issue 6, 2020.
1134
Harmani et al. World Journal of Pharmacy and Pharmaceutical Sciences
because of mutations in the abnormal cells' DNA. While atypical cells continues developing,
development of the normal cells decreases and would die rapidly. Due to accumulation of
atypical cells, formation of tumor happens that can develop and attack surrounding tissue.
These atypical cells can be affect to other parts of the body after the break off and metastasize
(spread).
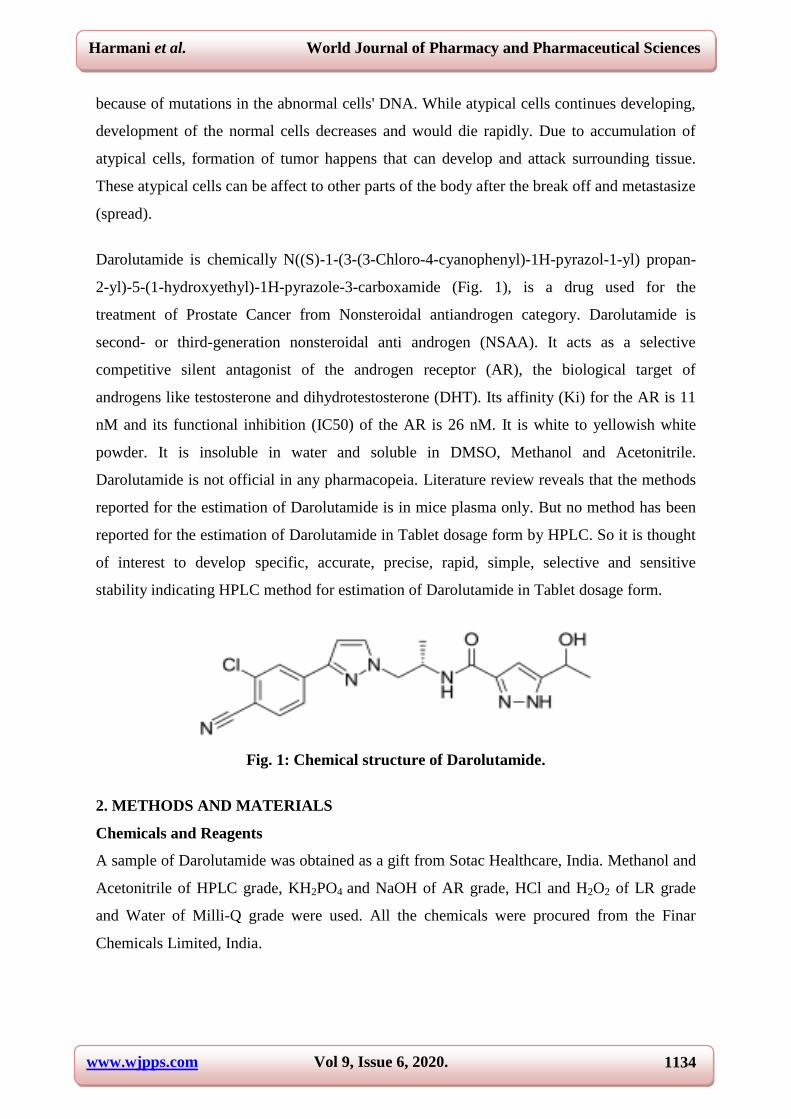
Darolutamide is chemically N((S)-1-(3-(3-Chloro-4-cyanophenyl)-1H-pyrazol-1-yl) propan-
2-yl)-5-(1-hydroxyethyl)-1H-pyrazole-3-carboxamide (Fig. 1), is a drug used for the
treatment of Prostate Cancer from Nonsteroidal antiandrogen category. Darolutamide is
second- or third-generation nonsteroidal anti androgen (NSAA). It acts as a selective
competitive silent antagonist of the androgen receptor (AR), the biological target of
androgens like testosterone and dihydrotestosterone (DHT). Its affinity (Ki) for the AR is 11
nM and its functional inhibition (IC50) of the AR is 26 nM. It is white to yellowish white
powder. It is insoluble in water and soluble in DMSO, Methanol and Acetonitrile.
Darolutamide is not official in any pharmacopeia. Literature review reveals that the methods
reported for the estimation of Darolutamide is in mice plasma only. But no method has been
reported for the estimation of Darolutamide in Tablet dosage form by HPLC. So it is thought
of interest to develop specific, accurate, precise, rapid, simple, selective and sensitive
stability indicating HPLC method for estimation of Darolutamide in Tablet dosage form.
Fig. 1: Chemical structure of Darolutamide.
2. METHODS AND MATERIALS
Chemicals and Reagents
A sample of Darolutamide was obtained as a gift from Sotac Healthcare, India. Methanol and
Acetonitrile of HPLC grade, KH2PO4 and NaOH of AR grade, HCl and H2O2 of LR grade
and Water of Milli-Q grade were used. All the chemicals were procured from the Finar
Chemicals Limited, India.
www.wjpps.com Vol 9, Issue 6, 2020.
1135
Harmani et al. World Journal of Pharmacy and Pharmaceutical Sciences
Apparatus and Instrumentation
Chromatographic separation achieved by the Shimadzu HPLC system (Model: LC-10 AT)
with SPD 20A UV detector and LC solution software, Hypersil BDS C18 (250 × 4.6 mm, 5µ)
column, Shimadzu analytical balance, Lab man pH meter and Ultrasonicator.
PREPARATION OF STANDARD SOLUTIONS
Darolutamide standard stock solution (500 μg/mL)
Weighed 50 mg of Darolutamide and transfer it into a 100 mL volumetric flask. Dilute it with
methanol to the mark.
Preparation of working solution Darolutamide (50 μg/mL)
Transferred 1 mL from the Darolutamide stock solution into 10 mL volumetric flask and
Dilute it up to the mark with mobile phase which was used in particular trials.
Phosphate Buffer preparation
Weighed 6.8 gm of Phosphate buffer and was transferred to 1000 mL beaker and 200 mL of
water added and shaken for few minutes than volume was made up with water, pH was
adjusted by adding 1% o-Phosphoric acid or 0.1M KOH.
Diluent: Mobile phase
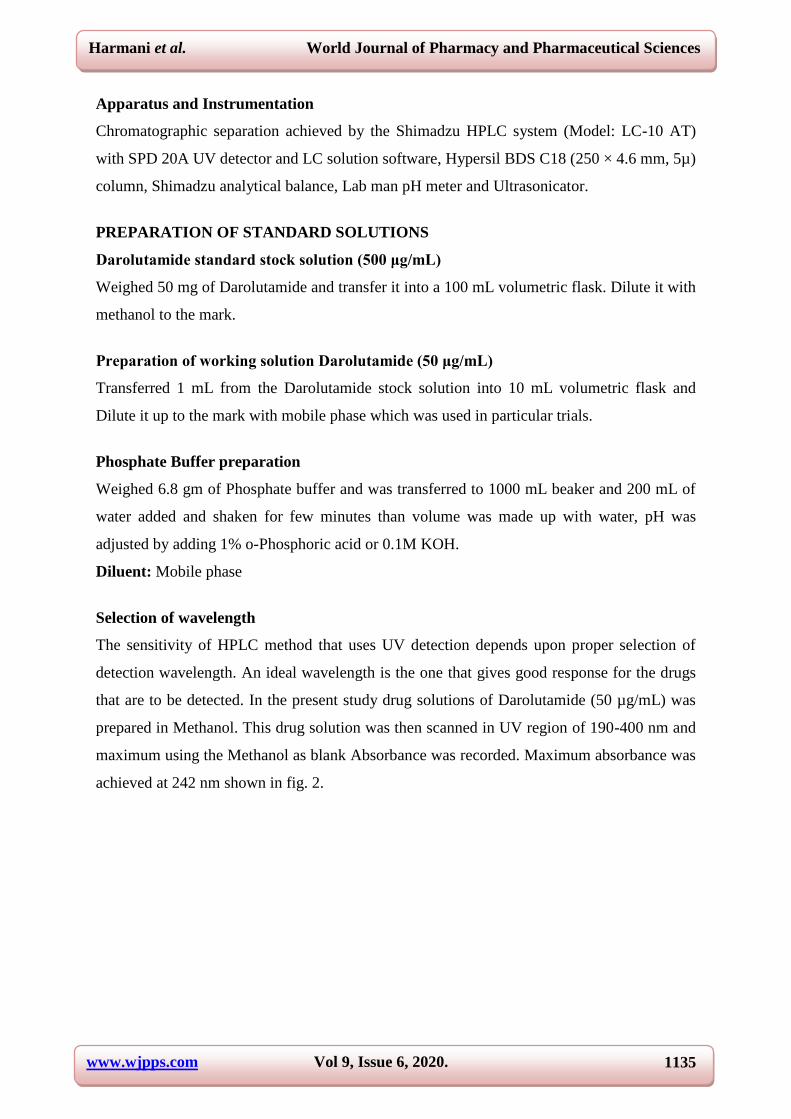
Selection of wavelength
The sensitivity of HPLC method that uses UV detection depends upon proper selection of
detection wavelength. An ideal wavelength is the one that gives good response for the drugs
that are to be detected. In the present study drug solutions of Darolutamide (50 µg/mL) was
prepared in Methanol. This drug solution was then scanned in UV region of 190-400 nm and
maximum using the Methanol as blank Absorbance was recorded. Maximum absorbance was
achieved at 242 nm shown in fig. 2.
www.wjpps.com Vol 9, Issue 6, 2020.
1136
Harmani et al. World Journal of Pharmacy and Pharmaceutical Sciences
Fig. 2: UV Spectra of Darolutamide.
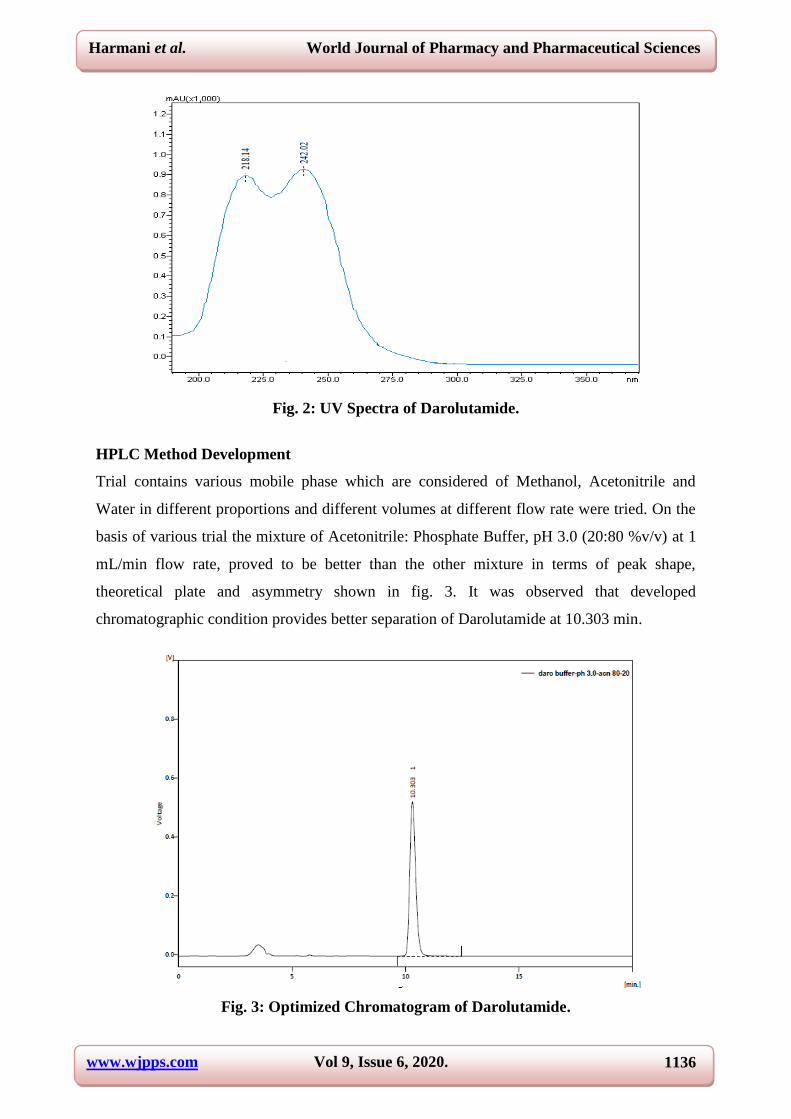
HPLC Method Development
Trial contains various mobile phase which are considered of Methanol, Acetonitrile and
Water in different proportions and different volumes at different flow rate were tried. On the
basis of various trial the mixture of Acetonitrile: Phosphate Buffer, pH 3.0 (20:80 %v/v) at 1
mL/min flow rate, proved to be better than the other mixture in terms of peak shape,
theoretical plate and asymmetry shown in fig. 3. It was observed that developed
chromatographic condition provides better separation of Darolutamide at 10.303 min.
Fig. 3: Optimized Chromatogram of Darolutamide.
www.wjpps.com Vol 9, Issue 6, 2020.
1137
Harmani et al. World Journal of Pharmacy and Pharmaceutical Sciences
Optimization of HPLC Method
The developed HPLC method was optimized with a view to develop stability indicating
method. The method was optimized on C18 (250× 4.6 mm, 5µ) Hypersil BDS with isocratic
method of elution using the mobile phase Acetonitrile: Phosphate Buffer, pH 3.0 (20:80%v/v)
at a flow rate of 1 mL/min, 20 µL injection volume and 20 min run time. The detection was
carried out at 242 nm.
Forced Degradation Studies
Stability-Indicating method are based on the characteristic structural, chemical or biological
properties of each active ingredient of a drug product, is quantitative analytical methods and
will differentiate separately active ingredient from its degradation products so that the active
ingredient content can be exactly evaluated. Degradation studies were carried out under
different stress conditions like Acidic, Alkaline, Oxidation, Photo and Thermal.
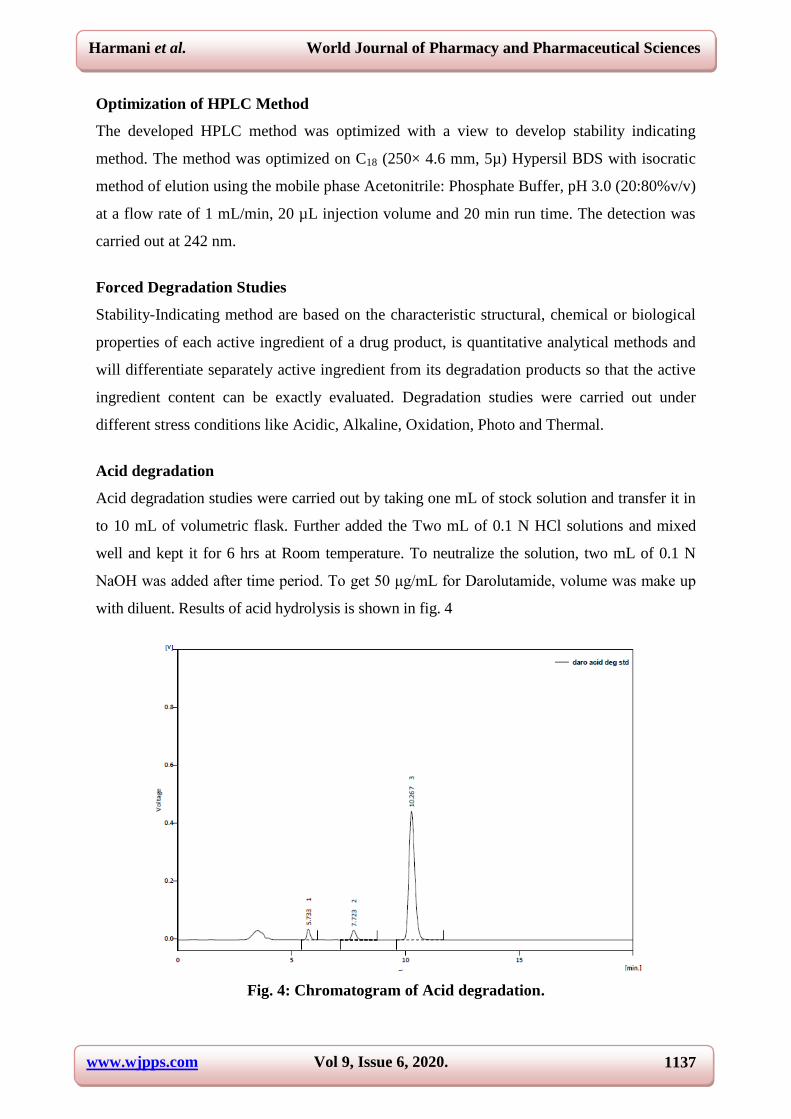
Acid degradation
Acid degradation studies were carried out by taking one mL of stock solution and transfer it in
to 10 mL of volumetric flask. Further added the Two mL of 0.1 N HCl solutions and mixed
well and kept it for 6 hrs at Room temperature. To neutralize the solution, two mL of 0.1 N
NaOH was added after time period. To get 50 μg/mL for Darolutamide, volume was make up
with diluent. Results of acid hydrolysis is shown in fig. 4
Fig. 4: Chromatogram of Acid degradation.
www.wjpps.com Vol 9, Issue 6, 2020.
1138
Harmani et al. World Journal of Pharmacy and Pharmaceutical Sciences
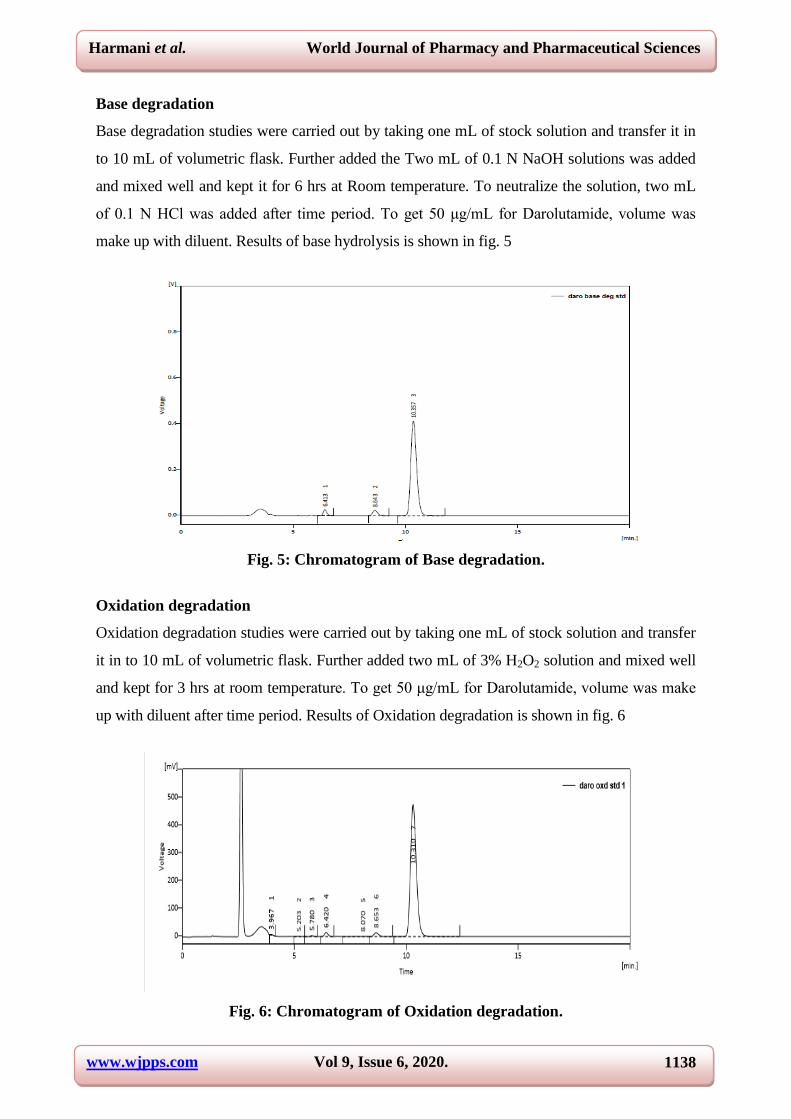
Base degradation
Base degradation studies were carried out by taking one mL of stock solution and transfer it in
to 10 mL of volumetric flask. Further added the Two mL of 0.1 N NaOH solutions was added
and mixed well and kept it for 6 hrs at Room temperature. To neutralize the solution, two mL
of 0.1 N HCl was added after time period. To get 50 μg/mL for Darolutamide, volume was
make up with diluent. Results of base hydrolysis is shown in fig. 5
Fig. 5: Chromatogram of Base degradation.
Oxidation degradation
Oxidation degradation studies were carried out by taking one mL of stock solution and transfer
it in to 10 mL of volumetric flask. Further added two mL of 3% H2O2 solution and mixed well
and kept for 3 hrs at room temperature. To get 50 μg/mL for Darolutamide, volume was make
up with diluent after time period. Results of Oxidation degradation is shown in fig. 6
Fig. 6: Chromatogram of Oxidation degradation.
www.wjpps.com Vol 9, Issue 6, 2020.
1139
Harmani et al. World Journal of Pharmacy and Pharmaceutical Sciences
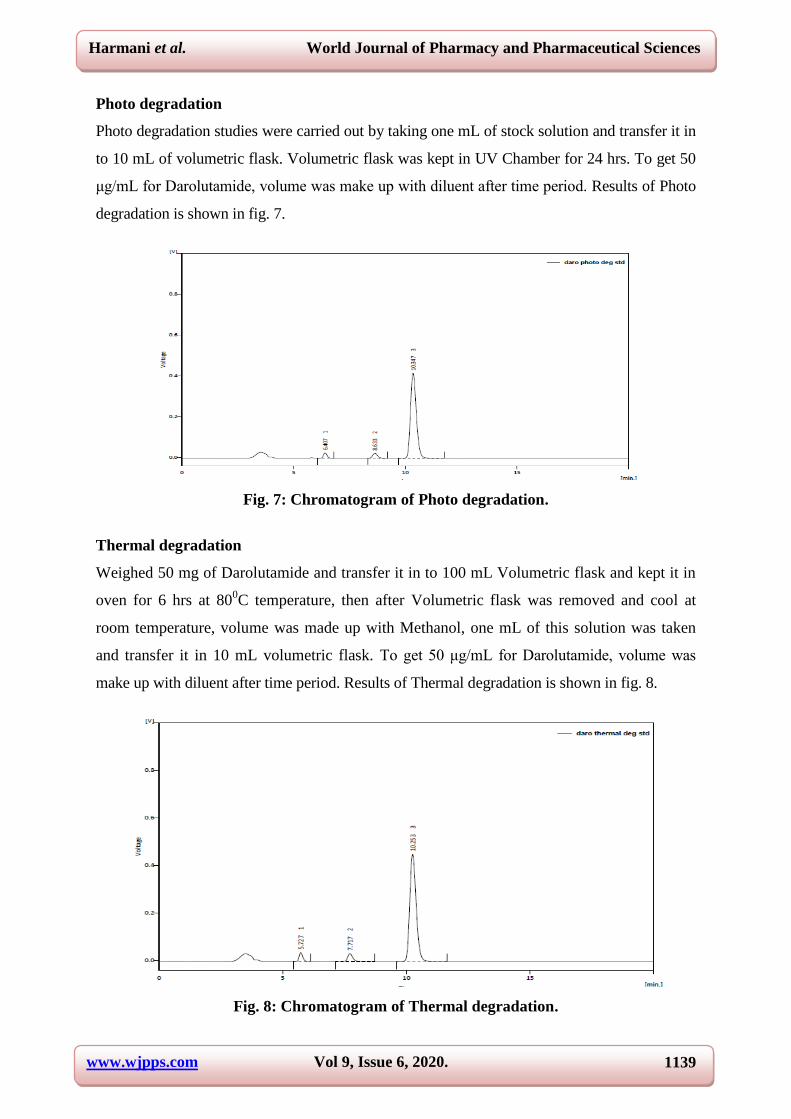
Photo degradation
Photo degradation studies were carried out by taking one mL of stock solution and transfer it in
to 10 mL of volumetric flask. Volumetric flask was kept in UV Chamber for 24 hrs. To get 50
μg/mL for Darolutamide, volume was make up with diluent after time period. Results of Photo
degradation is shown in fig. 7.
Fig. 7: Chromatogram of Photo degradation.
Thermal degradation
Weighed 50 mg of Darolutamide and transfer it in to 100 mL Volumetric flask and kept it in
oven for 6 hrs at 800C temperature, then after Volumetric flask was removed and cool at
room temperature, volume was made up with Methanol, one mL of this solution was taken
and transfer it in 10 mL volumetric flask. To get 50 μg/mL for Darolutamide, volume was
make up with diluent after time period. Results of Thermal degradation is shown in fig. 8.
Fig. 8: Chromatogram of Thermal degradation.
www.wjpps.com Vol 9, Issue 6, 2020.
1140
Harmani et al. World Journal of Pharmacy and Pharmaceutical Sciences
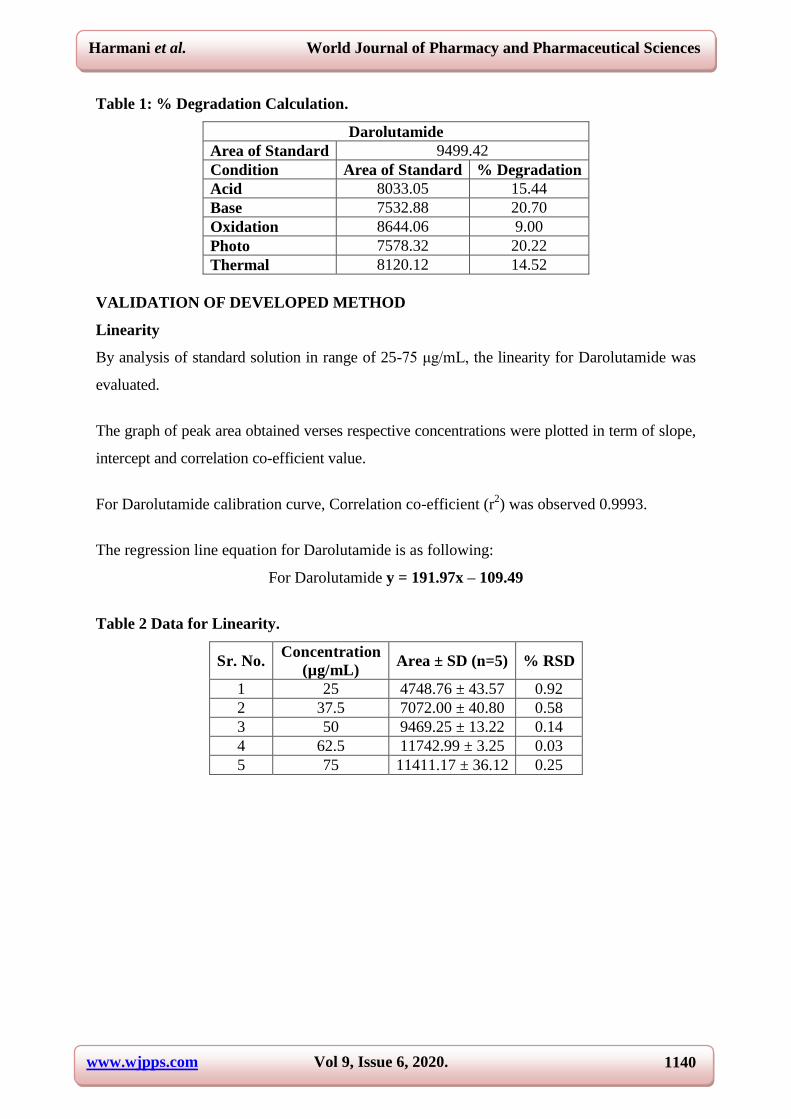
Table 1: % Degradation Calculation.
Darolutamide
Area of Standard 9499.42
Condition Area of Standard % Degradation
Acid 8033.05 15.44
Base 7532.88 20.70
Oxidation 8644.06 9.00
Photo 7578.32 20.22
Thermal 8120.12 14.52
VALIDATION OF DEVELOPED METHOD
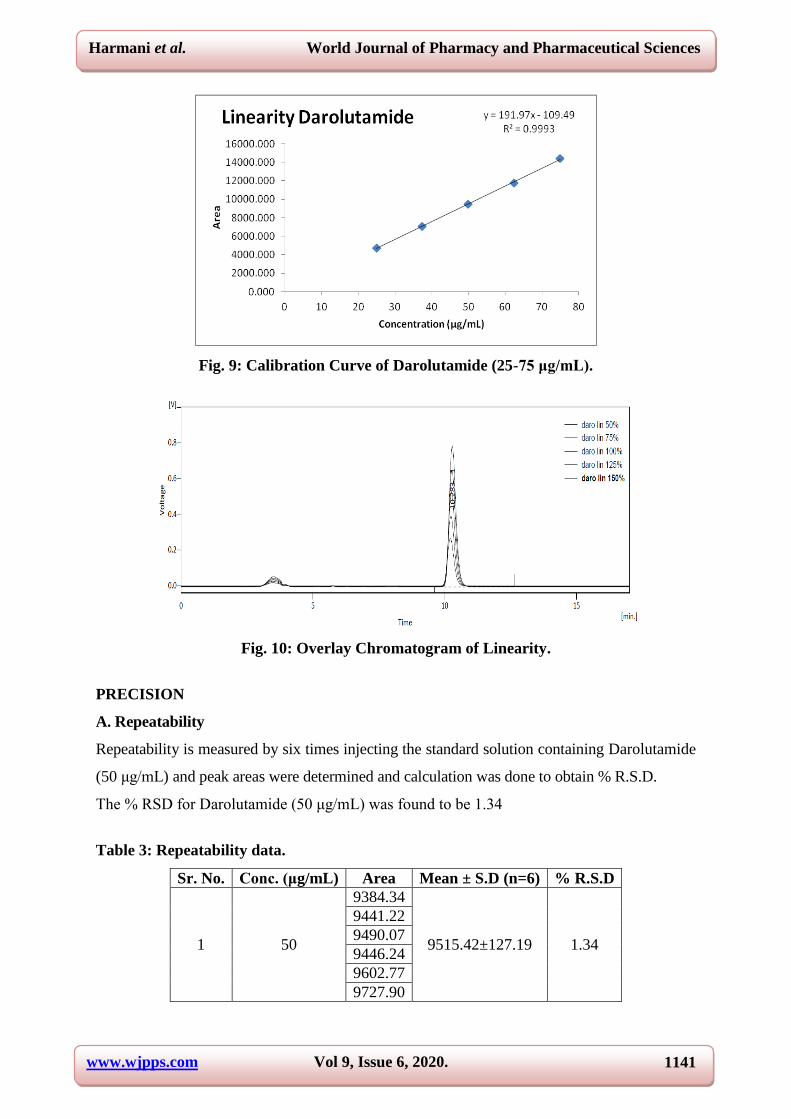
Linearity
By analysis of standard solution in range of 25-75 μg/mL, the linearity for Darolutamide was
evaluated.
The graph of peak area obtained verses respective concentrations were plotted in term of slope,
intercept and correlation co-efficient value.
For Darolutamide calibration curve, Correlation co-efficient (r2) was observed 0.9993.
The regression line equation for Darolutamide is as following:
For Darolutamide y = 191.97x – 109.49
Table 2 Data for Linearity.
Sr. No. Concentration
(µg/mL) Area ± SD (n=5) % RSD
1 25 4748.76 ± 43.57 0.92
2 37.5 7072.00 ± 40.80 0.58
3 50 9469.25 ± 13.22 0.14
4 62.5 11742.99 ± 3.25 0.03
5 75 11411.17 ± 36.12 0.25
www.wjpps.com Vol 9, Issue 6, 2020.
1141
Harmani et al. World Journal of Pharmacy and Pharmaceutical Sciences
Fig. 9: Calibration Curve of Darolutamide (25-75 μg/mL).
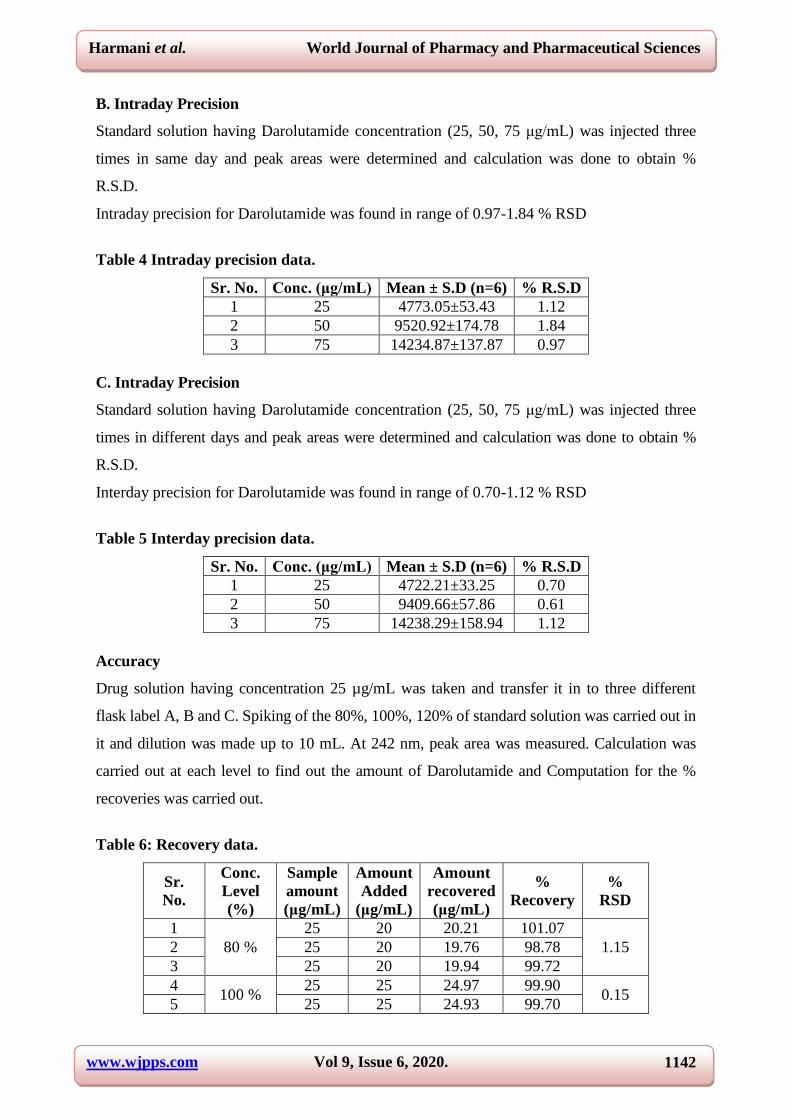
Fig. 10: Overlay Chromatogram of Linearity.
PRECISION
A. Repeatability
Repeatability is measured by six times injecting the standard solution containing Darolutamide
(50 μg/mL) and peak areas were determined and calculation was done to obtain % R.S.D.
The % RSD for Darolutamide (50 μg/mL) was found to be 1.34
Table 3: Repeatability data.
Sr. No. Conc. (μg/mL) Area Mean ± S.D (n=6) % R.S.D
1 50
9384.34
9515.42±127.19 1.34
9441.22
9490.07
9446.24
9602.77
9727.90
www.wjpps.com Vol 9, Issue 6, 2020.
1142
Harmani et al. World Journal of Pharmacy and Pharmaceutical Sciences
B. Intraday Precision
Standard solution having Darolutamide concentration (25, 50, 75 μg/mL) was injected three
times in same day and peak areas were determined and calculation was done to obtain %
R.S.D.
Intraday precision for Darolutamide was found in range of 0.97-1.84 % RSD
Table 4 Intraday precision data.
Sr. No. Conc. (μg/mL) Mean ± S.D (n=6) % R.S.D
1 25 4773.05±53.43 1.12
2 50 9520.92±174.78 1.84
3 75 14234.87±137.87 0.97
C. Intraday Precision
Standard solution having Darolutamide concentration (25, 50, 75 μg/mL) was injected three
times in different days and peak areas were determined and calculation was done to obtain %
R.S.D.
Interday precision for Darolutamide was found in range of 0.70-1.12 % RSD
Table 5 Interday precision data.
Sr. No. Conc. (μg/mL) Mean ± S.D (n=6) % R.S.D
1 25 4722.21±33.25 0.70
2 50 9409.66±57.86 0.61
3 75 14238.29±158.94 1.12
Accuracy
Drug solution having concentration 25 µg/mL was taken and transfer it in to three different
flask label A, B and C. Spiking of the 80%, 100%, 120% of standard solution was carried out in
it and dilution was made up to 10 mL. At 242 nm, peak area was measured. Calculation was
carried out at each level to find out the amount of Darolutamide and Computation for the %
recoveries was carried out.
Table 6: Recovery data.
Sr.
No.
Conc.
Level
(%)
Sample
amount
(μg/mL)
Amount
Added
(μg/mL)
Amount
recovered
(μg/mL)
%
Recovery
%
RSD
1
80 %
25 20 20.21 101.07
1.15 2 25 20 19.76 98.78
3 25 20 19.94 99.72
4 100 %
25 25 24.97 99.90 0.15
5 25 25 24.93 99.70
www.wjpps.com Vol 9, Issue 6, 2020.
1143
Harmani et al. World Journal of Pharmacy and Pharmaceutical Sciences
6 25 25 25.00 100.01
7
120 %
25 30 29.94 99.79
1.03 8 25 30 30.25 100.83
9 25 30 29.63 98.77
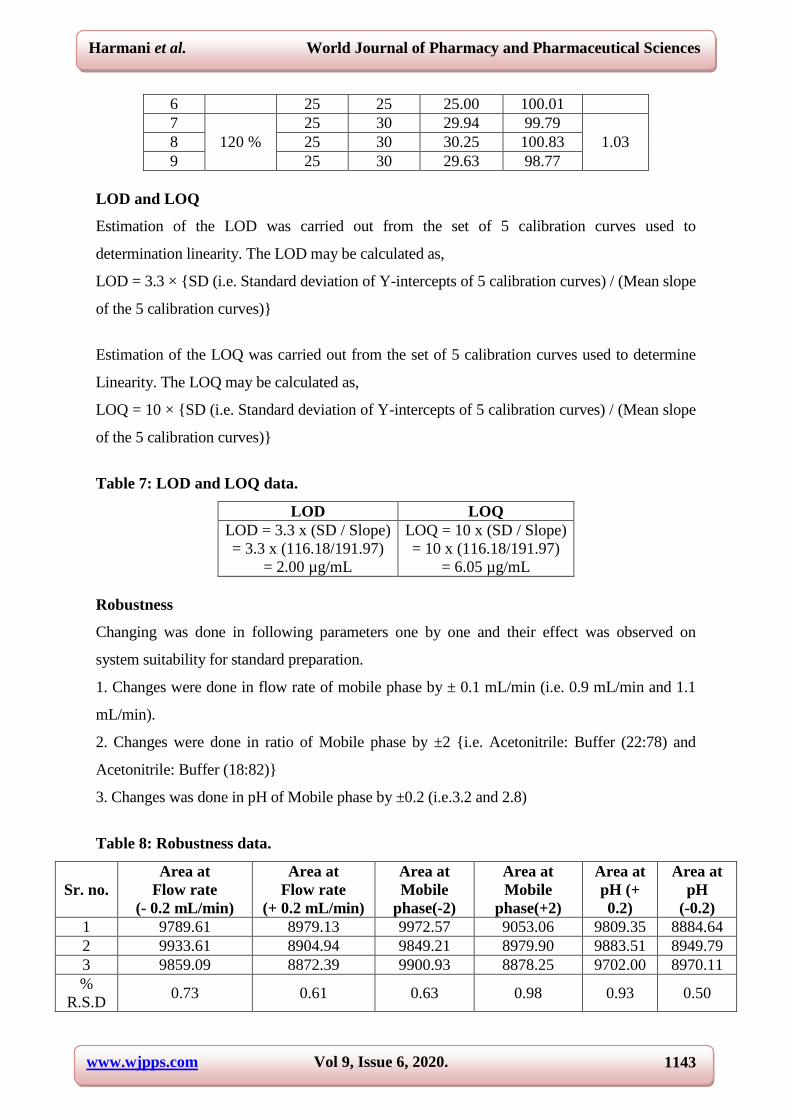
LOD and LOQ
Estimation of the LOD was carried out from the set of 5 calibration curves used to
determination linearity. The LOD may be calculated as,
LOD = 3.3 × {SD (i.e. Standard deviation of Y-intercepts of 5 calibration curves) / (Mean slope
of the 5 calibration curves)}
Estimation of the LOQ was carried out from the set of 5 calibration curves used to determine
Linearity. The LOQ may be calculated as,
LOQ = 10 × {SD (i.e. Standard deviation of Y-intercepts of 5 calibration curves) / (Mean slope
of the 5 calibration curves)}
Table 7: LOD and LOQ data.
LOD LOQ
LOD = 3.3 x (SD / Slope)
= 3.3 x (116.18/191.97)
= 2.00 µg/mL
LOQ = 10 x (SD / Slope)
= 10 x (116.18/191.97)
= 6.05 µg/mL
Robustness
Changing was done in following parameters one by one and their effect was observed on
system suitability for standard preparation.
1. Changes were done in flow rate of mobile phase by ± 0.1 mL/min (i.e. 0.9 mL/min and 1.1
mL/min).
2. Changes were done in ratio of Mobile phase by ±2 {i.e. Acetonitrile: Buffer (22:78) and
Acetonitrile: Buffer (18:82)}
3. Changes was done in pH of Mobile phase by ±0.2 (i.e.3.2 and 2.8)
Table 8: Robustness data.
Sr. no.
Area at
Flow rate
(- 0.2 mL/min)
Area at
Flow rate
(+ 0.2 mL/min)
Area at
Mobile
phase(-2)
Area at
Mobile
phase(+2)
Area at
pH (+
0.2)
Area at
pH
(-0.2)
1 9789.61 8979.13 9972.57 9053.06 9809.35 8884.64
2 9933.61 8904.94 9849.21 8979.90 9883.51 8949.79
3 9859.09 8872.39 9900.93 8878.25 9702.00 8970.11
%
R.S.D 0.73 0.61 0.63 0.98 0.93 0.50
www.wjpps.com Vol 9, Issue 6, 2020.
1144
Harmani et al. World Journal of Pharmacy and Pharmaceutical Sciences
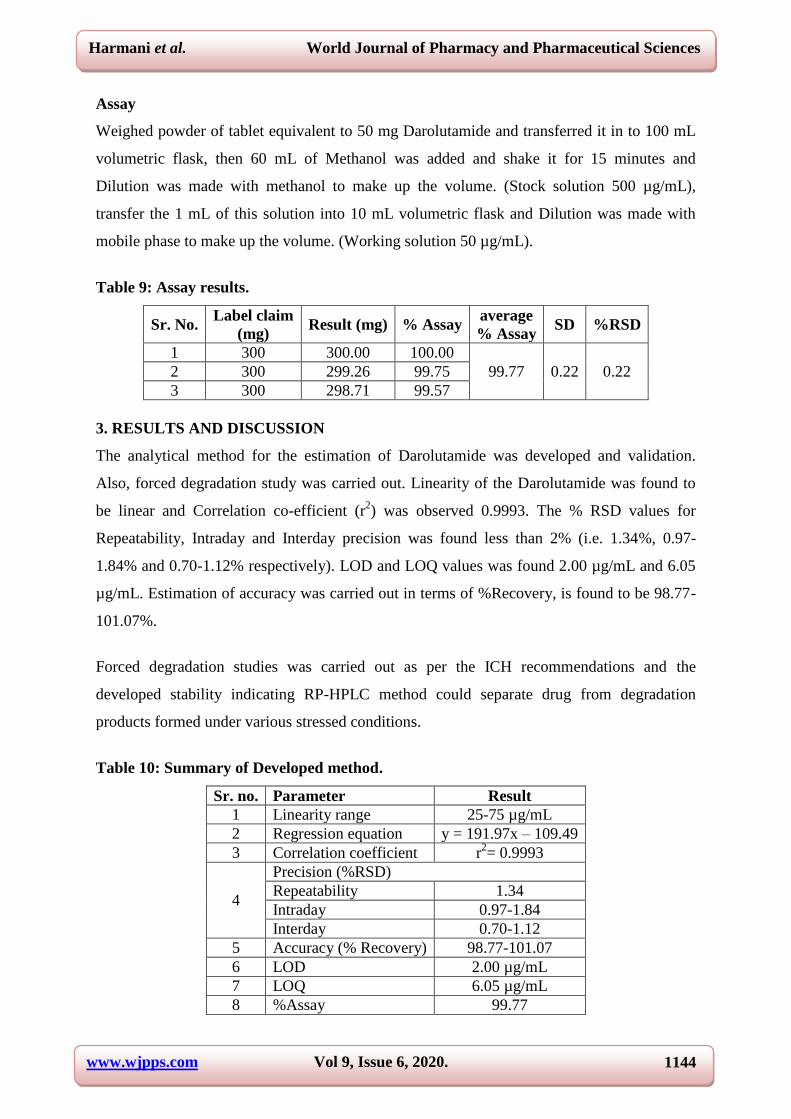
Assay
Weighed powder of tablet equivalent to 50 mg Darolutamide and transferred it in to 100 mL
volumetric flask, then 60 mL of Methanol was added and shake it for 15 minutes and
Dilution was made with methanol to make up the volume. (Stock solution 500 µg/mL),
transfer the 1 mL of this solution into 10 mL volumetric flask and Dilution was made with
mobile phase to make up the volume. (Working solution 50 µg/mL).
Table 9: Assay results.
Sr. No. Label claim
(mg) Result (mg) % Assay
average
% Assay SD %RSD
1 300 300.00 100.00
99.77 0.22 0.22 2 300 299.26 99.75
3 300 298.71 99.57
3. RESULTS AND DISCUSSION
The analytical method for the estimation of Darolutamide was developed and validation.
Also, forced degradation study was carried out. Linearity of the Darolutamide was found to
be linear and Correlation co-efficient (r2) was observed 0.9993. The % RSD values for
Repeatability, Intraday and Interday precision was found less than 2% (i.e. 1.34%, 0.97-
1.84% and 0.70-1.12% respectively). LOD and LOQ values was found 2.00 µg/mL and 6.05
µg/mL. Estimation of accuracy was carried out in terms of %Recovery, is found to be 98.77-
101.07%.
Forced degradation studies was carried out as per the ICH recommendations and the
developed stability indicating RP-HPLC method could separate drug from degradation
products formed under various stressed conditions.
Table 10: Summary of Developed method.
Sr. no. Parameter Result
1 Linearity range 25-75 µg/mL
2 Regression equation y = 191.97x – 109.49
3 Correlation coefficient r2= 0.9993
4
Precision (%RSD)
Repeatability 1.34
Intraday 0.97-1.84
Interday 0.70-1.12
5 Accuracy (% Recovery) 98.77-101.07
6 LOD 2.00 µg/mL
7 LOQ 6.05 µg/mL
8 %Assay 99.77
www.wjpps.com Vol 9, Issue 6, 2020.
1145
Harmani et al. World Journal of Pharmacy and Pharmaceutical Sciences
4. CONCLUSION
The method validation has been performed for linearity, Specificity, Robustness, precision
and accuracy. As reported methods for estimation of Darolutamide is available in mice
plasma only, this method development is worthwhile. Developed method was found to be
specific, accurate, precise, rapid, simple, selective and sensitive for estimation of
Darolutamide.
5. ACKNOWLEDGEMENTS
The authors are thankful to the K analytical Laboratory, Gujarat India, for providing
necessary infrastructure, facilities and support.
6. REFERENCES
1. ―Introduction to Prostate Cancer‖, September-19, https://www.mayoclinic.org/diseases-
conditions/prostate-cancer/symptoms-causes/syc-20353087?p=1
2. Watson DG. Pharmaceutical Analysis; 2nd
Edn; Elsevier Churchill, Livingstone, 2005;
87-88: 267-268.
3. Skoog DA., West DM., Holler FJ. and Crouch SR. Fundamentals of Analytical
Chemistry; 8th Edn; Thomson Books, 2010; 973-995.
4. Grubner O., Gidding JC. and Keller RA. Advances in Chromatography; 6th Edn;
Marcel Dekker, New York, 1958; 173-209.
5. Christian GD. In: Analytical Chemistry; 4th
Edn; John Wiley and Sons, United
Kingdom, 1986; 1-6.
6. Conners AK. In Textbook of Pharmaceutical Analysis, 3rd
Edn, A Wiley Intersciences
Publication, 1999; 616.
7. Sharma BK. In Instrumental Method of Chemical Analysis, 21st Edn, Goel Publishing
Housing, Krishna Prakashan Ltd; 2002; 3-10.
8. Jeffery GH, Bassett J, Mendham J, Denney RC. Vogel’s In Textbook of Quantitative
Chemical Analysis, 5th
Edn, Adison Wesley Longman LTD., 1996; 216-220.
9. Beckett AH, Stellate JB. Practical Pharmaceutical Chemistry, 4th
Edn, part, 196-212.
10. Sadek PC. Troubleshooting HPLC systems; 1st Edn; John Wiley and Sons, New York,
2000; 1-25.
11. Hussain MF, Bhadra S, Kumar U, Rouf SS ―The ICH guidance in practice: Stress
degradation studies on aceclofenac and development of a validated stability-indicating
reversed-phase HPLC assay in tablet dosage form‖, Der pharma chemica, 2013; 5(4):
www.wjpps.com Vol 9, Issue 6, 2020.
1146
Harmani et al. World Journal of Pharmacy and Pharmaceutical Sciences
131-146.
12. Sethi PD. High Performance Liquid Chromatography: Quantitative Analysis of
Pharmaceutical Formulations: Volume-I; Reprint of 1st Edn; CBS Publishers and
Distributors, New Delhi, 2010; 1-214.
13. Robinson JW, Skelly France EM, Frame GM. In Undergraduate Instrumental
Analysis, 6th
Edn, Marcel Dekker, 2005; 806.
14. ICH, Validation of Analytical Procedures; Text and Methodology, Q2 (R1), International
Conference on Harmonization, IFPMA, Geneva, 1996.
15. ICH, Stability testing of new drug substances and products, Q1A (R2), International
Conference on Harmonization, IFPMA, Geneva, 2003.
16. ―Drug profile for Darolutamide‖, September.-2019,
https://www.drugbank.ca/drugs/DB12941
17. ―Drug profile for Darolutamide‖, September 2019,
https://pubchem.ncbi.nlm.nih.gov/compound/Darolutamide
18. Zakkula A, Kiran V, Todmal U, Sulochna SP, Mullangi R, ―RP-HPLC-UV Method for
Simultaneous Quantification of Second Generation Non-Steroidal Antiandrogens Along
with their Active Metabolites in Mice Plasma: Application to a Pharmacokinetic Study‖
Drug Res., 2018.
19. Saini NK, Sulochna SP, Zainuddin M, Mullangi R, ―Development and validation of a
novel method for simultaneous quantification of enzalutamide, darolutamide and their
active metabolites in mice dried blood spots using LCMS/MS: application to
pharmacokinetic study in mice‖ ADMET & DMPK, 2018; 6(3): 242-257.
20. Sulochna SP, Saini NK, Daram P, Polina SB, Mulangi R ―Validation of an LC–MS/MS
method for simultaneous quantitation of enzalutamide, Ndesmethylenzalutamide,
apalutamide, darolutamide and ORM-15341 in mice plasma and its application to a mice
pharmacokinetic study‖ J. of Pharm. and Bio, 2018; 156: 170-180.