Embed Size (px)
Citation preview

Keeping Seniors Connected to the Labor Market:
Keeping Seniors Connected to the Labor Market:
Trends and Benefits
National Governor’s AssociationNovember 17, 2006

The U.S. Population is AgingThe U.S. Population is Aging
As America Ages,So Does the U.S. WorkforceAs America Ages,So Does the U.S. Workforce
• Boomers comprise 46% of today’s U.S. workforce
• At the same time, U.S. workforce growth is slowing
• Boomers comprise 46% of today’s U.S. workforce
• At the same time, U.S. workforce growth is slowing
Source: U.S. Census Bureau, Bureau of Labor Statistics
78 million Baby Boomers(born 1946-1964)
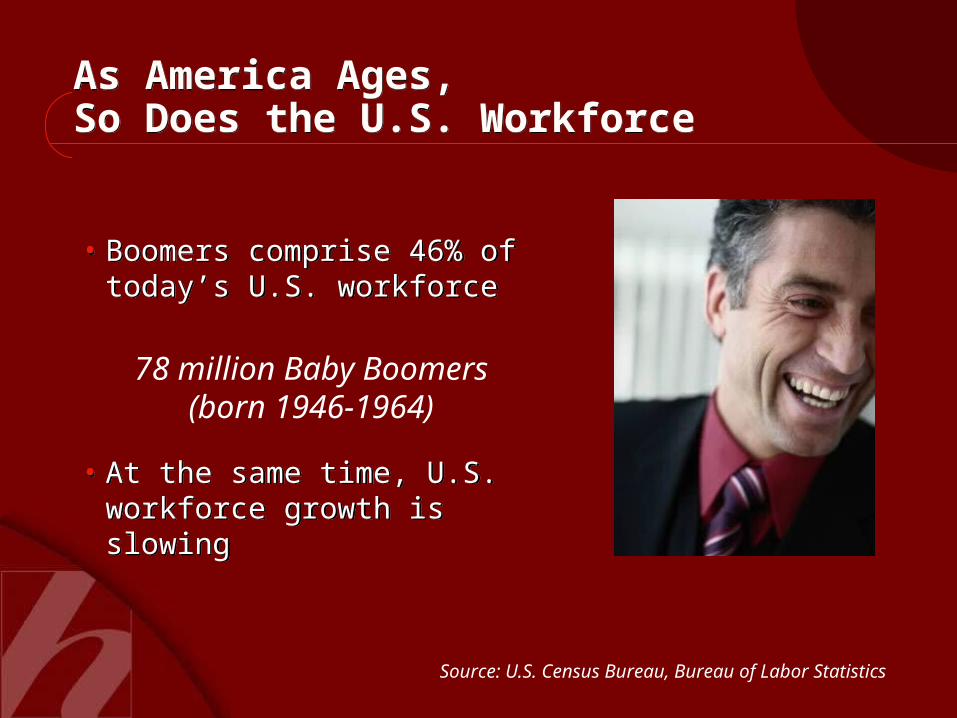
Change in U.S. Population, 1950-1960 by Age GroupChange in U.S. Population, 1950-1960 by Age Group
36.8
9.9
-4.6
11.9
17.916.6
34.5
-10
0
10
20
30
40
% P
opul
atio
n Cha
nge
14 &under
15 to 24 25 to 34 35 to 44 45 to 54 55 to 64 65 &older
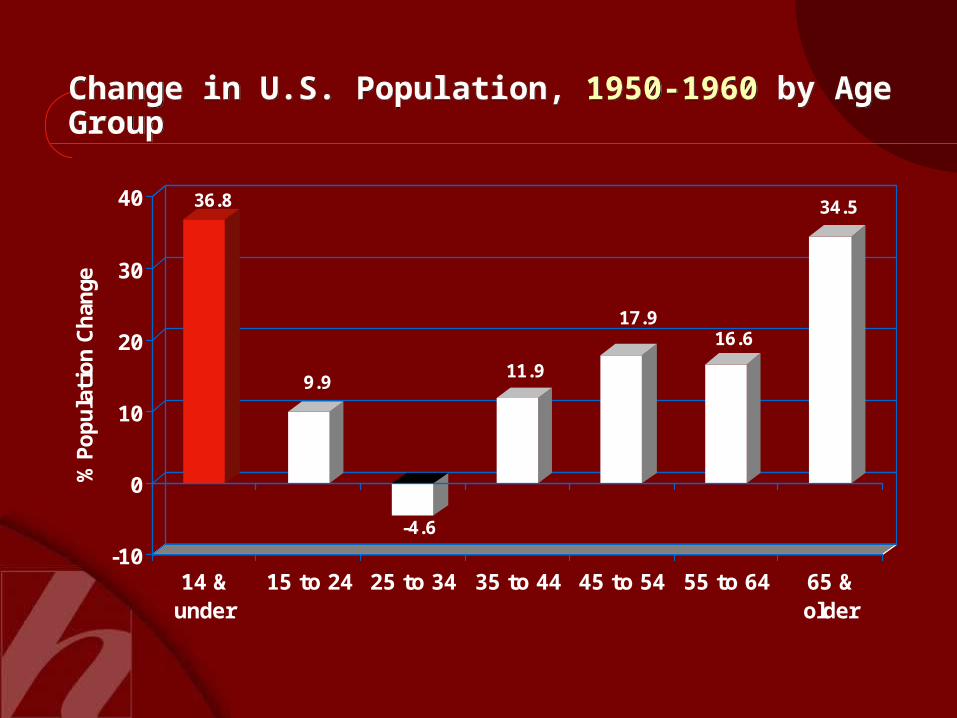
Change in U.S. Population, 1960-1970 by Age GroupChange in U.S. Population, 1960-1970 by Age Group
3.3
48.7
10.5
-4.4
13.3
19.6 20.6
-10
0
10
20
30
40
50
% P
opul
atio
n Cha
nge
14 &under
15 to 24 25 to 34 35 to 44 45 to 54 55 to 64 65 &older
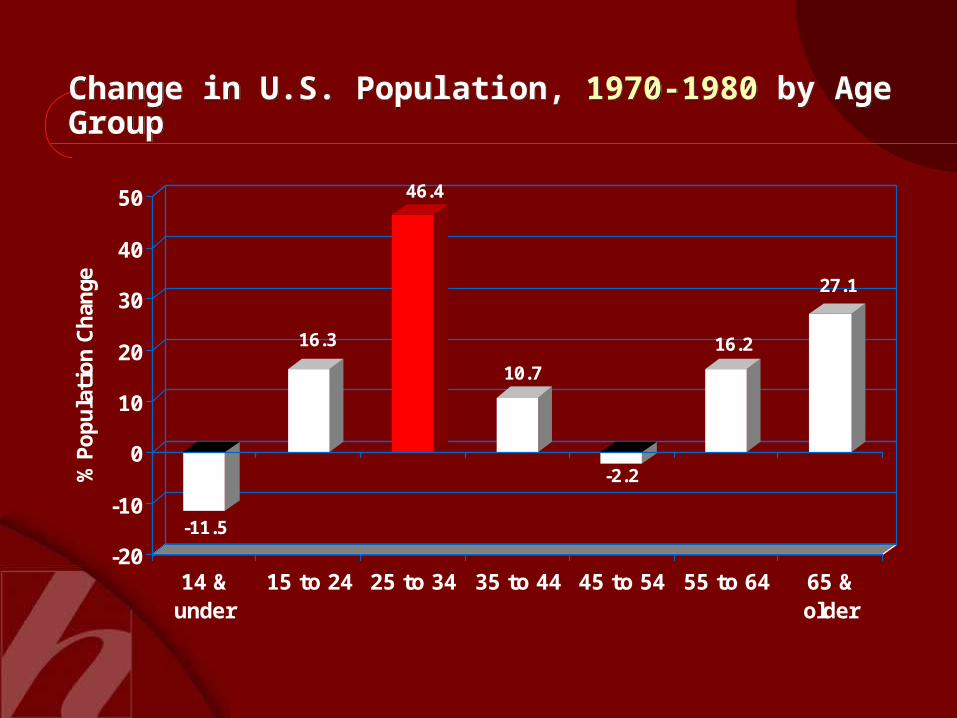
Change in U.S. Population, 1970-1980 by Age GroupChange in U.S. Population, 1970-1980 by Age Group
-11.5
16.3
46.4
10.7
-2.2
16.2
27.1
-20
-10
0
10
20
30
40
50
% P
opul
atio
n Cha
nge
14 &under
15 to 24 25 to 34 35 to 44 45 to 54 55 to 64 65 &older
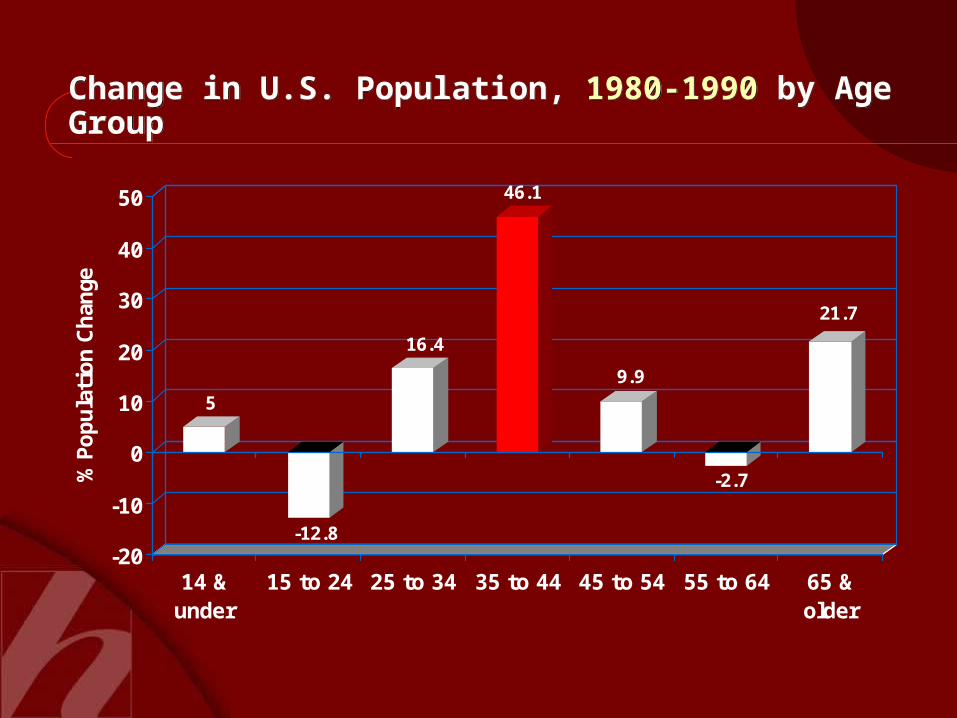
Change in U.S. Population, 1980-1990 by Age GroupChange in U.S. Population, 1980-1990 by Age Group
5
-12.8
16.4
46.1
9.9
-2.7
21.7
-20
-10
0
10
20
30
40
50
% P
opul
atio
n Cha
nge
14 &under
15 to 24 25 to 34 35 to 44 45 to 54 55 to 64 65 &older
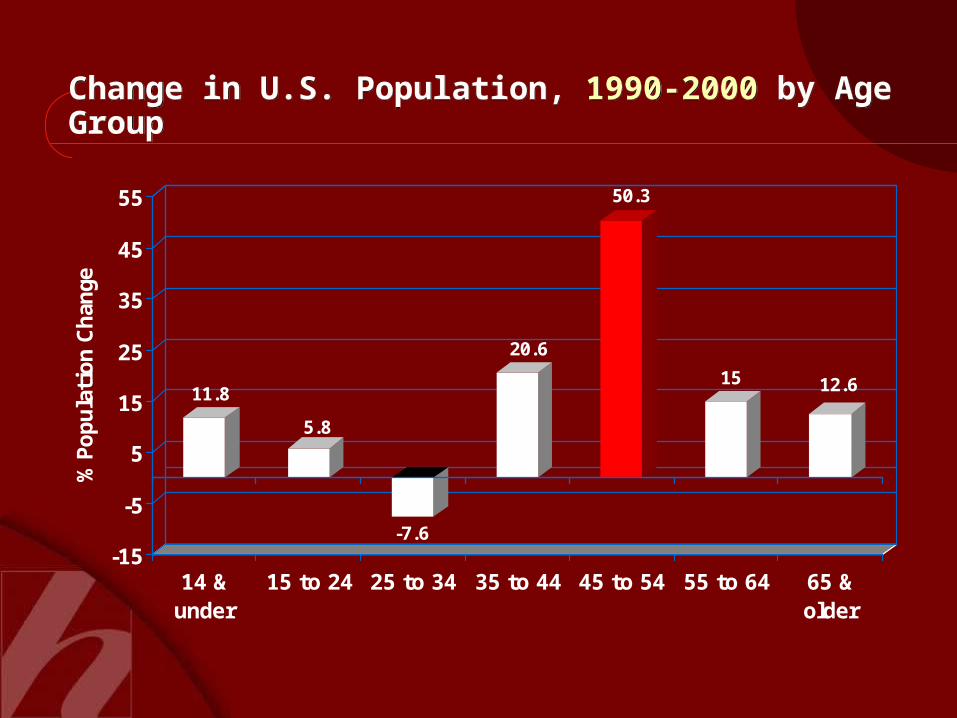
Change in U.S. Population, 1990-2000 by Age GroupChange in U.S. Population, 1990-2000 by Age Group
11.8
5.8
-7.6
20.6
50.3
15 12.6
-15
-5
5
15
25
35
45
55
% P
opul
atio
n Cha
nge
14 &under
15 to 24 25 to 34 35 to 44 45 to 54 55 to 64 65 &older
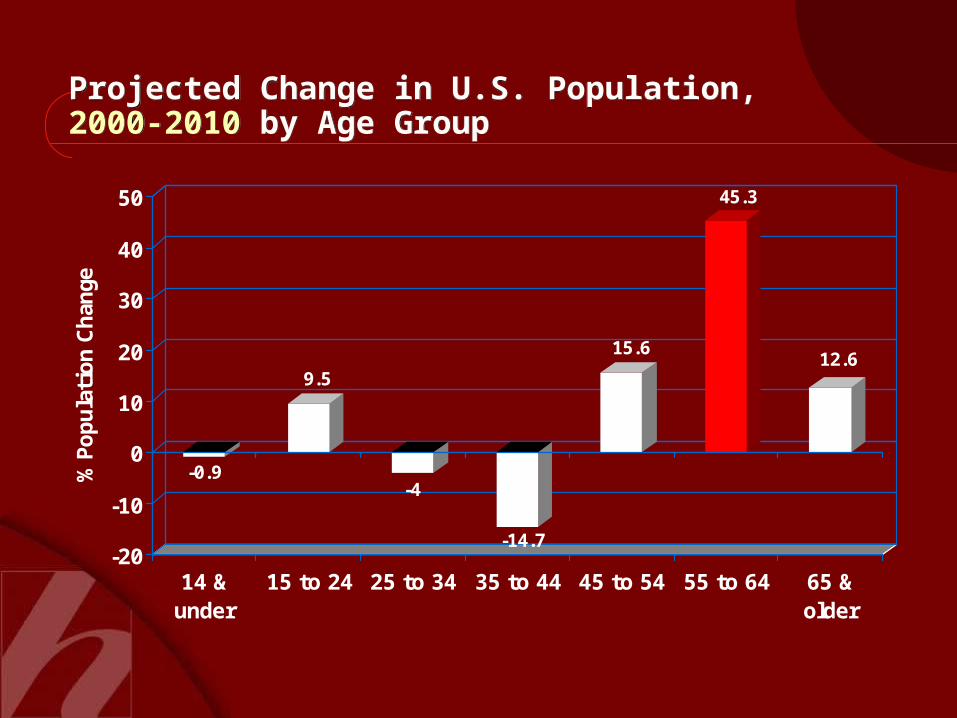
Projected Change in U.S. Population,2000-2010 by Age GroupProjected Change in U.S. Population,2000-2010 by Age Group
-0.9
9.5
-4
-14.7
15.6
45.3
12.6
-20
-10
0
10
20
30
40
50
% P
opul
atio
n Cha
nge
14 &under
15 to 24 25 to 34 35 to 44 45 to 54 55 to 64 65 &older
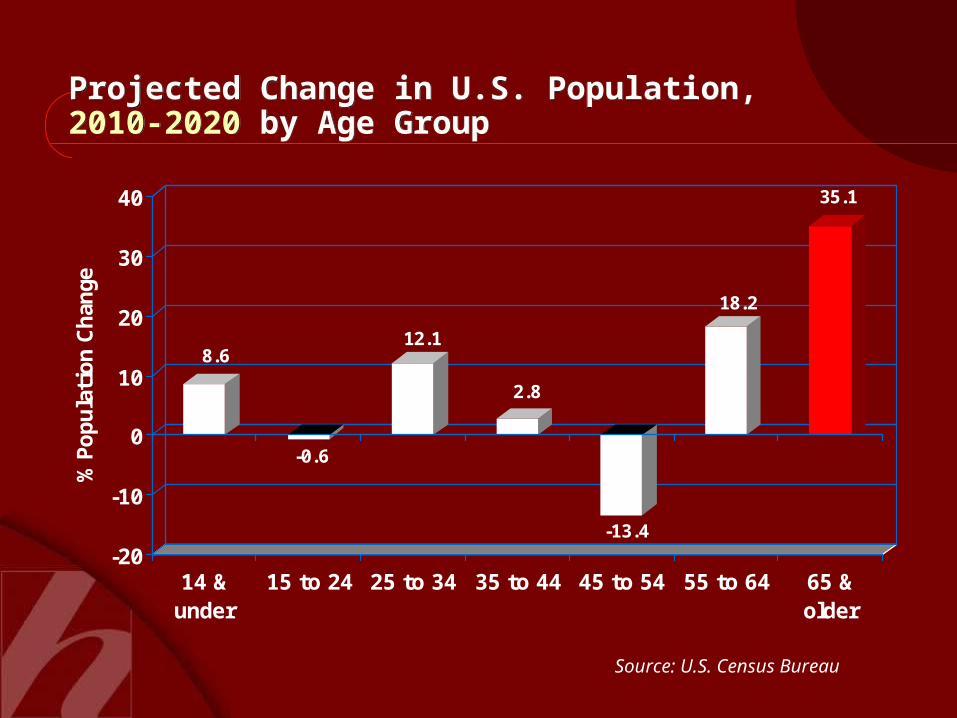
Projected Change in U.S. Population,2010-2020 by Age GroupProjected Change in U.S. Population,2010-2020 by Age Group
8.6
-0.6
12.1
2.8
-13.4
18.2
35.1
-20
-10
0
10
20
30
40
% P
opul
atio
n Cha
nge
14 &under
15 to 24 25 to 34 35 to 44 45 to 54 55 to 64 65 &older
Source: U.S. Census Bureau
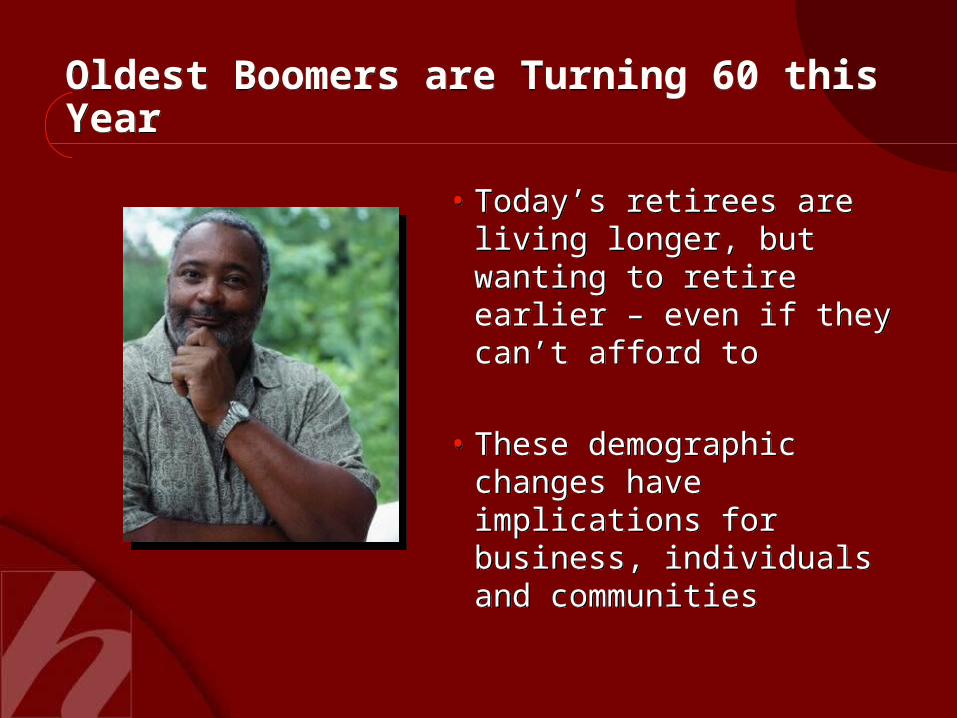
Oldest Boomers are Turning 60 this YearOldest Boomers are Turning 60 this Year
• Today’s retirees are living longer, but wanting to retire earlier – even if they can’t afford to
• These demographic changes have implications for business, individuals and communities
• Today’s retirees are living longer, but wanting to retire earlier – even if they can’t afford to
• These demographic changes have implications for business, individuals and communities
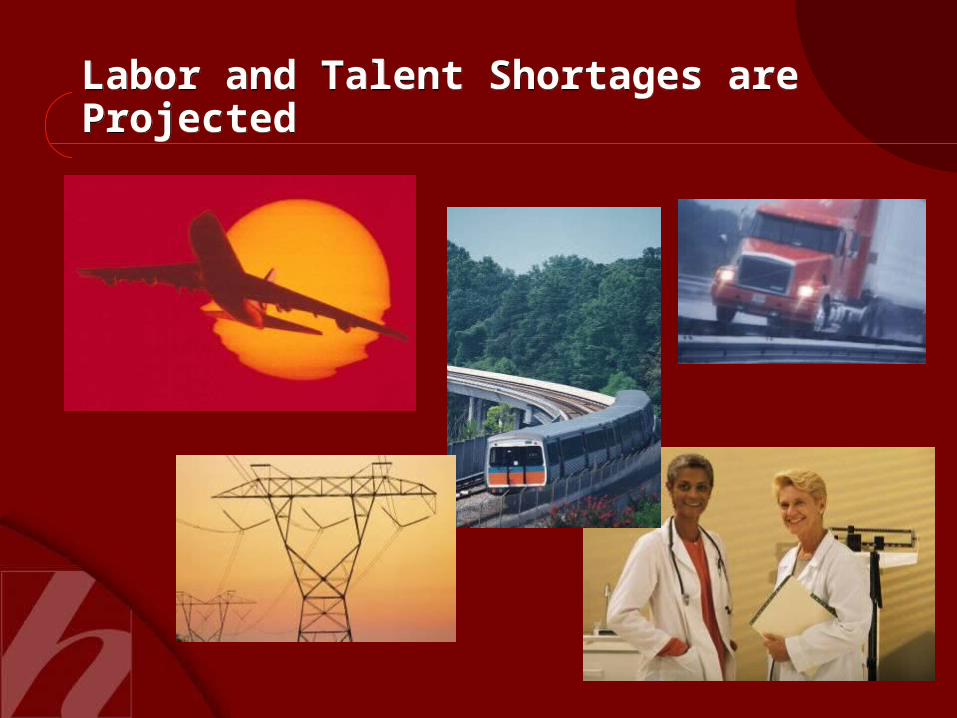
Labor and Talent Shortages are ProjectedLabor and Talent Shortages are Projected

Retirements to take a toll on the Federal GovernmentRetirements to take a toll on the Federal Government
• Average age of federal civilian workforce – 45.5
• Nearly one-half of the federal workforce could begin retirement in 2008 at age 55
• Average age of federal civilian workforce – 45.5
• Nearly one-half of the federal workforce could begin retirement in 2008 at age 55
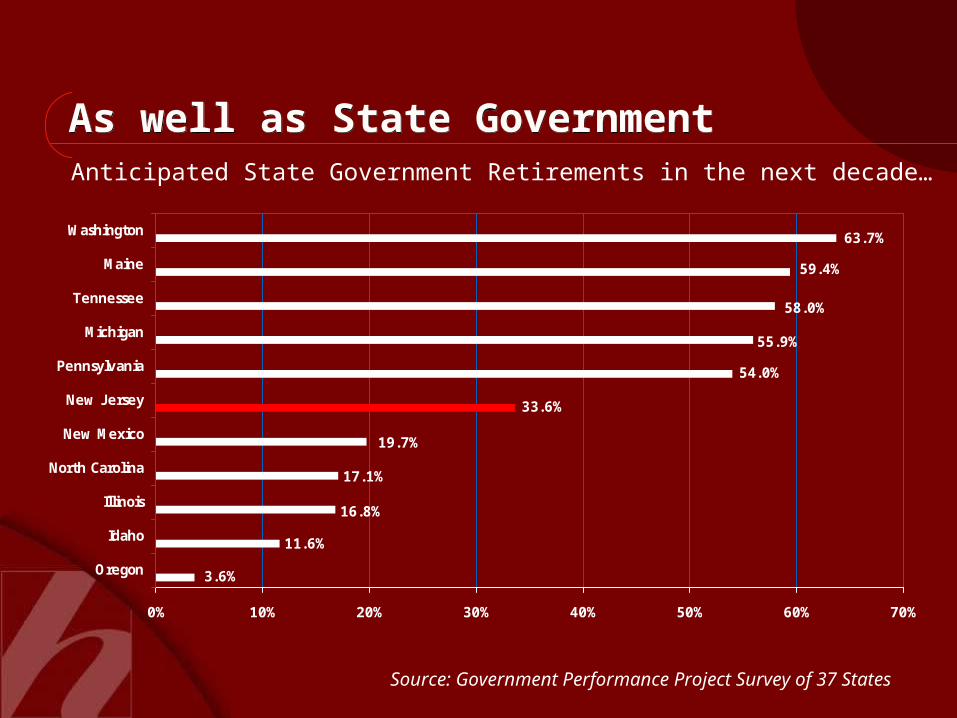
As well as State GovernmentAs well as State Government
33.6%
59.4%
58.0%
55.9%
11.6%
16.8%
17.1%
19.7%
54.0%
63.7%
3.6%
0% 10% 20% 30% 40% 50% 60% 70%
Oregon
Idaho
Illinois
North Carolina
New Mexico
New Jersey
Pennsylvania
Michigan
Tennessee
Maine
Washington
Source: Government Performance Project Survey of 37 States
Anticipated State Government Retirements in the next decade…

The Workforce of Tomorrow?The Workforce of Tomorrow?
Gray mattersGray mattersGray mattersGray matters
But Not All Mature Workers CanWork, Want to Work, or Find it Easy to Get A Job
But Not All Mature Workers CanWork, Want to Work, or Find it Easy to Get A Job
• Many unable to work past retirement age– (mandatory retirement, physical strain/disability)
• Many unable to find flexible work options
• Many don’t want to work
• Many find themselves competing with experienced peers for later-in-life employment
• Many unable to work past retirement age– (mandatory retirement, physical strain/disability)
• Many unable to find flexible work options
• Many don’t want to work
• Many find themselves competing with experienced peers for later-in-life employment
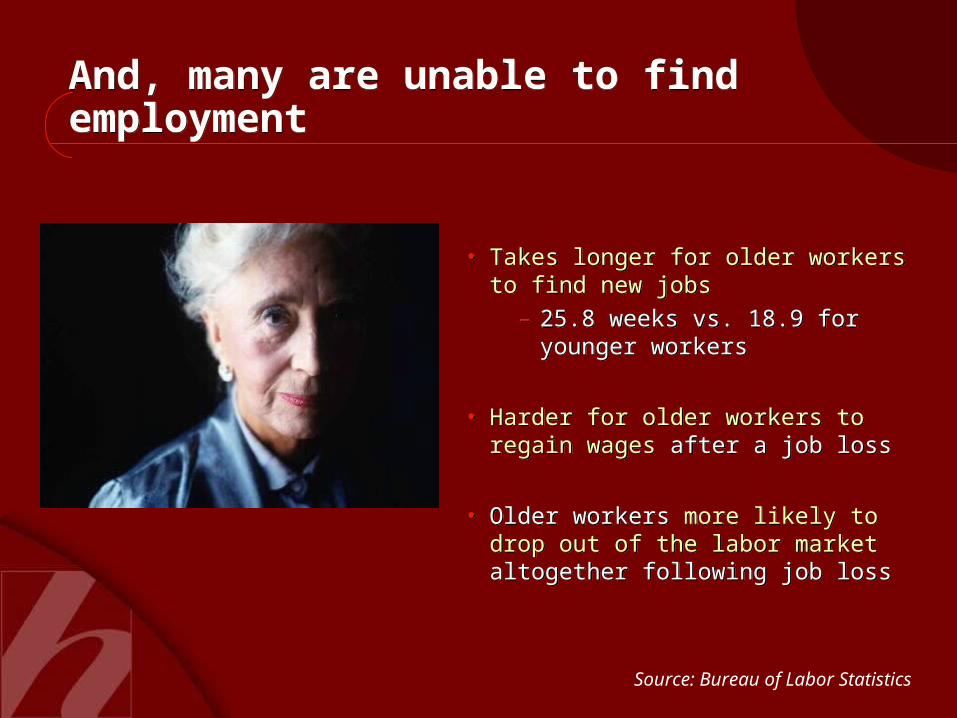
And, many are unable to find employmentAnd, many are unable to find employment
• Takes longer for older workers to find new jobs
– 25.8 weeks vs. 18.9 for younger workers
• Harder for older workers to regain wages after a job loss
• Older workers more likely to drop out of the labor market altogether following job loss
• Takes longer for older workers to find new jobs
– 25.8 weeks vs. 18.9 for younger workers
• Harder for older workers to regain wages after a job loss
• Older workers more likely to drop out of the labor market altogether following job loss
Source: Bureau of Labor Statistics

Mature Workers have a prominent role to play in the country’s future economic growth
Mature Workers have a prominent role to play in the country’s future economic growth
Benefits for Workers:
• Less reliance on public supports
• Greater financial security (continue earning and saving)
• Better physical and mental health, lower mortality rates
Benefits For Business:
• Retain knowledgeable, skilled and experienced employees
Benefits to Communities:
• Reduced strain on government programs, services and benefits