Embed Size (px)
Citation preview
1
Keeping On Track in Ninth Grade and Beyond:
Baltimore’s Ninth Graders in 2007-08
A Research Report by the Baltimore Education Research Consortium
Authored by:
Martha Abele Mac Iver
and
Douglas J. Mac Iver
March 18, 2010

2
Keeping On Track in Ninth Grade and Beyond:
Baltimore’s Ninth Graders in 2007-08
Executive Summary
Raising the graduation rate in Baltimore City will require specific attention to addressing the
behavioral factors identified in previous research that push students off-track to graduation,
particularly chronic absenteeism, suspensions, and course failure in ninth grade.i Researchers
further hypothesize that interventions to reduce the incidence of these behaviors associated with
non-graduation will help to increase graduation rates, though such intervention studies have not
yet been underway long enough for graduation outcomes to be measured. Such interventions
will often need to address underlying causes of behavioral indicators. A first step, prior to
organizing intervention strategies and evaluating their effectiveness, is to describe the extent and
concentration of these ninth grade early warning indicators, which is the primary goal of this
study.
Analysis of Baltimore City Schools data for the 6,662 first-time ninth graders in 2007-08
indicated that:
Chronic absenteeism was widespread.
• Four in ten (41.9%) of all first-time ninth graders missed more than 20 days of school in
2007-08.
• While the majority (62.4%) of those chronically absent in ninth grade were also
chronically absent in eighth grade the prior year, more than a third of the chronically
absent first-time ninth graders were newly falling off-track in attendance as they entered
high school.
Core course failure was even more common than chronic absenteeism.
• Half (50.4%) of all first-time ninth graders with transcript data failed at least one core
course (math, English, social studies or science) and nearly four in ten (37.6%) failed two
or more core courses. Course failure means that credits required for graduation were not
earned, and have to be recovered in some way to keep students on track to graduation.
• While course failure was strongly related to attendance (correlation of -0.6), a relatively
large minority (40.4%) of students with at least one failure were not chronically absent
(had 20 or fewer absences), and one in five had attendance of at least 95 percent.
• Though course failure in ninth grade was related to failing math or reading/language arts
(RELA) in eighth grade (the prior year), there were numerous ninth graders whose course
failure would not have been predictable. Just one in four of those failing in ninth grade
had evidence of failing math or RELA the prior year.
3
Suspensions were much less prevalent.
• About one in six (16.9%) of first-time ninth graders in 2007-08 had at least one
suspension, of whom most (80.9%) had suspensions of at least three days (a total of
13.7% of the cohort).
• The majority (72.9%) of those who were suspended for at least three days were also
chronically absent in 2007-08.
• Suspensions were more extensive among males than females (16.9% vs. 10.4%) and
special education than regular students (18.6% vs. 12.7%).
Implications of the Findings
Raising the graduation rate in Baltimore City will particularly require specifically targeted efforts
to increase attendance and reduce ninth grade course failure. The large number of students
exhibiting these warning signals demands extensive district support to those schools where
concentrations are extremely high. Efforts to increase attendance must begin much earlier than
high school, since most of those chronically absent in ninth grade had poor attendance patterns
already established in prior years.
The district’s Master Plan already includes numerous action steps designed to increase
attendance. While there is considerable discussion underway of the steps being taken, it is
important for the district to consider a more formal analysis of ongoing efforts to increase
attendance. Similarly, while the Master Plan also notes the need to address course failure, it is
crucial to collect systematic data on what schools are actually doing to prevent course failure as
well as to provide credit recovery options for students who need them. This is particularly
important given the significant additional costs associated with credit recovery (for nearly 27,000
core courses failed at Baltimore City high schools grades 9-12 in a single academic year). While
some course failure is directly linked to students' irregular attendance, other course failure seems
to have different roots.
BERC is currently planning a study to analyze school and classroom practices associated with
higher levels of ninth grade course passing in Baltimore’s schools. An additional BERC study
of the district’s efforts to increase attendance would provide useful information for future data-
driven decision making. We believe that formal analysis of the current efforts underway to
address attendance and course failure in particular will also help district leaders to better
integrate multiple programs and strategies into a more systematic framework for dropout
prevention. Implementation of early warning systems and public health-style tiered prevention
models designed to keep students from falling off-track to graduation (particularly in terms of
credits accrued) will be an important step to increase the district’s graduation rate. Assessing
the effectiveness of current interventions is the next step in the “cycle of inquiry,” a fundamental
practice of a well-functioning school district “learning community” (Senge, 1990).

4
Keeping On Track in Ninth Grade and Beyond:
Baltimore’s Ninth Graders in 2007-08
Introduction
“How do you lose those ninth-grade blues?” asks Barthe DeClements (1993) in the title
of her popular young adolescent novel. The ninth grade transition to high school, occurring at
the peak of adolescent turmoil, is a crucial year that often determines the probability of a student
successfully arriving at on-time graduation. This report explores the experience of the 2007-08
cohort of Baltimore City Schools ninth graders as they begin their journey through high school.
Building on research findings in other urban districts, we seek to describe the extent and
concentration of ninth grade behaviors that throw students off-track to on-time graduation. In
addition, we identify school- and individual-level characteristics that distinguish students with
higher and lower levels of risk and resilience indicators. Findings from this study will provide
information to help district policymakers target interventions to increase the district’s graduation
rate.
While graduation rates are considerably higher among some demographic groups than
others, Gleason and Dynarski (2002) have shown that demographic factors (e.g., high poverty,
Hispanic and Black, having parents or siblings who did not complete high school) do not
efficiently predict which students will leave school without graduating. A more promising focus
relies on the theoretical construct of student engagement in schooling (e.g., Fredricks,
Blumenfeld, & Paris, 2004). Student engagement in schooling has emotional, behavioral, and
cognitive components, which are sometimes classified as social and academic engagement
(Wehlage, et al., 1989). Behavioral indicators of engagement (e.g., attendance, attention in class,
completion of assignments, etc.) are influenced by attitudes -- the emotional and cognitive
components of engagement -- which can be viewed within the theoretical context of motivation.
While many of the factors leading to student disengagement are not school-related, the
behavioral indicators of student disengagement leading to a dropout outcome, such as attendance
and course failure,ii manifest themselves directly at school. Prior research has shown that
keeping students on track to graduation consists primarily in assuring that students pass all their
ninth grade courses (particularly the core academic courses required for graduation), and
continue to pass courses through twelfth grade (Allensworth & Easton, 2007; Mac Iver, Balfanz,
& Byrnes, 2009; Neild, 2009; Roderick & Camburn, 1999). But ninth grade course failure is
unfortunately still widespread. More than half (53%) of Chicago ninth grade students fail one or
more semester courses in ninth grade (Allensworth & Easton, 2007), and figures are similar in
other urban districts (Mac Iver, Balfanz, & Byrnes, 2009; Neild & Balfanz, 2006a, 2006b). Once
students get off track in ninth grade, bringing them to successful high school graduation is
extremely difficult. And ninth grade failure is also related to prior patterns of failure and low
attendance. As many as half of high school dropouts in Philadelphia could be identified by
patterns of course failure, low attendance, or behavioral problems in sixth grade (Balfanz,
Herzog, & Mac Iver, 2007). Longitudinal studies have supported the hypothesis that academic

5
failure has a direct effect on student motivation, which in turn has a direct effect on dropout
behavior (e.g., Kaplan, Peck & Kaplan, 1997).
Raising the graduation rate in Baltimore City will require specific attention to addressing
the behavioral factors identified in previous research that push students off-track to graduation,
particularly chronic absenteeism, suspensions, and course failure in ninth grade.iii
Researchers
further hypothesize that interventions to reduce the incidence of these behaviors associated with
non-graduation will help to increase graduation rates, though such intervention studies have not
yet been underway long enough for graduation outcomes to be measured (e.g., Mac Iver & Mac
Iver, 2009). Such interventions will often need to address underlying causes of behavioral
indicators (e.g., family issues such as caring for younger siblings that keep students from
attending school, health issues, etc.). A first step, prior to organizing intervention strategies and
evaluating their effectiveness, is to describe the extent and concentration of these ninth grade
early warning indicators, which is the primary goal of this study. In particular, it is crucial to
identify the extent and concentration of ninth grade failure, since failure requires district- and
school-level planning for credit recovery in order for failing students to graduate. This
descriptive study of ninth grade early warning indicators should also motivate a district- and
school-level focus on preventing absenteeism, behavior problems, and course failure before they
occur.
Research Questions
1. To what extent are City Schools ninth graders exhibiting early warning indicators of non-
graduation (chronic absenteeism, behavioral problems, course failure) during ninth
grade? How does this vary by demographic group and school type?
2. To what extent did City Schools ninth graders who exhibit early warning indicators of
non-graduation also have these indicators prior to ninth grade (in eighth grade, seventh
grade, and sixth grade)? How does this vary by demographic group and school type?
3. To what extent did City Schools ninth graders demonstrate resiliency, exhibiting these
indicators prior to ninth grade (in eighth grade, seventh grade, or sixth grade) but not in
ninth grade? How does this vary by demographic group and school type?
Data and Methods
This analysis used de-identified yearly administrative student-level data files from the
Baltimore City Public Schools from 2007-2008 and the four previous years (2003-04, 2004-05,
2005-06, and 2006-07). These files include demographic variables, school status variables
(grade level, school, special education status, limited English proficiency (LEP) status, etc.),
attendance, test scores, suspensions, and core course grades.iv
Data analyses were conducted
specifically for this report and may not match other published analyses exactly.
We focused on all ninth grade students in 2007-08, merging in prior years’ data on
attendance, test scores, suspensions, and middle school grades, as well as school and grade level
for those students who were attending school in the district in middle school. Based on these
6
student-level data, we created several variables describing student outcomes in ninth grade and
prior years. This retrospective approach differs from more traditional cohort analyses in that it
focuses on all students at a particular grade level in a particular year (distinguishing between
first-time ninth graders and repeat ninth graders), and then follows them backward in time
through district records. It provides a complementary analysis to the traditional cohort study
approach that follows students forward in time.
Descriptive Findings
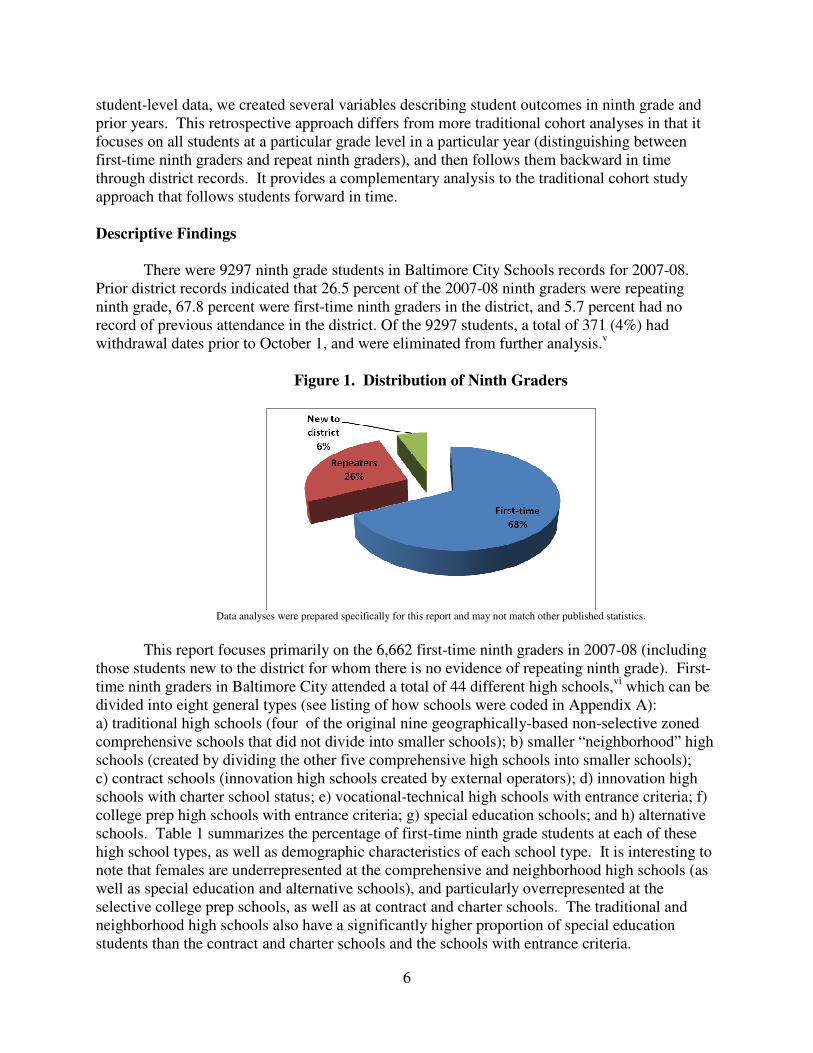
There were 9297 ninth grade students in Baltimore City Schools records for 2007-08.
Prior district records indicated that 26.5 percent of the 2007-08 ninth graders were repeating
ninth grade, 67.8 percent were first-time ninth graders in the district, and 5.7 percent had no
record of previous attendance in the district. Of the 9297 students, a total of 371 (4%) had
withdrawal dates prior to October 1, and were eliminated from further analysis.v
Figure 1. Distribution of Ninth Graders
Data analyses were prepared specifically for this report and may not match other published statistics.
This report focuses primarily on the 6,662 first-time ninth graders in 2007-08 (including
those students new to the district for whom there is no evidence of repeating ninth grade). First-
time ninth graders in Baltimore City attended a total of 44 different high schools,vi
which can be
divided into eight general types (see listing of how schools were coded in Appendix A):
a) traditional high schools (four of the original nine geographically-based non-selective zoned
comprehensive schools that did not divide into smaller schools); b) smaller “neighborhood” high
schools (created by dividing the other five comprehensive high schools into smaller schools);
c) contract schools (innovation high schools created by external operators); d) innovation high
schools with charter school status; e) vocational-technical high schools with entrance criteria; f)
college prep high schools with entrance criteria; g) special education schools; and h) alternative
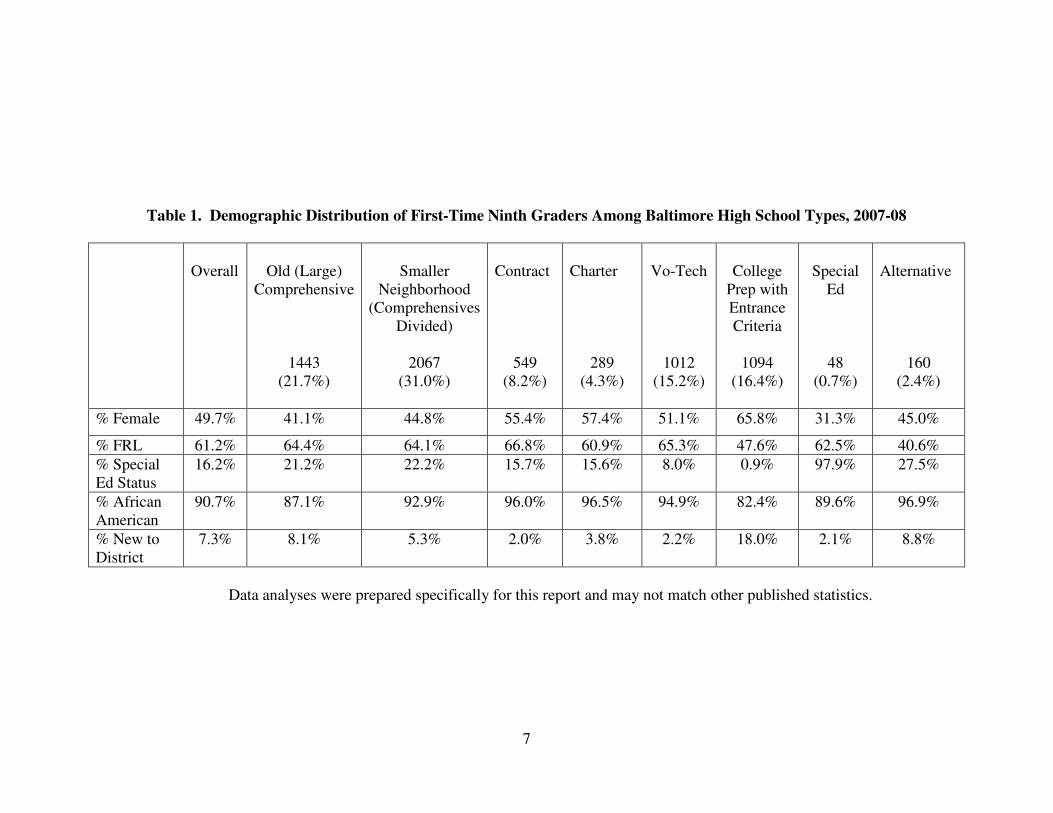
schools. Table 1 summarizes the percentage of first-time ninth grade students at each of these
high school types, as well as demographic characteristics of each school type. It is interesting to
note that females are underrepresented at the comprehensive and neighborhood high schools (as
well as special education and alternative schools), and particularly overrepresented at the
selective college prep schools, as well as at contract and charter schools. The traditional and
neighborhood high schools also have a significantly higher proportion of special education
students than the contract and charter schools and the schools with entrance criteria.
7
Table 1. Demographic Distribution of First-Time Ninth Graders Among Baltimore High School Types, 2007-08
Overall
Old (Large)
Comprehensive
1443
(21.7%)
Smaller
Neighborhood
(Comprehensives
Divided)
2067
(31.0%)
Contract
549
(8.2%)
Charter
289
(4.3%)
Vo-Tech
1012
(15.2%)
College
Prep with
Entrance
Criteria
1094
(16.4%)
Special
Ed
48
(0.7%)
Alternative
160
(2.4%)
% Female 49.7% 41.1% 44.8% 55.4% 57.4% 51.1% 65.8% 31.3% 45.0%
% FRL 61.2% 64.4% 64.1% 66.8% 60.9% 65.3% 47.6% 62.5% 40.6%
% Special
Ed Status
16.2% 21.2% 22.2% 15.7% 15.6% 8.0% 0.9% 97.9% 27.5%
% African
American
90.7% 87.1% 92.9% 96.0% 96.5% 94.9% 82.4% 89.6% 96.9%
% New to
District
7.3% 8.1% 5.3% 2.0% 3.8% 2.2% 18.0% 2.1% 8.8%
Data analyses were prepared specifically for this report and may not match other published statistics.
8
Ninth Grade Early Warning Indicators
Given the prior research that identified absenteeism, behavior problems, and course
failure (the “ABCs”) as important early behavioral warning indicators of a dropout outcome
(Allensworth & Easton, 2007; Balfanz, Herzog, & Mac Iver, 2007), we sought to determine how
many Baltimore students were displaying these “actionable” early warning signs as first-time
ninth graders in 2007-08. We also examine overage for grade status, since it has been identified
as a strong predictor of non-graduation and can be considered an “off-track” indicator reflecting
prior retention in grade (which is an “actionable” policy, even if overage status is not).
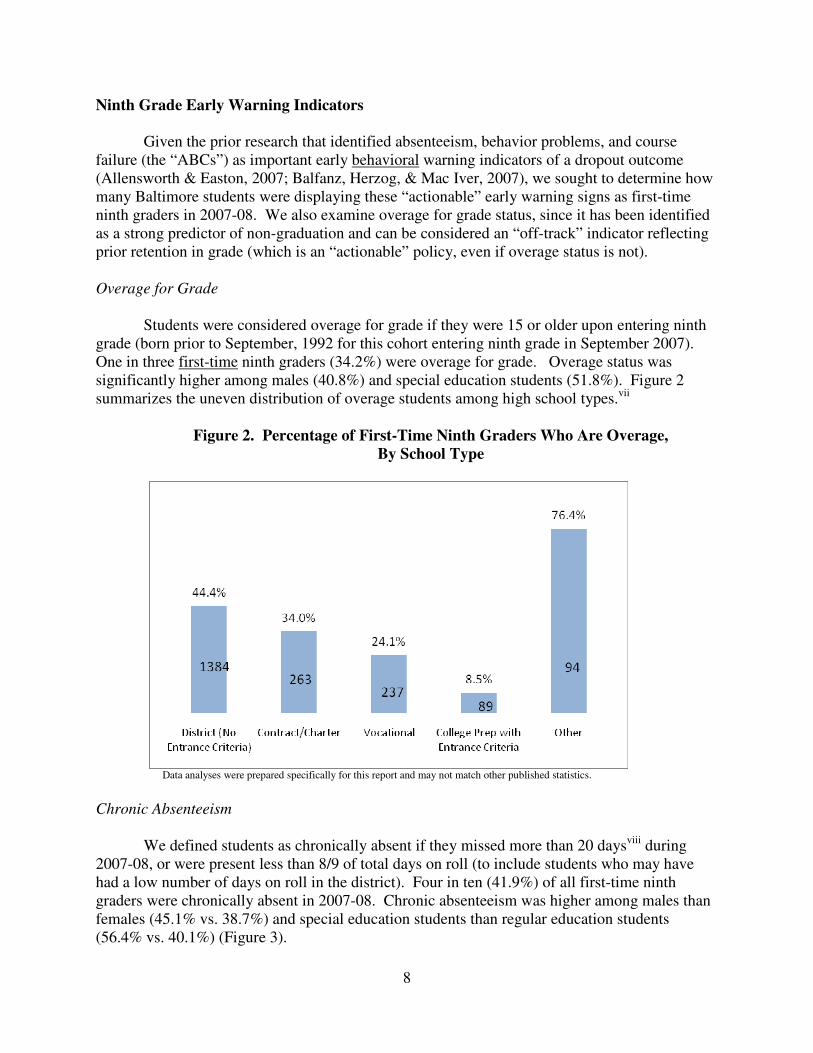
Overage for Grade
Students were considered overage for grade if they were 15 or older upon entering ninth
grade (born prior to September, 1992 for this cohort entering ninth grade in September 2007).
One in three first-time ninth graders (34.2%) were overage for grade. Overage status was
significantly higher among males (40.8%) and special education students (51.8%). Figure 2
summarizes the uneven distribution of overage students among high school types.vii
Figure 2. Percentage of First-Time Ninth Graders Who Are Overage,
By School Type
Data analyses were prepared specifically for this report and may not match other published statistics.
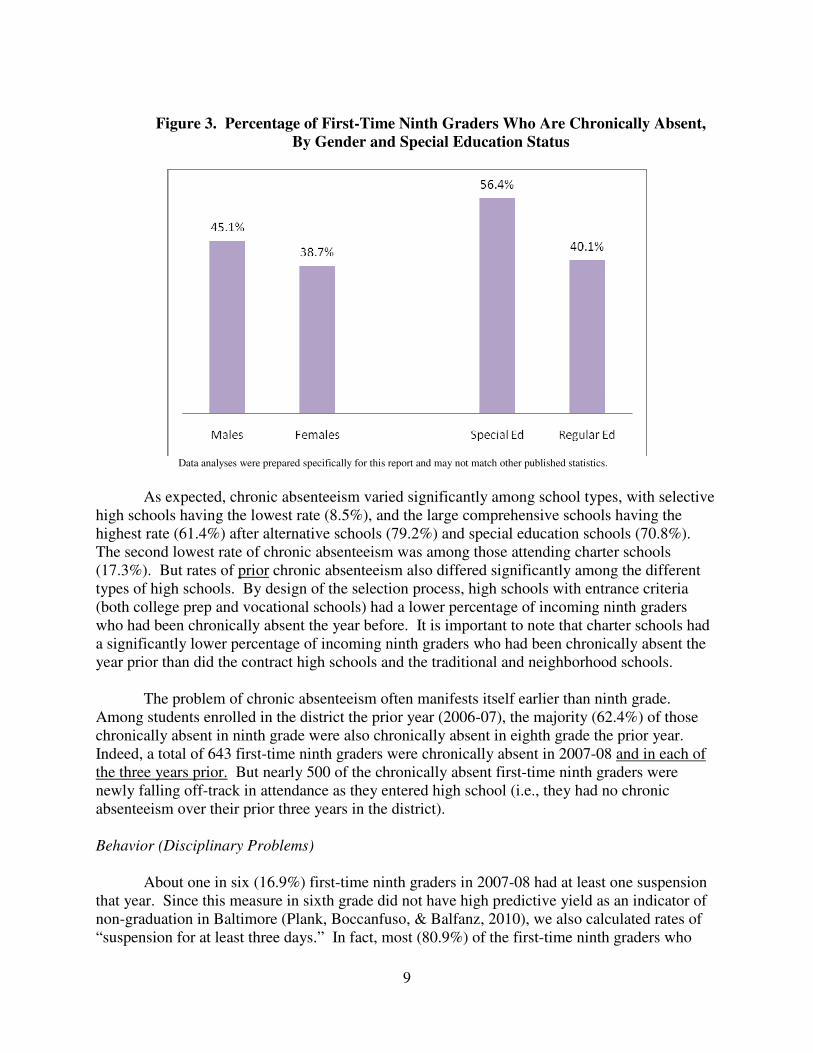
Chronic Absenteeism
We defined students as chronically absent if they missed more than 20 daysviii
during
2007-08, or were present less than 8/9 of total days on roll (to include students who may have
had a low number of days on roll in the district). Four in ten (41.9%) of all first-time ninth
graders were chronically absent in 2007-08. Chronic absenteeism was higher among males than
females (45.1% vs. 38.7%) and special education students than regular education students
(56.4% vs. 40.1%) (Figure 3).
9
Figure 3. Percentage of First-Time Ninth Graders Who Are Chronically Absent,
By Gender and Special Education Status
Data analyses were prepared specifically for this report and may not match other published statistics.
As expected, chronic absenteeism varied significantly among school types, with selective
high schools having the lowest rate (8.5%), and the large comprehensive schools having the
highest rate (61.4%) after alternative schools (79.2%) and special education schools (70.8%).
The second lowest rate of chronic absenteeism was among those attending charter schools
(17.3%). But rates of prior chronic absenteeism also differed significantly among the different
types of high schools. By design of the selection process, high schools with entrance criteria
(both college prep and vocational schools) had a lower percentage of incoming ninth graders
who had been chronically absent the year before. It is important to note that charter schools had
a significantly lower percentage of incoming ninth graders who had been chronically absent the
year prior than did the contract high schools and the traditional and neighborhood schools.
The problem of chronic absenteeism often manifests itself earlier than ninth grade.
Among students enrolled in the district the prior year (2006-07), the majority (62.4%) of those
chronically absent in ninth grade were also chronically absent in eighth grade the prior year.
Indeed, a total of 643 first-time ninth graders were chronically absent in 2007-08 and in each of
the three years prior. But nearly 500 of the chronically absent first-time ninth graders were
newly falling off-track in attendance as they entered high school (i.e., they had no chronic
absenteeism over their prior three years in the district).
Behavior (Disciplinary Problems)
About one in six (16.9%) first-time ninth graders in 2007-08 had at least one suspension
that year. Since this measure in sixth grade did not have high predictive yield as an indicator of
non-graduation in Baltimore (Plank, Boccanfuso, & Balfanz, 2010), we also calculated rates of
“suspension for at least three days.” In fact, most (80.9%) of the first-time ninth graders who
10
were suspended in 2007-08 had suspensions lasting at least three days (13.7% of the cohort).
The majority (72.9%) of those who were suspended for at least three days that year were also
chronically absent in 2007-08. This disciplinary problem indicator was much more prominent
among males than females (16.9% vs. 10.4%) and special education than regular students (18.6%
vs. 12.7%).
To what extent was chronic absenteeism driven by suspension? Nearly one in four
(23.8%, 664 students) of those first-time ninth graders who were chronically absent in 2007-08
had been suspended for at least three days. But for the large majority (76.2%) of chronically
absent students, attendance problems were not related to suspension. Among the chronically
absent students who had been suspended for three or more days, half (49.4%) had been
suspended for six or fewer days, and three-quarters (76.2%) had been suspended for 20 or fewer
days. There was a group of 158 first-time ninth graders (2% of the entire cohort) who missed
more than 20 days of school due to suspension in 2007-08.
Suspensions during the middle grades were significantly related to chronic absence in
ninth grade. A majority (60.2%) of those who had been suspended at any time during middle
school were chronically absent in ninth grade, compared to just a third (33.0%) of those who
hadn’t been suspended in middle school who had chronic absence problems in ninth grade.
While the relationship is strong, less than half (47.0%) of those chronically absent in ninth grade
had a record of suspension anytime in the previous three years (compared to 22.4% of non-
chronically absent ninth graders with a suspension during the past three years). The majority of
chronic absenteeism in ninth grade was not related to suspension, though suspension in the
middle grades could be a major contributing factor for a large number of chronically absent
students.
Course Failure
Final course grades were available for core academic courses (math, English, science,
and social studies) for the majority (89.2%) of first-time ninth grade students. ix
Course grades
were coded as failing if the grade received was below a 60. Half (50.4%) of all first-time ninth
graders with course grade data failed at least one core course, and nearly four in ten (37.6%)
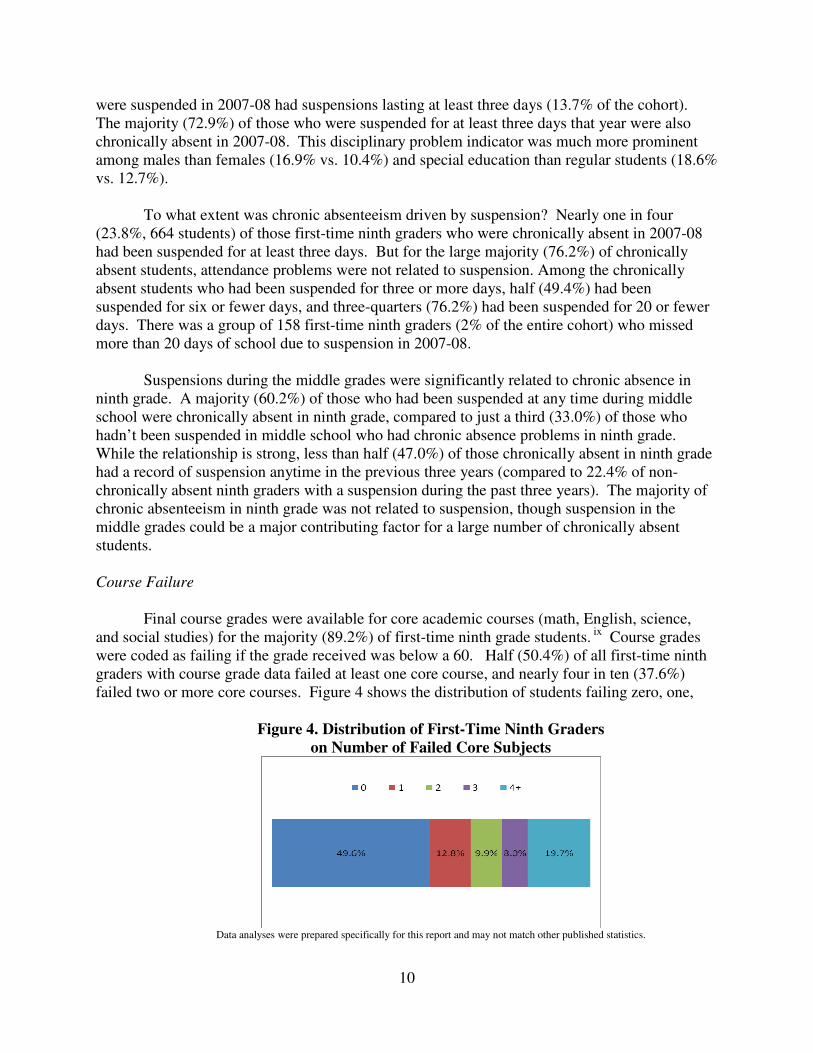
failed two or more core courses. Figure 4 shows the distribution of students failing zero, one,
Figure 4. Distribution of First-Time Ninth Graders
on Number of Failed Core Subjects
Data analyses were prepared specifically for this report and may not match other published statistics.
11
two, three, or four or more core courses.x One in five students (19.7%) failed four or more core
courses, one in twelve failed a total of three courses, one in ten failed two courses, and one in
eight failed just one course.
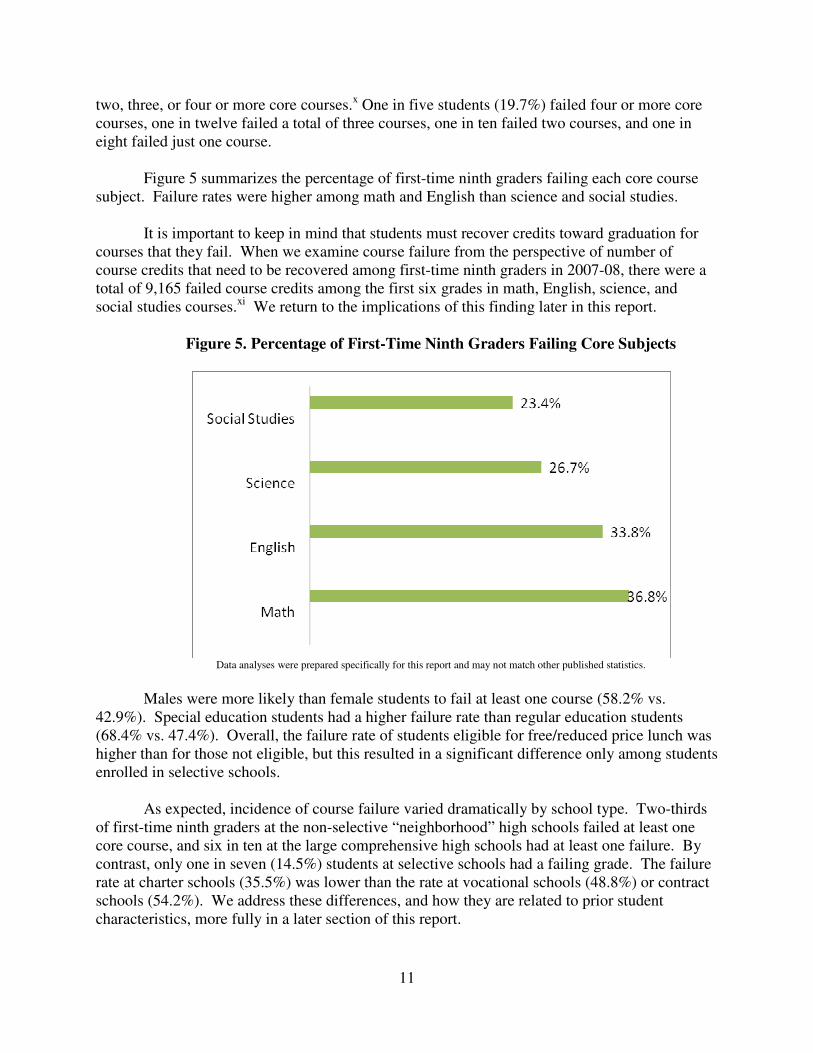
Figure 5 summarizes the percentage of first-time ninth graders failing each core course
subject. Failure rates were higher among math and English than science and social studies.
It is important to keep in mind that students must recover credits toward graduation for
courses that they fail. When we examine course failure from the perspective of number of
course credits that need to be recovered among first-time ninth graders in 2007-08, there were a
total of 9,165 failed course credits among the first six grades in math, English, science, and
social studies courses.xi
We return to the implications of this finding later in this report.
Figure 5. Percentage of First-Time Ninth Graders Failing Core Subjects
Data analyses were prepared specifically for this report and may not match other published statistics.
Males were more likely than female students to fail at least one course (58.2% vs.
42.9%). Special education students had a higher failure rate than regular education students
(68.4% vs. 47.4%). Overall, the failure rate of students eligible for free/reduced price lunch was
higher than for those not eligible, but this resulted in a significant difference only among students
enrolled in selective schools.
As expected, incidence of course failure varied dramatically by school type. Two-thirds
of first-time ninth graders at the non-selective “neighborhood” high schools failed at least one
core course, and six in ten at the large comprehensive high schools had at least one failure. By
contrast, only one in seven (14.5%) students at selective schools had a failing grade. The failure
rate at charter schools (35.5%) was lower than the rate at vocational schools (48.8%) or contract
schools (54.2%). We address these differences, and how they are related to prior student
characteristics, more fully in a later section of this report.
12
While course failure was strongly related to attendance (correlation of -0.6), a relatively
large minority (40.4%) of students with at least one failure were not chronically absent (had 20
or fewer absences), and one in five had attendance of at least 95 percent. Thus, an appreciable
number of ninth graders are failing core courses despite regular attendance.
Though course failure in ninth grade was related to failing math or reading/language arts
(RELA) in eighth grade (the prior year), there were numerous ninth graders whose course failure
would not have been expected. More than half (53.9%) of those failing at least one core course
in ninth grade had passing grades in reading and math in eighth grade, while an additional 20.7%
had no course data available from the prior year.xii
Just one in four (25.5%) of those failing any
core course in ninth grade had a record of failing math or RELA the prior year.
Early Warning Indicator (EWI) Scale
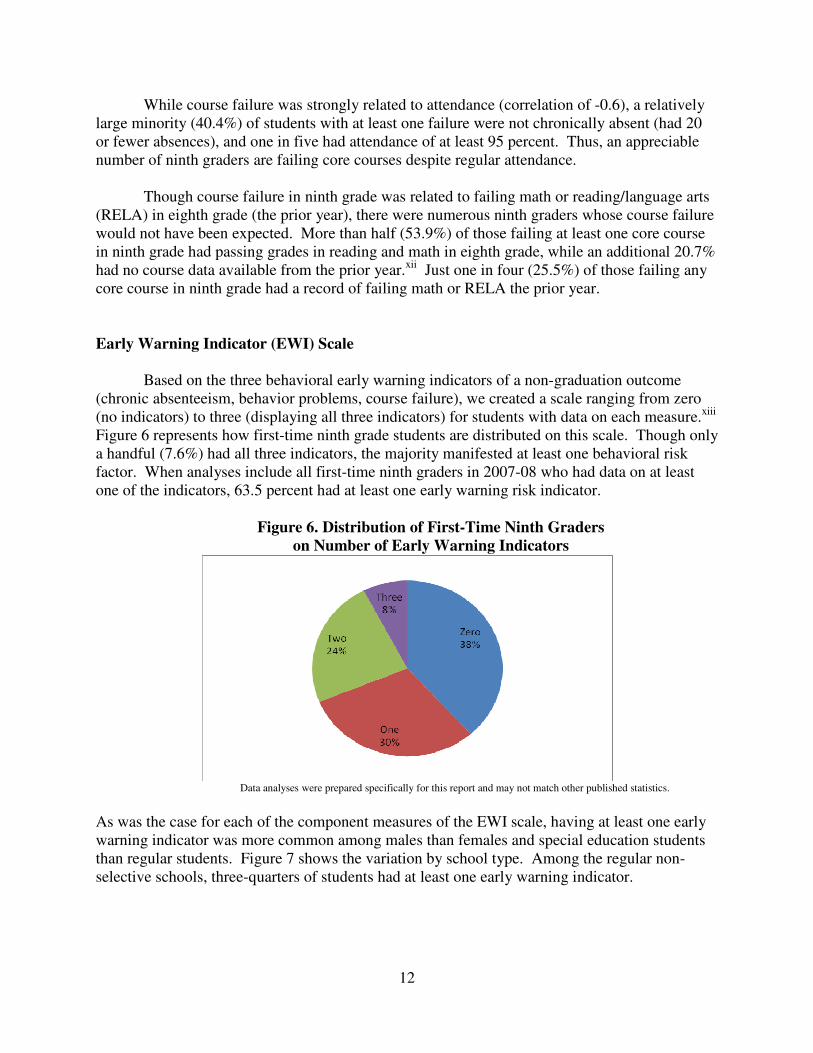
Based on the three behavioral early warning indicators of a non-graduation outcome
(chronic absenteeism, behavior problems, course failure), we created a scale ranging from zero
(no indicators) to three (displaying all three indicators) for students with data on each measure.xiii
Figure 6 represents how first-time ninth grade students are distributed on this scale. Though only
a handful (7.6%) had all three indicators, the majority manifested at least one behavioral risk
factor. When analyses include all first-time ninth graders in 2007-08 who had data on at least
one of the indicators, 63.5 percent had at least one early warning risk indicator.
Figure 6. Distribution of First-Time Ninth Graders
on Number of Early Warning Indicators
Data analyses were prepared specifically for this report and may not match other published statistics.
As was the case for each of the component measures of the EWI scale, having at least one early
warning indicator was more common among males than females and special education students
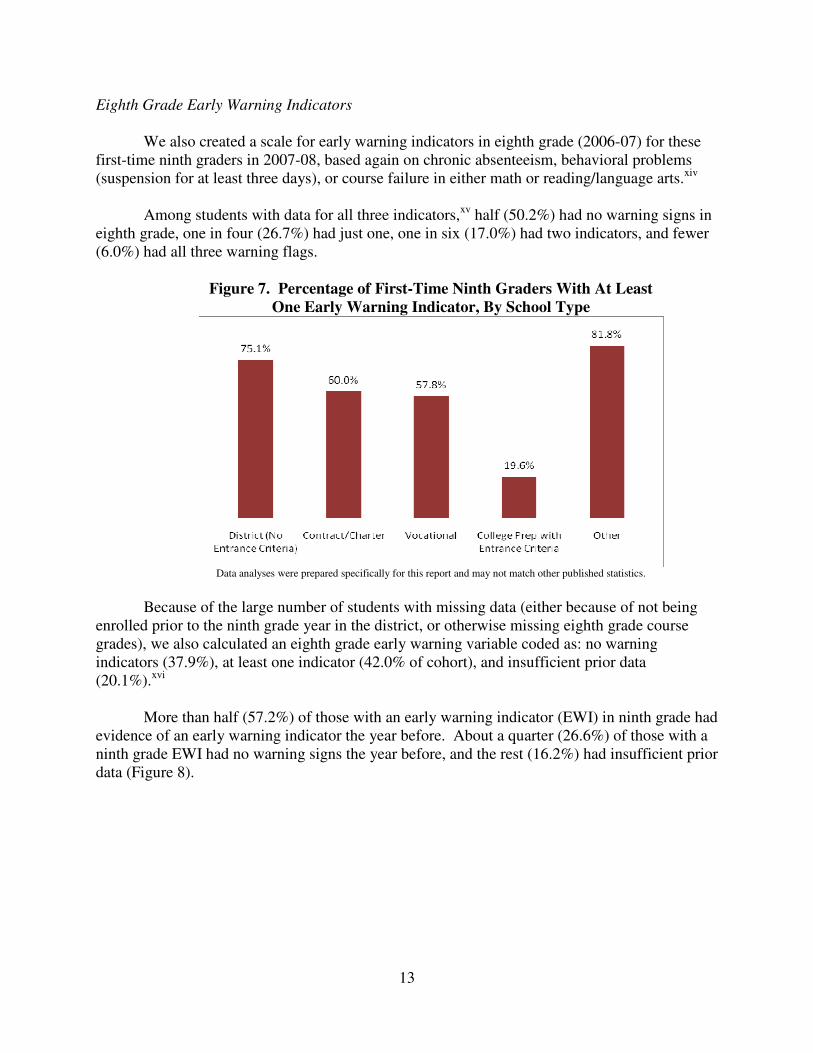
than regular students. Figure 7 shows the variation by school type. Among the regular non-
selective schools, three-quarters of students had at least one early warning indicator.
13
Eighth Grade Early Warning Indicators
We also created a scale for early warning indicators in eighth grade (2006-07) for these
first-time ninth graders in 2007-08, based again on chronic absenteeism, behavioral problems
(suspension for at least three days), or course failure in either math or reading/language arts.xiv
Among students with data for all three indicators,xv
half (50.2%) had no warning signs in
eighth grade, one in four (26.7%) had just one, one in six (17.0%) had two indicators, and fewer
(6.0%) had all three warning flags.
Figure 7. Percentage of First-Time Ninth Graders With At Least
One Early Warning Indicator, By School Type
Data analyses were prepared specifically for this report and may not match other published statistics.
Because of the large number of students with missing data (either because of not being
enrolled prior to the ninth grade year in the district, or otherwise missing eighth grade course
grades), we also calculated an eighth grade early warning variable coded as: no warning
indicators (37.9%), at least one indicator (42.0% of cohort), and insufficient prior data
(20.1%).xvi
More than half (57.2%) of those with an early warning indicator (EWI) in ninth grade had
evidence of an early warning indicator the year before. About a quarter (26.6%) of those with a
ninth grade EWI had no warning signs the year before, and the rest (16.2%) had insufficient prior
data (Figure 8).
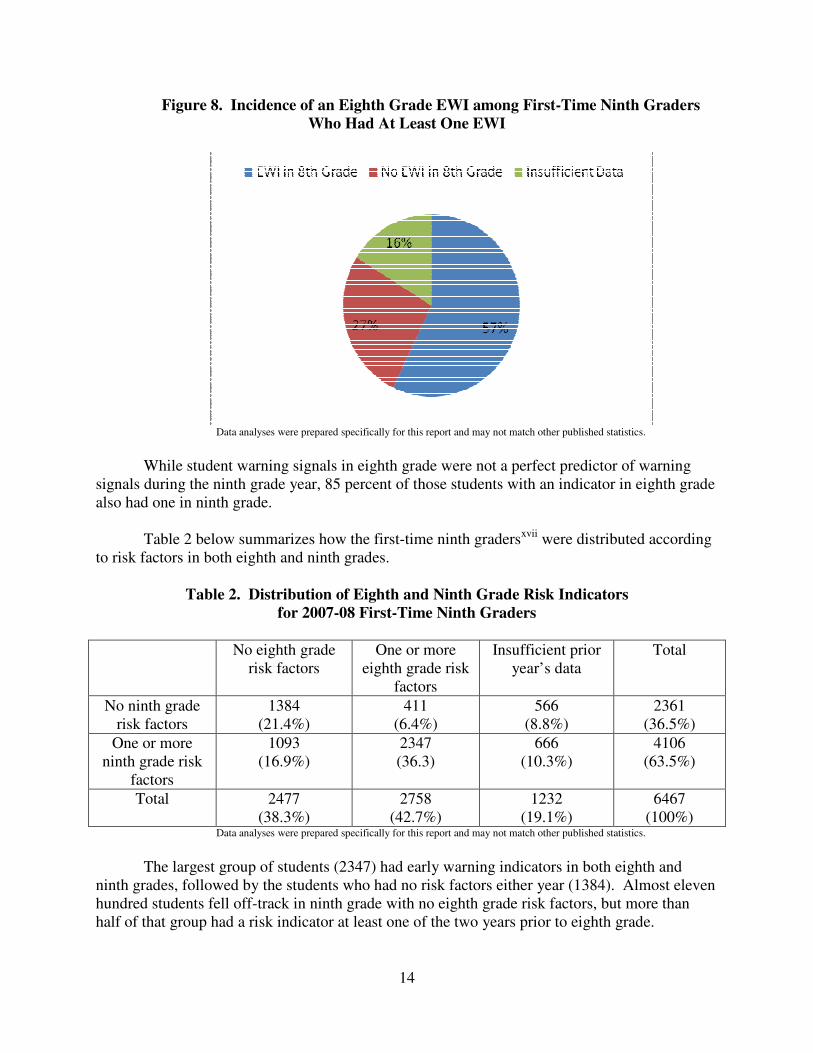
14
Figure 8. Incidence of an Eighth Grade EWI among First-Time Ninth Graders
Who Had At Least One EWI
Data analyses were prepared specifically for this report and may not match other published statistics.
While student warning signals in eighth grade were not a perfect predictor of warning
signals during the ninth grade year, 85 percent of those students with an indicator in eighth grade
also had one in ninth grade.
Table 2 below summarizes how the first-time ninth gradersxvii
were distributed according
to risk factors in both eighth and ninth grades.
Table 2. Distribution of Eighth and Ninth Grade Risk Indicators
for 2007-08 First-Time Ninth Graders
No eighth grade
risk factors
One or more
eighth grade risk
factors
Insufficient prior
year’s data
Total
No ninth grade
risk factors
1384
(21.4%)
411
(6.4%)
566
(8.8%)
2361
(36.5%)
One or more
ninth grade risk
factors
1093
(16.9%)
2347
(36.3)
666
(10.3%)
4106
(63.5%)
Total 2477
(38.3%)
2758
(42.7%)
1232
(19.1%)
6467
(100%) Data analyses were prepared specifically for this report and may not match other published statistics.
The largest group of students (2347) had early warning indicators in both eighth and
ninth grades, followed by the students who had no risk factors either year (1384). Almost eleven
hundred students fell off-track in ninth grade with no eighth grade risk factors, but more than
half of that group had a risk indicator at least one of the two years prior to eighth grade.

15
A small percentage (6.4%) of students (but more than four hundred total) displayed
resiliency, finishing ninth grade with no early warning signs even though they had exhibited an
indicator in eighth grade. Analyses indicated that the proportion (23.1%) of these resilient
students attending newly created high schools (contract or charters schools) was nearly twice the
proportion of all first-time ninth graders attending those schools (12.6%). This suggests it is
important to explore whether practices at these newly created high schools can be credited with
helping students to recover from prior problems. The resilient group had a slightly higher
proportion of females than males (53.3% vs. 46.7%) and slightly lower percentage of special
education students than the ninth grade class overall (13.9% vs. 14.7%).
Warning Signals Before Eighth Grade
Building on previous findings regarding the importance of the sixth grade, the first year
of the middle grades, in analyses of early warning indicators (Balfanz, Herzog, & Mac Iver,
2007), we analyzed to what extent Baltimore students with off-track indicators in ninth grade
could be identified three years earlier, when they were (primarily) in sixth grade. Analyses
indicated that more than half (53.0%) of the 4106 ninth graders with early warning signals in
2007-08 could be identified by an early warning signal in 2004-05. One quarter (22.9%) did not
exhibit any indicators in the sixth grade year, and another quarter had insufficient data available
in 2004-05.
While student warning signals in 2004-05 (primarily sixth grade) were not a perfect
predictor of warning signals during the ninth grade year, eight in ten of those students with an
indicator in 2004-05 also had one in ninth grade. Similarly eight in ten of those students with an
indicator in 2005-06 (primarily seventh grade) also had one in ninth grade.
Predicting Course Failure
Given the prior research findings on the importance of ninth grade course failure as a
determinant of non-graduation outcomes, we explored the factors associated with course failure
through multivariate analyses that took into consideration the fact that students were nested
within non-selective schools (see Appendix B for a more detailed description of these analyses).
The strongest predictor of course failure is absenteeism in ninth grade. Being suspended for at
least three days in ninth grade also has a significant (though weaker) effect on failure. Having an
early warning indicator in eighth grade (chronic absence, suspension, or core course failure) and
eighth grade test scores are also significant predictors of failure, though these relationships are
considerably weaker than the impact of absenteeism. Males still have a significantly higher
failure rate than females even when we control for the fact that they have higher rates of
characteristics related to failure: higher absenteeism in ninth grade, higher rates of early warning
indicators (absences, behavior, and course failure) in eighth grade, lower eighth grade test scores,
and overage status.
While there is wide variation among non-selective schools in the percentage of first-time
ninth grade students failing one or more core courses, most of this variation is explained by
variation in the demographic and prior behavioral characteristics (eighth grade attendance,
behavior, and course performance) of the ninth grade students. That is to say, the differences in
16
failure rate observed between high schools are primarily due to the pre-existing characteristics of
their students. (This is particularly the case for charter schools, whose students have
significantly higher middle school attendance than other non-selective schools.) The small
amount of variance in course failure rates that can be attributed to schools (once student
characteristics are controlled) could be due to particular practices aimed at increasing attendance
and course passing that are implemented at the school level. Further qualitative study of these
outlier schools could be useful for increasing understanding of effective practices.
Conclusions and Policy Implications
The majority of first-time ninth graders in Baltimore City have at least one early warning
indicator of a non-graduation outcome – primarily absenteeism and course failure. Research in
other urban districts has found that while some students go on to recover from problems in ninth
grade and manage to graduate, the majority do not. The district goal of increasing the graduation
rate will require intensive attention particularly to increasing attendance and course passing rates
among ninth graders. Since chronic absenteeism in ninth grade is closely related to chronic
absenteeism in the middle grades, concerted efforts to improve student attendance patterns prior
to high school are also crucial.
The number of students chronically absent in sixth grade has declined notably over the
past several years (Plank, Boccanfuso, & Balfanz, 2010), but one in five middle grades students
still misses more than 20 days of school.1 At present, middle grades schools vary dramatically in
the percentage of students chronically absent, ranging from zero percent to more than 60 percent
(with a mean district-wide of 20 percent of students in grades six to eight absent more than 20
days during 2008-09). Whatever the size of the attendance problem at particular schools, school
leaders need to be equipped with strategies and resources to implement interventions that will be
effective in increasing student attendance.
The district’s Master Plan already includes numerous action steps designed to increase
attendance, as well as additional supports for schools with the highest levels of chronic
absenteeism. District and school leaders are actively seeking to implement strategies that will
lead to improved outcomes. While there is considerable discussion underway of the steps being
taken, it is important for the district to consider a more formal analysis of ongoing efforts to
increase attendance. What is actually being implemented, and to what degree? What are the
barriers to implementing certain strategies and how can they be overcome? What impacts are
various strategies having? What resources are needed to yield a significant increase in student
attendance?
Similarly, while the Master Plan also notes the need to address course failure, it is crucial
to collect systematic data on what schools are actually doing to prevent course failure as well as
to provide credit recovery options for students who need them. This is particularly important
given the significant additional costs associated with credit recovery (for nearly 27,000 core
courses failed at Baltimore City high schools grades 9-12 in a single academic year). While
some course failure is directly linked to students' irregular attendance, other course failure seems
to have different roots. These findings highlight the complexity of designing interventions to
1 This figures and those following are based on analyses conducted specifically for this report from 2008-09 data,
and may differ somewhat from other published statistics.

17
ninth-grade course failure, and remind us that multiple strategies will be needed if all students
are to be supported. BERC is currently planning a study involving analysis of school and
classroom practices associated with higher levels of ninth grade course passing in Baltimore’s
schools.xviii
An additional BERC study of the district’s efforts to increase attendance would
provide useful information for future data-driven decision making.xix
We believe that formal analysis of the current efforts underway to address attendance and
course failure in particular will also help district leaders to understand the need for better
integration of multiple programs and strategies into a more systematic framework for dropout
prevention. Implementation of early warning systems (such as those in Chicago Public
Schoolsxx
) and public health-style tiered prevention models designed to keep students from
falling off-track to graduation (particularly in terms of credits accrued) will be an important step
for increasing the district’s graduation rate (Mac Iver & Mac Iver 2009; Mac Iver, Balfanz, &
Byrnes, 2009). Assessing the effectiveness of current interventions is the next step in the “cycle
of inquiry,” a fundamental practice of a well-functioning school district “learning community”
(Senge, 1990).

18
Appendix A. Coding of Schools
Old Comprehensive
Northwestern High School-401
Patterson High School-405
Forest Park Senior High-406
Frederick Douglass High School-450
Neighborhood Digital Harbor High School-416
W.E.B. Dubois High School-418
Reginald F. Lewis School for Business & Law-419
Dr. Samuel L. Banks High School-420
Thurgood Marshall High School-424
Heritage High School-425
Doris M. Johnson High School-426
Vivien T. Thomas Medical Arts Academy-429
Augusta Fells Savage Institute for Visual Arts-430
Maritime Academy-431
Homeland Security High School-434
Business and Entrepreneurship Academy -435
Liberal Arts Academy-436
Innovation - Contract New Era Academy-422
Baltimore Freedom Academy-423
Academy for College and Career Exploration High School-427
Baltimore Talent Development High School-428
Renaissance Academy-433
Innovation - Charter Coppin Academy-432
ConneXions Leadership Academy - 325
Md Academy of Tech and Health Sciences - 331
Independence School Local 1 - 333
Vocational (with Entrance Criteria) Edmondson Westside High School-400
Mergenthaler Vocational Technical High-410
The National Academy Foundation HS-421
Carver Vocational Technical High-454
College Prep (with Entrance Criteria) Baltimore Polytechnic Institute-403
Western High School-407
The New Paul L Dunbar High School-414
Baltimore City College High School-480
Baltimore School for the Arts - 415

19
Special Ed Central Career Academy At Briscoe-451
George McMechen - 177
Claremont School – 307
Upton School - 301
William S. Baer - 303
Alternative Francis M. Wood - 178
Harbor City High School-413
Laurence G. Paquin Middle/High-457
Alternative Learning Center -488
Baltimore City Detention Center - 884
20
Appendix B
To understand the factors associated with ninth grade course failure, we conducted
analyses using two-level hierarchical linear modeling (HLM) to take account of the fact that
students were nested within schools.2 Given the significantly different student populations in
different types of schools, we focused on just the non-selective schools (excluding vocational
and college preparatory schools with entrance criteria as well as alternative and special education
schools). In addition, only students with data from the prior year (2006-07) were included. The
sample was thus comprised of 2985 students from 26 non-selective schools (large
comprehensive, small neighborhood, contract, and charter schools).
The dependent variable in analyses was number of ninth grade failures in core courses,
ranging from zero to four or more. Student-level predictive variables included ninth grade
attendance (percentage of days attended), suspension for three or more days in ninth grade
(coded 1 if yes, 0 if no), having at least one early warning indicator (chronic absenteeism,
suspension of three or more days, course failure in math or language arts) in eighth grade the
prior year (coded 1 if yes, 0 if no), scale score on the eighth grade mathematics MSA, gender
(coded 1 for male, 0 for female), and overage status (coded 1 if yes, 0 if no). Preliminary
analyses indicated that special education status was not significant once test scores were
controlled. We also did not include ethnicity or free lunch status3 because of low levels of
variation on these variables.
During preliminary analyses, the following potential school-level predictive variables
were considered for inclusion by testing whether a model containing that variable alone was a
significant improvement over the null model: Whether the school was district-operated (coded 1)
or was operated by one of the district’s external partners as a contract or charter school (coded
0); the school’s student attendance rate; the percentage of special education students in the
school; the school’s ninth-grade enrollment; the school’s total enrollment; and the school’s
percentage of conditionally certified teachers. Only two of the school-level predictors were
significant predictors of the mean number of core courses failed by ninth graders in that school:
whether the school was district operated or not and the school’s attendance rate. The mean
number of courses failed by ninth-graders was two-thirds of a course higher in district-operated
than in partner-operated schools. An increase of ten percentage points in a school’s attendance
rate (e.g., from 83% ADA to 93% ADA) was associated with a two-fifths of a course decrease in
the average number of courses failed. These two school-level predictors, however, lost their
predictive power in subsequent models that included the full set of student-level predictors of
interest. In other words, knowing whether a school is district- or partner-operated and its
attendance rate did not explain any variation in the number of courses failed beyond what could
2 Students were coded according to their final school. A total of 311 students within this sample
attended more than one school during 2007-08. 3 Since analyses indicate that Baltimore students who have previously been eligible for
free/reduced price lunch frequently are not classified as eligible during high school, we
constructed a free lunch status variable using data over time. In non-selective schools there was
little variability of interest in this variable.

21
be explained by a model that included only information on student-specific predictors and risk
indicators.
Table B1 summarizes the series of models estimated to explain the variation in ninth
grade failure, compared to the null model. Model 1 included only the impact of prior student-
specific variables (gender, overage status, eighth grade test score, and eighth grade early warning
indicator) on ninth grade failure. This model represented a 21% reduction in variance compared
to the null model. Among these prior predictors, having an eighth grade early warning indicator
(chronic absenteeism, suspension or core course failure) was the strongest. But gender and
overage status were still significant predictors, even controlling for eighth grade test score and
warning indicators.
Model 2 adds two ninth grade student-level measures to the prior student characteristics:
ninth grade attendance and whether or not the student was suspended for at least three days
during ninth grade. As the comparable effect size statistics indicate, ninth grade attendance is by
far the strongest predictor of ninth grade failure. But the other variables, including gender and
overage status, remain significant predictors of failure, even when attendance is controlled.
Model 3 expands Model 2 to add the school level variable indicating whether or not the student’s
ninth grade school was district-operated. Model 4 expands Model 2 to add the school level
variable, attendance rate. Neither Model 3 nor Model 4 are significant improvements over the
Model 2.
This series of models indicates that while ninth grade attendance explains the largest
proportion of variation in ninth grade failure, other prior student characteristics and behaviors are
still significantly related to failure. Once these are controlled, the effects of school operator and
school attendance rate are not significant. At the same time, as the presentation of variance
components in Table B1 indicates, ninth grade failure varied significantly between schools, even
controlling for student level variables. For example, in Model 2 a total of 14 percent of the
unexplained variation in number of courses failed is found between schools (86 percent is
between students). This suggests that there could be other school-level practices or
characteristics that are affecting student course failure. In a future BERC qualitative study in
Baltimore, we plan to explore these potential effects more fully.

22
Table B1. Estimated Fixed Effects, Effect Sizes, and Variance Components for Models
of the Predictors of the Number of Ninth Grade Courses Failed
Parameter Null
Model
Model 1 Model 2 Model 3 Model 4
Fixed Effect Coefficient
(SE)
Coefficient
(SE)
Effect
Size
Coefficient
(SE)
Effect
Size
Coefficient
(SE)
Effect Size Coefficient
(SE)
Effect
Size
Intercept 1.60 (0.11) 1.63 (0.10) 1.65 (0.09) 1.65 (0.09) 1.66 (0.09)
Level 1 –
Student-specific
predictors/risk
indicators
Percentage of
days attended in
9th Grade
-0.05
(0.00)
Stand.
Coef. =
-0.50
-0.05
(0.00)
Stand.Coef.
=
-0.50
-0.05
(0.00)
Stand.
Coef. = -
0.50
Student was
suspended 3 or
more days in 9th
Grade
0.40 (0.07) Cohen’s
d = 0.24
0.40 (0.07) Cohen’s d
= 0.24
0.40 (0.07) Cohen’s
d = 0.24
Student displayed
an “early warning
indicator” in 8th
grade
0.84 (0.06) Cohen’s
d = .51
0.37 (0.04) Cohen’s
d = 0.23
0.37 (0.04) Cohen’s d
= 0.23
0.37 (0.04) Cohen’s
d = 0.23
Student is male 0.38 (0.09) Cohen’s
d =
0.23
0.33 (0.07) Cohen’s
d = 0.20
0.33 (0.07) Cohen’s d
= 0.20
0.33 (0.07) Cohen’s
d = 0.20
Math
performance on
the 8th grade
MSA
-0.02
(0.00)
Stand.
Coef. =
-0.25
-0.01
(0.00)
Stand.
Coef. =
-0.19
-0.01
(0.00)
Stand.
Coef. =
-0.19
-0.01
(0.00)
Stand.
Coef. = -
0.19
Student is
overage
0.33 (0.07) Cohen’s
d =
0.20
0.19 (0.06) Cohen’s
d = 0.12
0.19 (0.06) Cohen’s d
=0.12
0.19 (0.06) Cohen’s
d = 0.12
Level 2 – School-
specific
predictors
School is district-
operated
0.05 (0.22) Cohen’s d
= 0.03
School’s student
attendance rate
0.01 (0.01) Stand.
Coef. =
0.06
Random Effect Variance
Component
Variance
Component
Variance
Component
Variance
Component
Variance
Component
Intercept, U0 0.29*** 0.24*** 0.22*** 0.23*** 0.22***
Level 1, r 2.47 1.95 1.37 1.37 1.37
Proportional
reduction in error
(versus null
model)
-- 0.21 0.42 0.42 0.42
Analyses include first-time ninth graders in non-selective schools, 2007-08. The dependent
variable, number of course failures, ranges from zero to four or more. Results using
dichotomous failure variables in binary logistic regression HLM analyses (no courses versus one
or more courses failed; one or fewer versus two or more courses failed) produced virtually the
same results.

23
Endnotes
i A Baltimore City ninth grade cohort study similar to research conducted in other districts is currently being
conducted by the lead author of this study, with funding from the Council of the Great City Schools. Preliminary
results indicate that the ninth grade risk factors identified in other districts (particularly attendance and course
failure) are also significant predictors of student graduation outcomes in Baltimore.
ii While some may view course grades as cognitive indicators, we view passing high school courses as primarily a
result of student behaviors influenced by motivation. Required student behaviors can be categorized roughly as: 1)
attendance, 2) paying attention, 3) completion of class work, 4) completion of homework, 5) studying. A
qualitative study focused on the relationship between student motivation and effort, classroom practices, and course
failure is planned as part of the BERC research agenda.
iii
A Baltimore City ninth grade cohort study similar to research conducted in other districts is currently being
conducted by the lead author of this study, with funding from the Council of the Great City Schools. Preliminary
results indicate that the ninth grade risk factors identified in other districts (particularly attendance and course
failure) are also significant predictors of student graduation outcomes in Baltimore.
iv
We are in the process of obtaining access to the full course history files, and will update this report after analyses
with those data are completed.
v Most of these students (200) were repeating ninth graders, and only a handful (7) were new to the district. It is
important to note that among repeat ninth graders, 59% of these pre-October withdrawals had dropout codes, and an
additional 7.5% had a transfer to juvenile justice system. Among first-time ninth graders, 23.1% of these
withdrawals were dropouts.
vi
Six of those schools had fewer than 30 first-time ninth graders. Students were coded according to their final
school on record. A total of just 8.6% (571 students) attended more than one school in 2007-08 (had more than one
administrative record). Most of these attended two schools; fewer than 1% attended three or more schools. Three-
quarters of the students who attended more than one school were concentrated in the comprehensive or
neighborhood schools as their final school, and most of the rest were in alternative schools.
vii
Date of birth data (month and year) were available for 89.2 percent of the first-time ninth graders, and when we
also used grade level data from prior years indicating retention in grade, it was possible to calculate “overage for
grade” status for 90.6 percent of cases. With missing cases included, there were 30.9% overage for grade students,
and 9.4% with missing data.
viii
Percentage of students missing more than 20 days is routinely reported by the Maryland State Department of
Education, though MSDE reports are restricted to only those students attending a particular school for more than 90
days.
ix
Most of the 720 students missing course data had withdrawal codes from the district, and 208 of these had dropout
codes. Of the 156 students missing data who had not withdrawn from the system, 59.6% were designated as special
education. Of the remaining 63 non-special education students who were missing course data, the majority (41
students) were from either School 403 (Polytechnic) or School 884 (Baltimore Detention Center).
x While almost all students at selective schools and some other schools had just four course marks (and most
students at Baltimore School for the Arts (BSFA) had just three marks), most students at the comprehensive schools
had five or six course marks, having more than one course in a core subject (often an extra course designed to build
essential skills). Since students had different numbers of course marks, we created a course failure scale ending in
“failed four or more core courses.” Since no student at BSFA failed more than two courses, this scale appears to be
justified even for those few students who had the opportunity to fail only three courses.

24
xi
Students in schools without entrance criteria tended to have at least one and sometimes two additional courses in
the four core subject areas, for a total of four or five. Among all high school students in grades 9-12, the total
number of failed course credits requiring recovery was 26,869 among the first six core courses taken by each student
in 2007-08. There were probably more failed courses among the other non-core subjects as well. Further analyses
will be conducted when full course files become available. xii
Of the students with missing data on course grades for 2006-07, half (50.5%, 817 students) were enrolled in the
district but grades were not recorded in the files. Many of these were concentrated in certain schools.
xiii
Here we follow Balfanz, Herzog, and Mac Iver (2007) rather than Plank, Boccanfuso, & Balfanz (2010),
leaving overage for grade status out of the EWI scale. Students who were missing grade data were excluded when
calculating this EWI scale, but those with evidence of chronic absenteeism or suspension were included in the
calculation of “at least one EWI.”
xiv
Selection of math or reading/language arts course failure is based on findings from Balfanz, Herzog, & Mac Iver,
2007.
xv
A quarter of first-time ninth graders did not have complete eighth grade data, either because they were not
enrolled in the district (816 students) or course grade data were missing for enrolled students (817 students). While
attendance and suspension data were available for all enrolled students, course grade data were available for 87.7%
of enrolled students. Missing data were somewhat concentrated in particular schools, and so not randomly
distributed. Analyses of missing data will be incorporated into the final version of this report.
xvi
Students enrolled in the district in 2006-07 who had no warning indicator for attendance or suspensions, but who
were missing course grades, were coded as “insufficient prior data.” Those missing course grades but who had
another warning indicator were included with “at least one indicator.”
xvii
Ninth graders with missing course grade data who had no other warning signals were excluded from this table of
percentages.
xviii
A proposal to the W. T. Grant Foundation is currently under consideration to fund a study approved by the
BERC Executive Committee.
xix
See Mac Iver & Farley-Ripple, 2009.
xx
Gewertz, 2009.

25
References
Allensworth, E., & Easton, J. (2007). What matters for staying on-track and graduating in
Chicago public high schools. Chicago: Consortium on Chicago School Research.
Balfanz, R., Herzog, L. & Mac Iver, D.J. (2007). Preventing student disengagement and
keeping students on the graduation path in urban middle-grades schools: Early
identification and effective interventions. Educational Psychologist, 42, 4, 223-235.
Balfanz, R., Durham, R., & Plank, S. (2008). Lost days: Patterns and levels of chronic
absenteeism among Baltimore City public school students 1999-00 to 2005-06. Research
Report. Baltimore, MD: Johns Hopkins University. Retrieved May 21, 2009 from
http://www.baltimore-berc.org/pdfs/Attendance_issue_brief_FINAL_JULY%202008.pdf
DeClements, B. (1993). How do you lose those ninth grade blues? New York: Puffin.
Dynarski, M. & Gleason, P. (2002). How can we help? What we have learned from recent
federal dropout prevention evaluations. Journal of Education for Students Placed at Risk,
7, 43-69.
Fredricks, J. A., Blumenfeld, P. C., & Paris, A. H. (2004). School engagement: Potential of the
concept, state of the evidence. Review of Educational Research, 74, 59-109.
Gewertz, C. (2009, March 11). 9th
grade, by the numbers. Education Week. Retrieved May 19,
2009, from
http://www.edweek.org/login.html?source=http://www.edweek.org/ew/articles/2009/03/1
1/24tracking_ep.h28.html&destination=http://www.edweek.org/ew/articles/2009/03/11/2
4tracking_ep.h28.html&levelId=1000
Gleason, P. & Dynarski, M. (2002). Do we know whom to serve? Issues in using risk factors to
identify dropouts. Journal of Education for Students Placed at Risk, 7, 25-41.
Kaplan, D., Peck, B. M. & Kaplan, H. B. (1997). Decomposing the academic failure-dropout
relationship: A longitudinal analysis. Journal of Educational Research 90(6), 331-343.
Mac Iver, M., Plank, S.B., Durham, R., Farley-Ripple, E., & Balfanz, R. (2008). The challenge
of on-time arrival: The seven-year flight paths of Baltimore’s sixth graders of 1999-
2000. Research Report. Baltimore, MD: Johns Hopkins University. Retrieved May 21,
2009, from http://www.baltimore-berc.org/pdfs/SIXTH%20pathways5-13-08.pdf
Mac Iver, M.A. & Farley-Ripple, E. (2009). Data-driven decision making requires more than
just achievement data: Measuring and analyzing the factors that influence achievement.
26
Presentation at the 2009 American Association of School Administrators National
Conference on Education, San Francisco, CA. Retrieved May 21, 2009, from
http://www.every1graduates.org/PDFs/MacIverAASA2009presentation.pdf
Mac Iver, M., Balfanz, R., & Byrnes, V. (2009). Advancing the ‘Colorado Graduates’ agenda:
Understanding the dropout problem and mobilizing to meet the graduation challenge.
Denver, CO: Colorado Children’s Campaign.
Mac Iver, M. A. & Mac Iver, D. J. (2009). Beyond the indicators: An integrated school-level
approach to dropout prevention. Arlington, VA: The Mid-Atlantic Equity Center, The
George Washington University Center for Equity and Excellence in Education.
Neild, R. C., & Balfanz, R. (2006a). An extreme degree of difficulty: The educational
demographics of urban neighborhood high schools. Journal of Education for Students
Placed at Risk, 11, 131-141.
Neild, R. C. & Balfanz, R. (2006b). Unfulfilled promise: The dimensions and characteristics of
Philadelphia’s dropout crisis, 2000-2005. Philadelphia, PA: Philadelphia Youth
Transitions Collaborative.
Neild, R. C., Stoner-Eby, S., & Furstenberg, F. F. (2008). Connecting entrance and departure:
The transition to ninth grade and high school dropout. Education and Urban Society, 40,
543-569.
Neild, R.C. (2009a). Falling off track during the transition to high school: What we know and
what can be done. The Future of Children, 19, 53-76.
Plank, S., Boccanfuso, C., & Balfanz, R. (2010). Destination Graduation: Lessons learned
about early warning indicators in two sixth grade cohorts in Baltimore City Schools.
Baltimore, MD: Baltimore Education Research Consortium.
Roderick, M., & Camburn, E. (1999). Risk and recovery from course failure in the early years of
high school. American Educational Research Journal, 36, 303–344.
Senge, P. (1990). The fifth discipline: The art and practice of the learning organization. New
York: Doubleday.
Wehlage, G., Rutter, R., Smith, G., Lesko, N., & Fernandez, R. (1989). Reducing the risk:
Schools as communities of support. New York: Falmer Press.