Embed Size (px)
Citation preview
Colliers International | Kansas City colliersmultifamilyeast.com
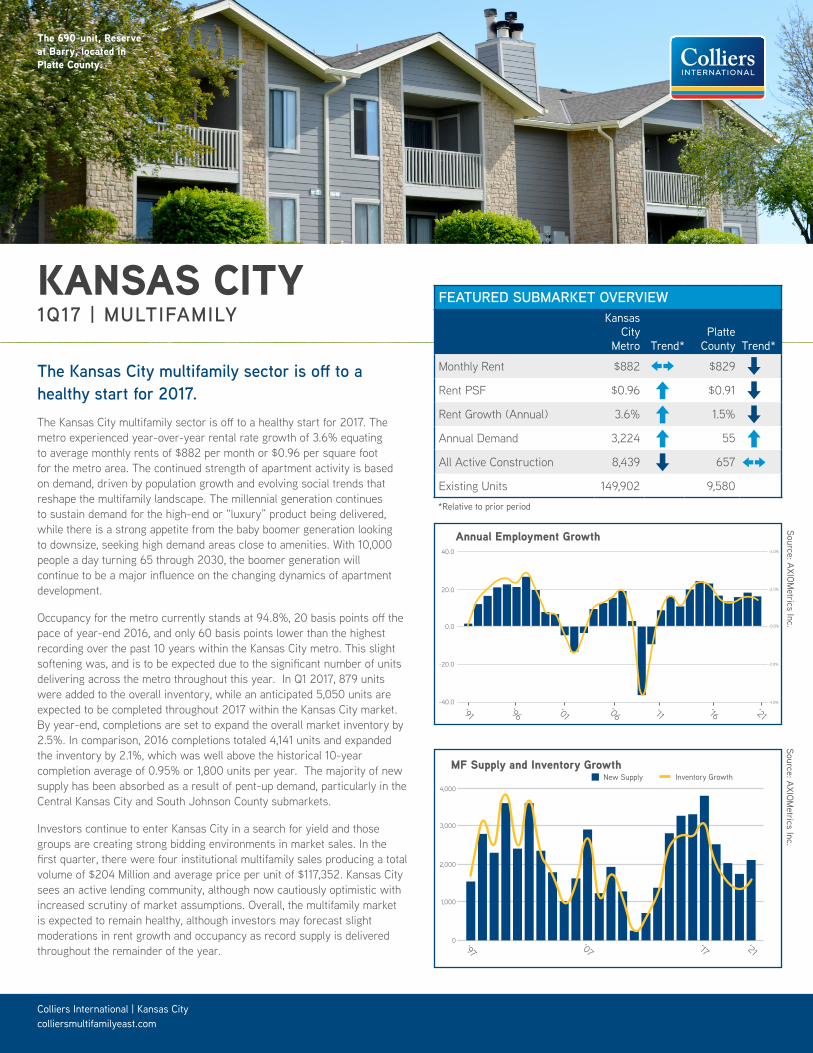
KANSAS CITY1Q17 | MULTIFAMILY
The Kansas City multifamily sector is off to a healthy start for 2017.The Kansas City multifamily sector is off to a healthy start for 2017. The metro experienced year-over-year rental rate growth of 3.6% equating to average monthly rents of $882 per month or $0.96 per square foot for the metro area. The continued strength of apartment activity is based on demand, driven by population growth and evolving social trends that reshape the multifamily landscape. The millennial generation continues to sustain demand for the high-end or “luxury” product being delivered, while there is a strong appetite from the baby boomer generation looking to downsize, seeking high demand areas close to amenities. With 10,000 people a day turning 65 through 2030, the boomer generation will continue to be a major influence on the changing dynamics of apartment development.
Occupancy for the metro currently stands at 94.8%, 20 basis points off the pace of year-end 2016, and only 60 basis points lower than the highest recording over the past 10 years within the Kansas City metro. This slight softening was, and is to be expected due to the significant number of units delivering across the metro throughout this year. In Q1 2017, 879 units were added to the overall inventory, while an anticipated 5,050 units are expected to be completed throughout 2017 within the Kansas City market. By year-end, completions are set to expand the overall market inventory by 2.5%. In comparison, 2016 completions totaled 4,141 units and expanded the inventory by 2.1%, which was well above the historical 10-year completion average of 0.95% or 1,800 units per year. The majority of new supply has been absorbed as a result of pent-up demand, particularly in the Central Kansas City and South Johnson County submarkets.
Investors continue to enter Kansas City in a search for yield and those groups are creating strong bidding environments in market sales. In the first quarter, there were four institutional multifamily sales producing a total volume of $204 Million and average price per unit of $117,352. Kansas City sees an active lending community, although now cautiously optimistic with increased scrutiny of market assumptions. Overall, the multifamily market is expected to remain healthy, although investors may forecast slight moderations in rent growth and occupancy as record supply is delivered throughout the remainder of the year.
FEATURED SUBMARKET OVERVIEWKansas
City Metro Trend*
Platte County Trend*
Monthly Rent $882 $829
Rent PSF $0.96 $0.91
Rent Growth (Annual) 3.6% 1.5%
Annual Demand 3,224 55
All Active Construction 8,439 657
Existing Units 149,902 9,580
The 690-unit, Reserve at Barry, located in Platte County.
Source: AXIOMetrics Inc.
Source: AXIOMetrics Inc.
*Relative to prior period
-40.0
0
1,000
2,000
3,000
4,000
Annual Employment Growth
New Supply Inventory GrowthMF Supply and Inventory Growth
-4.0%
-20.0
0.0
20.0
40.0
-2.0%
-0.0%
-2.0%
-4.0%
‘91
‘97‘07 ‘17 ‘21
‘96 ‘01 ‘06 ‘11 ‘16 ‘21
Colliers International | Kansas Citycolliersmultifamilyeast.com
SOUTHOVERLAND
PARK
CENTRAL KANSAS
CITY
SOUTHKANSAS CITY/GRANDVIEW
LEE’S SUMMIT/BLUE SPRINGS/
RAYTOWN
CLAY COUNTY
WYANDOTTE COUNTY/LEAVENWORTH
NORTH OVERLAND
PARK
Sherman Army Airfield Clay
CountyRegional Airfield
RichardsGebaurAirport
Kansas CityInternational
Airport
DowntownAirport
KANSAS CITY, KANSAS
SHAWNEE
OVERLANDPARK
STANLEYGRANDVIEW
BELTON
PECULIAR
RAYMORE
LEE’S SUMMIT
RAYTOWN
BLUE SPRINGS
INDEPENDENCE
LIBERTY
CLAYCOMO
GLADSTONE
KANSAS CITY
PLATTE CITY
KEARNEY
EXCELSIORSPRINGS
NORTHKANSAS CITY
KANSAS CITY
GREENWOOD
LENEXA
Kansas City MetroOffice Submarkets
Colliers International4520 Main Street, Suite 1000Kansas City, Missouri 64111www.colliers.com
PLATTE COUNTY
SHAWNEE/LENEXA/MISSION
INDEPENDENCE/EAST KANSAS CITY
OLATHE/GARDNER
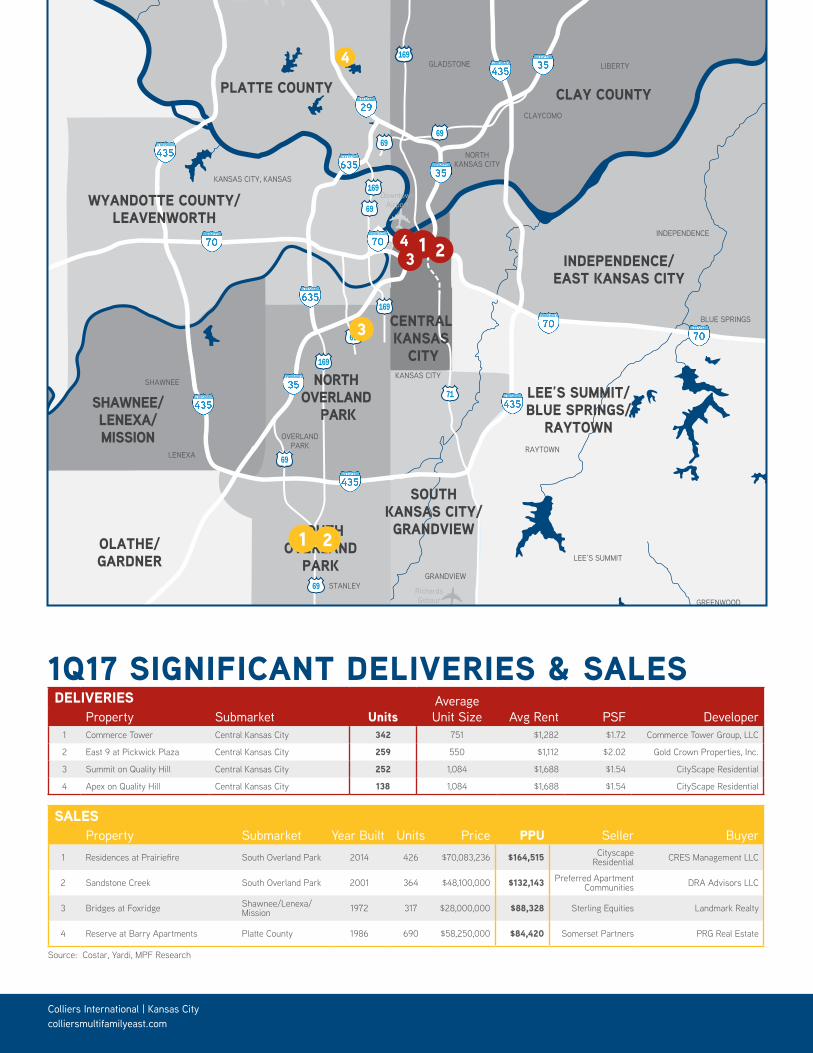
1 243
1 2
3
4
DELIVERIES Average Unit Size Property Submarket Units Avg Rent PSF Developer
1 Commerce Tower Central Kansas City 342 751 $1,282 $1.72 Commerce Tower Group, LLC
2 East 9 at Pickwick Plaza Central Kansas City 259 550 $1,112 $2.02 Gold Crown Properties, Inc.
3 Summit on Quality Hill Central Kansas City 252 1,084 $1,688 $1.54 CityScape Residential
4 Apex on Quality Hill Central Kansas City 138 1,084 $1,688 $1.54 CityScape Residential
1Q17 SIGNIFICANT DELIVERIES & SALES
Source: Costar, Yardi, MPF Research
SALESYear Built PPU Property Submarket Units Price Seller Buyer
1 Residences at Prairiefire South Overland Park 2014 426 $70,083,236 $164,515 Cityscape Residential CRES Management LLC
2 Sandstone Creek South Overland Park 2001 364 $48,100,000 $132,143 Preferred Apartment Communities DRA Advisors LLC
3 Bridges at Foxridge Shawnee/Lenexa/Mission 1972 317 $28,000,000 $88,328 Sterling Equities Landmark Realty
4 Reserve at Barry Apartments Platte County 1986 690 $58,250,000 $84,420 Somerset Partners PRG Real Estate
Colliers International | Kansas City
Martin Maguire cprcSenior Research Director | Kansas City
+1 816 556 [email protected]
Colliers International | Kansas City | 4520 Main Street, Suite 1000, Kansas City, Missouri 64111 | +1 816 531 5303 | colliers.com
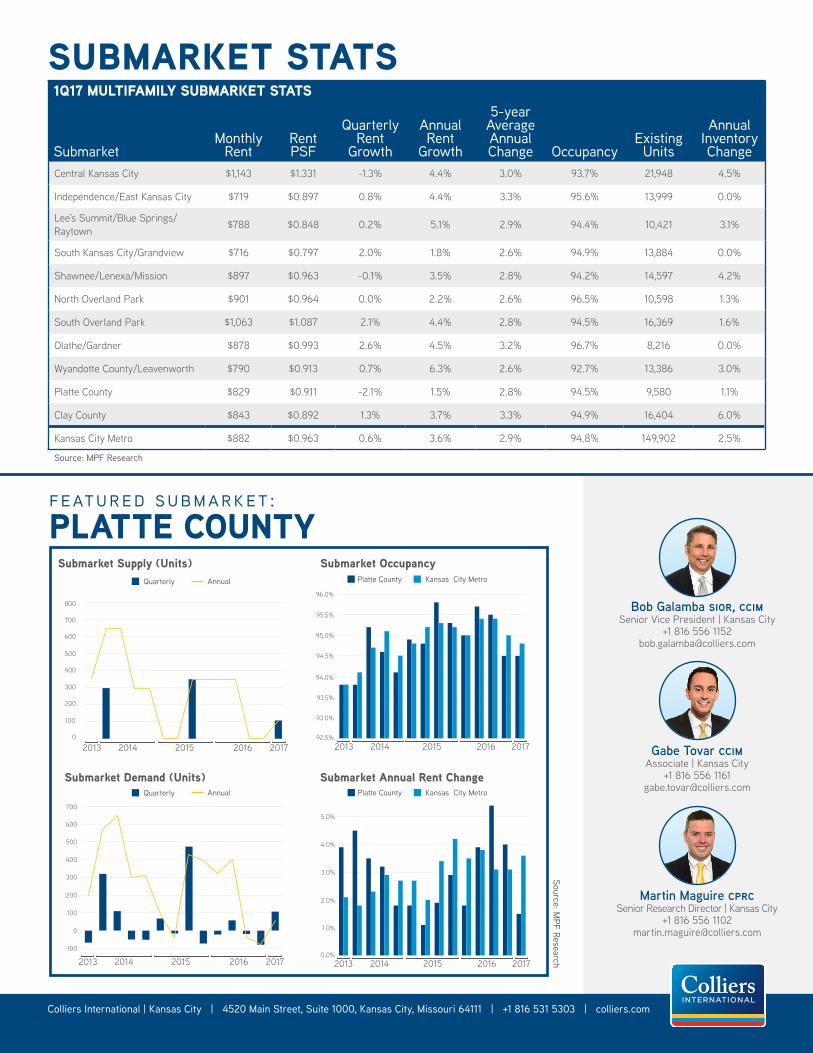
SUBMARKET STATS1Q17 MULTIFAMILY SUBMARKET STATS
SubmarketMonthly
RentRent PSF
Quarterly Rent
Growth
Annual Rent
Growth
5-year Average Annual Change Occupancy
Existing Units
Annual Inventory Change
Central Kansas City $1,143 $1.331 -1.3% 4.4% 3.0% 93.7% 21,948 4.5%
Independence/East Kansas City $719 $0.897 0.8% 4.4% 3.3% 95.6% 13,999 0.0%
Lee's Summit/Blue Springs/Raytown $788 $0.848 0.2% 5.1% 2.9% 94.4% 10,421 3.1%
South Kansas City/Grandview $716 $0.797 2.0% 1.8% 2.6% 94.9% 13,884 0.0%
Shawnee/Lenexa/Mission $897 $0.963 -0.1% 3.5% 2.8% 94.2% 14,597 4.2%
North Overland Park $901 $0.964 0.0% 2.2% 2.6% 96.5% 10,598 1.3%
South Overland Park $1,063 $1.087 2.1% 4.4% 2.8% 94.5% 16,369 1.6%
Olathe/Gardner $878 $0.993 2.6% 4.5% 3.2% 96.7% 8,216 0.0%
Wyandotte County/Leavenworth $790 $0.913 0.7% 6.3% 2.6% 92.7% 13,386 3.0%
Platte County $829 $0.911 -2.1% 1.5% 2.8% 94.5% 9,580 1.1%
Clay County $843 $0.892 1.3% 3.7% 3.3% 94.9% 16,404 6.0%
Kansas City Metro $882 $0.963 0.6% 3.6% 2.9% 94.8% 149,902 2.5%
Gabe Tovar ccimAssociate | Kansas City
+1 816 556 [email protected]
Bob Galamba sior, ccimSenior Vice President | Kansas City
+1 816 556 [email protected]
featured submarket:PLATTE COUNTY
Source: MPF Research
Submarket Supply (Units)
0
100
200
300
Quarterly Annual
Submarket Annual Rent Change
0.0%
1.0%
2.0%
3.0%
4.0%
92.5%
93.0%
93.5%
94.0%
94.5%
95.0%
95.5%
96.0%
Platte County
Submarket OccupancyKansas City Metro
Submarket Demand (Units)
400
300
200
100
0
-100
400
500
600
700
800
500
600
7005.0%
0
100
200
300
400
500
600
700
800
900
1,000
2013 Q4 2014 Q1 2014 Q2 2014 Q3 2014 Q4 2015 Q1 2015 Q2 2015 Q3 2015 Q4 2016 Q1 2016 Q2 2016 Q3 2016 Q4 2017 Q1
Source: MPF Research
Platte County Supply (Units)
Quarterly Annual
2014 2015 2016 2017201392.5%
93.0%
93.5%
94.0%
94.5%
95.0%
95.5%
96.0%
2013 Q4 2014 Q1 2014 Q2 2014 Q3 2014 Q4 2015 Q1 2015 Q2 2015 Q3 2015 Q4 2016 Q1 2016 Q2 2016 Q3 2016 Q4 2017 Q1Source: MPF Research
Submarket Occupancy
Platte County Kansas City Metro
2014 2015 2016 20172013
-300
-200
-100
0
100
200
300
400
500
600
700
2013 Q4 2014 Q1 2014 Q2 2014 Q3 2014 Q4 2015 Q1 2015 Q2 2015 Q3 2015 Q4 2016 Q1 2016 Q2 2016 Q3 2016 Q4 2017 Q1
Source: MPF Research
Platte County Demand (Units)
Quarterly Annual
2014 2015 2016 20172013
Quarterly Annual
0.0%
1.0%
2.0%
3.0%
4.0%
5.0%
6.0%
2013 Q4 2014 Q1 2014 Q2 2014 Q3 2014 Q4 2015 Q1 2015 Q2 2015 Q3 2015 Q4 2016 Q1 2016 Q2 2016 Q3 2016 Q4 2017 Q1Source: MPF Research
Submarket Annual Rent Change
Platte County Kansas City MetroPlatte County Kansas City Metro
2014 2015 2016 20172013
Source: MPF Research