Embed Size (px)
Citation preview
Colliers International | Kansas City colliersmultifamilyeast.com
KANSAS CITY2Q17 | MULTIFAMILY
Key Takeaways > The Kansas City multifamily market remains very healthy with a current
overall occupancy rate of 94.8%. Strong demand has held the metro’s occupy rate close to the Q3 2016 all-time high of 95.5% even with a recent influx of apartment deliveries.
> Kansas City’s overall occupy rate has remained above 94% for 14 consecutive quarters.
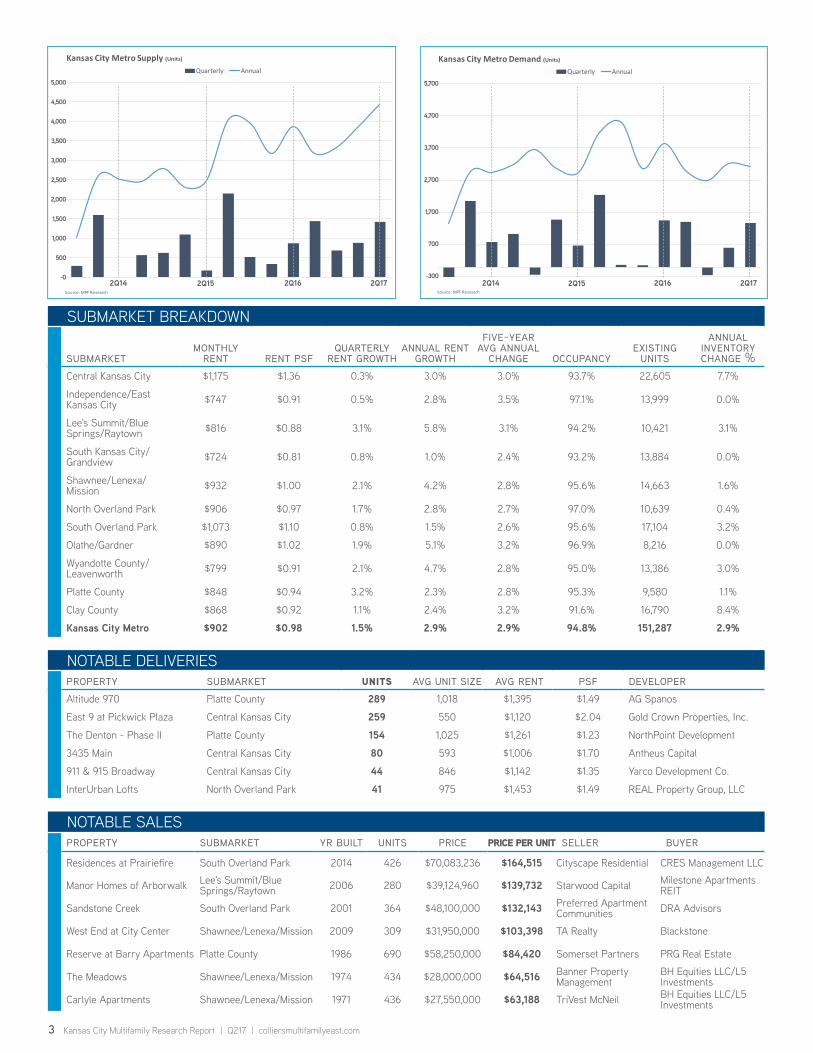
> Multifamily demand in the Kansas City market continues to be nothing short of impressive. Total inventory reached 151,287 units at the end of Q2 2017, while another 5,749 units are under active construction, which is higher than the five-year average annual supply of 2,454 units.
> Effective rents have increased as a result of elevated demand levels. Average monthly rental rates increased to $902 per unit. The average rate per square foot rose to $0.98 at the close of the Q2, which represented a 1.5% quarterly increase.
> Annual rent growth was 2.9% for Q2 2017, which is in line with the past five years measuring between 1.8% and 4.2%. Rental rates increased 1.5% during Q2 2017.
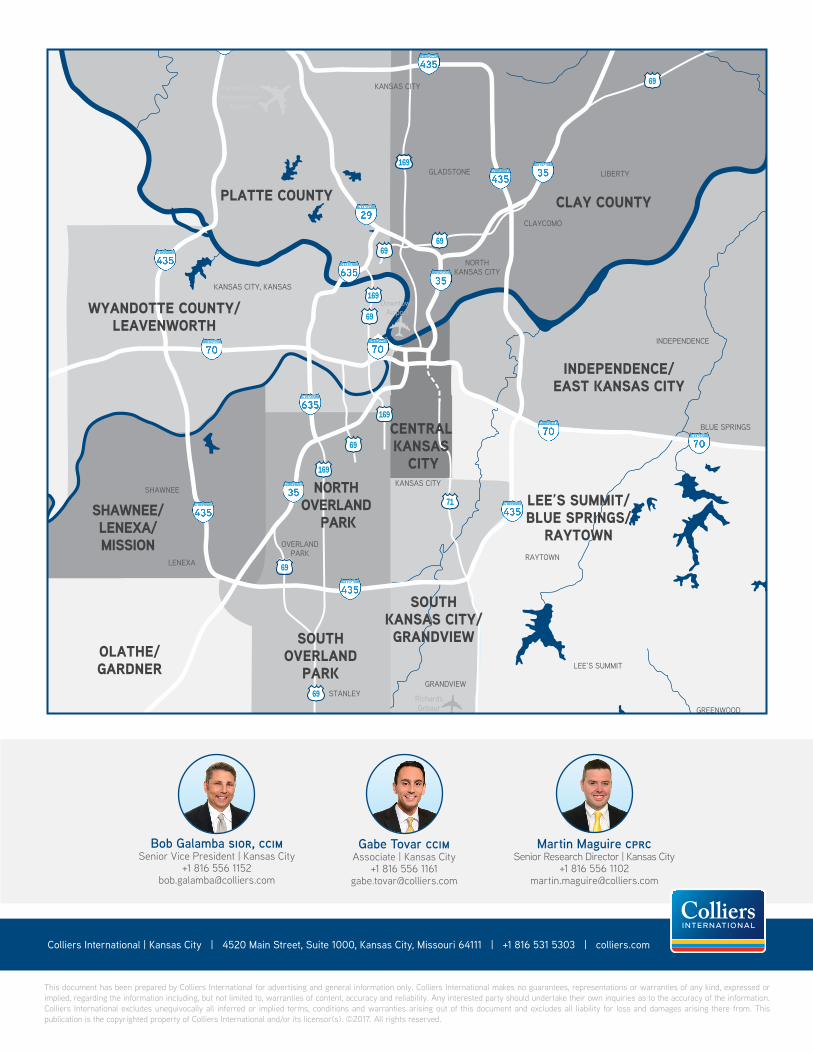
> Apartment construction continues across all portions of the metro, however, there remains a heavy concentration in the Central Kansas City and South Johnson County submarkets.
> In Q2 2017, 870 units were added to the overall inventory, while an anticipated 4,950 units are expected to be completed throughout 2017 within the Kansas City market. By year-end, completions are set to expand the overall market inventory by 2.7%.
> Job growth is spurring demand for apartments in well sought out locations. Demand remains on pace with the new supply that has been brought to market during the first half of 2017.
MARKET INDICATORSRelative to prior period
Kansas City2Q16
Kansas City2Q17
occupancy
effective rents
construction
deliveries
SUMMARY STATISTICS2Q17
Kansas City Market
total inventory (units) 151,287
vacancy rate 5.2%
total occupancy rate 94.8%
units under construction 5,749
unit deliveries in 2Q17 870
EFFECTIVE RENTSPer Unit Per Month
Kansas City Metro
average per unit $902
rent psf $0.98
rent growth (annual) 2.9%
93.0%
93.5%
94.0%
94.5%
95.0%
95.5%
96.0%
2013 Q4 2014 Q1 2014 Q2 2014 Q3 2014 Q4 2015 Q1 2015 Q2 2015 Q3 2015 Q4 2016 Q1 2016 Q2 2016 Q3 2016 Q4 2017 Q1 2017 Q2Source: MPF Research
Kansas City Metro Occupancy
0.0%
1.0%
2.0%
3.0%
4.0%
5.0%
6.0%
7.0%
4Q2011
1Q2012
2Q2012
3Q2012
4Q2012
1Q2013
2Q2013
3Q2013
4Q2013
1Q2014
2Q2014
3Q2014
4Q2014
1Q2015
2Q2015
3Q2015
4Q2015
1Q2016
2Q2016
3Q2016
4Q2016
1Q2017
2Q2017
Source: MPF Research
Annual Rent Change ComparisonUnited States Midwest Kansas City
Rental Rates
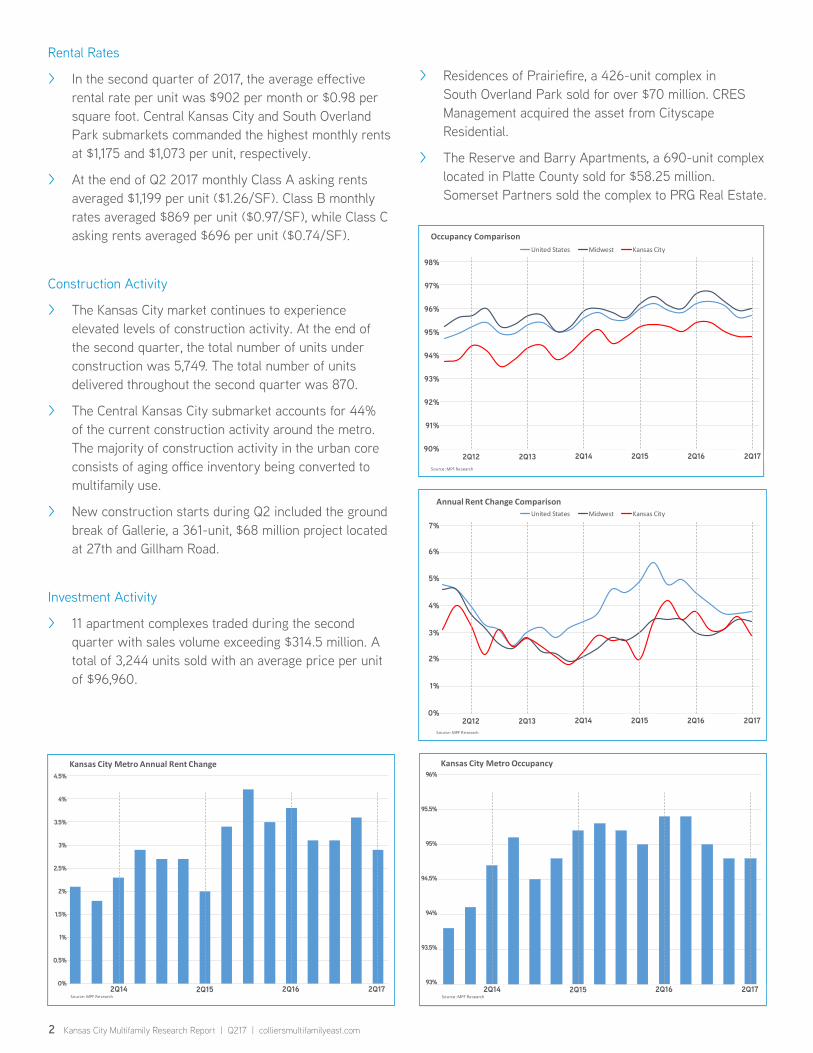
> In the second quarter of 2017, the average effective rental rate per unit was $902 per month or $0.98 per square foot. Central Kansas City and South Overland Park submarkets commanded the highest monthly rents at $1,175 and $1,073 per unit, respectively.
> At the end of Q2 2017 monthly Class A asking rents averaged $1,199 per unit ($1.26/SF). Class B monthly rates averaged $869 per unit ($0.97/SF), while Class C asking rents averaged $696 per unit ($0.74/SF).
Construction Activity
> The Kansas City market continues to experience elevated levels of construction activity. At the end of the second quarter, the total number of units under construction was 5,749. The total number of units delivered throughout the second quarter was 870.
> The Central Kansas City submarket accounts for 44% of the current construction activity around the metro. The majority of construction activity in the urban core consists of aging office inventory being converted to multifamily use.
> New construction starts during Q2 included the ground break of Gallerie, a 361-unit, $68 million project located at 27th and Gillham Road.
Investment Activity
> 11 apartment complexes traded during the second quarter with sales volume exceeding $314.5 million. A total of 3,244 units sold with an average price per unit of $96,960.
2 Kansas City Multifamily Research Report | Q217 | colliersmultifamilyeast.com
90.0%
91.0%
92.0%
93.0%
94.0%
95.0%
96.0%
97.0%
98.0%
4Q2011
1Q2012
2Q2012
3Q2012
4Q2012
1Q2013
2Q2013
3Q2013
4Q2013
1Q2014
2Q2014
3Q2014
4Q2014
1Q2015
2Q2015
3Q2015
4Q2015
1Q2016
2Q2016
3Q2016
4Q2016
1Q2017
2Q2017
Source: MPF Research
Occupancy ComparisonUnited States Midwest Kansas City
0.0%
0.5%
1.0%
1.5%
2.0%
2.5%
3.0%
3.5%
4.0%
4.5%
2013 Q4 2014 Q1 2014 Q2 2014 Q3 2014 Q4 2015 Q1 2015 Q2 2015 Q3 2015 Q4 2016 Q1 2016 Q2 2016 Q3 2016 Q4 2017 Q1 2017 Q2Source: MPF Research
Kansas City Metro Annual Rent Change
> Residences of Prairiefire, a 426-unit complex in South Overland Park sold for over $70 million. CRES Management acquired the asset from Cityscape Residential.
> The Reserve and Barry Apartments, a 690-unit complex located in Platte County sold for $58.25 million. Somerset Partners sold the complex to PRG Real Estate.
2Q12 2Q13 2Q14 2Q15 2Q16 2Q17
7%
6%
5%
4%
3%
2%
1%
0%
98%
97%
96%
95%
94%
93%
92%
91%
2Q12 2Q13 2Q14 2Q15 2Q16 2Q1790%
2Q14 2Q15 2Q16 2Q17
96%
95.5%
95%
94.5%
94%
93.5%
93%2Q14 2Q15 2Q16 2Q17
3.5%
3%
2.5%
2%
1.5%
1%
0.5%
0%
4.5%
4%
0
500
1,000
1,500
2,000
2,500
3,000
3,500
4,000
4,500
5,000
2013 Q4 2014 Q1 2014 Q2 2014 Q3 2014 Q4 2015 Q1 2015 Q2 2015 Q3 2015 Q4 2016 Q1 2016 Q2 2016 Q3 2016 Q4 2017 Q1 2017 Q2
Source: MPF Research
Kansas City Metro Supply (Units)
Quarterly Annual
NOTABLE DELIVERIESproperty submarket units avg unit size avg rent psf developer Altitude 970 Platte County 289 1,018 $1,395 $1.49 AG Spanos
East 9 at Pickwick Plaza Central Kansas City 259 550 $1,120 $2.04 Gold Crown Properties, Inc.
The Denton - Phase II Platte County 154 1,025 $1,261 $1.23 NorthPoint Development
3435 Main Central Kansas City 80 593 $1,006 $1.70 Antheus Capital
911 & 915 Broadway Central Kansas City 44 846 $1,142 $1.35 Yarco Development Co.
InterUrban Lofts North Overland Park 41 975 $1,453 $1.49 REAL Property Group, LLC
NOTABLE SALESproperty submarket yr built units price price per unit seller buyerResidences at Prairiefire South Overland Park 2014 426 $70,083,236 $164,515 Cityscape Residential CRES Management LLC
Manor Homes of Arborwalk Lee's Summit/Blue Springs/Raytown 2006 280 $39,124,960 $139,732 Starwood Capital Milestone Apartments
REIT
Sandstone Creek South Overland Park 2001 364 $48,100,000 $132,143 Preferred Apartment Communities DRA Advisors
West End at City Center Shawnee/Lenexa/Mission 2009 309 $31,950,000 $103,398 TA Realty Blackstone
Reserve at Barry Apartments Platte County 1986 690 $58,250,000 $84,420 Somerset Partners PRG Real Estate
The Meadows Shawnee/Lenexa/Mission 1974 434 $28,000,000 $64,516 Banner Property Management
BH Equities LLC/L5 Investments
Carlyle Apartments Shawnee/Lenexa/Mission 1971 436 $27,550,000 $63,188 TriVest McNeil BH Equities LLC/L5 Investments
3 Kansas City Multifamily Research Report | Q217 | colliersmultifamilyeast.com
SUBMARKET BREAKDOWN
submarketmonthly
rent rent psfquarterly
rent growthannual rent
growth
five-year avg annual
change occupancyexisting
units
annual inventory change %
Central Kansas City $1,175 $1.36 0.3% 3.0% 3.0% 93.7% 22,605 7.7%
Independence/East Kansas City $747 $0.91 0.5% 2.8% 3.5% 97.1% 13,999 0.0%
Lee's Summit/Blue Springs/Raytown $816 $0.88 3.1% 5.8% 3.1% 94.2% 10,421 3.1%
South Kansas City/Grandview $724 $0.81 0.8% 1.0% 2.4% 93.2% 13,884 0.0%
Shawnee/Lenexa/Mission $932 $1.00 2.1% 4.2% 2.8% 95.6% 14,663 1.6%
North Overland Park $906 $0.97 1.7% 2.8% 2.7% 97.0% 10,639 0.4%
South Overland Park $1,073 $1.10 0.8% 1.5% 2.6% 95.6% 17,104 3.2%
Olathe/Gardner $890 $1.02 1.9% 5.1% 3.2% 96.9% 8,216 0.0%
Wyandotte County/Leavenworth $799 $0.91 2.1% 4.7% 2.8% 95.0% 13,386 3.0%
Platte County $848 $0.94 3.2% 2.3% 2.8% 95.3% 9,580 1.1%
Clay County $868 $0.92 1.1% 2.4% 3.2% 91.6% 16,790 8.4%
Kansas City Metro $902 $0.98 1.5% 2.9% 2.9% 94.8% 151,287 2.9%
-300
700
1,700
2,700
3,700
4,700
5,700
2013 Q4 2014 Q1 2014 Q2 2014 Q3 2014 Q4 2015 Q1 2015 Q2 2015 Q3 2015 Q4 2016 Q1 2016 Q2 2016 Q3 2016 Q4 2017 Q1 2017 Q2
Source: MPF Research
Kansas City Metro Demand (Units)
Quarterly Annual
2Q14 2Q15 2Q16 2Q17
5,700
4,700
3,700
2,700
1,700
700
-3002Q14 2Q15 2Q16 2Q17
3,500
3,000
2,500
2,000
1,000
500
-0
5,000
4,500
4,000
1,500
SOUTHOVERLAND
PARK
CENTRAL KANSAS
CITY
SOUTHKANSAS CITY/GRANDVIEW
LEE’S SUMMIT/BLUE SPRINGS/
RAYTOWN
CLAY COUNTY
WYANDOTTE COUNTY/LEAVENWORTH
NORTH OVERLAND
PARK
Sherman Army Airfield Clay
CountyRegional Airfield
RichardsGebaurAirport
Kansas CityInternational
Airport
DowntownAirport
KANSAS CITY, KANSAS
SHAWNEE
OVERLANDPARK
STANLEYGRANDVIEW
BELTON
PECULIAR
RAYMORE
LEE’S SUMMIT
RAYTOWN
BLUE SPRINGS
INDEPENDENCE
LIBERTY
CLAYCOMO
GLADSTONE
KANSAS CITY
PLATTE CITY
KEARNEY
EXCELSIORSPRINGS
NORTHKANSAS CITY
KANSAS CITY
GREENWOOD
LENEXA
Kansas City MetroOffice Submarkets
Colliers International4520 Main Street, Suite 1000Kansas City, Missouri 64111www.colliers.com
PLATTE COUNTY
SHAWNEE/LENEXA/MISSION
INDEPENDENCE/EAST KANSAS CITY
OLATHE/GARDNER
Martin Maguire cprcSenior Research Director | Kansas City
+1 816 556 [email protected]
Gabe Tovar ccimAssociate | Kansas City
+1 816 556 [email protected]
Bob Galamba sior, ccimSenior Vice President | Kansas City
+1 816 556 [email protected]
Colliers International | Kansas City | 4520 Main Street, Suite 1000, Kansas City, Missouri 64111 | +1 816 531 5303 | colliers.com
This document has been prepared by Colliers International for advertising and general information only. Colliers International makes no guarantees, representations or warranties of any kind, expressed or implied, regarding the information including, but not limited to, warranties of content, accuracy and reliability. Any interested party should undertake their own inquiries as to the accuracy of the information. Colliers International excludes unequivocally all inferred or implied terms, conditions and warranties arising out of this document and excludes all liability for loss and damages arising there from. This publication is the copyrighted property of Colliers International and/or its licensor(s). ©2017. All rights reserved.


![[15] Planetary Geology (10/19/17)miller/teaching/astr120f17/class15.pdf · Maximum height of Mountains •Earth: 8.8 km •Venus: 11 km; surface gravity 0.91 times Earth’s 8.8 km/0.91~10](https://img.pdfslide.us/doc/110x75/5fb83964df9a3259956fc5a7/15-planetary-geology-101917-millerteachingastr120f17-maximum-height.jpg)