Embed Size (px)
Citation preview
November 2015
K34: Flow Assurance
Technical Transport
K34: Flow Assurance
IMPORTANT NOTICE
The information provided further to UK CCS Commercialisation Programme (the Competition) set out
herein (the Information) has been prepared by Capture Power Limited and its sub-contractors (the
Consortium) solely for the Department of Energy and Climate Change in connection with the Competition.
The Information does not amount to advice on CCS technology or any CCS engineering, commercial,
financial, regulatory, legal or other solutions on which any reliance should be placed. Accordingly, no
member of the Consortium makes (and the UK Government does not make) any representation, warranty
or undertaking, express or implied, as to the accuracy, adequacy or completeness of any of the Information
and no reliance may be placed on the Information. In so far as permitted by law, no member of the
Consortium or any company in the same group as any member of the Consortium or their respective
officers, employees or agents accepts (and the UK Government does not accept) any responsibility or
liability of any kind, whether for negligence or any other reason, for any damage or loss arising from any
use of or any reliance placed on the Information or any subsequent communication of the Information.
Each person to whom the Information is made available must make their own independent assessment of
the Information after making such investigation and taking professional technical, engineering, commercial,
regulatory, financial, legal or other advice, as they deem necessary.
K34: Flow Assurance
Chapter Title Page
Executive Summary i
1 Introduction 1
2 Purpose 2
3 Overview 3
4 Pipeline and Well Operating Envelope and Capacity 6
4.1 Modelling _________________________________________________________________________ 6 4.2 Fluid Phase Envelopes _______________________________________________________________ 6 4.3 Operating Pressure Envelope _________________________________________________________ 8 4.4 Reservoir Pressure Sensitivity ________________________________________________________ 10
5 Steady State Operation 12
5.1 Years 1 to 5 (0.58 – 2.68 MTPA) ______________________________________________________ 12 5.2 Years 5 to 10 (10 MTPA) ____________________________________________________________ 14 5.3 Year 10 Onwards (17 MTPA) _________________________________________________________ 16
6 Steady State System Constraints 19
6.1 Years 1 to 5 (0.58 – 2.68 MTPA) ______________________________________________________ 19 6.2 Years 5 to 10 (10 MTPA) ____________________________________________________________ 19 6.3 Year 10 Onwards (17 MTPA) _________________________________________________________ 21 6.4 Summary of Conclusions ____________________________________________________________ 22
7 Pipeline Transient Scenarios 24
7.1 Initial Start-up _____________________________________________________________________ 24 7.1.1 Initial Start-up without PIG Operations __________________________________________________ 24 7.1.1.1 Maximum Flowrate from Drax (2.68 MTPA) ______________________________________________ 24 7.1.1.2 Minimum Flowrate from Drax (0.58 MTPA) ______________________________________________ 29 7.1.2 Initial Start-up with PIG Operations ____________________________________________________ 31 7.1.2.1 Maximum Flowrate from Drax (2.68 MTPA) ______________________________________________ 31 7.1.3 Pressurisation up to 100 barg _________________________________________________________ 34 7.1.4 Initial Start-up Summary _____________________________________________________________ 35 7.2 PIG Operations ____________________________________________________________________ 36 7.2.1 Pigging Summary __________________________________________________________________ 38 7.3 Turndown ________________________________________________________________________ 38 7.3.1 Year 1-5 (2.68 – 0.58 MTPA) _________________________________________________________ 39 7.3.1.1 Turndown at 2% of the Maximum Rate _________________________________________________ 39 7.3.1.2 Turndown at a Linear Rate Over 24 Hours _______________________________________________ 41 7.3.2 Year 5-10 (10 – 7.9 MTPA) __________________________________________________________ 43 7.3.3 Turndown Summary ________________________________________________________________ 46 7.4 Ramp-up _________________________________________________________________________ 46 7.4.1 Year 1-5 (0.58–2.68 MTPA) __________________________________________________________ 47 7.4.1.1 Ramp-up Following Additional Well (0.58 MTPA to 2.68 MTPA) ______________________________ 49 7.4.2 Year 5-10 (7.9-10 MTPA) ____________________________________________________________ 52
Contents
K34: Flow Assurance
7.4.2.1 Ramp-up Following Additional Well (7.9 – 10 MTPA) _______________________________________ 54 7.4.3 Ramp-up Summary ________________________________________________________________ 57 7.5 Cooldown ________________________________________________________________________ 58 7.5.1 Cooldown Summary ________________________________________________________________ 60 7.6 Restart __________________________________________________________________________ 61 7.6.1 Cold Restart ______________________________________________________________________ 61 7.6.2 Warm Restart _____________________________________________________________________ 63 7.6.3 Restart Summary __________________________________________________________________ 65 7.7 Depressurisation __________________________________________________________________ 65 7.7.1 Depressurisation – A Multistage Process ________________________________________________ 66 7.7.2 Impact of Orifice Size _______________________________________________________________ 69 7.7.3 Impact of Restarting Depressurisation Too Quickly ________________________________________ 71 7.7.4 Depressurisation at the Peak Elevation _________________________________________________ 72 7.7.5 Location of Minimum Temperature _____________________________________________________ 76 7.7.6 Do the Results from OLGA Make Physical Sense? ________________________________________ 77 7.7.7 Depressurisation of the Offshore Pipeline _______________________________________________ 80 7.7.8 Full System Depressurisation _________________________________________________________ 81 7.7.9 Depressurisation Summary __________________________________________________________ 87 7.8 Leak Detection ____________________________________________________________________ 89 7.8.1 Leak Detection Summary ____________________________________________________________ 91 7.9 Line Pack ________________________________________________________________________ 91 7.9.1 Pipeline Shut-in ___________________________________________________________________ 91 7.9.2 Changes in Flowrate and Well Availability _______________________________________________ 93 7.9.3 Linepack Summary _________________________________________________________________ 97 7.10 Daily Swing _______________________________________________________________________ 97 7.10.1 Daily Swing Summary ______________________________________________________________ 99 7.11 Maximum Pipeline Inventory _________________________________________________________ 99 7.11.1 Maximum Pipeline Inventory Summary ________________________________________________ 101 7.12 Pipeline Unpacking ________________________________________________________________ 101 7.12.1 Pipeline Unpacking Summary _______________________________________________________ 103 7.13 Pressure Surge Due to ESD Valve Closure _____________________________________________ 103 7.13.1 Pressure Surge Summary __________________________________________________________ 106 7.14 Water Wash _____________________________________________________________________ 106 7.14.1 Reservoir Injectivity (for Water Wash Operation) _________________________________________ 107 7.14.2 Prewash MEG Flush_______________________________________________________________ 109 7.14.3 Water Wash _____________________________________________________________________ 109 7.14.4 Postwash MEG Flush ______________________________________________________________ 111 7.14.5 Start-up Post Water Wash __________________________________________________________ 112 7.14.6 Water Wash Summary _____________________________________________________________ 115 7.15 Initial Wells Inventory ______________________________________________________________ 116 7.15.1 Initial Well Inventory Summary _______________________________________________________ 120 7.16 Low Pressure Well Settle-out ________________________________________________________ 120 7.16.1 Low Pressure Well Settle-out Summary ________________________________________________ 122
8 Conclusions from Transient Analysis 123
8.1 General _________________________________________________________________________ 123 8.2 Initial Start-up ____________________________________________________________________ 123 8.3 PIG Operations ___________________________________________________________________ 123 8.4 Turndown _______________________________________________________________________ 123 8.5 Ramp-up ________________________________________________________________________ 124
K34: Flow Assurance
8.6 Cooldown _______________________________________________________________________ 124 8.7 Restart _________________________________________________________________________ 124 8.8 Depressurisation _________________________________________________________________ 125 8.9 Leak Detection ___________________________________________________________________ 125 8.10 Line Pack _______________________________________________________________________ 125 8.11 Daily Swing ______________________________________________________________________ 125 8.12 Maximum Pipeline Inventory ________________________________________________________ 125 8.13 Pipeline Unpacking ________________________________________________________________ 126 8.14 Pressure Surge Due to ESD Valve Closure _____________________________________________ 126 8.15 Water Wash _____________________________________________________________________ 126 8.16 Initial Well Inventory _______________________________________________________________ 126 8.17 Low Pressure Well Settle-out ________________________________________________________ 126
9 Recommendations Derived from Transient Analysis 128
10 Glossary 129
K34: Flow Assurance
Key Word Meaning or Explanation
Carbon An element, but used as shorthand for its gaseous oxide, CO2.
Capture Collection of CO2 from power station combustion process or other facilities and its process ready for transportation.
Dense Phase Fluid state that has a viscosity close to a gas while having a density closer to a liquid. Achieved by maintaining the temperature of a gas within a particular range and compressing it above a critical pressure.
Key knowledge Information that may be useful if not vital to understanding how some enterprise may be successfully undertaken
Storage Containment in suitable pervious rock formations located under impervious rock formations usually under the sea bed.
Transport Removing processed CO2 by pipeline from the capture and process unit to storage.
Heat and Mass Balance Heat and mass balance is a document produced by process design engineers while designing a process plant. A heat and mass balance sheet represents every process stream on the corresponding process flow diagram in terms of the process conditions.
Process Flow Diagram Process Flow Diagram (PFD) is a drawing which essentially captures the process flow for a processing plant. PFD is used to capture the main process items of equipment, main process stream, process/design conditions in these items of equipment and the basic process control scheme in a single drawing.
Full Chain Reports described as “full chain” would cover the complete process from the capture of the carbon at the emitter plant to its injection into the storage reservoir.
Flow Assurance Ensuring successful and economical flow of a fluid stream through a pipework system.
Key Words

K34: Flow Assurance
i
This report is one of a series of reports; these “key knowledge” reports are issued here as public
information. These reports were generated as part of the Front End Engineering Design Contract (FEED)
agreed with the Department of Energy and Climate Change (DECC) as part of the White Rose Project.
White Rose seeks to deliver a clean coal-fired power station using oxy-fuel technology, which would
generate up to 448MWe (gross), integrated into a full-chain Carbon Capture and Storage (CCS) Project.
CCS technology allows 90% of the carbon dioxide produced during combustion to be captured, processed
and compressed before being transported to permanent storage in dense phase. The dense phase carbon
dioxide would be kept under pressure while it is pumped through an underground pipeline to the seashore
and then through an offshore pipeline to be stored in a specially chosen rock formation under the seabed
of the southern North Sea.
Delivery of the full-chain project is be provided by National Grid Carbon, which is responsible for the
Transport and Storage (T&S) network, and Capture Power Limited (CPL), which is responsible for the Oxy
Power Plant (OPP) and the Gas Processing Unit (GPU).
This document presents flow assurance results for the transportation and storage scheme, covering both
steady and transient modelling of flow. It addresses the analysis of transient conditions which are likely to
occur during operation of the CCS system. The results will inform the control philosophies.
Executive Summary

K34: Flow Assurance
1
National Grid Carbon Limited (NGC) is a wholly owned subsidiary of the National Grid group of companies.
Capture Power Limited (CPL) is a special purpose vehicle company, which has been formed by a
consortium consisting of ALSTOM, Drax and BOC, to pursue the White Rose CCS Project (the WR
Project).
CPL have entered into an agreement (the FEED Contract) with the UK Government’s Department of
Energy and Climate Change (DECC) pursuant to which it will carry out, among other things, the
engineering, cost estimation and risk assessment required to specify the budget required to develop and
operate the WR Assets. The WR Assets comprise an end-to-end electricity generation and carbon capture
and storage system comprising, broadly: a coal fired power station utilising oxy-fuel technology, carbon
dioxide capture, processing, compression and metering facilities; transportation pipeline and pressure
boosting facilities; offshore carbon dioxide reception and processing facilities, and injection wells into an
offshore storage reservoir.
CPL and NGC have entered into an agreement (the KSC) pursuant to which NGC will perform a project
(the WR T&S FEED Project) which will meet that part of CPL’s obligations under the FEED Contract which
are associated with the T&S Assets. The T&S Assets include, broadly: the transportation pipeline and
pressure boosting facilities; offshore carbon dioxide reception and processing facilities, and injection wells
into an offshore storage reservoir.
A key component of the WR T&S FEED Project is the Key Knowledge Transfer process. A major portion
of this is the compilation and distribution of a set of documents termed Key Knowledge Deliverables
(KKDs). This document is one of these KKDs and its specific purpose is summarised below.
The steady state flow assurance analysis of the White Rose transportation system has been conducted at
a range of flowrates across the life of the project at both summer and winter conditions.
The fluid pressures, temperatures and densities will be used as a basis for the design of the onshore and
offshore pipelines, and for boundary conditions for various process simulations and designs. The
differential pressure requirements will be used as a basis for selecting the pump design. The well
performance data will be used for further reservoir modelling work.
The findings of the steady state analysis are presented to answer two fundamental questions:
What pipeline operating pressures are required to achieve the target injection flowrates?
What injection rates can be achieved by the system?
Flow Assurance transient studies were conducted for the full length (end to end) of the pipeline system,
from the outlet of the Oxy Power Plant (OPP) Carbon Dioxide Capture Plant to the reservoir including 3
wells at the 5/42 platform and future wells located at another location. The model incorporated wellhead
pressure controls and pump efficiency curves and determined the effects of such transient situations
resulting from shutdown, emergency shutdown, initial start, restarts, turndown, ramp-up, Pipeline
Inspection Gauge (PIG) operations, depressurising and booster pump trips.
1 Introduction
K34: Flow Assurance
2
The findings of this analysis are presented to answer two fundamental questions:
What pipeline operating pressures are required to achieve the target injection flowrates?
What injection rates can be achieved by the system?
It will address through separate chapters the following areas:
The pipeline and well operating envelopes and capacity; and
pipeline transient issues such as:
– pipeline and well start up;
– shutdown;
– depressurisation;
– deployment of PIGs;
– buffering capacity;
– turndown issues; and
– surge analysis.
2 Purpose
K34: Flow Assurance
3
The White Rose CCS Project is to provide an example of a clean coal-fired power station of up to 448 MW
gross output, built and operated as a commercial enterprise.
The project comprises a state-of-the-art coal-fired power plant that is equipped with full CCS technology.
The plant would also have the potential to co-fire biomass. The project is intended to prove CCS
technology at a commercial scale and demonstrate it as a competitive form of low-carbon power
generation and as an important technology in tackling climate change. It would also play an important role
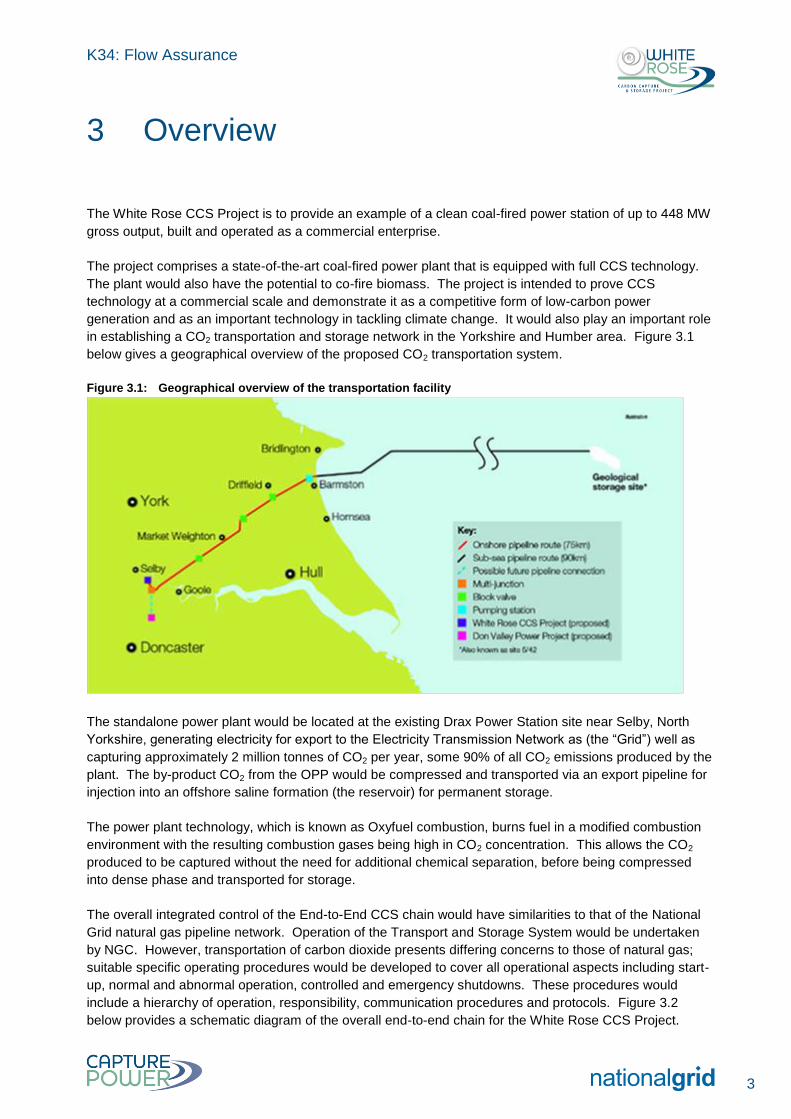
in establishing a CO2 transportation and storage network in the Yorkshire and Humber area. Figure 3.1
below gives a geographical overview of the proposed CO2 transportation system.
Figure 3.1: Geographical overview of the transportation facility
The standalone power plant would be located at the existing Drax Power Station site near Selby, North
Yorkshire, generating electricity for export to the Electricity Transmission Network as (the “Grid”) well as
capturing approximately 2 million tonnes of CO2 per year, some 90% of all CO2 emissions produced by the
plant. The by-product CO2 from the OPP would be compressed and transported via an export pipeline for
injection into an offshore saline formation (the reservoir) for permanent storage.
The power plant technology, which is known as Oxyfuel combustion, burns fuel in a modified combustion
environment with the resulting combustion gases being high in CO2 concentration. This allows the CO2
produced to be captured without the need for additional chemical separation, before being compressed
into dense phase and transported for storage.
The overall integrated control of the End-to-End CCS chain would have similarities to that of the National
Grid natural gas pipeline network. Operation of the Transport and Storage System would be undertaken
by NGC. However, transportation of carbon dioxide presents differing concerns to those of natural gas;
suitable specific operating procedures would be developed to cover all operational aspects including start-
up, normal and abnormal operation, controlled and emergency shutdowns. These procedures would
include a hierarchy of operation, responsibility, communication procedures and protocols. Figure 3.2
below provides a schematic diagram of the overall end-to-end chain for the White Rose CCS Project.
3 Overview
K34: Flow Assurance
4
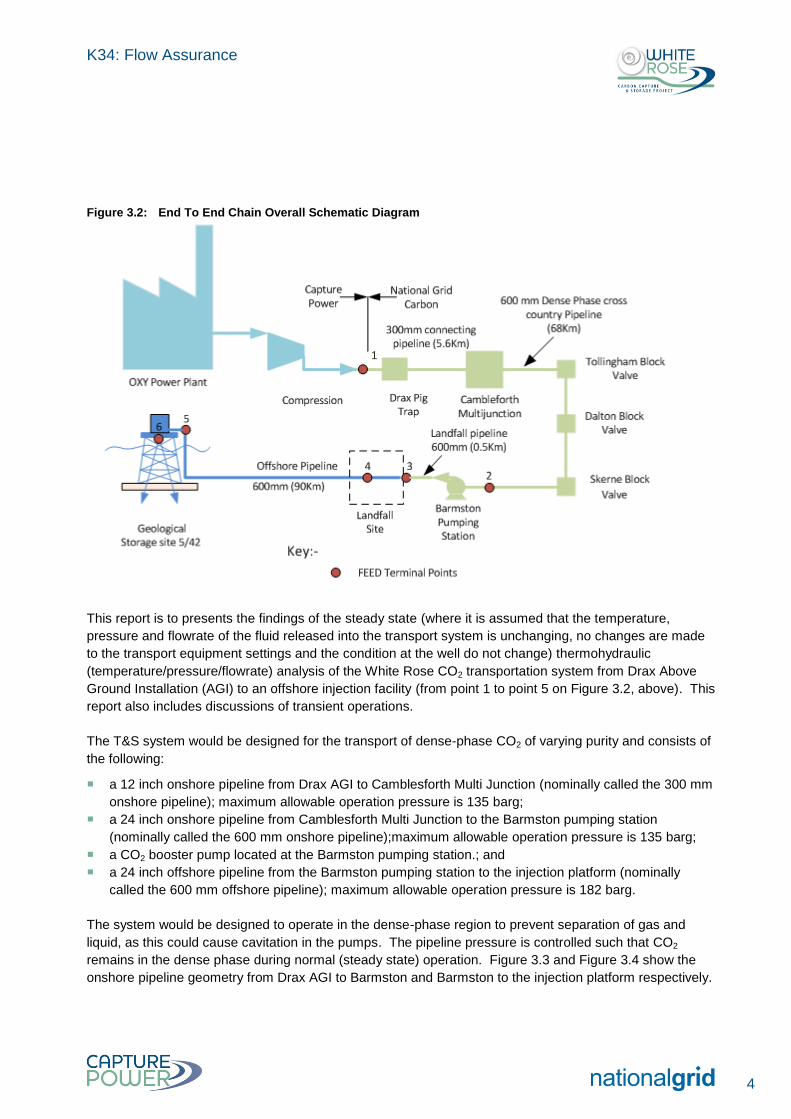
Figure 3.2: End To End Chain Overall Schematic Diagram
This report is to presents the findings of the steady state (where it is assumed that the temperature,
pressure and flowrate of the fluid released into the transport system is unchanging, no changes are made
to the transport equipment settings and the condition at the well do not change) thermohydraulic
(temperature/pressure/flowrate) analysis of the White Rose CO2 transportation system from Drax Above
Ground Installation (AGI) to an offshore injection facility (from point 1 to point 5 on Figure 3.2, above). This
report also includes discussions of transient operations.
The T&S system would be designed for the transport of dense-phase CO2 of varying purity and consists of
the following:
a 12 inch onshore pipeline from Drax AGI to Camblesforth Multi Junction (nominally called the 300 mm
onshore pipeline); maximum allowable operation pressure is 135 barg;
a 24 inch onshore pipeline from Camblesforth Multi Junction to the Barmston pumping station
(nominally called the 600 mm onshore pipeline);maximum allowable operation pressure is 135 barg;
a CO2 booster pump located at the Barmston pumping station.; and
a 24 inch offshore pipeline from the Barmston pumping station to the injection platform (nominally
called the 600 mm offshore pipeline); maximum allowable operation pressure is 182 barg.
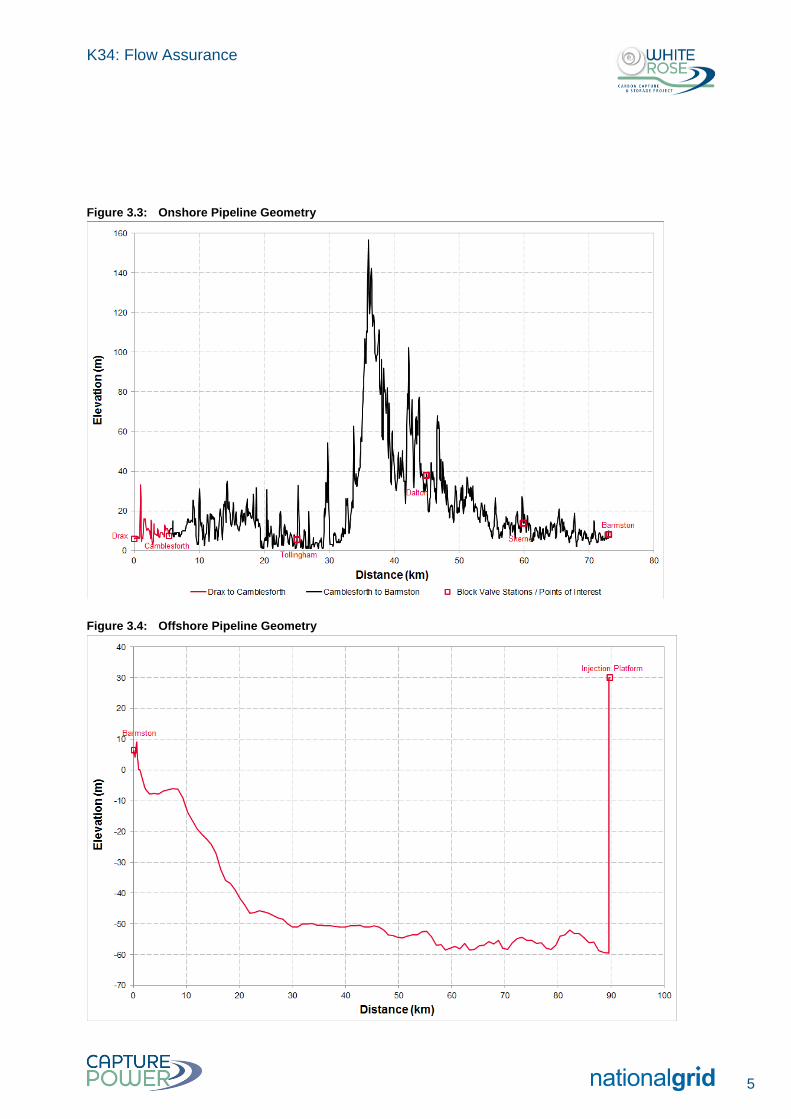
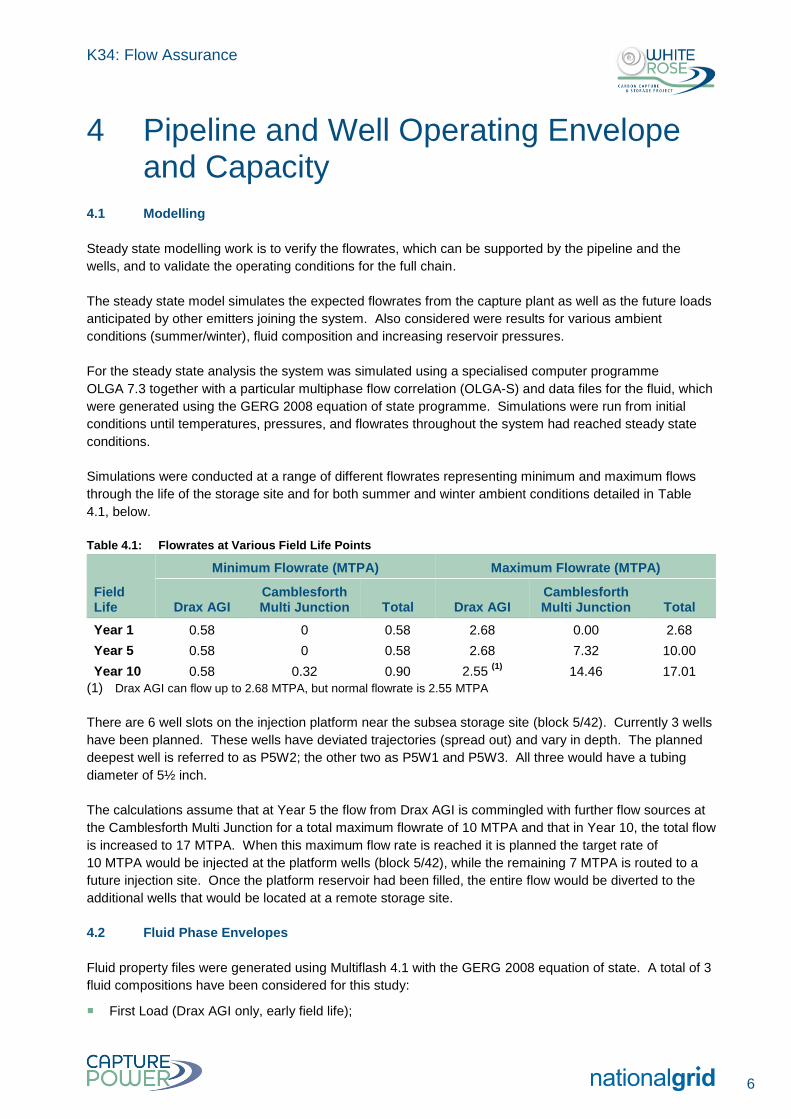
The system would be designed to operate in the dense-phase region to prevent separation of gas and
liquid, as this could cause cavitation in the pumps. The pipeline pressure is controlled such that CO2
remains in the dense phase during normal (steady state) operation. Figure 3.3 and Figure 3.4 show the
onshore pipeline geometry from Drax AGI to Barmston and Barmston to the injection platform respectively.
K34: Flow Assurance
5
Figure 3.3: Onshore Pipeline Geometry
Figure 3.4: Offshore Pipeline Geometry
K34: Flow Assurance
6
4.1 Modelling
Steady state modelling work is to verify the flowrates, which can be supported by the pipeline and the
wells, and to validate the operating conditions for the full chain.
The steady state model simulates the expected flowrates from the capture plant as well as the future loads
anticipated by other emitters joining the system. Also considered were results for various ambient
conditions (summer/winter), fluid composition and increasing reservoir pressures.
For the steady state analysis the system was simulated using a specialised computer programme
OLGA 7.3 together with a particular multiphase flow correlation (OLGA-S) and data files for the fluid, which
were generated using the GERG 2008 equation of state programme. Simulations were run from initial
conditions until temperatures, pressures, and flowrates throughout the system had reached steady state
conditions.
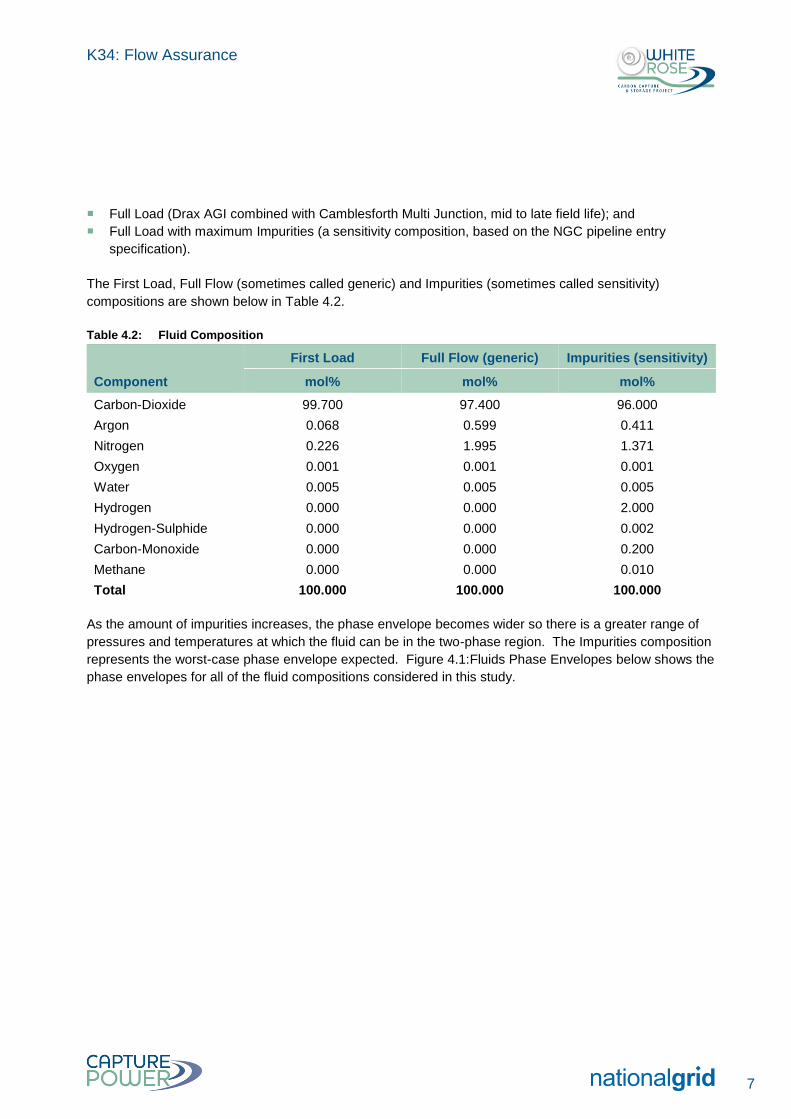
Simulations were conducted at a range of different flowrates representing minimum and maximum flows
through the life of the storage site and for both summer and winter ambient conditions detailed in Table
4.1, below.
Table 4.1: Flowrates at Various Field Life Points
Field Life
Minimum Flowrate (MTPA) Maximum Flowrate (MTPA)
Drax AGI Camblesforth Multi Junction Total Drax AGI
Camblesforth Multi Junction Total
Year 1 0.58 0 0.58 2.68 0.00 2.68
Year 5 0.58 0 0.58 2.68 7.32 10.00
Year 10 0.58 0.32 0.90 2.55 (1)
14.46 17.01
(1) Drax AGI can flow up to 2.68 MTPA, but normal flowrate is 2.55 MTPA
There are 6 well slots on the injection platform near the subsea storage site (block 5/42). Currently 3 wells
have been planned. These wells have deviated trajectories (spread out) and vary in depth. The planned
deepest well is referred to as P5W2; the other two as P5W1 and P5W3. All three would have a tubing
diameter of 5½ inch.
The calculations assume that at Year 5 the flow from Drax AGI is commingled with further flow sources at
the Camblesforth Multi Junction for a total maximum flowrate of 10 MTPA and that in Year 10, the total flow
is increased to 17 MTPA. When this maximum flow rate is reached it is planned the target rate of
10 MTPA would be injected at the platform wells (block 5/42), while the remaining 7 MTPA is routed to a
future injection site. Once the platform reservoir had been filled, the entire flow would be diverted to the
additional wells that would be located at a remote storage site.
4.2 Fluid Phase Envelopes
Fluid property files were generated using Multiflash 4.1 with the GERG 2008 equation of state. A total of 3
fluid compositions have been considered for this study:
First Load (Drax AGI only, early field life);
4 Pipeline and Well Operating Envelope and Capacity
K34: Flow Assurance
7
Full Load (Drax AGI combined with Camblesforth Multi Junction, mid to late field life); and
Full Load with maximum Impurities (a sensitivity composition, based on the NGC pipeline entry
specification).
The First Load, Full Flow (sometimes called generic) and Impurities (sometimes called sensitivity)
compositions are shown below in Table 4.2.
Table 4.2: Fluid Composition
Component
First Load Full Flow (generic) Impurities (sensitivity)
mol% mol% mol%
Carbon-Dioxide 99.700 97.400 96.000
Argon 0.068 0.599 0.411
Nitrogen 0.226 1.995 1.371
Oxygen 0.001 0.001 0.001
Water 0.005 0.005 0.005
Hydrogen 0.000 0.000 2.000
Hydrogen-Sulphide 0.000 0.000 0.002
Carbon-Monoxide 0.000 0.000 0.200
Methane 0.000 0.000 0.010
Total 100.000 100.000 100.000
As the amount of impurities increases, the phase envelope becomes wider so there is a greater range of
pressures and temperatures at which the fluid can be in the two-phase region. The Impurities composition
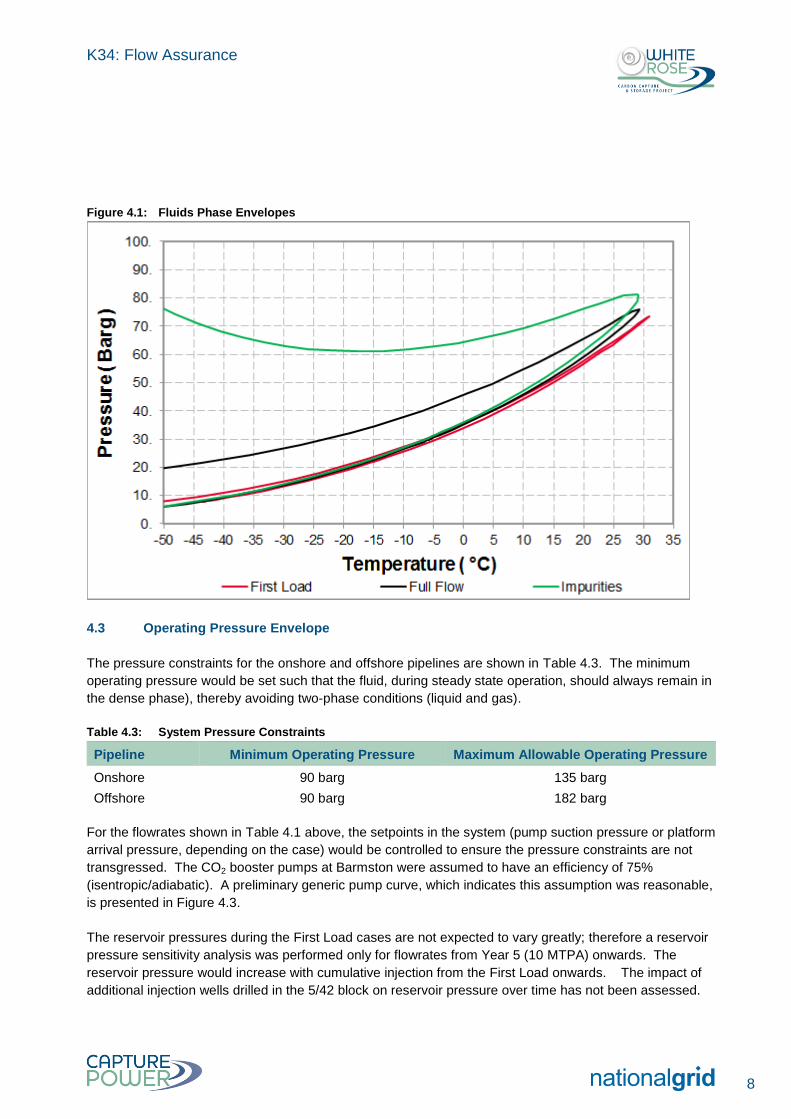
represents the worst-case phase envelope expected. Figure 4.1: Fluids Phase Envelopes below shows the
phase envelopes for all of the fluid compositions considered in this study.
K34: Flow Assurance
8
Figure 4.1: Fluids Phase Envelopes
4.3 Operating Pressure Envelope
The pressure constraints for the onshore and offshore pipelines are shown in Table 4.3. The minimum
operating pressure would be set such that the fluid, during steady state operation, should always remain in
the dense phase), thereby avoiding two-phase conditions (liquid and gas).
Table 4.3: System Pressure Constraints
Pipeline Minimum Operating Pressure Maximum Allowable Operating Pressure
Onshore 90 barg 135 barg
Offshore 90 barg 182 barg
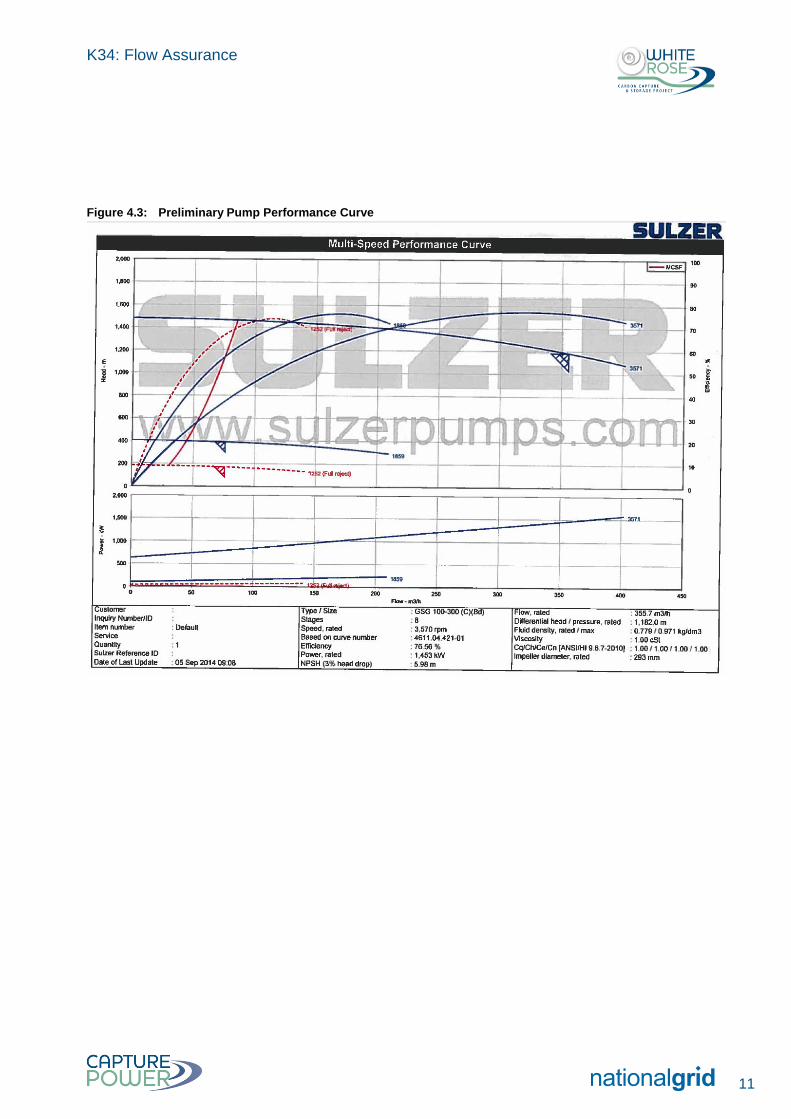
For the flowrates shown in Table 4.1 above, the setpoints in the system (pump suction pressure or platform
arrival pressure, depending on the case) would be controlled to ensure the pressure constraints are not
transgressed. The CO2 booster pumps at Barmston were assumed to have an efficiency of 75%
(isentropic/adiabatic). A preliminary generic pump curve, which indicates this assumption was reasonable,
is presented in Figure 4.3.
The reservoir pressures during the First Load cases are not expected to vary greatly; therefore a reservoir
pressure sensitivity analysis was performed only for flowrates from Year 5 (10 MTPA) onwards. The
reservoir pressure would increase with cumulative injection from the First Load onwards. The impact of
additional injection wells drilled in the 5/42 block on reservoir pressure over time has not been assessed.
K34: Flow Assurance
9
After Year 5 the pressure in the reservoir varies based on the assumed reservoir model properties. A
conservative estimate was used for a finite volume aquifer, with a pressure increase of 27 bar from the
Year 1 reservoir pressures at the perforation datum point (1300m below sea-level) by Year 5. A less
conservative estimate was also considered, where the volume of an adjacent aquifer was not confined.
This resulted in a reservoir pressure increase of 21 bar.
By Year 10 the conservative reservoir pressure would have increased by 44 bar and the less conservative
reservoir pressure would have increased by 28 bar compared to Year 1.
Table 4.4 shows the average reservoir pressures considered in this analysis.
Table 4.4: Average Reservoir Pressures over Life of the Storage Site
Well Year Flowrate (MTPA) Low Pressure (barg) High Pressure (barg) Injectivity MTPA/bar
P5W1 1 0.58 - 2.68 150 150
0.0442 P5W2 5 10 171 177
P5W3 10 17 178 194
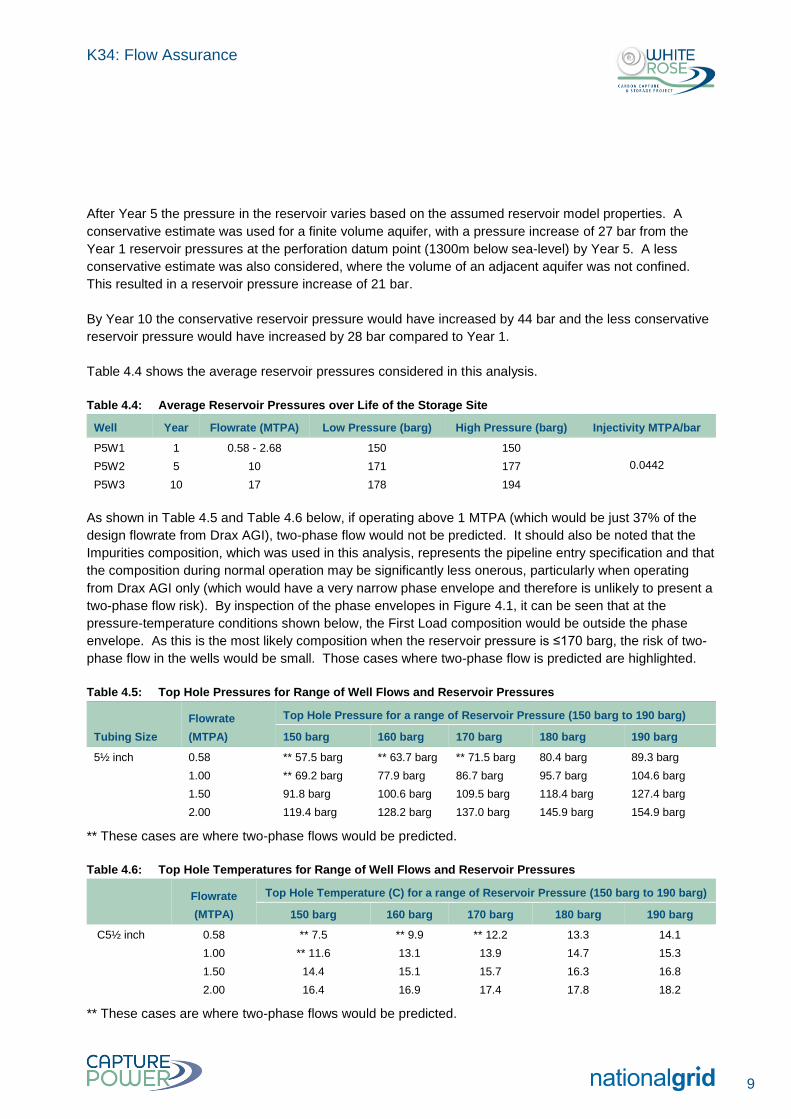
As shown in Table 4.5 and Table 4.6 below, if operating above 1 MTPA (which would be just 37% of the
design flowrate from Drax AGI), two-phase flow would not be predicted. It should also be noted that the
Impurities composition, which was used in this analysis, represents the pipeline entry specification and that
the composition during normal operation may be significantly less onerous, particularly when operating
from Drax AGI only (which would have a very narrow phase envelope and therefore is unlikely to present a
two-phase flow risk). By inspection of the phase envelopes in Figure 4.1, it can be seen that at the
pressure-temperature conditions shown below, the First Load composition would be outside the phase
envelope. As this is the most likely composition when the reservoir pressure is ≤170 barg, the risk of two-
phase flow in the wells would be small. Those cases where two-phase flow is predicted are highlighted.
Table 4.5: Top Hole Pressures for Range of Well Flows and Reservoir Pressures
Tubing Size
Flowrate
(MTPA)
Top Hole Pressure for a range of Reservoir Pressure (150 barg to 190 barg)
150 barg 160 barg 170 barg 180 barg 190 barg
5½ inch 0.58 ** 57.5 barg ** 63.7 barg ** 71.5 barg 80.4 barg 89.3 barg
1.00 ** 69.2 barg 77.9 barg 86.7 barg 95.7 barg 104.6 barg
1.50 91.8 barg 100.6 barg 109.5 barg 118.4 barg 127.4 barg
2.00 119.4 barg 128.2 barg 137.0 barg 145.9 barg 154.9 barg
** These cases are where two-phase flows would be predicted.
Table 4.6: Top Hole Temperatures for Range of Well Flows and Reservoir Pressures
Flowrate
(MTPA)
Top Hole Temperature (C) for a range of Reservoir Pressure (150 barg to 190 barg)
150 barg 160 barg 170 barg 180 barg 190 barg
C5½ inch 0.58 ** 7.5 ** 9.9 ** 12.2 13.3 14.1
1.00 ** 11.6 13.1 13.9 14.7 15.3
1.50 14.4 15.1 15.7 16.3 16.8
2.00 16.4 16.9 17.4 17.8 18.2
** These cases are where two-phase flows would be predicted.
K34: Flow Assurance
10
4.4 Reservoir Pressure Sensitivity
The reservoir pressures during first load are not expected to vary greatly, therefore a reservoir pressure
sensitivity analysis was performed for flowrates from Year 5 (10MTPA) onwards. The early life reservoir
conditions are given in Table 4.7 below.
Table 4.7: Year 1 Reservoir Conditions
Well Pressure at Top Perforation (barg) Temperature at Top Perforation (C)
P5W1 140.1 56.9
P5W2 140.3 56.9
P5W3 140.7 57.1
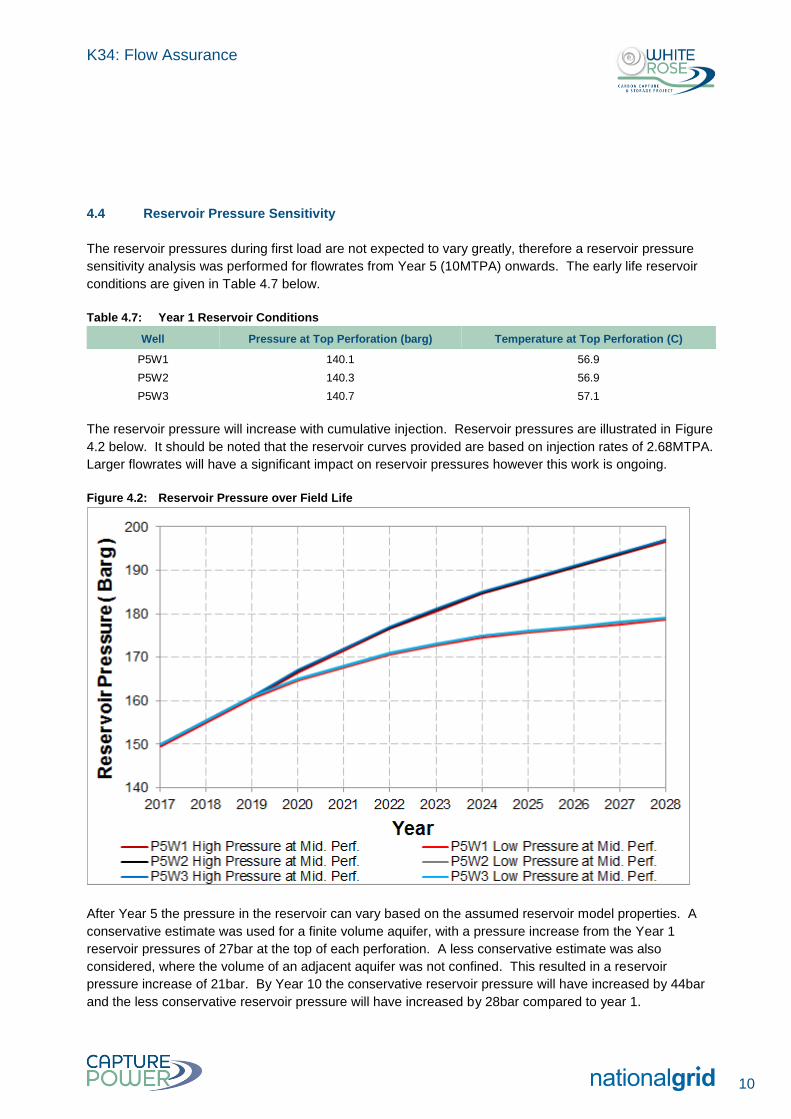
The reservoir pressure will increase with cumulative injection. Reservoir pressures are illustrated in Figure
4.2 below. It should be noted that the reservoir curves provided are based on injection rates of 2.68MTPA.
Larger flowrates will have a significant impact on reservoir pressures however this work is ongoing.
Figure 4.2: Reservoir Pressure over Field Life
After Year 5 the pressure in the reservoir can vary based on the assumed reservoir model properties. A
conservative estimate was used for a finite volume aquifer, with a pressure increase from the Year 1
reservoir pressures of 27bar at the top of each perforation. A less conservative estimate was also
considered, where the volume of an adjacent aquifer was not confined. This resulted in a reservoir
pressure increase of 21bar. By Year 10 the conservative reservoir pressure will have increased by 44bar
and the less conservative reservoir pressure will have increased by 28bar compared to year 1.
K34: Flow Assurance
11
Figure 4.3: Preliminary Pump Performance Curve
K34: Flow Assurance
12
This section provides the pipeline hydraulics for the CO2 transportation system assuming that the flowrate
to each well and the number of wells at the injection platform is fixed and the system is at the maximum
pressure requirements. This is based on up to 10 MTPA being injected at the injection platform, with an
additional 7 MTPA (when applicable) routed to a remote location, yet to be defined.
5.1 Years 1 to 5 (0.58 – 2.68 MTPA)
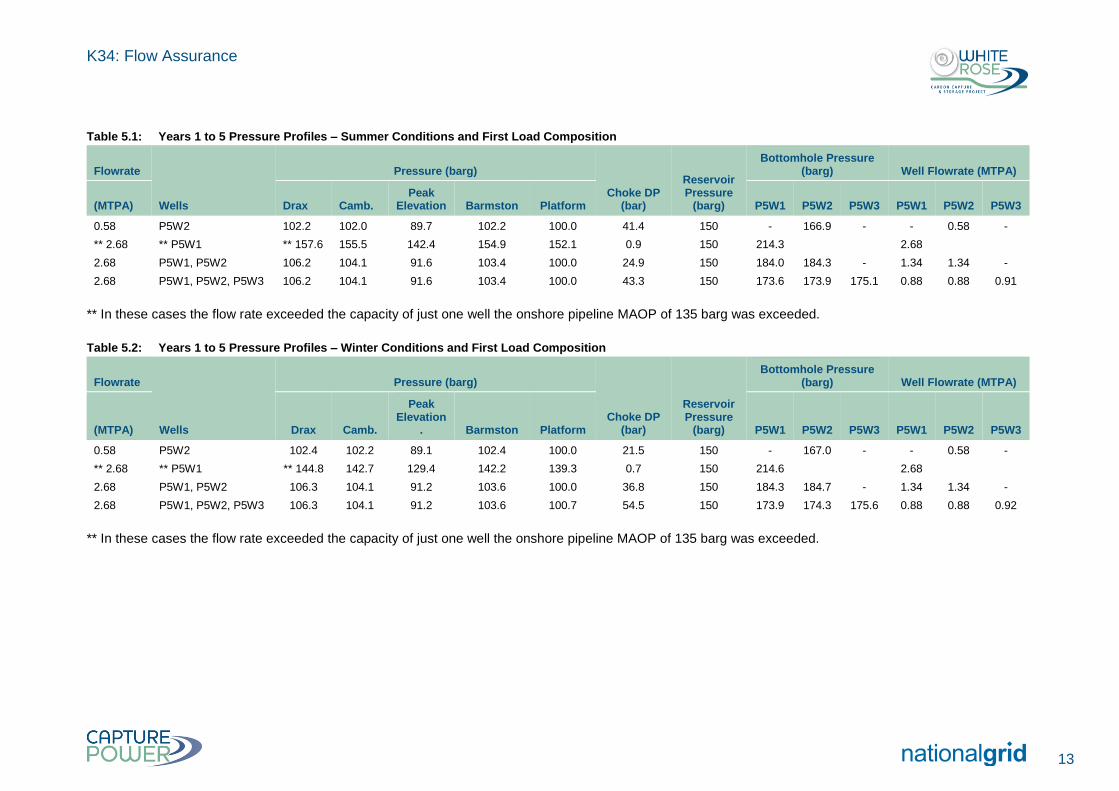
Table 5.1 and Table 5.2, below, show the pressure profiles for the First Load composition (Year 1) for the
minimum flow case and the peak Years 1 to 5 flowrate for summer and winter conditions respectively (well
P5W2 was used as it would have the longest well tubing geometry and therefore presents the worst-case
for pressure drop). As the flowrates were relatively low in these cases, the CO2 booster pumps at
Barmston would not be required. However, to avoid the CO2 entering the 2-phase region in the pipeline
the pressure would be controlled at the platform. A setpoint of 100 barg would be selected to ensure that
the pipeline contents would not enter the two-phase region during steady state conditions. As the
composition would have a high purity (as per the First Load composition) the two phase region is very
narrow (see Figure 4.1, above) and so the risk of entering into it would be very low. However, the
observations from this analysis could be applied to less pure compositions when operating at low
flowrates.
5 Steady State Operation
K34: Flow Assurance
13
Table 5.1: Years 1 to 5 Pressure Profiles – Summer Conditions and First Load Composition
Flowrate
Wells
Pressure (barg)
Choke DP (bar)
Reservoir Pressure
(barg)
Bottomhole Pressure (barg) Well Flowrate (MTPA)
(MTPA) Drax Camb. Peak
Elevation Barmston Platform P5W1 P5W2 P5W3 P5W1 P5W2 P5W3
0.58 P5W2 102.2 102.0 89.7 102.2 100.0 41.4 150 - 166.9 - - 0.58 -
** 2.68 ** P5W1 ** 157.6 155.5 142.4 154.9 152.1 0.9 150 214.3 2.68
2.68 P5W1, P5W2 106.2 104.1 91.6 103.4 100.0 24.9 150 184.0 184.3 - 1.34 1.34 -
2.68 P5W1, P5W2, P5W3 106.2 104.1 91.6 103.4 100.0 43.3 150 173.6 173.9 175.1 0.88 0.88 0.91
** In these cases the flow rate exceeded the capacity of just one well the onshore pipeline MAOP of 135 barg was exceeded.
Table 5.2: Years 1 to 5 Pressure Profiles – Winter Conditions and First Load Composition
Flowrate
Wells
Pressure (barg)
Choke DP (bar)
Reservoir Pressure
(barg)
Bottomhole Pressure (barg) Well Flowrate (MTPA)
(MTPA) Drax Camb.
Peak Elevation
. Barmston Platform P5W1 P5W2 P5W3 P5W1 P5W2 P5W3
0.58 P5W2 102.4 102.2 89.1 102.4 100.0 21.5 150 - 167.0 - - 0.58 -
** 2.68 ** P5W1 ** 144.8 142.7 129.4 142.2 139.3 0.7 150 214.6 2.68
2.68 P5W1, P5W2 106.3 104.1 91.2 103.6 100.0 36.8 150 184.3 184.7 - 1.34 1.34 -
2.68 P5W1, P5W2, P5W3 106.3 104.1 91.2 103.6 100.7 54.5 150 173.9 174.3 175.6 0.88 0.88 0.92
** In these cases the flow rate exceeded the capacity of just one well the onshore pipeline MAOP of 135 barg was exceeded.
K34: Flow Assurance
14
As the flowrates were well below the pipeline design capacity when only Drax AGI is supplying the
pipeline, the net pipeline pressure drop was small in both summer and winter. The minimum pressure in
both cases occurs at the highest/peak elevation point along the pipeline, which would be between the
Tollingham and Dalton block valve stations, at approximately 36 km from the inlet.
The minimum flowrate of 0.58 MTPA could be injected into a single well (the P5W2 well was used in this
analysis as it would have the longest well tubing geometry and therefore is the most conservative) with the
pressure controlled at the platform. The pressure drop (2.2 bar) through the pipeline was very low, so
there would be some scope for adjusting the pressure setpoint at the platform upwards if desirable. The
setpoint should not be adjusted below 100 barg as the minimum pressure (at the highest elevation point)
would be just below 90 barg, which would be the minimum pipeline operating pressure. Reducing the
pressure below 90 barg would risk two-phase operation during injection or following shutdown. It was
recognised however, that for the First Load composition the risk of entering the two-phase region would be
low due to the purity of CO2 giving rise to a very narrow phase envelope.
Injecting 2.68 MTPA (design flowrate from Drax AGI) into a single well would not be possible, as the
indicated pipeline pressure exceeds the maximum onshore pipeline operating pressure of 135 barg by over
22 bar. A minimum of two injection wells would be required in Years 1 to 5 to meet the maximum
operating pressure constraint. The P5W1 and P5W2 wells were used as they are longer than the P5W3
well and therefore present a more conservative basis.
The fluid would reach ambient temperature by 40 km from the platform at these low flowrates. It is worth
noting that the temperature profile in the offshore section changes: the first 25 km would be concrete-
coated, so would have relatively good insulating properties giving a near linear heat loss. Where the
pipeline was not concrete-coated, the temperature drops much more quickly as the heat retention is much
poorer.
A range of minimum theoretical CO2 temperature may be calculated using the Multiflash programme,
assuming a fluid temperature of -7°C (minimum ambient air temperature) with and an isentropic (adiabatic)
flash downstream of the choke valve, for a range of platform pressures upstream of the injection choke
valve. The minimum theoretical temperature downstream of the choke valve for a pressure of 33.9 barg at
the top of the tubing (minimum steady state pressure) would range from -11°C to -21°C depending on the
pressure upstream of the choke and composition. The impurities composition exhibits a greater
expansion-cooling effect due to the level of impurities and wider phase envelope.
The normal operating temperature for the First Load composition at minimum flowrate was above the
minimum theoretical as the temperature at the platform was significantly higher than the minimum ambient.
Even taking the worst-case minimum theoretical temperatures, a minimum design temperature
downstream of the choke of -25°C should be sufficient to accommodate all likely operating conditions.
5.2 Years 5 to 10 (10 MTPA)
The flowrate through the injection system would be expected to increase in Year 5, when additional
sources of CO2 would be supplied to the Camblesforth Multi Junction and the total flowrate increased to
10 MTPA. To manage the increased flowrate, an additional number of wells would be required to maintain
the pipeline pressure within the maximum allowable operating pressure (MAOP) constraint. Up to three
K34: Flow Assurance
15
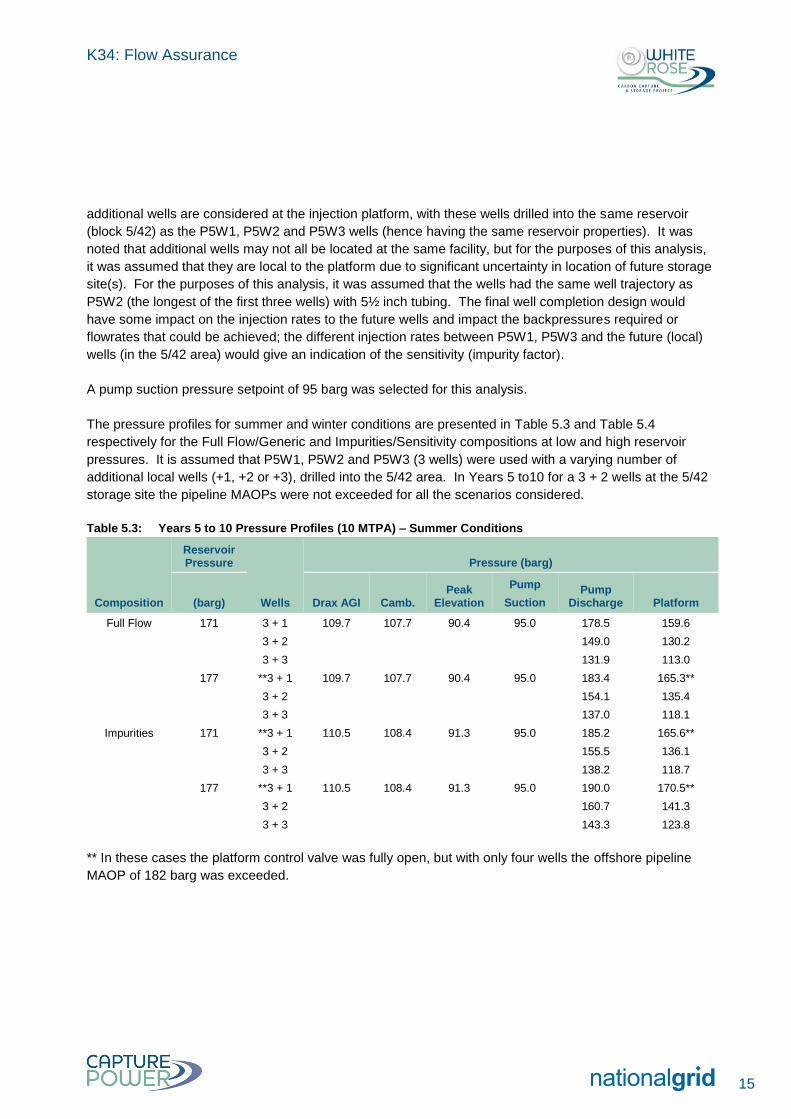
additional wells are considered at the injection platform, with these wells drilled into the same reservoir
(block 5/42) as the P5W1, P5W2 and P5W3 wells (hence having the same reservoir properties). It was
noted that additional wells may not all be located at the same facility, but for the purposes of this analysis,
it was assumed that they are local to the platform due to significant uncertainty in location of future storage
site(s). For the purposes of this analysis, it was assumed that the wells had the same well trajectory as
P5W2 (the longest of the first three wells) with 5½ inch tubing. The final well completion design would
have some impact on the injection rates to the future wells and impact the backpressures required or
flowrates that could be achieved; the different injection rates between P5W1, P5W3 and the future (local)
wells (in the 5/42 area) would give an indication of the sensitivity (impurity factor).
A pump suction pressure setpoint of 95 barg was selected for this analysis.
The pressure profiles for summer and winter conditions are presented in Table 5.3 and Table 5.4
respectively for the Full Flow/Generic and Impurities/Sensitivity compositions at low and high reservoir
pressures. It is assumed that P5W1, P5W2 and P5W3 (3 wells) were used with a varying number of
additional local wells (+1, +2 or +3), drilled into the 5/42 area. In Years 5 to10 for a 3 + 2 wells at the 5/42
storage site the pipeline MAOPs were not exceeded for all the scenarios considered.
Table 5.3: Years 5 to 10 Pressure Profiles (10 MTPA) – Summer Conditions
Composition
Reservoir Pressure
Wells
Pressure (barg)
(barg) Drax AGI Camb. Peak
Elevation
Pump
Suction Pump
Discharge Platform
Full Flow 171 3 + 1 109.7 107.7 90.4 95.0 178.5 159.6
3 + 2 149.0 130.2
3 + 3 131.9 113.0
177 **3 + 1 109.7 107.7 90.4 95.0 183.4 165.3**
3 + 2 154.1 135.4
3 + 3 137.0 118.1
Impurities 171 **3 + 1 110.5 108.4 91.3 95.0 185.2 165.6**
3 + 2 155.5 136.1
3 + 3 138.2 118.7
177 **3 + 1 110.5 108.4 91.3 95.0 190.0 170.5**
3 + 2 160.7 141.3
3 + 3 143.3 123.8
** In these cases the platform control valve was fully open, but with only four wells the offshore pipeline
MAOP of 182 barg was exceeded.
K34: Flow Assurance
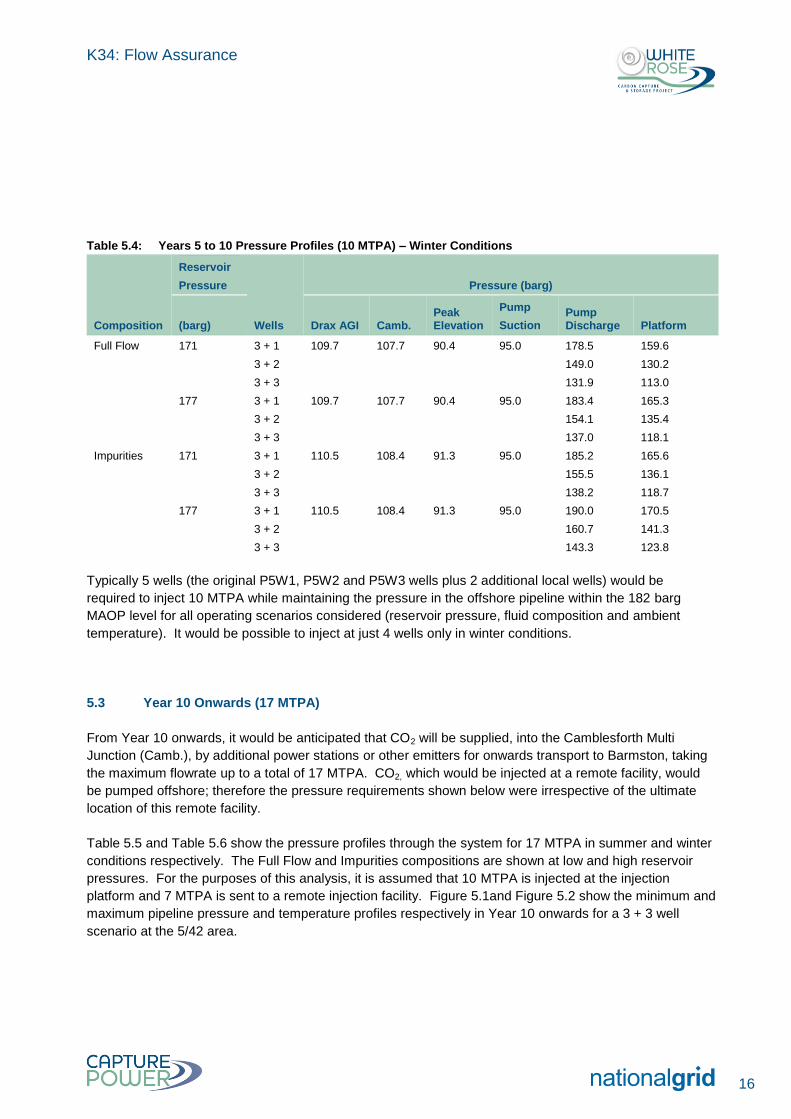
16
Table 5.4: Years 5 to 10 Pressure Profiles (10 MTPA) – Winter Conditions
Composition
Reservoir
Pressure
Wells
Pressure (barg)
(barg) Drax AGI Camb. Peak Elevation
Pump
Suction Pump Discharge Platform
Full Flow 171 3 + 1 109.7 107.7 90.4 95.0 178.5 159.6
3 + 2 149.0 130.2
3 + 3 131.9 113.0
177 3 + 1 109.7 107.7 90.4 95.0 183.4 165.3
3 + 2 154.1 135.4
3 + 3 137.0 118.1
Impurities 171 3 + 1 110.5 108.4 91.3 95.0 185.2 165.6
3 + 2 155.5 136.1
3 + 3 138.2 118.7
177 3 + 1 110.5 108.4 91.3 95.0 190.0 170.5
3 + 2 160.7 141.3
3 + 3 143.3 123.8
Typically 5 wells (the original P5W1, P5W2 and P5W3 wells plus 2 additional local wells) would be
required to inject 10 MTPA while maintaining the pressure in the offshore pipeline within the 182 barg
MAOP level for all operating scenarios considered (reservoir pressure, fluid composition and ambient
temperature). It would be possible to inject at just 4 wells only in winter conditions.
5.3 Year 10 Onwards (17 MTPA)
From Year 10 onwards, it would be anticipated that CO2 will be supplied, into the Camblesforth Multi
Junction (Camb.), by additional power stations or other emitters for onwards transport to Barmston, taking
the maximum flowrate up to a total of 17 MTPA. CO2, which would be injected at a remote facility, would
be pumped offshore; therefore the pressure requirements shown below were irrespective of the ultimate
location of this remote facility.
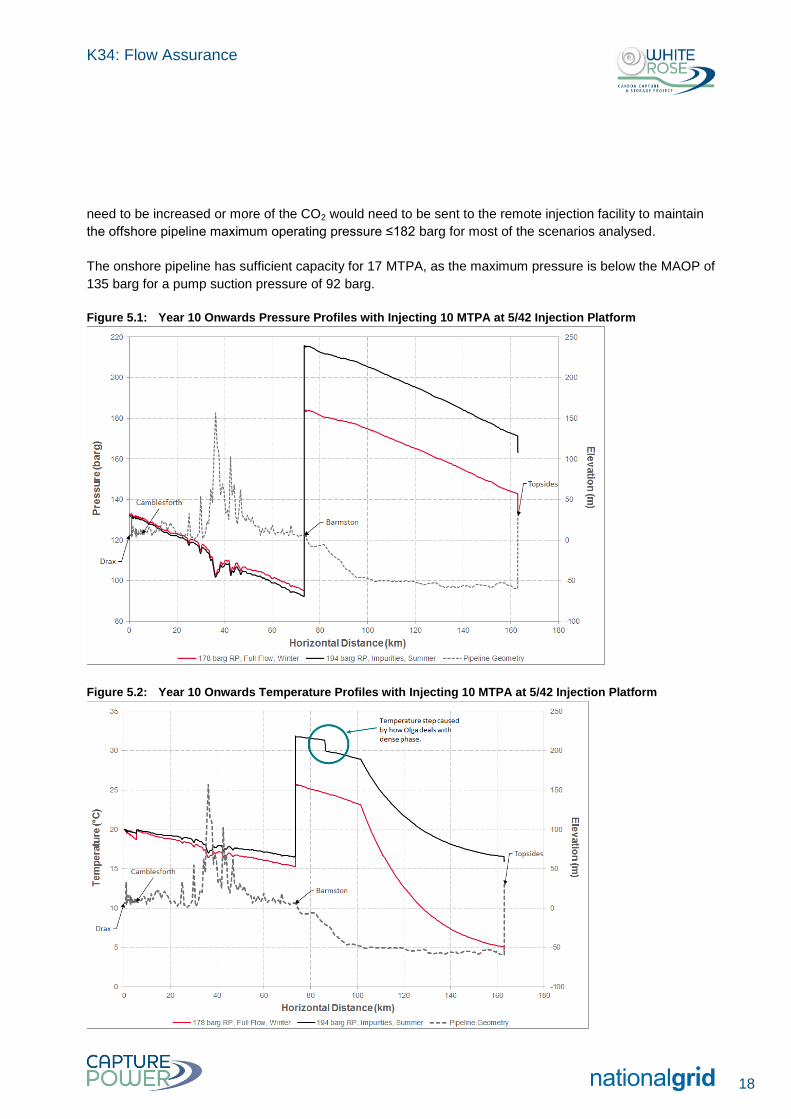
Table 5.5 and Table 5.6 show the pressure profiles through the system for 17 MTPA in summer and winter
conditions respectively. The Full Flow and Impurities compositions are shown at low and high reservoir
pressures. For the purposes of this analysis, it is assumed that 10 MTPA is injected at the injection
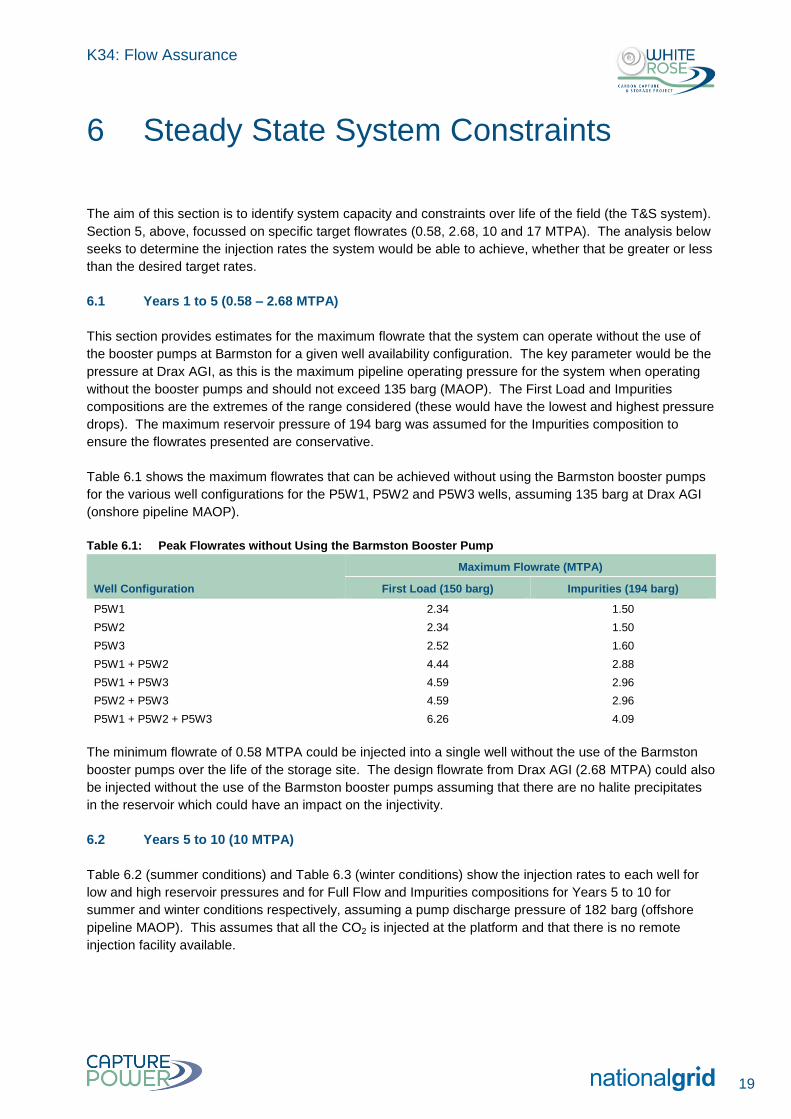
platform and 7 MTPA is sent to a remote injection facility. Figure 5.1and Figure 5.2 show the minimum and
maximum pipeline pressure and temperature profiles respectively in Year 10 onwards for a 3 + 3 well
scenario at the 5/42 area.
K34: Flow Assurance
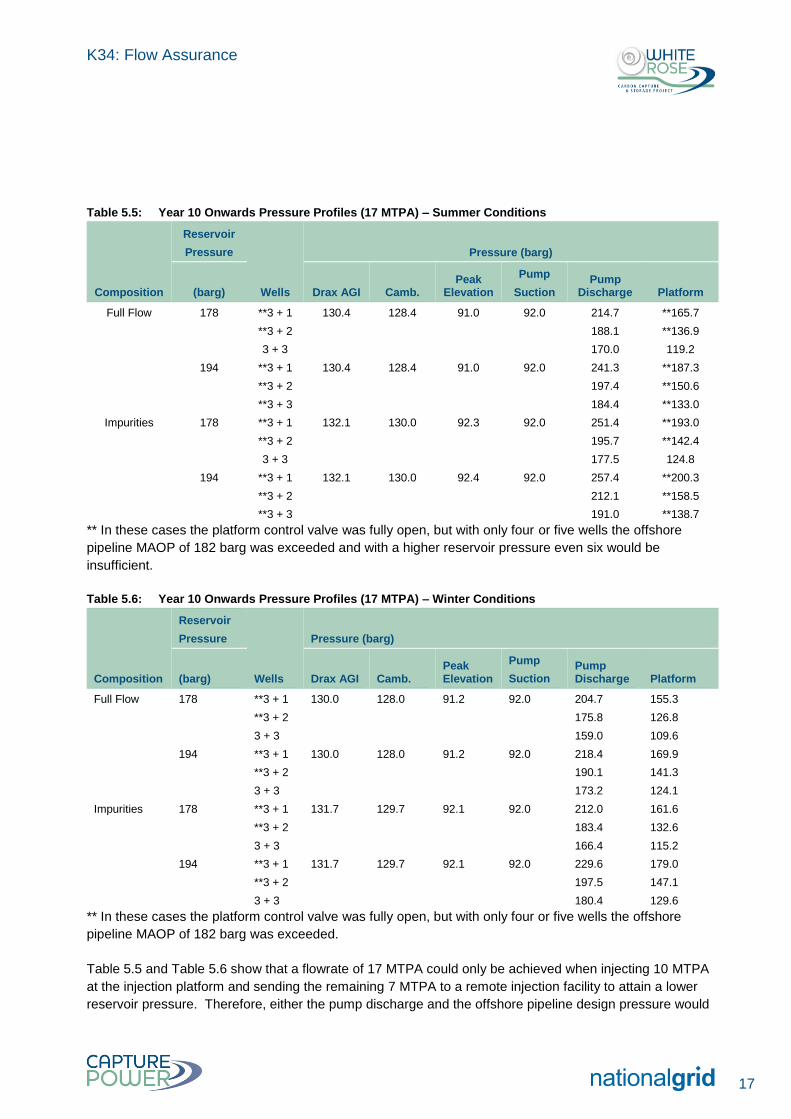
17
Table 5.5: Year 10 Onwards Pressure Profiles (17 MTPA) – Summer Conditions
Composition
Reservoir
Pressure
Wells
Pressure (barg)
(barg) Drax AGI Camb. Peak
Elevation
Pump
Suction Pump
Discharge Platform
Full Flow 178 **3 + 1 130.4 128.4 91.0 92.0 214.7 **165.7
**3 + 2 188.1 **136.9
3 + 3 170.0 119.2
194 **3 + 1 130.4 128.4 91.0 92.0 241.3 **187.3
**3 + 2 197.4 **150.6
**3 + 3 184.4 **133.0
Impurities 178 **3 + 1 132.1 130.0 92.3 92.0 251.4 **193.0
**3 + 2 195.7 **142.4
3 + 3 177.5 124.8
194 **3 + 1 132.1 130.0 92.4 92.0 257.4 **200.3
**3 + 2 212.1 **158.5
**3 + 3 191.0 **138.7
** In these cases the platform control valve was fully open, but with only four or five wells the offshore
pipeline MAOP of 182 barg was exceeded and with a higher reservoir pressure even six would be
insufficient.
Table 5.6: Year 10 Onwards Pressure Profiles (17 MTPA) – Winter Conditions
Composition
Reservoir
Pressure
Wells
Pressure (barg)
(barg) Drax AGI Camb. Peak Elevation
Pump
Suction Pump Discharge Platform
Full Flow 178 **3 + 1 130.0 128.0 91.2 92.0 204.7 155.3
**3 + 2 175.8 126.8
3 + 3 159.0 109.6
194 **3 + 1 130.0 128.0 91.2 92.0 218.4 169.9
**3 + 2 190.1 141.3
3 + 3 173.2 124.1
Impurities 178 **3 + 1 131.7 129.7 92.1 92.0 212.0 161.6
**3 + 2 183.4 132.6
3 + 3 166.4 115.2
194 **3 + 1 131.7 129.7 92.1 92.0 229.6 179.0
**3 + 2 197.5 147.1
3 + 3 180.4 129.6
** In these cases the platform control valve was fully open, but with only four or five wells the offshore
pipeline MAOP of 182 barg was exceeded.
Table 5.5 and Table 5.6 show that a flowrate of 17 MTPA could only be achieved when injecting 10 MTPA
at the injection platform and sending the remaining 7 MTPA to a remote injection facility to attain a lower
reservoir pressure. Therefore, either the pump discharge and the offshore pipeline design pressure would
K34: Flow Assurance
18
need to be increased or more of the CO2 would need to be sent to the remote injection facility to maintain
the offshore pipeline maximum operating pressure ≤182 barg for most of the scenarios analysed.
The onshore pipeline has sufficient capacity for 17 MTPA, as the maximum pressure is below the MAOP of
135 barg for a pump suction pressure of 92 barg.
Figure 5.1: Year 10 Onwards Pressure Profiles with Injecting 10 MTPA at 5/42 Injection Platform
Figure 5.2: Year 10 Onwards Temperature Profiles with Injecting 10 MTPA at 5/42 Injection Platform
K34: Flow Assurance
19
The aim of this section is to identify system capacity and constraints over life of the field (the T&S system).
Section 5, above, focussed on specific target flowrates (0.58, 2.68, 10 and 17 MTPA). The analysis below
seeks to determine the injection rates the system would be able to achieve, whether that be greater or less
than the desired target rates.
6.1 Years 1 to 5 (0.58 – 2.68 MTPA)
This section provides estimates for the maximum flowrate that the system can operate without the use of
the booster pumps at Barmston for a given well availability configuration. The key parameter would be the
pressure at Drax AGI, as this is the maximum pipeline operating pressure for the system when operating
without the booster pumps and should not exceed 135 barg (MAOP). The First Load and Impurities
compositions are the extremes of the range considered (these would have the lowest and highest pressure
drops). The maximum reservoir pressure of 194 barg was assumed for the Impurities composition to
ensure the flowrates presented are conservative.
Table 6.1 shows the maximum flowrates that can be achieved without using the Barmston booster pumps
for the various well configurations for the P5W1, P5W2 and P5W3 wells, assuming 135 barg at Drax AGI
(onshore pipeline MAOP).
Table 6.1: Peak Flowrates without Using the Barmston Booster Pump
Well Configuration
Maximum Flowrate (MTPA)
First Load (150 barg) Impurities (194 barg)
P5W1 2.34 1.50
P5W2 2.34 1.50
P5W3 2.52 1.60
P5W1 + P5W2 4.44 2.88
P5W1 + P5W3 4.59 2.96
P5W2 + P5W3 4.59 2.96
P5W1 + P5W2 + P5W3 6.26 4.09
The minimum flowrate of 0.58 MTPA could be injected into a single well without the use of the Barmston
booster pumps over the life of the storage site. The design flowrate from Drax AGI (2.68 MTPA) could also
be injected without the use of the Barmston booster pumps assuming that there are no halite precipitates
in the reservoir which could have an impact on the injectivity.
6.2 Years 5 to 10 (10 MTPA)
Table 6.2 (summer conditions) and Table 6.3 (winter conditions) show the injection rates to each well for
low and high reservoir pressures and for Full Flow and Impurities compositions for Years 5 to 10 for
summer and winter conditions respectively, assuming a pump discharge pressure of 182 barg (offshore
pipeline MAOP). This assumes that all the CO2 is injected at the platform and that there is no remote
injection facility available.
6 Steady State System Constraints
K34: Flow Assurance
20
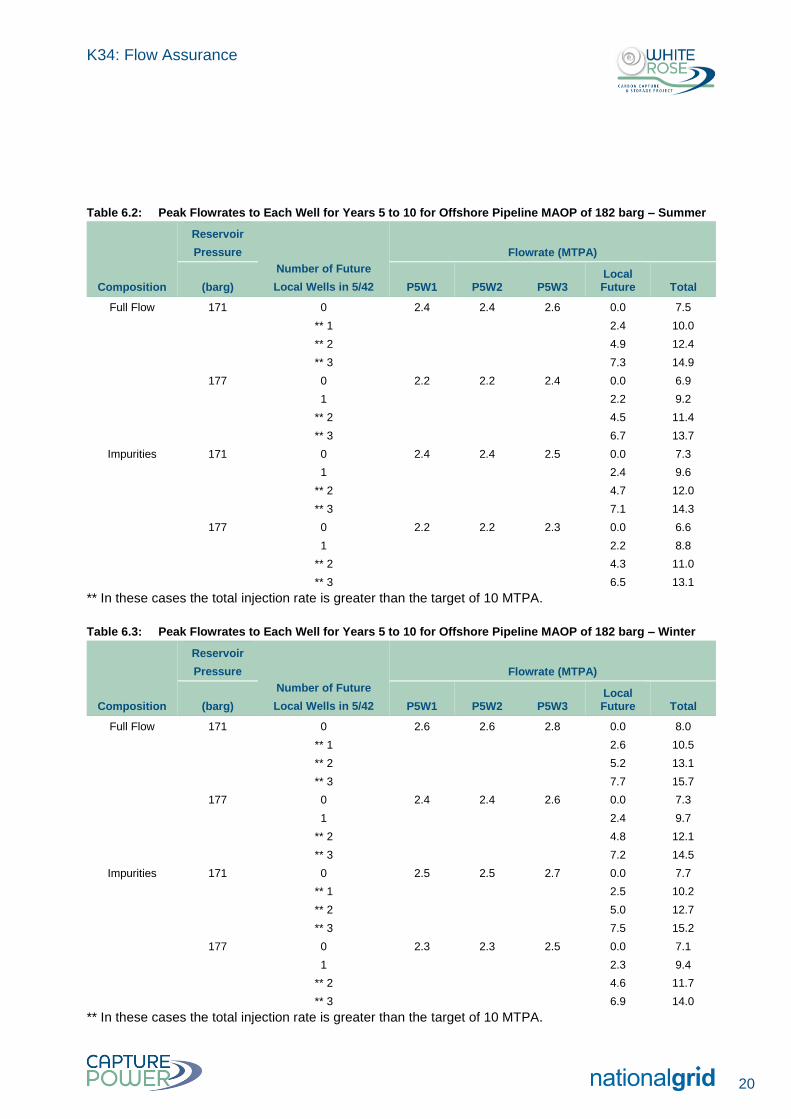
Table 6.2: Peak Flowrates to Each Well for Years 5 to 10 for Offshore Pipeline MAOP of 182 barg – Summer
Composition
Reservoir
Pressure
Number of Future
Local Wells in 5/42
Flowrate (MTPA)
(barg) P5W1 P5W2 P5W3 Local Future Total
Full Flow 171 0 2.4 2.4 2.6 0.0 7.5
** 1 2.4 10.0
** 2 4.9 12.4
** 3 7.3 14.9
177 0 2.2 2.2 2.4 0.0 6.9
1 2.2 9.2
** 2 4.5 11.4
** 3 6.7 13.7
Impurities 171 0 2.4 2.4 2.5 0.0 7.3
1 2.4 9.6
** 2 4.7 12.0
** 3 7.1 14.3
177 0 2.2 2.2 2.3 0.0 6.6
1 2.2 8.8
** 2 4.3 11.0
** 3 6.5 13.1
** In these cases the total injection rate is greater than the target of 10 MTPA.
Table 6.3: Peak Flowrates to Each Well for Years 5 to 10 for Offshore Pipeline MAOP of 182 barg – Winter
Composition
Reservoir
Pressure
Number of Future
Local Wells in 5/42
Flowrate (MTPA)
(barg) P5W1 P5W2 P5W3 Local Future Total
Full Flow 171 0 2.6 2.6 2.8 0.0 8.0
** 1 2.6 10.5
** 2 5.2 13.1
** 3 7.7 15.7
177 0 2.4 2.4 2.6 0.0 7.3
1 2.4 9.7
** 2 4.8 12.1
** 3 7.2 14.5
Impurities 171 0 2.5 2.5 2.7 0.0 7.7
** 1 2.5 10.2
** 2 5.0 12.7
** 3 7.5 15.2
177 0 2.3 2.3 2.5 0.0 7.1
1 2.3 9.4
** 2 4.6 11.7
** 3 6.9 14.0
** In these cases the total injection rate is greater than the target of 10 MTPA.
K34: Flow Assurance
21
A flowrate of 10 MTPA could be injected into the 5/42 block provided that at least 5 wells are available,
irrespective of ambient conditions and fluid composition. As reservoir pressure increases (a greater push-
back), the peak injection flowrate would decrease, as should be expected, and higher levels of impurities in
the fluid would reduce the peak injection rates.
The flowrates injected into the local future wells (in the 5/42 block) would be a function of the well tubing
geometry assumed (for this analysis it was assumed the future wells are the same as well P5W2 as this is
the most onerous well). Based on the difference in flowrates to the P5W1 and P5W3 wells, it is reasonable
to assume the flowrate could increase by up to 0.2 MTPA if a more favourable well geometry is used for
the future wells in the 5/42 block.
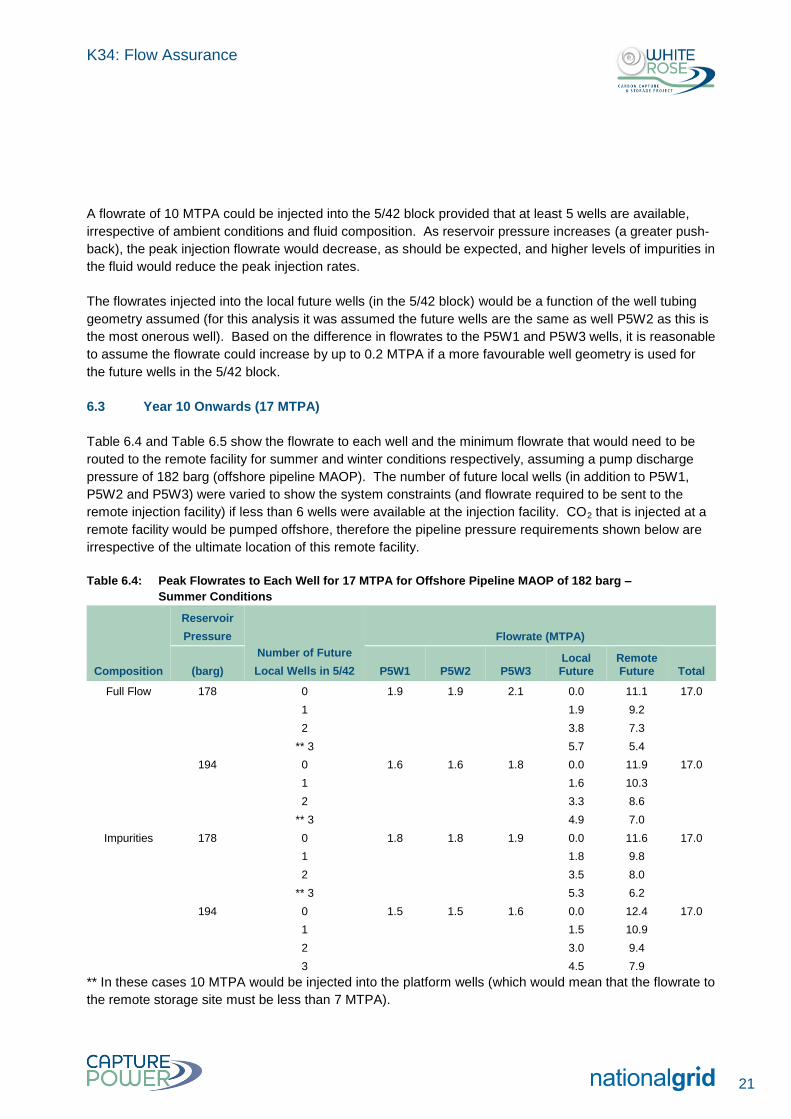
6.3 Year 10 Onwards (17 MTPA)
Table 6.4 and Table 6.5 show the flowrate to each well and the minimum flowrate that would need to be
routed to the remote facility for summer and winter conditions respectively, assuming a pump discharge
pressure of 182 barg (offshore pipeline MAOP). The number of future local wells (in addition to P5W1,
P5W2 and P5W3) were varied to show the system constraints (and flowrate required to be sent to the
remote injection facility) if less than 6 wells were available at the injection facility. CO2 that is injected at a
remote facility would be pumped offshore, therefore the pipeline pressure requirements shown below are
irrespective of the ultimate location of this remote facility.
Table 6.4: Peak Flowrates to Each Well for 17 MTPA for Offshore Pipeline MAOP of 182 barg –
Summer Conditions
Composition
Reservoir
Pressure
Number of Future
Local Wells in 5/42
Flowrate (MTPA)
(barg) P5W1 P5W2 P5W3 Local Future
Remote Future Total
Full Flow 178 0 1.9 1.9 2.1 0.0 11.1 17.0
1 1.9 9.2
2 3.8 7.3
** 3 5.7 5.4
194 0 1.6 1.6 1.8 0.0 11.9 17.0
1 1.6 10.3
2 3.3 8.6
** 3 4.9 7.0
Impurities 178 0 1.8 1.8 1.9 0.0 11.6 17.0
1 1.8 9.8
2 3.5 8.0
** 3 5.3 6.2
194 0 1.5 1.5 1.6 0.0 12.4 17.0
1 1.5 10.9
2 3.0 9.4
3 4.5 7.9
** In these cases 10 MTPA would be injected into the platform wells (which would mean that the flowrate to
the remote storage site must be less than 7 MTPA).
K34: Flow Assurance
22
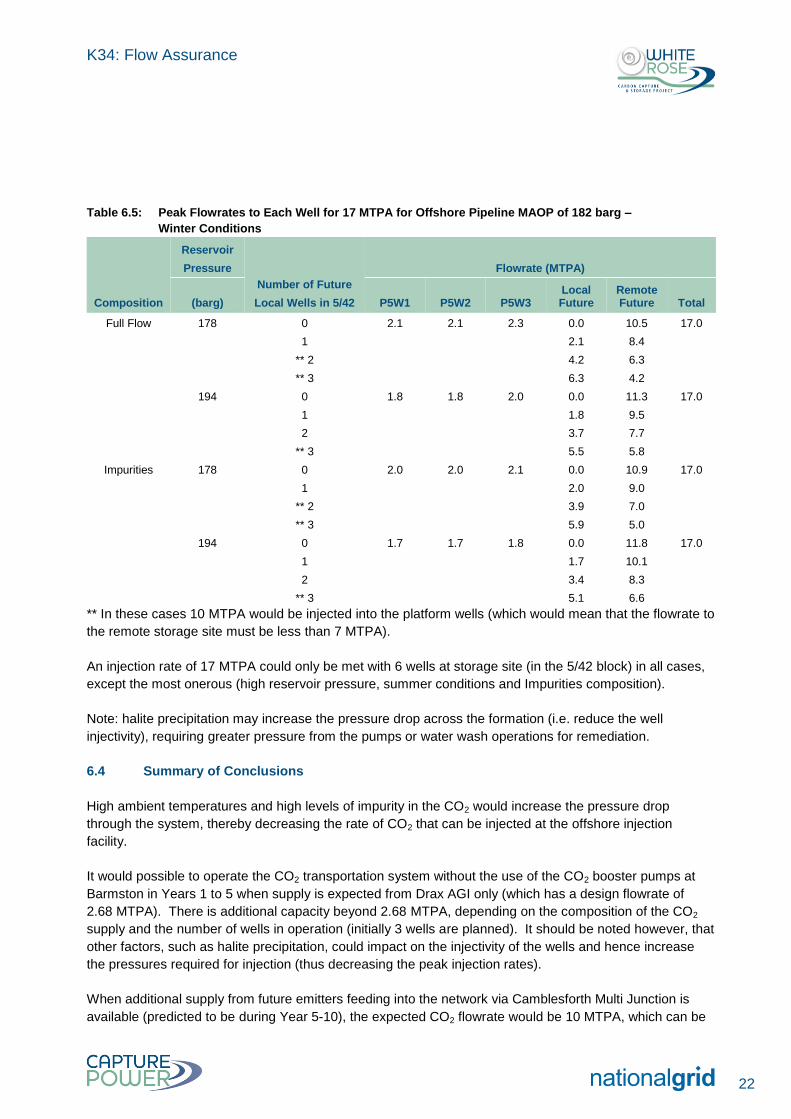
Table 6.5: Peak Flowrates to Each Well for 17 MTPA for Offshore Pipeline MAOP of 182 barg –
Winter Conditions
Composition
Reservoir
Pressure
Number of Future
Local Wells in 5/42
Flowrate (MTPA)
(barg) P5W1 P5W2 P5W3 Local Future
Remote Future Total
Full Flow 178 0 2.1 2.1 2.3 0.0 10.5 17.0
1 2.1 8.4
** 2 4.2 6.3
** 3 6.3 4.2
194 0 1.8 1.8 2.0 0.0 11.3 17.0
1 1.8 9.5
2 3.7 7.7
** 3 5.5 5.8
Impurities 178 0 2.0 2.0 2.1 0.0 10.9 17.0
1 2.0 9.0
** 2 3.9 7.0
** 3 5.9 5.0
194 0 1.7 1.7 1.8 0.0 11.8 17.0
1 1.7 10.1
2 3.4 8.3
** 3 5.1 6.6
** In these cases 10 MTPA would be injected into the platform wells (which would mean that the flowrate to
the remote storage site must be less than 7 MTPA).
An injection rate of 17 MTPA could only be met with 6 wells at storage site (in the 5/42 block) in all cases,
except the most onerous (high reservoir pressure, summer conditions and Impurities composition).
Note: halite precipitation may increase the pressure drop across the formation (i.e. reduce the well
injectivity), requiring greater pressure from the pumps or water wash operations for remediation.
6.4 Summary of Conclusions
High ambient temperatures and high levels of impurity in the CO2 would increase the pressure drop
through the system, thereby decreasing the rate of CO2 that can be injected at the offshore injection
facility.
It would possible to operate the CO2 transportation system without the use of the CO2 booster pumps at
Barmston in Years 1 to 5 when supply is expected from Drax AGI only (which has a design flowrate of
2.68 MTPA). There is additional capacity beyond 2.68 MTPA, depending on the composition of the CO2
supply and the number of wells in operation (initially 3 wells are planned). It should be noted however, that
other factors, such as halite precipitation, could impact on the injectivity of the wells and hence increase
the pressures required for injection (thus decreasing the peak injection rates).
When additional supply from future emitters feeding into the network via Camblesforth Multi Junction is
available (predicted to be during Year 5-10), the expected CO2 flowrate would be 10 MTPA, which can be
K34: Flow Assurance
23
transported provided at least 5 wells were available for injection. The CO2 booster pumps would be
required at this stage to allow the system to maintain this flow without the pressure in the onshore pipeline
being pushed above the MAOP of 135 barg.
From Year 10 onwards, it is predicted that CO2 would be supplied by additional sources up to a total of
17 MTPA and a significant proportion of the CO2 would need to be routed via offshore pumping to a remote
injection facility (location etc. to be determined). As the reservoir pressure increases following prolonged
CO2 injection, the pressure required to transport the CO2 and maintain injection rates of 10 MTPA at the
injection platform would need to exceed the offshore pipeline MAOP of 182 barg for all cases except for
low reservoir pressure and/or winter conditions when 6 wells are available for injection. The injection rate
at the platform would be limited to 9.1 – 12.8 MTPA, depending on the conditions (composition, reservoir
pressure and ambient conditions) with the remainder being pumped to the remote facility.
The pressure control scheme for the CO2 transportation system would be two-fold:
pressure controlled at the platform for low flow operation (typically when the CO2 booster pumps were
not in operation, but could conceivably be used with the pumps if desired); and
pressure controlled at the booster pump suction to ensure the pressure in the onshore pipeline does
not transgress the pressure constraints on the system.
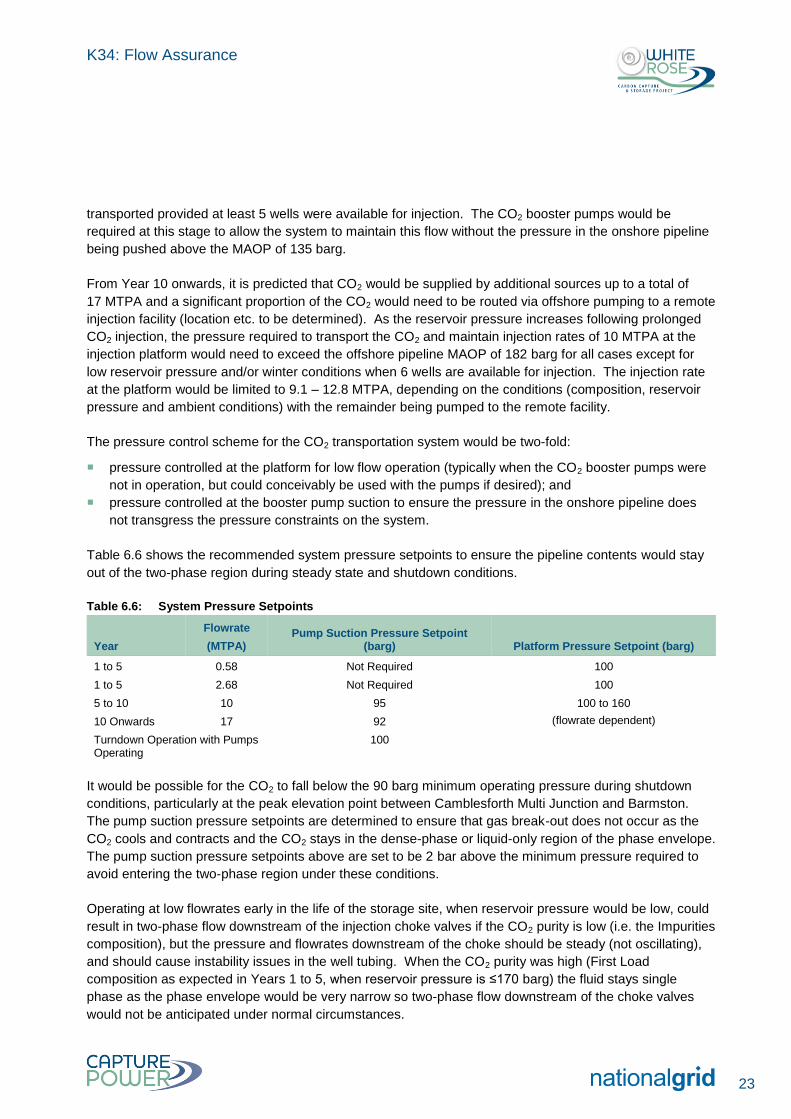
Table 6.6 shows the recommended system pressure setpoints to ensure the pipeline contents would stay
out of the two-phase region during steady state and shutdown conditions.
Table 6.6: System Pressure Setpoints
Year
Flowrate
(MTPA) Pump Suction Pressure Setpoint
(barg) Platform Pressure Setpoint (barg)
1 to 5 0.58 Not Required 100
1 to 5 2.68 Not Required 100
5 to 10 10 95 100 to 160
(flowrate dependent) 10 Onwards 17 92
Turndown Operation with Pumps Operating
100
It would be possible for the CO2 to fall below the 90 barg minimum operating pressure during shutdown
conditions, particularly at the peak elevation point between Camblesforth Multi Junction and Barmston.
The pump suction pressure setpoints are determined to ensure that gas break-out does not occur as the
CO2 cools and contracts and the CO2 stays in the dense-phase or liquid-only region of the phase envelope.
The pump suction pressure setpoints above are set to be 2 bar above the minimum pressure required to
avoid entering the two-phase region under these conditions.
Operating at low flowrates early in the life of the storage site, when reservoir pressure would be low, could
result in two-phase flow downstream of the injection choke valves if the CO2 purity is low (i.e. the Impurities
composition), but the pressure and flowrates downstream of the choke should be steady (not oscillating),
and should cause instability issues in the well tubing. When the CO2 purity was high (First Load
composition as expected in Years 1 to 5, when reservoir pressure is ≤170 barg) the fluid stays single
phase as the phase envelope would be very narrow so two-phase flow downstream of the choke valves
would not be anticipated under normal circumstances.
K34: Flow Assurance
24
The flow assurance model was used to simulate steady state conditions in order to validate the operating
conditions of the system and to verify the capacity that could be supported in the pipeline and wells. The
steady state results provided the input data which was used as part of the transient analysis.
The flow assurance model was also be used as part of the transient analysis which covered various
scenarios that were considered likely to occur during operation of the CCS system. The results from the
analysis governed the design conditions and the requirements for the control philosophies.
7.1 Initial Start-up
The purpose of this analysis is to determine the following:
time required for displacing the air left in the pipeline following pre-commissioning activities;
time required for filling each section of the onshore and offshore pipelines with CO₂, starting from an
air-filled system;
the Drax to Camblesforth section was pressurised to 50 barg; and
The remainder of the pipeline was pressurised to 25 barg.
The pipeline was set-up with air using the initial conditions functionality in OLGA. CO₂ was then introduced
at Drax at the minimum and maximum flowrates. With the block valves at each block valve station closed,
each section was pressurised to 65 barg before bypassing (and ultimately opening) the block valves to
pressurise the downstream section.
The air pressure in the CO₂ transportation system (i.e. onshore and offshore pipelines) prior to initial start-
up should be minimised. Therefore, the system was filled to 25 barg with air and the isolation block valves
closed throughout the system. The Drax to Camblesforth pipeline was then pressurised to 55 barg with air
to avoid operating with 2-phase CO2 when introducing CO₂ into the pipeline. As the First Load CO₂ is
almost pure, the phase envelope is very narrow (as shown in Figure 4.1) and 55 barg is approximately
15 bar above the bubble point at 4°C (minimum ambient buried pipeline temperature), and above the
phase envelope for maximum ambient conditions. The risk of operating in the 2-phase region during
commissioning is therefore low.
The block valves were controlled to open once the pressure upstream of them had reached 65 barg, so
each isolated section was pressurised in turn.
7.1.1 Initial Start-up without PIG Operations
7.1.1.1 Maximum Flowrate from Drax (2.68 MTPA)
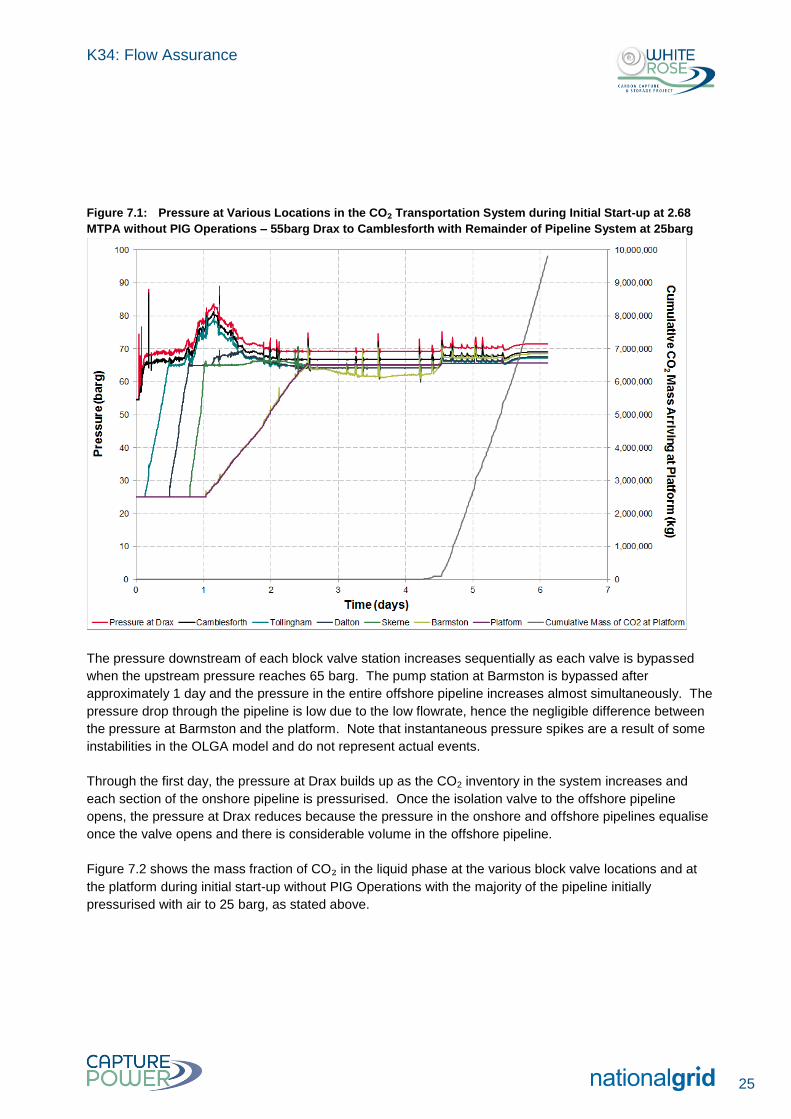
Figure 7.1: Pressure at Various Locations in the CO₂ Transportation System during Initial Start-up at
2.68 MTPA without PIG Operations – 55barg Drax to Camblesforth with Remainder of Pipeline System at
25barg shows the pressure at the various block valve locations and at the platform during initial start-up at
2.68 MTPA, without PIG operations, with the majority of the pipeline initially pressurised with air to 25 barg
and the Drax to Camblesforth section pressurised to 55 barg, as stated above. The mass flowrate of CO₂
arriving at the platform is also shown. Note that CO₂ is introduced into the pipeline at simulation time = 1
hour.
7 Pipeline Transient Scenarios
K34: Flow Assurance
25
Figure 7.1: Pressure at Various Locations in the CO₂ Transportation System during Initial Start-up at 2.68
MTPA without PIG Operations – 55barg Drax to Camblesforth with Remainder of Pipeline System at 25barg
The pressure downstream of each block valve station increases sequentially as each valve is bypassed
when the upstream pressure reaches 65 barg. The pump station at Barmston is bypassed after
approximately 1 day and the pressure in the entire offshore pipeline increases almost simultaneously. The
pressure drop through the pipeline is low due to the low flowrate, hence the negligible difference between
the pressure at Barmston and the platform. Note that instantaneous pressure spikes are a result of some
instabilities in the OLGA model and do not represent actual events.
Through the first day, the pressure at Drax builds up as the CO2 inventory in the system increases and
each section of the onshore pipeline is pressurised. Once the isolation valve to the offshore pipeline
opens, the pressure at Drax reduces because the pressure in the onshore and offshore pipelines equalise
once the valve opens and there is considerable volume in the offshore pipeline.
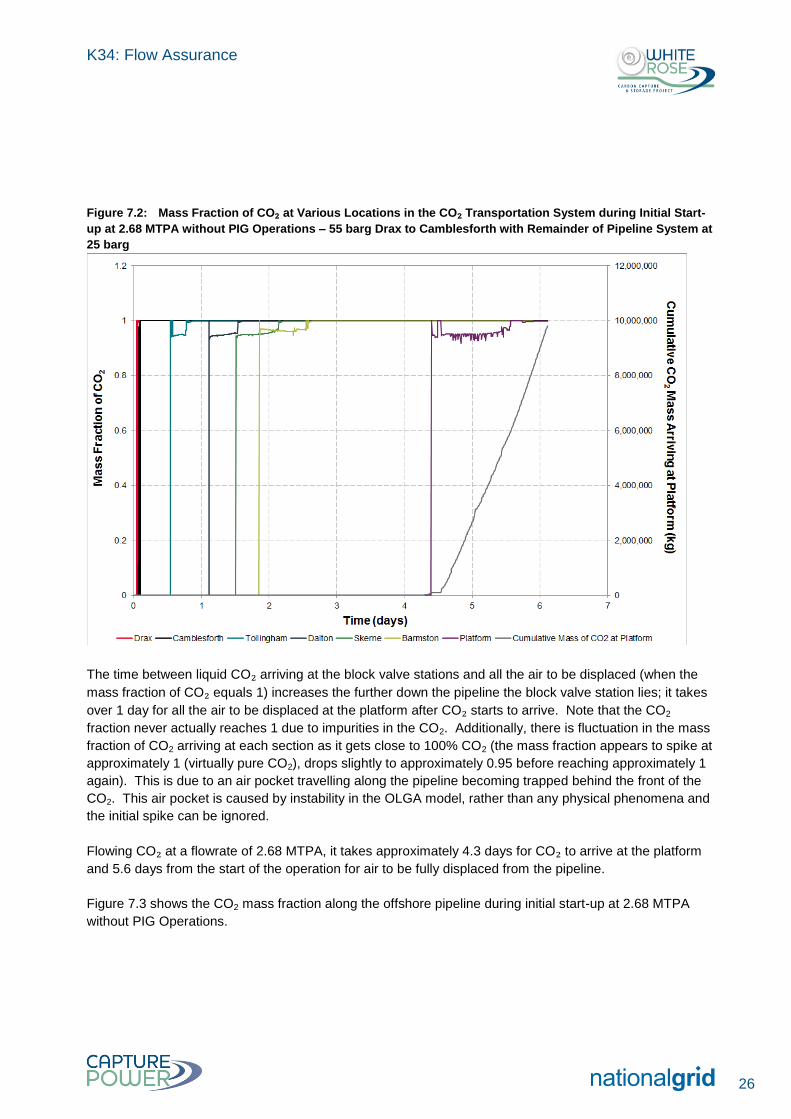
Figure 7.2 shows the mass fraction of CO₂ in the liquid phase at the various block valve locations and at
the platform during initial start-up without PIG Operations with the majority of the pipeline initially
pressurised with air to 25 barg, as stated above.
K34: Flow Assurance
26
Figure 7.2: Mass Fraction of CO₂ at Various Locations in the CO₂ Transportation System during Initial Start-
up at 2.68 MTPA without PIG Operations – 55 barg Drax to Camblesforth with Remainder of Pipeline System at
25 barg
The time between liquid CO₂ arriving at the block valve stations and all the air to be displaced (when the
mass fraction of CO₂ equals 1) increases the further down the pipeline the block valve station lies; it takes
over 1 day for all the air to be displaced at the platform after CO₂ starts to arrive. Note that the CO2
fraction never actually reaches 1 due to impurities in the CO2. Additionally, there is fluctuation in the mass
fraction of CO2 arriving at each section as it gets close to 100% CO2 (the mass fraction appears to spike at
approximately 1 (virtually pure CO2), drops slightly to approximately 0.95 before reaching approximately 1
again). This is due to an air pocket travelling along the pipeline becoming trapped behind the front of the
CO2. This air pocket is caused by instability in the OLGA model, rather than any physical phenomena and
the initial spike can be ignored.
Flowing CO₂ at a flowrate of 2.68 MTPA, it takes approximately 4.3 days for CO₂ to arrive at the platform
and 5.6 days from the start of the operation for air to be fully displaced from the pipeline.
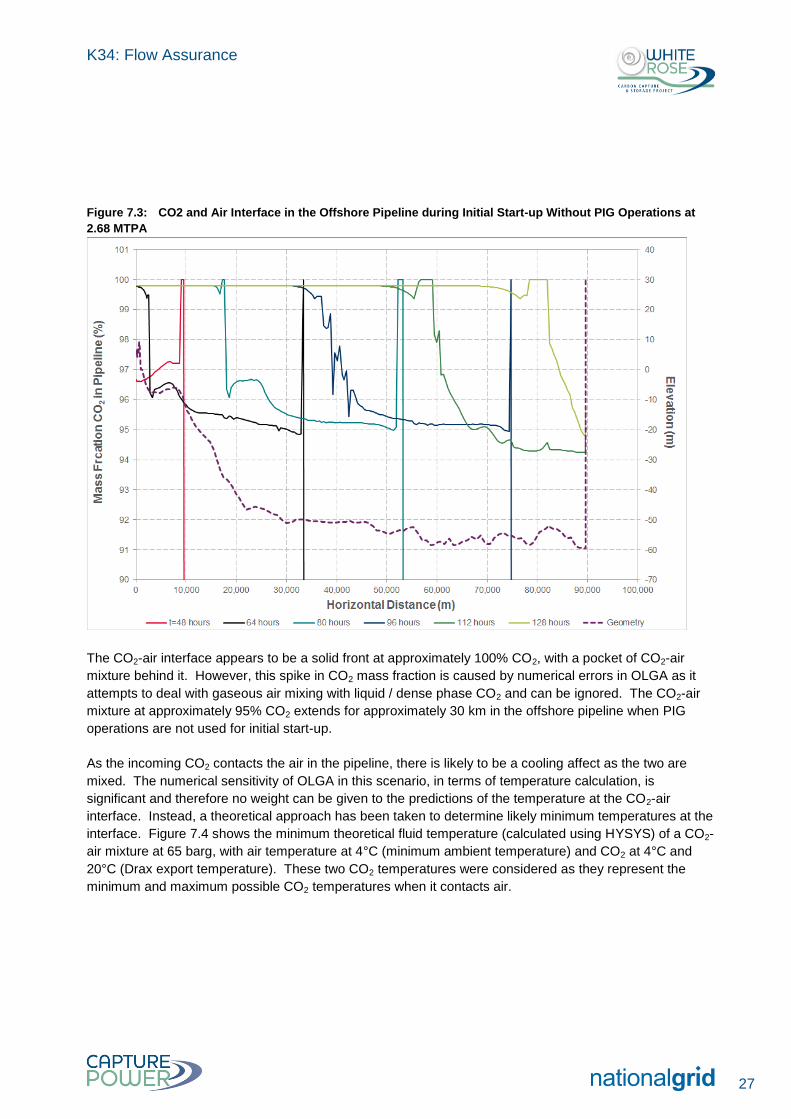
Figure 7.3 shows the CO2 mass fraction along the offshore pipeline during initial start-up at 2.68 MTPA
without PIG Operations.
K34: Flow Assurance
27
Figure 7.3: CO2 and Air Interface in the Offshore Pipeline during Initial Start-up Without PIG Operations at
2.68 MTPA
The CO2-air interface appears to be a solid front at approximately 100% CO2, with a pocket of CO2-air
mixture behind it. However, this spike in CO2 mass fraction is caused by numerical errors in OLGA as it
attempts to deal with gaseous air mixing with liquid / dense phase CO2 and can be ignored. The CO2-air
mixture at approximately 95% CO2 extends for approximately 30 km in the offshore pipeline when PIG
operations are not used for initial start-up.
As the incoming CO2 contacts the air in the pipeline, there is likely to be a cooling affect as the two are
mixed. The numerical sensitivity of OLGA in this scenario, in terms of temperature calculation, is
significant and therefore no weight can be given to the predictions of the temperature at the CO2-air
interface. Instead, a theoretical approach has been taken to determine likely minimum temperatures at the
interface. Figure 7.4 shows the minimum theoretical fluid temperature (calculated using HYSYS) of a CO2-
air mixture at 65 barg, with air temperature at 4°C (minimum ambient temperature) and CO2 at 4°C and
20°C (Drax export temperature). These two CO2 temperatures were considered as they represent the
minimum and maximum possible CO2 temperatures when it contacts air.
K34: Flow Assurance
28
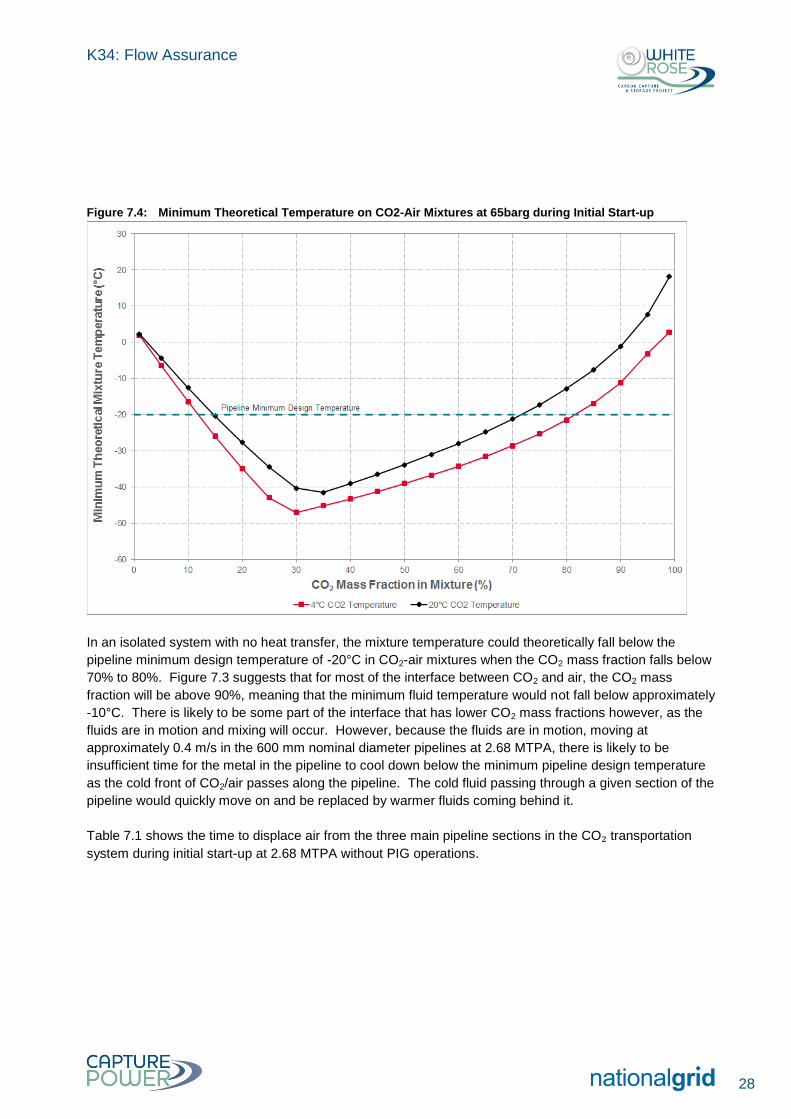
Figure 7.4: Minimum Theoretical Temperature on CO2-Air Mixtures at 65barg during Initial Start-up
In an isolated system with no heat transfer, the mixture temperature could theoretically fall below the
pipeline minimum design temperature of -20°C in CO2-air mixtures when the CO2 mass fraction falls below
70% to 80%. Figure 7.3 suggests that for most of the interface between CO2 and air, the CO2 mass
fraction will be above 90%, meaning that the minimum fluid temperature would not fall below approximately
-10°C. There is likely to be some part of the interface that has lower CO2 mass fractions however, as the
fluids are in motion and mixing will occur. However, because the fluids are in motion, moving at
approximately 0.4 m/s in the 600 mm nominal diameter pipelines at 2.68 MTPA, there is likely to be
insufficient time for the metal in the pipeline to cool down below the minimum pipeline design temperature
as the cold front of CO2/air passes along the pipeline. The cold fluid passing through a given section of the
pipeline would quickly move on and be replaced by warmer fluids coming behind it.
Table 7.1 shows the time to displace air from the three main pipeline sections in the CO₂ transportation
system during initial start-up at 2.68 MTPA without PIG operations.
K34: Flow Assurance
29
Table 7.1: Time to Displace Air during Initial Start-up at 2.68 MTPA without PIG Operations
Section
Time from Start of Commissioning to Fully Displace Air from Section
Time from Arrival of CO₂ at Section Inlet to Fully Displace Air from Section
Total Time Pressure to Fully Stabilise from Start of Commissioning
days days days
Drax to Camblesforth 0.1 0.1 6
Camblesforth to Barmston 2.8 2.0 6
Barmston to Platform 5.6 2.8(1)
6
(1) It takes approximately 1.2 days from the time CO2 first arrives at the platform for air to be displaced fully
from the entire pipeline system.
7.1.1.2 Minimum Flowrate from Drax (0.58 MTPA)
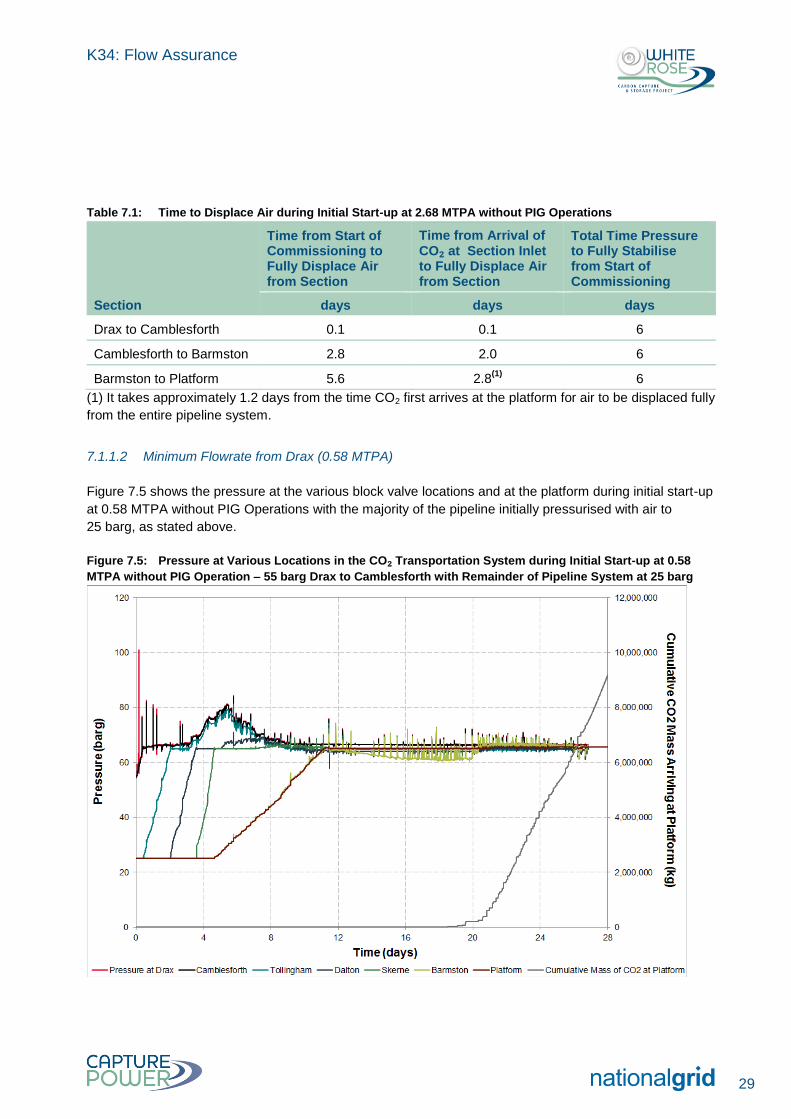
Figure 7.5 shows the pressure at the various block valve locations and at the platform during initial start-up
at 0.58 MTPA without PIG Operations with the majority of the pipeline initially pressurised with air to
25 barg, as stated above.
Figure 7.5: Pressure at Various Locations in the CO₂ Transportation System during Initial Start-up at 0.58
MTPA without PIG Operation – 55 barg Drax to Camblesforth with Remainder of Pipeline System at 25 barg
K34: Flow Assurance
30
The CO2 starts to arrive at the platform after almost 3 weeks and would need to be vented at the platform
for at least a week before full displaced has been achieved – steady operation has not been achieved after
4 weeks.
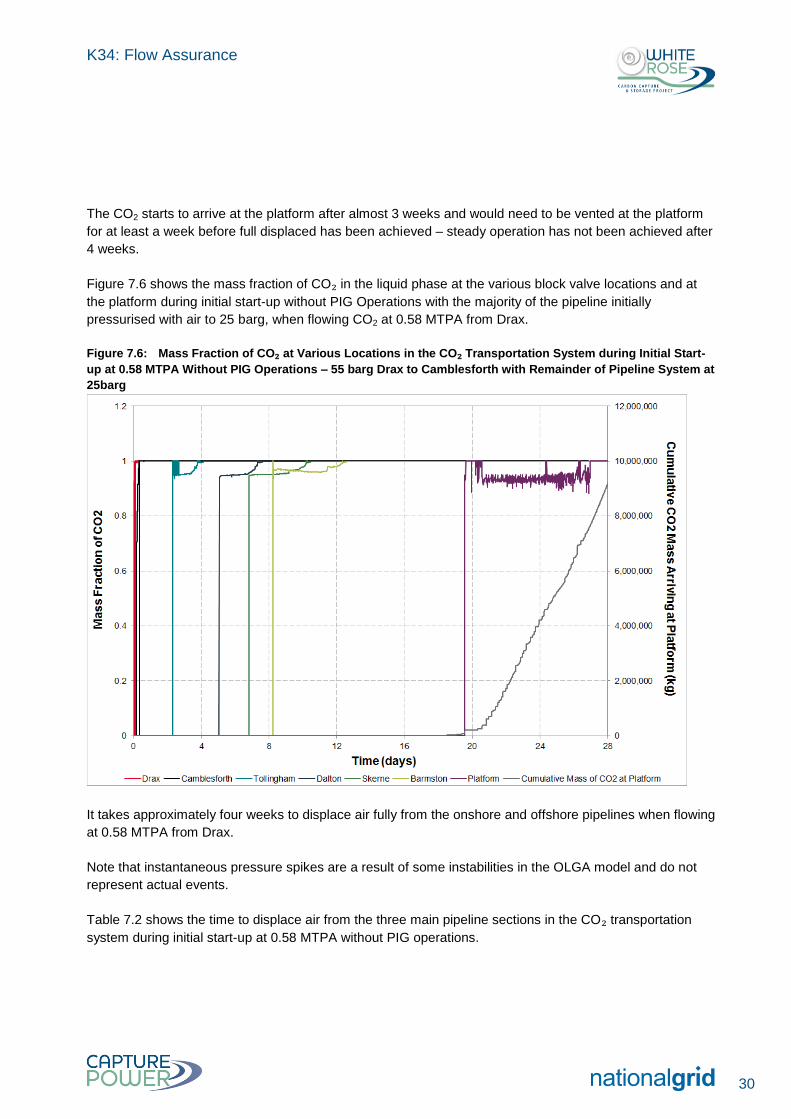
Figure 7.6 shows the mass fraction of CO₂ in the liquid phase at the various block valve locations and at
the platform during initial start-up without PIG Operations with the majority of the pipeline initially
pressurised with air to 25 barg, when flowing CO2 at 0.58 MTPA from Drax.
Figure 7.6: Mass Fraction of CO₂ at Various Locations in the CO₂ Transportation System during Initial Start-
up at 0.58 MTPA Without PIG Operations – 55 barg Drax to Camblesforth with Remainder of Pipeline System at
25barg
It takes approximately four weeks to displace air fully from the onshore and offshore pipelines when flowing
at 0.58 MTPA from Drax.
Note that instantaneous pressure spikes are a result of some instabilities in the OLGA model and do not
represent actual events.
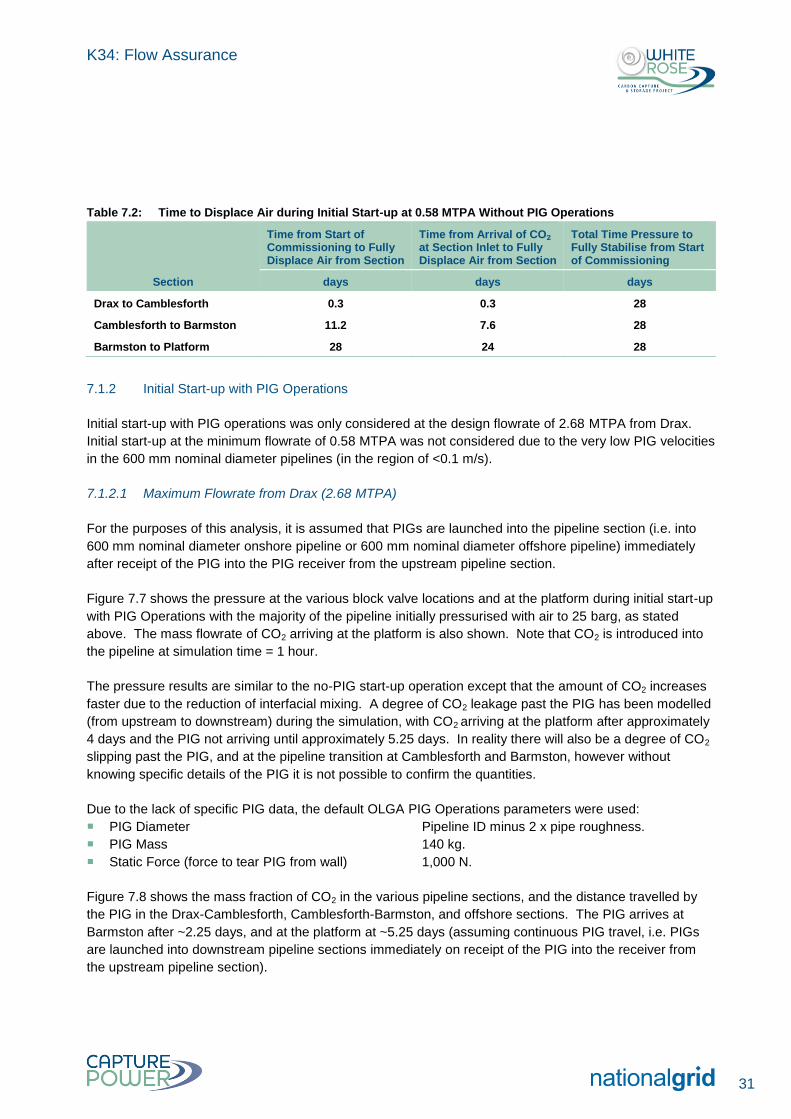
Table 7.2 shows the time to displace air from the three main pipeline sections in the CO₂ transportation
system during initial start-up at 0.58 MTPA without PIG operations.
K34: Flow Assurance
31
Table 7.2: Time to Displace Air during Initial Start-up at 0.58 MTPA Without PIG Operations
Section
Time from Start of Commissioning to Fully Displace Air from Section
Time from Arrival of CO₂ at Section Inlet to Fully Displace Air from Section
Total Time Pressure to Fully Stabilise from Start of Commissioning
days days days
Drax to Camblesforth 0.3 0.3 28
Camblesforth to Barmston 11.2 7.6 28
Barmston to Platform 28 24 28
7.1.2 Initial Start-up with PIG Operations
Initial start-up with PIG operations was only considered at the design flowrate of 2.68 MTPA from Drax.
Initial start-up at the minimum flowrate of 0.58 MTPA was not considered due to the very low PIG velocities
in the 600 mm nominal diameter pipelines (in the region of <0.1 m/s).
7.1.2.1 Maximum Flowrate from Drax (2.68 MTPA)
For the purposes of this analysis, it is assumed that PIGs are launched into the pipeline section (i.e. into
600 mm nominal diameter onshore pipeline or 600 mm nominal diameter offshore pipeline) immediately
after receipt of the PIG into the PIG receiver from the upstream pipeline section.
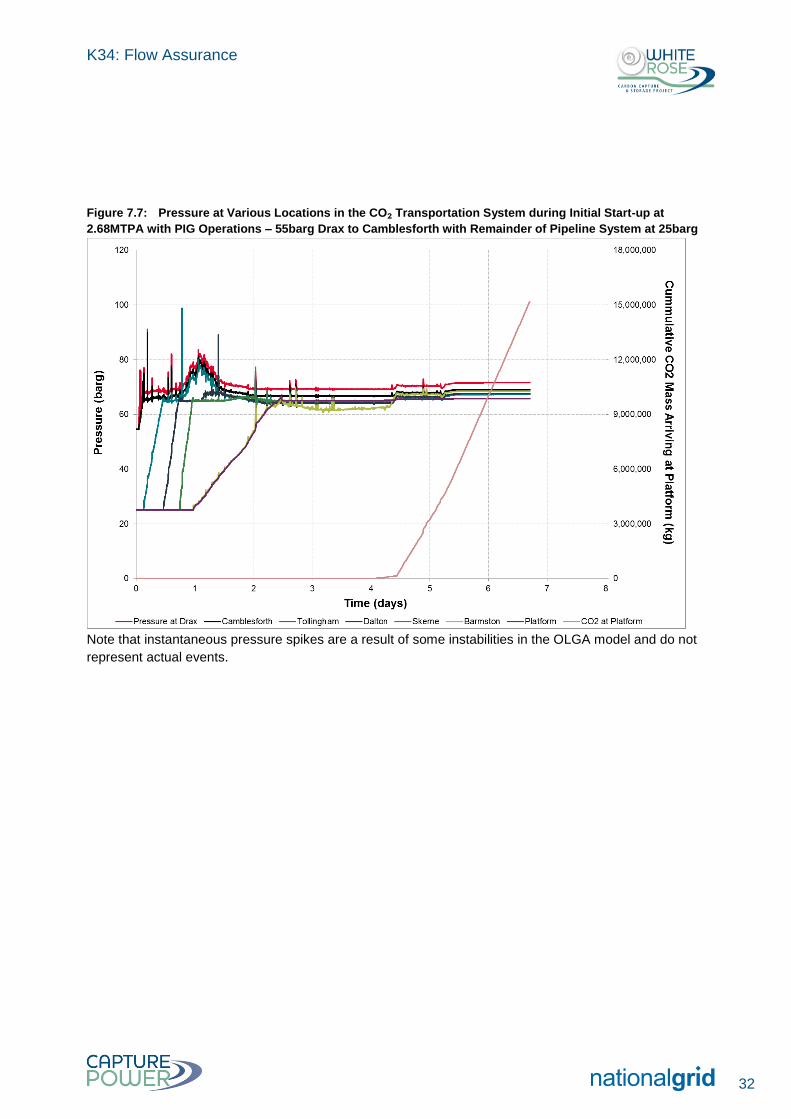
Figure 7.7 shows the pressure at the various block valve locations and at the platform during initial start-up
with PIG Operations with the majority of the pipeline initially pressurised with air to 25 barg, as stated
above. The mass flowrate of CO2 arriving at the platform is also shown. Note that CO2 is introduced into
the pipeline at simulation time = 1 hour.
The pressure results are similar to the no-PIG start-up operation except that the amount of CO2 increases
faster due to the reduction of interfacial mixing. A degree of CO2 leakage past the PIG has been modelled
(from upstream to downstream) during the simulation, with CO2 arriving at the platform after approximately
4 days and the PIG not arriving until approximately 5.25 days. In reality there will also be a degree of CO2
slipping past the PIG, and at the pipeline transition at Camblesforth and Barmston, however without
knowing specific details of the PIG it is not possible to confirm the quantities.
Due to the lack of specific PIG data, the default OLGA PIG Operations parameters were used:
PIG Diameter Pipeline ID minus 2 x pipe roughness.
PIG Mass 140 kg.
Static Force (force to tear PIG from wall) 1,000 N.
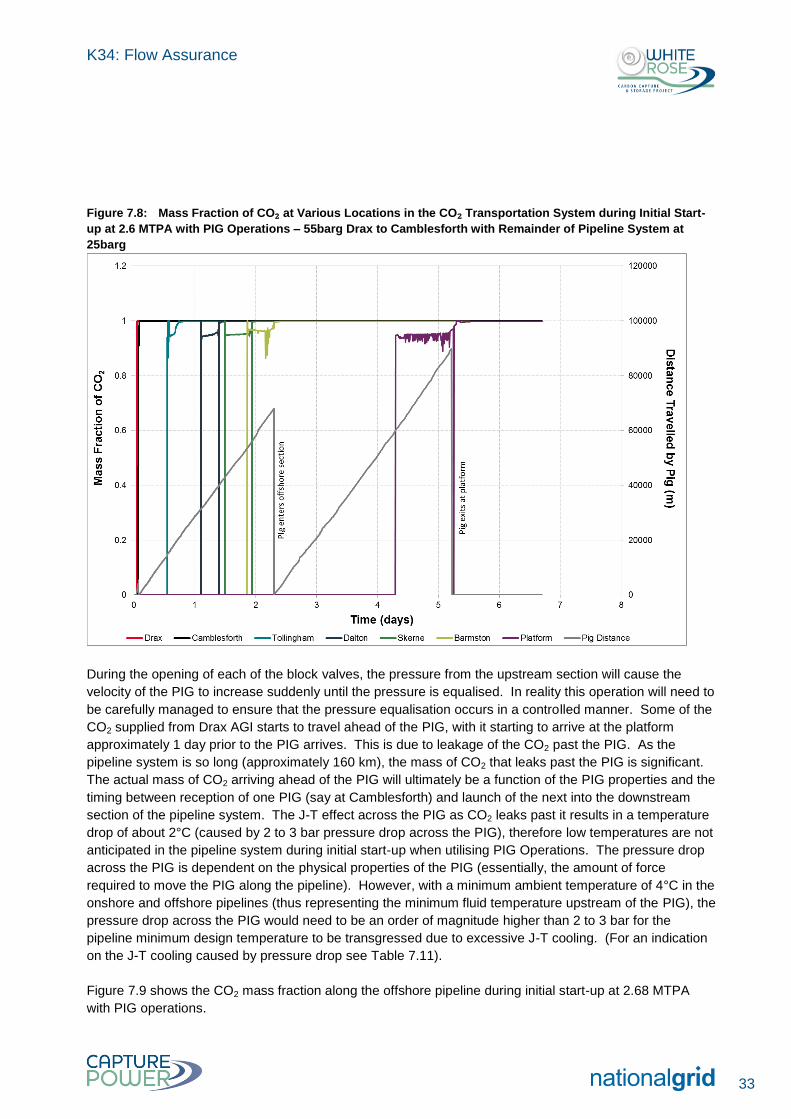
Figure 7.8 shows the mass fraction of CO2 in the various pipeline sections, and the distance travelled by
the PIG in the Drax-Camblesforth, Camblesforth-Barmston, and offshore sections. The PIG arrives at
Barmston after ~2.25 days, and at the platform at ~5.25 days (assuming continuous PIG travel, i.e. PIGs
are launched into downstream pipeline sections immediately on receipt of the PIG into the receiver from
the upstream pipeline section).
K34: Flow Assurance
32
Figure 7.7: Pressure at Various Locations in the CO₂ Transportation System during Initial Start-up at
2.68MTPA with PIG Operations – 55barg Drax to Camblesforth with Remainder of Pipeline System at 25barg
Note that instantaneous pressure spikes are a result of some instabilities in the OLGA model and do not
represent actual events.
K34: Flow Assurance
33
Figure 7.8: Mass Fraction of CO₂ at Various Locations in the CO₂ Transportation System during Initial Start-
up at 2.6 MTPA with PIG Operations – 55barg Drax to Camblesforth with Remainder of Pipeline System at
25barg
During the opening of each of the block valves, the pressure from the upstream section will cause the
velocity of the PIG to increase suddenly until the pressure is equalised. In reality this operation will need to
be carefully managed to ensure that the pressure equalisation occurs in a controlled manner. Some of the
CO2 supplied from Drax AGI starts to travel ahead of the PIG, with it starting to arrive at the platform
approximately 1 day prior to the PIG arrives. This is due to leakage of the CO2 past the PIG. As the
pipeline system is so long (approximately 160 km), the mass of CO2 that leaks past the PIG is significant.
The actual mass of CO2 arriving ahead of the PIG will ultimately be a function of the PIG properties and the
timing between reception of one PIG (say at Camblesforth) and launch of the next into the downstream
section of the pipeline system. The J-T effect across the PIG as CO2 leaks past it results in a temperature
drop of about 2°C (caused by 2 to 3 bar pressure drop across the PIG), therefore low temperatures are not
anticipated in the pipeline system during initial start-up when utilising PIG Operations. The pressure drop
across the PIG is dependent on the physical properties of the PIG (essentially, the amount of force
required to move the PIG along the pipeline). However, with a minimum ambient temperature of 4°C in the
onshore and offshore pipelines (thus representing the minimum fluid temperature upstream of the PIG), the
pressure drop across the PIG would need to be an order of magnitude higher than 2 to 3 bar for the
pipeline minimum design temperature to be transgressed due to excessive J-T cooling. (For an indication
on the J-T cooling caused by pressure drop see Table 7.11).
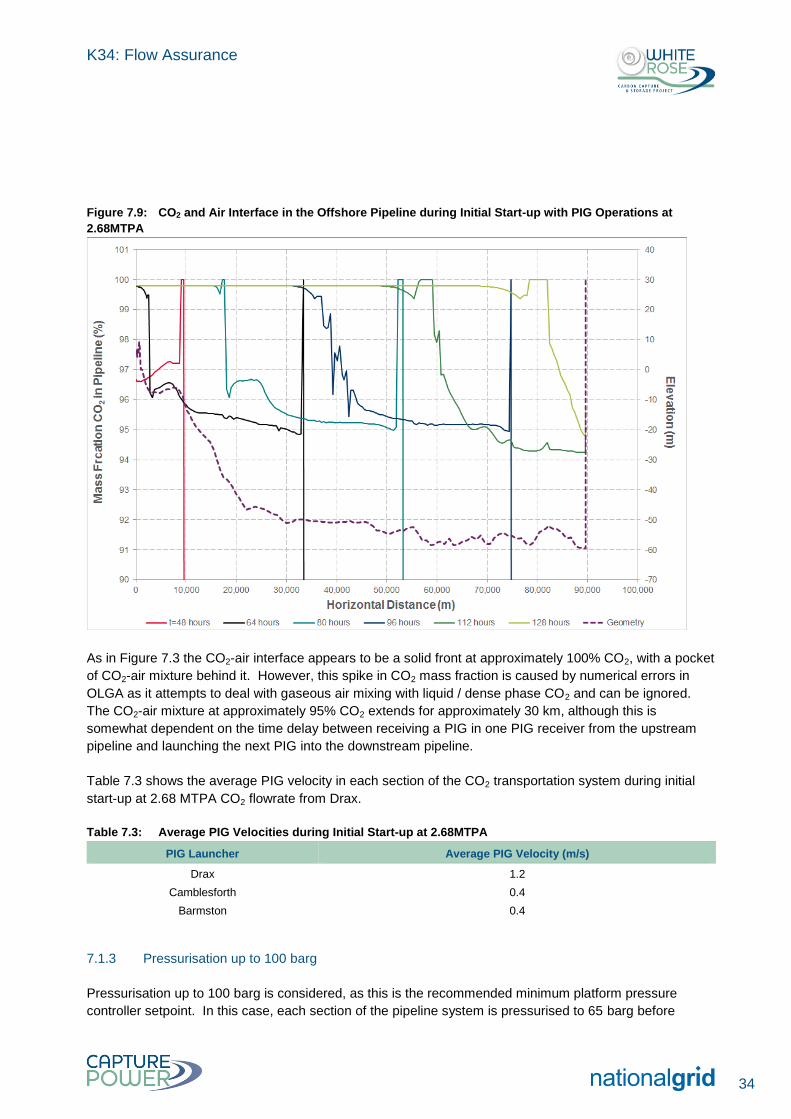
Figure 7.9 shows the CO2 mass fraction along the offshore pipeline during initial start-up at 2.68 MTPA
with PIG operations.
K34: Flow Assurance
34
Figure 7.9: CO2 and Air Interface in the Offshore Pipeline during Initial Start-up with PIG Operations at
2.68MTPA
As in Figure 7.3 the CO2-air interface appears to be a solid front at approximately 100% CO2, with a pocket
of CO2-air mixture behind it. However, this spike in CO2 mass fraction is caused by numerical errors in
OLGA as it attempts to deal with gaseous air mixing with liquid / dense phase CO2 and can be ignored.
The CO2-air mixture at approximately 95% CO2 extends for approximately 30 km, although this is
somewhat dependent on the time delay between receiving a PIG in one PIG receiver from the upstream
pipeline and launching the next PIG into the downstream pipeline.
Table 7.3 shows the average PIG velocity in each section of the CO2 transportation system during initial
start-up at 2.68 MTPA CO2 flowrate from Drax.
Table 7.3: Average PIG Velocities during Initial Start-up at 2.68MTPA
PIG Launcher Average PIG Velocity (m/s)
Drax 1.2
Camblesforth 0.4
Barmston 0.4
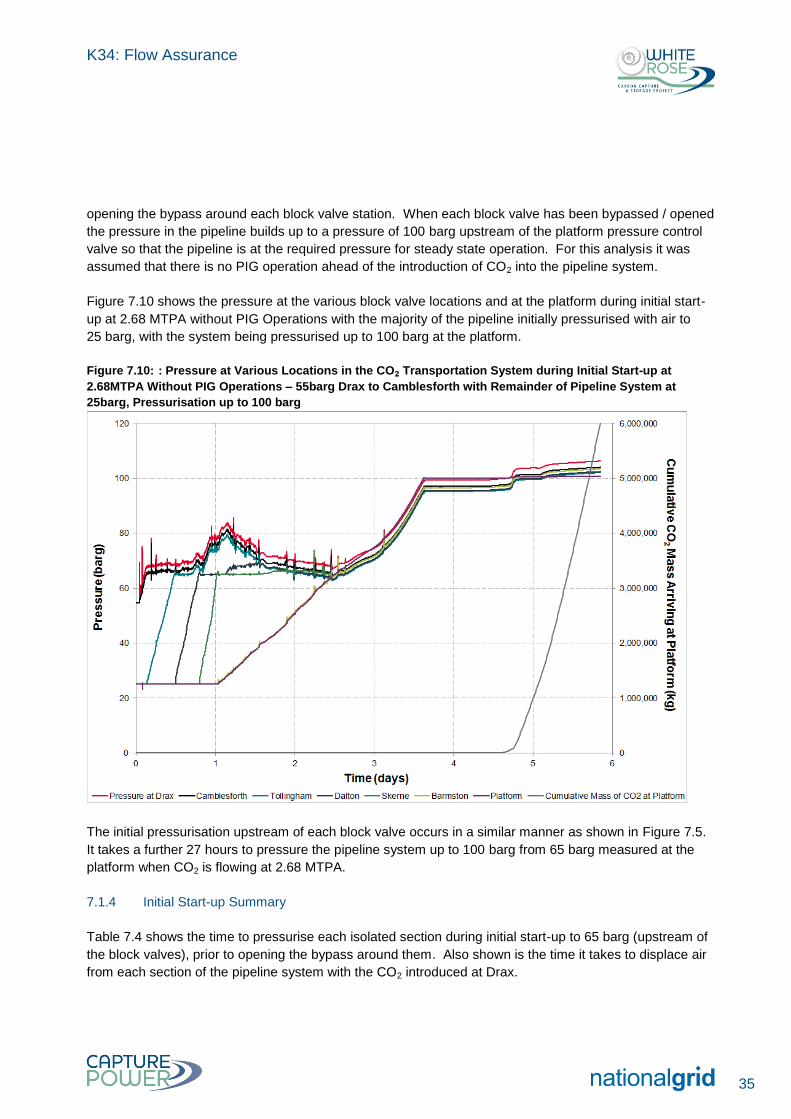
7.1.3 Pressurisation up to 100 barg
Pressurisation up to 100 barg is considered, as this is the recommended minimum platform pressure
controller setpoint. In this case, each section of the pipeline system is pressurised to 65 barg before
K34: Flow Assurance
35
opening the bypass around each block valve station. When each block valve has been bypassed / opened
the pressure in the pipeline builds up to a pressure of 100 barg upstream of the platform pressure control
valve so that the pipeline is at the required pressure for steady state operation. For this analysis it was
assumed that there is no PIG operation ahead of the introduction of CO2 into the pipeline system.
Figure 7.10 shows the pressure at the various block valve locations and at the platform during initial start-
up at 2.68 MTPA without PIG Operations with the majority of the pipeline initially pressurised with air to
25 barg, with the system being pressurised up to 100 barg at the platform.
Figure 7.10: : Pressure at Various Locations in the CO₂ Transportation System during Initial Start-up at
2.68MTPA Without PIG Operations – 55barg Drax to Camblesforth with Remainder of Pipeline System at
25barg, Pressurisation up to 100 barg
The initial pressurisation upstream of each block valve occurs in a similar manner as shown in Figure 7.5.
It takes a further 27 hours to pressure the pipeline system up to 100 barg from 65 barg measured at the
platform when CO2 is flowing at 2.68 MTPA.
7.1.4 Initial Start-up Summary
Table 7.4 shows the time to pressurise each isolated section during initial start-up to 65 barg (upstream of
the block valves), prior to opening the bypass around them. Also shown is the time it takes to displace air
from each section of the pipeline system with the CO2 introduced at Drax.
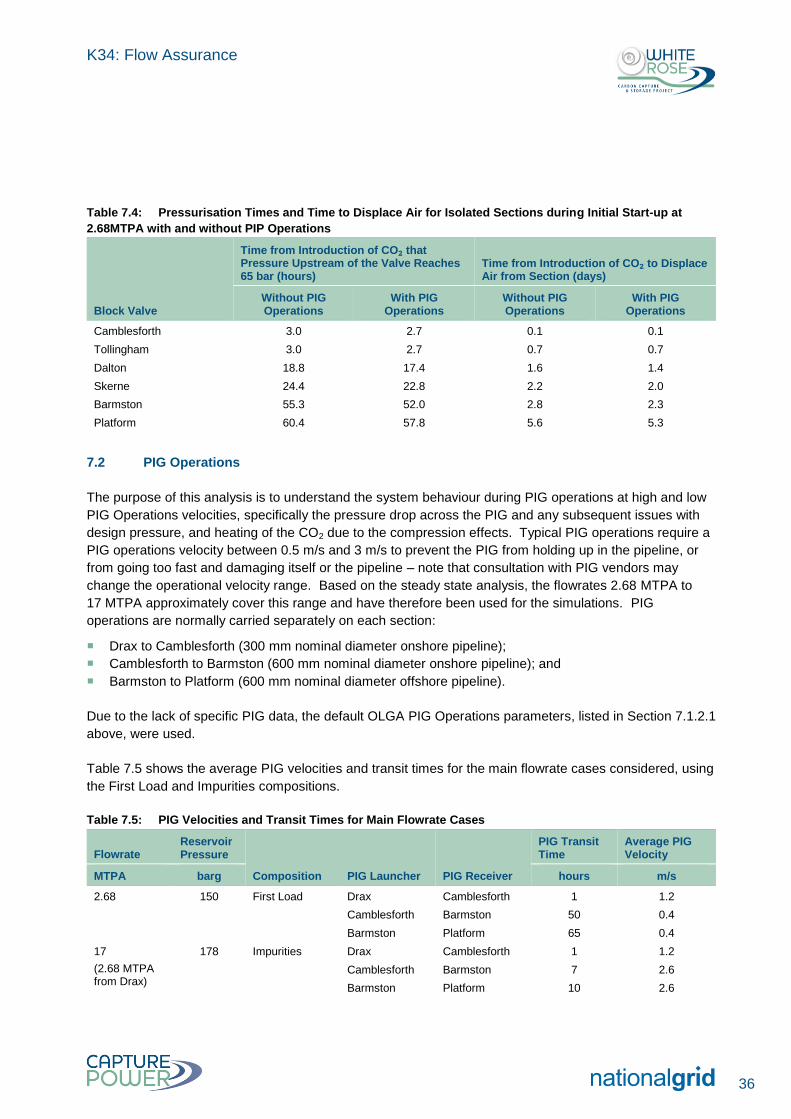
K34: Flow Assurance
36
Table 7.4: Pressurisation Times and Time to Displace Air for Isolated Sections during Initial Start-up at
2.68MTPA with and without PIP Operations
Block Valve
Time from Introduction of CO₂ that Pressure Upstream of the Valve Reaches 65 bar (hours)
Time from Introduction of CO₂ to Displace Air from Section (days)
Without PIG Operations
With PIG Operations
Without PIG Operations
With PIG Operations
Camblesforth 3.0 2.7 0.1 0.1
Tollingham 3.0 2.7 0.7 0.7
Dalton 18.8 17.4 1.6 1.4
Skerne 24.4 22.8 2.2 2.0
Barmston 55.3 52.0 2.8 2.3
Platform 60.4 57.8 5.6 5.3
7.2 PIG Operations
The purpose of this analysis is to understand the system behaviour during PIG operations at high and low
PIG Operations velocities, specifically the pressure drop across the PIG and any subsequent issues with
design pressure, and heating of the CO2 due to the compression effects. Typical PIG operations require a
PIG operations velocity between 0.5 m/s and 3 m/s to prevent the PIG from holding up in the pipeline, or
from going too fast and damaging itself or the pipeline – note that consultation with PIG vendors may
change the operational velocity range. Based on the steady state analysis, the flowrates 2.68 MTPA to
17 MTPA approximately cover this range and have therefore been used for the simulations. PIG
operations are normally carried separately on each section:
Drax to Camblesforth (300 mm nominal diameter onshore pipeline);
Camblesforth to Barmston (600 mm nominal diameter onshore pipeline); and
Barmston to Platform (600 mm nominal diameter offshore pipeline).
Due to the lack of specific PIG data, the default OLGA PIG Operations parameters, listed in Section 7.1.2.1
above, were used.
Table 7.5 shows the average PIG velocities and transit times for the main flowrate cases considered, using
the First Load and Impurities compositions.
Table 7.5: PIG Velocities and Transit Times for Main Flowrate Cases
Flowrate Reservoir Pressure
Composition PIG Launcher PIG Receiver
PIG Transit Time
Average PIG Velocity
MTPA barg hours m/s
2.68 150 First Load Drax Camblesforth 1 1.2
Camblesforth Barmston 50 0.4
Barmston Platform 65 0.4
17
(2.68 MTPA from Drax)
178 Impurities Drax Camblesforth 1 1.2
Camblesforth Barmston 7 2.6
Barmston Platform 10 2.6

K34: Flow Assurance
37
At the First Load flowrate of 2.68 MTPA, the PIG velocity is within the accepted limits in the Drax to
Camblesforth pipeline and has a 1 hour transit time. However, at this flowrate, the average PIG velocity
falls below 0.5 m/s when conducting PIG operations on the 600 mm nominal diameter pipelines (onshore
and offshore), which may increase the risk of a stuck PIG. The average PIG velocities in the 600 mm
nominal diameter pipelines at 17 MTPA are within the acceptable PIG velocity range.
Table 7.6 shows the flowrate range for each pipeline that ensures the average PIG velocity is within the
0.5 – 3 m/s velocity limit.
Table 7.6: Flowrates Required for PIG Velocity Limits
PIG Launcher
Flowrate for PIG Velocity Limit (MTPA)
with a velocity limit of 0.5 m/s with a velocity limit of 3 m/s
Drax 1.0 5.9
Camblesforth 3.7 22.3
Barmston 3.8 23.0
The flowrates required to achieve an average PIG velocity of 3 m/s are >17 MTPA, therefore PIG
operations can be carried out at the design flowrate and the supplies from Drax and Camblesforth do not
need to be turned down.
Analysis of the pressures and temperatures during PIG operations shows a negligible impact. A typical
plot is shown in Figure 7.11 Pressure Behaviour during Pigging Camblesforth to Barmston at 17 MTPA for
a PIG operations operation from Camblesforth to Barmston at 17 MTPA. There is a small pressure spike
as the PIG is launched, followed by some fluctuations of less than 1 bar as the PIG traverses the elevation
changes specific to this section of pipeline. However there is no appreciable rise in pressure at
Camblesforth when the PIG is in the pipeline, as there is negligible pressure drop across the PIG.
Consequently there is negligible change in temperature across the PIG.
Pressure drop across the PIG is dependent on the PIG properties used within OLGA (wall friction, mass,
etc.). It is therefore recommended that once specific PIG data is available these simulations be re-run to
confirm the impact on pressures and temperatures on the system.
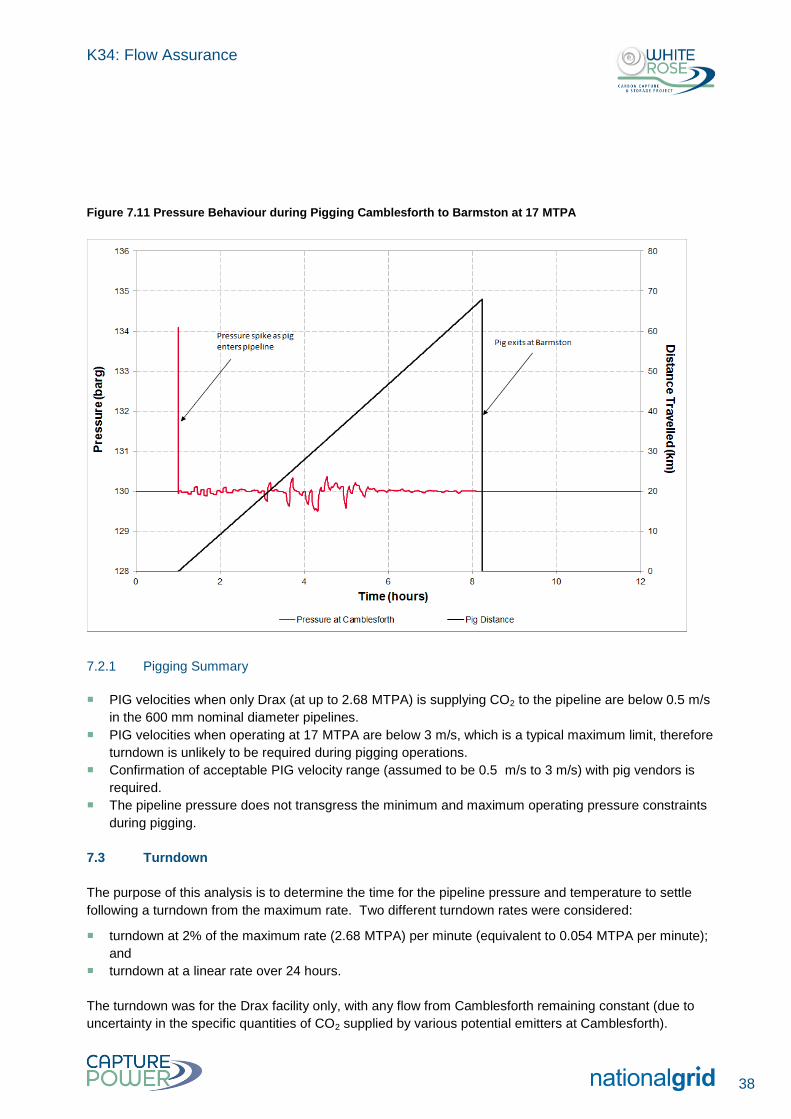
K34: Flow Assurance
38
Figure 7.11 Pressure Behaviour during Pigging Camblesforth to Barmston at 17 MTPA
7.2.1 Pigging Summary
PIG velocities when only Drax (at up to 2.68 MTPA) is supplying CO2 to the pipeline are below 0.5 m/s
in the 600 mm nominal diameter pipelines.
PIG velocities when operating at 17 MTPA are below 3 m/s, which is a typical maximum limit, therefore
turndown is unlikely to be required during pigging operations.
Confirmation of acceptable PIG velocity range (assumed to be 0.5 m/s to 3 m/s) with pig vendors is
required.
The pipeline pressure does not transgress the minimum and maximum operating pressure constraints
during pigging.
7.3 Turndown
The purpose of this analysis is to determine the time for the pipeline pressure and temperature to settle
following a turndown from the maximum rate. Two different turndown rates were considered:
turndown at 2% of the maximum rate (2.68 MTPA) per minute (equivalent to 0.054 MTPA per minute);
and
turndown at a linear rate over 24 hours.
The turndown was for the Drax facility only, with any flow from Camblesforth remaining constant (due to
uncertainty in the specific quantities of CO2 supplied by various potential emitters at Camblesforth).
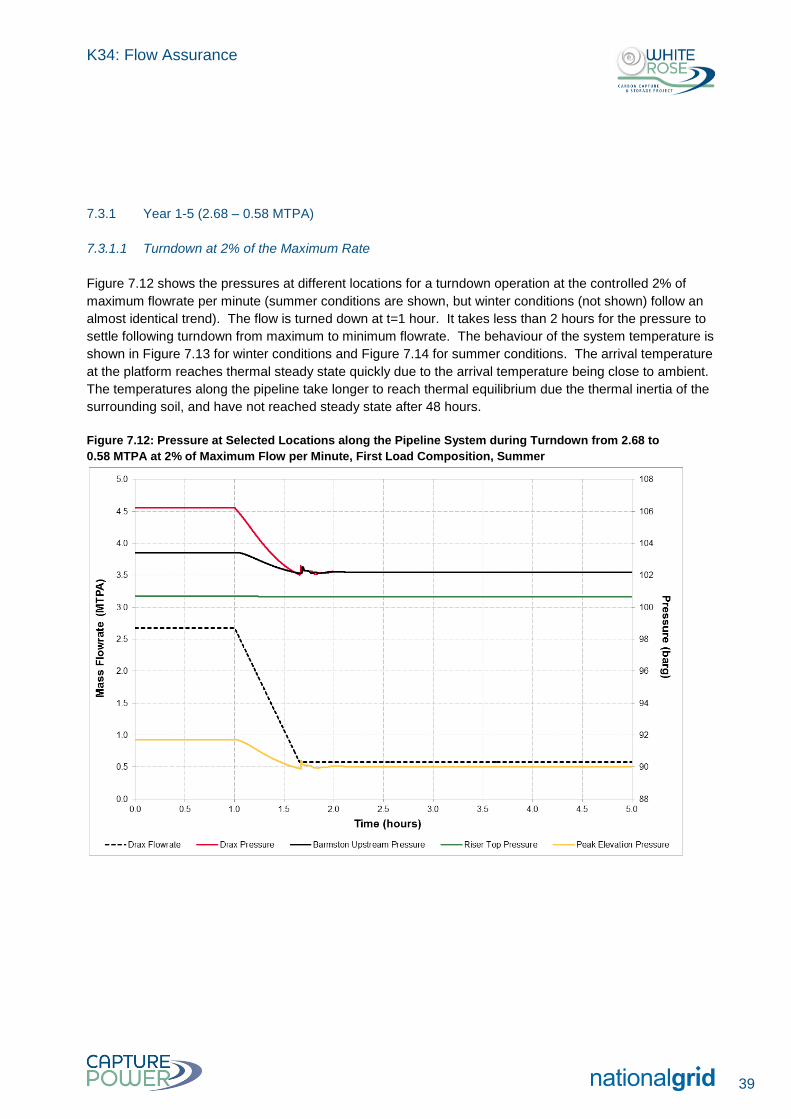
K34: Flow Assurance
39
7.3.1 Year 1-5 (2.68 – 0.58 MTPA)
7.3.1.1 Turndown at 2% of the Maximum Rate
Figure 7.12 shows the pressures at different locations for a turndown operation at the controlled 2% of
maximum flowrate per minute (summer conditions are shown, but winter conditions (not shown) follow an
almost identical trend). The flow is turned down at t=1 hour. It takes less than 2 hours for the pressure to
settle following turndown from maximum to minimum flowrate. The behaviour of the system temperature is
shown in Figure 7.13 for winter conditions and Figure 7.14 for summer conditions. The arrival temperature
at the platform reaches thermal steady state quickly due to the arrival temperature being close to ambient.
The temperatures along the pipeline take longer to reach thermal equilibrium due the thermal inertia of the
surrounding soil, and have not reached steady state after 48 hours.
Figure 7.12: Pressure at Selected Locations along the Pipeline System during Turndown from 2.68 to
0.58 MTPA at 2% of Maximum Flow per Minute, First Load Composition, Summer
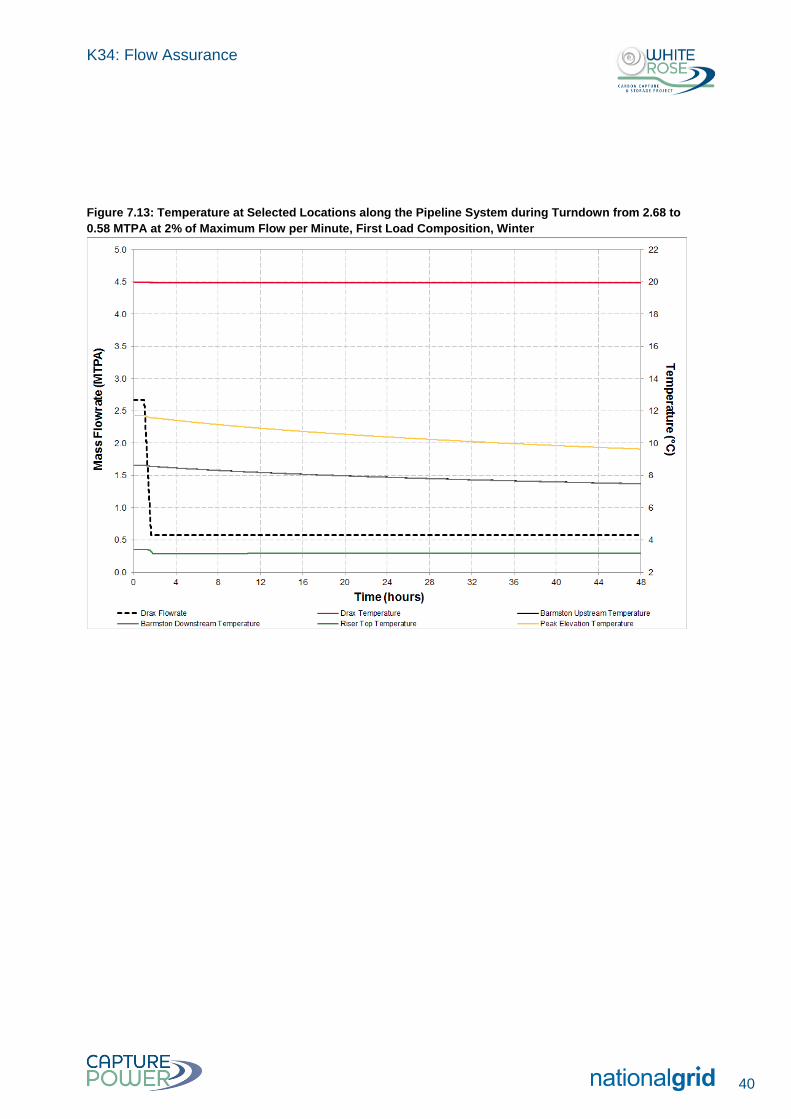
K34: Flow Assurance
40
Figure 7.13: Temperature at Selected Locations along the Pipeline System during Turndown from 2.68 to
0.58 MTPA at 2% of Maximum Flow per Minute, First Load Composition, Winter
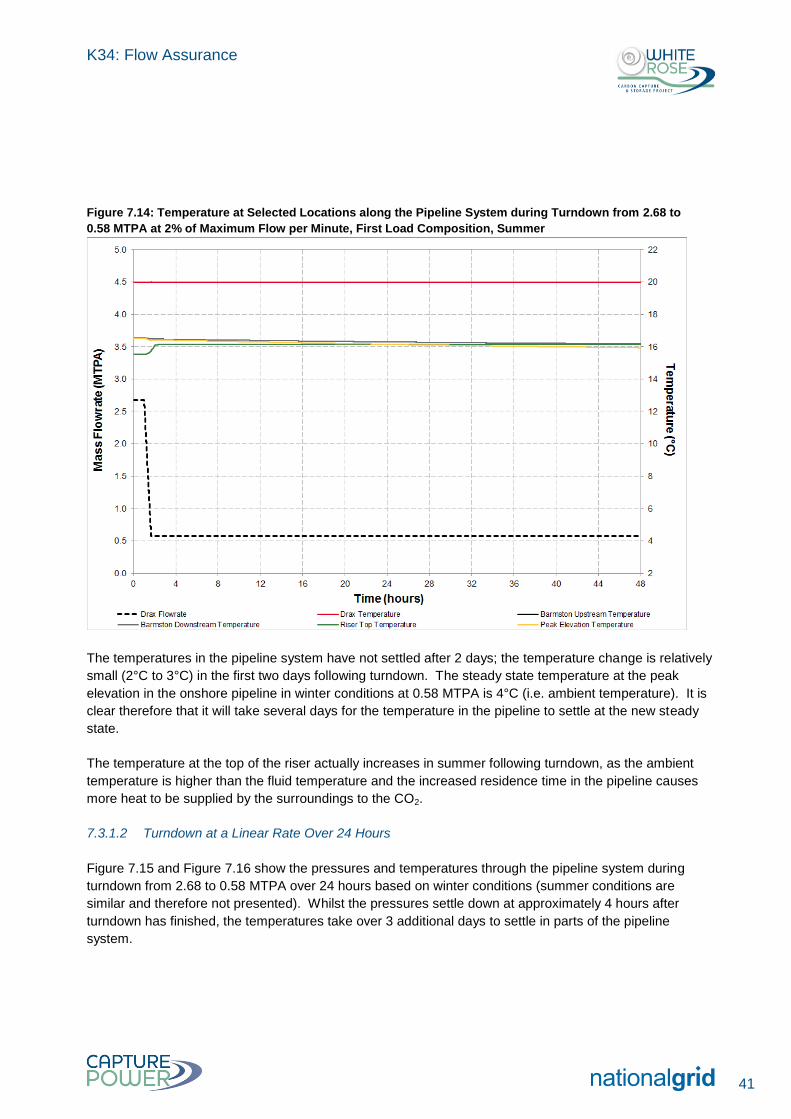
K34: Flow Assurance
41
Figure 7.14: Temperature at Selected Locations along the Pipeline System during Turndown from 2.68 to
0.58 MTPA at 2% of Maximum Flow per Minute, First Load Composition, Summer
The temperatures in the pipeline system have not settled after 2 days; the temperature change is relatively
small (2°C to 3°C) in the first two days following turndown. The steady state temperature at the peak
elevation in the onshore pipeline in winter conditions at 0.58 MTPA is 4°C (i.e. ambient temperature). It is
clear therefore that it will take several days for the temperature in the pipeline to settle at the new steady
state.
The temperature at the top of the riser actually increases in summer following turndown, as the ambient
temperature is higher than the fluid temperature and the increased residence time in the pipeline causes
more heat to be supplied by the surroundings to the CO2.
7.3.1.2 Turndown at a Linear Rate Over 24 Hours
Figure 7.15 and Figure 7.16 show the pressures and temperatures through the pipeline system during
turndown from 2.68 to 0.58 MTPA over 24 hours based on winter conditions (summer conditions are
similar and therefore not presented). Whilst the pressures settle down at approximately 4 hours after
turndown has finished, the temperatures take over 3 additional days to settle in parts of the pipeline
system.
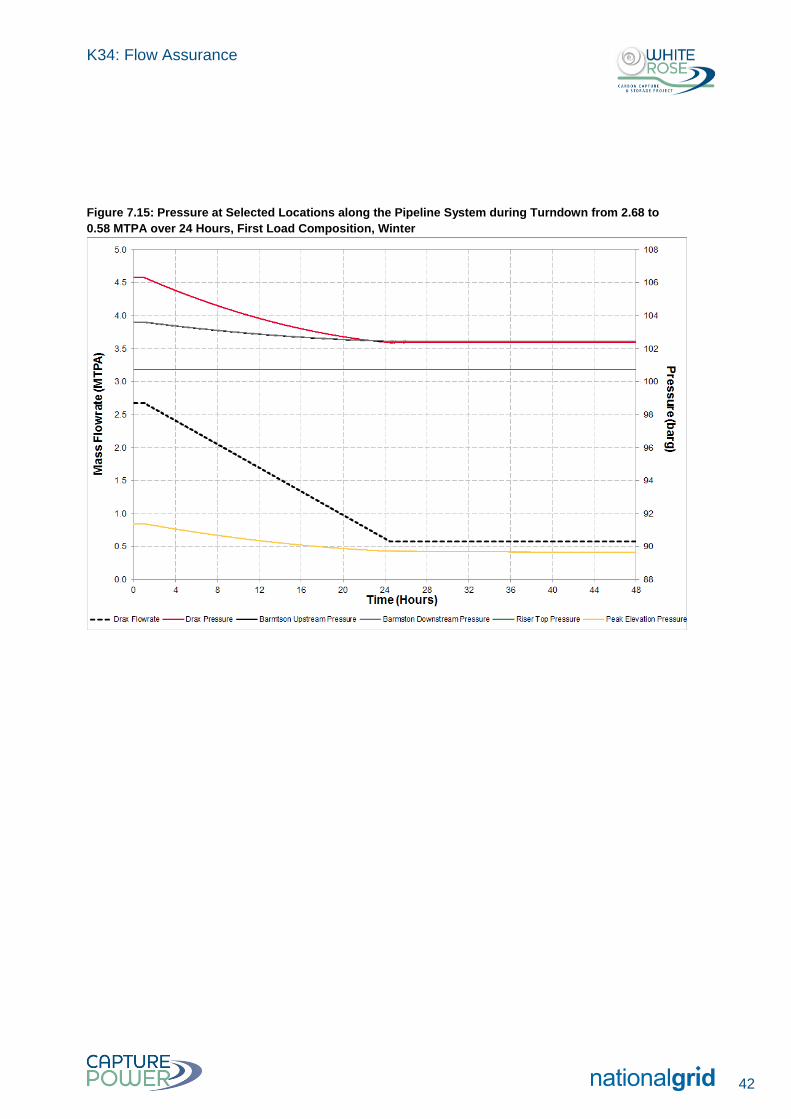
K34: Flow Assurance
42
Figure 7.15: Pressure at Selected Locations along the Pipeline System during Turndown from 2.68 to
0.58 MTPA over 24 Hours, First Load Composition, Winter
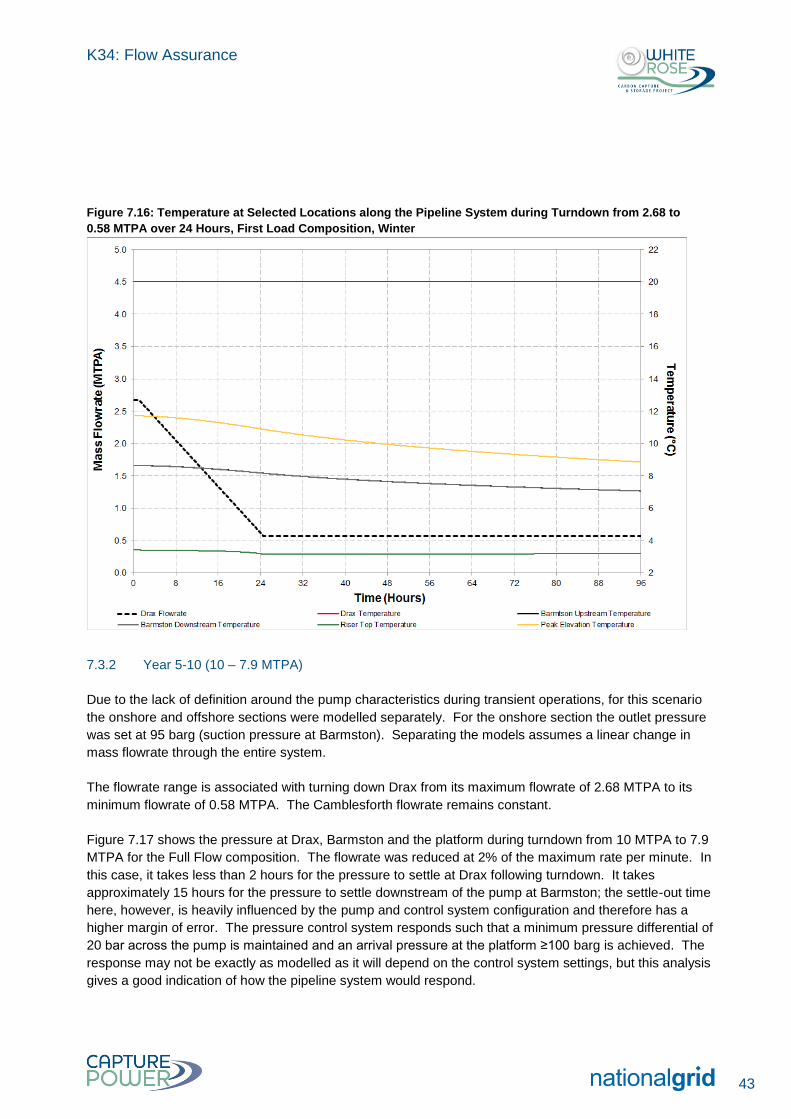
K34: Flow Assurance
43
Figure 7.16: Temperature at Selected Locations along the Pipeline System during Turndown from 2.68 to
0.58 MTPA over 24 Hours, First Load Composition, Winter
7.3.2 Year 5-10 (10 – 7.9 MTPA)
Due to the lack of definition around the pump characteristics during transient operations, for this scenario
the onshore and offshore sections were modelled separately. For the onshore section the outlet pressure
was set at 95 barg (suction pressure at Barmston). Separating the models assumes a linear change in
mass flowrate through the entire system.
The flowrate range is associated with turning down Drax from its maximum flowrate of 2.68 MTPA to its
minimum flowrate of 0.58 MTPA. The Camblesforth flowrate remains constant.
Figure 7.17 shows the pressure at Drax, Barmston and the platform during turndown from 10 MTPA to 7.9
MTPA for the Full Flow composition. The flowrate was reduced at 2% of the maximum rate per minute. In
this case, it takes less than 2 hours for the pressure to settle at Drax following turndown. It takes
approximately 15 hours for the pressure to settle downstream of the pump at Barmston; the settle-out time
here, however, is heavily influenced by the pump and control system configuration and therefore has a
higher margin of error. The pressure control system responds such that a minimum pressure differential of
20 bar across the pump is maintained and an arrival pressure at the platform ≥100 barg is achieved. The
response may not be exactly as modelled as it will depend on the control system settings, but this analysis
gives a good indication of how the pipeline system would respond.
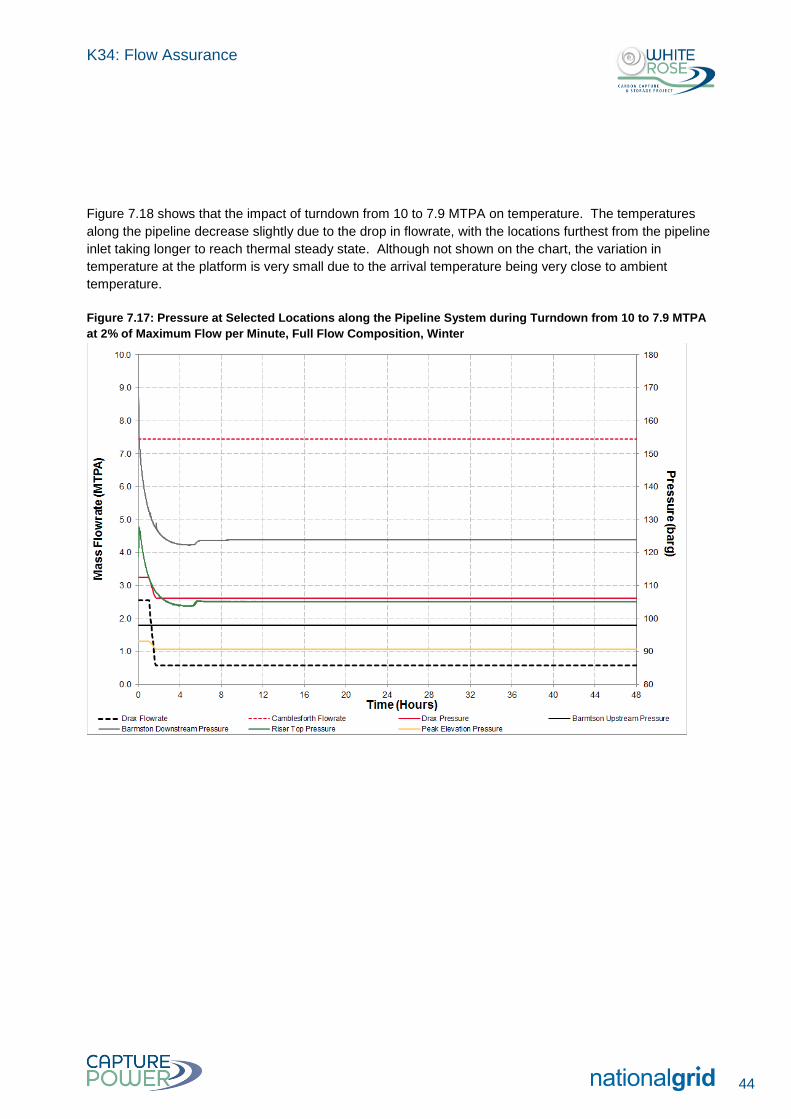
K34: Flow Assurance
44
Figure 7.18 shows that the impact of turndown from 10 to 7.9 MTPA on temperature. The temperatures
along the pipeline decrease slightly due to the drop in flowrate, with the locations furthest from the pipeline
inlet taking longer to reach thermal steady state. Although not shown on the chart, the variation in
temperature at the platform is very small due to the arrival temperature being very close to ambient
temperature.
Figure 7.17: Pressure at Selected Locations along the Pipeline System during Turndown from 10 to 7.9 MTPA
at 2% of Maximum Flow per Minute, Full Flow Composition, Winter
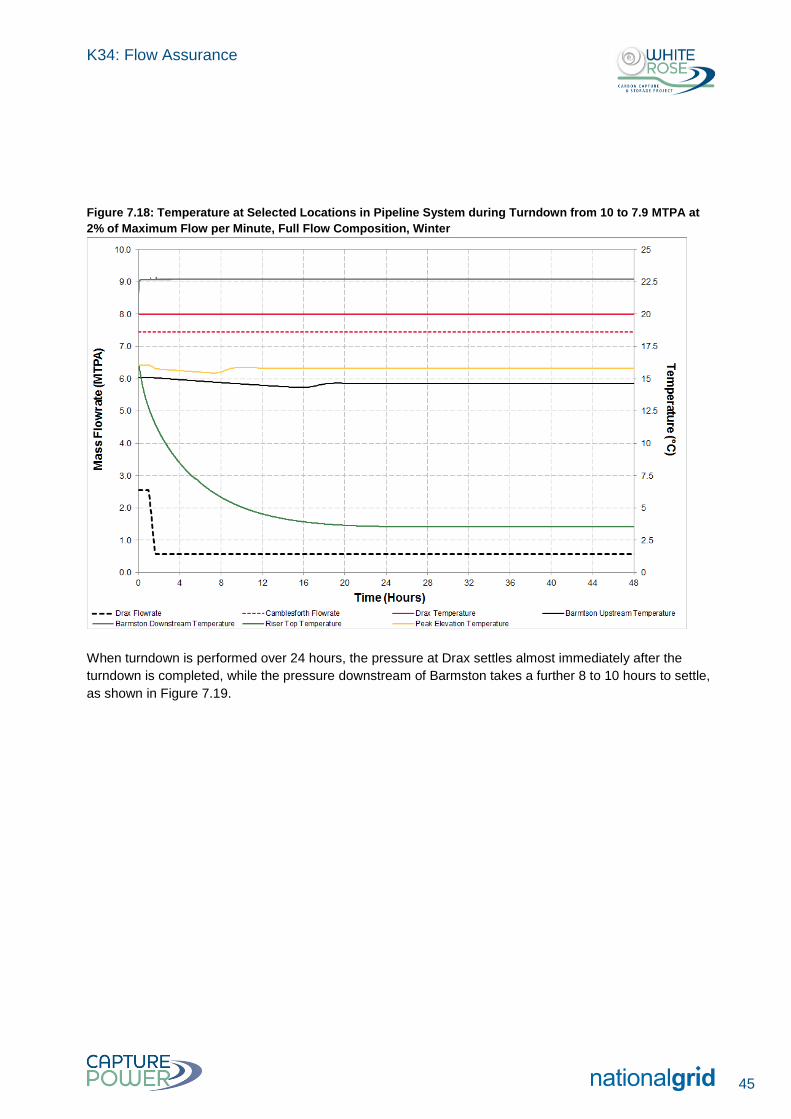
K34: Flow Assurance
45
Figure 7.18: Temperature at Selected Locations in Pipeline System during Turndown from 10 to 7.9 MTPA at
2% of Maximum Flow per Minute, Full Flow Composition, Winter
When turndown is performed over 24 hours, the pressure at Drax settles almost immediately after the
turndown is completed, while the pressure downstream of Barmston takes a further 8 to 10 hours to settle,
as shown in Figure 7.19.
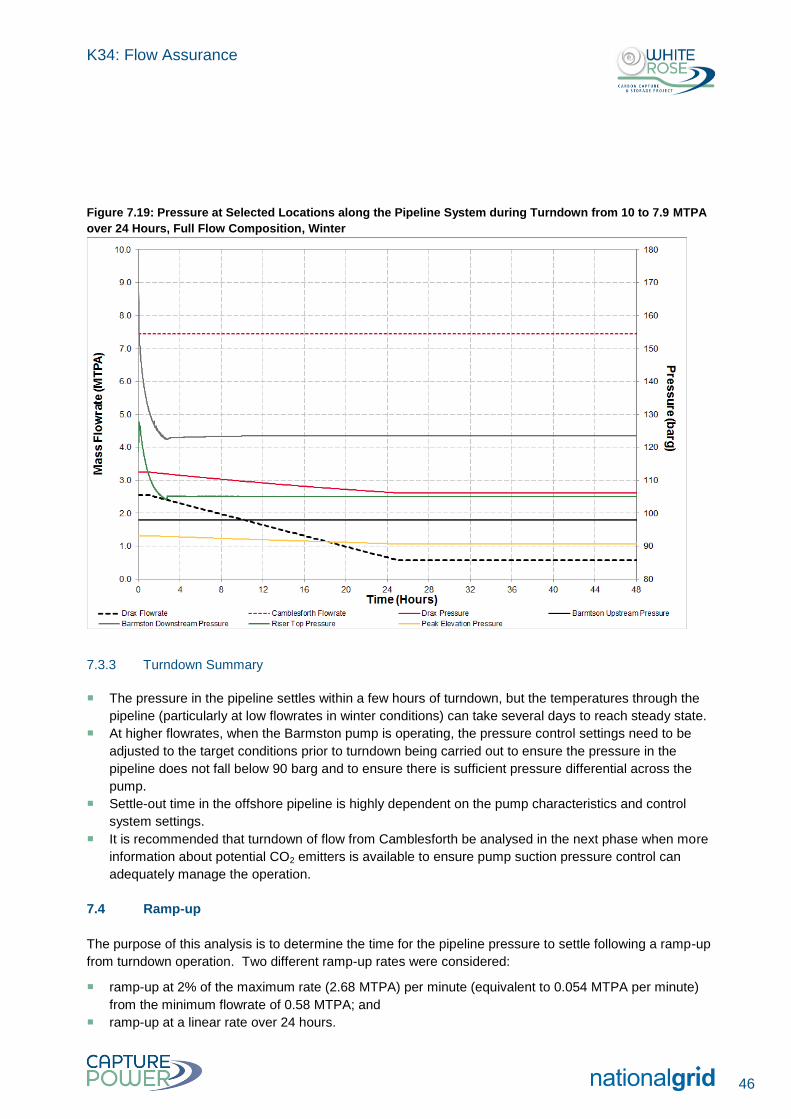
K34: Flow Assurance
46
Figure 7.19: Pressure at Selected Locations along the Pipeline System during Turndown from 10 to 7.9 MTPA
over 24 Hours, Full Flow Composition, Winter
7.3.3 Turndown Summary
The pressure in the pipeline settles within a few hours of turndown, but the temperatures through the
pipeline (particularly at low flowrates in winter conditions) can take several days to reach steady state.
At higher flowrates, when the Barmston pump is operating, the pressure control settings need to be
adjusted to the target conditions prior to turndown being carried out to ensure the pressure in the
pipeline does not fall below 90 barg and to ensure there is sufficient pressure differential across the
pump.
Settle-out time in the offshore pipeline is highly dependent on the pump characteristics and control
system settings.
It is recommended that turndown of flow from Camblesforth be analysed in the next phase when more
information about potential CO2 emitters is available to ensure pump suction pressure control can
adequately manage the operation.
7.4 Ramp-up
The purpose of this analysis is to determine the time for the pipeline pressure to settle following a ramp-up
from turndown operation. Two different ramp-up rates were considered:
ramp-up at 2% of the maximum rate (2.68 MTPA) per minute (equivalent to 0.054 MTPA per minute)
from the minimum flowrate of 0.58 MTPA; and
ramp-up at a linear rate over 24 hours.
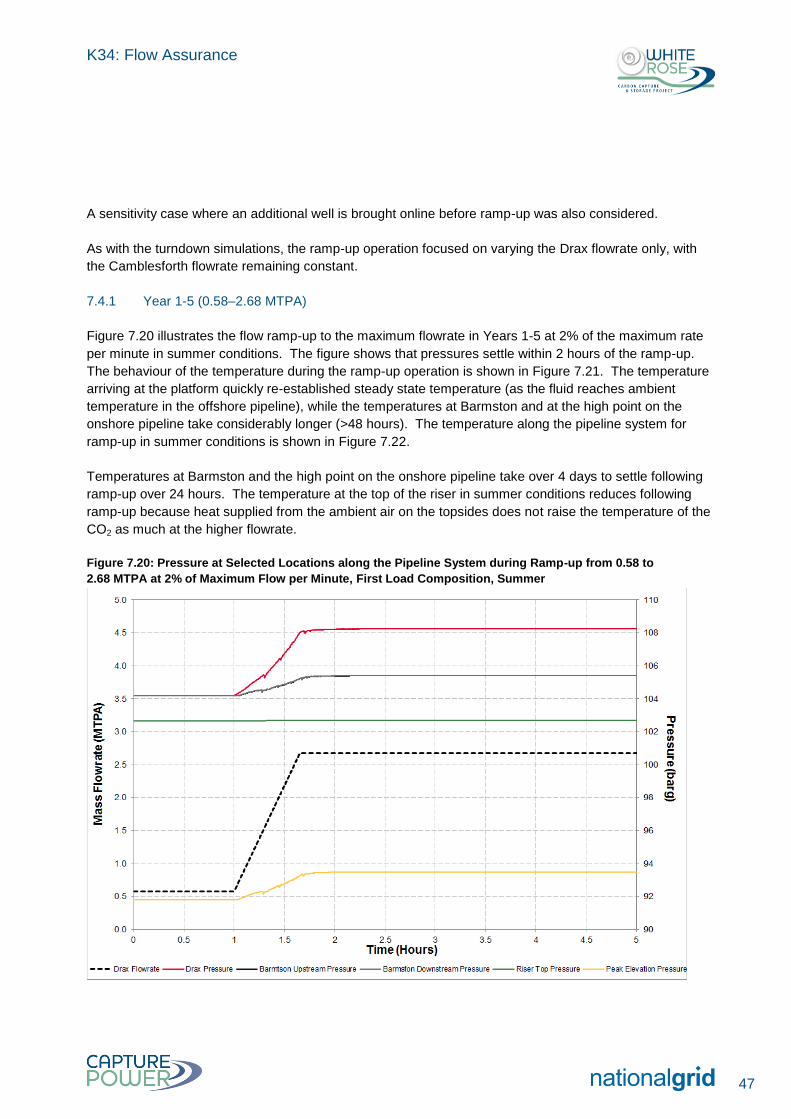
K34: Flow Assurance
47
A sensitivity case where an additional well is brought online before ramp-up was also considered.
As with the turndown simulations, the ramp-up operation focused on varying the Drax flowrate only, with
the Camblesforth flowrate remaining constant.
7.4.1 Year 1-5 (0.58–2.68 MTPA)
Figure 7.20 illustrates the flow ramp-up to the maximum flowrate in Years 1-5 at 2% of the maximum rate
per minute in summer conditions. The figure shows that pressures settle within 2 hours of the ramp-up.
The behaviour of the temperature during the ramp-up operation is shown in Figure 7.21. The temperature
arriving at the platform quickly re-established steady state temperature (as the fluid reaches ambient
temperature in the offshore pipeline), while the temperatures at Barmston and at the high point on the
onshore pipeline take considerably longer (>48 hours). The temperature along the pipeline system for
ramp-up in summer conditions is shown in Figure 7.22.
Temperatures at Barmston and the high point on the onshore pipeline take over 4 days to settle following
ramp-up over 24 hours. The temperature at the top of the riser in summer conditions reduces following
ramp-up because heat supplied from the ambient air on the topsides does not raise the temperature of the
CO2 as much at the higher flowrate.
Figure 7.20: Pressure at Selected Locations along the Pipeline System during Ramp-up from 0.58 to
2.68 MTPA at 2% of Maximum Flow per Minute, First Load Composition, Summer
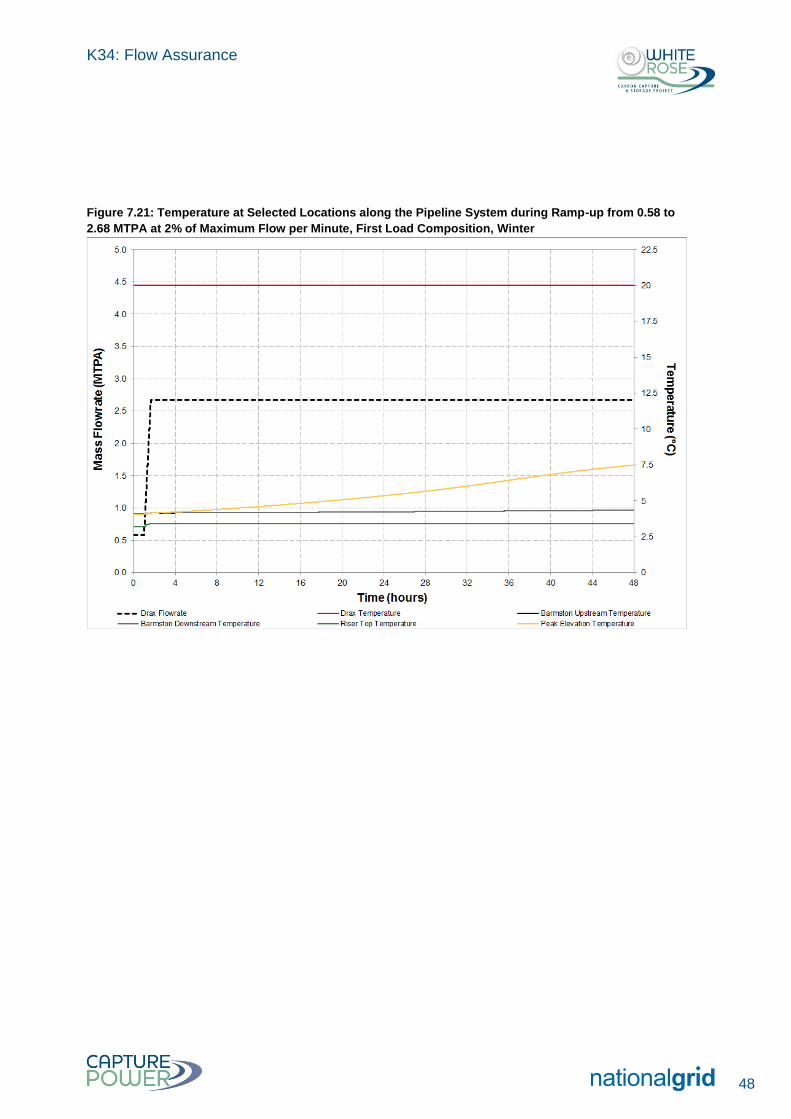
K34: Flow Assurance
48
Figure 7.21: Temperature at Selected Locations along the Pipeline System during Ramp-up from 0.58 to
2.68 MTPA at 2% of Maximum Flow per Minute, First Load Composition, Winter
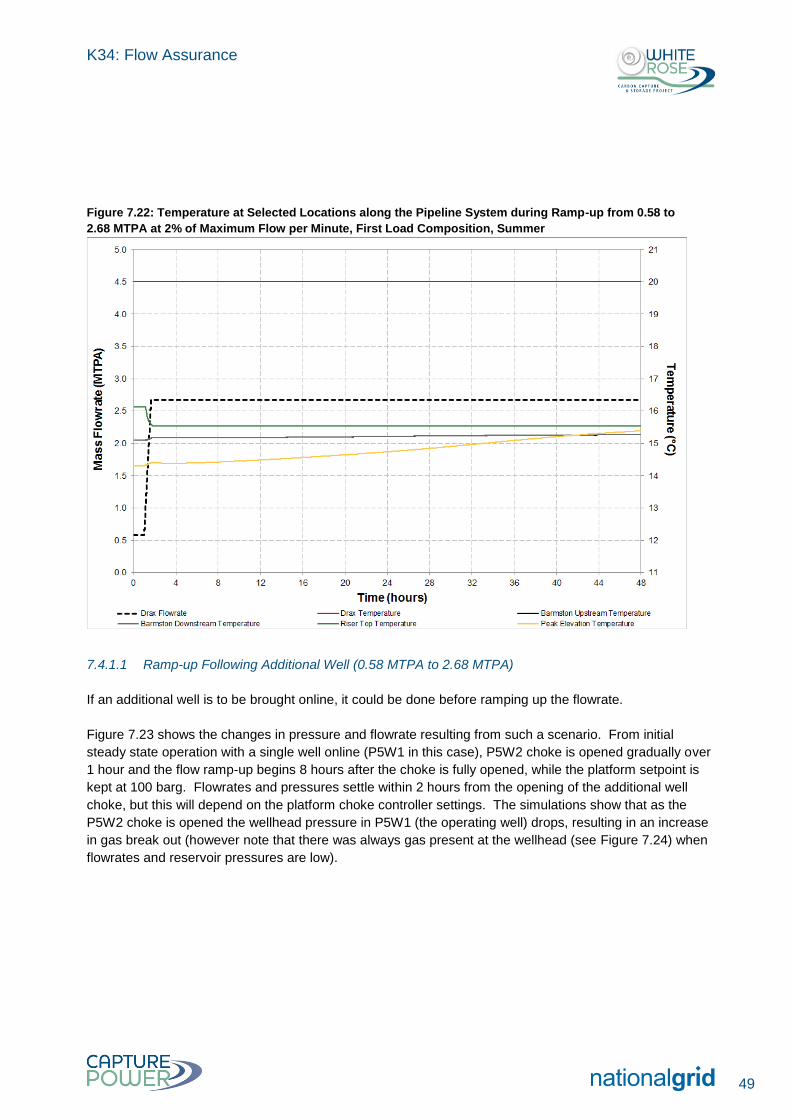
K34: Flow Assurance
49
Figure 7.22: Temperature at Selected Locations along the Pipeline System during Ramp-up from 0.58 to
2.68 MTPA at 2% of Maximum Flow per Minute, First Load Composition, Summer
7.4.1.1 Ramp-up Following Additional Well (0.58 MTPA to 2.68 MTPA)
If an additional well is to be brought online, it could be done before ramping up the flowrate.
Figure 7.23 shows the changes in pressure and flowrate resulting from such a scenario. From initial
steady state operation with a single well online (P5W1 in this case), P5W2 choke is opened gradually over
1 hour and the flow ramp-up begins 8 hours after the choke is fully opened, while the platform setpoint is
kept at 100 barg. Flowrates and pressures settle within 2 hours from the opening of the additional well
choke, but this will depend on the platform choke controller settings. The simulations show that as the
P5W2 choke is opened the wellhead pressure in P5W1 (the operating well) drops, resulting in an increase
in gas break out (however note that there was always gas present at the wellhead (see Figure 7.24) when
flowrates and reservoir pressures are low).
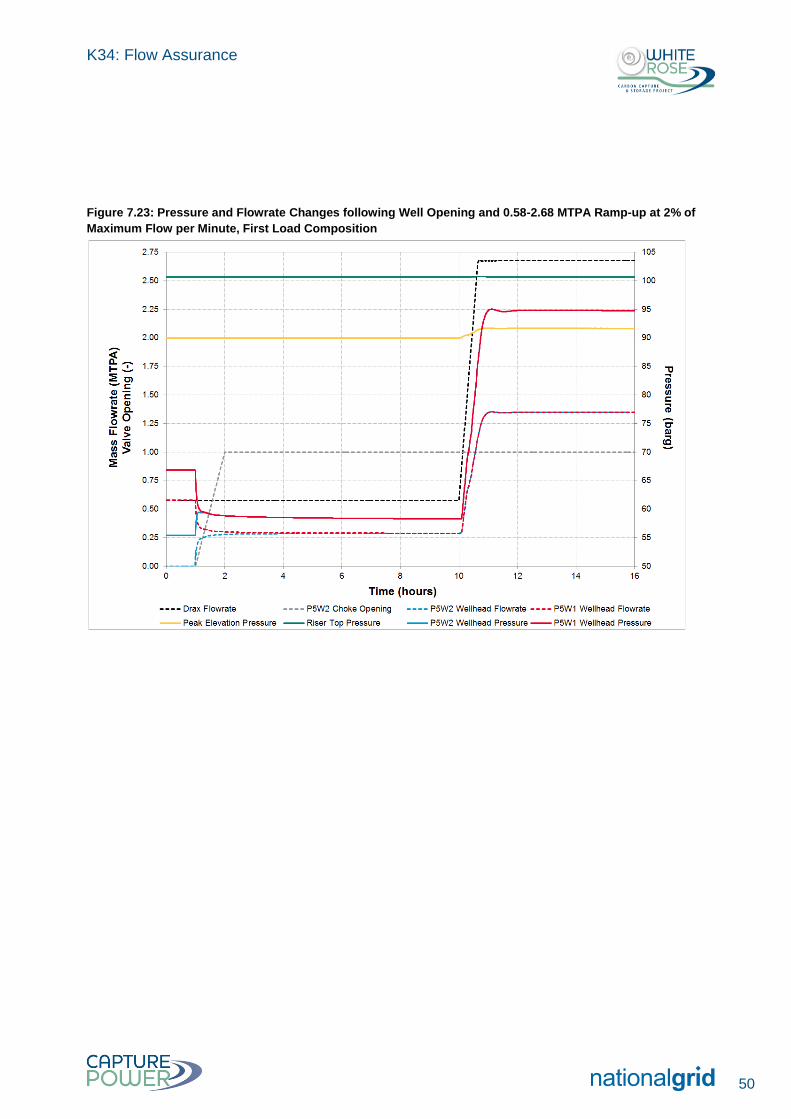
K34: Flow Assurance
50
Figure 7.23: Pressure and Flowrate Changes following Well Opening and 0.58-2.68 MTPA Ramp-up at 2% of
Maximum Flow per Minute, First Load Composition
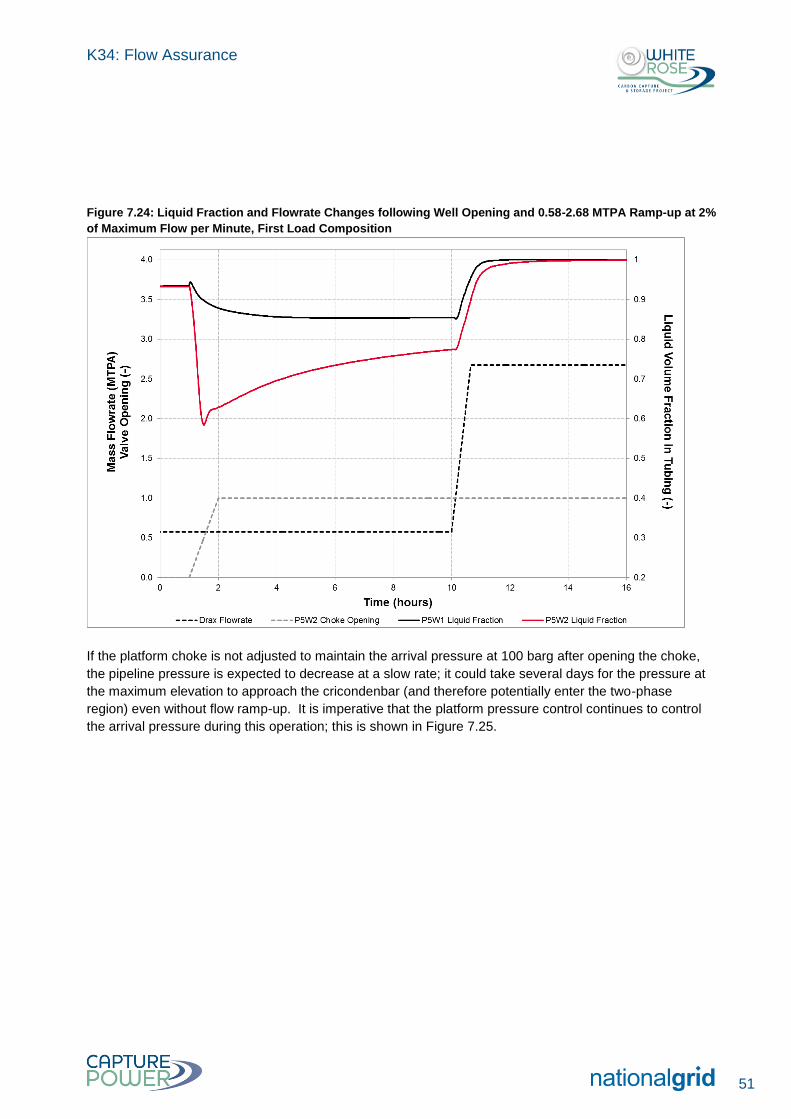
K34: Flow Assurance
51
Figure 7.24: Liquid Fraction and Flowrate Changes following Well Opening and 0.58-2.68 MTPA Ramp-up at 2%
of Maximum Flow per Minute, First Load Composition
If the platform choke is not adjusted to maintain the arrival pressure at 100 barg after opening the choke,
the pipeline pressure is expected to decrease at a slow rate; it could take several days for the pressure at
the maximum elevation to approach the cricondenbar (and therefore potentially enter the two-phase
region) even without flow ramp-up. It is imperative that the platform pressure control continues to control
the arrival pressure during this operation; this is shown in Figure 7.25.
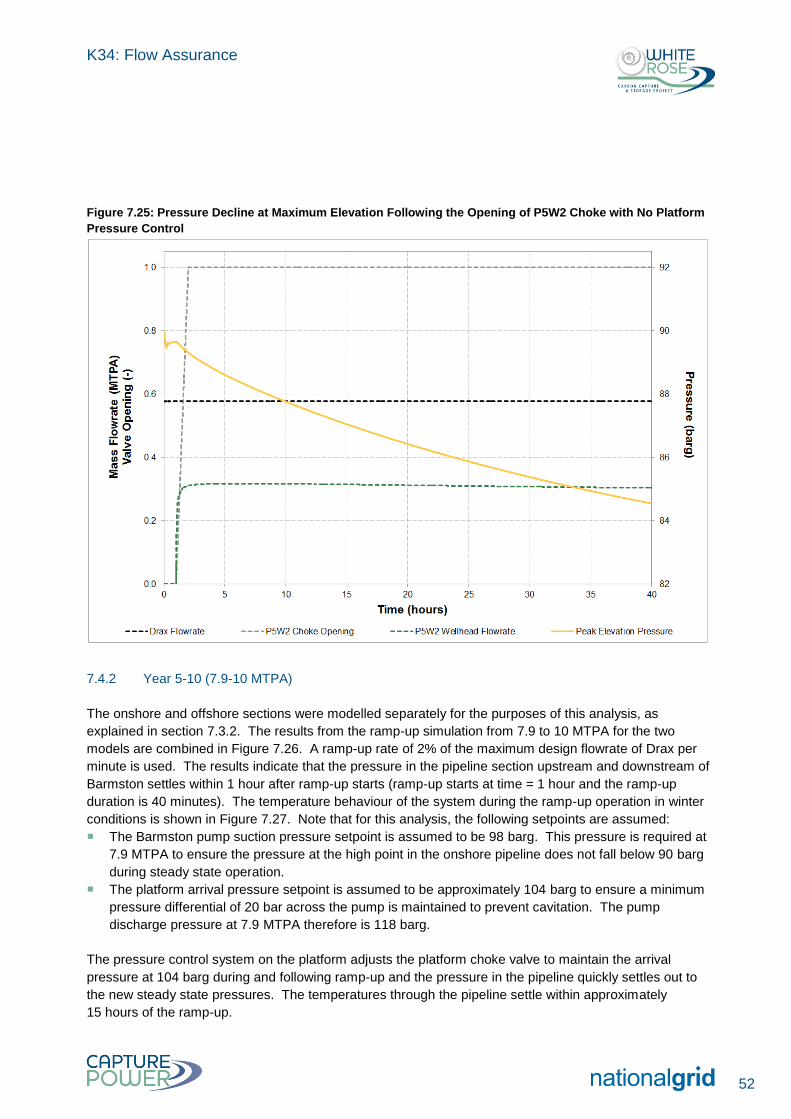
K34: Flow Assurance
52
Figure 7.25: Pressure Decline at Maximum Elevation Following the Opening of P5W2 Choke with No Platform
Pressure Control
7.4.2 Year 5-10 (7.9-10 MTPA)
The onshore and offshore sections were modelled separately for the purposes of this analysis, as
explained in section 7.3.2. The results from the ramp-up simulation from 7.9 to 10 MTPA for the two
models are combined in Figure 7.26. A ramp-up rate of 2% of the maximum design flowrate of Drax per
minute is used. The results indicate that the pressure in the pipeline section upstream and downstream of
Barmston settles within 1 hour after ramp-up starts (ramp-up starts at time = 1 hour and the ramp-up
duration is 40 minutes). The temperature behaviour of the system during the ramp-up operation in winter
conditions is shown in Figure 7.27. Note that for this analysis, the following setpoints are assumed:
The Barmston pump suction pressure setpoint is assumed to be 98 barg. This pressure is required at
7.9 MTPA to ensure the pressure at the high point in the onshore pipeline does not fall below 90 barg
during steady state operation.
The platform arrival pressure setpoint is assumed to be approximately 104 barg to ensure a minimum
pressure differential of 20 bar across the pump is maintained to prevent cavitation. The pump
discharge pressure at 7.9 MTPA therefore is 118 barg.
The pressure control system on the platform adjusts the platform choke valve to maintain the arrival
pressure at 104 barg during and following ramp-up and the pressure in the pipeline quickly settles out to
the new steady state pressures. The temperatures through the pipeline settle within approximately
15 hours of the ramp-up.
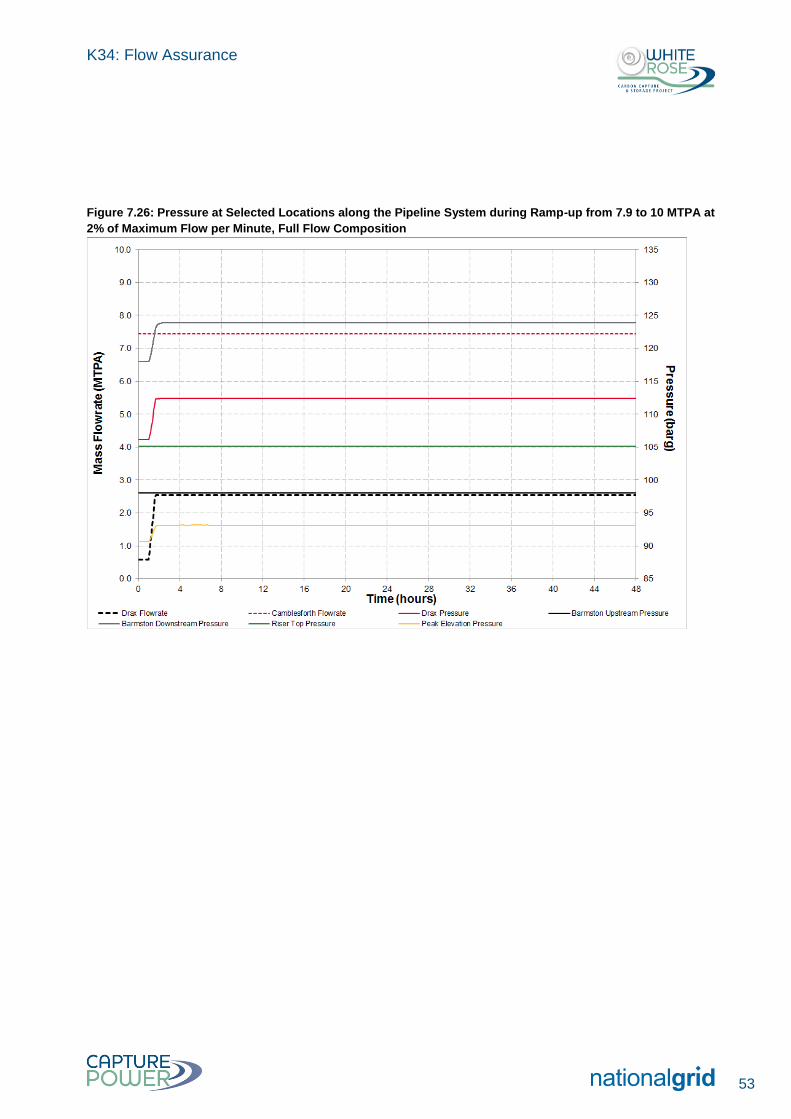
K34: Flow Assurance
53
Figure 7.26: Pressure at Selected Locations along the Pipeline System during Ramp-up from 7.9 to 10 MTPA at
2% of Maximum Flow per Minute, Full Flow Composition
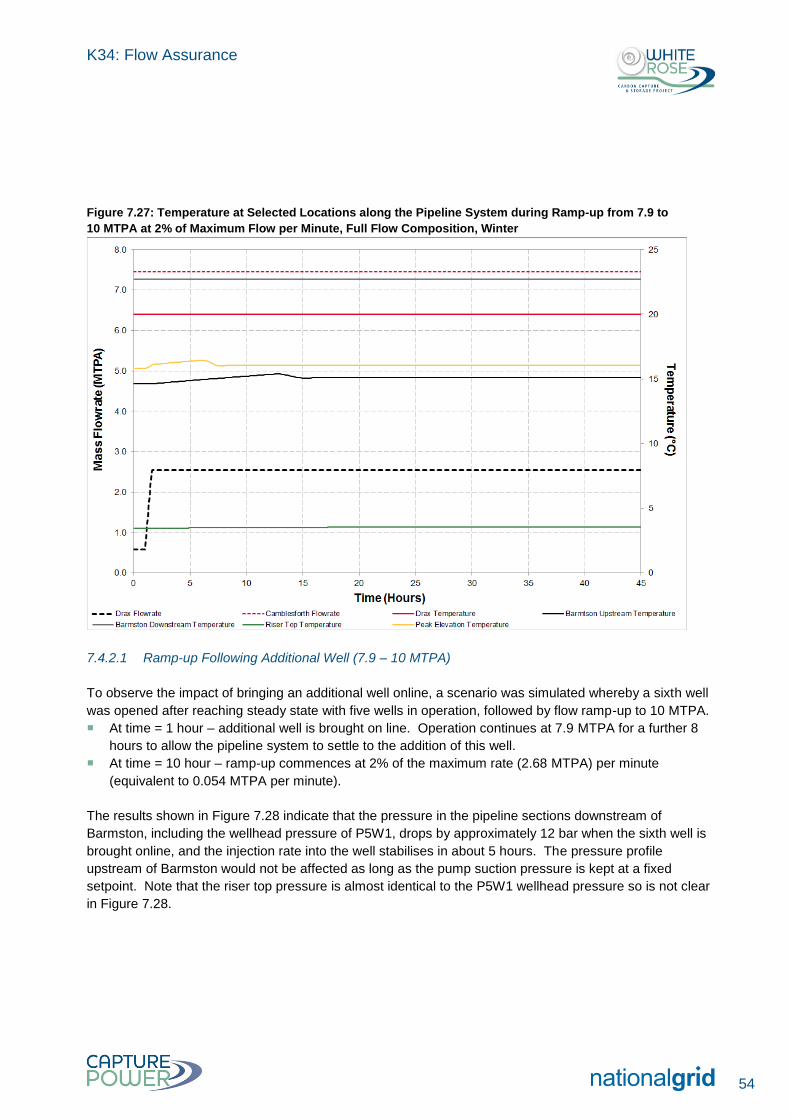
K34: Flow Assurance
54
Figure 7.27: Temperature at Selected Locations along the Pipeline System during Ramp-up from 7.9 to
10 MTPA at 2% of Maximum Flow per Minute, Full Flow Composition, Winter
7.4.2.1 Ramp-up Following Additional Well (7.9 – 10 MTPA)
To observe the impact of bringing an additional well online, a scenario was simulated whereby a sixth well
was opened after reaching steady state with five wells in operation, followed by flow ramp-up to 10 MTPA.
At time = 1 hour – additional well is brought on line. Operation continues at 7.9 MTPA for a further 8
hours to allow the pipeline system to settle to the addition of this well.
At time = 10 hour – ramp-up commences at 2% of the maximum rate (2.68 MTPA) per minute
(equivalent to 0.054 MTPA per minute).
The results shown in Figure 7.28 indicate that the pressure in the pipeline sections downstream of
Barmston, including the wellhead pressure of P5W1, drops by approximately 12 bar when the sixth well is
brought online, and the injection rate into the well stabilises in about 5 hours. The pressure profile
upstream of Barmston would not be affected as long as the pump suction pressure is kept at a fixed
setpoint. Note that the riser top pressure is almost identical to the P5W1 wellhead pressure so is not clear
in Figure 7.28.
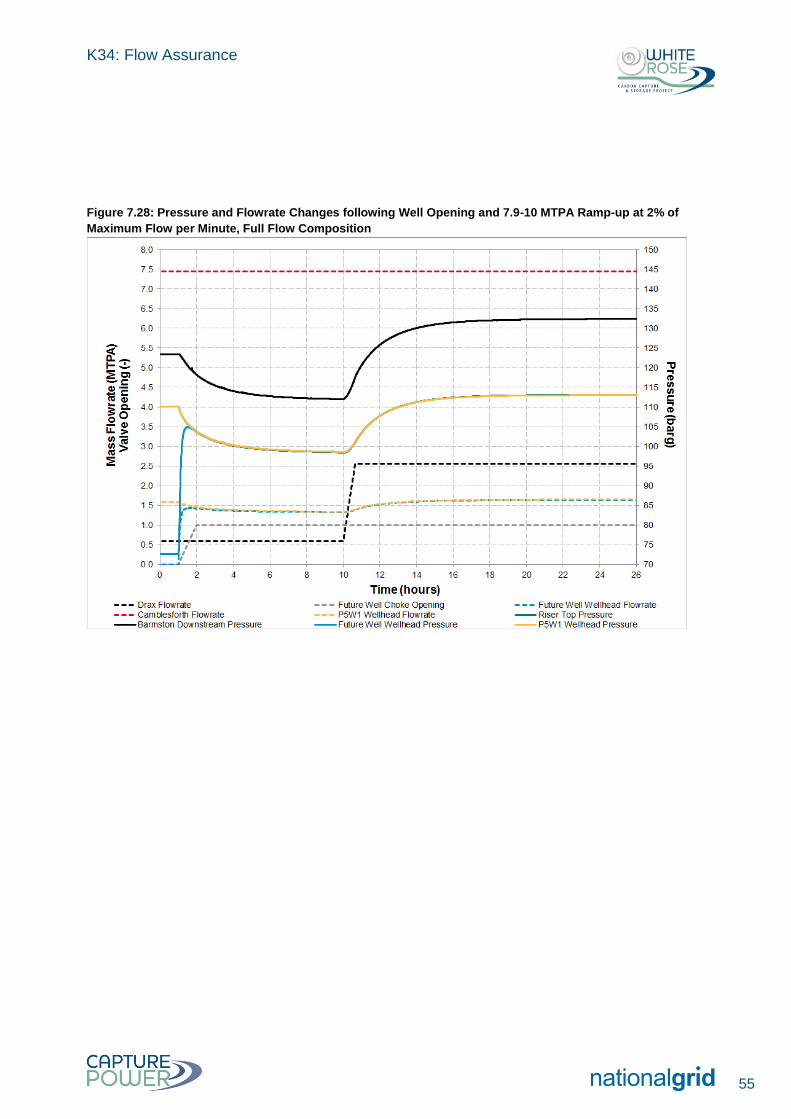
K34: Flow Assurance
55
Figure 7.28: Pressure and Flowrate Changes following Well Opening and 7.9-10 MTPA Ramp-up at 2% of
Maximum Flow per Minute, Full Flow Composition
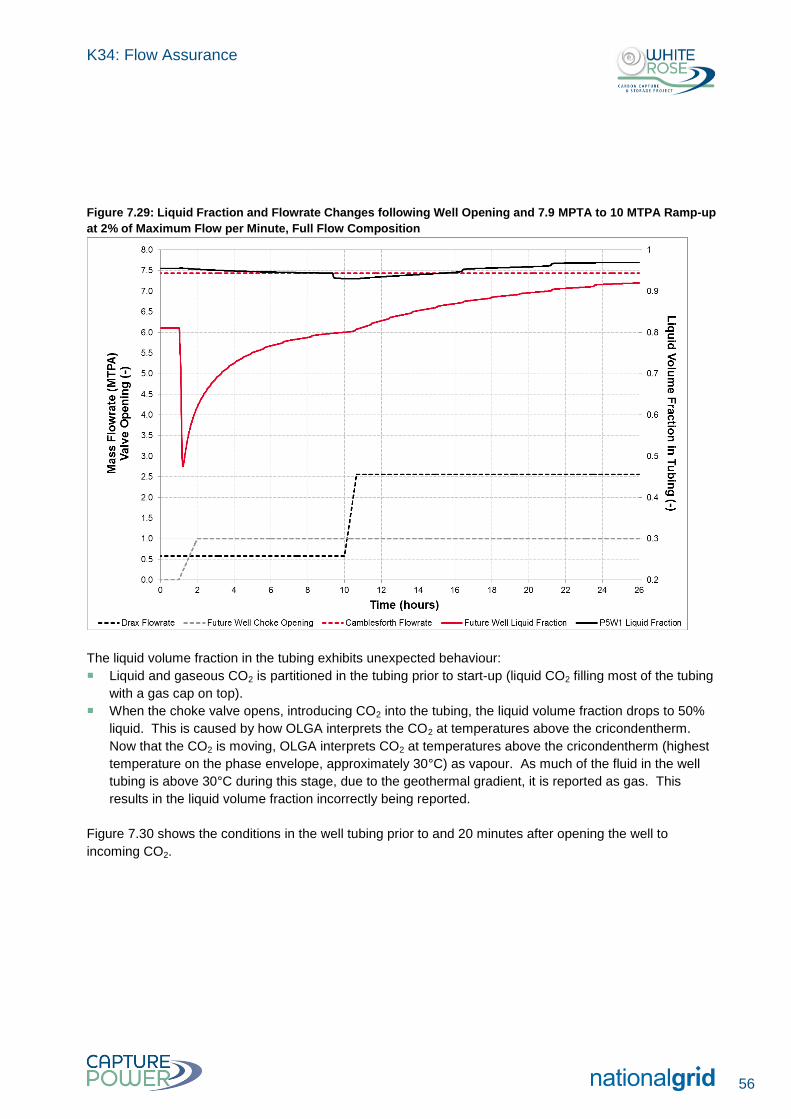
K34: Flow Assurance
56
Figure 7.29: Liquid Fraction and Flowrate Changes following Well Opening and 7.9 MPTA to 10 MTPA Ramp-up
at 2% of Maximum Flow per Minute, Full Flow Composition
The liquid volume fraction in the tubing exhibits unexpected behaviour:
Liquid and gaseous CO2 is partitioned in the tubing prior to start-up (liquid CO2 filling most of the tubing
with a gas cap on top).
When the choke valve opens, introducing CO2 into the tubing, the liquid volume fraction drops to 50%
liquid. This is caused by how OLGA interprets the CO2 at temperatures above the cricondentherm.
Now that the CO2 is moving, OLGA interprets CO2 at temperatures above the cricondentherm (highest
temperature on the phase envelope, approximately 30°C) as vapour. As much of the fluid in the well
tubing is above 30°C during this stage, due to the geothermal gradient, it is reported as gas. This
results in the liquid volume fraction incorrectly being reported.
Figure 7.30 shows the conditions in the well tubing prior to and 20 minutes after opening the well to
incoming CO2.
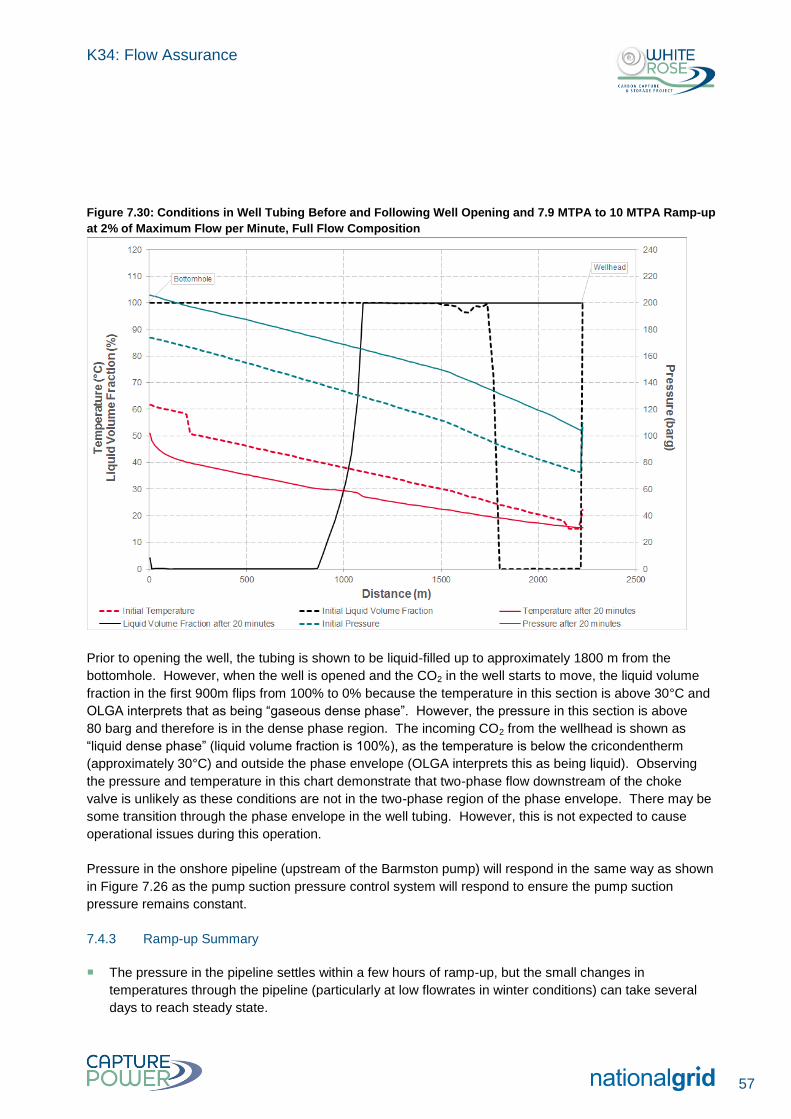
K34: Flow Assurance
57
Figure 7.30: Conditions in Well Tubing Before and Following Well Opening and 7.9 MTPA to 10 MTPA Ramp-up
at 2% of Maximum Flow per Minute, Full Flow Composition
Prior to opening the well, the tubing is shown to be liquid-filled up to approximately 1800 m from the
bottomhole. However, when the well is opened and the CO2 in the well starts to move, the liquid volume
fraction in the first 900m flips from 100% to 0% because the temperature in this section is above 30°C and
OLGA interprets that as being “gaseous dense phase”. However, the pressure in this section is above
80 barg and therefore is in the dense phase region. The incoming CO2 from the wellhead is shown as
“liquid dense phase” (liquid volume fraction is 100%), as the temperature is below the cricondentherm
(approximately 30°C) and outside the phase envelope (OLGA interprets this as being liquid). Observing
the pressure and temperature in this chart demonstrate that two-phase flow downstream of the choke
valve is unlikely as these conditions are not in the two-phase region of the phase envelope. There may be
some transition through the phase envelope in the well tubing. However, this is not expected to cause
operational issues during this operation.
Pressure in the onshore pipeline (upstream of the Barmston pump) will respond in the same way as shown
in Figure 7.26 as the pump suction pressure control system will respond to ensure the pump suction
pressure remains constant.
7.4.3 Ramp-up Summary
The pressure in the pipeline settles within a few hours of ramp-up, but the small changes in
temperatures through the pipeline (particularly at low flowrates in winter conditions) can take several
days to reach steady state.
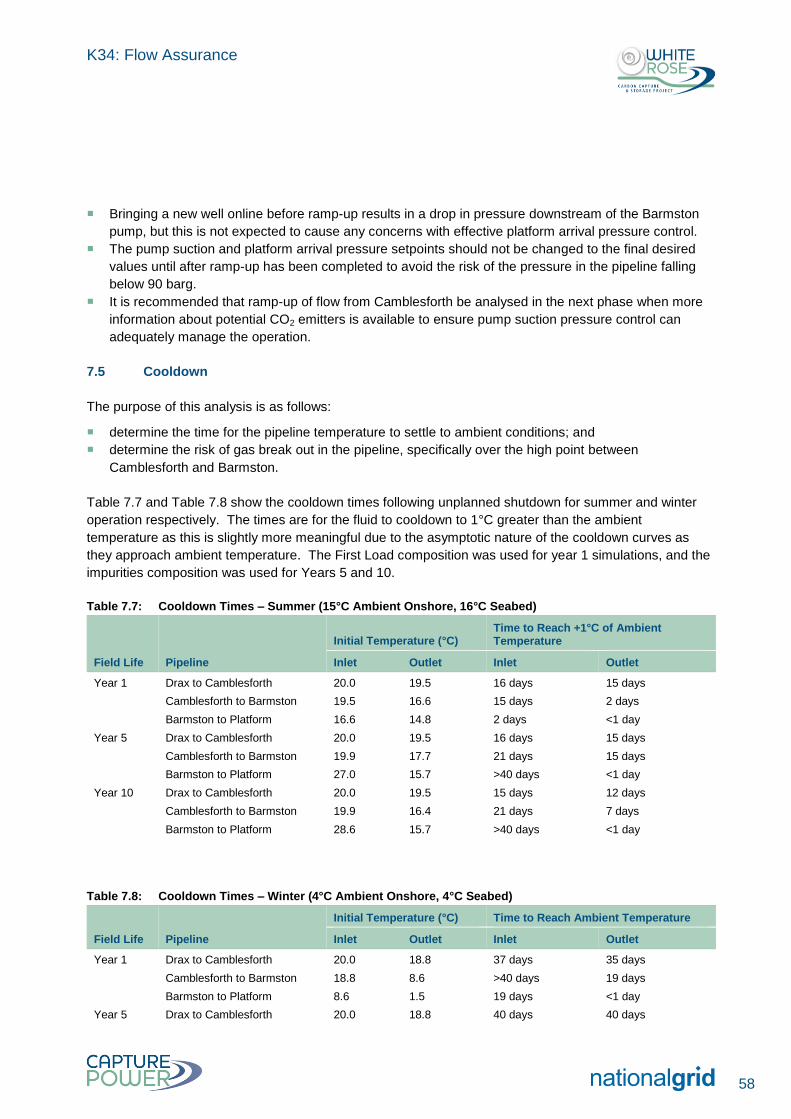
K34: Flow Assurance
58
Bringing a new well online before ramp-up results in a drop in pressure downstream of the Barmston
pump, but this is not expected to cause any concerns with effective platform arrival pressure control.
The pump suction and platform arrival pressure setpoints should not be changed to the final desired
values until after ramp-up has been completed to avoid the risk of the pressure in the pipeline falling
below 90 barg.
It is recommended that ramp-up of flow from Camblesforth be analysed in the next phase when more
information about potential CO2 emitters is available to ensure pump suction pressure control can
adequately manage the operation.
7.5 Cooldown
The purpose of this analysis is as follows:
determine the time for the pipeline temperature to settle to ambient conditions; and
determine the risk of gas break out in the pipeline, specifically over the high point between
Camblesforth and Barmston.
Table 7.7 and Table 7.8 show the cooldown times following unplanned shutdown for summer and winter
operation respectively. The times are for the fluid to cooldown to 1°C greater than the ambient
temperature as this is slightly more meaningful due to the asymptotic nature of the cooldown curves as
they approach ambient temperature. The First Load composition was used for year 1 simulations, and the
impurities composition was used for Years 5 and 10.
Table 7.7: Cooldown Times – Summer (15°C Ambient Onshore, 16°C Seabed)
Field Life Pipeline
Initial Temperature (°C) Time to Reach +1°C of Ambient Temperature
Inlet Outlet Inlet Outlet
Year 1 Drax to Camblesforth 20.0 19.5 16 days 15 days
Camblesforth to Barmston 19.5 16.6 15 days 2 days
Barmston to Platform 16.6 14.8 2 days <1 day
Year 5 Drax to Camblesforth 20.0 19.5 16 days 15 days
Camblesforth to Barmston 19.9 17.7 21 days 15 days
Barmston to Platform 27.0 15.7 >40 days <1 day
Year 10 Drax to Camblesforth 20.0 19.5 15 days 12 days
Camblesforth to Barmston 19.9 16.4 21 days 7 days
Barmston to Platform 28.6 15.7 >40 days <1 day
Table 7.8: Cooldown Times – Winter (4°C Ambient Onshore, 4°C Seabed)
Field Life Pipeline
Initial Temperature (°C) Time to Reach Ambient Temperature
Inlet Outlet Inlet Outlet
Year 1 Drax to Camblesforth 20.0 18.8 37 days 35 days
Camblesforth to Barmston 18.8 8.6 >40 days 19 days
Barmston to Platform 8.6 1.5 19 days <1 day
Year 5 Drax to Camblesforth 20.0 18.8 40 days 40 days
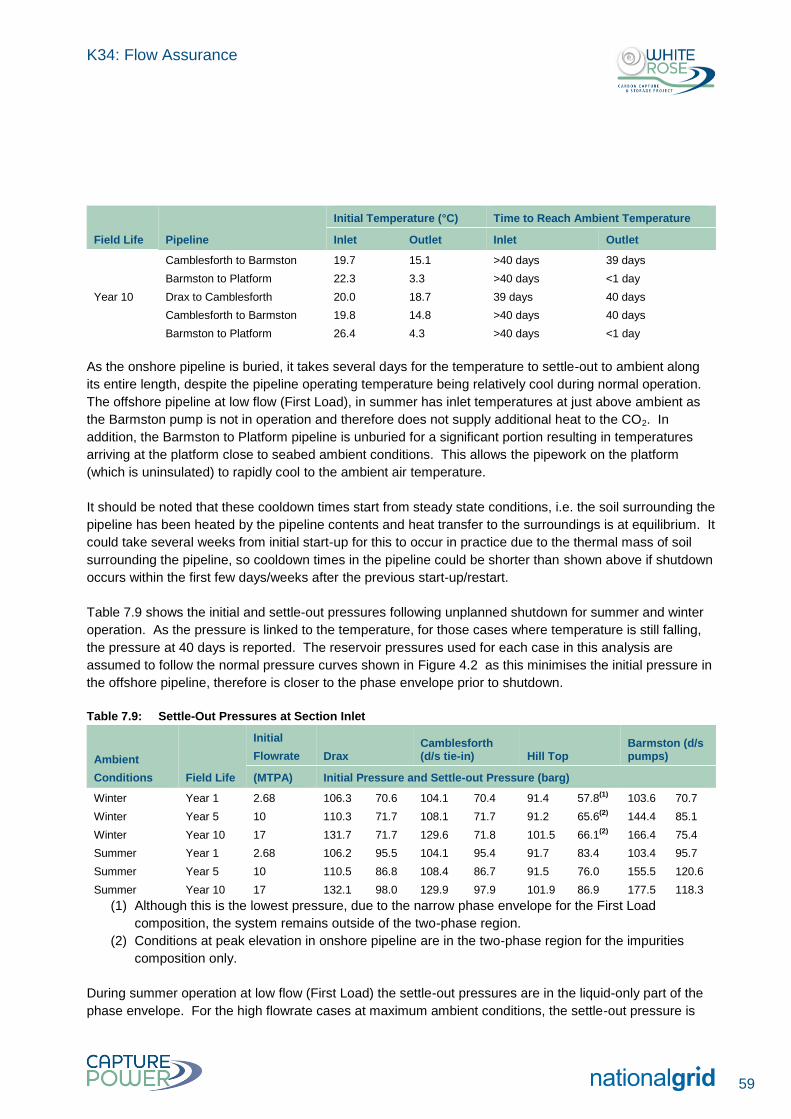
K34: Flow Assurance
59
Field Life Pipeline
Initial Temperature (°C) Time to Reach Ambient Temperature
Inlet Outlet Inlet Outlet
Camblesforth to Barmston 19.7 15.1 >40 days 39 days
Barmston to Platform 22.3 3.3 >40 days <1 day
Year 10 Drax to Camblesforth 20.0 18.7 39 days 40 days
Camblesforth to Barmston 19.8 14.8 >40 days 40 days
Barmston to Platform 26.4 4.3 >40 days <1 day
As the onshore pipeline is buried, it takes several days for the temperature to settle-out to ambient along
its entire length, despite the pipeline operating temperature being relatively cool during normal operation.
The offshore pipeline at low flow (First Load), in summer has inlet temperatures at just above ambient as
the Barmston pump is not in operation and therefore does not supply additional heat to the CO2. In
addition, the Barmston to Platform pipeline is unburied for a significant portion resulting in temperatures
arriving at the platform close to seabed ambient conditions. This allows the pipework on the platform
(which is uninsulated) to rapidly cool to the ambient air temperature.
It should be noted that these cooldown times start from steady state conditions, i.e. the soil surrounding the
pipeline has been heated by the pipeline contents and heat transfer to the surroundings is at equilibrium. It
could take several weeks from initial start-up for this to occur in practice due to the thermal mass of soil
surrounding the pipeline, so cooldown times in the pipeline could be shorter than shown above if shutdown
occurs within the first few days/weeks after the previous start-up/restart.
Table 7.9 shows the initial and settle-out pressures following unplanned shutdown for summer and winter
operation. As the pressure is linked to the temperature, for those cases where temperature is still falling,
the pressure at 40 days is reported. The reservoir pressures used for each case in this analysis are
assumed to follow the normal pressure curves shown in Figure 4.2 as this minimises the initial pressure in
the offshore pipeline, therefore is closer to the phase envelope prior to shutdown.
Table 7.9: Settle-Out Pressures at Section Inlet
Ambient
Conditions Field Life
Initial
Flowrate Drax Camblesforth (d/s tie-in) Hill Top
Barmston (d/s pumps)
(MTPA) Initial Pressure and Settle-out Pressure (barg)
Winter Year 1 2.68 106.3 70.6 104.1 70.4 91.4 57.8(1) 103.6 70.7
Winter Year 5 10 110.3 71.7 108.1 71.7 91.2 65.6(2) 144.4 85.1
Winter Year 10 17 131.7 71.7 129.6 71.8 101.5 66.1(2) 166.4 75.4
Summer Year 1 2.68 106.2 95.5 104.1 95.4 91.7 83.4 103.4 95.7
Summer Year 5 10 110.5 86.8 108.4 86.7 91.5 76.0 155.5 120.6
Summer Year 10 17 132.1 98.0 129.9 97.9 101.9 86.9 177.5 118.3
(1) Although this is the lowest pressure, due to the narrow phase envelope for the First Load
composition, the system remains outside of the two-phase region.
(2) Conditions at peak elevation in onshore pipeline are in the two-phase region for the impurities
composition only.
During summer operation at low flow (First Load) the settle-out pressures are in the liquid-only part of the
phase envelope. For the high flowrate cases at maximum ambient conditions, the settle-out pressure is
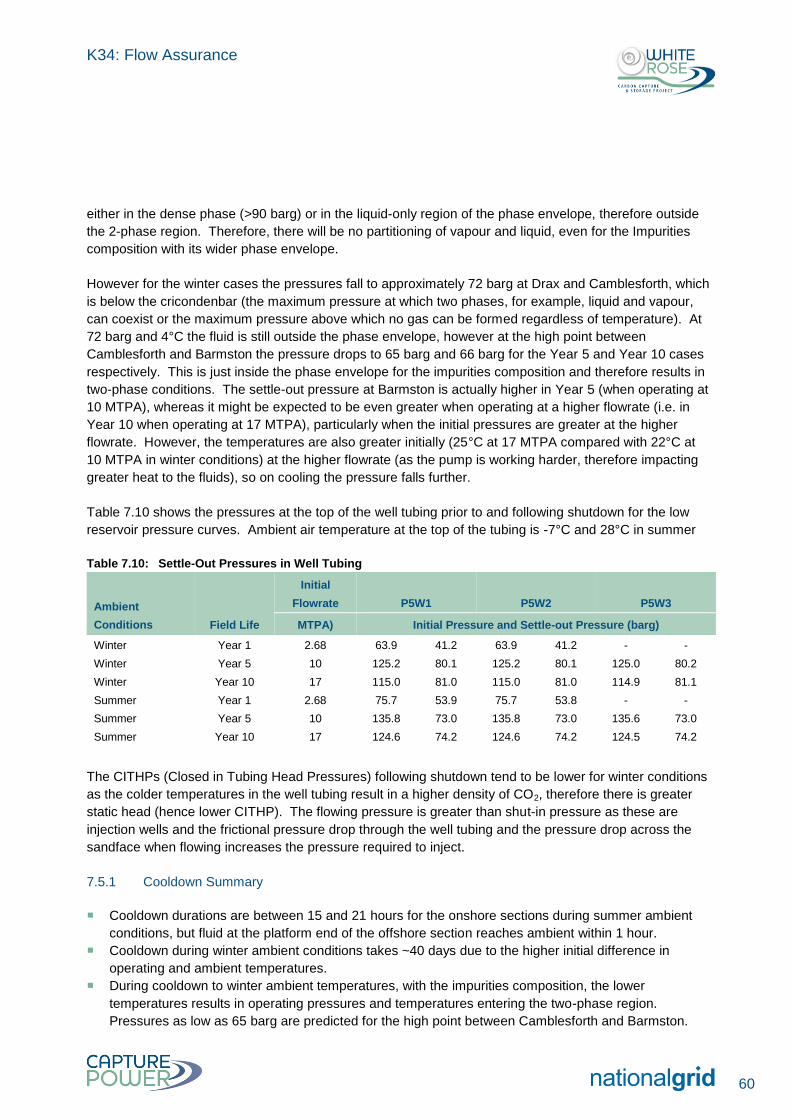
K34: Flow Assurance
60
either in the dense phase (>90 barg) or in the liquid-only region of the phase envelope, therefore outside
the 2-phase region. Therefore, there will be no partitioning of vapour and liquid, even for the Impurities
composition with its wider phase envelope.
However for the winter cases the pressures fall to approximately 72 barg at Drax and Camblesforth, which
is below the cricondenbar (the maximum pressure at which two phases, for example, liquid and vapour,
can coexist or the maximum pressure above which no gas can be formed regardless of temperature). At
72 barg and 4°C the fluid is still outside the phase envelope, however at the high point between
Camblesforth and Barmston the pressure drops to 65 barg and 66 barg for the Year 5 and Year 10 cases
respectively. This is just inside the phase envelope for the impurities composition and therefore results in
two-phase conditions. The settle-out pressure at Barmston is actually higher in Year 5 (when operating at
10 MTPA), whereas it might be expected to be even greater when operating at a higher flowrate (i.e. in
Year 10 when operating at 17 MTPA), particularly when the initial pressures are greater at the higher
flowrate. However, the temperatures are also greater initially (25°C at 17 MTPA compared with 22°C at
10 MTPA in winter conditions) at the higher flowrate (as the pump is working harder, therefore impacting
greater heat to the fluids), so on cooling the pressure falls further.
Table 7.10 shows the pressures at the top of the well tubing prior to and following shutdown for the low
reservoir pressure curves. Ambient air temperature at the top of the tubing is -7°C and 28°C in summer
Table 7.10: Settle-Out Pressures in Well Tubing
Ambient
Conditions Field Life
Initial
Flowrate P5W1 P5W2 P5W3
MTPA) Initial Pressure and Settle-out Pressure (barg)
Winter Year 1 2.68 63.9 41.2 63.9 41.2 - -
Winter Year 5 10 125.2 80.1 125.2 80.1 125.0 80.2
Winter Year 10 17 115.0 81.0 115.0 81.0 114.9 81.1
Summer Year 1 2.68 75.7 53.9 75.7 53.8 - -
Summer Year 5 10 135.8 73.0 135.8 73.0 135.6 73.0
Summer Year 10 17 124.6 74.2 124.6 74.2 124.5 74.2
The CITHPs (Closed in Tubing Head Pressures) following shutdown tend to be lower for winter conditions
as the colder temperatures in the well tubing result in a higher density of CO2, therefore there is greater
static head (hence lower CITHP). The flowing pressure is greater than shut-in pressure as these are
injection wells and the frictional pressure drop through the well tubing and the pressure drop across the
sandface when flowing increases the pressure required to inject.
7.5.1 Cooldown Summary
Cooldown durations are between 15 and 21 hours for the onshore sections during summer ambient
conditions, but fluid at the platform end of the offshore section reaches ambient within 1 hour.
Cooldown during winter ambient conditions takes ~40 days due to the higher initial difference in
operating and ambient temperatures.
During cooldown to winter ambient temperatures, with the impurities composition, the lower
temperatures results in operating pressures and temperatures entering the two-phase region.
Pressures as low as 65 barg are predicted for the high point between Camblesforth and Barmston.
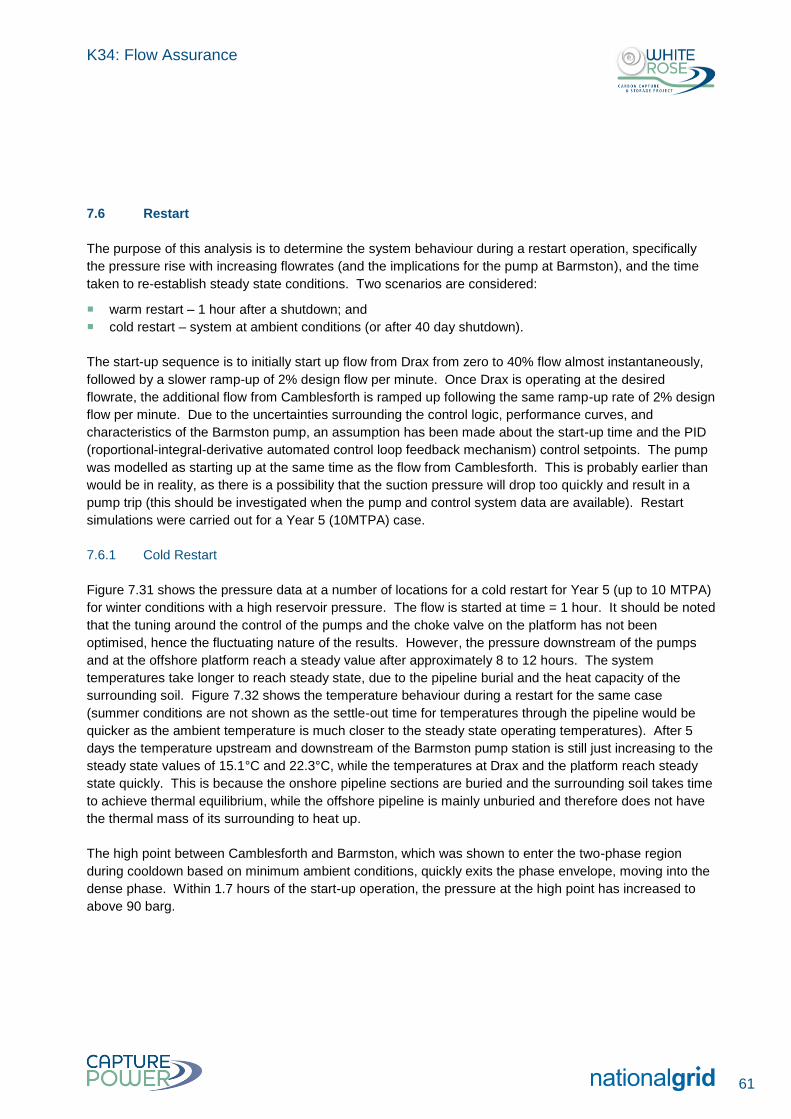
K34: Flow Assurance
61
7.6 Restart
The purpose of this analysis is to determine the system behaviour during a restart operation, specifically
the pressure rise with increasing flowrates (and the implications for the pump at Barmston), and the time
taken to re-establish steady state conditions. Two scenarios are considered:
warm restart – 1 hour after a shutdown; and
cold restart – system at ambient conditions (or after 40 day shutdown).
The start-up sequence is to initially start up flow from Drax from zero to 40% flow almost instantaneously,
followed by a slower ramp-up of 2% design flow per minute. Once Drax is operating at the desired
flowrate, the additional flow from Camblesforth is ramped up following the same ramp-up rate of 2% design
flow per minute. Due to the uncertainties surrounding the control logic, performance curves, and
characteristics of the Barmston pump, an assumption has been made about the start-up time and the PID
(roportional-integral-derivative automated control loop feedback mechanism) control setpoints. The pump
was modelled as starting up at the same time as the flow from Camblesforth. This is probably earlier than
would be in reality, as there is a possibility that the suction pressure will drop too quickly and result in a
pump trip (this should be investigated when the pump and control system data are available). Restart
simulations were carried out for a Year 5 (10MTPA) case.
7.6.1 Cold Restart
Figure 7.31 shows the pressure data at a number of locations for a cold restart for Year 5 (up to 10 MTPA)
for winter conditions with a high reservoir pressure. The flow is started at time = 1 hour. It should be noted
that the tuning around the control of the pumps and the choke valve on the platform has not been
optimised, hence the fluctuating nature of the results. However, the pressure downstream of the pumps
and at the offshore platform reach a steady value after approximately 8 to 12 hours. The system
temperatures take longer to reach steady state, due to the pipeline burial and the heat capacity of the
surrounding soil. Figure 7.32 shows the temperature behaviour during a restart for the same case
(summer conditions are not shown as the settle-out time for temperatures through the pipeline would be
quicker as the ambient temperature is much closer to the steady state operating temperatures). After 5
days the temperature upstream and downstream of the Barmston pump station is still just increasing to the
steady state values of 15.1°C and 22.3°C, while the temperatures at Drax and the platform reach steady
state quickly. This is because the onshore pipeline sections are buried and the surrounding soil takes time
to achieve thermal equilibrium, while the offshore pipeline is mainly unburied and therefore does not have
the thermal mass of its surrounding to heat up.
The high point between Camblesforth and Barmston, which was shown to enter the two-phase region
during cooldown based on minimum ambient conditions, quickly exits the phase envelope, moving into the
dense phase. Within 1.7 hours of the start-up operation, the pressure at the high point has increased to
above 90 barg.
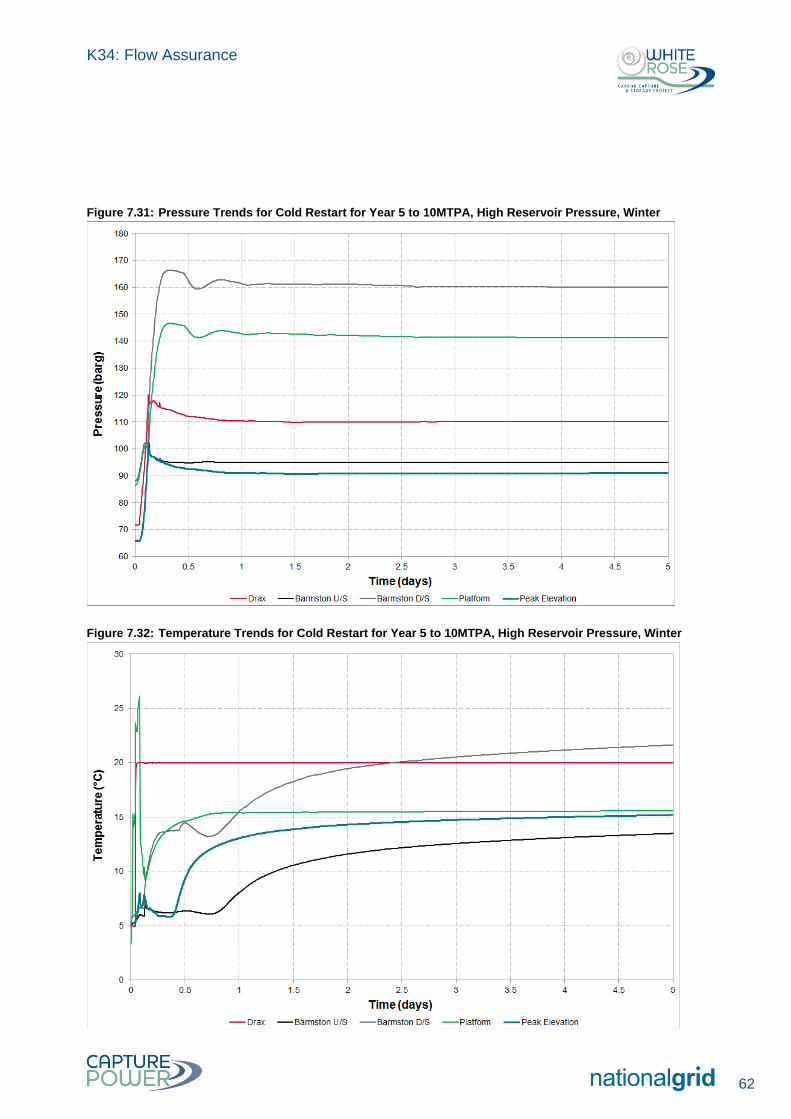
K34: Flow Assurance
62
Figure 7.31: Pressure Trends for Cold Restart for Year 5 to 10MTPA, High Reservoir Pressure, Winter
Figure 7.32: Temperature Trends for Cold Restart for Year 5 to 10MTPA, High Reservoir Pressure, Winter
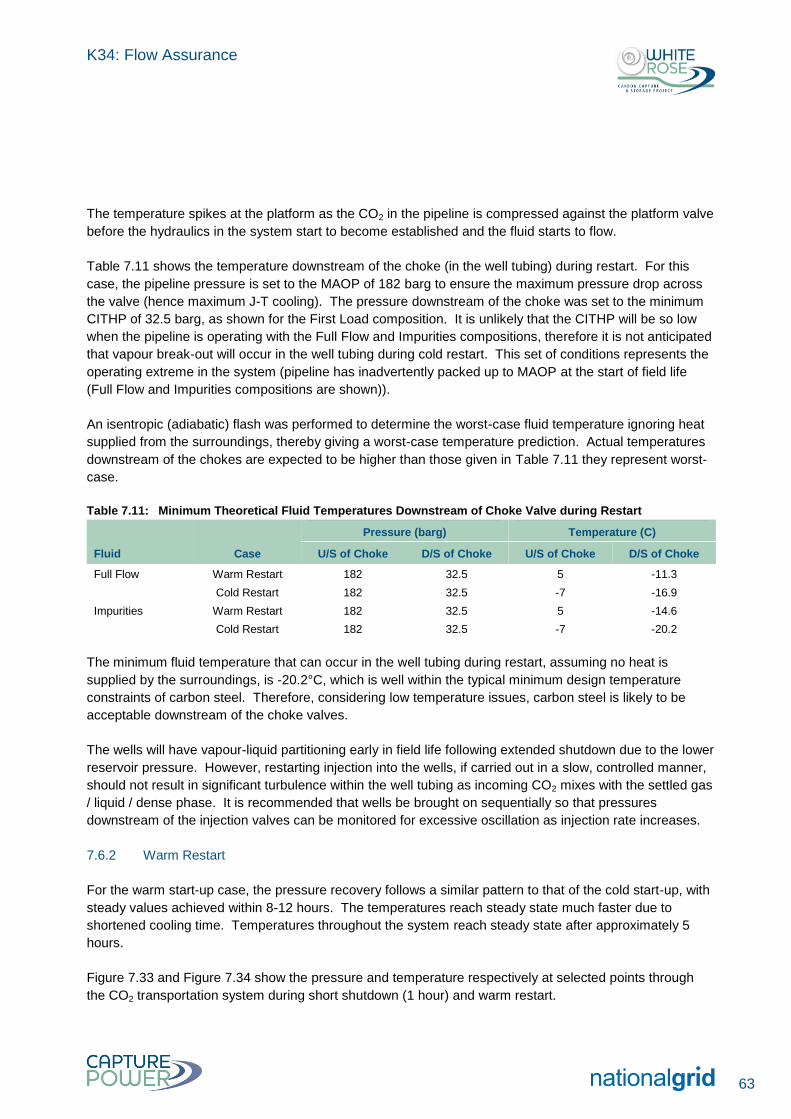
K34: Flow Assurance
63
The temperature spikes at the platform as the CO2 in the pipeline is compressed against the platform valve
before the hydraulics in the system start to become established and the fluid starts to flow.
Table 7.11 shows the temperature downstream of the choke (in the well tubing) during restart. For this
case, the pipeline pressure is set to the MAOP of 182 barg to ensure the maximum pressure drop across
the valve (hence maximum J-T cooling). The pressure downstream of the choke was set to the minimum
CITHP of 32.5 barg, as shown for the First Load composition. It is unlikely that the CITHP will be so low
when the pipeline is operating with the Full Flow and Impurities compositions, therefore it is not anticipated
that vapour break-out will occur in the well tubing during cold restart. This set of conditions represents the
operating extreme in the system (pipeline has inadvertently packed up to MAOP at the start of field life
(Full Flow and Impurities compositions are shown)).
An isentropic (adiabatic) flash was performed to determine the worst-case fluid temperature ignoring heat
supplied from the surroundings, thereby giving a worst-case temperature prediction. Actual temperatures
downstream of the chokes are expected to be higher than those given in Table 7.11 they represent worst-
case.
Table 7.11: Minimum Theoretical Fluid Temperatures Downstream of Choke Valve during Restart
Fluid Case
Pressure (barg) Temperature (C)
U/S of Choke D/S of Choke U/S of Choke D/S of Choke
Full Flow Warm Restart 182 32.5 5 -11.3
Cold Restart 182 32.5 -7 -16.9
Impurities Warm Restart 182 32.5 5 -14.6
Cold Restart 182 32.5 -7 -20.2
The minimum fluid temperature that can occur in the well tubing during restart, assuming no heat is
supplied by the surroundings, is -20.2°C, which is well within the typical minimum design temperature
constraints of carbon steel. Therefore, considering low temperature issues, carbon steel is likely to be
acceptable downstream of the choke valves.
The wells will have vapour-liquid partitioning early in field life following extended shutdown due to the lower
reservoir pressure. However, restarting injection into the wells, if carried out in a slow, controlled manner,
should not result in significant turbulence within the well tubing as incoming CO2 mixes with the settled gas
/ liquid / dense phase. It is recommended that wells be brought on sequentially so that pressures
downstream of the injection valves can be monitored for excessive oscillation as injection rate increases.
7.6.2 Warm Restart
For the warm start-up case, the pressure recovery follows a similar pattern to that of the cold start-up, with
steady values achieved within 8-12 hours. The temperatures reach steady state much faster due to
shortened cooling time. Temperatures throughout the system reach steady state after approximately 5
hours.
Figure 7.33 and Figure 7.34 show the pressure and temperature respectively at selected points through
the CO2 transportation system during short shutdown (1 hour) and warm restart.
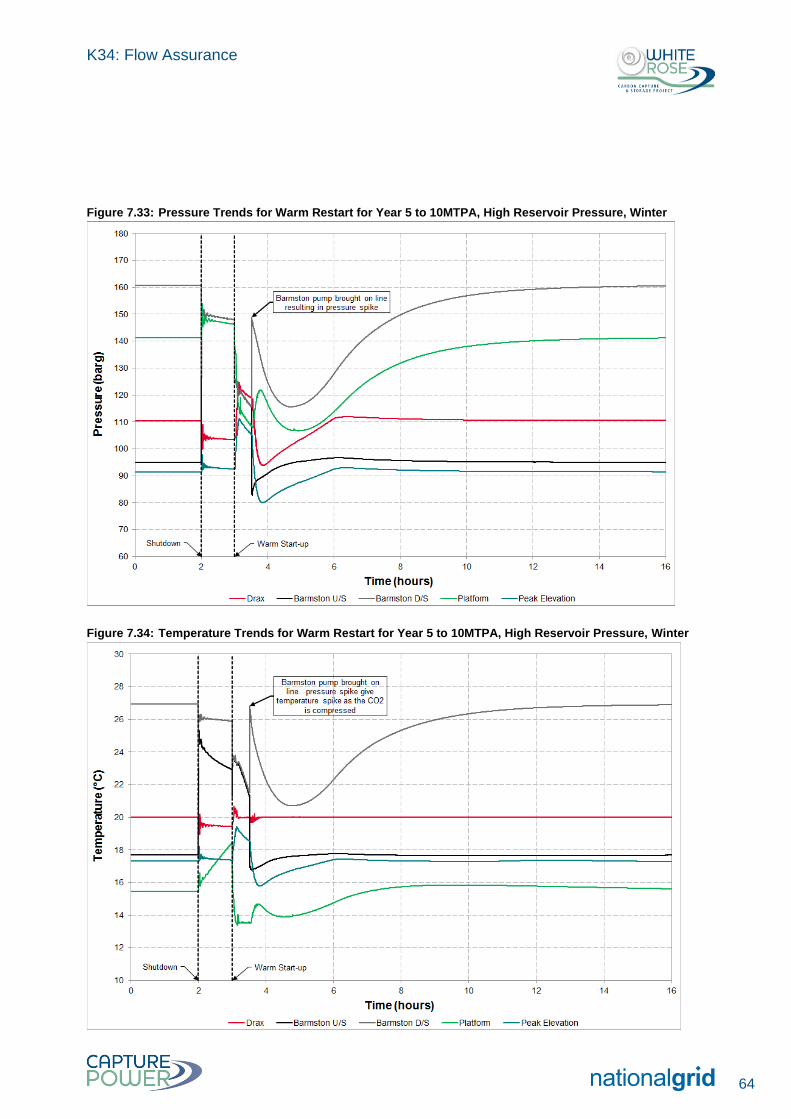
K34: Flow Assurance
64
Figure 7.33: Pressure Trends for Warm Restart for Year 5 to 10MTPA, High Reservoir Pressure, Winter
Figure 7.34: Temperature Trends for Warm Restart for Year 5 to 10MTPA, High Reservoir Pressure, Winter
K34: Flow Assurance
65
When the Barmston pump comes on-line there is a pressure spike with an associated temperature spike
that occurs due to the relative incompressibility (compared to gas) of the CO2. There is a subsequent drop
in pressure and temperature as the pump control system and system hydraulics start to respond and
colder CO2 is pumped.
7.6.3 Restart Summary
Restart from a warm start-up reaches thermal steady state after approximately 10 hours, with the
pressure reaching steady state in a similar time.
Cold restart simulations (starting from a pipeline at minimum ambient temperature) took in excess of 5
days to reach thermal steady state due to the time required to heat the soil surrounding the onshore
(and part of the offshore) pipeline, but reached a steady pressure within approximately 10 hours.
7.7 Depressurisation
The main aim of this analysis is to determine the minimum temperature that the pipeline will experience
during a controlled, planned, blowdown. If the depressurisation is performed too quickly, the J-T
expansion of the CO2 could result in excessively cold temperatures in the pipeline.
The onshore pipeline can be isolated at each block valve station so that individual sections can be
depressurised either as part of a full system depressurisation or to enable isolated depressurisation of a
section without the need to blow down the entire pipeline. The following sections were considered in this
analysis:
Drax to Camblesforth;
Camblesforth to Tollingham;
Dalton to Skerne;
Skerne to Barmston;
Drax to Barmston;
Barmston to Platform; and
Drax to Platform.
Depressurisation of long CO2-rich dense fluid pipelines is a complex process where, generally speaking,
the following phenomena take place:
due to pressure reduction, boiling of liquid CO2 will commence causing heat to be absorbed from the
surrounding metal (pipe wall) and surrounding soil to supply the latent heat of vaporisation, thereby
reducing the metal temperature to (close to, but not below) the fluid temperature. J-T cooling will occur
as the CO2-rich gas expands and the pipeline inventory is reduced through venting; and
due to the terrain profile, gas pockets will be trapped between liquid columns causing pressure
differences on both sides of the high elevation points. Trapped liquid will continue to boil. Once the
pressure on the side closest to the vent is low enough for the gas to sweep the trapped liquid,
additional J-T cooling may occur.
For the purposes of this assessment, minimum ambient (winter) conditions have been assumed throughout
as these give rise to lowest fluid temperatures. Summer conditions produce very similar results and the
operating philosophy of depressurisation operation needs to be robust to the full range of operating
conditions and therefore would not be different for summer from winter.
K34: Flow Assurance
66
For all the cases investigated, the initial condition (before starting to depressurise) is the pipeline packed to
the MAOP (135 barg in the onshore pipeline and 182 barg in the offshore pipeline) and the fluid
temperature settled to ambient conditions. Initially, the fluid is motionless. It is noted that it may be
preferable to reduce the pressure in the pipeline to as low as practical (whilst staying above 90 barg) prior
to performing depressurisation to minimise the inventory of CO2 vented to the atmosphere. However, this
analysis considers the worst case for mass of CO2 vented.
The target pressure of the onshore and offshore system has been set to 5 barg (using an assumed vent
stack backpressure of 0.5 barg (i.e. downstream of the blowdown orifice), which is a typical assumption
when venting to atmosphere).
The minimum design temperature of the pipeline is 0°C. However, this value will be transgressed
because, as discussed earlier, the fluid will experience much lower temperatures due to the extensive J-T
cooling. Therefore, it is recommended that additional Charpy testing be carried out to ensure the pipeline
is capable of maintaining integrity at lower temperatures. For the purposes of this analysis, a minimum
fluid temperature of -20°C has been assumed as Charpy testing to this temperature is expected to be
comfortably achieved. It is assumed that the pipeline wall temperature is equal to the fluid temperature in
this analysis.
The depressurisation process in almost all cases needs to be carried out in a step-wise fashion in order to
control the extent of the J-T cooling. In this analysis, if the temperature anywhere along the pipeline
reaches -20°C, the vent is then closed and the pipeline inventory allowed to settle and warm-up before
again opening the vent. The waiting time between each blowdown period can be several days due to the
insulating properties of the surrounding soil inhibiting heat transfer from the ambient surroundings to the
CO2 in the pipeline.
It should be noted that, due to inherent challenges in modelling depressurisation of impure CO2 in OLGA
(caused mainly by the narrow phase envelopes associated with impure CO2), the depressurisation
procedure has not been optimised. The time to depressurise the various sections are therefore indicative
(particularly when depressurising very long sections). See section 7.7.3 for further details.
The following sections describe the various findings of this assessment. The Camblesforth to Tollingham
section is used to illustrate the main points, although the conclusions from analysis on this section of the
onshore pipeline are applicable to most of the scenarios investigated.
Note that the Impurities composition has been used throughout this analysis as it has the widest phase
envelope and therefore presents the greatest challenge as the pipeline inventory remains in the two-phase
region for longer during this operation. The other compositions present similar challenges with low
temperatures but as the phase envelopes are narrower they pass through the two-phase region more
quickly during depressurisation.
7.7.1 Depressurisation – A Multistage Process
This section explains the necessity to depressurise the pipeline in a multi-stage process. Figure 7.35 and
Figure 7.36 show the vent rate and the minimum fluid temperature when depressurising the Camblesforth
to Tollingham section through a 1 inch orifice. The minimum pressure in the section and pressure
measured at Camblesforth are shown to demonstrate the progress of the depressurisation.
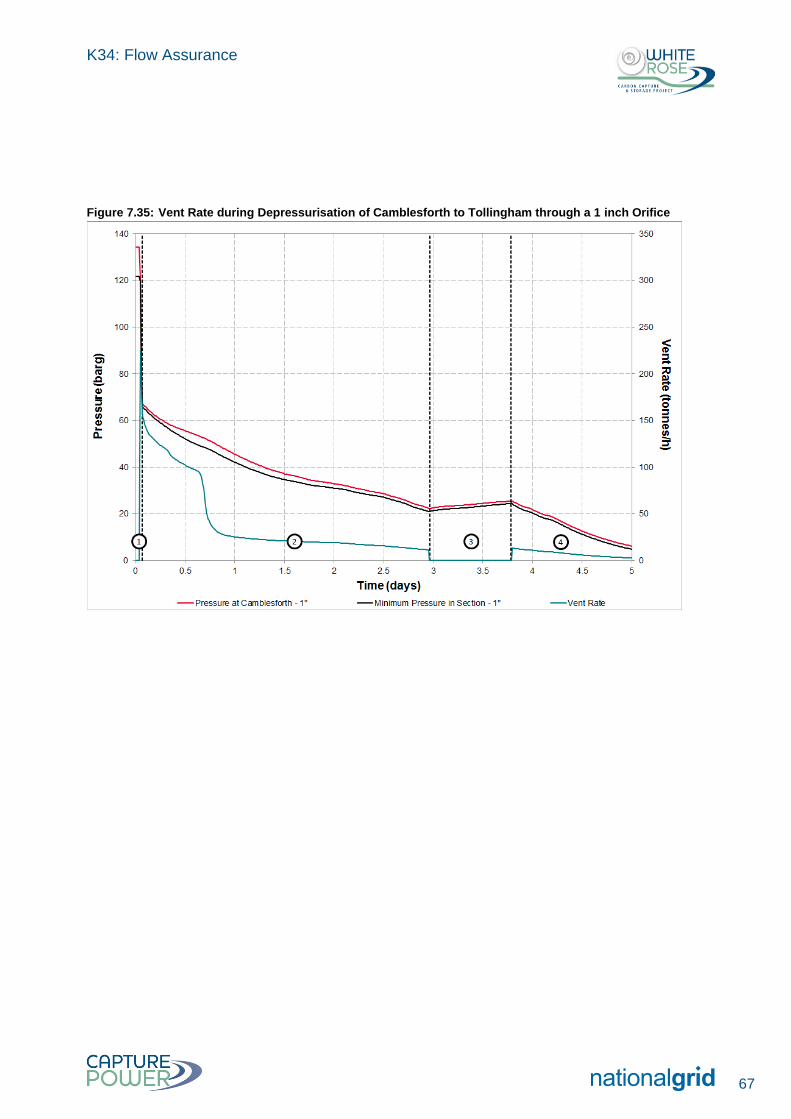
K34: Flow Assurance
67
Figure 7.35: Vent Rate during Depressurisation of Camblesforth to Tollingham through a 1 inch Orifice
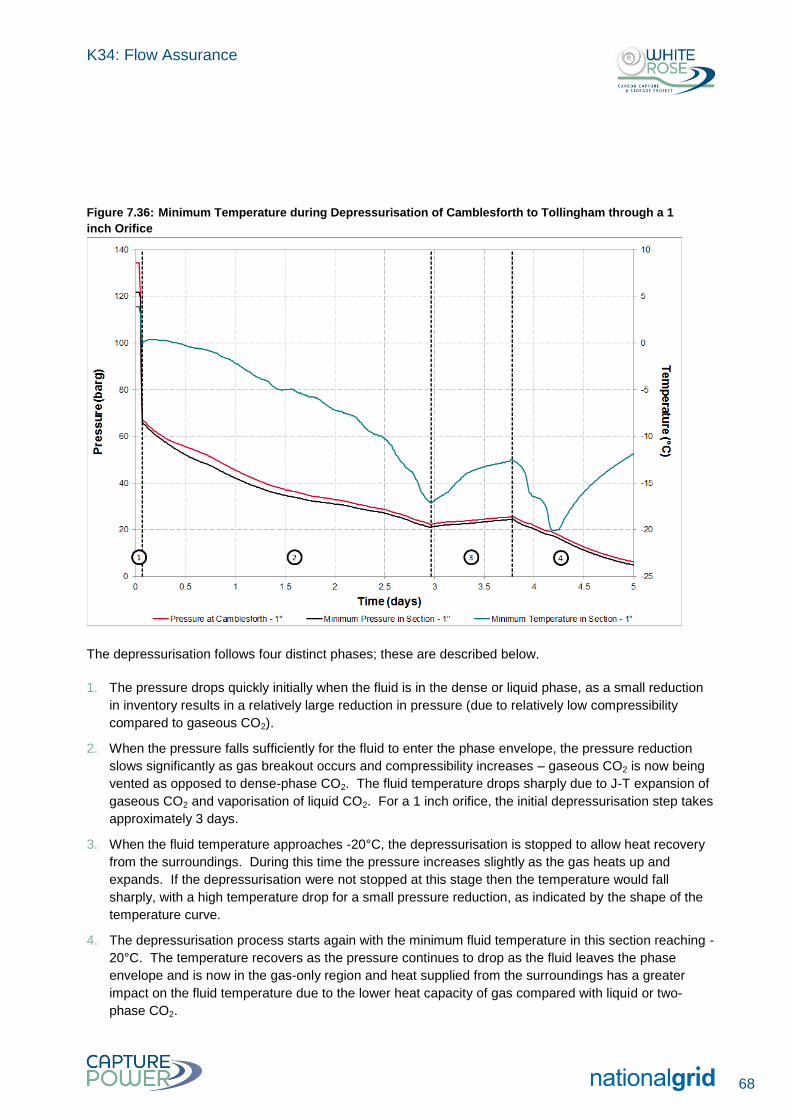
K34: Flow Assurance
68
Figure 7.36: Minimum Temperature during Depressurisation of Camblesforth to Tollingham through a 1
inch Orifice
The depressurisation follows four distinct phases; these are described below.
1. The pressure drops quickly initially when the fluid is in the dense or liquid phase, as a small reduction
in inventory results in a relatively large reduction in pressure (due to relatively low compressibility
compared to gaseous CO2).
2. When the pressure falls sufficiently for the fluid to enter the phase envelope, the pressure reduction
slows significantly as gas breakout occurs and compressibility increases – gaseous CO2 is now being
vented as opposed to dense-phase CO2. The fluid temperature drops sharply due to J-T expansion of
gaseous CO2 and vaporisation of liquid CO2. For a 1 inch orifice, the initial depressurisation step takes
approximately 3 days.
3. When the fluid temperature approaches -20°C, the depressurisation is stopped to allow heat recovery
from the surroundings. During this time the pressure increases slightly as the gas heats up and
expands. If the depressurisation were not stopped at this stage then the temperature would fall
sharply, with a high temperature drop for a small pressure reduction, as indicated by the shape of the
temperature curve.
4. The depressurisation process starts again with the minimum fluid temperature in this section reaching -
20°C. The temperature recovers as the pressure continues to drop as the fluid leaves the phase
envelope and is now in the gas-only region and heat supplied from the surroundings has a greater
impact on the fluid temperature due to the lower heat capacity of gas compared with liquid or two-
phase CO2.
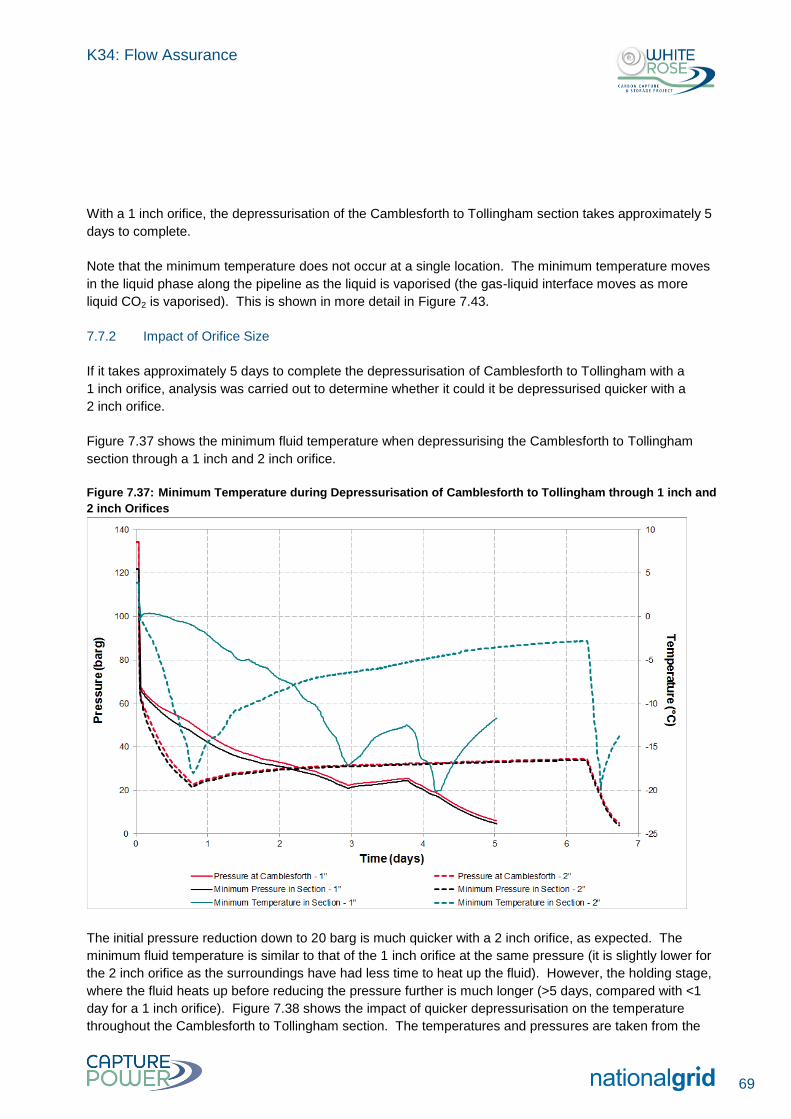
K34: Flow Assurance
69
With a 1 inch orifice, the depressurisation of the Camblesforth to Tollingham section takes approximately 5
days to complete.
Note that the minimum temperature does not occur at a single location. The minimum temperature moves
in the liquid phase along the pipeline as the liquid is vaporised (the gas-liquid interface moves as more
liquid CO2 is vaporised). This is shown in more detail in Figure 7.43.
7.7.2 Impact of Orifice Size
If it takes approximately 5 days to complete the depressurisation of Camblesforth to Tollingham with a
1 inch orifice, analysis was carried out to determine whether it could it be depressurised quicker with a
2 inch orifice.
Figure 7.37 shows the minimum fluid temperature when depressurising the Camblesforth to Tollingham
section through a 1 inch and 2 inch orifice.
Figure 7.37: Minimum Temperature during Depressurisation of Camblesforth to Tollingham through 1 inch and
2 inch Orifices
The initial pressure reduction down to 20 barg is much quicker with a 2 inch orifice, as expected. The
minimum fluid temperature is similar to that of the 1 inch orifice at the same pressure (it is slightly lower for
the 2 inch orifice as the surroundings have had less time to heat up the fluid). However, the holding stage,
where the fluid heats up before reducing the pressure further is much longer (>5 days, compared with <1
day for a 1 inch orifice). Figure 7.38 shows the impact of quicker depressurisation on the temperature
throughout the Camblesforth to Tollingham section. The temperatures and pressures are taken from the
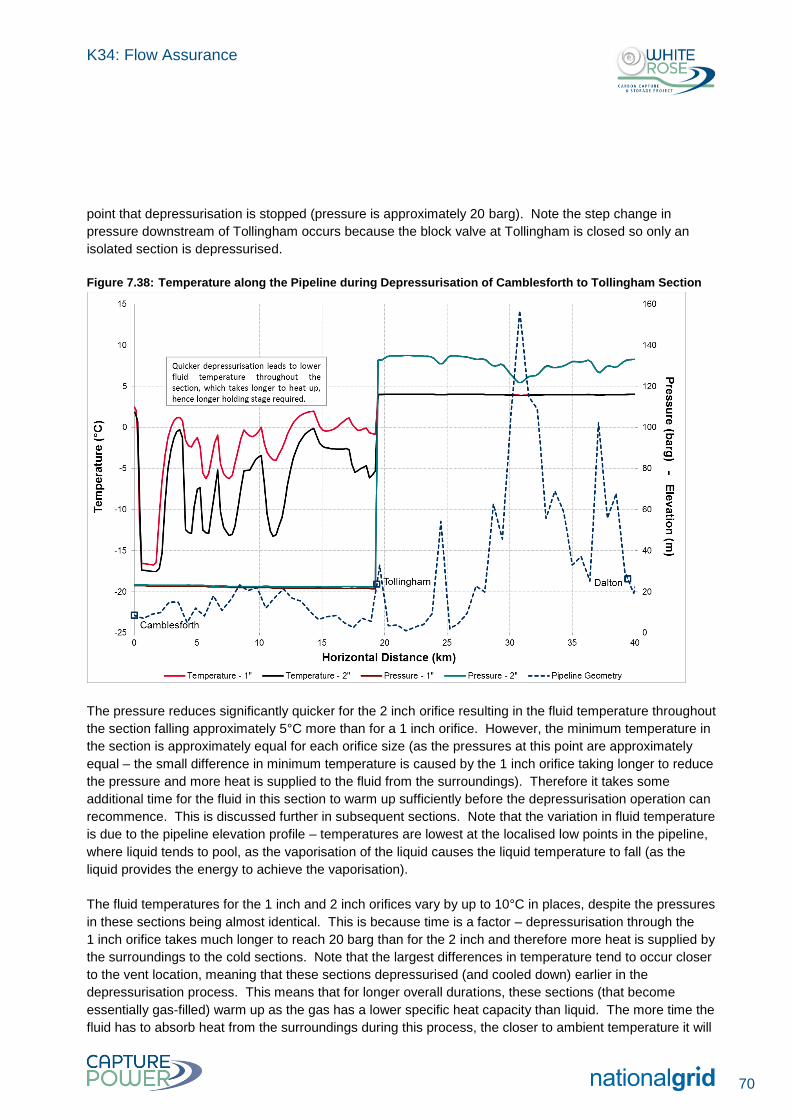
K34: Flow Assurance
70
point that depressurisation is stopped (pressure is approximately 20 barg). Note the step change in
pressure downstream of Tollingham occurs because the block valve at Tollingham is closed so only an
isolated section is depressurised.
Figure 7.38: Temperature along the Pipeline during Depressurisation of Camblesforth to Tollingham Section
The pressure reduces significantly quicker for the 2 inch orifice resulting in the fluid temperature throughout
the section falling approximately 5°C more than for a 1 inch orifice. However, the minimum temperature in
the section is approximately equal for each orifice size (as the pressures at this point are approximately
equal – the small difference in minimum temperature is caused by the 1 inch orifice taking longer to reduce
the pressure and more heat is supplied to the fluid from the surroundings). Therefore it takes some
additional time for the fluid in this section to warm up sufficiently before the depressurisation operation can
recommence. This is discussed further in subsequent sections. Note that the variation in fluid temperature
is due to the pipeline elevation profile – temperatures are lowest at the localised low points in the pipeline,
where liquid tends to pool, as the vaporisation of the liquid causes the liquid temperature to fall (as the
liquid provides the energy to achieve the vaporisation).
The fluid temperatures for the 1 inch and 2 inch orifices vary by up to 10°C in places, despite the pressures
in these sections being almost identical. This is because time is a factor – depressurisation through the
1 inch orifice takes much longer to reach 20 barg than for the 2 inch and therefore more heat is supplied by
the surroundings to the cold sections. Note that the largest differences in temperature tend to occur closer
to the vent location, meaning that these sections depressurised (and cooled down) earlier in the
depressurisation process. This means that for longer overall durations, these sections (that become
essentially gas-filled) warm up as the gas has a lower specific heat capacity than liquid. The more time the
fluid has to absorb heat from the surroundings during this process, the closer to ambient temperature it will
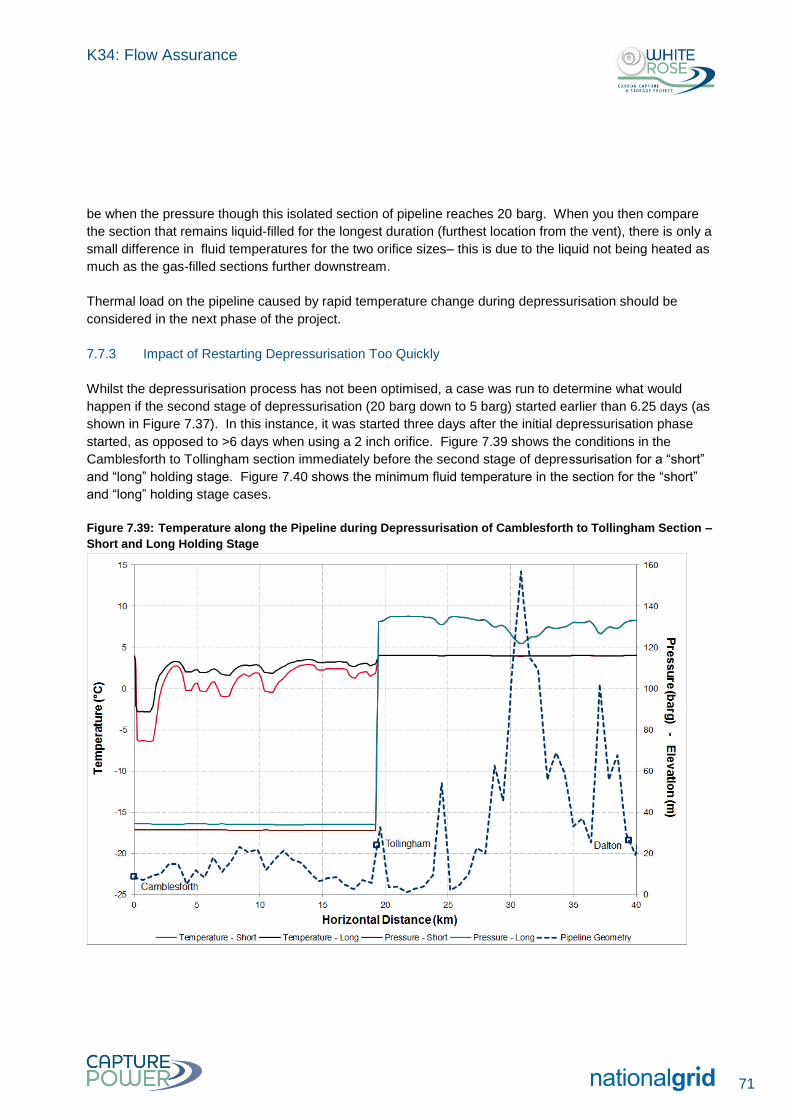
K34: Flow Assurance
71
be when the pressure though this isolated section of pipeline reaches 20 barg. When you then compare
the section that remains liquid-filled for the longest duration (furthest location from the vent), there is only a
small difference in fluid temperatures for the two orifice sizes– this is due to the liquid not being heated as
much as the gas-filled sections further downstream.
Thermal load on the pipeline caused by rapid temperature change during depressurisation should be
considered in the next phase of the project.
7.7.3 Impact of Restarting Depressurisation Too Quickly
Whilst the depressurisation process has not been optimised, a case was run to determine what would
happen if the second stage of depressurisation (20 barg down to 5 barg) started earlier than 6.25 days (as
shown in Figure 7.37). In this instance, it was started three days after the initial depressurisation phase
started, as opposed to >6 days when using a 2 inch orifice. Figure 7.39 shows the conditions in the
Camblesforth to Tollingham section immediately before the second stage of depressurisation for a “short”
and “long” holding stage. Figure 7.40 shows the minimum fluid temperature in the section for the “short”
and “long” holding stage cases.
Figure 7.39: Temperature along the Pipeline during Depressurisation of Camblesforth to Tollingham Section –
Short and Long Holding Stage
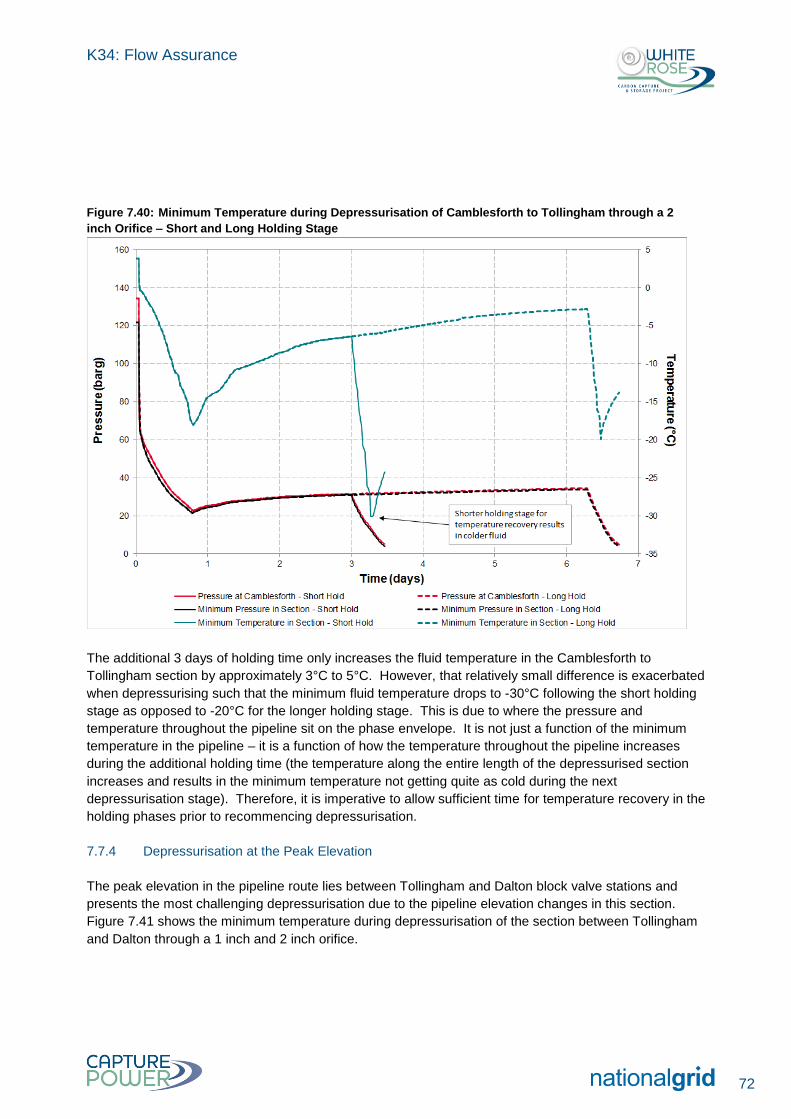
K34: Flow Assurance
72
Figure 7.40: Minimum Temperature during Depressurisation of Camblesforth to Tollingham through a 2
inch Orifice – Short and Long Holding Stage
The additional 3 days of holding time only increases the fluid temperature in the Camblesforth to
Tollingham section by approximately 3°C to 5°C. However, that relatively small difference is exacerbated
when depressurising such that the minimum fluid temperature drops to -30°C following the short holding
stage as opposed to -20°C for the longer holding stage. This is due to where the pressure and
temperature throughout the pipeline sit on the phase envelope. It is not just a function of the minimum
temperature in the pipeline – it is a function of how the temperature throughout the pipeline increases
during the additional holding time (the temperature along the entire length of the depressurised section
increases and results in the minimum temperature not getting quite as cold during the next
depressurisation stage). Therefore, it is imperative to allow sufficient time for temperature recovery in the
holding phases prior to recommencing depressurisation.
7.7.4 Depressurisation at the Peak Elevation
The peak elevation in the pipeline route lies between Tollingham and Dalton block valve stations and
presents the most challenging depressurisation due to the pipeline elevation changes in this section.
Figure 7.41 shows the minimum temperature during depressurisation of the section between Tollingham
and Dalton through a 1 inch and 2 inch orifice.
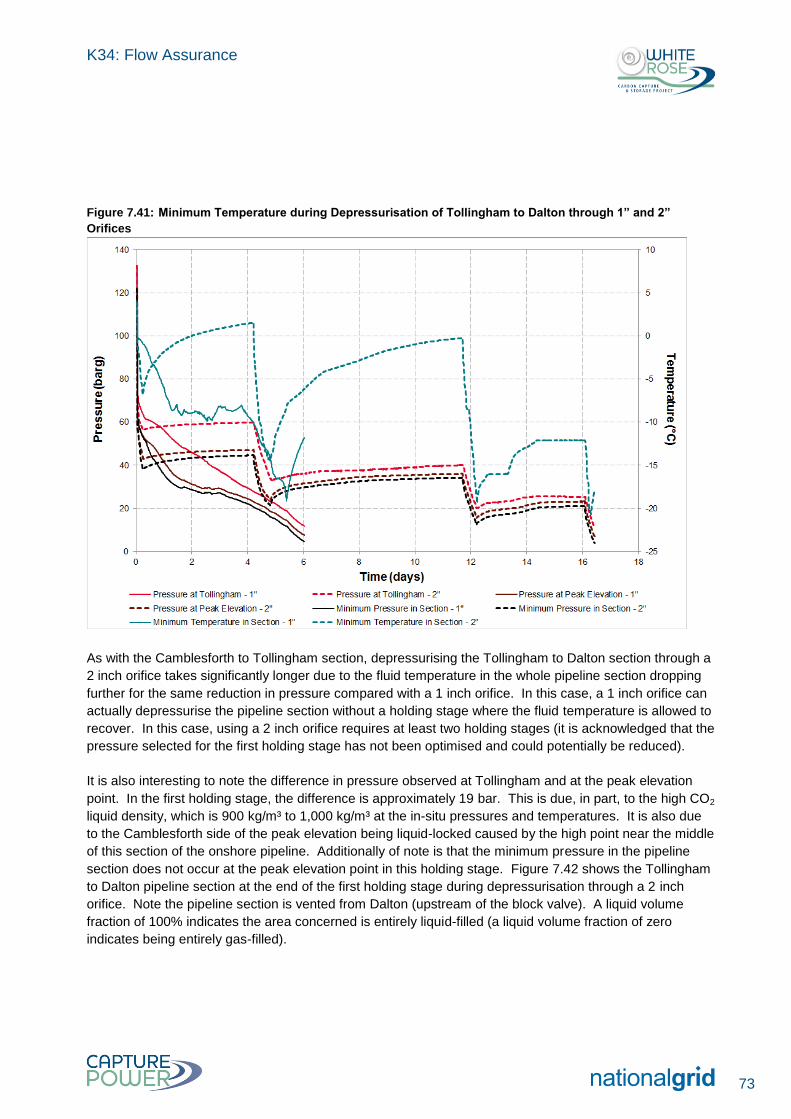
K34: Flow Assurance
73
Figure 7.41: Minimum Temperature during Depressurisation of Tollingham to Dalton through 1” and 2”
Orifices
As with the Camblesforth to Tollingham section, depressurising the Tollingham to Dalton section through a
2 inch orifice takes significantly longer due to the fluid temperature in the whole pipeline section dropping
further for the same reduction in pressure compared with a 1 inch orifice. In this case, a 1 inch orifice can
actually depressurise the pipeline section without a holding stage where the fluid temperature is allowed to
recover. In this case, using a 2 inch orifice requires at least two holding stages (it is acknowledged that the
pressure selected for the first holding stage has not been optimised and could potentially be reduced).
It is also interesting to note the difference in pressure observed at Tollingham and at the peak elevation
point. In the first holding stage, the difference is approximately 19 bar. This is due, in part, to the high CO2
liquid density, which is 900 kg/m³ to 1,000 kg/m³ at the in-situ pressures and temperatures. It is also due
to the Camblesforth side of the peak elevation being liquid-locked caused by the high point near the middle
of this section of the onshore pipeline. Additionally of note is that the minimum pressure in the pipeline
section does not occur at the peak elevation point in this holding stage. Figure 7.42 shows the Tollingham
to Dalton pipeline section at the end of the first holding stage during depressurisation through a 2 inch
orifice. Note the pipeline section is vented from Dalton (upstream of the block valve). A liquid volume
fraction of 100% indicates the area concerned is entirely liquid-filled (a liquid volume fraction of zero
indicates being entirely gas-filled).
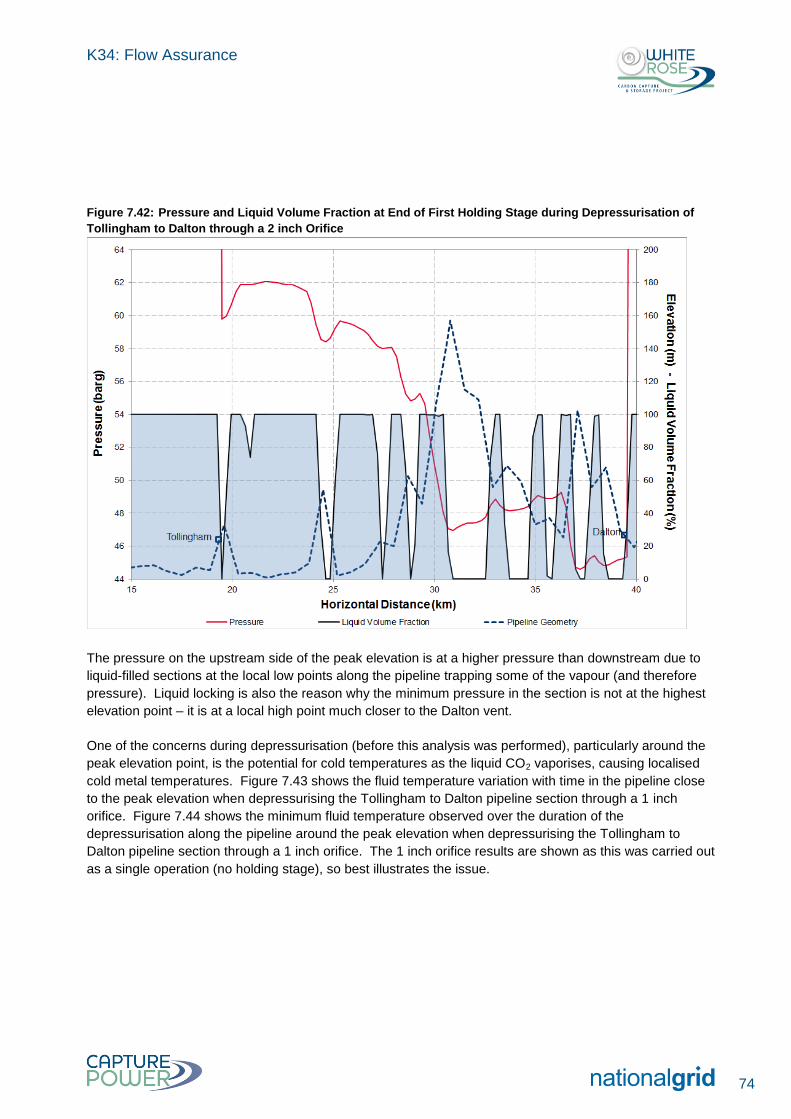
K34: Flow Assurance
74
Figure 7.42: Pressure and Liquid Volume Fraction at End of First Holding Stage during Depressurisation of
Tollingham to Dalton through a 2 inch Orifice
The pressure on the upstream side of the peak elevation is at a higher pressure than downstream due to
liquid-filled sections at the local low points along the pipeline trapping some of the vapour (and therefore
pressure). Liquid locking is also the reason why the minimum pressure in the section is not at the highest
elevation point – it is at a local high point much closer to the Dalton vent.
One of the concerns during depressurisation (before this analysis was performed), particularly around the
peak elevation point, is the potential for cold temperatures as the liquid CO2 vaporises, causing localised
cold metal temperatures. Figure 7.43 shows the fluid temperature variation with time in the pipeline close
to the peak elevation when depressurising the Tollingham to Dalton pipeline section through a 1 inch
orifice. Figure 7.44 shows the minimum fluid temperature observed over the duration of the
depressurisation along the pipeline around the peak elevation when depressurising the Tollingham to
Dalton pipeline section through a 1 inch orifice. The 1 inch orifice results are shown as this was carried out
as a single operation (no holding stage), so best illustrates the issue.
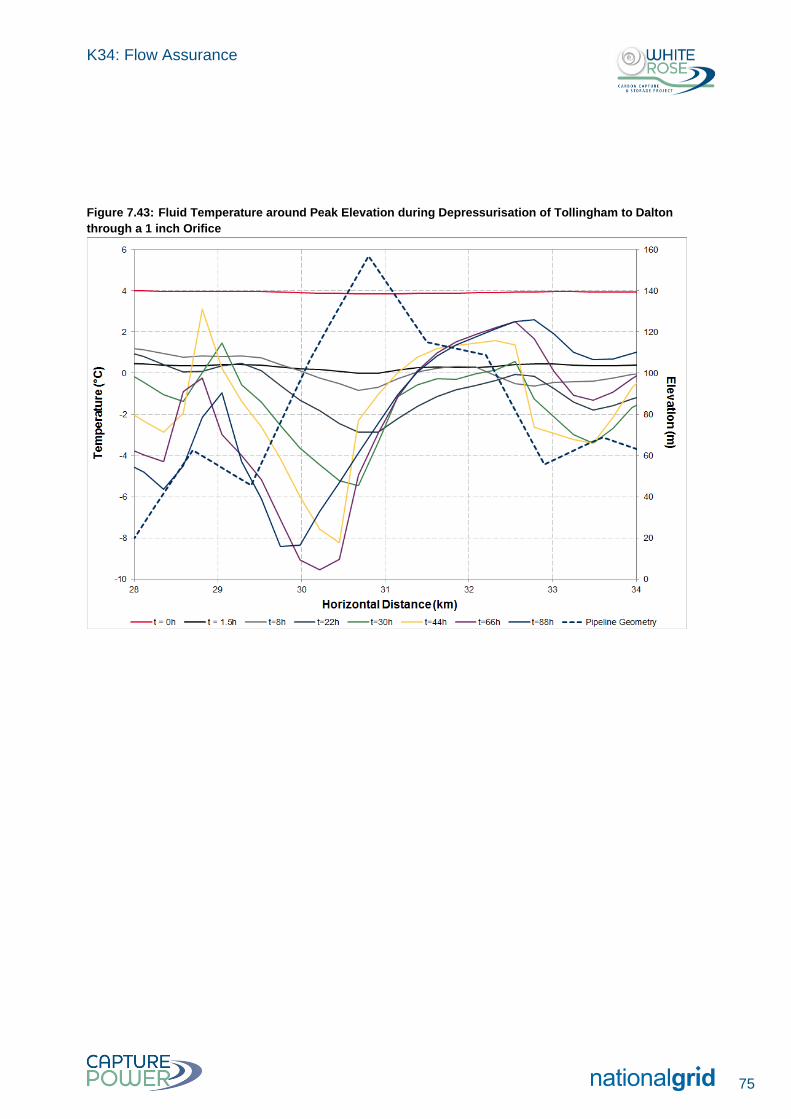
K34: Flow Assurance
75
Figure 7.43: Fluid Temperature around Peak Elevation during Depressurisation of Tollingham to Dalton
through a 1 inch Orifice
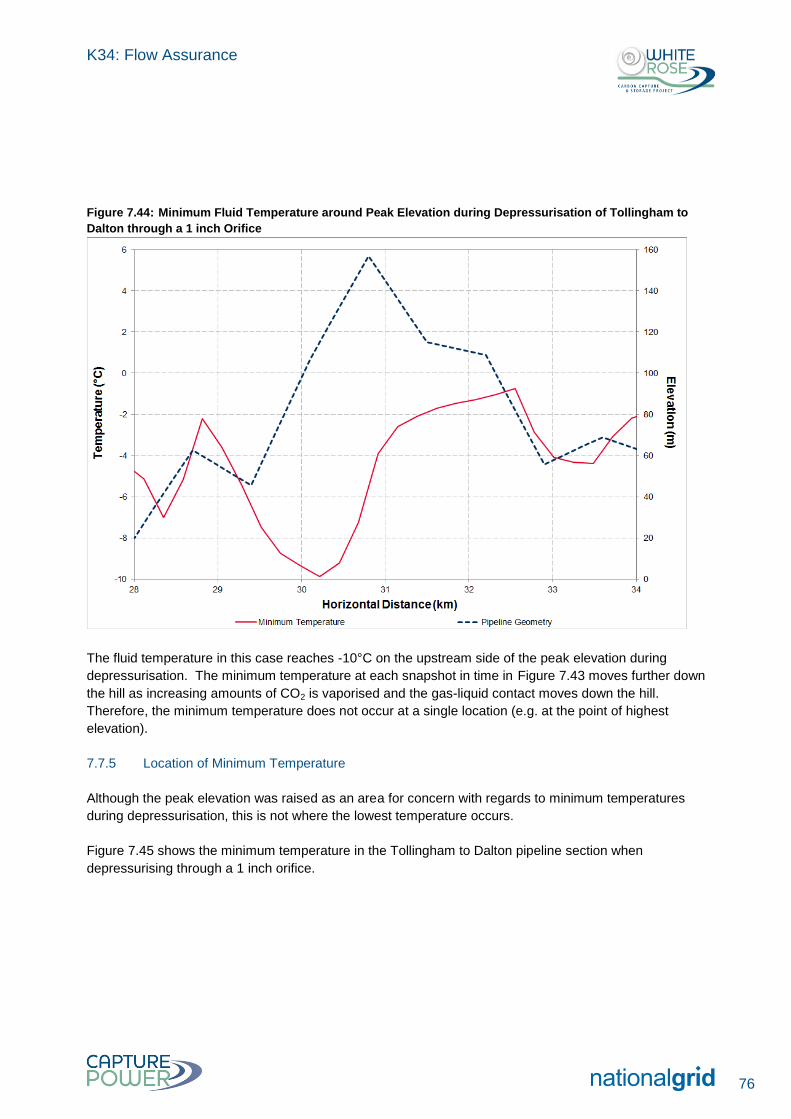
K34: Flow Assurance
76
Figure 7.44: Minimum Fluid Temperature around Peak Elevation during Depressurisation of Tollingham to
Dalton through a 1 inch Orifice
The fluid temperature in this case reaches -10°C on the upstream side of the peak elevation during
depressurisation. The minimum temperature at each snapshot in time in Figure 7.43 moves further down
the hill as increasing amounts of CO2 is vaporised and the gas-liquid contact moves down the hill.
Therefore, the minimum temperature does not occur at a single location (e.g. at the point of highest
elevation).
7.7.5 Location of Minimum Temperature
Although the peak elevation was raised as an area for concern with regards to minimum temperatures
during depressurisation, this is not where the lowest temperature occurs.
Figure 7.45 shows the minimum temperature in the Tollingham to Dalton pipeline section when
depressurising through a 1 inch orifice.
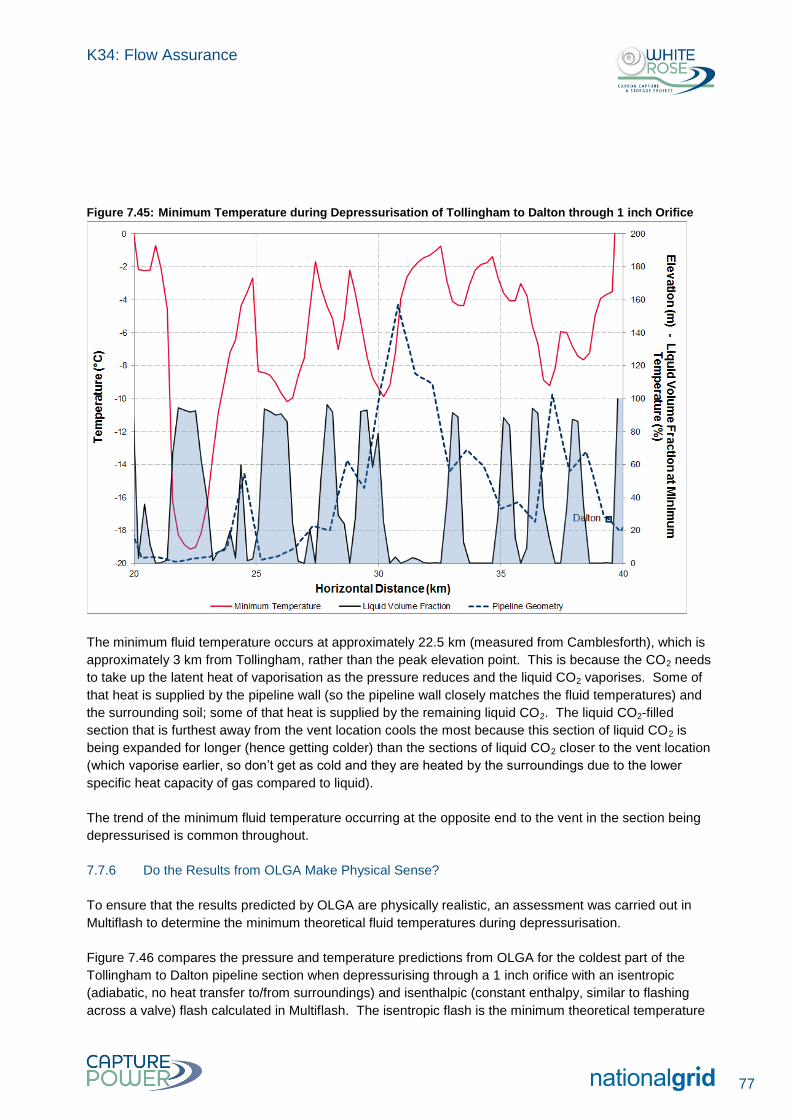
K34: Flow Assurance
77
Figure 7.45: Minimum Temperature during Depressurisation of Tollingham to Dalton through 1 inch Orifice
The minimum fluid temperature occurs at approximately 22.5 km (measured from Camblesforth), which is
approximately 3 km from Tollingham, rather than the peak elevation point. This is because the CO2 needs
to take up the latent heat of vaporisation as the pressure reduces and the liquid CO2 vaporises. Some of
that heat is supplied by the pipeline wall (so the pipeline wall closely matches the fluid temperatures) and
the surrounding soil; some of that heat is supplied by the remaining liquid CO2. The liquid CO2-filled
section that is furthest away from the vent location cools the most because this section of liquid CO2 is
being expanded for longer (hence getting colder) than the sections of liquid CO2 closer to the vent location
(which vaporise earlier, so don’t get as cold and they are heated by the surroundings due to the lower
specific heat capacity of gas compared to liquid).
The trend of the minimum fluid temperature occurring at the opposite end to the vent in the section being
depressurised is common throughout.
7.7.6 Do the Results from OLGA Make Physical Sense?
To ensure that the results predicted by OLGA are physically realistic, an assessment was carried out in
Multiflash to determine the minimum theoretical fluid temperatures during depressurisation.
Figure 7.46 compares the pressure and temperature predictions from OLGA for the coldest part of the
Tollingham to Dalton pipeline section when depressurising through a 1 inch orifice with an isentropic
(adiabatic, no heat transfer to/from surroundings) and isenthalpic (constant enthalpy, similar to flashing
across a valve) flash calculated in Multiflash. The isentropic flash is the minimum theoretical temperature
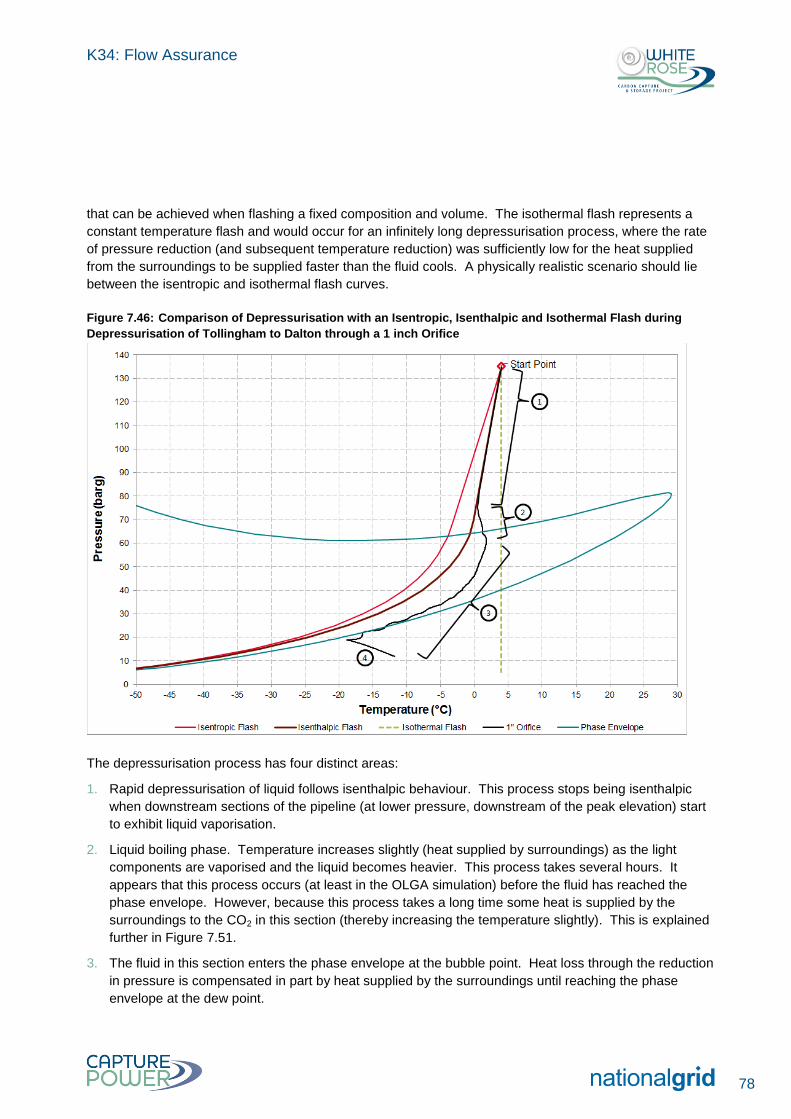
K34: Flow Assurance
78
that can be achieved when flashing a fixed composition and volume. The isothermal flash represents a
constant temperature flash and would occur for an infinitely long depressurisation process, where the rate
of pressure reduction (and subsequent temperature reduction) was sufficiently low for the heat supplied
from the surroundings to be supplied faster than the fluid cools. A physically realistic scenario should lie
between the isentropic and isothermal flash curves.
Figure 7.46: Comparison of Depressurisation with an Isentropic, Isenthalpic and Isothermal Flash during
Depressurisation of Tollingham to Dalton through a 1 inch Orifice
The depressurisation process has four distinct areas:
1. Rapid depressurisation of liquid follows isenthalpic behaviour. This process stops being isenthalpic
when downstream sections of the pipeline (at lower pressure, downstream of the peak elevation) start
to exhibit liquid vaporisation.
2. Liquid boiling phase. Temperature increases slightly (heat supplied by surroundings) as the light
components are vaporised and the liquid becomes heavier. This process takes several hours. It
appears that this process occurs (at least in the OLGA simulation) before the fluid has reached the
phase envelope. However, because this process takes a long time some heat is supplied by the
surroundings to the CO2 in this section (thereby increasing the temperature slightly). This is explained
further in Figure 7.51.
3. The fluid in this section enters the phase envelope at the bubble point. Heat loss through the reduction
in pressure is compensated in part by heat supplied by the surroundings until reaching the phase
envelope at the dew point.
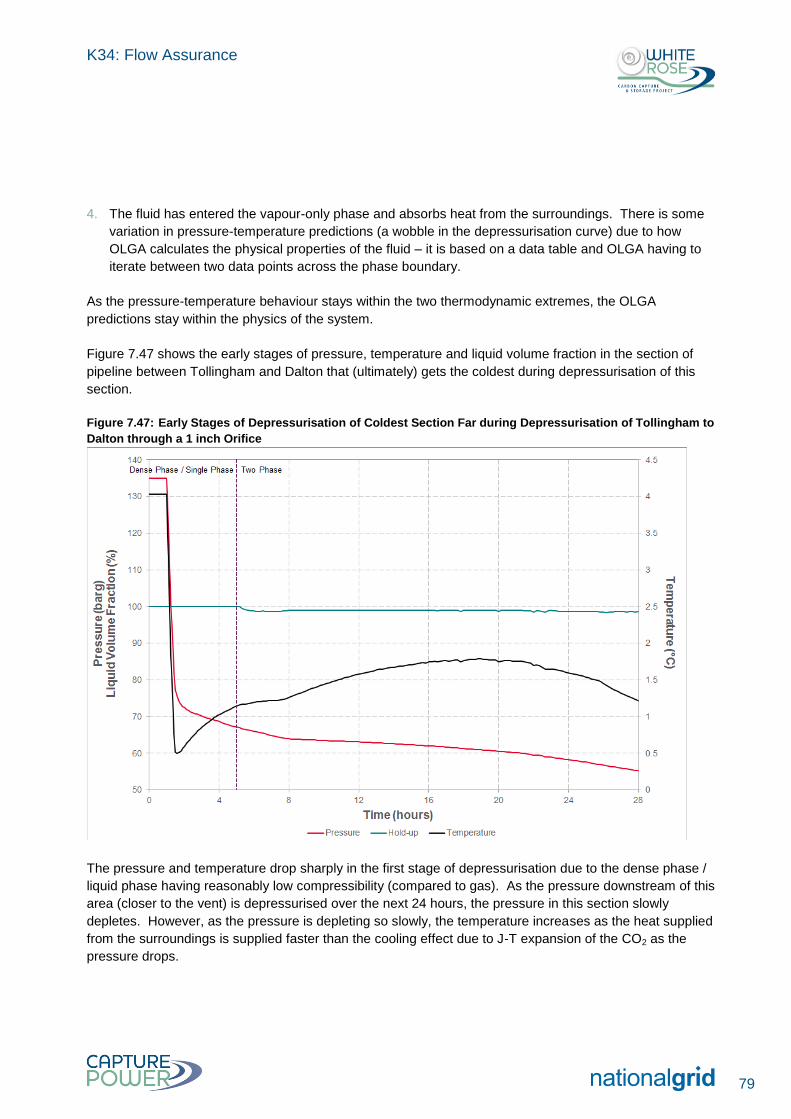
K34: Flow Assurance
79
4. The fluid has entered the vapour-only phase and absorbs heat from the surroundings. There is some
variation in pressure-temperature predictions (a wobble in the depressurisation curve) due to how
OLGA calculates the physical properties of the fluid – it is based on a data table and OLGA having to
iterate between two data points across the phase boundary.
As the pressure-temperature behaviour stays within the two thermodynamic extremes, the OLGA
predictions stay within the physics of the system.
Figure 7.47 shows the early stages of pressure, temperature and liquid volume fraction in the section of
pipeline between Tollingham and Dalton that (ultimately) gets the coldest during depressurisation of this
section.
Figure 7.47: Early Stages of Depressurisation of Coldest Section Far during Depressurisation of Tollingham to
Dalton through a 1 inch Orifice
The pressure and temperature drop sharply in the first stage of depressurisation due to the dense phase /
liquid phase having reasonably low compressibility (compared to gas). As the pressure downstream of this
area (closer to the vent) is depressurised over the next 24 hours, the pressure in this section slowly
depletes. However, as the pressure is depleting so slowly, the temperature increases as the heat supplied
from the surroundings is supplied faster than the cooling effect due to J-T expansion of the CO2 as the
pressure drops.
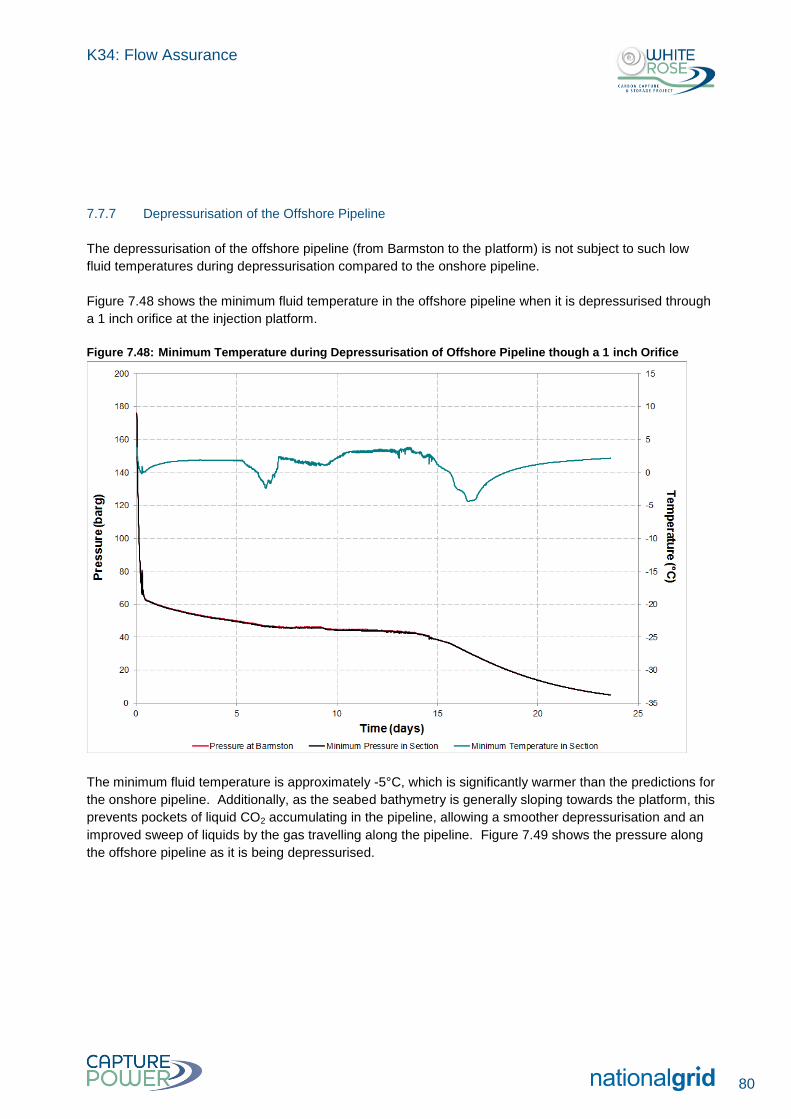
K34: Flow Assurance
80
7.7.7 Depressurisation of the Offshore Pipeline
The depressurisation of the offshore pipeline (from Barmston to the platform) is not subject to such low
fluid temperatures during depressurisation compared to the onshore pipeline.
Figure 7.48 shows the minimum fluid temperature in the offshore pipeline when it is depressurised through
a 1 inch orifice at the injection platform.
Figure 7.48: Minimum Temperature during Depressurisation of Offshore Pipeline though a 1 inch Orifice
The minimum fluid temperature is approximately -5°C, which is significantly warmer than the predictions for
the onshore pipeline. Additionally, as the seabed bathymetry is generally sloping towards the platform, this
prevents pockets of liquid CO2 accumulating in the pipeline, allowing a smoother depressurisation and an
improved sweep of liquids by the gas travelling along the pipeline. Figure 7.49 shows the pressure along
the offshore pipeline as it is being depressurised.
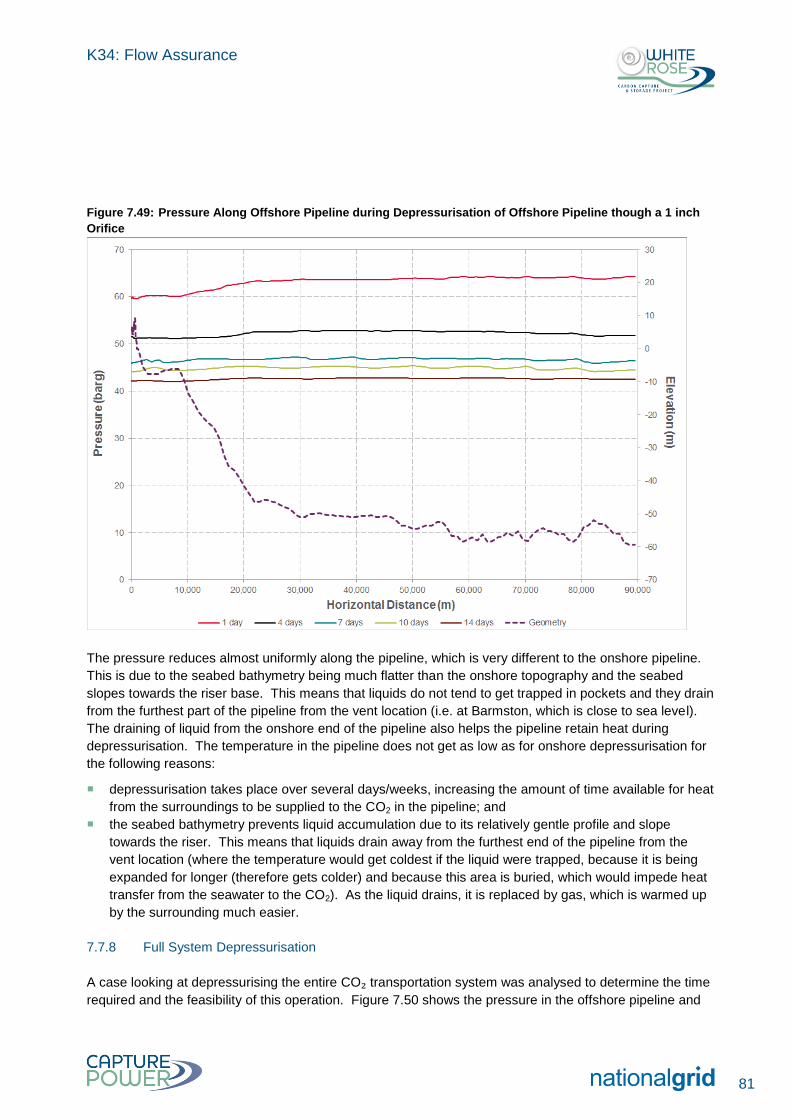
K34: Flow Assurance
81
Figure 7.49: Pressure Along Offshore Pipeline during Depressurisation of Offshore Pipeline though a 1 inch
Orifice
The pressure reduces almost uniformly along the pipeline, which is very different to the onshore pipeline.
This is due to the seabed bathymetry being much flatter than the onshore topography and the seabed
slopes towards the riser base. This means that liquids do not tend to get trapped in pockets and they drain
from the furthest part of the pipeline from the vent location (i.e. at Barmston, which is close to sea level).
The draining of liquid from the onshore end of the pipeline also helps the pipeline retain heat during
depressurisation. The temperature in the pipeline does not get as low as for onshore depressurisation for
the following reasons:
depressurisation takes place over several days/weeks, increasing the amount of time available for heat
from the surroundings to be supplied to the CO2 in the pipeline; and
the seabed bathymetry prevents liquid accumulation due to its relatively gentle profile and slope
towards the riser. This means that liquids drain away from the furthest end of the pipeline from the
vent location (where the temperature would get coldest if the liquid were trapped, because it is being
expanded for longer (therefore gets colder) and because this area is buried, which would impede heat
transfer from the seawater to the CO2). As the liquid drains, it is replaced by gas, which is warmed up
by the surrounding much easier.
7.7.8 Full System Depressurisation
A case looking at depressurising the entire CO₂ transportation system was analysed to determine the time
required and the feasibility of this operation. Figure 7.50 shows the pressure in the offshore pipeline and
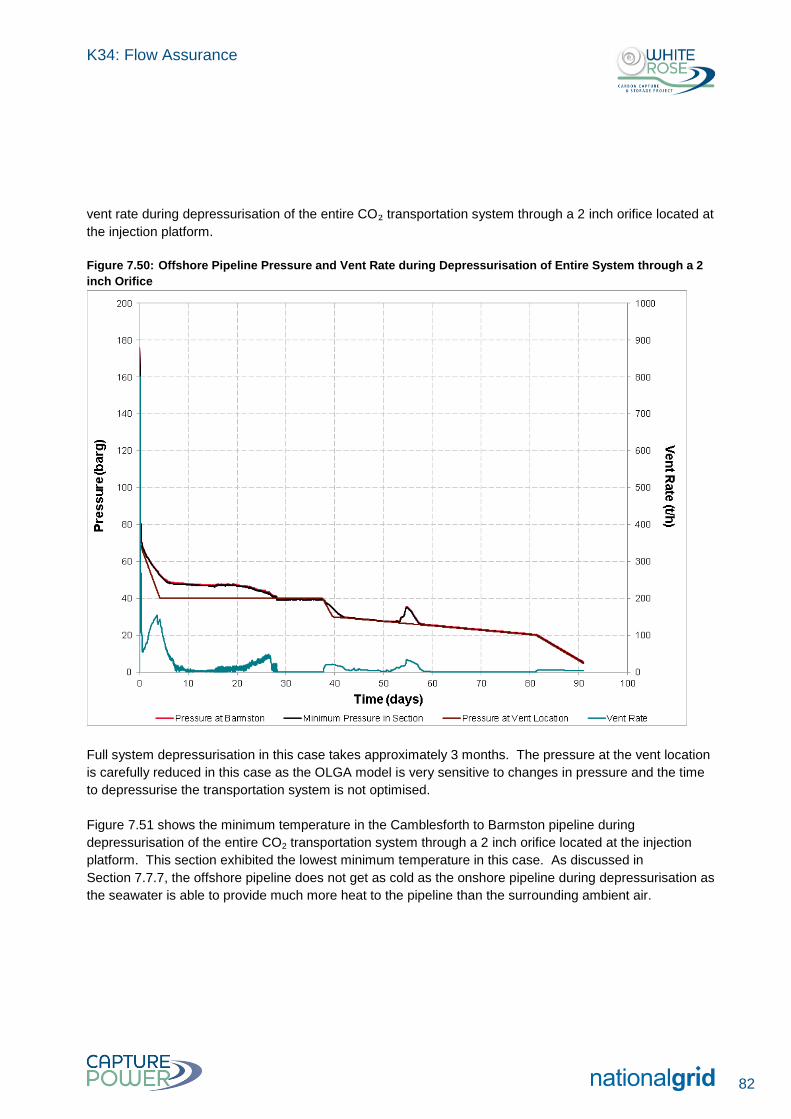
K34: Flow Assurance
82
vent rate during depressurisation of the entire CO₂ transportation system through a 2 inch orifice located at
the injection platform.
Figure 7.50: Offshore Pipeline Pressure and Vent Rate during Depressurisation of Entire System through a 2
inch Orifice
Full system depressurisation in this case takes approximately 3 months. The pressure at the vent location
is carefully reduced in this case as the OLGA model is very sensitive to changes in pressure and the time
to depressurise the transportation system is not optimised.
Figure 7.51 shows the minimum temperature in the Camblesforth to Barmston pipeline during
depressurisation of the entire CO2 transportation system through a 2 inch orifice located at the injection
platform. This section exhibited the lowest minimum temperature in this case. As discussed in
Section 7.7.7, the offshore pipeline does not get as cold as the onshore pipeline during depressurisation as
the seawater is able to provide much more heat to the pipeline than the surrounding ambient air.
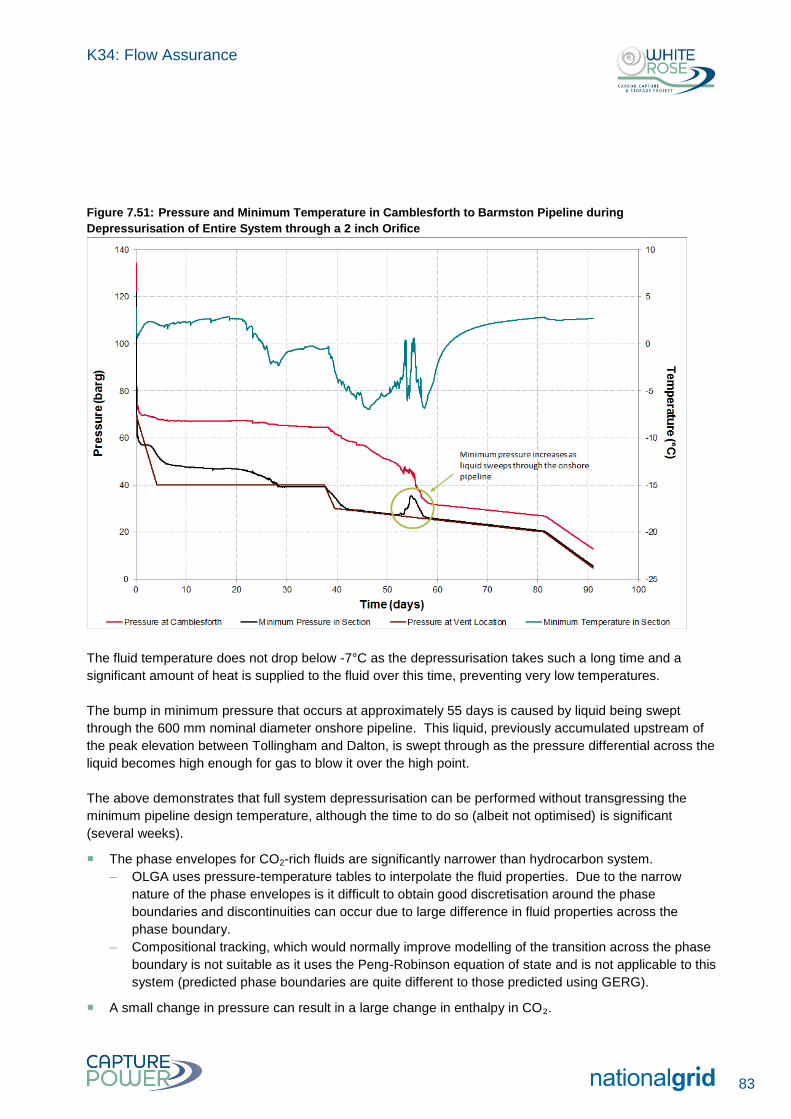
K34: Flow Assurance
83
Figure 7.51: Pressure and Minimum Temperature in Camblesforth to Barmston Pipeline during
Depressurisation of Entire System through a 2 inch Orifice
The fluid temperature does not drop below -7°C as the depressurisation takes such a long time and a
significant amount of heat is supplied to the fluid over this time, preventing very low temperatures.
The bump in minimum pressure that occurs at approximately 55 days is caused by liquid being swept
through the 600 mm nominal diameter onshore pipeline. This liquid, previously accumulated upstream of
the peak elevation between Tollingham and Dalton, is swept through as the pressure differential across the
liquid becomes high enough for gas to blow it over the high point.
The above demonstrates that full system depressurisation can be performed without transgressing the
minimum pipeline design temperature, although the time to do so (albeit not optimised) is significant
(several weeks).
The phase envelopes for CO2-rich fluids are significantly narrower than hydrocarbon system.
– OLGA uses pressure-temperature tables to interpolate the fluid properties. Due to the narrow
nature of the phase envelopes is it difficult to obtain good discretisation around the phase
boundaries and discontinuities can occur due to large difference in fluid properties across the
phase boundary.
– Compositional tracking, which would normally improve modelling of the transition across the phase
boundary is not suitable as it uses the Peng-Robinson equation of state and is not applicable to this
system (predicted phase boundaries are quite different to those predicted using GERG).
A small change in pressure can result in a large change in enthalpy in CO₂.
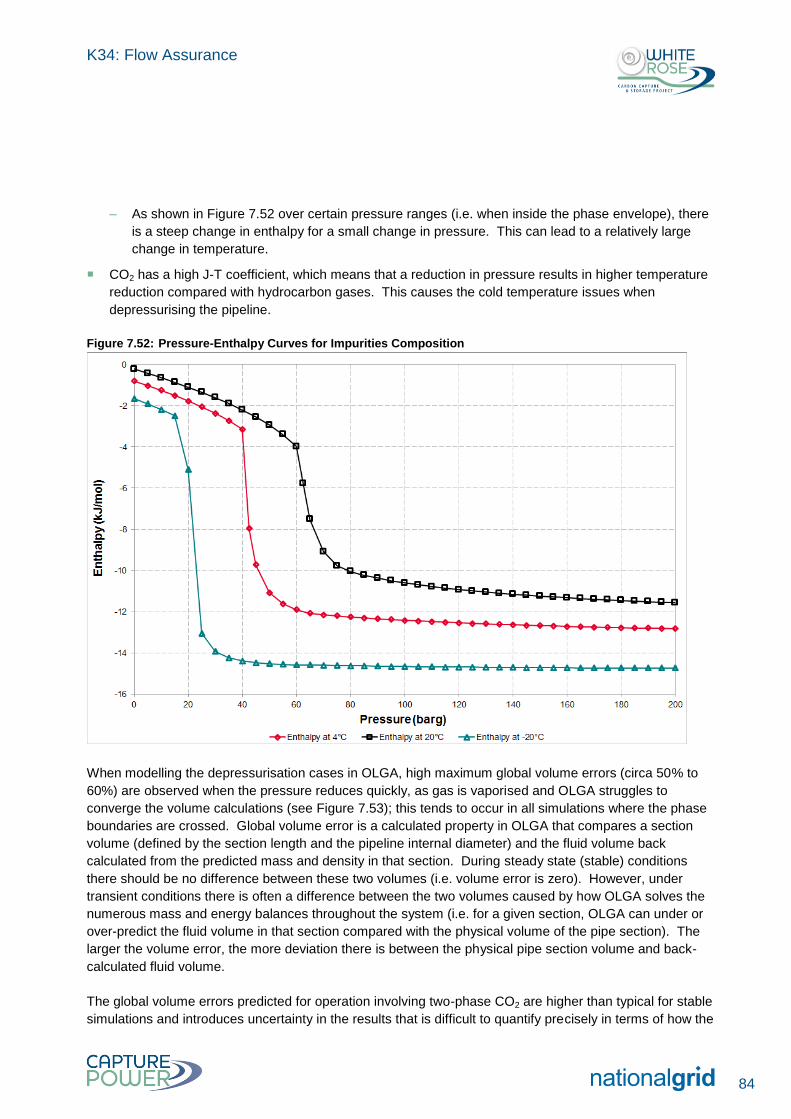
K34: Flow Assurance
84
– As shown in Figure 7.52 over certain pressure ranges (i.e. when inside the phase envelope), there
is a steep change in enthalpy for a small change in pressure. This can lead to a relatively large
change in temperature.
CO2 has a high J-T coefficient, which means that a reduction in pressure results in higher temperature
reduction compared with hydrocarbon gases. This causes the cold temperature issues when
depressurising the pipeline.
Figure 7.52: Pressure-Enthalpy Curves for Impurities Composition
When modelling the depressurisation cases in OLGA, high maximum global volume errors (circa 50% to
60%) are observed when the pressure reduces quickly, as gas is vaporised and OLGA struggles to
converge the volume calculations (see Figure 7.53); this tends to occur in all simulations where the phase
boundaries are crossed. Global volume error is a calculated property in OLGA that compares a section
volume (defined by the section length and the pipeline internal diameter) and the fluid volume back
calculated from the predicted mass and density in that section. During steady state (stable) conditions
there should be no difference between these two volumes (i.e. volume error is zero). However, under
transient conditions there is often a difference between the two volumes caused by how OLGA solves the
numerous mass and energy balances throughout the system (i.e. for a given section, OLGA can under or
over-predict the fluid volume in that section compared with the physical volume of the pipe section). The
larger the volume error, the more deviation there is between the physical pipe section volume and back-
calculated fluid volume.
The global volume errors predicted for operation involving two-phase CO2 are higher than typical for stable
simulations and introduces uncertainty in the results that is difficult to quantify precisely in terms of how the
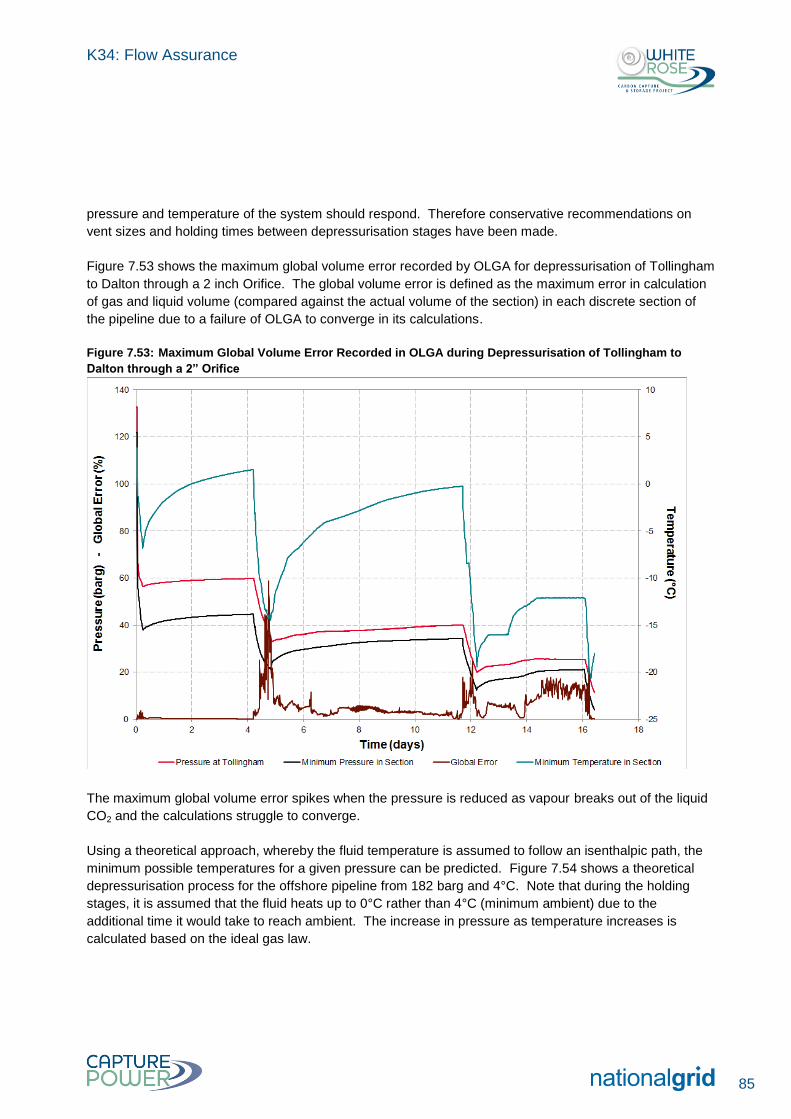
K34: Flow Assurance
85
pressure and temperature of the system should respond. Therefore conservative recommendations on
vent sizes and holding times between depressurisation stages have been made.
Figure 7.53 shows the maximum global volume error recorded by OLGA for depressurisation of Tollingham
to Dalton through a 2 inch Orifice. The global volume error is defined as the maximum error in calculation
of gas and liquid volume (compared against the actual volume of the section) in each discrete section of
the pipeline due to a failure of OLGA to converge in its calculations.
Figure 7.53: Maximum Global Volume Error Recorded in OLGA during Depressurisation of Tollingham to
Dalton through a 2” Orifice
The maximum global volume error spikes when the pressure is reduced as vapour breaks out of the liquid
CO2 and the calculations struggle to converge.
Using a theoretical approach, whereby the fluid temperature is assumed to follow an isenthalpic path, the
minimum possible temperatures for a given pressure can be predicted. Figure 7.54 shows a theoretical
depressurisation process for the offshore pipeline from 182 barg and 4°C. Note that during the holding
stages, it is assumed that the fluid heats up to 0°C rather than 4°C (minimum ambient) due to the
additional time it would take to reach ambient. The increase in pressure as temperature increases is
calculated based on the ideal gas law.
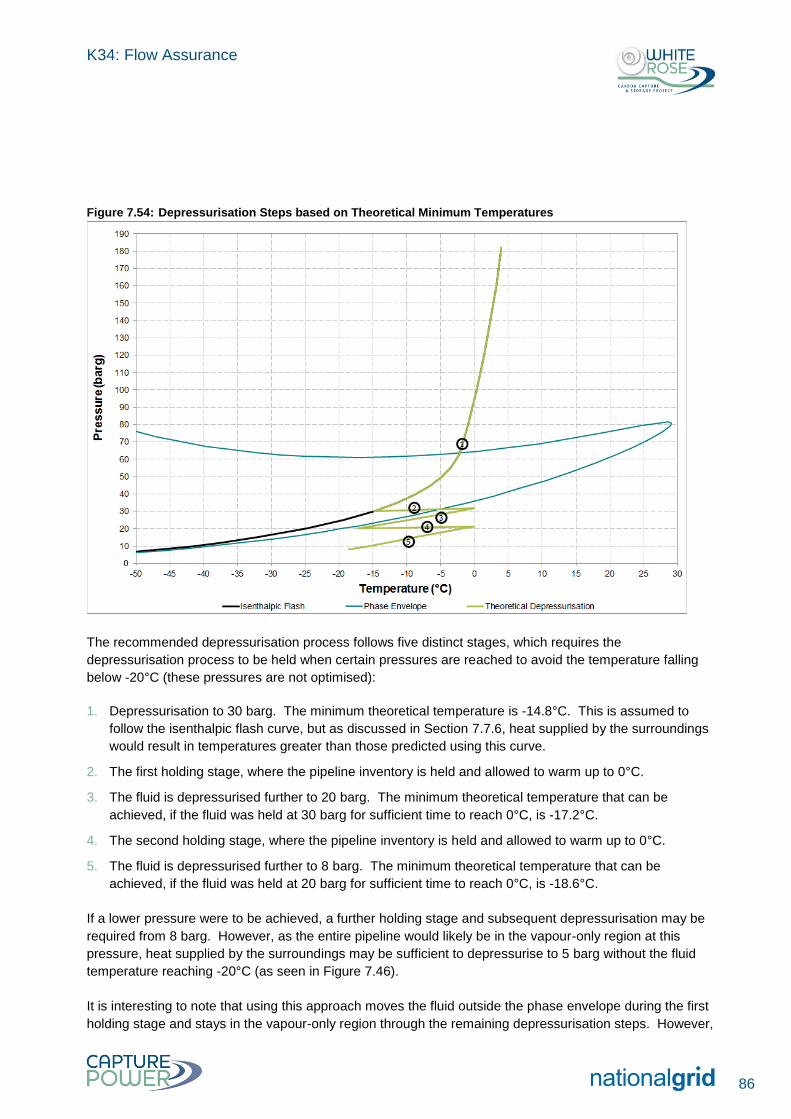
K34: Flow Assurance
86
Figure 7.54: Depressurisation Steps based on Theoretical Minimum Temperatures
The recommended depressurisation process follows five distinct stages, which requires the
depressurisation process to be held when certain pressures are reached to avoid the temperature falling
below -20°C (these pressures are not optimised):
1. Depressurisation to 30 barg. The minimum theoretical temperature is -14.8°C. This is assumed to
follow the isenthalpic flash curve, but as discussed in Section 7.7.6, heat supplied by the surroundings
would result in temperatures greater than those predicted using this curve.
2. The first holding stage, where the pipeline inventory is held and allowed to warm up to 0°C.
3. The fluid is depressurised further to 20 barg. The minimum theoretical temperature that can be
achieved, if the fluid was held at 30 barg for sufficient time to reach 0°C, is -17.2°C.
4. The second holding stage, where the pipeline inventory is held and allowed to warm up to 0°C.
5. The fluid is depressurised further to 8 barg. The minimum theoretical temperature that can be
achieved, if the fluid was held at 20 barg for sufficient time to reach 0°C, is -18.6°C.
If a lower pressure were to be achieved, a further holding stage and subsequent depressurisation may be
required from 8 barg. However, as the entire pipeline would likely be in the vapour-only region at this
pressure, heat supplied by the surroundings may be sufficient to depressurise to 5 barg without the fluid
temperature reaching -20°C (as seen in Figure 7.46).
It is interesting to note that using this approach moves the fluid outside the phase envelope during the first
holding stage and stays in the vapour-only region through the remaining depressurisation steps. However,
K34: Flow Assurance
87
the pressure through the pipeline is not uniform (as shown in Figure 7.42), so the pressure at the holding
stages must be considered as the minimum pipeline pressures (which are generally very close to the
pressure measured upstream of the vent orifice). Therefore, it should not be expected that the entire
section being depressurised be in the vapour-only phase after the first holding phase.
It is recognised that this approach is conservative and there may be an opportunity to optimise the
depressurisation process later in the design / operation of the CO2 transportation system. However, it has
been demonstrated that depressurisation of the pipeline can be achieved.
Figure 7.41 shows that it takes approximately 1 week for the fluids to heat up from a temperature of -15°C
to 0°C in the holding stage. It is recommended that each holding stage be for a minimum of 1 week.
Where this approach becomes more challenging is in the calculation of the time required for the pipeline to
warm up at the different holding stages. Based on the time predicted for depressurisation of the section
between Tollingham and Dalton through a 2 inch orifice (see Figure 7.40), a one to two week holding
period should be sufficient to ensure the pipeline is within 1°C to 2°C of ambient temperature.
Temperature sensors at the vent locations would help inform this, however it is unlikely there would be the
means to measure temperature along the length of pipeline for the operators to know the absolute
temperature of the fluid.
Options to minimise the risk of excessively low temperatures during depressurisation include:
follow the step-wise depressurisation process described above to limit the minimum fluid temperatures
to -20°C;
Charpy testing the pipeline to ensure a minimum temperature of -45°C is acceptable, which is the
minimum theoretical temperature that the CO2 could reach when depressurising to 11 barg from
135 barg at 4°C (this pressure would be at the peak elevation point rather than upstream of the vent).
The impact on vendor selection should be considered if selecting this option as the additional testing
may preclude some vendors from bidding to supply the pipeline; and
avoiding depressurisation of CO2 by using a PIG/PIG rain to displace the CO2 into the well using an
inert fluid (e.g. air or water). If this option was selected, then it may be required for maintenance on the
pipeline/equipment that sectional depressurisation would otherwise be used, requiring an air supply
and the initial start-up process to be followed to bring the pipeline back into operation.
7.7.9 Depressurisation Summary
Table 7.12 shows the time to depressurise each section of the onshore and offshore system to 5 barg and
the peak rates and total inventory of CO₂-rich fluid vented during the depressurisation process for the
Impurities composition, based on winter conditions.
Table 7.12: Depressurisation Times and Mass of Vented CO2-rich Fluid (Impurities Composition)
Pipeline Section Orifice Size (in)
Time to Reach 5 barg from MAOP
(days)
Mass of CO2-rich Fluid
Vented (t)
Peak CO2-rich Fluid
Vent Rate (t/h)

K34: Flow Assurance
88
Pipeline Section Orifice Size (in)
Time to Reach 5 barg from MAOP
(days)
Mass of CO2-rich Fluid
Vented (t)
Peak CO2-rich Fluid
Vent Rate (t/h)
Drax to Camblesforth 0.5 1.1 262 61
Camblesforth to Tollingham 1 5.0 3,145 226
2 6.7 3,440 762
Tollingham to Dalton 1 6.0 3,324 226
2 16.4 3,595 771
Dalton to Skerne 1 5.9 2,771 224
2 5.9 2,893 732
Skerne to Barmston 1 3.2 2,119 219
2 4.8 2,270 676
Drax to Barmston 1 20.1 11,661 236
2 6.2 12,538 896
Barmston to Platform 1 23.6 19,775 279
Drax to Platform 2 91(1) 31,242 802
The time to depressurise has not been optimised and there is scope to reduce this time significantly.
It can be seen that peak vent rates are clearly much higher for larger orifice sizes and the depressurisation
times are, in general, shorter. However, for some cases, the depressurisation for the larger orifices takes
longer because more blowdown-warmup cycles are required. This is because the higher rates induce
greater or quicker pressure drop rates and, consequently, it is more difficult to control the associated J-T
cooling. In addition, this effect is most pronounced in pipeline sections with very hilly terrain (i.e. the
Tollingham to Dalton section).
Table 7.13 shows the recommended orifice sizes for the onshore and offshore pipelines, based on a
pipeline minimum design temperature of -20°C. It should be noted that these orifice sizes are preliminary,
based on the uncertainties discussed in Section 7.7.2. It is also assumed for the vent orifice size
recommendations that depressurisation through a single vent point (on the platform) would not be
performed.
Table 7.13: Recommended Blowdown Orifice Sizes
Pipeline Section Recommended Orifice Size
300 mm Onshore Pipeline 0.5 inch
600 mm Onshore Pipeline 1 inch
600 mm Offshore Pipeline 1 inch
Table 7.14 shows the recommended stages for depressurisation of the various pipeline sections to ensure
a minimum operating temperature of -20°C is not transgressed. The time to depressurise each section to
the required pressure is dependent on the section being depressurised (in terms of both volume and
terrain).
K34: Flow Assurance
89
Table 7.14: Recommended Depressurisation Stages
Stage Pressure at Vent (barg) Time (days)
Depressurisation 30 ~0.5
Hold at Pressure 30 >7
Depressurisation 20 ~1
Hold at Pressure 20 >7
Depressurisation 8(1) ~0.5 (1)A pressure of 5 barg may be achieved at this stage as the CO₂-rich fluid will be in the vapour-only region and therefore will be heated by the surroundings more than when in the two-phase region and a temperature of -20°C may not be reached.
7.8 Leak Detection
The purpose of this analysis is to determine the time required for a leak of 2.5% of the total flowrate to be
detected by a reduction in operating pressure. For the purposes of this analysis, it is assumed that the
leak results in a constant flow, and occurs at the pipeline entrance at Drax to obtain the maximum
detection time. It is also assumed that the platform choke position is not changed in response to the
decline in pressure as a result of the leak. For those cases with the Barmston pump in operation, the leak
was still assumed to be detected at the platform.
Figure 7.55 shows the pressure decline at the platform (upstream of the injection trees) observed due to a
2.5% leak at the inlet of the Drax to Camblesforth onshore pipeline. This case is selected as it represents
the longest detection time due to the low flowrate. The pressure at the platform steadily declines due to
the leak in the onshore pipeline, with a 1 bar reduction in pressure occurring 3.5 hours after the leak
appears.
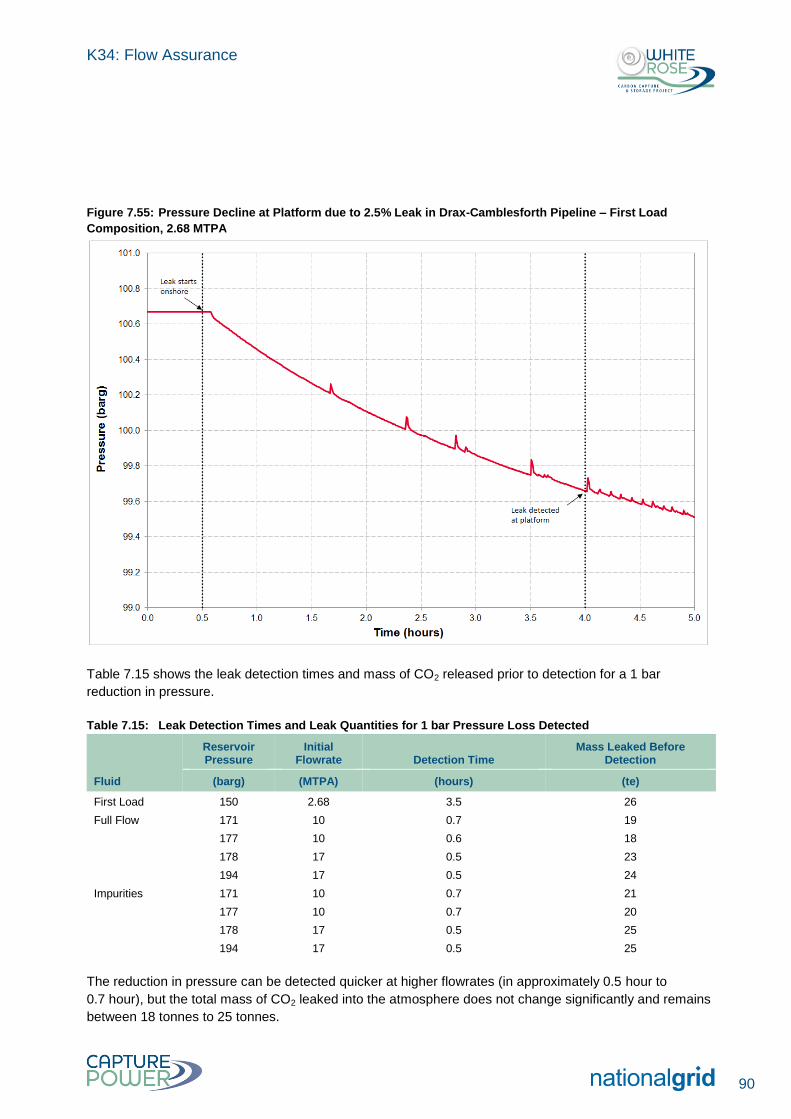
K34: Flow Assurance
90
Figure 7.55: Pressure Decline at Platform due to 2.5% Leak in Drax-Camblesforth Pipeline – First Load
Composition, 2.68 MTPA
Table 7.15 shows the leak detection times and mass of CO2 released prior to detection for a 1 bar
reduction in pressure.
Table 7.15: Leak Detection Times and Leak Quantities for 1 bar Pressure Loss Detected
Fluid
Reservoir Pressure
Initial Flowrate Detection Time
Mass Leaked Before Detection
(barg) (MTPA) (hours) (te)
First Load 150 2.68 3.5 26
Full Flow 171 10 0.7 19
177 10 0.6 18
178 17 0.5 23
194 17 0.5 24
Impurities 171 10 0.7 21
177 10 0.7 20
178 17 0.5 25
194 17 0.5 25
The reduction in pressure can be detected quicker at higher flowrates (in approximately 0.5 hour to
0.7 hour), but the total mass of CO2 leaked into the atmosphere does not change significantly and remains
between 18 tonnes to 25 tonnes.

K34: Flow Assurance
91
7.8.1 Leak Detection Summary
It is assumed for this analysis that a leak can be detected by a 1 bar reduction in pressure.
The reduction in pressure due to a leak can be detected quicker at higher flowrates, but the resulting
mass of CO₂ leaked to the atmosphere is not significantly different as the leak is based on 2.5% of the
total flowrate.
Leaks of 2.5% of the total flowrate could be detected within 0.5 hour to 3.5 hour.
7.9 Line Pack
If a section of the pipeline becomes shut in and CO2 supply continues, pressure will rise and potentially
exceed the MAOP. This analysis aims to estimate the time for this to occur. In addition, a series of cases
were considered to demonstrate the available line pack when the system is subjected to swings in
production rates or changes in injection wells availability.
7.9.1 Pipeline Shut-in
The purpose of this analysis is to determine the time for the pipeline operating pressure to reach the
MAOP where Drax and Camblesforth continue to supply CO2 to the pipeline at the same flowrate for the
following scenarios:
Shut-in at the Platform;
Shut-in at Barmston; and
Shut-in at Camblesforth.
6 wells are assumed to be online during these scenarios when operating at ≥10 MTPA. Figure 7.56 shows
how the pressure in the offshore section of the pipeline increases when flow is blocked at the platform with
continued CO2 supply from Drax and Camblesforth at a rate of 10 MTPA.
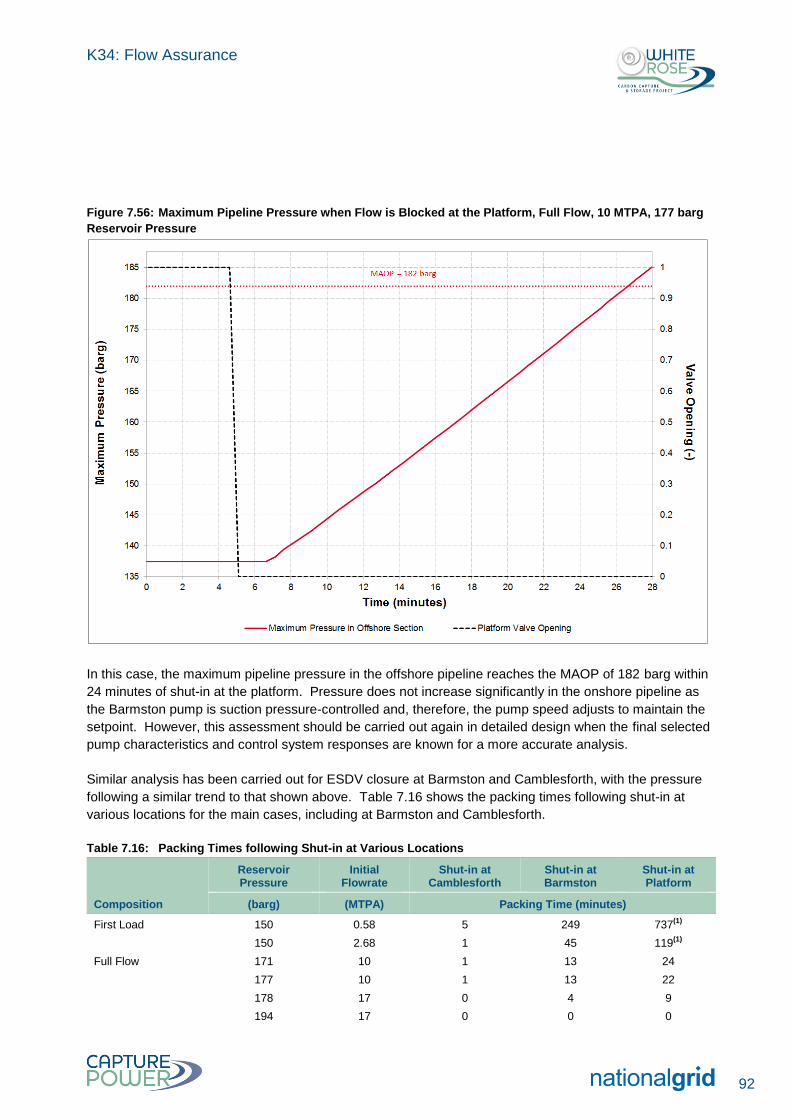
K34: Flow Assurance
92
Figure 7.56: Maximum Pipeline Pressure when Flow is Blocked at the Platform, Full Flow, 10 MTPA, 177 barg
Reservoir Pressure
In this case, the maximum pipeline pressure in the offshore pipeline reaches the MAOP of 182 barg within
24 minutes of shut-in at the platform. Pressure does not increase significantly in the onshore pipeline as
the Barmston pump is suction pressure-controlled and, therefore, the pump speed adjusts to maintain the
setpoint. However, this assessment should be carried out again in detailed design when the final selected
pump characteristics and control system responses are known for a more accurate analysis.
Similar analysis has been carried out for ESDV closure at Barmston and Camblesforth, with the pressure
following a similar trend to that shown above. Table 7.16 shows the packing times following shut-in at
various locations for the main cases, including at Barmston and Camblesforth.
Table 7.16: Packing Times following Shut-in at Various Locations
Composition
Reservoir Pressure
Initial Flowrate
Shut-in at Camblesforth
Shut-in at Barmston
Shut-in at Platform
(barg) (MTPA) Packing Time (minutes)
First Load 150 0.58 5 249 737(1)
150 2.68 1 45 119(1)
Full Flow 171 10 1 13 24
177 10 1 13 22
178 17 0 4 9
194 17 0 0 0
K34: Flow Assurance
93
Composition
Reservoir Pressure
Initial Flowrate
Shut-in at Camblesforth
Shut-in at Barmston
Shut-in at Platform
(barg) (MTPA) Packing Time (minutes)
Impurities 171 10 1 14 23
177 10 1 14 20
178 17 0 3 6
194 17 0 0 0 (1)
Onshore design pressure of 135barg is reached before the offshore design pressure.
The Drax to Camblesforth section reaches the MAOP of 135 barg in less than 1 minute (irrespective of
which valve is closed) for maximum flowrates as the pipeline capacity is relatively small and the steady
state pressure is close to MAOP at high flowrates. For shut-in at Barmston (upstream of the pump), the
onshore pipeline reaches the MAOP within 14 minutes when flowing at 10 MTPA. This is due to the
normal operating pressure at steady state being close to the MAOP at the higher flowrates.
Due to the very short packing time in the onshore pipeline following shut-in in the onshore facilities (at
Camblesforth throughout operational life and at Barmston from Year 5), there is insufficient time for
operators at Drax and Camblesforth to reroute CO2 from the pipeline to the secondary disposal route; an
automated response may be required.
A shut-in at the platform has a longer packing time than the offshore pipeline MAOP of 182 barg due to the
larger pipeline diameter and the higher MAOP compared with the onshore pipeline from Drax to
Camblesforth (the pipeline has a 300 mm nominal diameter) and is significantly longer. Note that for the
low flow cases without the Barmston pump in operation, the design pressure is exceeded in the onshore
section of the pipeline rather than the offshore section. The packing time ranges from 6 minutes to 24
minutes for the design and Full Flow flowrates of 17 and 10 MTPA respectively.
7.9.2 Changes in Flowrate and Well Availability
The purpose of this analysis was to look at the system behaviour during periods of varying flowrate and
how it responds to wells being taken offline; specifically the time taken for the system to re-establish steady
operation.
A series of cases were considered where the following sequence was implemented:
t = 0; Simulation starts at steady state;
t = 1 hr; Flowrate from Drax or Camblesforth is dropped by 20% in 15 min;
t = 7 hrs; Flowrate from Drax or Camblesforth is increased by 20% in 15 min;
t = 13 hrs; P5W2 well choke is closed in 1 hour; and
t = 19 hrs; P5W2 well choke is opened in 1 hour.
Three steady state flowrates were considered; 2.68 MTPA, 10 MTPA and 17 MTPA.
Figure 7.57 shows the change in pressure and temperature at different locations in response to these
changes for an initial flowrate of 2.68 MTPA. As the pressure at the platform end is fixed at 100 barg, the
impact of flowrate fluctuation becomes more significant towards the pipeline inlet where a 20% flowrate
reduction results in a 1.5 bar pressure drop.
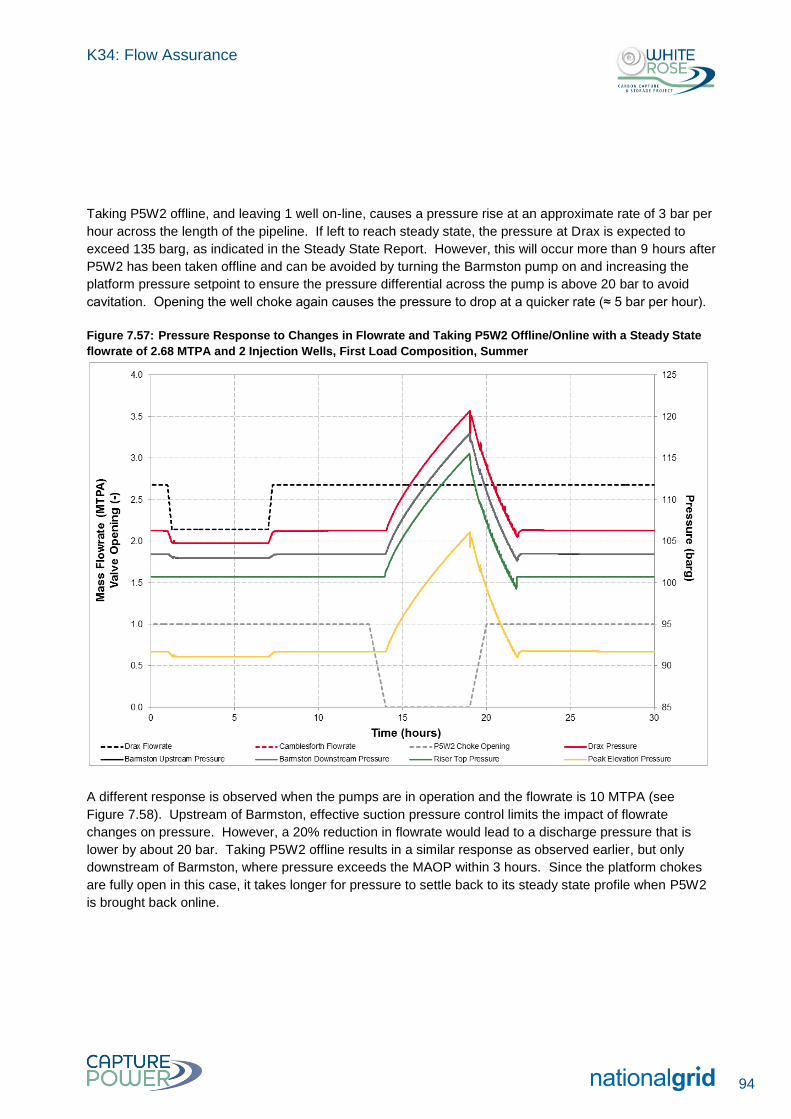
K34: Flow Assurance
94
Taking P5W2 offline, and leaving 1 well on-line, causes a pressure rise at an approximate rate of 3 bar per
hour across the length of the pipeline. If left to reach steady state, the pressure at Drax is expected to
exceed 135 barg, as indicated in the Steady State Report. However, this will occur more than 9 hours after
P5W2 has been taken offline and can be avoided by turning the Barmston pump on and increasing the
platform pressure setpoint to ensure the pressure differential across the pump is above 20 bar to avoid
cavitation. Opening the well choke again causes the pressure to drop at a quicker rate (≈ 5 bar per hour).
Figure 7.57: Pressure Response to Changes in Flowrate and Taking P5W2 Offline/Online with a Steady State
flowrate of 2.68 MTPA and 2 Injection Wells, First Load Composition, Summer
A different response is observed when the pumps are in operation and the flowrate is 10 MTPA (see
Figure 7.58). Upstream of Barmston, effective suction pressure control limits the impact of flowrate
changes on pressure. However, a 20% reduction in flowrate would lead to a discharge pressure that is
lower by about 20 bar. Taking P5W2 offline results in a similar response as observed earlier, but only
downstream of Barmston, where pressure exceeds the MAOP within 3 hours. Since the platform chokes
are fully open in this case, it takes longer for pressure to settle back to its steady state profile when P5W2
is brought back online.
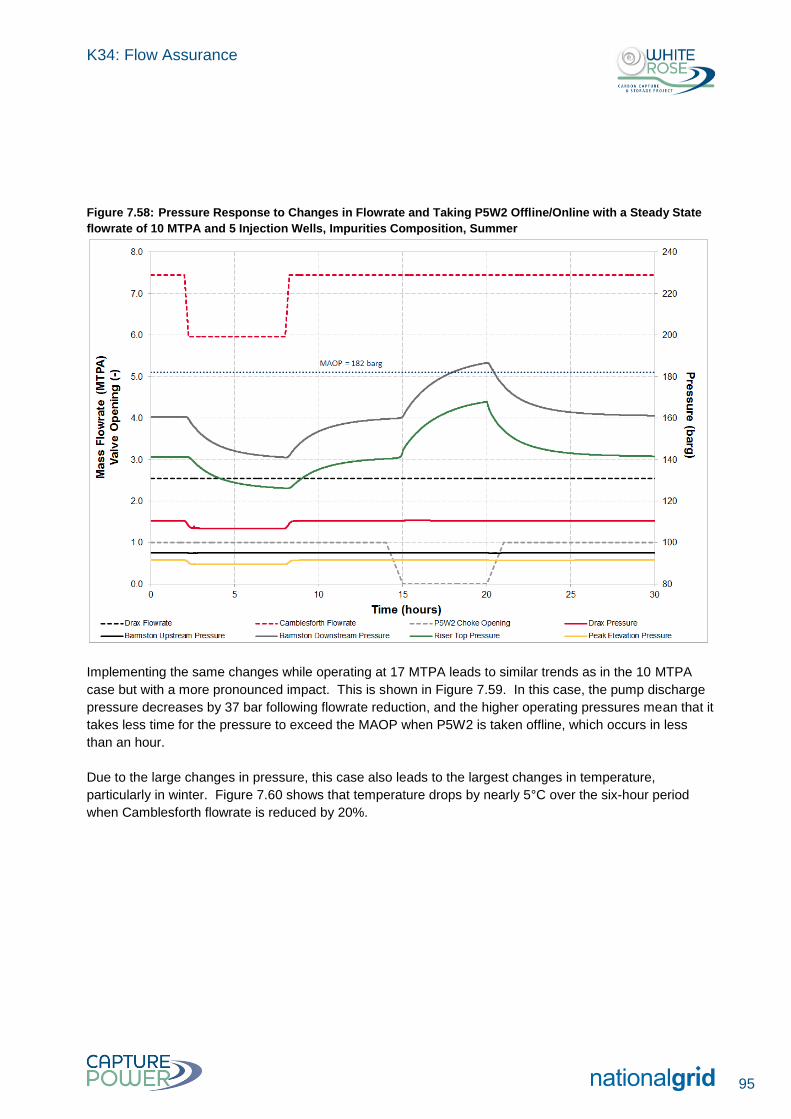
K34: Flow Assurance
95
Figure 7.58: Pressure Response to Changes in Flowrate and Taking P5W2 Offline/Online with a Steady State
flowrate of 10 MTPA and 5 Injection Wells, Impurities Composition, Summer
Implementing the same changes while operating at 17 MTPA leads to similar trends as in the 10 MTPA
case but with a more pronounced impact. This is shown in Figure 7.59. In this case, the pump discharge
pressure decreases by 37 bar following flowrate reduction, and the higher operating pressures mean that it
takes less time for the pressure to exceed the MAOP when P5W2 is taken offline, which occurs in less
than an hour.
Due to the large changes in pressure, this case also leads to the largest changes in temperature,
particularly in winter. Figure 7.60 shows that temperature drops by nearly 5°C over the six-hour period
when Camblesforth flowrate is reduced by 20%.
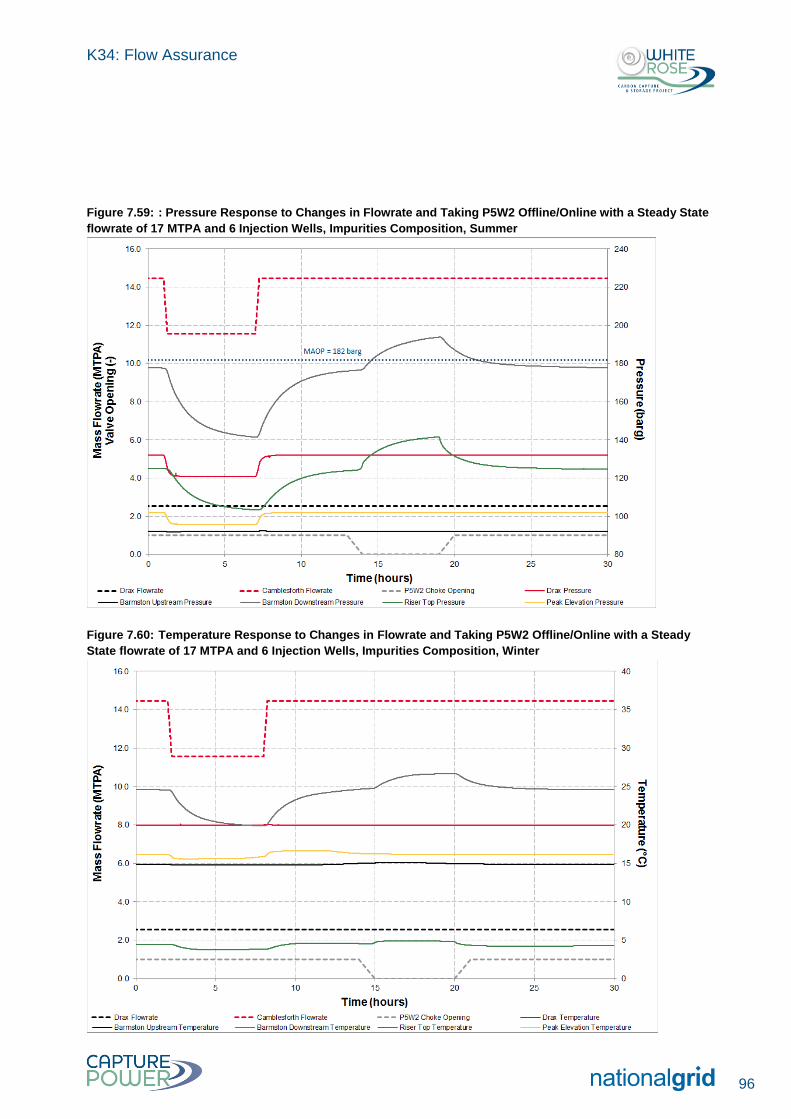
K34: Flow Assurance
96
Figure 7.59: : Pressure Response to Changes in Flowrate and Taking P5W2 Offline/Online with a Steady State
flowrate of 17 MTPA and 6 Injection Wells, Impurities Composition, Summer
Figure 7.60: Temperature Response to Changes in Flowrate and Taking P5W2 Offline/Online with a Steady
State flowrate of 17 MTPA and 6 Injection Wells, Impurities Composition, Winter
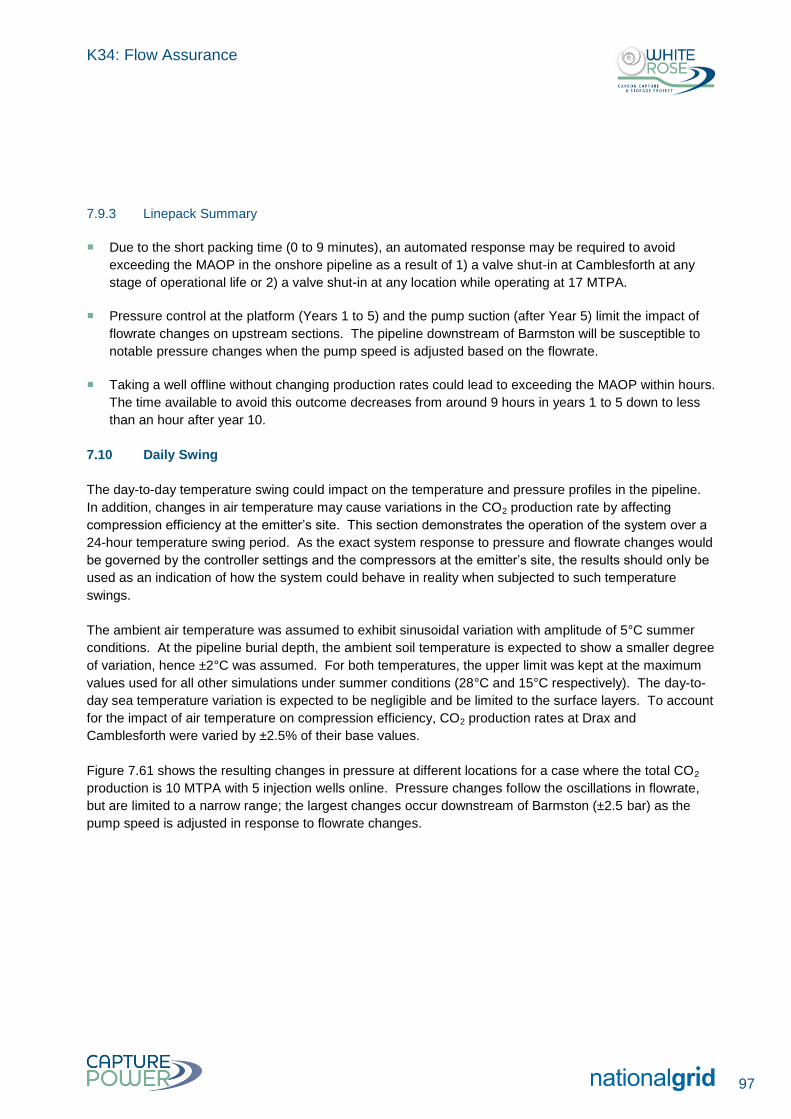
K34: Flow Assurance
97
7.9.3 Linepack Summary
Due to the short packing time (0 to 9 minutes), an automated response may be required to avoid
exceeding the MAOP in the onshore pipeline as a result of 1) a valve shut-in at Camblesforth at any
stage of operational life or 2) a valve shut-in at any location while operating at 17 MTPA.
Pressure control at the platform (Years 1 to 5) and the pump suction (after Year 5) limit the impact of
flowrate changes on upstream sections. The pipeline downstream of Barmston will be susceptible to
notable pressure changes when the pump speed is adjusted based on the flowrate.
Taking a well offline without changing production rates could lead to exceeding the MAOP within hours.
The time available to avoid this outcome decreases from around 9 hours in years 1 to 5 down to less
than an hour after year 10.
7.10 Daily Swing
The day-to-day temperature swing could impact on the temperature and pressure profiles in the pipeline.
In addition, changes in air temperature may cause variations in the CO2 production rate by affecting
compression efficiency at the emitter’s site. This section demonstrates the operation of the system over a
24-hour temperature swing period. As the exact system response to pressure and flowrate changes would
be governed by the controller settings and the compressors at the emitter’s site, the results should only be
used as an indication of how the system could behave in reality when subjected to such temperature
swings.
The ambient air temperature was assumed to exhibit sinusoidal variation with amplitude of 5°C summer
conditions. At the pipeline burial depth, the ambient soil temperature is expected to show a smaller degree
of variation, hence ±2°C was assumed. For both temperatures, the upper limit was kept at the maximum
values used for all other simulations under summer conditions (28°C and 15°C respectively). The day-to-
day sea temperature variation is expected to be negligible and be limited to the surface layers. To account
for the impact of air temperature on compression efficiency, CO2 production rates at Drax and
Camblesforth were varied by ±2.5% of their base values.
Figure 7.61 shows the resulting changes in pressure at different locations for a case where the total CO2
production is 10 MTPA with 5 injection wells online. Pressure changes follow the oscillations in flowrate,
but are limited to a narrow range; the largest changes occur downstream of Barmston (±2.5 bar) as the
pump speed is adjusted in response to flowrate changes.
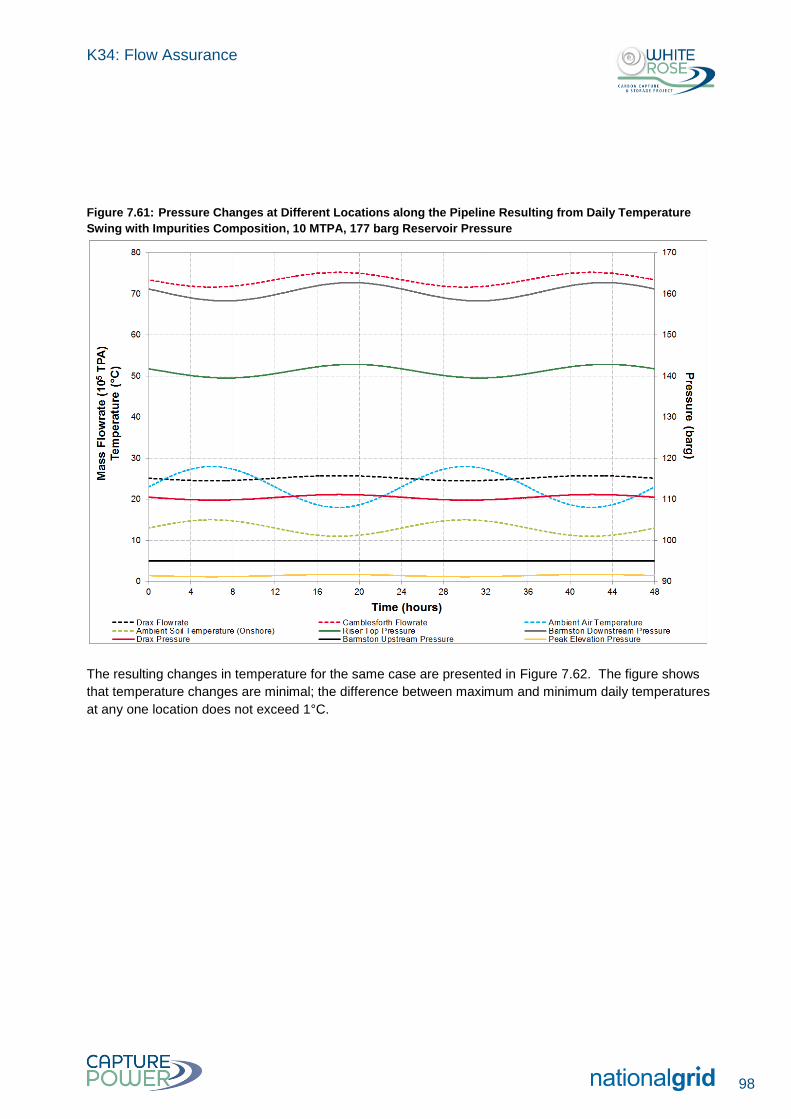
K34: Flow Assurance
98
Figure 7.61: Pressure Changes at Different Locations along the Pipeline Resulting from Daily Temperature
Swing with Impurities Composition, 10 MTPA, 177 barg Reservoir Pressure
The resulting changes in temperature for the same case are presented in Figure 7.62. The figure shows
that temperature changes are minimal; the difference between maximum and minimum daily temperatures
at any one location does not exceed 1°C.
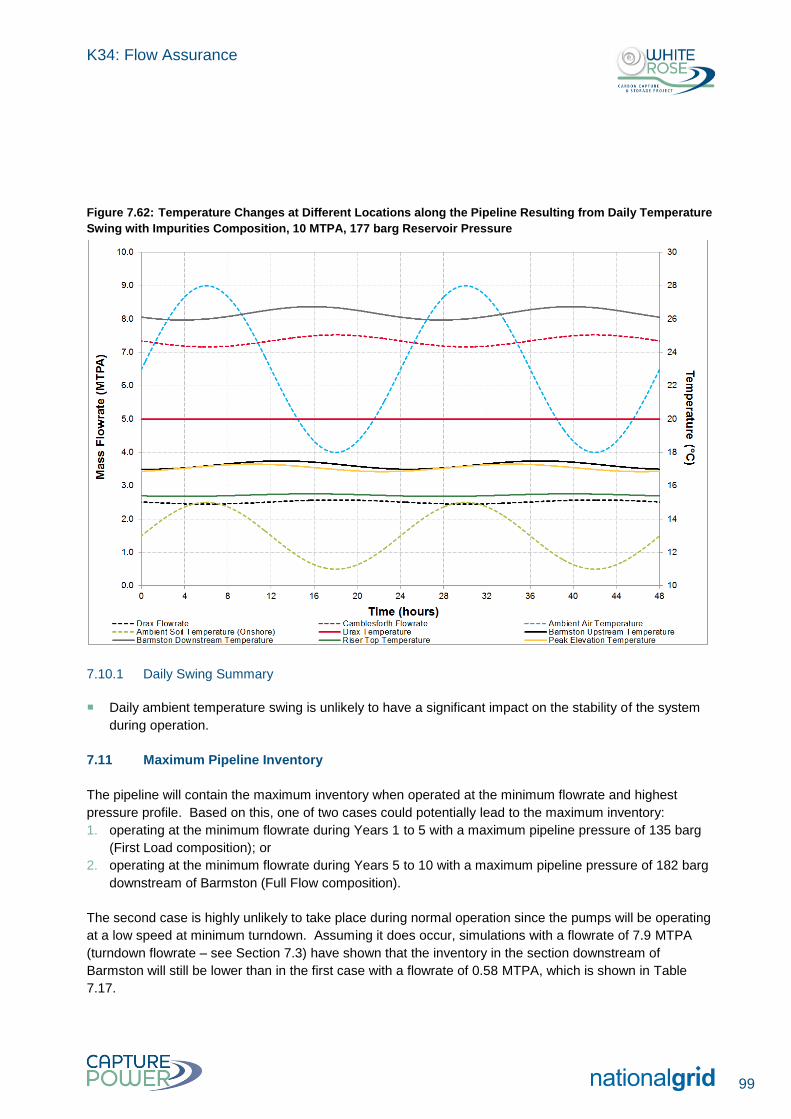
K34: Flow Assurance
99
Figure 7.62: Temperature Changes at Different Locations along the Pipeline Resulting from Daily Temperature
Swing with Impurities Composition, 10 MTPA, 177 barg Reservoir Pressure
7.10.1 Daily Swing Summary
Daily ambient temperature swing is unlikely to have a significant impact on the stability of the system
during operation.
7.11 Maximum Pipeline Inventory
The pipeline will contain the maximum inventory when operated at the minimum flowrate and highest
pressure profile. Based on this, one of two cases could potentially lead to the maximum inventory:
1. operating at the minimum flowrate during Years 1 to 5 with a maximum pipeline pressure of 135 barg
(First Load composition); or
2. operating at the minimum flowrate during Years 5 to 10 with a maximum pipeline pressure of 182 barg
downstream of Barmston (Full Flow composition).
The second case is highly unlikely to take place during normal operation since the pumps will be operating
at a low speed at minimum turndown. Assuming it does occur, simulations with a flowrate of 7.9 MTPA
(turndown flowrate – see Section 7.3) have shown that the inventory in the section downstream of
Barmston will still be lower than in the first case with a flowrate of 0.58 MTPA, which is shown in Table
7.17.
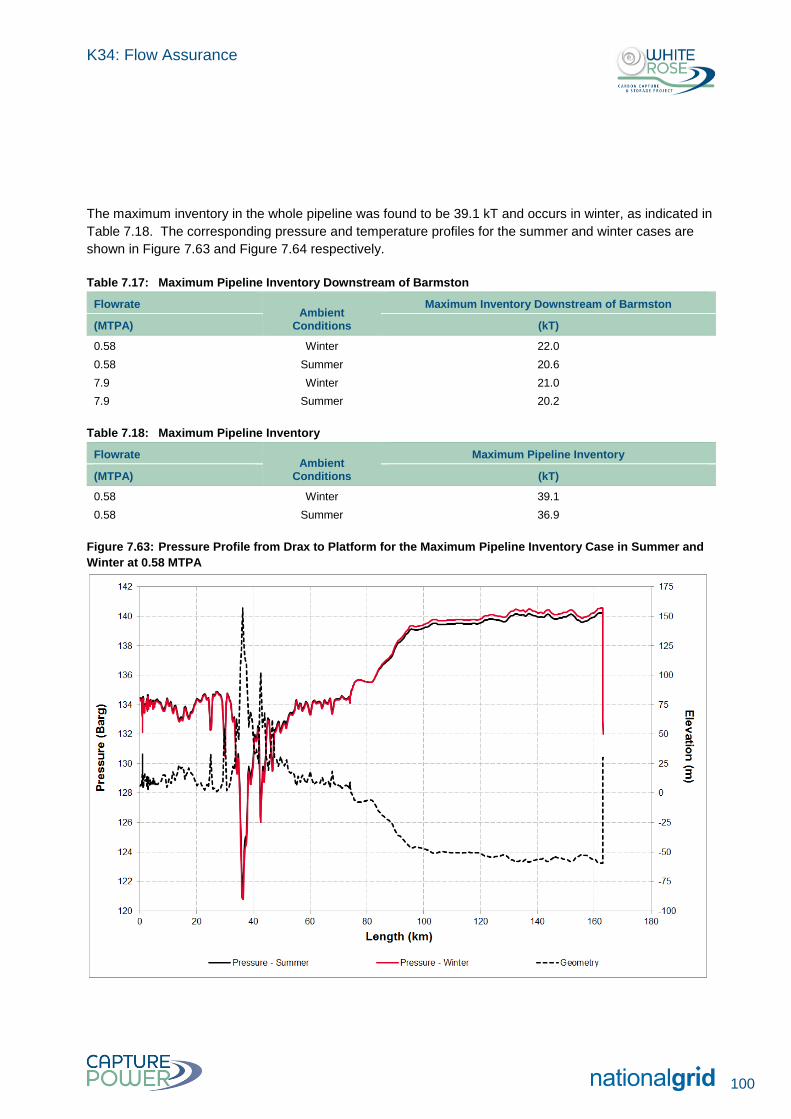
K34: Flow Assurance
100
The maximum inventory in the whole pipeline was found to be 39.1 kT and occurs in winter, as indicated in
Table 7.18. The corresponding pressure and temperature profiles for the summer and winter cases are
shown in Figure 7.63 and Figure 7.64 respectively.
Table 7.17: Maximum Pipeline Inventory Downstream of Barmston
Flowrate Ambient
Conditions
Maximum Inventory Downstream of Barmston
(MTPA) (kT)
0.58 Winter 22.0
0.58 Summer 20.6
7.9 Winter 21.0
7.9 Summer 20.2
Table 7.18: Maximum Pipeline Inventory
Flowrate Ambient
Conditions
Maximum Pipeline Inventory
(MTPA) (kT)
0.58 Winter 39.1
0.58 Summer 36.9
Figure 7.63: Pressure Profile from Drax to Platform for the Maximum Pipeline Inventory Case in Summer and
Winter at 0.58 MTPA
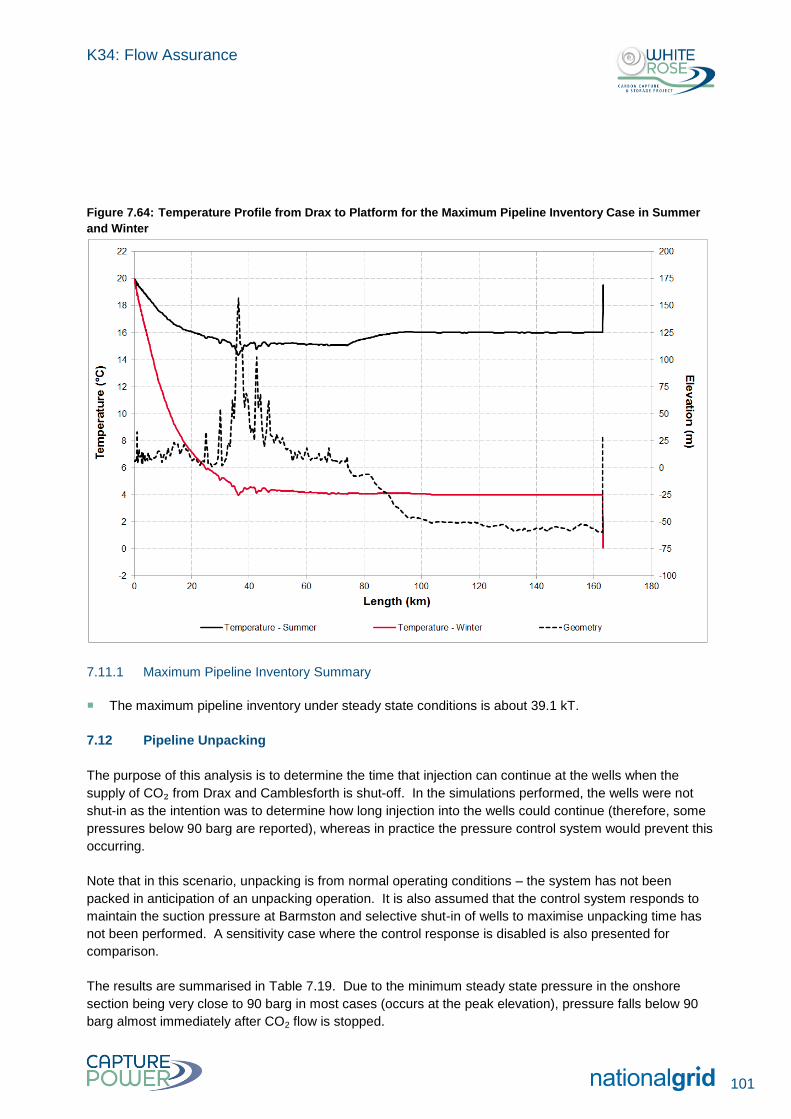
K34: Flow Assurance
101
Figure 7.64: Temperature Profile from Drax to Platform for the Maximum Pipeline Inventory Case in Summer
and Winter
7.11.1 Maximum Pipeline Inventory Summary
The maximum pipeline inventory under steady state conditions is about 39.1 kT.
7.12 Pipeline Unpacking
The purpose of this analysis is to determine the time that injection can continue at the wells when the
supply of CO₂ from Drax and Camblesforth is shut-off. In the simulations performed, the wells were not
shut-in as the intention was to determine how long injection into the wells could continue (therefore, some
pressures below 90 barg are reported), whereas in practice the pressure control system would prevent this
occurring.
Note that in this scenario, unpacking is from normal operating conditions – the system has not been
packed in anticipation of an unpacking operation. It is also assumed that the control system responds to
maintain the suction pressure at Barmston and selective shut-in of wells to maximise unpacking time has
not been performed. A sensitivity case where the control response is disabled is also presented for
comparison.
The results are summarised in Table 7.19. Due to the minimum steady state pressure in the onshore
section being very close to 90 barg in most cases (occurs at the peak elevation), pressure falls below 90
barg almost immediately after CO2 flow is stopped.
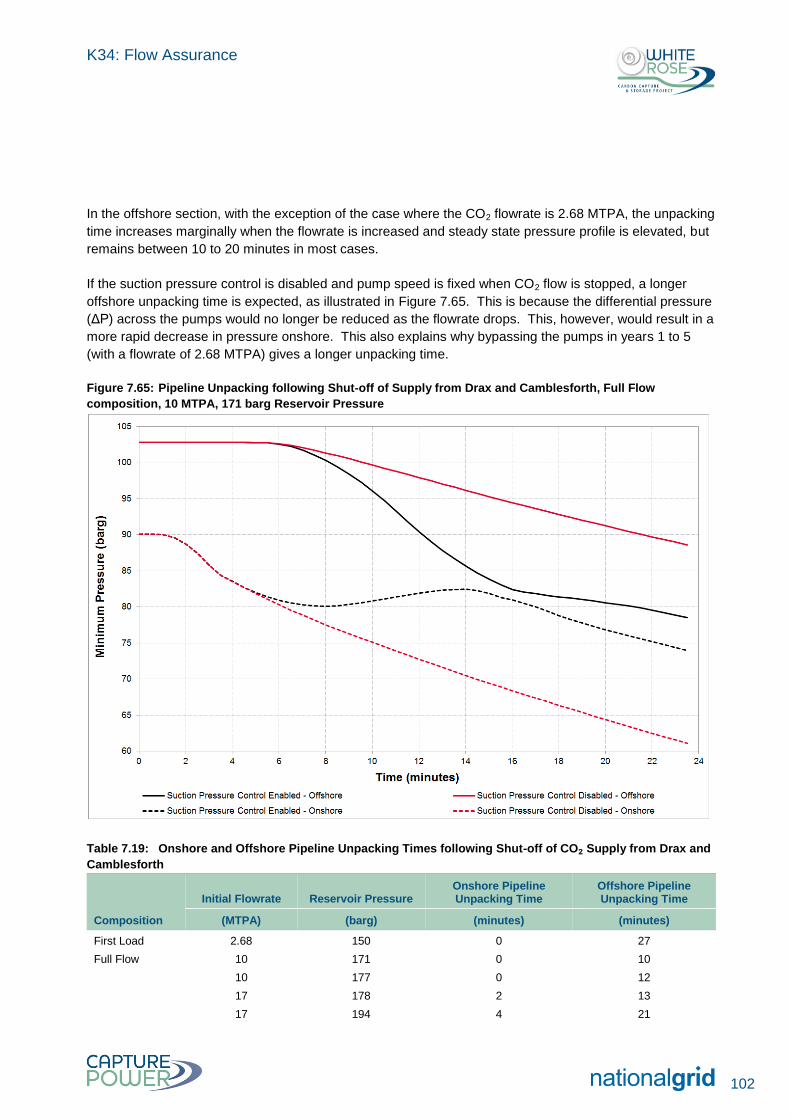
K34: Flow Assurance
102
In the offshore section, with the exception of the case where the CO2 flowrate is 2.68 MTPA, the unpacking
time increases marginally when the flowrate is increased and steady state pressure profile is elevated, but
remains between 10 to 20 minutes in most cases.
If the suction pressure control is disabled and pump speed is fixed when CO2 flow is stopped, a longer
offshore unpacking time is expected, as illustrated in Figure 7.65. This is because the differential pressure
(ΔP) across the pumps would no longer be reduced as the flowrate drops. This, however, would result in a
more rapid decrease in pressure onshore. This also explains why bypassing the pumps in years 1 to 5
(with a flowrate of 2.68 MTPA) gives a longer unpacking time.
Figure 7.65: Pipeline Unpacking following Shut-off of Supply from Drax and Camblesforth, Full Flow
composition, 10 MTPA, 171 barg Reservoir Pressure
Table 7.19: Onshore and Offshore Pipeline Unpacking Times following Shut-off of CO₂ Supply from Drax and
Camblesforth
Composition
Initial Flowrate Reservoir Pressure Onshore Pipeline Unpacking Time
Offshore Pipeline Unpacking Time
(MTPA) (barg) (minutes) (minutes)
First Load 2.68 150 0 27
Full Flow 10 171 0 10
10 177 0 12
17 178 2 13
17 194 4 21
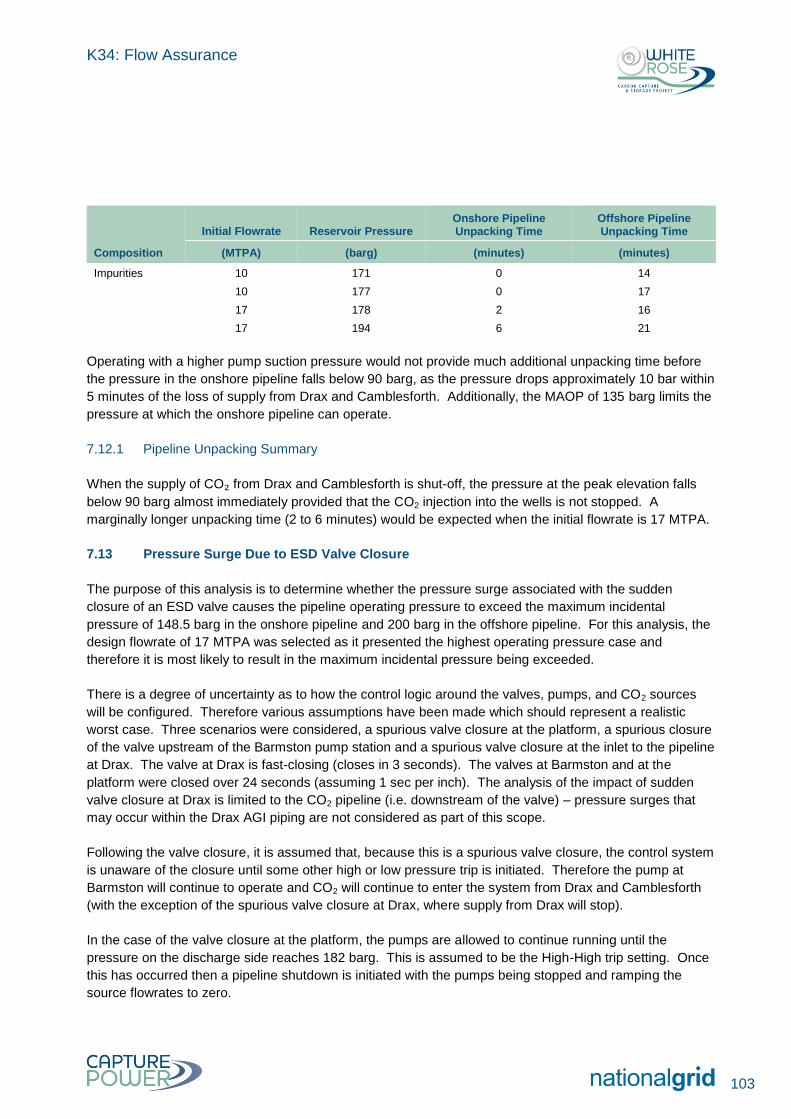
K34: Flow Assurance
103
Composition
Initial Flowrate Reservoir Pressure Onshore Pipeline Unpacking Time
Offshore Pipeline Unpacking Time
(MTPA) (barg) (minutes) (minutes)
Impurities 10 171 0 14
10 177 0 17
17 178 2 16
17 194 6 21
Operating with a higher pump suction pressure would not provide much additional unpacking time before
the pressure in the onshore pipeline falls below 90 barg, as the pressure drops approximately 10 bar within
5 minutes of the loss of supply from Drax and Camblesforth. Additionally, the MAOP of 135 barg limits the
pressure at which the onshore pipeline can operate.
7.12.1 Pipeline Unpacking Summary
When the supply of CO₂ from Drax and Camblesforth is shut-off, the pressure at the peak elevation falls
below 90 barg almost immediately provided that the CO2 injection into the wells is not stopped. A
marginally longer unpacking time (2 to 6 minutes) would be expected when the initial flowrate is 17 MTPA.
7.13 Pressure Surge Due to ESD Valve Closure
The purpose of this analysis is to determine whether the pressure surge associated with the sudden
closure of an ESD valve causes the pipeline operating pressure to exceed the maximum incidental
pressure of 148.5 barg in the onshore pipeline and 200 barg in the offshore pipeline. For this analysis, the
design flowrate of 17 MTPA was selected as it presented the highest operating pressure case and
therefore it is most likely to result in the maximum incidental pressure being exceeded.
There is a degree of uncertainty as to how the control logic around the valves, pumps, and CO2 sources
will be configured. Therefore various assumptions have been made which should represent a realistic
worst case. Three scenarios were considered, a spurious valve closure at the platform, a spurious closure
of the valve upstream of the Barmston pump station and a spurious valve closure at the inlet to the pipeline
at Drax. The valve at Drax is fast-closing (closes in 3 seconds). The valves at Barmston and at the
platform were closed over 24 seconds (assuming 1 sec per inch). The analysis of the impact of sudden
valve closure at Drax is limited to the CO2 pipeline (i.e. downstream of the valve) – pressure surges that
may occur within the Drax AGI piping are not considered as part of this scope.
Following the valve closure, it is assumed that, because this is a spurious valve closure, the control system
is unaware of the closure until some other high or low pressure trip is initiated. Therefore the pump at
Barmston will continue to operate and CO2 will continue to enter the system from Drax and Camblesforth
(with the exception of the spurious valve closure at Drax, where supply from Drax will stop).
In the case of the valve closure at the platform, the pumps are allowed to continue running until the
pressure on the discharge side reaches 182 barg. This is assumed to be the High-High trip setting. Once
this has occurred then a pipeline shutdown is initiated with the pumps being stopped and ramping the
source flowrates to zero.
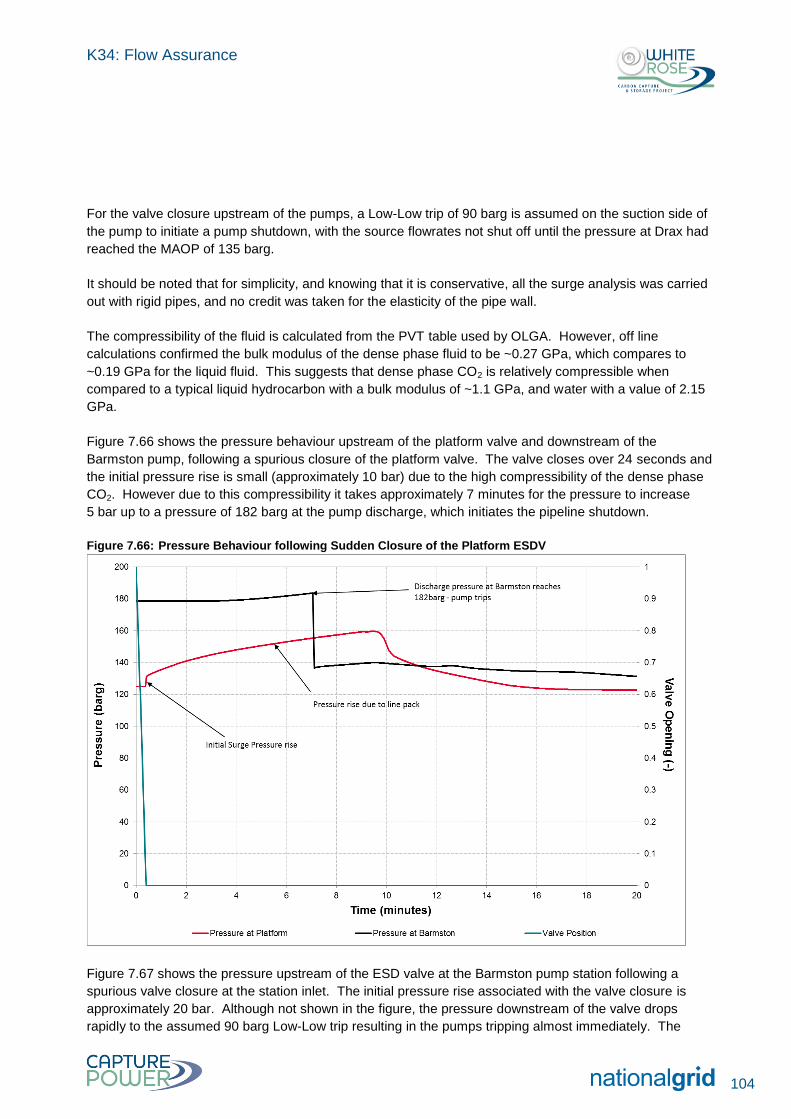
K34: Flow Assurance
104
For the valve closure upstream of the pumps, a Low-Low trip of 90 barg is assumed on the suction side of
the pump to initiate a pump shutdown, with the source flowrates not shut off until the pressure at Drax had
reached the MAOP of 135 barg.
It should be noted that for simplicity, and knowing that it is conservative, all the surge analysis was carried
out with rigid pipes, and no credit was taken for the elasticity of the pipe wall.
The compressibility of the fluid is calculated from the PVT table used by OLGA. However, off line
calculations confirmed the bulk modulus of the dense phase fluid to be ~0.27 GPa, which compares to
~0.19 GPa for the liquid fluid. This suggests that dense phase CO2 is relatively compressible when
compared to a typical liquid hydrocarbon with a bulk modulus of ~1.1 GPa, and water with a value of 2.15
GPa.
Figure 7.66 shows the pressure behaviour upstream of the platform valve and downstream of the
Barmston pump, following a spurious closure of the platform valve. The valve closes over 24 seconds and
the initial pressure rise is small (approximately 10 bar) due to the high compressibility of the dense phase
CO2. However due to this compressibility it takes approximately 7 minutes for the pressure to increase
5 bar up to a pressure of 182 barg at the pump discharge, which initiates the pipeline shutdown.
Figure 7.66: Pressure Behaviour following Sudden Closure of the Platform ESDV
Figure 7.67 shows the pressure upstream of the ESD valve at the Barmston pump station following a
spurious valve closure at the station inlet. The initial pressure rise associated with the valve closure is
approximately 20 bar. Although not shown in the figure, the pressure downstream of the valve drops
rapidly to the assumed 90 barg Low-Low trip resulting in the pumps tripping almost immediately. The
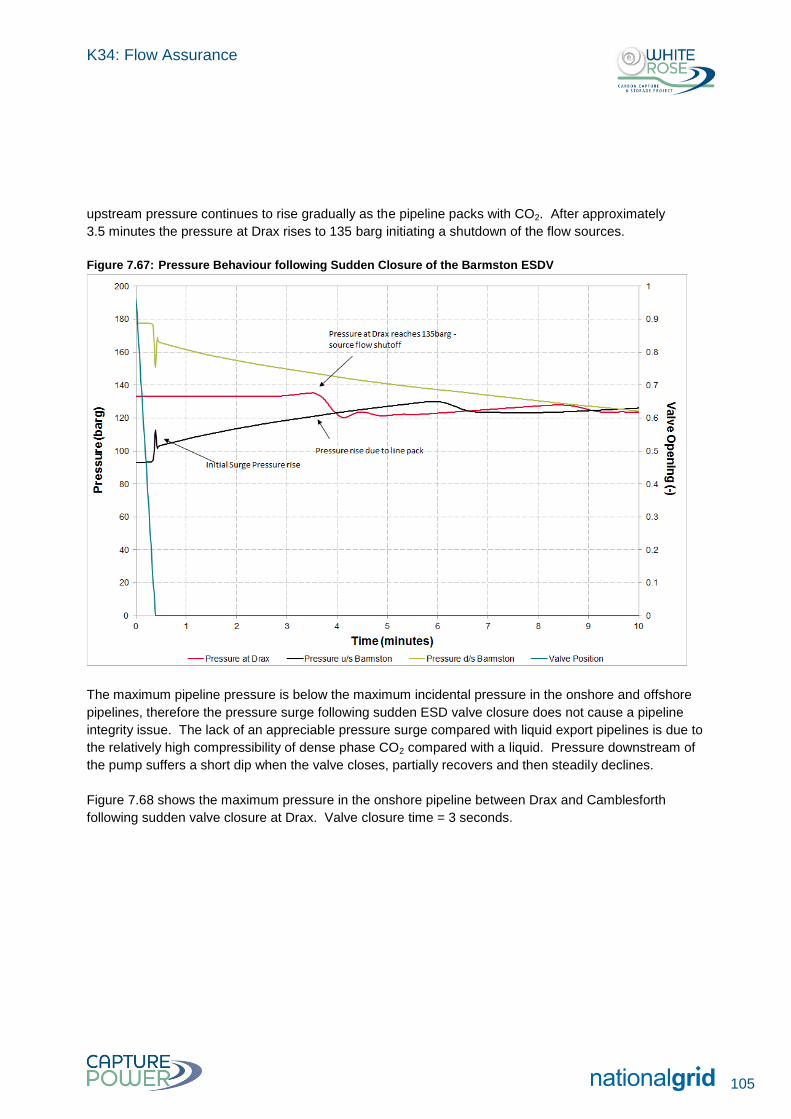
K34: Flow Assurance
105
upstream pressure continues to rise gradually as the pipeline packs with CO2. After approximately
3.5 minutes the pressure at Drax rises to 135 barg initiating a shutdown of the flow sources.
Figure 7.67: Pressure Behaviour following Sudden Closure of the Barmston ESDV
The maximum pipeline pressure is below the maximum incidental pressure in the onshore and offshore
pipelines, therefore the pressure surge following sudden ESD valve closure does not cause a pipeline
integrity issue. The lack of an appreciable pressure surge compared with liquid export pipelines is due to
the relatively high compressibility of dense phase CO2 compared with a liquid. Pressure downstream of
the pump suffers a short dip when the valve closes, partially recovers and then steadily declines.
Figure 7.68 shows the maximum pressure in the onshore pipeline between Drax and Camblesforth
following sudden valve closure at Drax. Valve closure time = 3 seconds.
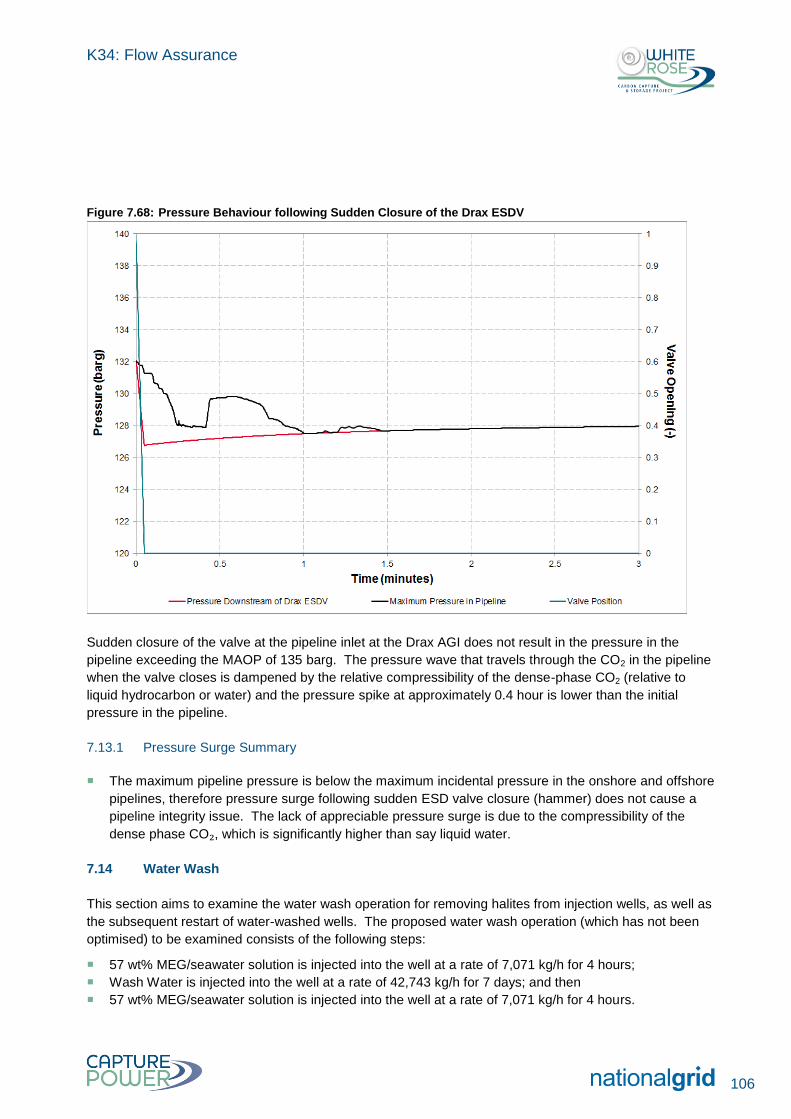
K34: Flow Assurance
106
Figure 7.68: Pressure Behaviour following Sudden Closure of the Drax ESDV
Sudden closure of the valve at the pipeline inlet at the Drax AGI does not result in the pressure in the
pipeline exceeding the MAOP of 135 barg. The pressure wave that travels through the CO2 in the pipeline
when the valve closes is dampened by the relative compressibility of the dense-phase CO2 (relative to
liquid hydrocarbon or water) and the pressure spike at approximately 0.4 hour is lower than the initial
pressure in the pipeline.
7.13.1 Pressure Surge Summary
The maximum pipeline pressure is below the maximum incidental pressure in the onshore and offshore
pipelines, therefore pressure surge following sudden ESD valve closure (hammer) does not cause a
pipeline integrity issue. The lack of appreciable pressure surge is due to the compressibility of the
dense phase CO₂, which is significantly higher than say liquid water.
7.14 Water Wash
This section aims to examine the water wash operation for removing halites from injection wells, as well as
the subsequent restart of water-washed wells. The proposed water wash operation (which has not been
optimised) to be examined consists of the following steps:
57 wt% MEG/seawater solution is injected into the well at a rate of 7,071 kg/h for 4 hours;
Wash Water is injected into the well at a rate of 42,743 kg/h for 7 days; and then
57 wt% MEG/seawater solution is injected into the well at a rate of 7,071 kg/h for 4 hours.
K34: Flow Assurance
107
Simulations were performed to confirm the operating pressure upstream of the wellhead, which is subject
to a MAOP limit of 182 barg. It should be noted that a key variable in these simulations is the reservoir
injectivity. The following section describes the approach taken in modelling this behaviour.
7.14.1 Reservoir Injectivity (for Water Wash Operation)
The reservoir injectivity dictates the pressure driving force required to inject a particular fluid into the
reservoir at a specific rate; it is a function of both reservoir and fluid properties. Specifically, mass
injectivity of the reservoir is inversely proportional to the kinematic viscosity (ratio of dynamic viscosity over
density) of the fluid at the bottom hole conditions, as illustrated in the equation below:
Where Imass is mass injectivity of the reservoir, q is fluid volumetric flowrate, ρ is mass density, pbh is bottom
hole pressure, pe is reservoir equilibrium pressure, k is reservoir permeability, h is reservoir thickness, µ is
fluid dynamic viscosity and f(rw, l) is a function of wellbore radius rw and the length l over which the
pressure drop occurs.
A CO2 injectivity of 1.4 x 10⁻⁵
kg/s/Pa had been inferred from the available data, as explained in the
simulation basis. To calculate the water and MEG solution injectivities for the same reservoir properties,
this value was adjusted based on the kinematic viscosity of the fluid at bottom hole conditions, assuming a
kinematic viscosity of 0.077 x 10⁻⁶
m2/s for CO2 (as predicted at 160 barg and 62°C).
The kinematic viscosity, and hence the injectivity, is a strong function of temperature; between 62°C
(approximate reservoir temperature) and 4°C (water injection temperature in winter), the kinematic
viscosity of the MEG solution and pure water increase by five-fold and three-fold respectively. This is
illustrated in Figure 7.69. Simulations were performed using an injection temperature of 4°C (at the
wellhead) to obtain the highest operating pressures.
Note that the impact of halites on the injectivity is not considered here – halites will impede injectivity but
the degree to which this occurs is dependent on the amount of deposition, which is unknown.
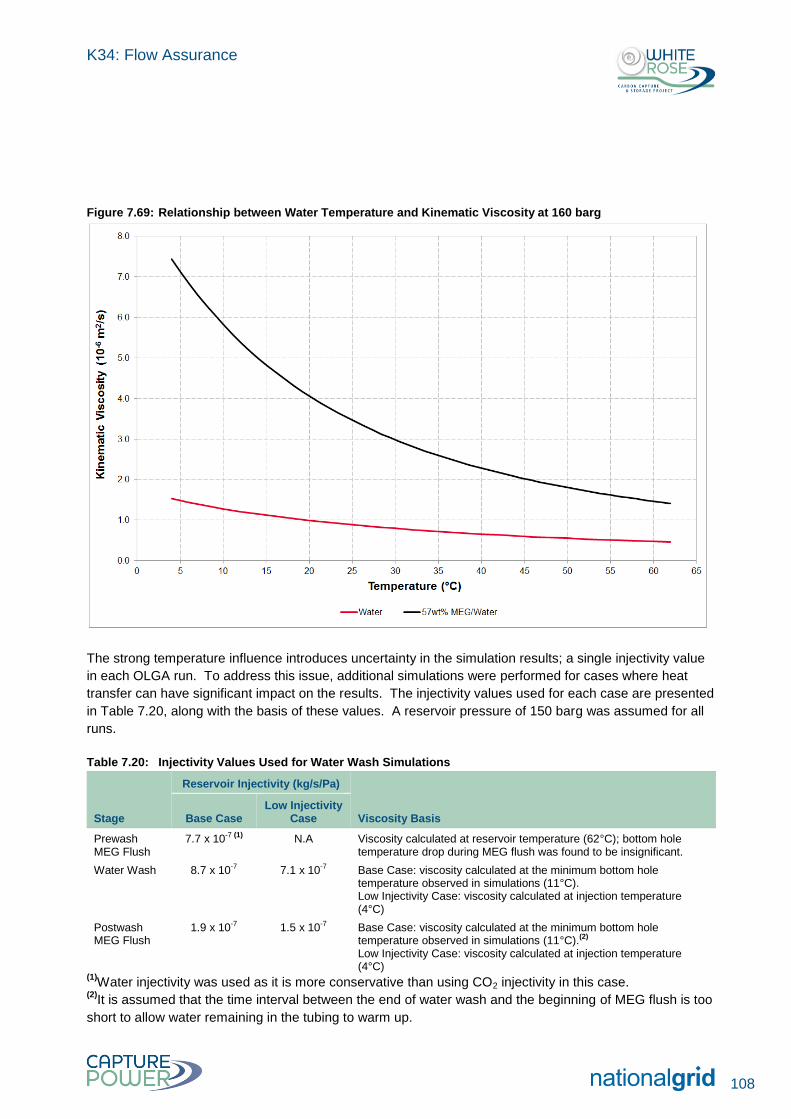
K34: Flow Assurance
108
Figure 7.69: Relationship between Water Temperature and Kinematic Viscosity at 160 barg
The strong temperature influence introduces uncertainty in the simulation results; a single injectivity value
in each OLGA run. To address this issue, additional simulations were performed for cases where heat
transfer can have significant impact on the results. The injectivity values used for each case are presented
in Table 7.20, along with the basis of these values. A reservoir pressure of 150 barg was assumed for all
runs.
Table 7.20: Injectivity Values Used for Water Wash Simulations
Stage
Reservoir Injectivity (kg/s/Pa)
Viscosity Basis Base Case Low Injectivity
Case
Prewash MEG Flush
7.7 x 10⁻⁷ (1) N.A Viscosity calculated at reservoir temperature (62°C); bottom hole temperature drop during MEG flush was found to be insignificant.
Water Wash 8.7 x 10⁻⁷ 7.1 x 10⁻⁷ Base Case: viscosity calculated at the minimum bottom hole temperature observed in simulations (11°C). Low Injectivity Case: viscosity calculated at injection temperature (4°C)
Postwash MEG Flush
1.9 x 10⁻⁷ 1.5 x 10⁻⁷ Base Case: viscosity calculated at the minimum bottom hole temperature observed in simulations (11°C).(2) Low Injectivity Case: viscosity calculated at injection temperature (4°C)
(1)Water injectivity was used as it is more conservative than using CO2 injectivity in this case.
(2)It is assumed that the time interval between the end of water wash and the beginning of MEG flush is too
short to allow water remaining in the tubing to warm up.
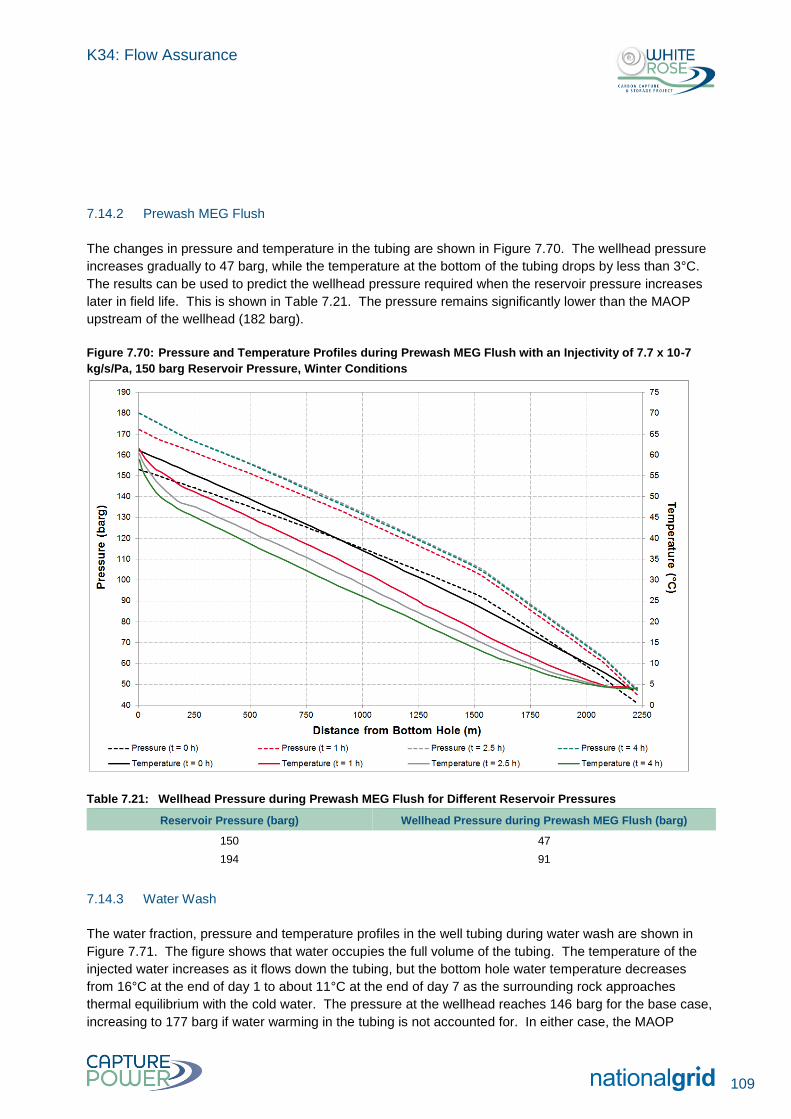
K34: Flow Assurance
109
7.14.2 Prewash MEG Flush
The changes in pressure and temperature in the tubing are shown in Figure 7.70. The wellhead pressure
increases gradually to 47 barg, while the temperature at the bottom of the tubing drops by less than 3°C.
The results can be used to predict the wellhead pressure required when the reservoir pressure increases
later in field life. This is shown in Table 7.21. The pressure remains significantly lower than the MAOP
upstream of the wellhead (182 barg).
Figure 7.70: Pressure and Temperature Profiles during Prewash MEG Flush with an Injectivity of 7.7 x 10⁻⁷
kg/s/Pa, 150 barg Reservoir Pressure, Winter Conditions
Table 7.21: Wellhead Pressure during Prewash MEG Flush for Different Reservoir Pressures
Reservoir Pressure (barg) Wellhead Pressure during Prewash MEG Flush (barg)
150 47
194 91
7.14.3 Water Wash
The water fraction, pressure and temperature profiles in the well tubing during water wash are shown in
Figure 7.71. The figure shows that water occupies the full volume of the tubing. The temperature of the
injected water increases as it flows down the tubing, but the bottom hole water temperature decreases
from 16°C at the end of day 1 to about 11°C at the end of day 7 as the surrounding rock approaches
thermal equilibrium with the cold water. The pressure at the wellhead reaches 146 barg for the base case,
increasing to 177 barg if water warming in the tubing is not accounted for. In either case, the MAOP
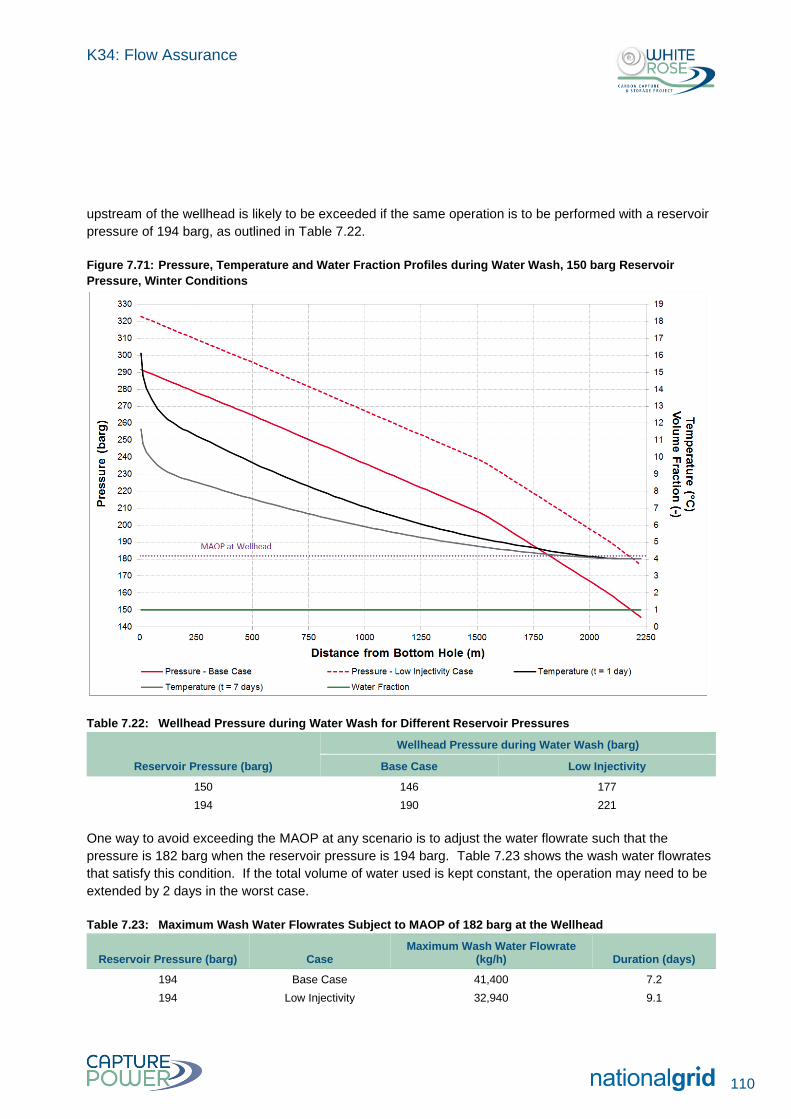
K34: Flow Assurance
110
upstream of the wellhead is likely to be exceeded if the same operation is to be performed with a reservoir
pressure of 194 barg, as outlined in Table 7.22.
Figure 7.71: Pressure, Temperature and Water Fraction Profiles during Water Wash, 150 barg Reservoir
Pressure, Winter Conditions
Table 7.22: Wellhead Pressure during Water Wash for Different Reservoir Pressures
Reservoir Pressure (barg)
Wellhead Pressure during Water Wash (barg)
Base Case Low Injectivity
150 146 177
194 190 221
One way to avoid exceeding the MAOP at any scenario is to adjust the water flowrate such that the
pressure is 182 barg when the reservoir pressure is 194 barg. Table 7.23 shows the wash water flowrates
that satisfy this condition. If the total volume of water used is kept constant, the operation may need to be
extended by 2 days in the worst case.
Table 7.23: Maximum Wash Water Flowrates Subject to MAOP of 182 barg at the Wellhead
Reservoir Pressure (barg) Case Maximum Wash Water Flowrate
(kg/h) Duration (days)
194 Base Case 41,400 7.2
194 Low Injectivity 32,940 9.1
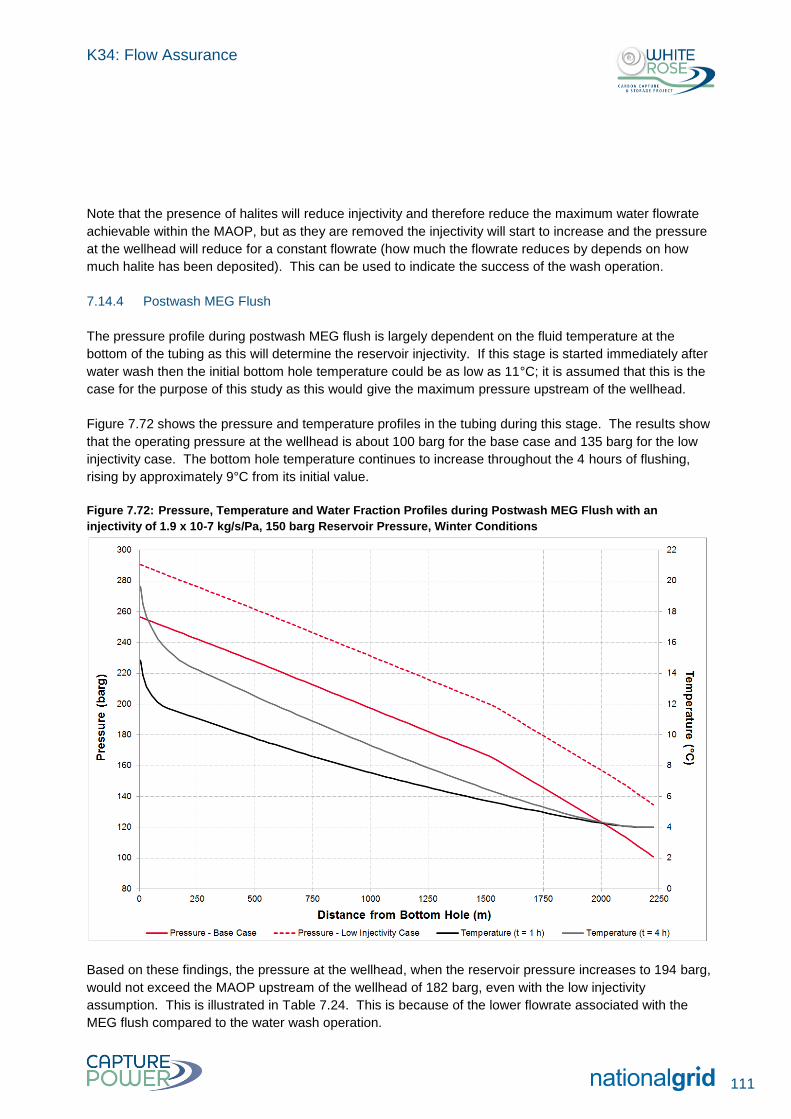
K34: Flow Assurance
111
Note that the presence of halites will reduce injectivity and therefore reduce the maximum water flowrate
achievable within the MAOP, but as they are removed the injectivity will start to increase and the pressure
at the wellhead will reduce for a constant flowrate (how much the flowrate reduces by depends on how
much halite has been deposited). This can be used to indicate the success of the wash operation.
7.14.4 Postwash MEG Flush
The pressure profile during postwash MEG flush is largely dependent on the fluid temperature at the
bottom of the tubing as this will determine the reservoir injectivity. If this stage is started immediately after
water wash then the initial bottom hole temperature could be as low as 11°C; it is assumed that this is the
case for the purpose of this study as this would give the maximum pressure upstream of the wellhead.
Figure 7.72 shows the pressure and temperature profiles in the tubing during this stage. The results show
that the operating pressure at the wellhead is about 100 barg for the base case and 135 barg for the low
injectivity case. The bottom hole temperature continues to increase throughout the 4 hours of flushing,
rising by approximately 9°C from its initial value.
Figure 7.72: Pressure, Temperature and Water Fraction Profiles during Postwash MEG Flush with an
injectivity of 1.9 x 10⁻⁷ kg/s/Pa, 150 barg Reservoir Pressure, Winter Conditions
Based on these findings, the pressure at the wellhead, when the reservoir pressure increases to 194 barg,
would not exceed the MAOP upstream of the wellhead of 182 barg, even with the low injectivity
assumption. This is illustrated in Table 7.24. This is because of the lower flowrate associated with the
MEG flush compared to the water wash operation.
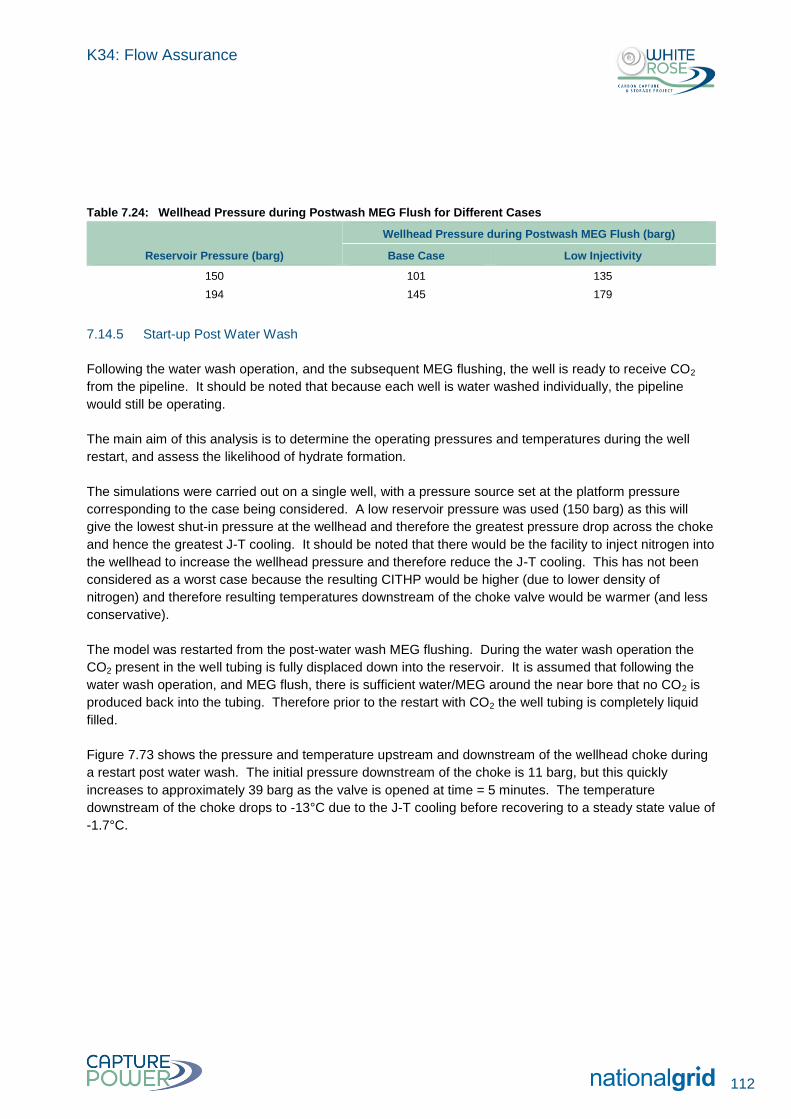
K34: Flow Assurance
112
Table 7.24: Wellhead Pressure during Postwash MEG Flush for Different Cases
Reservoir Pressure (barg)
Wellhead Pressure during Postwash MEG Flush (barg)
Base Case Low Injectivity
150 101 135
194 145 179
7.14.5 Start-up Post Water Wash
Following the water wash operation, and the subsequent MEG flushing, the well is ready to receive CO2
from the pipeline. It should be noted that because each well is water washed individually, the pipeline
would still be operating.
The main aim of this analysis is to determine the operating pressures and temperatures during the well
restart, and assess the likelihood of hydrate formation.
The simulations were carried out on a single well, with a pressure source set at the platform pressure
corresponding to the case being considered. A low reservoir pressure was used (150 barg) as this will
give the lowest shut-in pressure at the wellhead and therefore the greatest pressure drop across the choke
and hence the greatest J-T cooling. It should be noted that there would be the facility to inject nitrogen into
the wellhead to increase the wellhead pressure and therefore reduce the J-T cooling. This has not been
considered as a worst case because the resulting CITHP would be higher (due to lower density of
nitrogen) and therefore resulting temperatures downstream of the choke valve would be warmer (and less
conservative).
The model was restarted from the post-water wash MEG flushing. During the water wash operation the
CO2 present in the well tubing is fully displaced down into the reservoir. It is assumed that following the
water wash operation, and MEG flush, there is sufficient water/MEG around the near bore that no CO2 is
produced back into the tubing. Therefore prior to the restart with CO2 the well tubing is completely liquid
filled.
Figure 7.73 shows the pressure and temperature upstream and downstream of the wellhead choke during
a restart post water wash. The initial pressure downstream of the choke is 11 barg, but this quickly
increases to approximately 39 barg as the valve is opened at time = 5 minutes. The temperature
downstream of the choke drops to -13°C due to the J-T cooling before recovering to a steady state value of
-1.7°C.
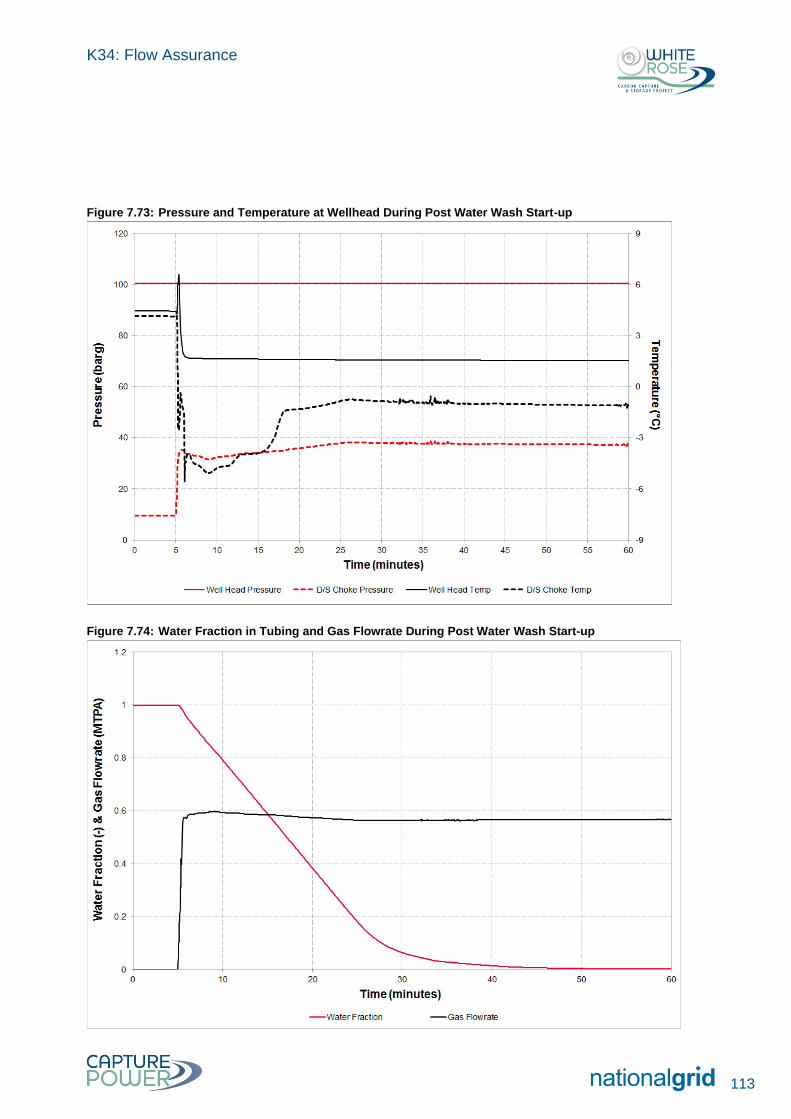
K34: Flow Assurance
113
Figure 7.73: Pressure and Temperature at Wellhead During Post Water Wash Start-up
Figure 7.74: Water Fraction in Tubing and Gas Flowrate During Post Water Wash Start-up
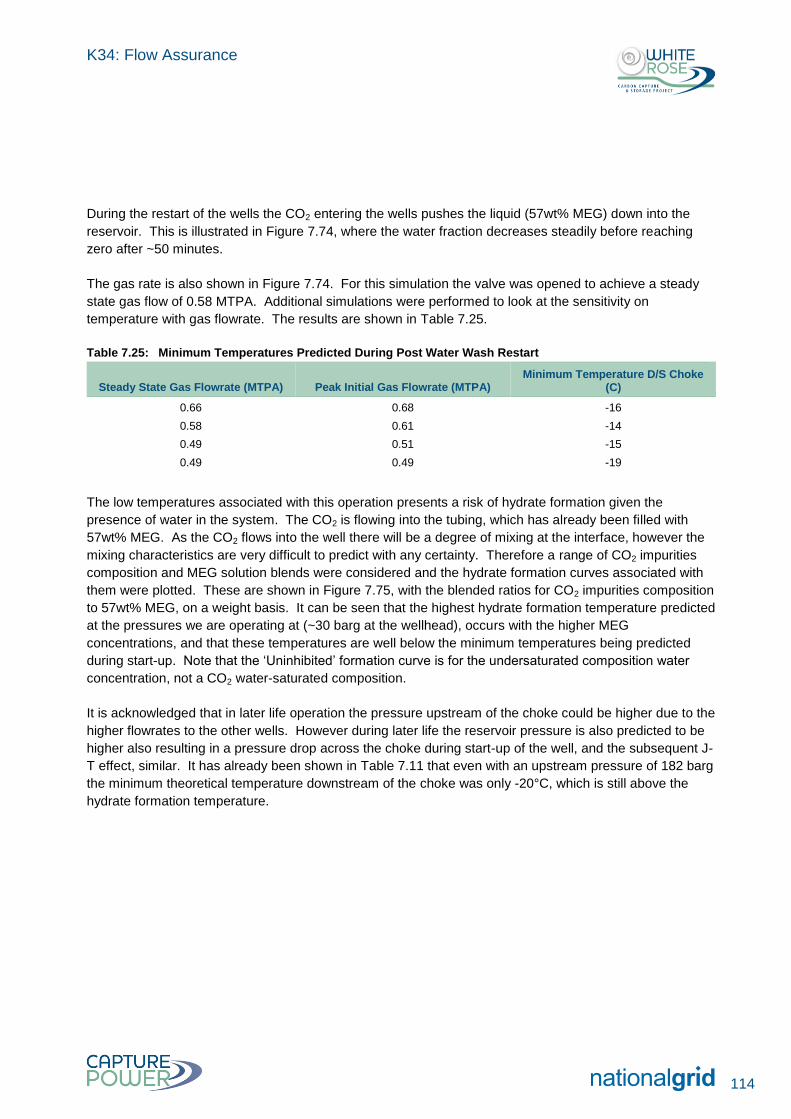
K34: Flow Assurance
114
During the restart of the wells the CO2 entering the wells pushes the liquid (57wt% MEG) down into the
reservoir. This is illustrated in Figure 7.74, where the water fraction decreases steadily before reaching
zero after ~50 minutes.
The gas rate is also shown in Figure 7.74. For this simulation the valve was opened to achieve a steady
state gas flow of 0.58 MTPA. Additional simulations were performed to look at the sensitivity on
temperature with gas flowrate. The results are shown in Table 7.25.
Table 7.25: Minimum Temperatures Predicted During Post Water Wash Restart
Steady State Gas Flowrate (MTPA) Peak Initial Gas Flowrate (MTPA) Minimum Temperature D/S Choke
(C)
0.66 0.68 -16
0.58 0.61 -14
0.49 0.51 -15
0.49 0.49 -19
The low temperatures associated with this operation presents a risk of hydrate formation given the
presence of water in the system. The CO2 is flowing into the tubing, which has already been filled with
57wt% MEG. As the CO2 flows into the well there will be a degree of mixing at the interface, however the
mixing characteristics are very difficult to predict with any certainty. Therefore a range of CO2 impurities
composition and MEG solution blends were considered and the hydrate formation curves associated with
them were plotted. These are shown in Figure 7.75, with the blended ratios for CO2 impurities composition
to 57wt% MEG, on a weight basis. It can be seen that the highest hydrate formation temperature predicted
at the pressures we are operating at (~30 barg at the wellhead), occurs with the higher MEG
concentrations, and that these temperatures are well below the minimum temperatures being predicted
during start-up. Note that the ‘Uninhibited’ formation curve is for the undersaturated composition water
concentration, not a CO2 water-saturated composition.
It is acknowledged that in later life operation the pressure upstream of the choke could be higher due to the
higher flowrates to the other wells. However during later life the reservoir pressure is also predicted to be
higher also resulting in a pressure drop across the choke during start-up of the well, and the subsequent J-
T effect, similar. It has already been shown in Table 7.11 that even with an upstream pressure of 182 barg
the minimum theoretical temperature downstream of the choke was only -20°C, which is still above the
hydrate formation temperature.
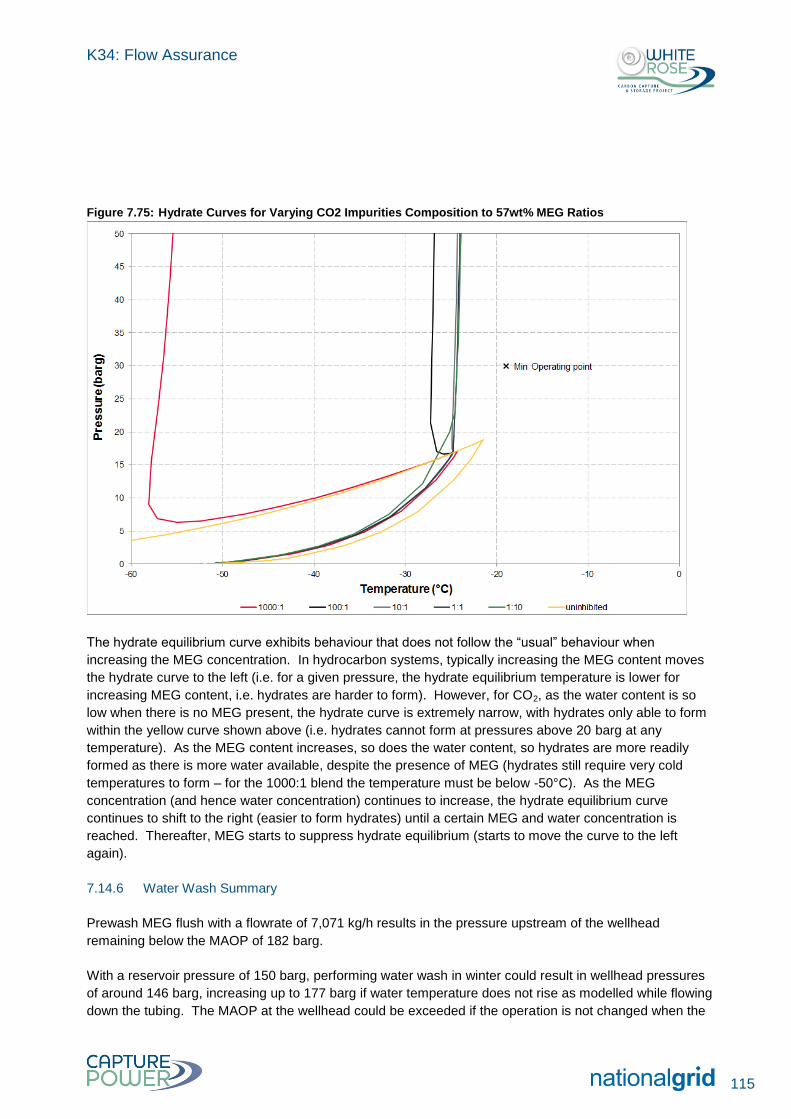
K34: Flow Assurance
115
Figure 7.75: Hydrate Curves for Varying CO2 Impurities Composition to 57wt% MEG Ratios
The hydrate equilibrium curve exhibits behaviour that does not follow the “usual” behaviour when
increasing the MEG concentration. In hydrocarbon systems, typically increasing the MEG content moves
the hydrate curve to the left (i.e. for a given pressure, the hydrate equilibrium temperature is lower for
increasing MEG content, i.e. hydrates are harder to form). However, for CO2, as the water content is so
low when there is no MEG present, the hydrate curve is extremely narrow, with hydrates only able to form
within the yellow curve shown above (i.e. hydrates cannot form at pressures above 20 barg at any
temperature). As the MEG content increases, so does the water content, so hydrates are more readily
formed as there is more water available, despite the presence of MEG (hydrates still require very cold
temperatures to form – for the 1000:1 blend the temperature must be below -50°C). As the MEG
concentration (and hence water concentration) continues to increase, the hydrate equilibrium curve
continues to shift to the right (easier to form hydrates) until a certain MEG and water concentration is
reached. Thereafter, MEG starts to suppress hydrate equilibrium (starts to move the curve to the left
again).
7.14.6 Water Wash Summary
Prewash MEG flush with a flowrate of 7,071 kg/h results in the pressure upstream of the wellhead
remaining below the MAOP of 182 barg.
With a reservoir pressure of 150 barg, performing water wash in winter could result in wellhead pressures
of around 146 barg, increasing up to 177 barg if water temperature does not rise as modelled while flowing
down the tubing. The MAOP at the wellhead could be exceeded if the operation is not changed when the
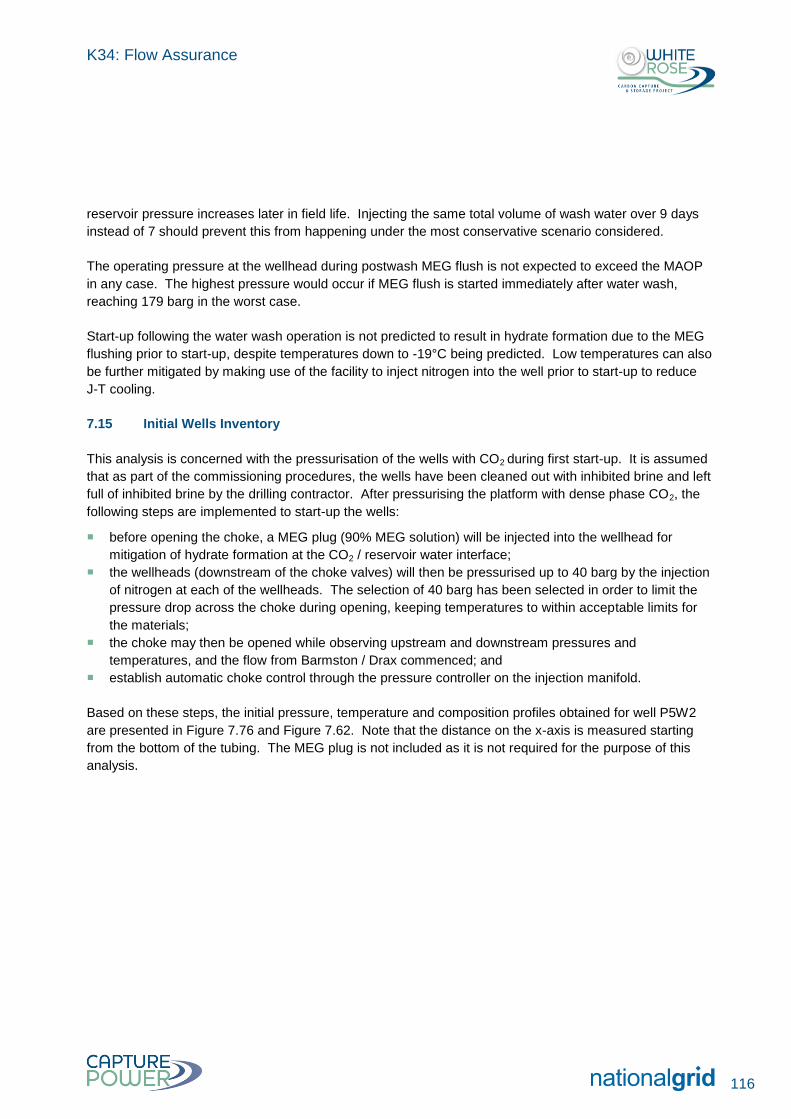
K34: Flow Assurance
116
reservoir pressure increases later in field life. Injecting the same total volume of wash water over 9 days
instead of 7 should prevent this from happening under the most conservative scenario considered.
The operating pressure at the wellhead during postwash MEG flush is not expected to exceed the MAOP
in any case. The highest pressure would occur if MEG flush is started immediately after water wash,
reaching 179 barg in the worst case.
Start-up following the water wash operation is not predicted to result in hydrate formation due to the MEG
flushing prior to start-up, despite temperatures down to -19°C being predicted. Low temperatures can also
be further mitigated by making use of the facility to inject nitrogen into the well prior to start-up to reduce
J-T cooling.
7.15 Initial Wells Inventory
This analysis is concerned with the pressurisation of the wells with CO2 during first start-up. It is assumed
that as part of the commissioning procedures, the wells have been cleaned out with inhibited brine and left
full of inhibited brine by the drilling contractor. After pressurising the platform with dense phase CO2, the
following steps are implemented to start-up the wells:
before opening the choke, a MEG plug (90% MEG solution) will be injected into the wellhead for
mitigation of hydrate formation at the CO2 / reservoir water interface;
the wellheads (downstream of the choke valves) will then be pressurised up to 40 barg by the injection
of nitrogen at each of the wellheads. The selection of 40 barg has been selected in order to limit the
pressure drop across the choke during opening, keeping temperatures to within acceptable limits for
the materials;
the choke may then be opened while observing upstream and downstream pressures and
temperatures, and the flow from Barmston / Drax commenced; and
establish automatic choke control through the pressure controller on the injection manifold.
Based on these steps, the initial pressure, temperature and composition profiles obtained for well P5W2
are presented in Figure 7.76 and Figure 7.62. Note that the distance on the x-axis is measured starting
from the bottom of the tubing. The MEG plug is not included as it is not required for the purpose of this
analysis.
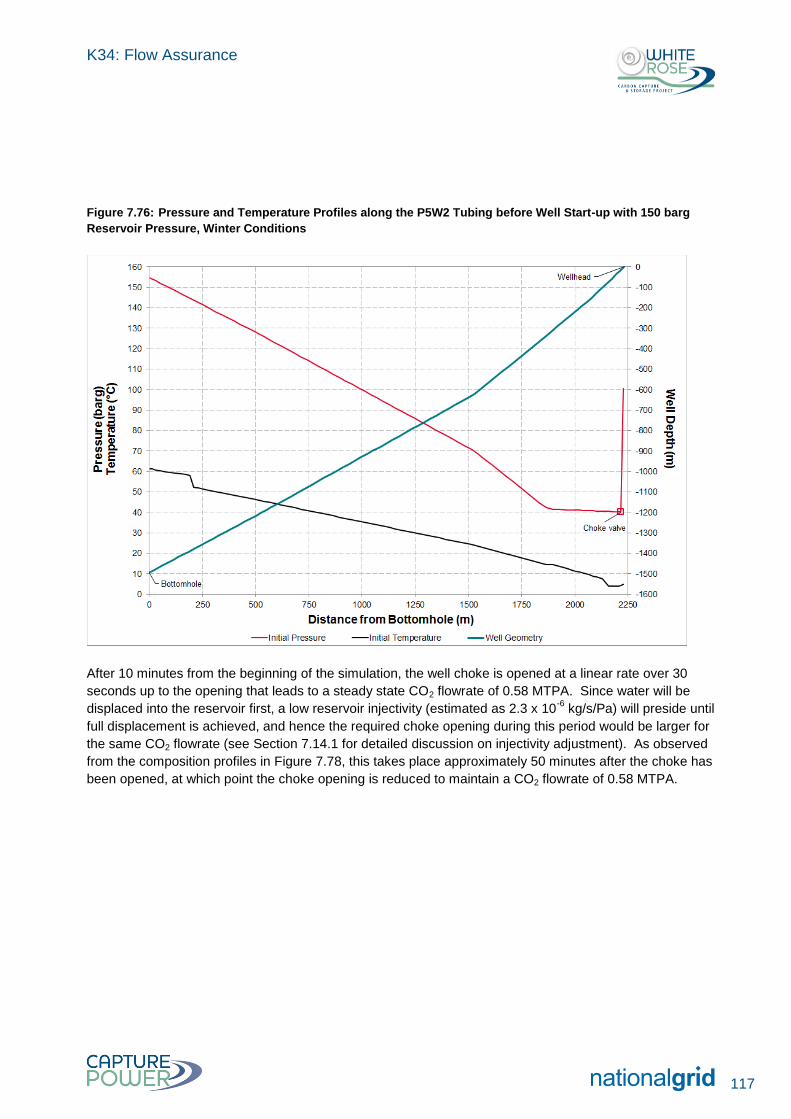
K34: Flow Assurance
117
Figure 7.76: Pressure and Temperature Profiles along the P5W2 Tubing before Well Start-up with 150 barg
Reservoir Pressure, Winter Conditions
After 10 minutes from the beginning of the simulation, the well choke is opened at a linear rate over 30
seconds up to the opening that leads to a steady state CO2 flowrate of 0.58 MTPA. Since water will be
displaced into the reservoir first, a low reservoir injectivity (estimated as 2.3 x 10⁻⁶
kg/s/Pa) will preside until
full displacement is achieved, and hence the required choke opening during this period would be larger for
the same CO2 flowrate (see Section 7.14.1 for detailed discussion on injectivity adjustment). As observed
from the composition profiles in Figure 7.78, this takes place approximately 50 minutes after the choke has
been opened, at which point the choke opening is reduced to maintain a CO2 flowrate of 0.58 MTPA.
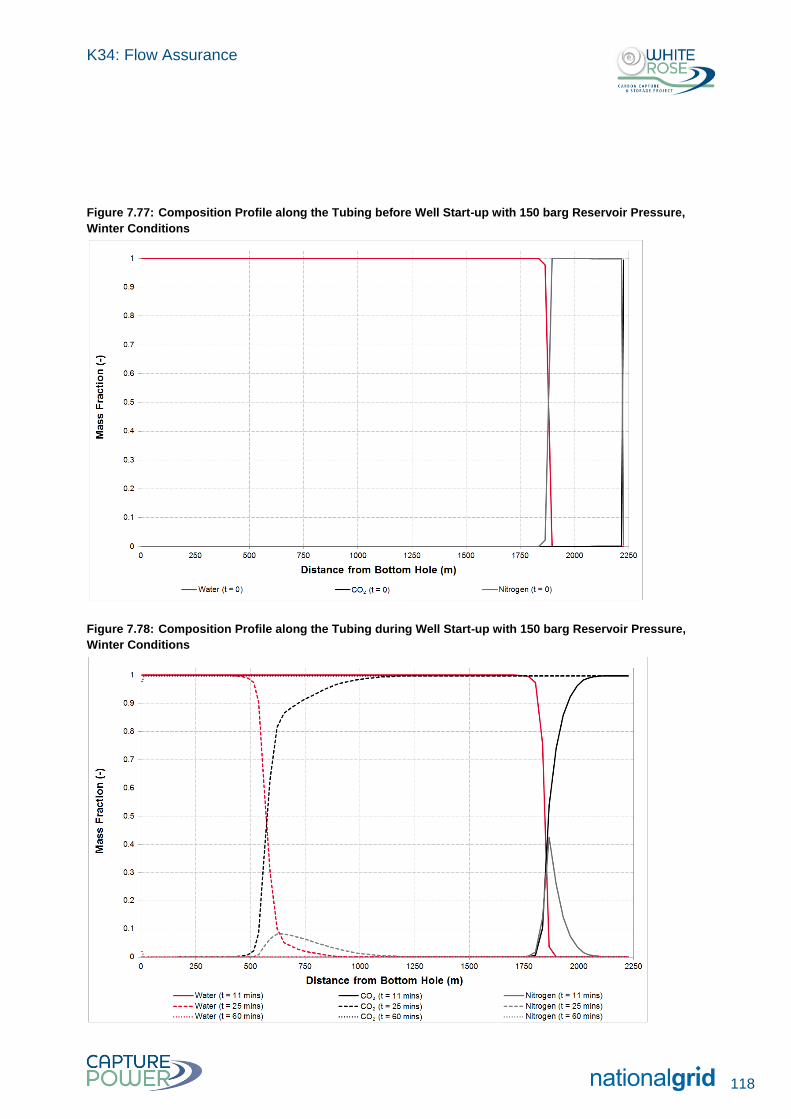
K34: Flow Assurance
118
Figure 7.77: Composition Profile along the Tubing before Well Start-up with 150 barg Reservoir Pressure,
Winter Conditions
Figure 7.78: Composition Profile along the Tubing during Well Start-up with 150 barg Reservoir Pressure,
Winter Conditions
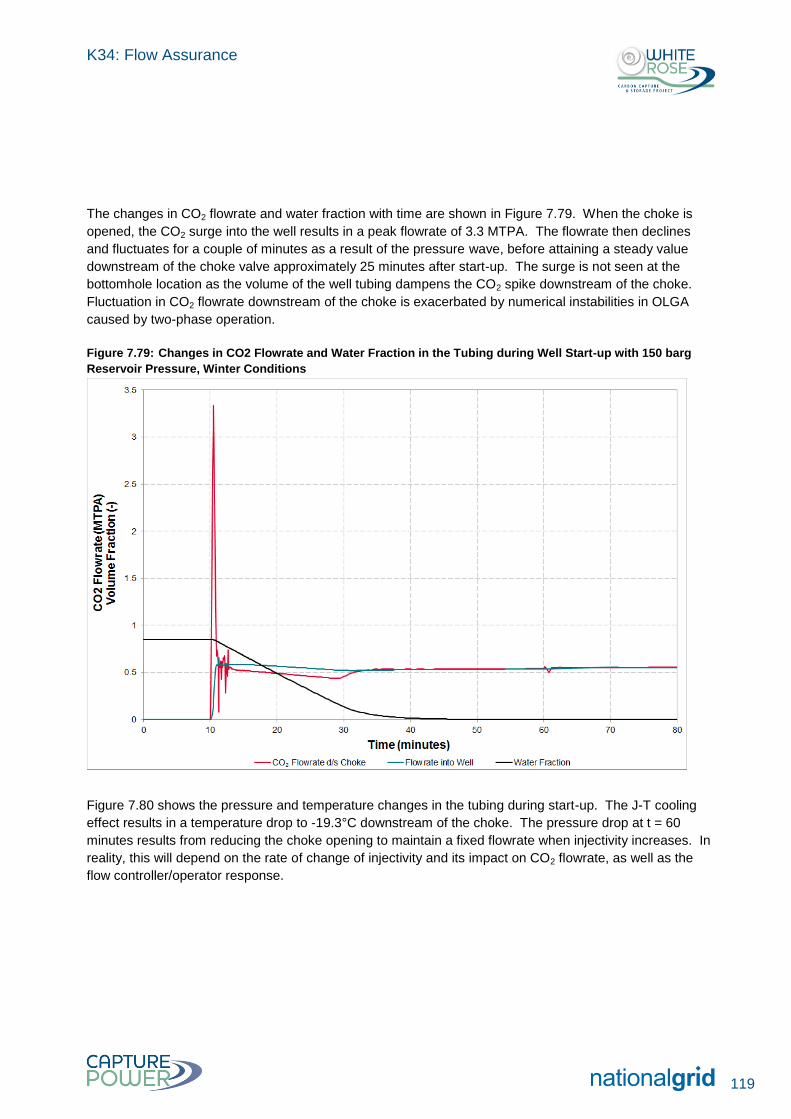
K34: Flow Assurance
119
The changes in CO2 flowrate and water fraction with time are shown in Figure 7.79. When the choke is
opened, the CO2 surge into the well results in a peak flowrate of 3.3 MTPA. The flowrate then declines
and fluctuates for a couple of minutes as a result of the pressure wave, before attaining a steady value
downstream of the choke valve approximately 25 minutes after start-up. The surge is not seen at the
bottomhole location as the volume of the well tubing dampens the CO2 spike downstream of the choke.
Fluctuation in CO2 flowrate downstream of the choke is exacerbated by numerical instabilities in OLGA
caused by two-phase operation.
Figure 7.79: Changes in CO2 Flowrate and Water Fraction in the Tubing during Well Start-up with 150 barg
Reservoir Pressure, Winter Conditions
Figure 7.80 shows the pressure and temperature changes in the tubing during start-up. The J-T cooling
effect results in a temperature drop to -19.3°C downstream of the choke. The pressure drop at t = 60
minutes results from reducing the choke opening to maintain a fixed flowrate when injectivity increases. In
reality, this will depend on the rate of change of injectivity and its impact on CO2 flowrate, as well as the
flow controller/operator response.
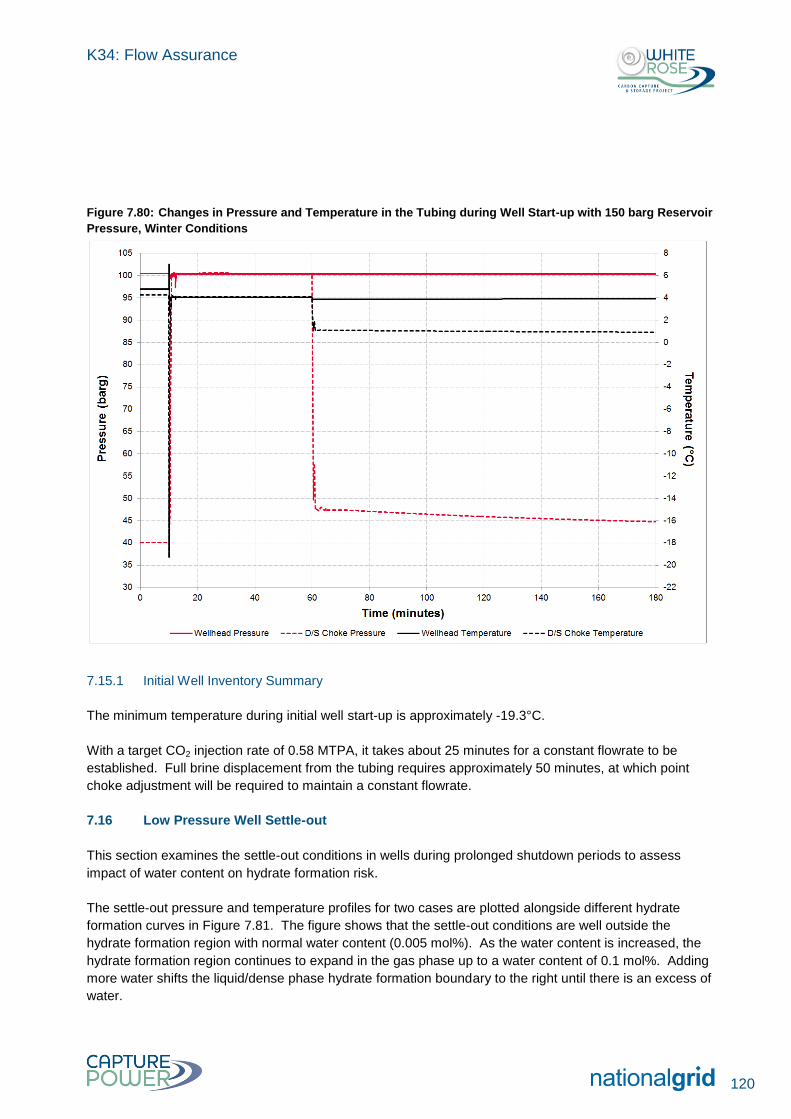
K34: Flow Assurance
120
Figure 7.80: Changes in Pressure and Temperature in the Tubing during Well Start-up with 150 barg Reservoir
Pressure, Winter Conditions
7.15.1 Initial Well Inventory Summary
The minimum temperature during initial well start-up is approximately -19.3°C.
With a target CO2 injection rate of 0.58 MTPA, it takes about 25 minutes for a constant flowrate to be
established. Full brine displacement from the tubing requires approximately 50 minutes, at which point
choke adjustment will be required to maintain a constant flowrate.
7.16 Low Pressure Well Settle-out
This section examines the settle-out conditions in wells during prolonged shutdown periods to assess
impact of water content on hydrate formation risk.
The settle-out pressure and temperature profiles for two cases are plotted alongside different hydrate
formation curves in Figure 7.81. The figure shows that the settle-out conditions are well outside the
hydrate formation region with normal water content (0.005 mol%). As the water content is increased, the
hydrate formation region continues to expand in the gas phase up to a water content of 0.1 mol%. Adding
more water shifts the liquid/dense phase hydrate formation boundary to the right until there is an excess of
water.
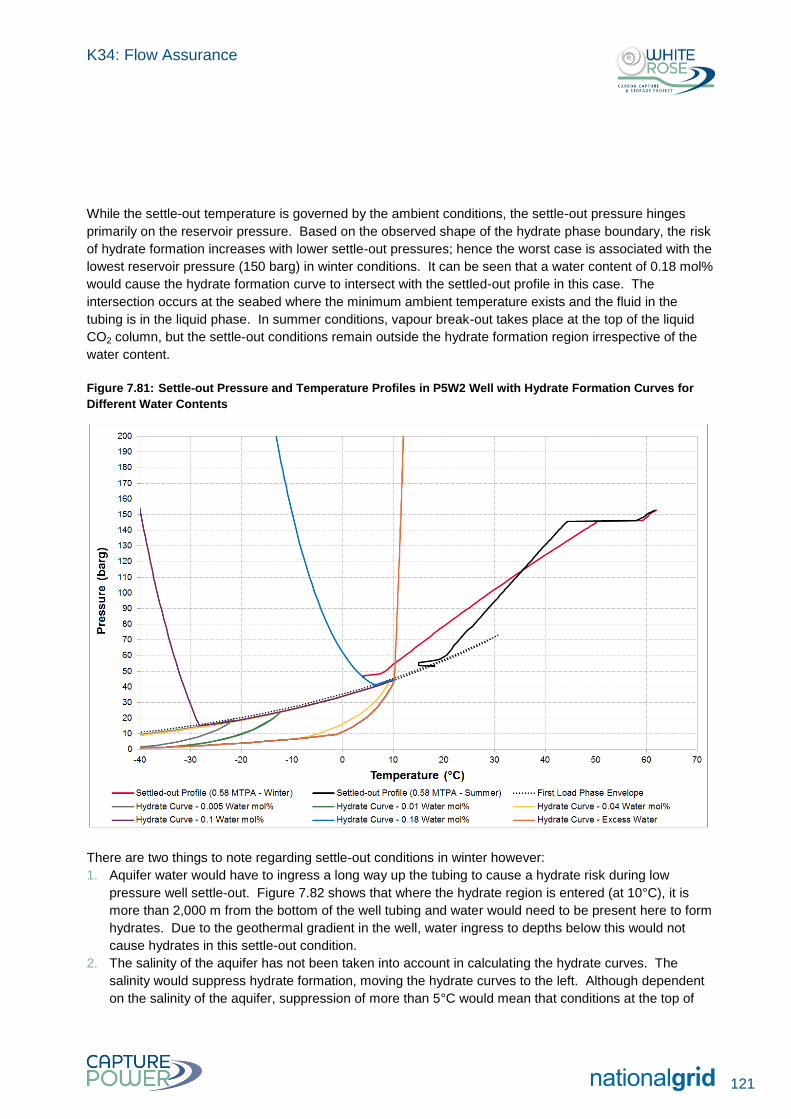
K34: Flow Assurance
121
While the settle-out temperature is governed by the ambient conditions, the settle-out pressure hinges
primarily on the reservoir pressure. Based on the observed shape of the hydrate phase boundary, the risk
of hydrate formation increases with lower settle-out pressures; hence the worst case is associated with the
lowest reservoir pressure (150 barg) in winter conditions. It can be seen that a water content of 0.18 mol%
would cause the hydrate formation curve to intersect with the settled-out profile in this case. The
intersection occurs at the seabed where the minimum ambient temperature exists and the fluid in the
tubing is in the liquid phase. In summer conditions, vapour break-out takes place at the top of the liquid
CO2 column, but the settle-out conditions remain outside the hydrate formation region irrespective of the
water content.
Figure 7.81: Settle-out Pressure and Temperature Profiles in P5W2 Well with Hydrate Formation Curves for
Different Water Contents
There are two things to note regarding settle-out conditions in winter however:
1. Aquifer water would have to ingress a long way up the tubing to cause a hydrate risk during low
pressure well settle-out. Figure 7.82 shows that where the hydrate region is entered (at 10°C), it is
more than 2,000 m from the bottom of the well tubing and water would need to be present here to form
hydrates. Due to the geothermal gradient in the well, water ingress to depths below this would not
cause hydrates in this settle-out condition.
2. The salinity of the aquifer has not been taken into account in calculating the hydrate curves. The
salinity would suppress hydrate formation, moving the hydrate curves to the left. Although dependent
on the salinity of the aquifer, suppression of more than 5°C would mean that conditions at the top of
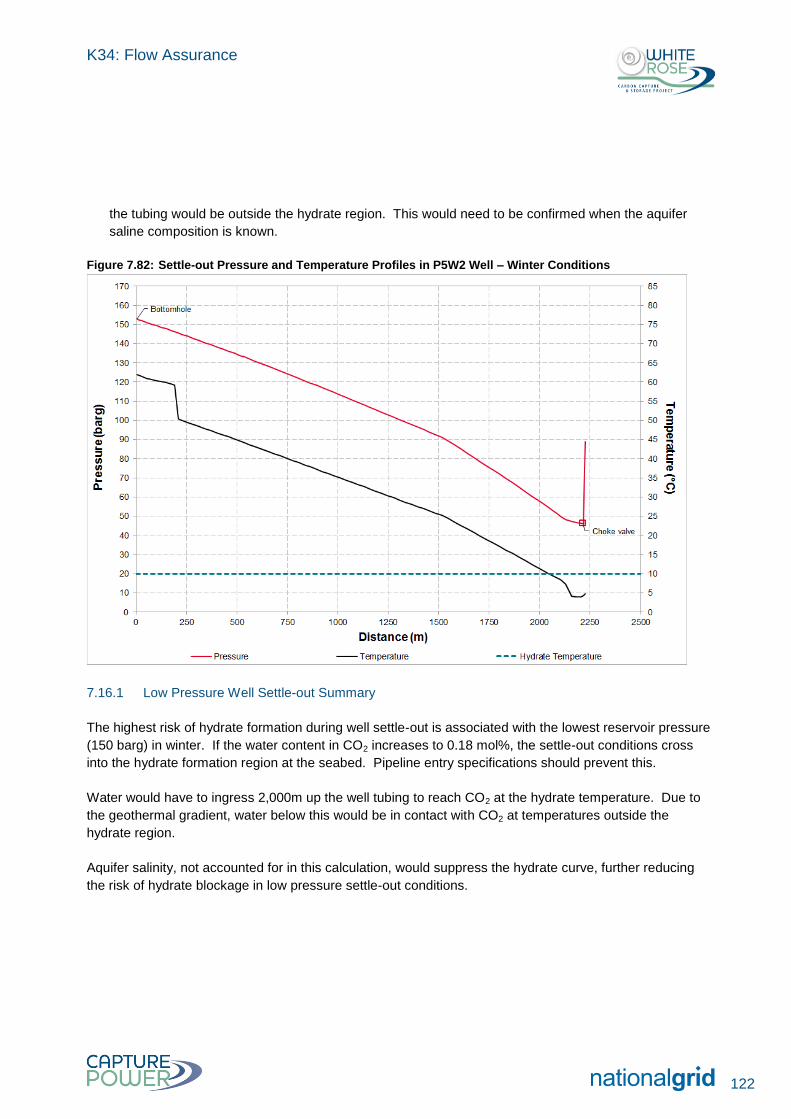
K34: Flow Assurance
122
the tubing would be outside the hydrate region. This would need to be confirmed when the aquifer
saline composition is known.
Figure 7.82: Settle-out Pressure and Temperature Profiles in P5W2 Well – Winter Conditions
7.16.1 Low Pressure Well Settle-out Summary
The highest risk of hydrate formation during well settle-out is associated with the lowest reservoir pressure
(150 barg) in winter. If the water content in CO2 increases to 0.18 mol%, the settle-out conditions cross
into the hydrate formation region at the seabed. Pipeline entry specifications should prevent this.
Water would have to ingress 2,000m up the well tubing to reach CO2 at the hydrate temperature. Due to
the geothermal gradient, water below this would be in contact with CO2 at temperatures outside the
hydrate region.
Aquifer salinity, not accounted for in this calculation, would suppress the hydrate curve, further reducing
the risk of hydrate blockage in low pressure settle-out conditions.
K34: Flow Assurance
123
8.1 General
Modelling two-phase impure CO2 presents a unique challenge due to the narrow phase envelopes and
large changes in fluid properties for small changes in operating conditions (compared with hydrocarbon
systems).
These challenges, however, can be overcome by combining simulation results with a theoretical
approach for two-phase operations.
8.2 Initial Start-up
CO2 arrives at the platform after approximately 4 days, with all the air displaced after ~5.25 days (at a
flowrate of 2.68 MTPA).
It takes approximately 4 weeks to displace air fully from the pipeline at a flowrate of 0.58 MTPA.
8.3 PIG Operations
The average PIG velocity at First Load (2.68 MTPA) is within the acceptable range in the Drax to
Camblesforth (300 mm nominal diameter) onshore pipeline section only; Camblesforth supply would
need to be online, supplying a total of ≥3.8 MTPA (Drax plus Camblesforth) to achieve an average PIG
velocity of 0.5 m/s in the 600 mm nominal diameter onshore and offshore pipelines.
PIG operations at the design flowrate of 17 MTPA results in a PIG velocity below the 3 m/s maximum
pig velocity limit, therefore CO2 supply from Drax and Camblesforth do not need to be turned down for
PIG operations, however PIG velocities might need to be controlled for in-line inspection depending on
the optimum speeds.
Confirmation of acceptable PIG velocity range (assumed to be 0.5 m/s to 3 m/s) with PIG vendors is
required.
The pipeline pressure does not transgress the minimum and maximum operating pressure constraints
during PIG operations.
8.4 Turndown
When bypassing the pumping station at Barmston in Years 1 to 5, pressure settles within 2 hours
following turndown from 2.68 MTPA.
The pressure settles within 2 hours in the onshore pipeline and within 15 hours in the offshore pipeline
following turndown from 10 MTPA.
At higher flowrates, when the Barmston pump is operating, the pressure control settings need to be
adjusted to the target conditions prior to turndown being carried out to ensure the pressure in the
pipeline does not fall below 90 barg and to ensure there is sufficient pressure differential across the
pump to prevent cavitation.
8 Conclusions from Transient Analysis
K34: Flow Assurance
124
The temperatures through the pipeline (particularly at low flowrates in winter conditions) can take
several days to reach steady state.
Settle-out time in the offshore pipeline is highly dependent on the pump characteristics and control
system settings.
8.5 Ramp-up
When bypassing the pumping station at Barmston in Years 1 to 5, pressure settles within 2 hours
following ramp-up to 2.68 MTPA.
The pressure and temperature settle within approximately 1 hour in the onshore and offshore pipelines
following ramp-up to 10 MTPA from turndown operation.
Settle-out time in the offshore pipeline is highly dependent on the pump characteristics and control
system settings.
The pump suction and platform arrival pressure setpoints should not be changed to the final desired
values until after ramp-up has been completed to avoid the risk of the pressure in the pipeline falling
below 90 barg.
Bringing a new well online before ramp-up results in a drop in pressure downstream of Barmston, but
this is not expected to cause any concerns with effective suction pressure control in place.
8.6 Cooldown
Cooldown durations are between 15 and 21 hours for the onshore sections during summer ambient
conditions, but fluid at the platform end of the offshore section reaches ambient within 1 hour.
Cooldown during winter ambient conditions takes ~40 days due to the higher initial difference in
operating and ambient temperatures.
During cooldown to winter ambient temperatures, with the impurities composition, the lower
temperatures results in operating pressures and temperatures entering the two-phase region.
Pressures as low as 65 barg are predicted for the high point between Camblesforth and Barmston.
8.7 Restart
Restart simulations from a warm start-up reached thermal steady state after approximately 10 hours,
with the pressure reaching steady state in a similar time.
Cold restart simulations (starting from a pipeline at minimum ambient temperature) took in excess of
5 days to reach thermal steady state due to the time required to heat the soil surrounding the onshore
(and part of the offshore) pipeline, but reached a steady pressure within approximately 10 hours.
K34: Flow Assurance
125
8.8 Depressurisation
A pipeline minimum design temperature of 0°C is not practical as depressurisation causes excessively
low fluid (and pipeline inner wall) temperatures as the gas expands (J-T cooling) and due to the pipe
wall supplying the heat of vaporisation to the fluid as it starts to vaporise/boil.
The lower the minimum design temperature of the pipeline the quicker that depressurisation can take
place as the reduction in pressure whilst maintaining the temperature above the minimum design is
greater.
Peak CO2 vent rates deplete as pipeline pressure reduces and should be considered for dispersion
analysis.
8.9 Leak Detection
The reduction in pressure due to a leak can be detected quicker at higher flowrates, but the resulting
mass of CO2 leaked to the atmosphere is not significantly different as the leak is based on 2.5% of the
total flowrate.
Leaks of 2.5% of the total flowrate could be detected within 0.5 to 3.5 hours.
8.10 Line Pack
Due to the short packing time (0 to 9 minutes), an automated response may be required to avoid
exceeding the MAOP in the onshore pipeline as a result of:
1. a valve shut-in at Camblesforth at any stage of operational life; or
2. a valve shut-in at any location while operating at 17 MTPA.
Pressure control at the platform (Years 1 to 5) and the pump suction (after Year 5) limit the impact of
flowrate changes on upstream sections. The pipeline downstream of Barmston will be susceptible to
notable pressure changes when the pump speed is adjusted based on the flowrate.
Taking a well offline without changing production rates could lead to exceeding the MAOP within hours.
The time available to avoid this outcome decreases from around 9 hours in Years 1 to 5 to less than an
hour after Year 10.
8.11 Daily Swing
Daily ambient temperature swing is unlikely to have a significant impact on the stability of the system
during operation.
8.12 Maximum Pipeline Inventory
The maximum pipeline inventory under steady state conditions is about 39.1 kT.
K34: Flow Assurance
126
8.13 Pipeline Unpacking
When the supply of CO2 from Drax and Camblesforth is shut-off, the pressure at the peak elevation
falls below 90 barg almost immediately if CO2 injection into the wells is not stopped. A marginally
longer unpacking time (2 to 6 minutes) is expected when the initial flowrate is 17 MTPA.
8.14 Pressure Surge Due to ESD Valve Closure
The maximum pipeline pressure is below the maximum incidental pressure in the onshore and offshore
pipelines; therefore pressure surge following sudden ESD valve closure (hammer) does not cause a
pipeline integrity issue.
The lack of appreciable pressure surge is due to the compressibility of the dense phase CO2, which is
significantly higher than a liquid (e.g. liquid water), and the ESD valve closure time.
8.15 Water Wash
Prewash MEG flush with a flowrate of 7,071 kg/h results in the pressure upstream of the wellhead
remaining below the MAOP of 182 barg.
With a reservoir pressure of 150 barg, performing water wash in winter could result in wellhead
pressures of around 146 barg, increasing up to 177 barg if water temperature does not rise as
modelled while flowing down the tubing. The MAOP at the wellhead could be exceeded if the
operation is not changed when the reservoir pressure increases later in field life. Injecting the same
total volume of wash water over 9 days instead of 7 should prevent this from happening under the most
conservative scenario considered.
The operating pressure at the wellhead during postwash MEG flush is not expected to exceed the
MAOP in any case. The highest pressure would occur if MEG flush is started immediately after water
wash, reaching 179 barg in the worst case.
Start-up following the water wash operation is not predicted to result in hydrate formation due to the
MEG flushing prior to start-up, despite temperatures down to -19°C being predicted. Low temperatures
can also be further mitigated by making use of the facility to inject nitrogen into the well prior to start-up
to reduce J-T cooling.
8.16 Initial Well Inventory
The minimum temperature during initial well start-up is approximately -19.3°C.
With a target CO2 injection rate of 0.58 MTPA, it takes about 25 minutes for a constant flowrate to be
established. Full brine displacement from the tubing requires approximately 50 minutes, at which point
choke adjustment will be required to maintain a constant flowrate.
8.17 Low Pressure Well Settle-out
The highest risk of hydrate formation during well settle-out is associated with the lowest reservoir
pressure (150 barg) in winter due to the potential for water ingress from the aquifer. If the water

K34: Flow Assurance
127
content in CO2 increases to 0.18 mol%, the settle-out conditions cross into the hydrate formation region
at the seabed.
Water ingress would have to be substantial (approximately 2,000 m up the tubing) to be in contact with
CO2 at a pressure and temperature within the hydrate region, therefore risk of hydrates in this scenario
is low.
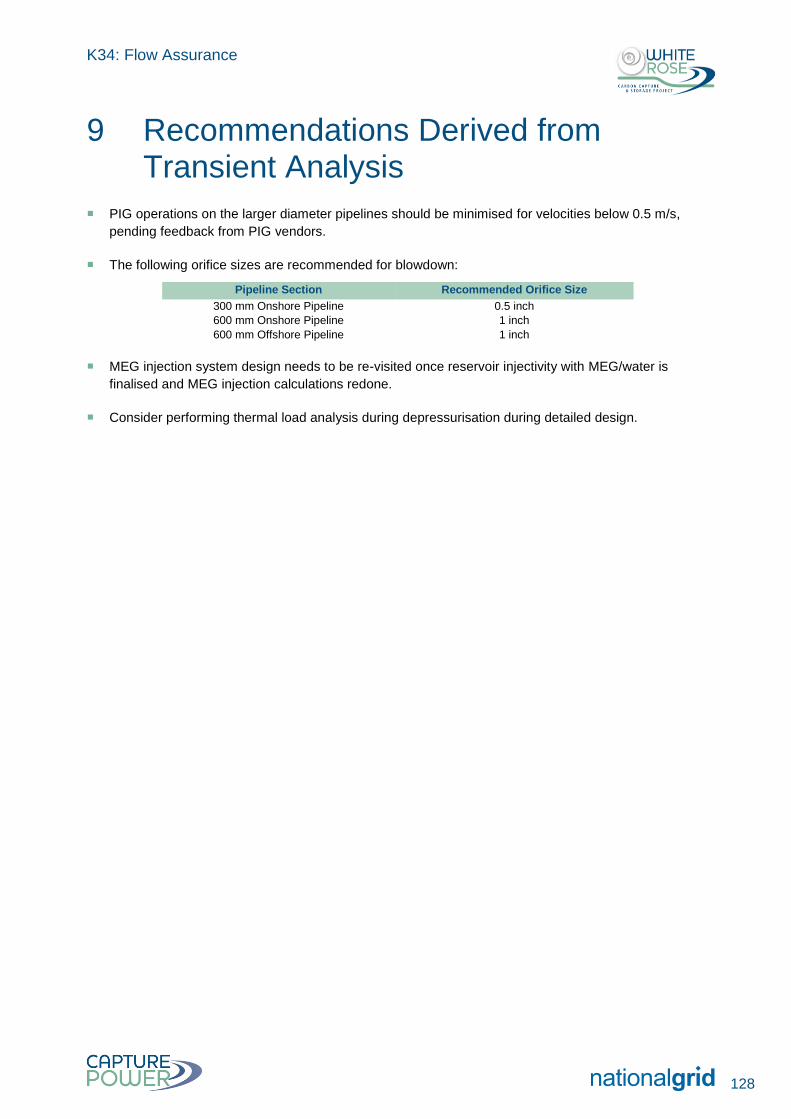
K34: Flow Assurance
128
PIG operations on the larger diameter pipelines should be minimised for velocities below 0.5 m/s,
pending feedback from PIG vendors.
The following orifice sizes are recommended for blowdown:
Pipeline Section Recommended Orifice Size
300 mm Onshore Pipeline 0.5 inch
600 mm Onshore Pipeline 1 inch
600 mm Offshore Pipeline 1 inch
MEG injection system design needs to be re-visited once reservoir injectivity with MEG/water is
finalised and MEG injection calculations redone.
Consider performing thermal load analysis during depressurisation during detailed design.
9 Recommendations Derived from Transient Analysis
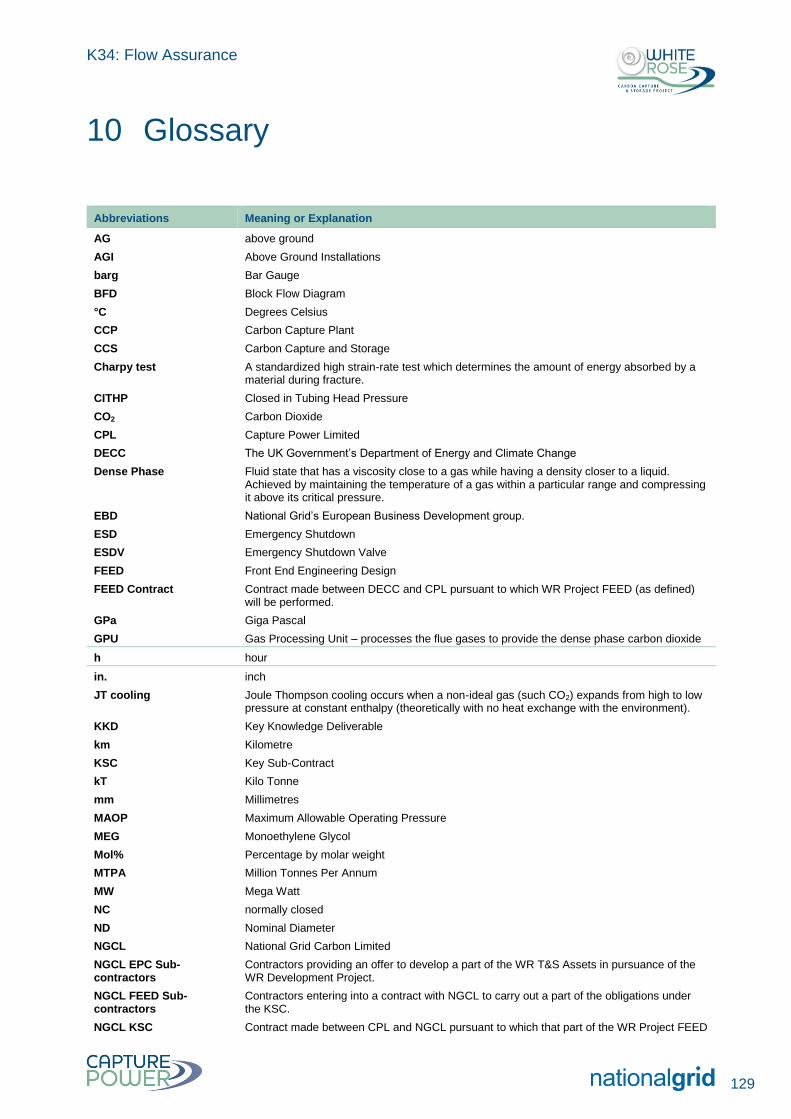
K34: Flow Assurance
129
Abbreviations Meaning or Explanation
AG above ground
AGI Above Ground Installations
barg Bar Gauge
BFD Block Flow Diagram
°C Degrees Celsius
CCP Carbon Capture Plant
CCS Carbon Capture and Storage
Charpy test A standardized high strain-rate test which determines the amount of energy absorbed by a material during fracture.
CITHP Closed in Tubing Head Pressure
CO2 Carbon Dioxide
CPL Capture Power Limited
DECC The UK Government’s Department of Energy and Climate Change
Dense Phase Fluid state that has a viscosity close to a gas while having a density closer to a liquid. Achieved by maintaining the temperature of a gas within a particular range and compressing it above its critical pressure.
EBD National Grid’s European Business Development group.
ESD Emergency Shutdown
ESDV Emergency Shutdown Valve
FEED Front End Engineering Design
FEED Contract Contract made between DECC and CPL pursuant to which WR Project FEED (as defined) will be performed.
GPa Giga Pascal
GPU Gas Processing Unit – processes the flue gases to provide the dense phase carbon dioxide
h hour
in. inch
JT cooling Joule Thompson cooling occurs when a non-ideal gas (such CO2) expands from high to low pressure at constant enthalpy (theoretically with no heat exchange with the environment).
KKD Key Knowledge Deliverable
km Kilometre
KSC Key Sub-Contract
kT Kilo Tonne
mm Millimetres
MAOP Maximum Allowable Operating Pressure
MEG Monoethylene Glycol
Mol% Percentage by molar weight
MTPA Million Tonnes Per Annum
MW Mega Watt
NC normally closed
ND Nominal Diameter
NGCL National Grid Carbon Limited
NGCL EPC Sub-contractors
Contractors providing an offer to develop a part of the WR T&S Assets in pursuance of the WR Development Project.
NGCL FEED Sub-contractors
Contractors entering into a contract with NGCL to carry out a part of the obligations under the KSC.
NGCL KSC Contract made between CPL and NGCL pursuant to which that part of the WR Project FEED
10 Glossary

K34: Flow Assurance
130
Abbreviations Meaning or Explanation
(as defined) which appertains to the WR T&S assets will be performed.
NGCL KSC Deliverables A number of documents and services, the delivery of which is a contractual obligation under the KSC.
NGCL Technical Assurance Team
EBD team responsible for providing independent technical auditing and peer review services to the WR T&S FEED Project.
NGCL WR Team The NGCL team established to meet the obligations in the KSC.
NNF normally no flow
NUI Normally Unmanned Installation. A term usually applied to an offshore installation.
OPP Oxy Power Plant
PFD Process Flow Diagram
PIG Pipeline Inspection Gauge: a unit, which is inserted into the pipeline, to clean and/or monitor the inner bore surface of the pipe.
t tonne
T&S Transportation and Storage
UG underground
UK United Kingdom
VSD Variable Speed Drive
WR White Rose
WR Assets All those assets that would be developed pursuant to the WR Project
WR Development Project A project to develop, operate and decommission the WR Assets which may transpire following the completion of the WR FEED Project.
WR FEED Project Project to carry out a FEED (as defined in the FEED Contract) with regard to the WR Assets.
WR Project White Rose CCS Project
WR T&S Assets That part of the WR Assets which would carry out the carbon dioxide transportation and storage functions of the WR Project and to which the KSC Contract relates.
WR T&S FEED Project The project to be pursued by NGCL in order to meet its obligations under the NGCL KSC.
wt% Percentage by weight