Embed Size (px)
Citation preview
6/28/2011
1
Council of State Governments Justice Center | 1
Justice Reinvestment in HawaiiInitial Work Group Meeting
June 28, 2011
Council of State Governments Justice CenterMarshall Clement, Project Director
Anne Bettesworth, Policy Analyst
Andy Barbee, Senior Research Associate
Jessy Tyler, Senior Research Associate
Robert Coombs, Senior Policy Analyst
CSG Justice Center
Council of State Governments Justice Center | 2
National non-profit, non-partisan membership association of state government officials
Represents all three branches of state government
Justice Center provides practical, nonpartisan advice informed by the best available evidence
Criminal Justice / Mental Health
Consensus Project
Reentry Policy Council
JusticeReinvestment
6/28/2011
2
Overview
1. Justice Reinvestment Process & Data To Be Analyzed
2. Case Studies
3. Initial Hawaii Analysis
4. Proposed Timeline & Next Steps
Council of State Governments Justice Center | 3
Funders and Partners
Council of State Governments Justice Center | 4
6/28/2011
3
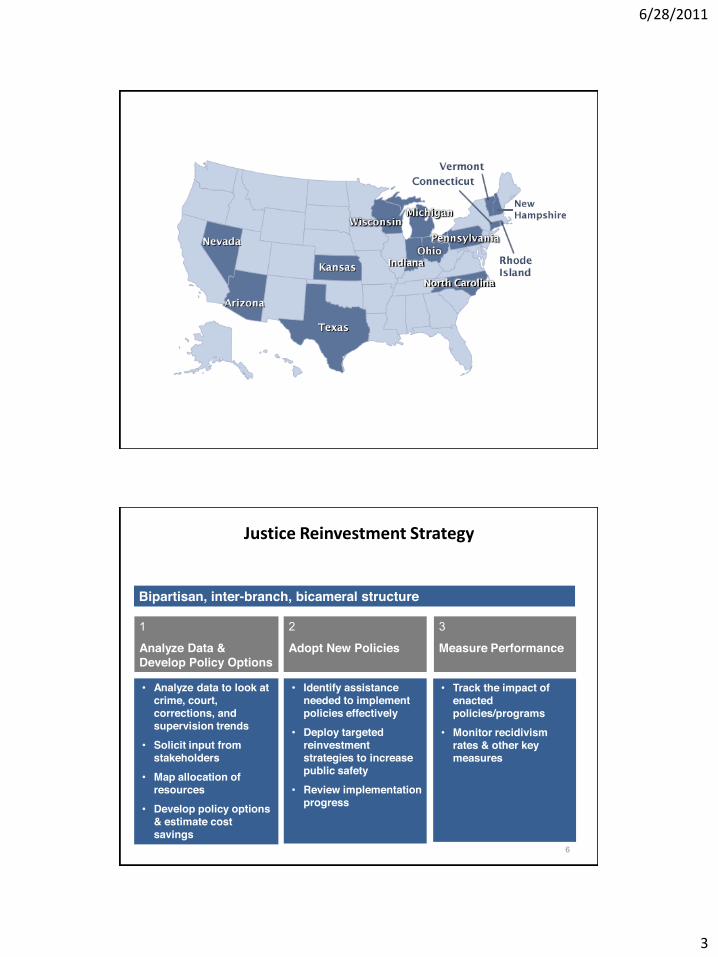
Justice Reinvestment Strategy
6
1
Analyze Data & Develop Policy Options
2
Adopt New Policies
3
Measure Performance
Bipartisan, inter-branch, bicameral structure
Identify assistance needed to implement policies effectivelyDeploy targeted reinvestment strategies to increase public safetyReview implementation progress
Analyze data to look at crime, court, corrections, and supervision trendsSolicit input from stakeholdersMap allocation of resourcesDevelop policy options & estimate cost savings
Track the impact of enacted policies/programsMonitor recidivism rates & other key measures
6/28/2011
4
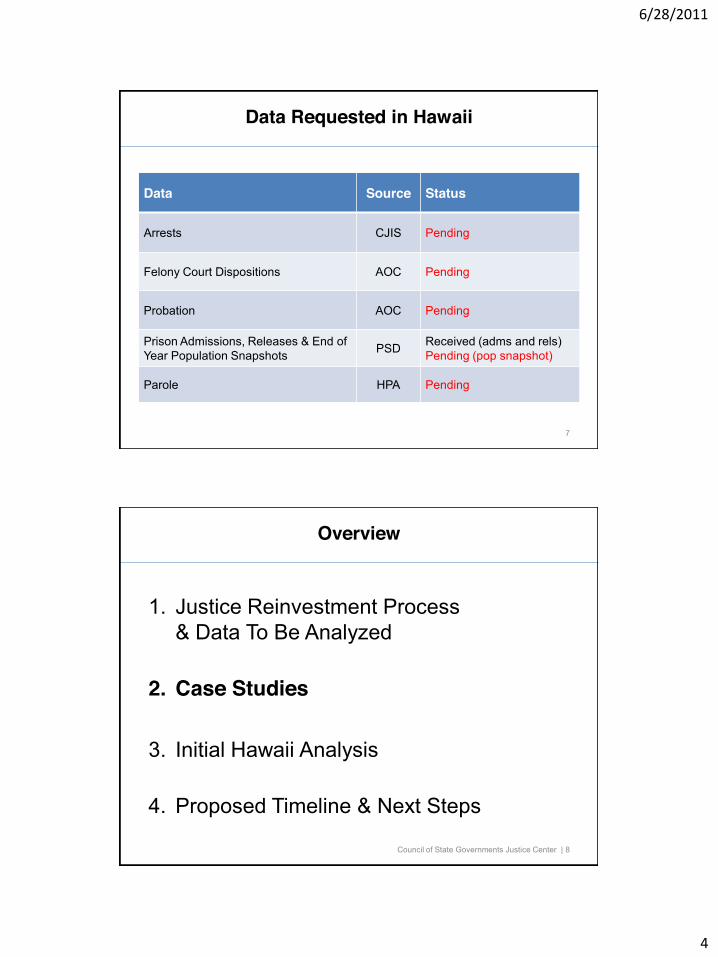
Data Requested in Hawaii
Data Source Status
Arrests CJIS Pending
Felony Court Dispositions AOC Pending
Probation AOC Pending
Prison Admissions, Releases & End of Year Population Snapshots PSD Received (adms and rels)
Pending (pop snapshot)
Parole HPA Pending
7
Overview
1. Justice Reinvestment Process & Data To Be Analyzed
2. Case Studies
3. Initial Hawaii Analysis
4. Proposed Timeline & Next Steps
Council of State Governments Justice Center | 8
6/28/2011
5
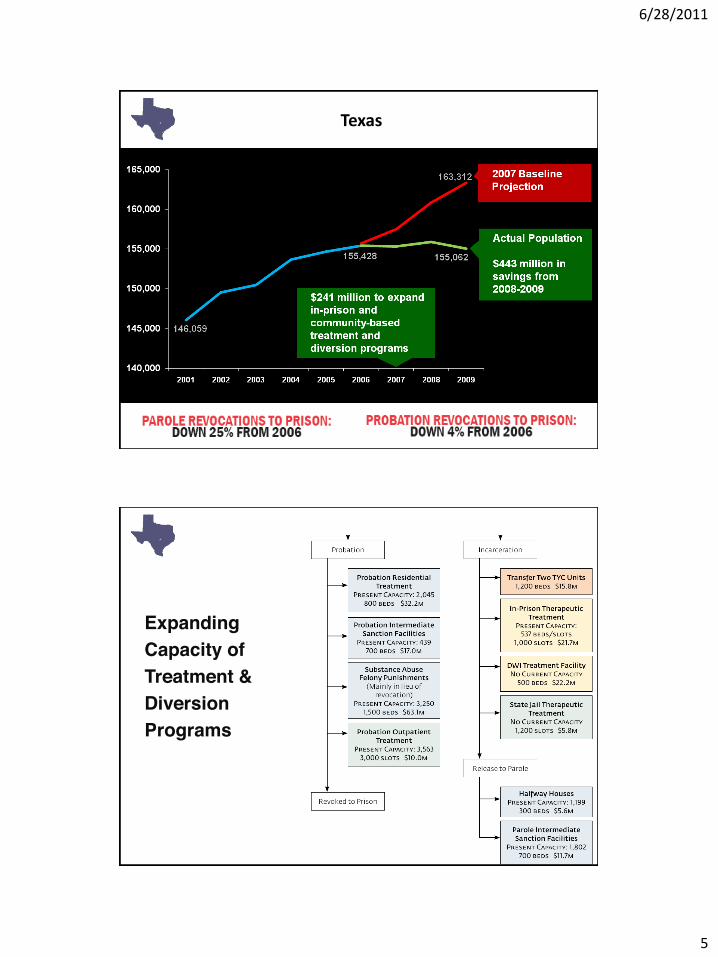
Texas
Expanding Capacity of Treatment & Diversion Programs
6/28/2011
6
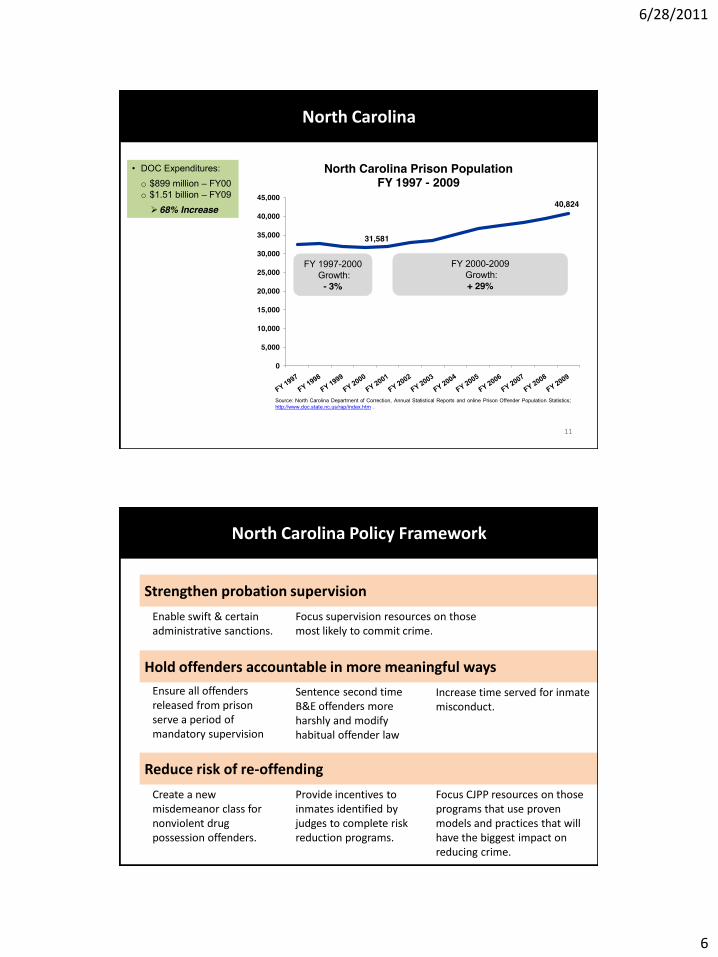
31,581
40,824
0
5,000
10,000
15,000
20,000
25,000
30,000
35,000
40,000
45,000
North Carolina Prison Population FY 1997 - 2009
11
DOC Expenditures:o $899 million FY00o $1.51 billion FY09
68% Increase
FY 2000-2009Growth:+ 29%
FY 1997-2000Growth:
- 3%
Source: North Carolina Department of Correction, Annual Statistical Reports and online Prison Offender Population Statistics;http://www.doc.state.nc.us/rap/index.htm .
North Carolina
North Carolina Policy Framework
Strengthen probation supervision
Hold offenders accountable in more meaningful ways
Reduce risk of re-‐offending
Enable swift & certain administrative sanctions.
Focus supervision resources on those most likely to commit crime.
Ensure all offenders released from prison serve a period of mandatory supervision
Sentence second time B&E offenders more harshly and modify habitual offender law
Increase time served for inmate misconduct.
Create a new misdemeanor class for nonviolent drug possession offenders.
Provide incentives to inmates identified by judges to complete risk reduction programs.
Focus CJPP resources on those programs that use proven models and practices that will have the biggest impact on reducing crime.
6/28/2011
7
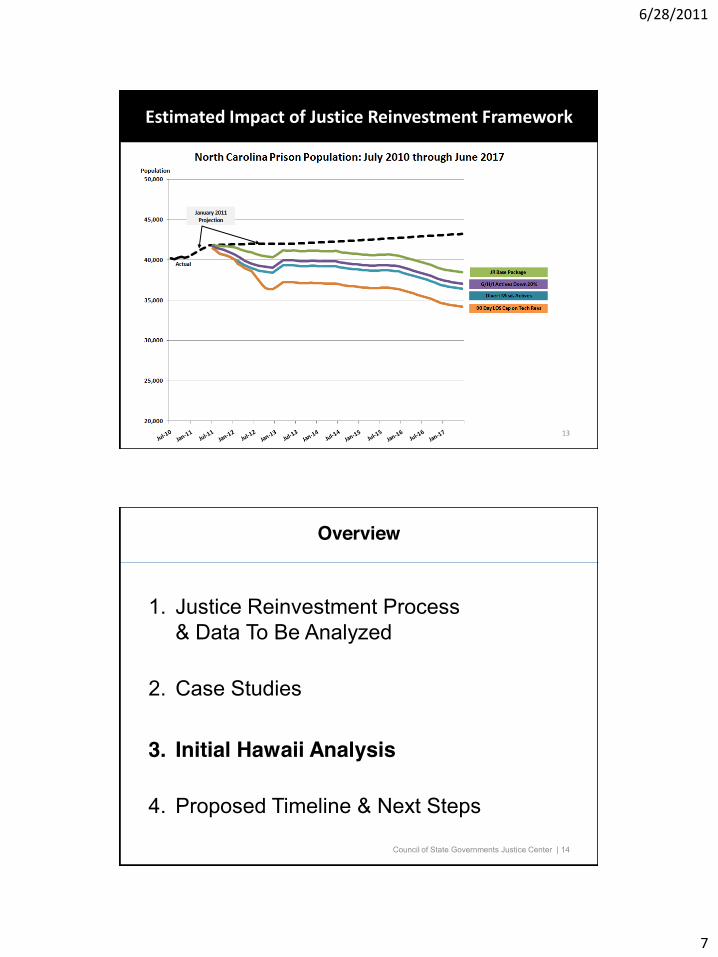
Estimated Impact of Justice Reinvestment Framework
13
Overview
1. Justice Reinvestment Process & Data To Be Analyzed
2. Case Studies
3. Initial Hawaii Analysis
4. Proposed Timeline & Next Steps
Council of State Governments Justice Center | 14
6/28/2011
8
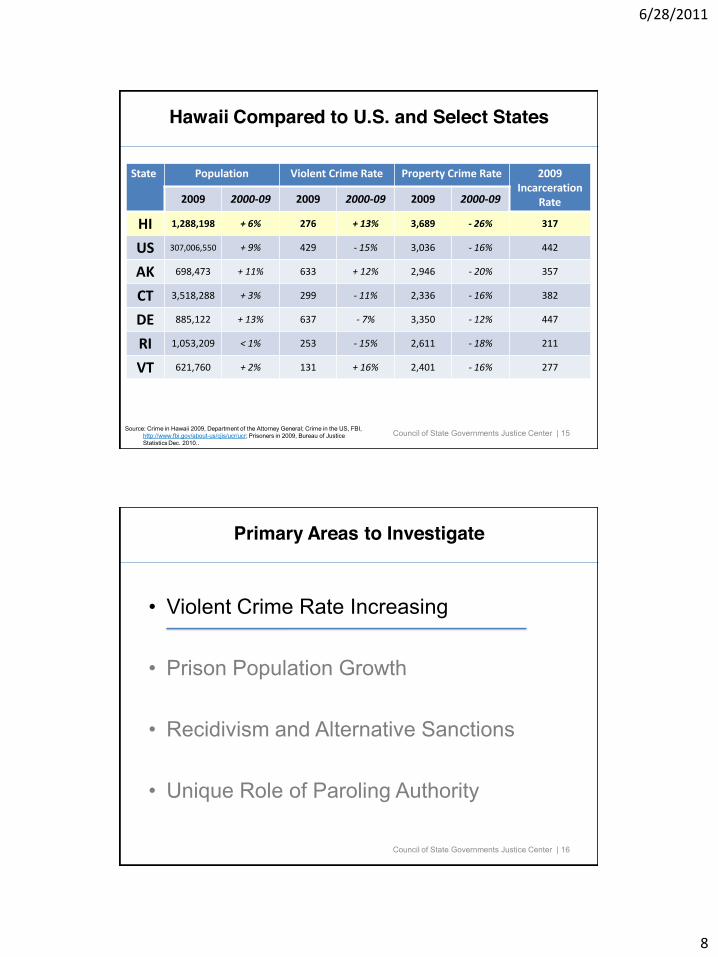
Hawaii Compared to U.S. and Select States
Council of State Governments Justice Center | 15Source: Crime in Hawaii 2009, Department of the Attorney General; Crime in the US, FBI, http://www.fbi.gov/about-us/cjis/ucr/ucr; Prisoners in 2009, Bureau of Justice Statistics Dec. 2010..
State Population Violent Crime Rate Property Crime Rate 2009 Incarceration
Rate2009 2000-‐09 2009 2000-‐09 2009 2000-‐09
HI 1,288,198 + 6% 276 + 13% 3,689 -‐ 26% 317
US 307,006,550 + 9% 429 -‐ 15% 3,036 -‐ 16% 442
AK 698,473 + 11% 633 + 12% 2,946 -‐ 20% 357
CT 3,518,288 + 3% 299 -‐ 11% 2,336 -‐ 16% 382
DE 885,122 + 13% 637 -‐ 7% 3,350 -‐ 12% 447
RI 1,053,209 < 1% 253 -‐ 15% 2,611 -‐ 18% 211
VT 621,760 + 2% 131 + 16% 2,401 -‐ 16% 277
Primary Areas to Investigate
Violent Crime Rate Increasing
Prison Population Growth
Recidivism and Alternative Sanctions
Unique Role of Paroling Authority
Council of State Governments Justice Center | 16
6/28/2011
9
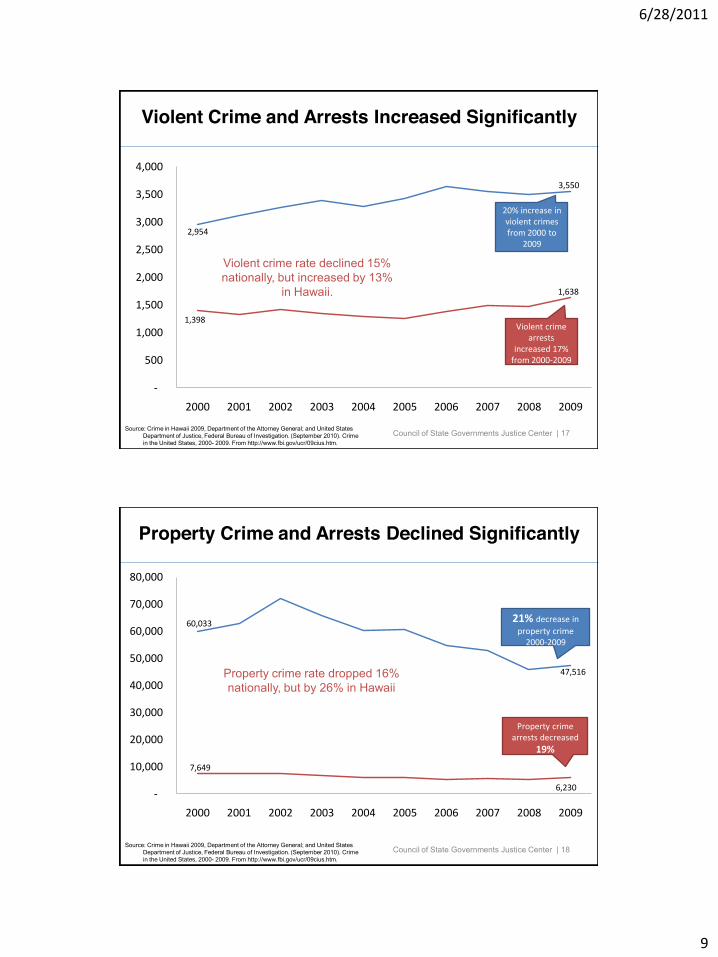
Violent Crime and Arrests Increased Significantly
Council of State Governments Justice Center | 17Source: Crime in Hawaii 2009, Department of the Attorney General; and United States Department of Justice, Federal Bureau of Investigation. (September 2010). Crime in the United States, 2000- 2009. From http://www.fbi.gov/ucr/09cius.htm.
-‐
500
1,000
1,500
2,000
2,500
3,000
3,500
4,000
2000 2001 2002 2003 2004 2005 2006 2007 2008 2009
20% increase in violent crimes from 2000 to
2009
Violent crime arrests
increased 17% from 2000-‐2009
Violent crime rate declined 15% nationally, but increased by 13%
in Hawaii.
2,954
3,550
1,398
1,638
Property Crime and Arrests Declined Significantly
Council of State Governments Justice Center | 18Source: Crime in Hawaii 2009, Department of the Attorney General; and United States Department of Justice, Federal Bureau of Investigation. (September 2010). Crime in the United States, 2000- 2009. From http://www.fbi.gov/ucr/09cius.htm.
-‐
10,000
20,000
30,000
40,000
50,000
60,000
70,000
80,000
2000 2001 2002 2003 2004 2005 2006 2007 2008 2009
21% decrease in property crime 2000-‐2009
Property crime arrests decreased
19%
Property crime rate dropped 16% nationally, but by 26% in Hawaii
60,033
47,516
7,649
6,230
6/28/2011
10
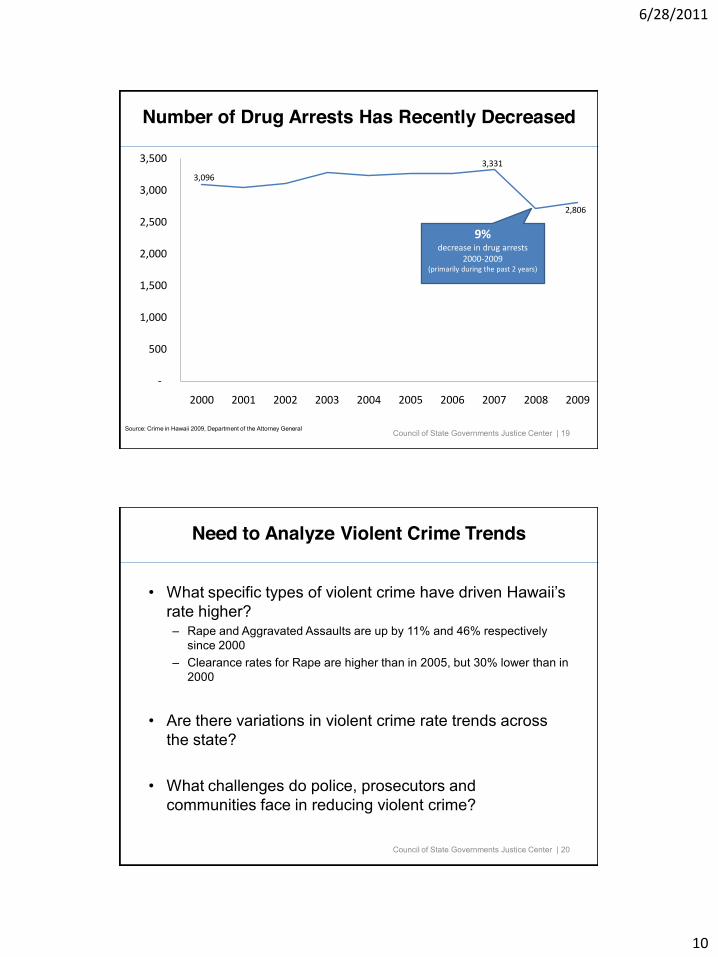
Number of Drug Arrests Has Recently Decreased
Council of State Governments Justice Center | 19Source: Crime in Hawaii 2009, Department of the Attorney General
-‐
500
1,000
1,500
2,000
2,500
3,000
3,500
2000 2001 2002 2003 2004 2005 2006 2007 2008 2009
9% decrease in drug arrests
2000-‐2009(primarily during the past 2 years)
3,096
2,806
3,331
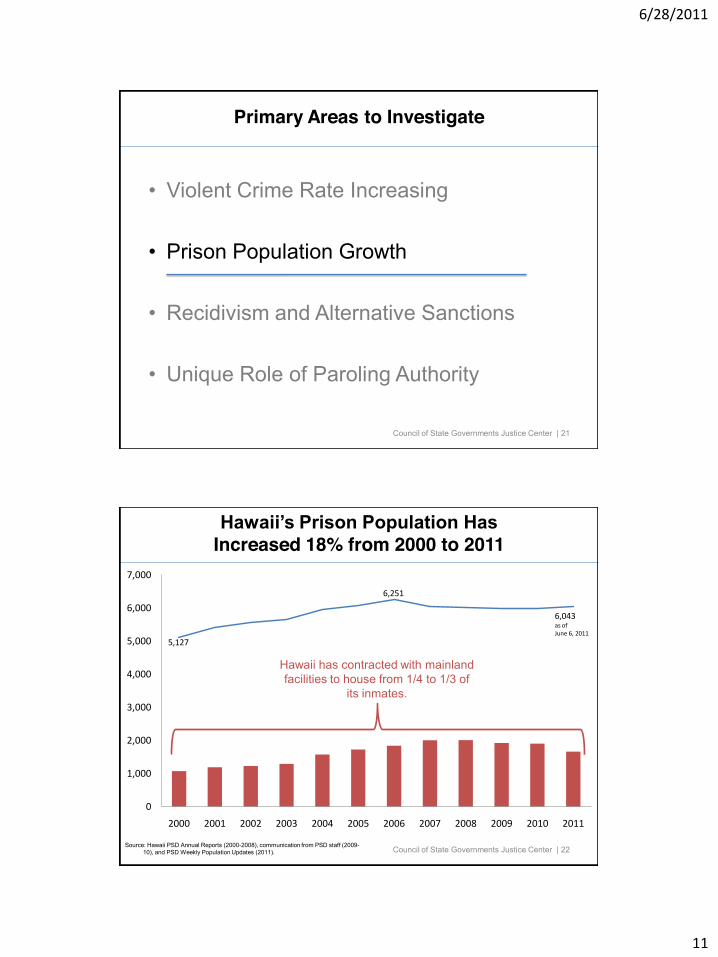
Need to Analyze Violent Crime Trends
rate higher?Rape and Aggravated Assaults are up by 11% and 46% respectively since 2000Clearance rates for Rape are higher than in 2005, but 30% lower than in 2000
Are there variations in violent crime rate trends across the state?
What challenges do police, prosecutors and communities face in reducing violent crime?
Council of State Governments Justice Center | 20
6/28/2011
11
Primary Areas to Investigate
Violent Crime Rate Increasing
Prison Population Growth
Recidivism and Alternative Sanctions
Unique Role of Paroling Authority
Council of State Governments Justice Center | 21
0
1,000
2,000
3,000
4,000
5,000
6,000
7,000
2000 2001 2002 2003 2004 2005 2006 2007 2008 2009 2010 2011
Increased 18% from 2000 to 2011
Council of State Governments Justice Center | 22Source: Hawaii PSD Annual Reports (2000-2008), communication from PSD staff (2009-10), and PSD Weekly Population Updates (2011).
5,127
6,043as ofJune 6, 2011
6,251
Hawaii has contracted with mainland facilities to house from 1/4 to 1/3 of
its inmates.
6/28/2011
12
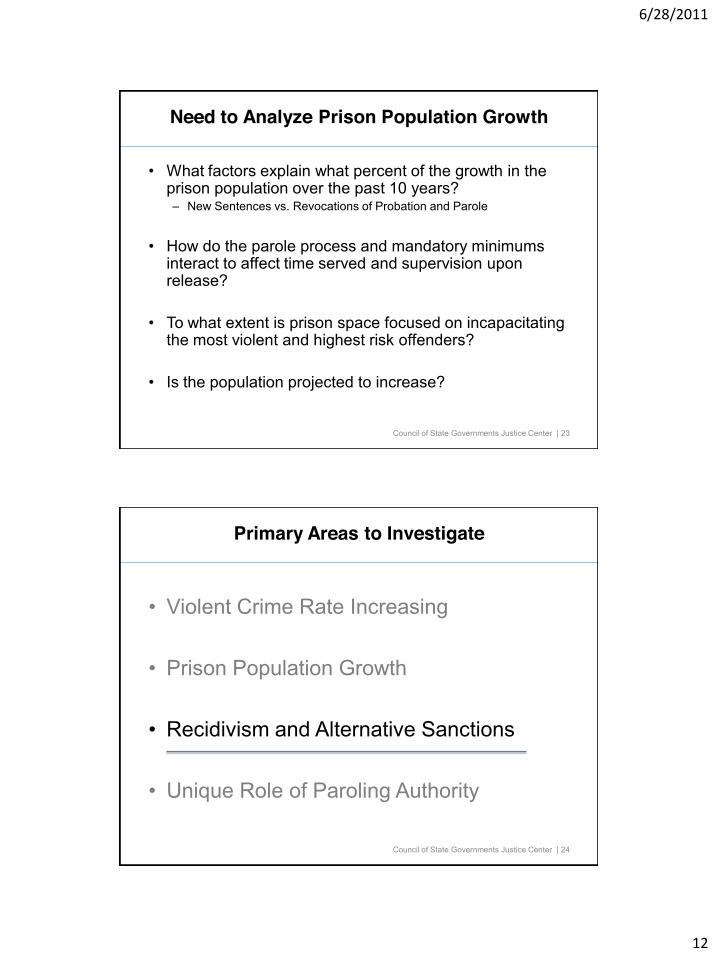
Need to Analyze Prison Population Growth
What factors explain what percent of the growth in the prison population over the past 10 years?
New Sentences vs. Revocations of Probation and Parole
How do the parole process and mandatory minimums interact to affect time served and supervision upon release?
To what extent is prison space focused on incapacitating the most violent and highest risk offenders?
Is the population projected to increase?
Council of State Governments Justice Center | 23
Primary Areas to Investigate
Violent Crime Rate Increasing
Prison Population Growth
Recidivism and Alternative Sanctions
Unique Role of Paroling Authority
Council of State Governments Justice Center | 24
6/28/2011
13
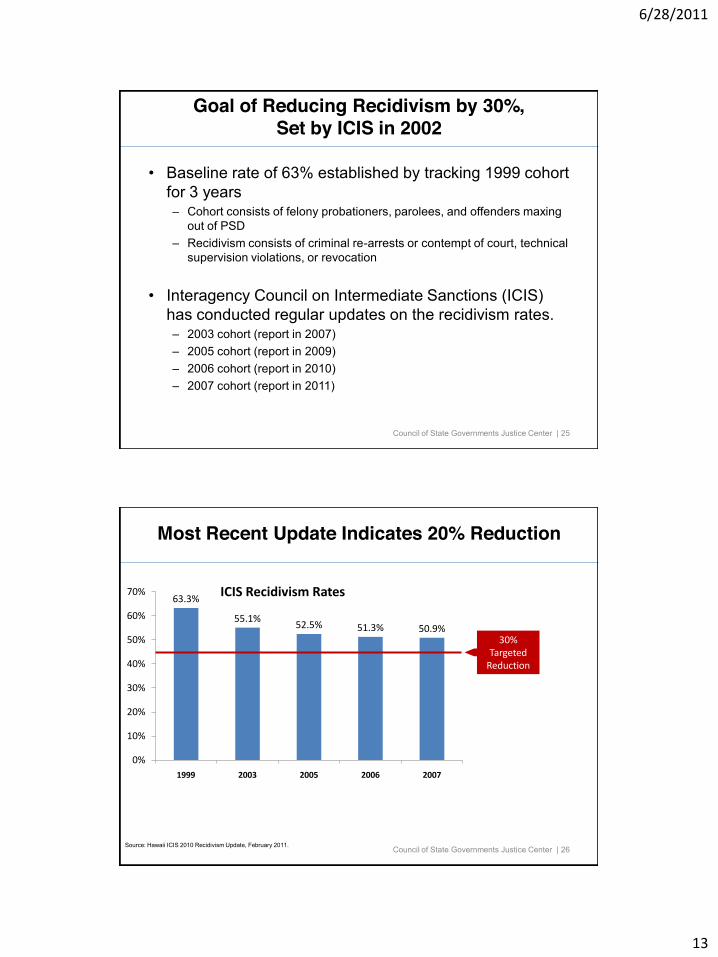
Goal of Reducing Recidivism by 30%, Set by ICIS in 2002
Baseline rate of 63% established by tracking 1999 cohort for 3 years
Cohort consists of felony probationers, parolees, and offenders maxing out of PSDRecidivism consists of criminal re-arrests or contempt of court, technical supervision violations, or revocation
Interagency Council on Intermediate Sanctions (ICIS) has conducted regular updates on the recidivism rates.
2003 cohort (report in 2007)2005 cohort (report in 2009)2006 cohort (report in 2010)2007 cohort (report in 2011)
Council of State Governments Justice Center | 25
Most Recent Update Indicates 20% Reduction
Council of State Governments Justice Center | 26
63.3%
55.1% 52.5% 51.3% 50.9%
0%
10%
20%
30%
40%
50%
60%
70%
1999 2003 2005 2006 2007
ICIS Recidivism Rates
30% TargetedReduction
Source: Hawaii ICIS 2010 Recidivism Update, February 2011.
6/28/2011
14
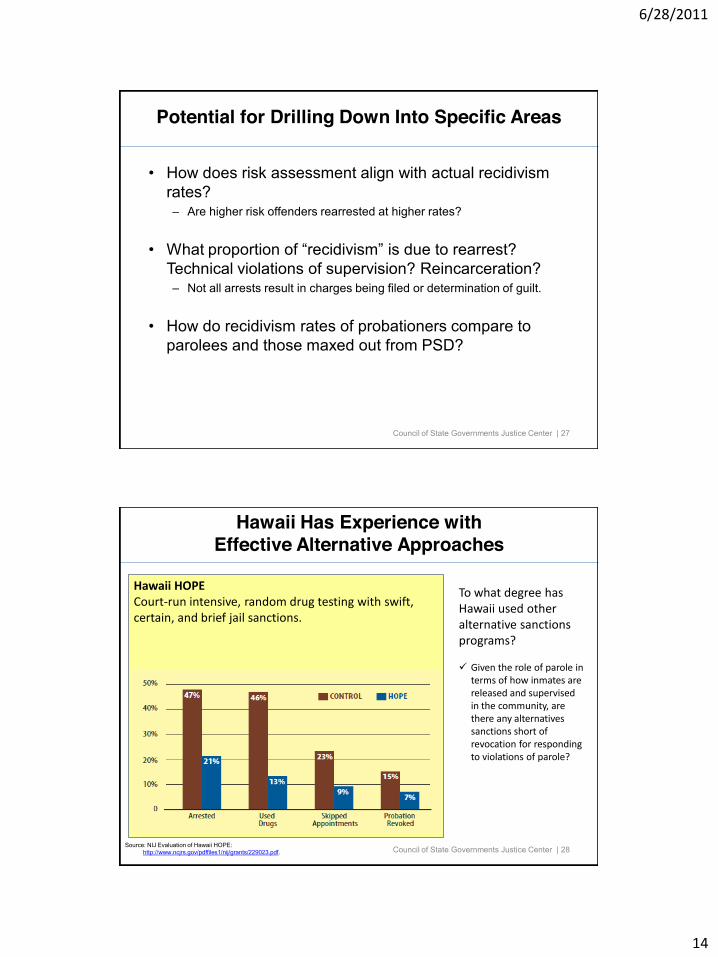
Potential for Drilling Down Into Specific Areas
How does risk assessment align with actual recidivism rates?
Are higher risk offenders rearrested at higher rates?
Technical violations of supervision? Reincarceration?Not all arrests result in charges being filed or determination of guilt.
How do recidivism rates of probationers compare to parolees and those maxed out from PSD?
Council of State Governments Justice Center | 27
Hawaii Has Experience withEffective Alternative Approaches
Council of State Governments Justice Center | 28
Hawaii HOPECourt-‐run intensive, random drug testing with swift, certain, and brief jail sanctions.
Source: NIJ Evaluation of Hawaii HOPE: http://www.ncjrs.gov/pdffiles1/nij/grants/229023.pdf.
To what degree has Hawaii used other alternative sanctions programs?
Given the role of parole in terms of how inmates are released and supervised in the community, are there any alternatives sanctions short of revocation for responding to violations of parole?
6/28/2011
15
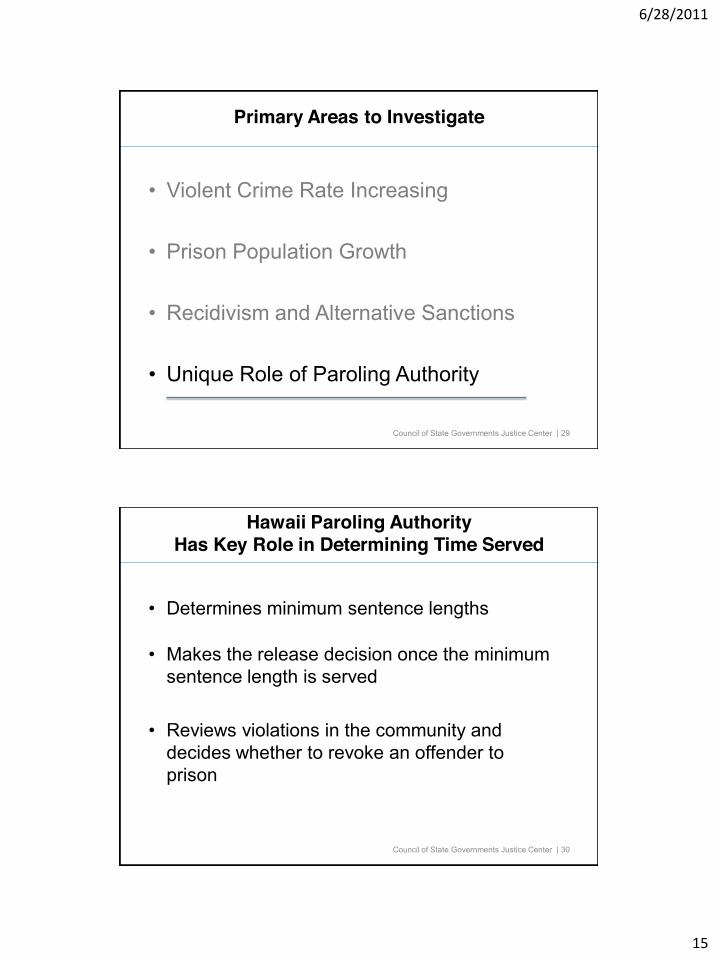
Primary Areas to Investigate
Violent Crime Rate Increasing
Prison Population Growth
Recidivism and Alternative Sanctions
Unique Role of Paroling Authority
Council of State Governments Justice Center | 29
Hawaii Paroling AuthorityHas Key Role in Determining Time Served
Determines minimum sentence lengths
Makes the release decision once the minimum sentence length is served
Reviews violations in the community and decides whether to revoke an offender to prison
Council of State Governments Justice Center | 30
6/28/2011
16
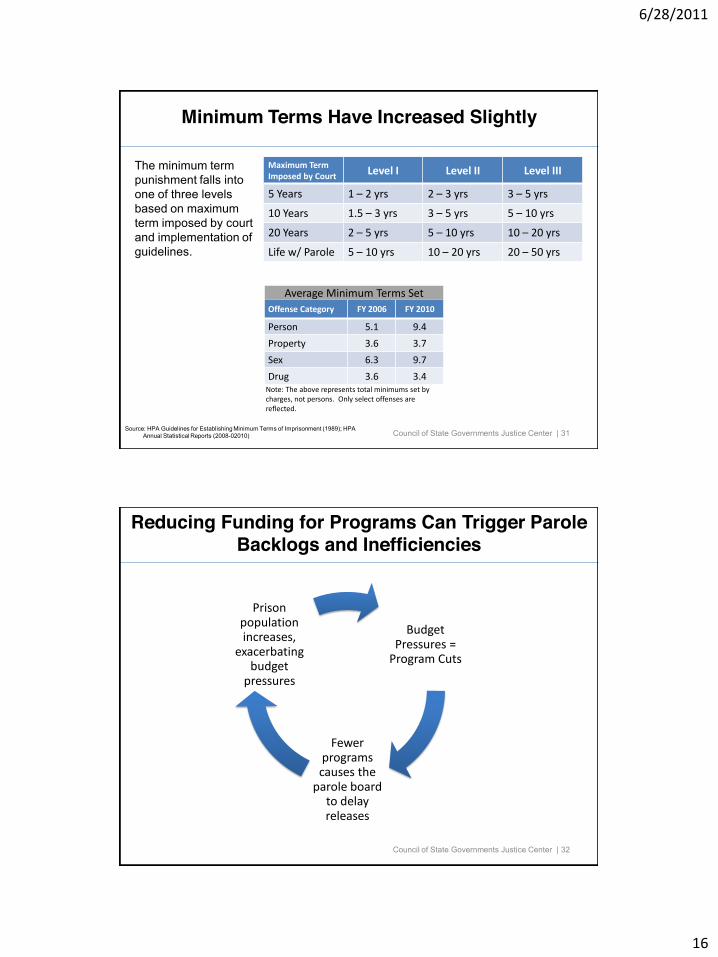
Minimum Terms Have Increased Slightly
The minimum term punishment falls into one of three levels based on maximum term imposed by court and implementation of guidelines.
Council of State Governments Justice Center | 31
Maximum Term Imposed by Court Level I Level II Level III
5 Years 1 2 yrs 2 3 yrs 3 5 yrs
10 Years 1.5 3 yrs 3 5 yrs 5 10 yrs
20 Years 2 5 yrs 5 10 yrs 10 20 yrs
Life w/ Parole 5 10 yrs 10 20 yrs 20 50 yrs
Source: HPA Guidelines for Establishing Minimum Terms of Imprisonment (1989); HPA Annual Statistical Reports (2008-02010)
Offense Category FY 2006 FY 2010
Person 5.1 9.4Property 3.6 3.7Sex 6.3 9.7Drug 3.6 3.4
Average Minimum Terms Set
Note: The above represents total minimums set by charges, not persons. Only select offenses are reflected.
Reducing Funding for Programs Can Trigger Parole Backlogs and Inefficiencies
Council of State Governments Justice Center | 32
Budget Pressures = Program Cuts
Fewer programs causes the parole board to delay releases
Prison population increases,
exacerbating budget pressures
6/28/2011
17
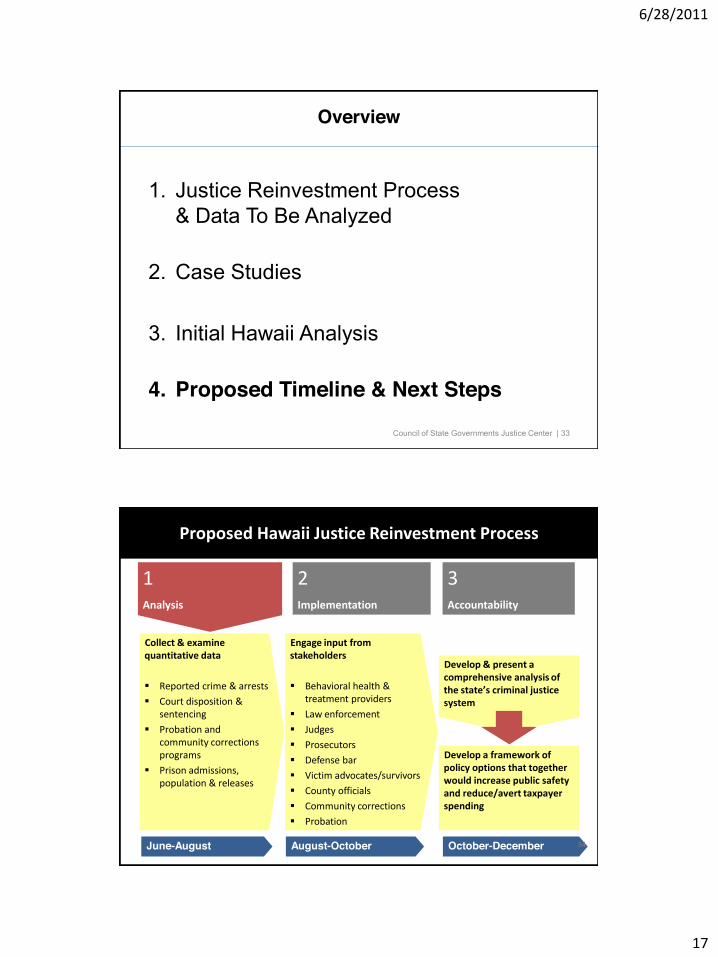
Overview
1. Justice Reinvestment Process & Data To Be Analyzed
2. Case Studies
3. Initial Hawaii Analysis
4. Proposed Timeline & Next Steps
Council of State Governments Justice Center | 33
Engage input from stakeholders
Behavioral health & treatment providersLaw enforcementJudgesProsecutorsDefense barVictim advocates/survivorsCounty officialsCommunity corrections Probation
Collect & examine quantitative data
Reported crime & arrestsCourt disposition & sentencingProbation and community corrections programsPrison admissions, population & releases
Develop & present a comprehensive analysis of
system
Develop a framework of policy options that together would increase public safety and reduce/avert taxpayer spending
1Analysis
2Implementation
3Accountability
Ohio Justice Reinvestment ProcessProposed Hawaii Justice Reinvestment Process
June-August August-October October-December 34
6/28/2011
18
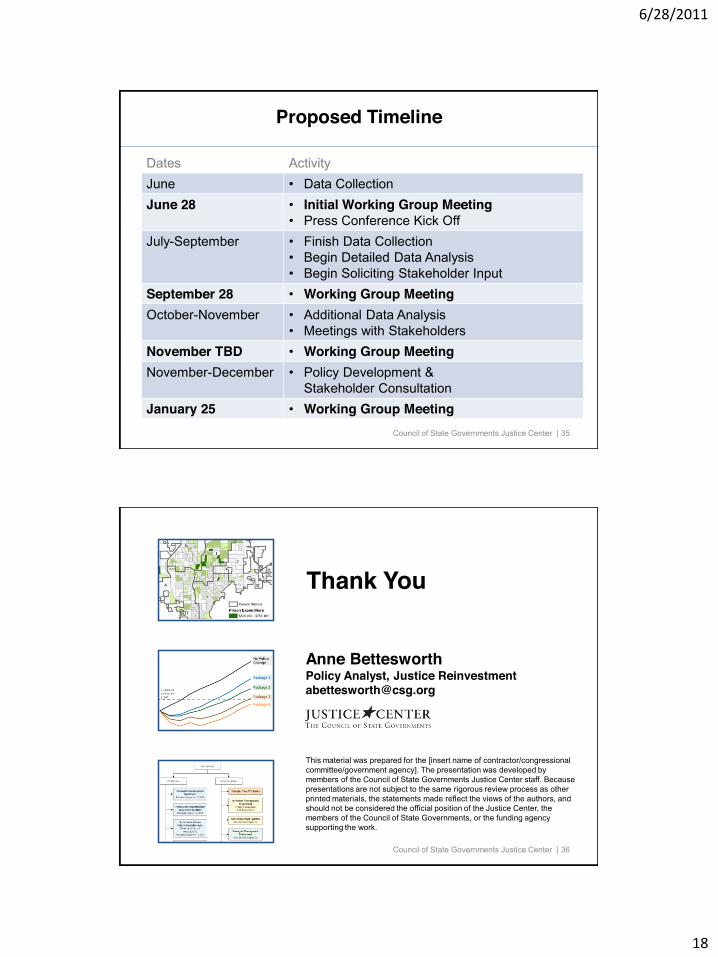
Proposed Timeline
Dates ActivityJune Data CollectionJune 28 Initial Working Group Meeting
Press Conference Kick OffJuly-September Finish Data Collection
Begin Detailed Data AnalysisBegin Soliciting Stakeholder Input
September 28 Working Group MeetingOctober-November Additional Data Analysis
Meetings with StakeholdersNovember TBD Working Group MeetingNovember-December Policy Development &
Stakeholder ConsultationJanuary 25 Working Group Meeting
Council of State Governments Justice Center | 35
Council of State Governments Justice Center | 36
Thank You
Anne BettesworthPolicy Analyst, Justice [email protected]
This material was prepared for the [insert name of contractor/congressional committee/government agency]. The presentation was developed by members of the Council of State Governments Justice Center staff. Because presentations are not subject to the same rigorous review process as other printed materials, the statements made reflect the views of the authors, and should not be considered the official position of the Justice Center, the members of the Council of State Governments, or the funding agency supporting the work.