Embed Size (px)
Citation preview

Making Leaders Successful Every Day
July 23, 2009
Mighty Mashups: Do-It-Yourself Business Intelligence For The New Economyby James Kobielusfor Information & Knowledge Management Professionals
© 2009, Forrester Research, Inc. All rights reserved. Unauthorized reproduction is strictly prohibited. Information is based on best available resources. Opinions reflect judgment at the time and are subject to change. Forrester®, Technographics®, Forrester Wave, RoleView, TechRadar, and Total Economic Impact are trademarks of Forrester Research, Inc. All other trademarks are the property of their respective companies. To purchase reprints of this document, please email [email protected]. For additional information, go to www.forrester.com.
For Information & Knowledge Management Professionals
ExEcuTIvE SuMMarYEnterprise business intelligence (BI) professionals face severe resource constraints, and the soft economy keeps budgets tight. One consequence is a lengthening queue of user requests to develop and revise reports, dashboards, cubes, and other analytic applications and data structures. To reduce the pressure on IT and satisfy user requests, information and knowledge management (I&KM) professionals provide users with self-service “mashup” capabilities. BI mashup tools let information workers handle some BI development tasks themselves from within their browsers, Excel spreadsheets, and other client applications. Mashup features, available in various vendors’ BI environments, let nontechnical users build personalized, context-rich, role-tailored, ad hoc views of disparate data and explore information in greater depth. These features can enhance information worker productivity, accelerate delivery of actionable intelligence, and reduce the development burden on overstretched IT staff in a tight economy. Still an emerging practice, mashup-style BI leverages organizations’ investments in both BI tools and interactive Web 2.0 technologies.
TaBlE oF coNTENTSBusiness Intelligence Development Resources Are Stretched Thin
Frustrated users Demand Self-Service BI
Empowering BI Users Via Mashup
Mashup Is Still an Emerging BI Practice
Mashup Implementers Address Many BI Needs
Early adopters realize Mashup Payoff
Do-It-Yourself BI, But Within Limits
rEcoMMENDaTIoNS
Now Is A Good Time To Adopt Mashup For Self-Service BI
Supplemental Material
NoTES & rESourcESForrester interviewed vendor companies including actuate, composite Software, corDa Technologies, Denodo Technologies, eThority, IBM cognos, InetSoft Technology, Information Builders, Kapow Technologies, Microsoft, SaP Business objects, and TIBco Spotfire. We also interviewed user company case studies in several verticals.
Related Research Documents“BI Belt Tightening In a Tough Economic climate”February 20, 2009
“olaP: In Fashion or old-Fashioned?”November 7, 2008
“Implementing Your Business Intelligence Solutions center”November 4, 2008
“BI Workspaces: BI Without Borders”June 23, 2008
July 23, 2009
Mighty Mashups: Do-It-Yourself Business Intelligence For The New Economyby James Kobieluswith rob Karel, Boris Evelson, and charles coit
2
5
11
13
15
16
© 2009, Forrester research, Inc. reproduction ProhibitedJuly 23, 2009
Mighty Mashups: Do-It-Yourself Business Intelligence For The New Economy For Information & Knowledge Management Professionals
2
BUSINESS INTELLIGENcE DEVELopMENT RESoURcES ARE STRETchED ThIN
Tight budgets bring out the resourcefulness in us all. Enterprise IT groups have responded to the current economic downturn by consolidating systems, cutting back staff, delaying projects, and rethinking processes in order to minimize impact on service levels.
Unfortunately, IT resource constraints create lengthening backlogs for service requests. Users are increasingly frustrated and are looking for other IT approaches that can service their business needs faster and, they hope, at a lower cost. Though Forrester has not seen a significant impact on enterprise business intelligence (BI) budgets from the current recession, BI service-request backlogs remain stubbornly long in many BI groups.1
The backlog stems from the following perennial issues with how enterprises typically handle the BI service-request support function:
· Unifying access to enterprise intelligence is difficult. Many organizations seek a single unified view of disparate enterprise data. However, this is easier said than done. Enterprise intelligence — the trusted, authoritative reference data for answering critical business questions — often originates in many scattered silos, comes in myriad open and proprietary formats, and conforms to a wide range of schemas and models. Unifying heterogeneous information for BI is a very complex, time-consuming, labor-intensive, costly process. Given how difficult it is to find and aggregate all this data, it is no surprise that most BI users report that they don’t have access to all the information they need.2
· Modifying rigid data structures requires tricky data modeling. Typically, organizations strive to consolidate most of their structured transactional data in an enterprise data warehouse (EDW) with online analytical processing (OLAP) data marts, the primary repositories accessed by BI applications. For all the benefits of this approach, EDW and OLAP data marts often have a less rosy flipside: rigid data structures, such as “star schemas,” that require attention from skilled data modelers within the IT organization. For example, a requirement from the business to connect, load, transform, join, aggregate, and display data from new sources in existing reports would require a complex and time-consuming change to the logical and physical data models supporting the BI environment.
· Designing BI applications is best left to the pros. BI reports, dashboards, and other applications are often so complex and convoluted that only experienced developers should design or maintain them. Even the most user-friendly, point-and-click BI applications require users to slog through a daunting range of user interfaces, features, reports, metrics, dimensions, and hierarchies. As a result, most BI end users must run back to IT for help in creating new reports, queries, and dashboards.3
© 2009, Forrester research, Inc. reproduction Prohibited July 23, 2009
Mighty Mashups: Do-It-Yourself Business Intelligence For The New Economy For Information & Knowledge Management Professionals
3
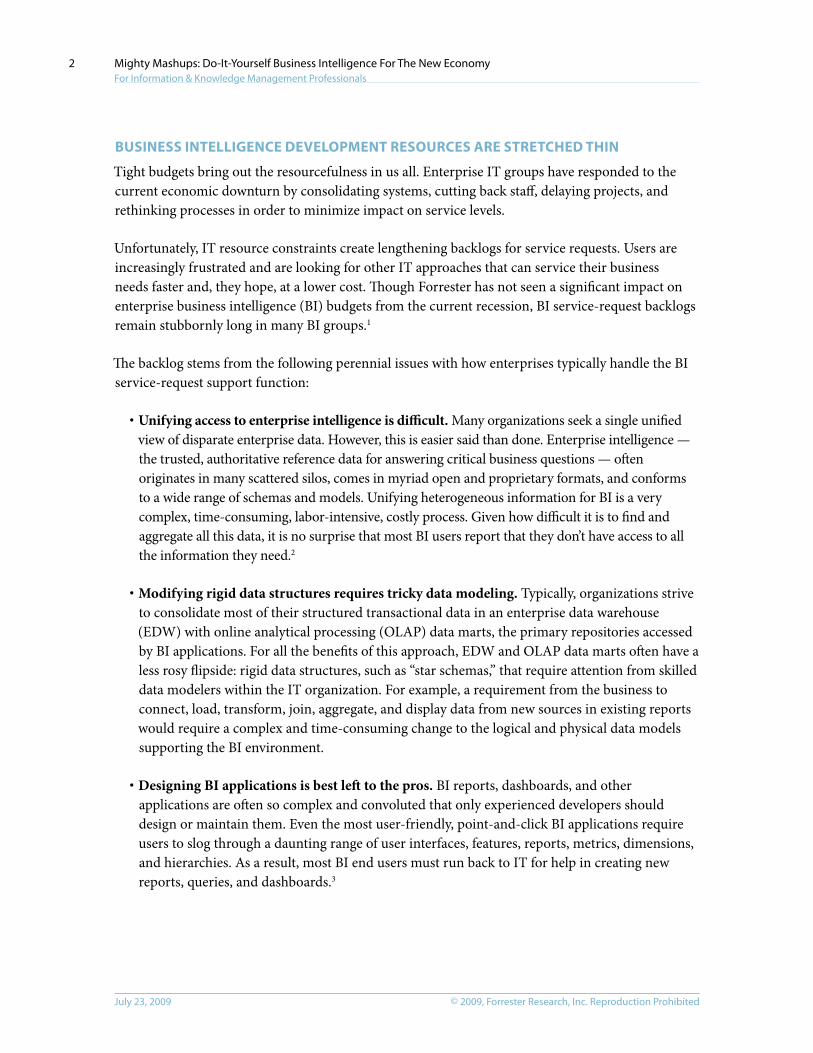
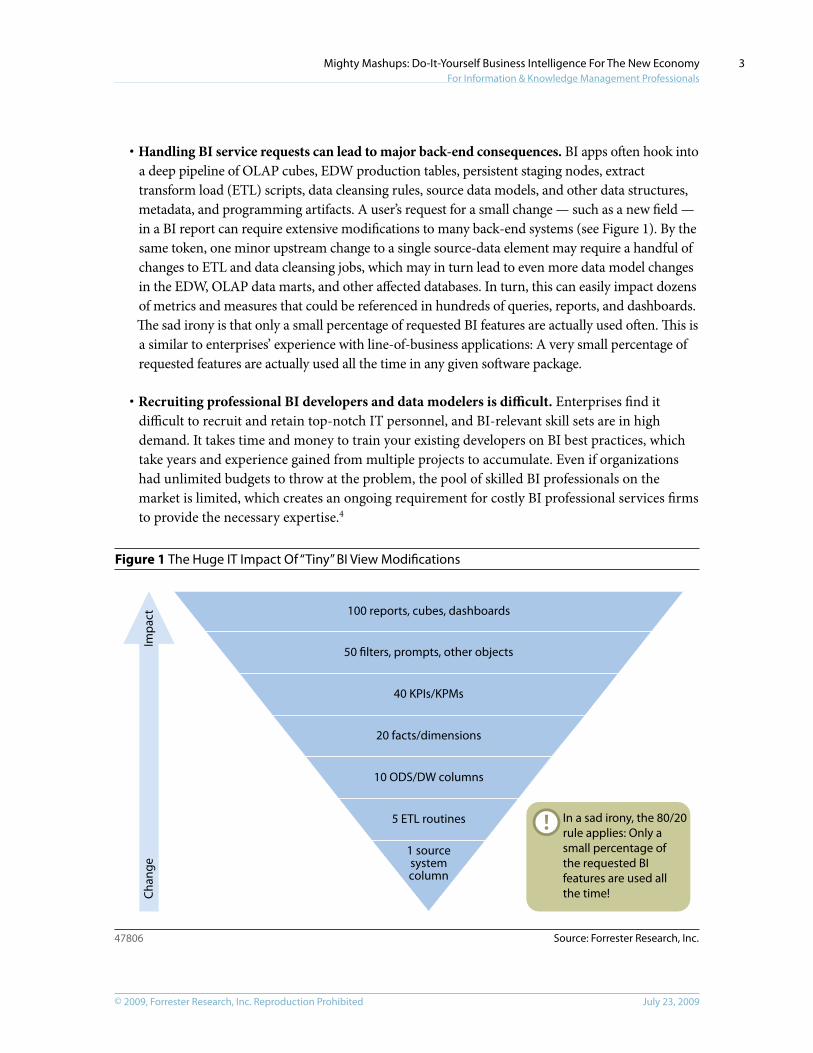
· Handling BI service requests can lead to major back-end consequences. BI apps often hook into a deep pipeline of OLAP cubes, EDW production tables, persistent staging nodes, extract transform load (ETL) scripts, data cleansing rules, source data models, and other data structures, metadata, and programming artifacts. A user’s request for a small change — such as a new field — in a BI report can require extensive modifications to many back-end systems (see Figure 1). By the same token, one minor upstream change to a single source-data element may require a handful of changes to ETL and data cleansing jobs, which may in turn lead to even more data model changes in the EDW, OLAP data marts, and other affected databases. In turn, this can easily impact dozens of metrics and measures that could be referenced in hundreds of queries, reports, and dashboards. The sad irony is that only a small percentage of requested BI features are actually used often. This is a similar to enterprises’ experience with line-of-business applications: A very small percentage of requested features are actually used all the time in any given software package.
· Recruiting professional BI developers and data modelers is difficult. Enterprises find it difficult to recruit and retain top-notch IT personnel, and BI-relevant skill sets are in high demand. It takes time and money to train your existing developers on BI best practices, which take years and experience gained from multiple projects to accumulate. Even if organizations had unlimited budgets to throw at the problem, the pool of skilled BI professionals on the market is limited, which creates an ongoing requirement for costly BI professional services firms to provide the necessary expertise.4
Figure 1 The Huge IT Impact of “Tiny” BI view Modifications
Source: Forrester Research, Inc.47806
1 source system column
5 ETL routines
10 ODS/DW columns
20 facts/dimensions
40 KPIs/KPMs
50 filters, prompts, other objects
100 reports, cubes, dashboards
Cha
nge
Imp
act
In a sad irony, the 80/20rule applies: Only asmall percentage ofthe requested BIfeatures are used allthe time!
© 2009, Forrester research, Inc. reproduction ProhibitedJuly 23, 2009
Mighty Mashups: Do-It-Yourself Business Intelligence For The New Economy For Information & Knowledge Management Professionals
4
Frustrated Users Demand Self-Service BI
Have you ever waited months for a simple report, or a simple change to an existing report, and wondered why it’s taking so long? Information workers express increasing frustration with this BI development bottleneck. They require speedy access to comprehensive business data to get their jobs done, but the IT staff can barely keep up with their demands.
Information workers are placing growing demands on their organizations’ BI groups, because their needs for actionable intelligence have not slackened, not even in a soft economy. People’s BI requirements will continue to grow and will challenge even the most forward-looking, resource-flush enterprise-BI operation on the planet. From a decision support standpoint, information workers are demanding, dynamic, and omnivorous — their BI needs are ever-changing.5 They demand access to new sources, data, models, reports, dashboards, queries, and applications. They generate a never-ending stream of requests for changes to all the above. And once you satisfy their needs with a BI rollout, their requirements begin to mushroom and they have demands you could never have anticipated in the first place.
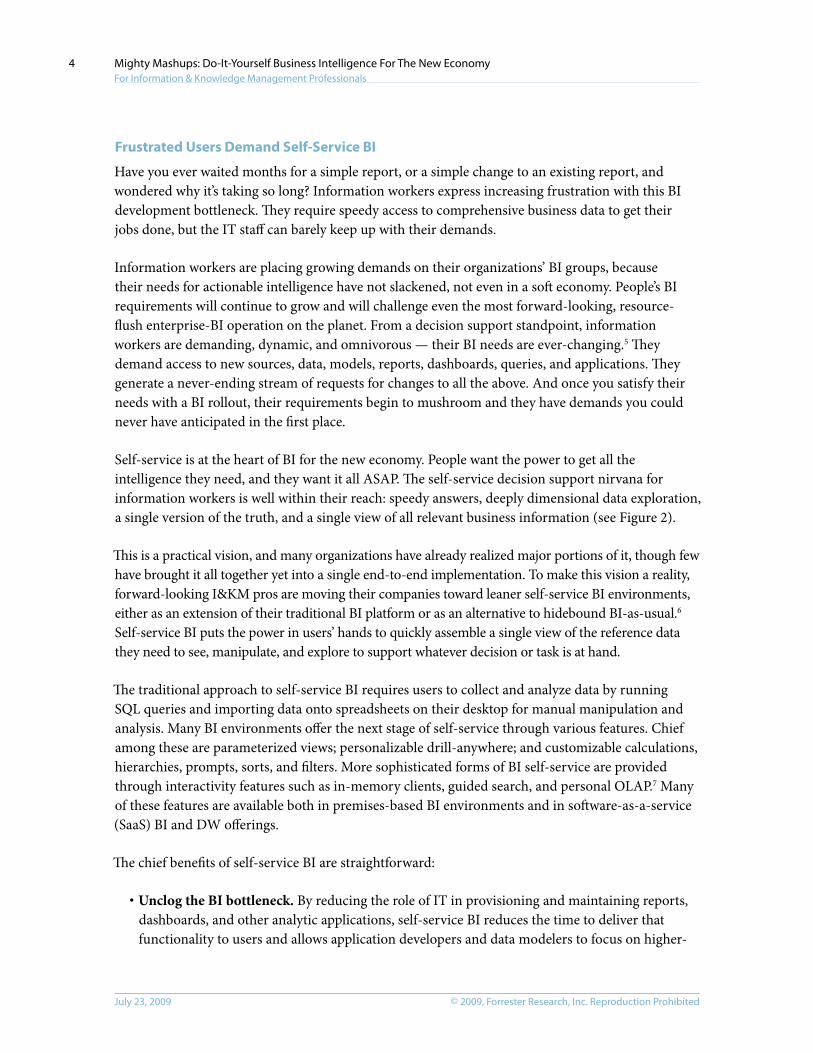
Self-service is at the heart of BI for the new economy. People want the power to get all the intelligence they need, and they want it all ASAP. The self-service decision support nirvana for information workers is well within their reach: speedy answers, deeply dimensional data exploration, a single version of the truth, and a single view of all relevant business information (see Figure 2).
This is a practical vision, and many organizations have already realized major portions of it, though few have brought it all together yet into a single end-to-end implementation. To make this vision a reality, forward-looking I&KM pros are moving their companies toward leaner self-service BI environments, either as an extension of their traditional BI platform or as an alternative to hidebound BI-as-usual.6 Self-service BI puts the power in users’ hands to quickly assemble a single view of the reference data they need to see, manipulate, and explore to support whatever decision or task is at hand.
The traditional approach to self-service BI requires users to collect and analyze data by running SQL queries and importing data onto spreadsheets on their desktop for manual manipulation and analysis. Many BI environments offer the next stage of self-service through various features. Chief among these are parameterized views; personalizable drill-anywhere; and customizable calculations, hierarchies, prompts, sorts, and filters. More sophisticated forms of BI self-service are provided through interactivity features such as in-memory clients, guided search, and personal OLAP.7 Many of these features are available both in premises-based BI environments and in software-as-a-service (SaaS) BI and DW offerings.
The chief benefits of self-service BI are straightforward:
· Unclog the BI bottleneck. By reducing the role of IT in provisioning and maintaining reports, dashboards, and other analytic applications, self-service BI reduces the time to deliver that functionality to users and allows application developers and data modelers to focus on higher-
© 2009, Forrester research, Inc. reproduction Prohibited July 23, 2009
Mighty Mashups: Do-It-Yourself Business Intelligence For The New Economy For Information & Knowledge Management Professionals
5
value, more complex projects such as data mining and closed-loop BI-integrated workflows. Enterprises can alleviate IT backlogs associated with designing, building, deploying, and maintaining reports, dashboards, queries, and analytic applications.
· Cut BI costs. By reducing the requirement for expensive BI application developers and data modelers, self-service BI enables organizations to reduce the cost of serving most routine analytics development and maintenance requests from information workers. Enterprises can evolve and expand their BI applications and usage without needing to add more modelers, developers, and DBAs.
· Enhance BI decision support. Business often moves faster than even the most agile IT department, which puts the onus on users to provide for themselves. By allowing information workers to get the information they need when they need it, and to create their own personalized views, models, manipulations, and calculations on the fly, self-service BI contributes to superior decision support. In other words, self-service BI can deliver the full range of actionable intelligence to all users all the time, morphing and evolving as dynamically as the business itself.
Figure 2 The Information Worker’s Decision Support Nirvana
Source: Forrester Research, Inc.47806
Self-service informationexploration
• User-defined mashup of reusable, personalized, context-rich, role-tailored view of information
• Collaborative sharing of reusable user mashups• Interactive, deeply dimensional drilldown
Single version of truth • Authoritative reference information conforming to standard dimensionsand hierarchies
• Matched, merged, cleansed, transformed, and enriched
Single view ofeverything
• Structured and unstructured, internal and external• Unified access, delivery, and presentation
Speedy answers • Fast access, loading, mediation, and virtualization of canonical views andinformation objects
• Shorten time to answer business questions
What they want How you deliver it
EMpoWERING BI USERS VIA MAShUp
In the Web 2.0 paradigm, the principal approach for self-service development is coined “mashup.” With a mashup, individuals rapidly create personalized applications using visual, browser-based drag-and-drop techniques — and without a single line of programming code. Typically, mashed-up applications incorporate lightweight components — known as widgets — and content created by others. Usually, mashups leverage AJAX and other Representational State Transfer (REST)
© 2009, Forrester research, Inc. reproduction ProhibitedJuly 23, 2009
Mighty Mashups: Do-It-Yourself Business Intelligence For The New Economy For Information & Knowledge Management Professionals
6
approaches that are native to the Internet. One of the most familiar Web mashup approaches uses Google Maps to display geocoded information in a browser-based map that can be scrolled, drilled, and manipulated without server roundtripping and mashes the Google Maps location data with other content, such as real estate listings, store locations, and so on.
Given the broad adoption of Web 2.0 in enterprise application architectures, it’s no surprise that self-service BI environments now embrace mashup-style development approaches as well.8 BI mashup takes self-service to the next level of sophistication and flexibility, blending all the self-service features just discussed — such as parameterized views, extensible hierarchies, in-memory clients, guided search, and personal OLAP — into a powerful new synthesis. 9 Though still immature, BI mashup is well on the way to becoming an enterprise-ready approach for self-service development. The key enablers for enterprise-grade BI mashup are IT governance practices such as design templates, version controls, and monitoring. When supported by strong governance, information workers can mash up personalized views from reusable analytic components that are developed and managed for them by IT. Mashup enables nontechnical users to build dynamic views of disparate data that are personalized, context-rich, role-tailored, and ad hoc to explore this data in greater depth.
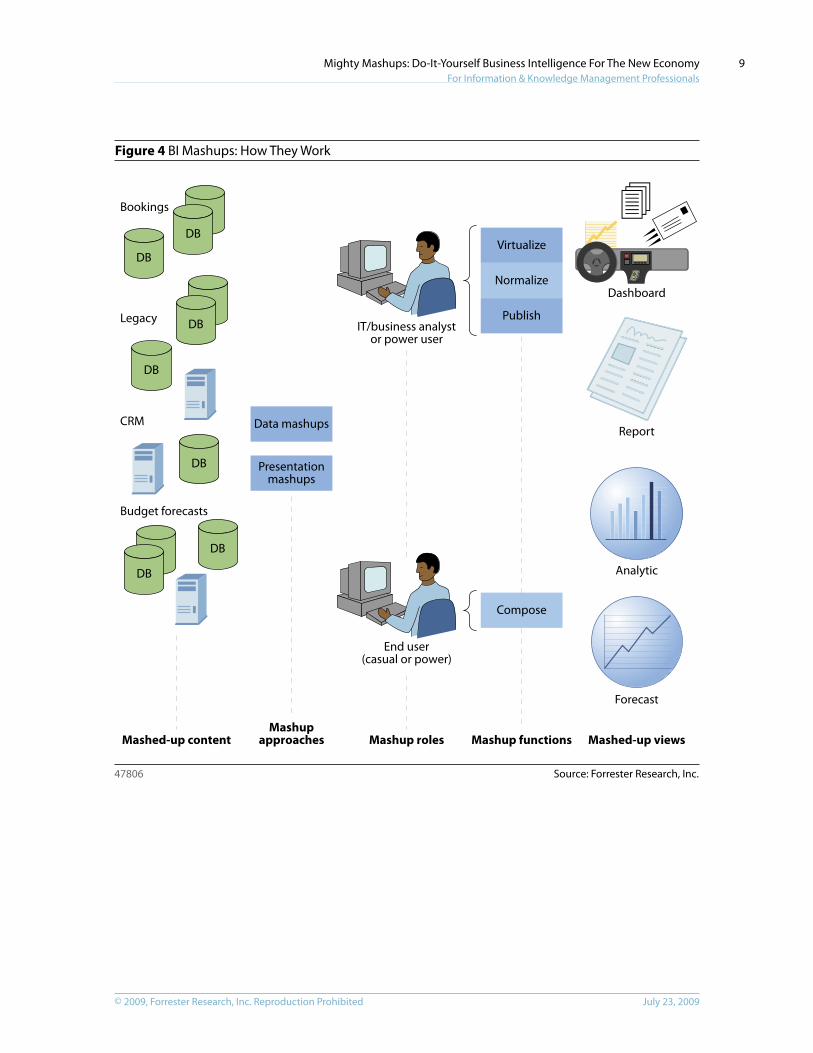
The key approaches that figure into a full BI mashup environment are data mashup and presentation mashup. Interwoven within a mashup environment, these approaches help information workers to combine more information more quickly into a unified BI workspace.
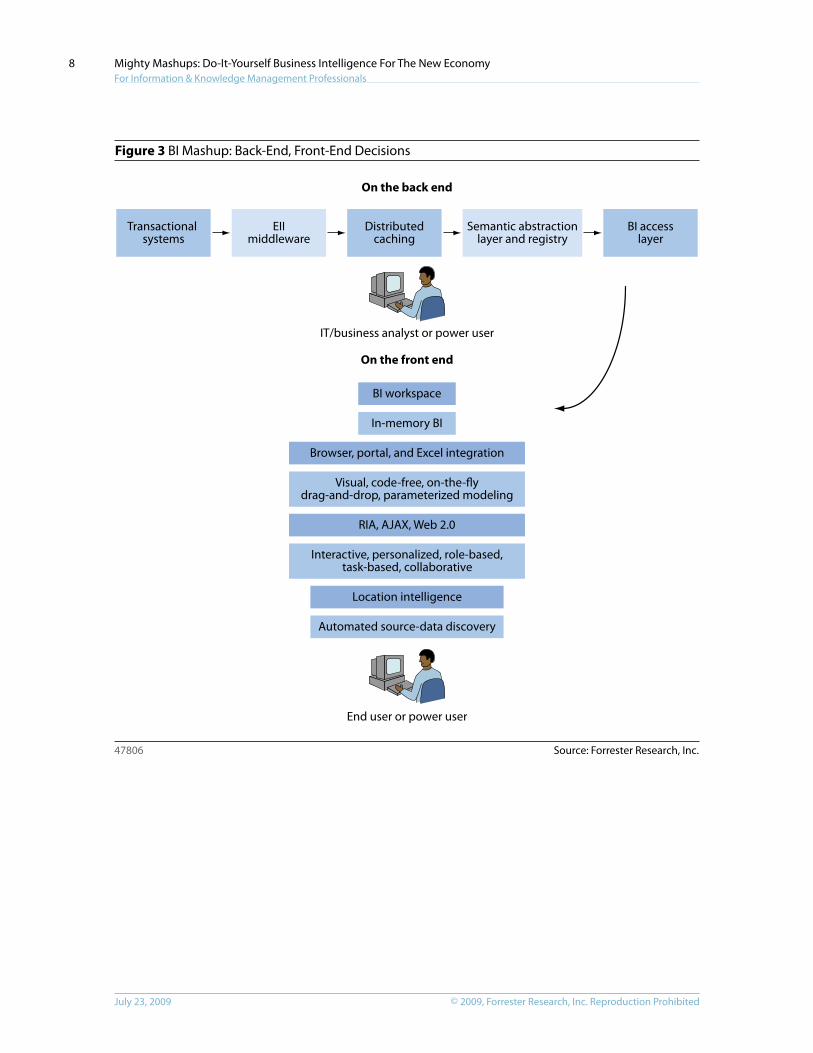
Data mashup allows IT professionals to develop analytic components that are made available for users to mash up. Data mashup refers to the integration, modeling, and governance functions that make presentation mashups possible while maintaining ongoing IT oversight. Data mashup relies on infrastructure for enterprise information integration (EII), semantic data virtualization, distributed caching, analytic-view service registries, and automated source-data discovery (see Figure 3).10 These infrastructure components isolate users from the complexity of heterogeneous data models in a federated data environment. Data mashups — such as multisource, on-demand server-side data-aggregations — are the province of SOA developers, professional data modelers and, on occasion, power users who are adept in domain-specific modeling. For example, a composite data services object — such as a developer might create in an EII visual flowcharting tool — might support retrieval of customer data from heterogeneous CRM systems and include complex rules to validate, match, merge, and deliver that data to myriad customer-data-integration (CDI) applications.
The principal data mashup functions are:
· Virtualizing sources, data, and views. IT provides virtualized, on-demand access to federated sources through EII middleware. Data virtualization ensures unified single viewing, access, and transactions against heterogeneous data models implemented in myriad database management systems (DBMS), data warehousing (DW), operational data stores (ODS), online transaction processing (OLTP), and other repositories.
© 2009, Forrester research, Inc. reproduction Prohibited July 23, 2009
Mighty Mashups: Do-It-Yourself Business Intelligence For The New Economy For Information & Knowledge Management Professionals
7
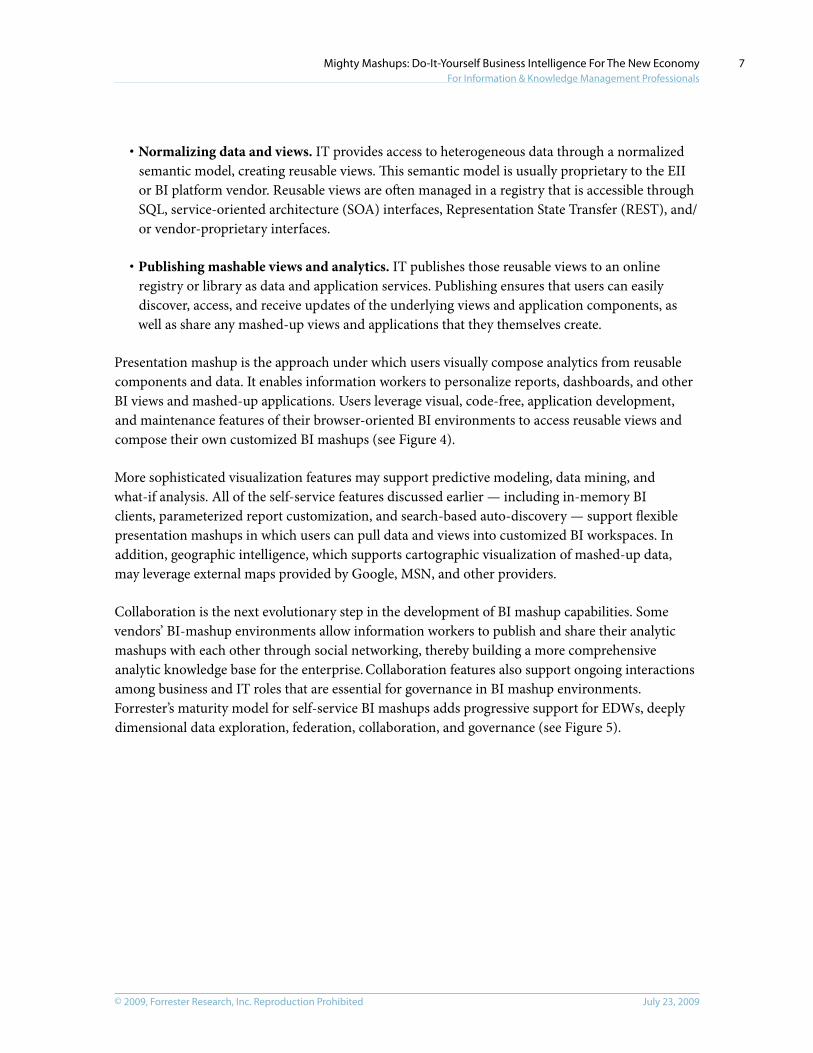
· Normalizing data and views. IT provides access to heterogeneous data through a normalized semantic model, creating reusable views. This semantic model is usually proprietary to the EII or BI platform vendor. Reusable views are often managed in a registry that is accessible through SQL, service-oriented architecture (SOA) interfaces, Representation State Transfer (REST), and/or vendor-proprietary interfaces.
· Publishing mashable views and analytics. IT publishes those reusable views to an online registry or library as data and application services. Publishing ensures that users can easily discover, access, and receive updates of the underlying views and application components, as well as share any mashed-up views and applications that they themselves create.
Presentation mashup is the approach under which users visually compose analytics from reusable components and data. It enables information workers to personalize reports, dashboards, and other BI views and mashed-up applications. Users leverage visual, code-free, application development, and maintenance features of their browser-oriented BI environments to access reusable views and compose their own customized BI mashups (see Figure 4).
More sophisticated visualization features may support predictive modeling, data mining, and what-if analysis. All of the self-service features discussed earlier — including in-memory BI clients, parameterized report customization, and search-based auto-discovery — support flexible presentation mashups in which users can pull data and views into customized BI workspaces. In addition, geographic intelligence, which supports cartographic visualization of mashed-up data, may leverage external maps provided by Google, MSN, and other providers.
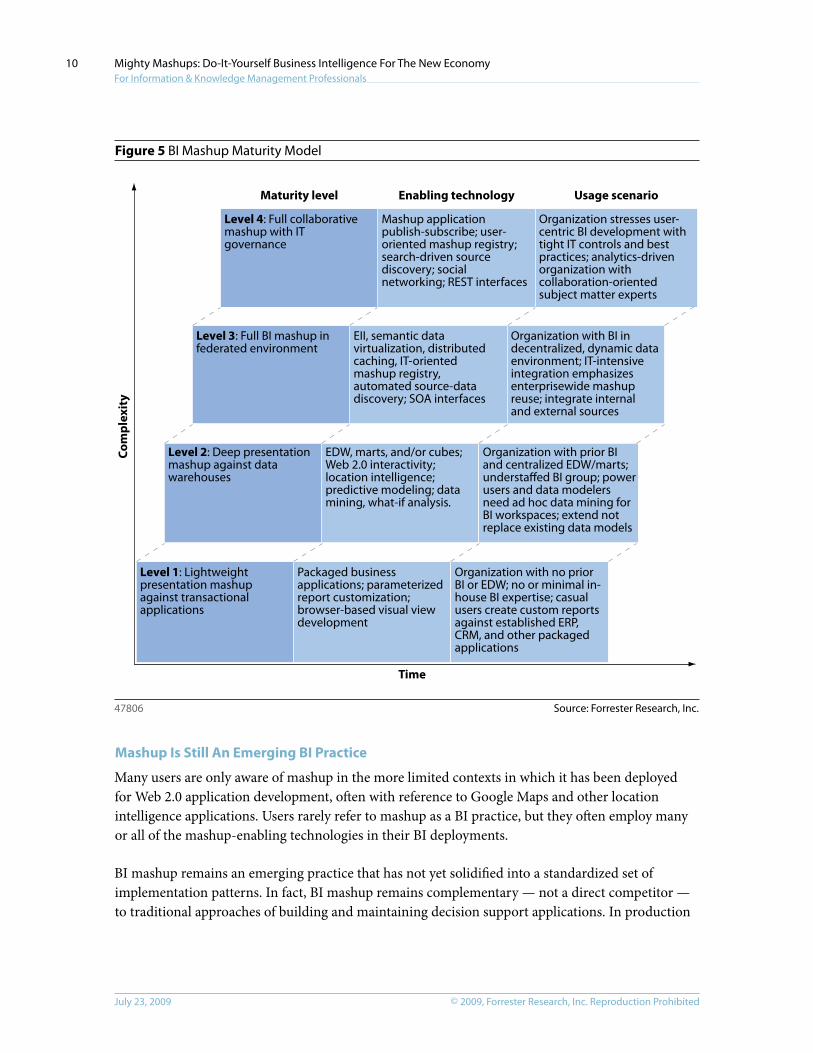
Collaboration is the next evolutionary step in the development of BI mashup capabilities. Some vendors’ BI-mashup environments allow information workers to publish and share their analytic mashups with each other through social networking, thereby building a more comprehensive analytic knowledge base for the enterprise. Collaboration features also support ongoing interactions among business and IT roles that are essential for governance in BI mashup environments. Forrester’s maturity model for self-service BI mashups adds progressive support for EDWs, deeply dimensional data exploration, federation, collaboration, and governance (see Figure 5).
© 2009, Forrester research, Inc. reproduction ProhibitedJuly 23, 2009
Mighty Mashups: Do-It-Yourself Business Intelligence For The New Economy For Information & Knowledge Management Professionals
8
Figure 3 BI Mashup: Back-End, Front-End Decisions
Source: Forrester Research, Inc.47806
EIImiddleware
On the back end
On the front end
Transactional systems
Distributed caching
Semantic abstractionlayer and registry
BI access layer
Browser, portal, and Excel integration
BI workspace
In-memory BI
Visual, code-free, on-the-fly drag-and-drop, parameterized modeling
RIA, AJAX, Web 2.0
Interactive, personalized, role-based, task-based, collaborative
Location intelligence
Automated source-data discovery
IT/business analyst or power user
End user or power user
© 2009, Forrester research, Inc. reproduction Prohibited July 23, 2009
Mighty Mashups: Do-It-Yourself Business Intelligence For The New Economy For Information & Knowledge Management Professionals
9
Figure 4 BI Mashups: How They Work
Source: Forrester Research, Inc.47806
Compose
DB
DB
DB
DB
DB
DB
Legacy
CRM
DB
DB
DB
DB
Bookings
Data mashups
Presentationmashups
Dashboard
Report
Analytic
Forecast
Virtualize
Normalize
Publish
End user (casual or power)
IT/business analystor power user
Budget forecasts
Mashed-up content Mashup
approaches Mashup roles Mashup functions Mashed-up views
© 2009, Forrester research, Inc. reproduction ProhibitedJuly 23, 2009
Mighty Mashups: Do-It-Yourself Business Intelligence For The New Economy For Information & Knowledge Management Professionals
10
Figure 5 BI Mashup Maturity Model
Source: Forrester Research, Inc.47806
Co
mp
lexi
ty
Time
Mashup applicationpublish-subscribe; user-oriented mashup registry;search-driven sourcediscovery; socialnetworking; REST interfaces
Level 4: Full collaborativemashup with ITgovernance
Organization stresses user-centric BI development withtight IT controls and bestpractices; analytics-drivenorganization withcollaboration-orientedsubject matter experts
Maturity level Enabling technology Usage scenario
EII, semantic datavirtualization, distributedcaching, IT-orientedmashup registry,automated source-datadiscovery; SOA interfaces
Level 3: Full BI mashup in federated environment
Organization with BI indecentralized, dynamic dataenvironment; IT-intensiveintegration emphasizesenterprisewide mashupreuse; integrate internaland external sources
EDW, marts, and/or cubes;Web 2.0 interactivity;location intelligence;predictive modeling; datamining, what-if analysis.
Level 2: Deep presentation mashup against data warehouses
Organization with prior BIand centralized EDW/marts;understaffed BI group; powerusers and data modelersneed ad hoc data mining forBI workspaces; extend notreplace existing data models
Packaged businessapplications; parameterizedreport customization;browser-based visual viewdevelopment
Level 1: Lightweight presentation mashup against transactional applications
Organization with no priorBI or EDW; no or minimal in-house BI expertise; casualusers create custom reportsagainst established ERP,CRM, and other packagedapplications
Mashup Is Still An Emerging BI practice
Many users are only aware of mashup in the more limited contexts in which it has been deployed for Web 2.0 application development, often with reference to Google Maps and other location intelligence applications. Users rarely refer to mashup as a BI practice, but they often employ many or all of the mashup-enabling technologies in their BI deployments.
BI mashup remains an emerging practice that has not yet solidified into a standardized set of implementation patterns. In fact, BI mashup remains complementary — not a direct competitor — to traditional approaches of building and maintaining decision support applications. In production
© 2009, Forrester research, Inc. reproduction Prohibited July 23, 2009
Mighty Mashups: Do-It-Yourself Business Intelligence For The New Economy For Information & Knowledge Management Professionals
11
environments, IT still develops and maintains most BI applications on behalf of their business stakeholders. Indeed, BI mashup is not yet mature enough for many mission-critical business applications due both to lack of feature-complete prepackaged vendor solutions and to enterprise reluctance to migrate toward a purely self-service user-centric approach.
While the benefits of BI mashup are compelling, I&KM pros must address certain risks before recommending implementation in their organizations:
· Risk 1: Users fail to capitalize on self-service BI. Many information workers consider self-service BI an unwelcome burden. Casual users can resent being expected to develop their own reports and dashboards, even if it’s very easy to do, because this was previously an IT responsibility. These users may make only the most perfunctory efforts to customize views to their needs, relying on default settings or “out-of-the-box” report templates. If users never touch the default view settings in your BI mashup environment, you will have squandered your investment in “self-service” BI.
· Risk 2: IT unwilling to give up significant BI development responsibility. As much as they groan from overwork, BI developers may be loath to give up such a key responsibility as building reports and dashboards. BI professionals may even find their workloads grow in the short term if they’re expected to maintain existing warehouses, marts, and cubes while also supporting new self-service user BI infrastructure. If nothing else, BI developers may worry that end users won’t follow consistent best practices and will therefore be expected to come in and
“clean up” later.
· Risk 3: IT fails to implement effective governance around self-service BI. BI developers must not permit users to create their own reports without design templates, version controls, access controls, or any other form of ongoing governance. This lack of effective governance might lead to users inadvertently duplicating each others’ applications, incorporating out-of-date or inaccurate data, or publishing them to unauthorized third parties.
MAShUp IMpLEMENTERS ADDRESS MANY BI NEEDS
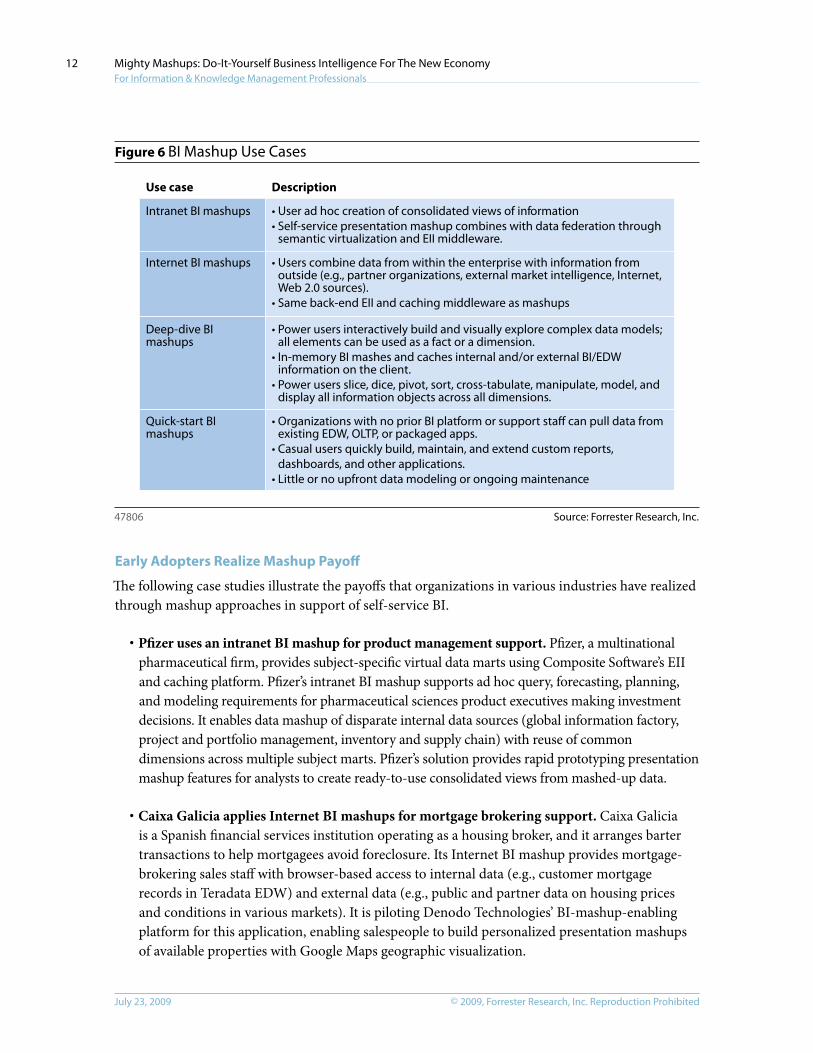
In spite of these risks, Forrester sees BI mashup being deployed in several emerging use cases: intranet BI mashups, Internet BI mashups, deep-dive BI mashups and quick-start BI mashups (see Figure 6). These use cases may involve enterprises that deploy mashup as an extension or supplement to their current BI and enterprise data warehousing environment, or those where users have no BI or EDW environment and choose to implement a mashup-oriented BI solution. Within any of these use cases, we further characterize the BI mashup deployment by whether it serves the needs of casual users, power users, or both.
© 2009, Forrester research, Inc. reproduction ProhibitedJuly 23, 2009
Mighty Mashups: Do-It-Yourself Business Intelligence For The New Economy For Information & Knowledge Management Professionals
12
Figure 6 BI Mashup use cases
Source: Forrester Research, Inc.47806
Intranet BI mashups
Internet BI mashups
Deep-dive BI mashups
Quick-start BImashups
Use case Description
• User ad hoc creation of consolidated views of information• Self-service presentation mashup combines with data federation through
semantic virtualization and EII middleware.
• Users combine data from within the enterprise with information fromoutside (e.g., partner organizations, external market intelligence, Internet,Web 2.0 sources).
• Same back-end EII and caching middleware as mashups
• Power users interactively build and visually explore complex data models;all elements can be used as a fact or a dimension.
• In-memory BI mashes and caches internal and/or external BI/EDWinformation on the client.
• Power users slice, dice, pivot, sort, cross-tabulate, manipulate, model, anddisplay all information objects across all dimensions.
• Organizations with no prior BI platform or support staff can pull data fromexisting EDW, OLTP, or packaged apps.
• Casual users quickly build, maintain, and extend custom reports,dashboards, and other applications.
• Little or no upfront data modeling or ongoing maintenance
Early Adopters Realize Mashup payoff
The following case studies illustrate the payoffs that organizations in various industries have realized through mashup approaches in support of self-service BI.
· Pfizer uses an intranet BI mashup for product management support. Pfizer, a multinational pharmaceutical firm, provides subject-specific virtual data marts using Composite Software’s EII and caching platform. Pfizer’s intranet BI mashup supports ad hoc query, forecasting, planning, and modeling requirements for pharmaceutical sciences product executives making investment decisions. It enables data mashup of disparate internal data sources (global information factory, project and portfolio management, inventory and supply chain) with reuse of common dimensions across multiple subject marts. Pfizer’s solution provides rapid prototyping presentation mashup features for analysts to create ready-to-use consolidated views from mashed-up data.
· Caixa Galicia applies Internet BI mashups for mortgage brokering support. Caixa Galicia is a Spanish financial services institution operating as a housing broker, and it arranges barter transactions to help mortgagees avoid foreclosure. Its Internet BI mashup provides mortgage-brokering sales staff with browser-based access to internal data (e.g., customer mortgage records in Teradata EDW) and external data (e.g., public and partner data on housing prices and conditions in various markets). It is piloting Denodo Technologies’ BI-mashup-enabling platform for this application, enabling salespeople to build personalized presentation mashups of available properties with Google Maps geographic visualization.
© 2009, Forrester research, Inc. reproduction Prohibited July 23, 2009
Mighty Mashups: Do-It-Yourself Business Intelligence For The New Economy For Information & Knowledge Management Professionals
13
· Teranode customers rely on deep-dive BI mashup for scientific research. Teranode, an independent software vendor (ISV), has customers whose R&D analysts use the firm’s mashup tools for deeply interactive visual modeling in biological sciences. Teranode’s product, which incorporates TIBCO Spotfire’s in-memory BI tool, supports mashed-up ad hoc access to complex clinical and pharmaceutical data in federated databases. It supports flexible analyst-driven development and project-oriented sharing of mashed-up models, normalizing heterogeneous source/subject schemas to common semantic ontology, managed in Oracle 11g RDF triple store.
· University of Louisville implements quick-start BI mashups for flexible reporting. The University of Louisville’s University Pediatrics Foundation, a not-for-profit foundation in Louisville, KY, operates several pediatric medical clinics and provides pediatric in-hospital services. Financial analysts adopted eThority’s mashup BI system for a quick-start BI mashup that allows each analyst to build custom consolidated reports from accounting data in PeopleSoft and Sage PFW, which don’t support customized views. Previously, the organization had no BI system. eThority allows financial analysts to customize canned views within browsers or build from scratch, leveraging a semantic “data table”. Accounting application administrators appreciate not having to build custom reports for these analysts.
Do-IT-YoURSELF BI, BUT WIThIN LIMITS
One area where the various BI mashup use cases differ is in the extent of collaboration necessary to field the capability, and on the roles involved. In other words, BI mashup is not entirely “do-it-yourself ” since information workers cannot — and should not — deploy and manage BI applications entirely on their own. Instead, BI mashup represents collaboration among nontechnical and technical roles.
That’s all for the best, because BI mashup without IT involvement is an invitation to chaos. User-centric presentation mashups must have IT governance, guidance, monitoring, and control. If serious about mashups, enterprises must define and enforce best practices and cultivate mashup skills among IT staff. Enterprise IT must not allow mashups if they compromise enterprise security, publish untrustworthy data, or fail to meet minimum service-level requirements.
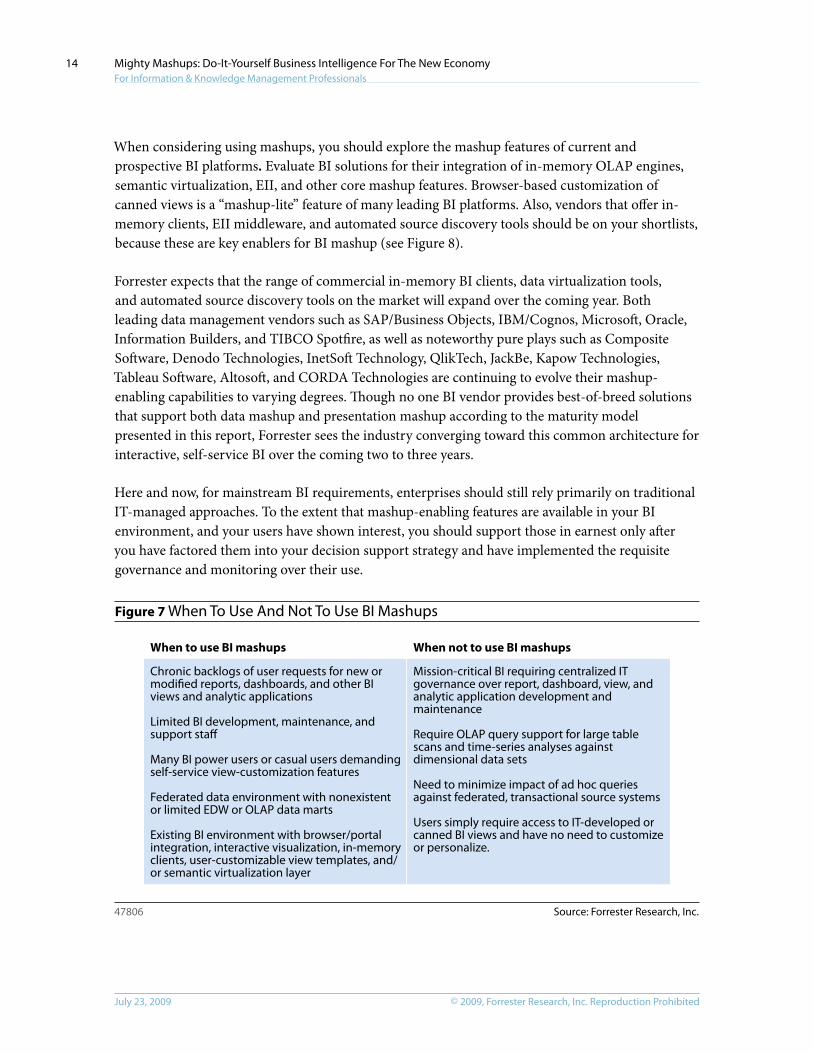
Just as important, enterprise IT must guide users away from considering mashups for BI scenarios that are ill-suited to this approach. I&KM pros should consider mashup an immature approach, supplementing but not replacing traditional BI practices. Mashup will not replace your OLAP cubes, EDW, and other core decision support infrastructure for heavy-hitting dimensional analysis against large table aggregates. But mashup can take a considerable burden off IT’s back for routine report, dashboard, and view development and maintenance. Be sure to condition expectations for mashup’s optimal role in your BI environment rather than present it as a one-size-fits-all approach for all decision support scenarios (see Figure 7).
© 2009, Forrester research, Inc. reproduction ProhibitedJuly 23, 2009
Mighty Mashups: Do-It-Yourself Business Intelligence For The New Economy For Information & Knowledge Management Professionals
14
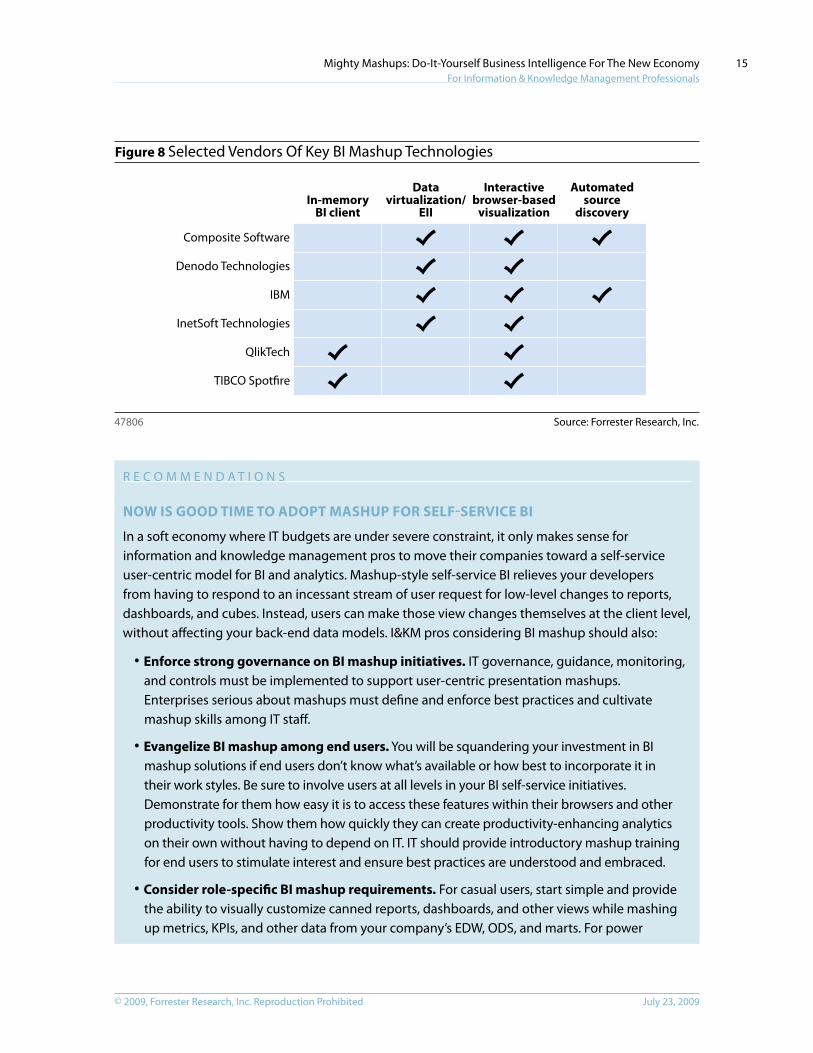
When considering using mashups, you should explore the mashup features of current and prospective BI platforms. Evaluate BI solutions for their integration of in-memory OLAP engines, semantic virtualization, EII, and other core mashup features. Browser-based customization of canned views is a “mashup-lite” feature of many leading BI platforms. Also, vendors that offer in-memory clients, EII middleware, and automated source discovery tools should be on your shortlists, because these are key enablers for BI mashup (see Figure 8).
Forrester expects that the range of commercial in-memory BI clients, data virtualization tools, and automated source discovery tools on the market will expand over the coming year. Both leading data management vendors such as SAP/Business Objects, IBM/Cognos, Microsoft, Oracle, Information Builders, and TIBCO Spotfire, as well as noteworthy pure plays such as Composite Software, Denodo Technologies, InetSoft Technology, QlikTech, JackBe, Kapow Technologies, Tableau Software, Altosoft, and CORDA Technologies are continuing to evolve their mashup-enabling capabilities to varying degrees. Though no one BI vendor provides best-of-breed solutions that support both data mashup and presentation mashup according to the maturity model presented in this report, Forrester sees the industry converging toward this common architecture for interactive, self-service BI over the coming two to three years.
Here and now, for mainstream BI requirements, enterprises should still rely primarily on traditional IT-managed approaches. To the extent that mashup-enabling features are available in your BI environment, and your users have shown interest, you should support those in earnest only after you have factored them into your decision support strategy and have implemented the requisite governance and monitoring over their use.
Figure 7 When To use and Not To use BI Mashups
Source: Forrester Research, Inc.47806
When to use BI mashups When not to use BI mashups
Chronic backlogs of user requests for new ormodified reports, dashboards, and other BIviews and analytic applications
Limited BI development, maintenance, andsupport staff
Many BI power users or casual users demandingself-service view-customization features
Federated data environment with nonexistentor limited EDW or OLAP data marts
Existing BI environment with browser/portalintegration, interactive visualization, in-memoryclients, user-customizable view templates, and/or semantic virtualization layer
Mission-critical BI requiring centralized ITgovernance over report, dashboard, view, andanalytic application development andmaintenance
Require OLAP query support for large tablescans and time-series analyses againstdimensional data sets
Need to minimize impact of ad hoc queriesagainst federated, transactional source systems
Users simply require access to IT-developed orcanned BI views and have no need to customizeor personalize.
© 2009, Forrester research, Inc. reproduction Prohibited July 23, 2009
Mighty Mashups: Do-It-Yourself Business Intelligence For The New Economy For Information & Knowledge Management Professionals
15
Figure 8 Selected vendors of Key BI Mashup Technologies
Source: Forrester Research, Inc.47806
Automated source
discovery
Interactive browser-based
visualization
Data virtualization/
EII In-memory
BI client
Composite Software
Denodo Technologies
IBM
InetSoft Technologies
QlikTech
TIBCO Spotfire
r E c o M M E N D a T I o N S
NoW IS GooD TIME To ADopT MAShUp FoR SELF-SERVIcE BI
In a soft economy where IT budgets are under severe constraint, it only makes sense for information and knowledge management pros to move their companies toward a self-service user-centric model for BI and analytics. Mashup-style self-service BI relieves your developers from having to respond to an incessant stream of user request for low-level changes to reports, dashboards, and cubes. Instead, users can make those view changes themselves at the client level, without affecting your back-end data models. I&KM pros considering BI mashup should also:
· Enforce strong governance on BI mashup initiatives. IT governance, guidance, monitoring, and controls must be implemented to support user-centric presentation mashups. Enterprises serious about mashups must define and enforce best practices and cultivate mashup skills among IT staff.
· Evangelize BI mashup among end users. You will be squandering your investment in BI mashup solutions if end users don’t know what’s available or how best to incorporate it in their work styles. Be sure to involve users at all levels in your BI self-service initiatives. Demonstrate for them how easy it is to access these features within their browsers and other productivity tools. Show them how quickly they can create productivity-enhancing analytics on their own without having to depend on IT. IT should provide introductory mashup training for end users to stimulate interest and ensure best practices are understood and embraced.
· consider role-specific BI mashup requirements. For casual users, start simple and provide the ability to visually customize canned reports, dashboards, and other views while mashing up metrics, KPIs, and other data from your company’s EDW, oDS, and marts. For power
© 2009, Forrester research, Inc. reproduction ProhibitedJuly 23, 2009
Mighty Mashups: Do-It-Yourself Business Intelligence For The New Economy For Information & Knowledge Management Professionals
16
users, offer deep-dive mashup features through in-memory client-side olaP engines, rich visualization options, and the ability to create new models, dimensions, and hierarchies above and beyond what is implemented in source data.
· Make mashups even mightier with collaborative analytics. The most powerful analytic mashups may be those that users build through sharing, combining, and extending each others’ work. When evaluating mashup-enabling BI solutions, be sure to consider the extent to which the vendor integrates Web 2.0 collaborative features such as blogs, wikis, and social networking into its tooling.
SUppLEMENTAL MATERIAL
companies Interviewed For This Document
Actuate
Composite Software
Denodo Technologies
eThority
IBM (Cognos, Lotus)
InetSoft Technology
Information Builders
JackBe
Kapow Technologies
Microsoft
QlikTech
SAP (Business Objects)
TIBCO Spotfire
ENDNoTES1 While overall IT budgets become key targets for cost cutting in recessionary times, Forrester has not yet
witnessed a trend where BI applications and infrastructure are falling onto this chopping block. Of course, current economic conditions necessitate a closer look at how BI dollars are spent. Fiscal and IT disciplines and best practices that tend to slip out of control during the good times must be reintroduced. I&KM pros are exploring approaches for doing more with less, which increasingly points toward self-service BI. See the February 20, 2009, “BI Belt Tightening In A Tough Economic Climate” report.
2 Enterprise BI environments seldom provide users with all the information they need. Forrester surveyed 82 IT decision-makers, asking, “What portion of the information you need to report on and analyze is available to and accessible from your BI applications?” Only 17.1% of respondents responded “Almost all.” Twenty-three percent responded “Most.” About 55% responded “Some” or “About half.” Source: August 2008 Global BI And Data Management Online Survey.
3 Indeed, IT still develops most BI applications, while end user self-service remains elusive. Forrester surveyed 82 IT decision-makers, asking “Who develops your BI applications?” (multiple responses were accepted from each respondent). Just over 70% responded that IT develops their reports and dashboards. About 57% responded that power users (in other words, business stakeholders with limited BI skills) did such development. Only 18.3% reported that BI development is done by end users with limited BI skills. Source: August 2008 Global BI And Data Management Online Survey.
© 2009, Forrester research, Inc. reproduction Prohibited July 23, 2009
Mighty Mashups: Do-It-Yourself Business Intelligence For The New Economy For Information & Knowledge Management Professionals
17
4 The average BI project is considerably more complex now than ever. Consequently, BI is a nirvana for professional services firms. Enterprises deploying BI will need help from consultants and systems integrators (SIs) for the foreseeable future. All successful, complete, scalable, “industrial strength” BI solutions require customization, application of best practices, and a significant systems integration effort that is often provided by systems integrators and consulting firms. Because true best practices do not evolve from implementing two or three BI applications, internal resources with dozens of successful BI implementation experiences are difficult to find. A good partner will increase the chances of success for your BI implementation. See the February 12, 2008, “Strong Partners Are Key To Successful BI Initiatives” report.
5 Managing a BI operation is fraught with complexities and potential for suboptimal service levels. The increasing pervasiveness, complexity, and criticality of today’s BI applications have led enterprises to recognize the need for something more formal than a traditional IT support center. Many I&KM professionals institute some form of a BI solutions center (BISC), which is a natural evolution of a BI IT support center. However, many real-world BISCs stumble or drift as they fall prey to a long list of worst practices. See the November 4, 2008, “Implementing Your Business Intelligence Solutions Center” report.
6 The opportunity for BI innovation and differentiation appears at every turn. Forward-looking BI-using companies are evolving their BI strategies to address growing decision support and automation requirements. These emerging requirements include convergence of structured and unstructured content analyses for detecting patterns and running what-if scenarios; a combination of real-time key performance indicators with process awareness for closed-loop workflow optimization; and interactive visualization for ad hoc manipulation of large, complex, multidimensional data sets for predictive analysis. See the October 23, 2007, “It’s Time To Reinvent Your BI Strategy” report.
7 Self-service BI benefits from advanced data visualization. Doing OLAP on millions and even billions of rows of data is one thing, but OLAP on data sets with hundreds or even thousands of dimensions is a different story. No traditional cross-tab report or pivot table can practically regroup, resort, and redisplay aggregates across thousands of dimensions. This is the realm of visual pattern recognition tools, which can flag the meaning of each data element, aggregate, or relationship through visual clues, such as different colors or shapes. See the November 7, 2008, “OLAP: In Fashion Or Old-Fashioned?” report.
8 Lightweight BI mashup composition tools might support unidirectional, visual cut-and-paste mashup of HTML code into Web pages, as well as incorporation of Google Maps and other Internet-accessible Web 2.0 objects. Heavyweight BI mashup composition tools might also support light or heavyweight application development with light coding that is beyond what casual users might do . Web 2.0 support via Ajax, Flash, Silverlight, and other enriched-browser features is essential for full presentation mashup. Most enterprises have not yet used Web 2.0 to anywhere near their potential. In a careful examination of the marketplace and trends for enterprise Web 2.0 tools, Forrester has revealed that organizations find wikis valuable, forums stable (though underutilized), and report mixed success with blogs. Enterprise social networking tools stand ready to redefine workplace collaboration, adding new value to your organization’s content by associating it with peers and experts. See the November 3, 2008, “Forrester TechRadar™ For I&KM Pros: Enterprise Web 2.0 For Collaboration” report.
© 2009, Forrester research, Inc. reproduction ProhibitedJuly 23, 2009
Mighty Mashups: Do-It-Yourself Business Intelligence For The New Economy For Information & Knowledge Management Professionals
18
9 In-memory analytics has the power to transform BI as a client-side experience with tremendous and near-instantaneous response against large data sets. In-memory data models enable all calculations and aggregations to be done at RAM speeds. They require little, if any, design and preparatory work. For example, there are times when analysts need to treat a continuously variable numerical value (like sales price) not as fact, but as a dimension. While conventional OLAP tools make this very difficult, in-memory models from vendors like InetSoft, QlikTech, and TIBCO Spotfire do not require a distinction between facts and dimensions — any element can be instantaneously used in either capacity. See the June 23, 2008,
“BI Workspaces: BI Without Borders” report.
10 When EDW constraints rear their ugly heads, I&KM professionals can turn to an alternate approach — data federation — to provide a logically unified single view to address operational BI requirements. Data federation — sometimes k nown as enterprise information integration (EII), semantic data integration, or data virtualization — may allow some organizations to do without an EDW if they wish. Data federation is an umbrella term for a wide range of operational BI topologies that provide decentralized, on-demand alternatives to the centralized, batch-oriented architectures characteristic of traditional EDW environments. Within an on-demand data federation environment, data delivery usually relies on an EII middleware layer, data persistence involves distributed caches, and data transformation relies on a semantic abstraction layer and registry. Although they are a broad architectural alternative to the EDW, data federation deployments may — and often do — coexist with, extend, virtualize, and enrich EDWs. I&KM professionals should use data federation to provide logically unified on-demand access to EDWs as well as to OLTP data stores, operational data stores (ODSes), independent data marts, and other data-persistence nodes. Furthermore, organizations can use data federation to provide interactive, transactional writeback of updates to operational sources. See the October 2, 2008, “Federation: Sharpen Your Focus On Vast Constellations Of Data” report.

Forrester Research, Inc. (Nasdaq: FORR)
is an independent research company
that provides pragmatic and forward-
thinking advice to global leaders in
business and technology. Forrester
works with professionals in 19 key roles
at major companies providing
proprietary research, consumer insight,
consulting, events, and peer-to-peer
executive programs. For more than 25
years, Forrester has been making IT,
marketing, and technology industry
leaders successful every day. For more
information, visit www.forrester.com.
Australia
Brazil
Canada
Denmark
France
Germany
Hong Kong
India
Israel
Japan
Korea
The Netherlands
Switzerland
United Kingdom
United States
Headquarters
Forrester Research, Inc.
400 Technology Square
Cambridge, MA 02139 USA
Tel: +1 617.613.6000
Fax: +1 617.613.5000
Email: [email protected]
Nasdaq symbol: FORR
www.forrester.com
M a k i n g l e a d e r s S u c c e s s f u l E v e r y D a y
For a complete list of worldwide locations,visit www.forrester.com/about.
Research and Sales Offices
47806
For information on hard-copy or electronic reprints, please contact Client Support
at +1 866.367.7378, +1 617.613.5730, or [email protected].
We offer quantity discounts and special pricing for academic and nonprofit institutions.