Embed Size (px)
Citation preview
A weekly publication of the Agricultural Marketing Service www.ams.usda.gov/GTR
July 12, 2018
Contents
Article/ Calendar
Grain
Transportation Indicators
Rail
Barge
Truck
Exports
Ocean
Brazil
Mexico
Grain Truck/Ocean Rate Advisory
Datasets
Specialists
Subscription Information
--------------
The next release is
July 19, 2018
Preferred citation: U.S. Dept. of Agriculture, Agricultural Marketing Service. Grain Transportation Report. July 12, 2018. Web: http://dx.doi.org/10.9752/TS056.07-12-2018
Grain Transportation Report
WEEKLY HIGHLIGHTS
Grain Inspections Down, but Well Above Average
For the week ending July 5, total inspections of grain (corn, wheat, and soybeans) for export from all major U.S. export regions
reached 2.39 million metric tons (mmt), down 13 percent from the previous week, up 17 percent from last year, and 23 percent above
the 3-year average. Inspections of each of the three major grains receded. Despite the decrease in total inspections, Pacific Northwest
inspections increased 16 percent from week to week. However, Mississippi Gulf inspections decreased 20 percent from the previous
week. During the last four weeks, grain inspections remained well above average, increasing 26 percent from last year and up 34
percent above the three-year average. Outstanding export sales were down for corn, wheat, and soybeans.
Bulk Shipping Getting More Expensive, but Grain Rates Remain Relatively Stable
According to a July 9 report by Amrith Ramkumar of the Wall Street Journal, the Baltic Dry Index (BDI)—which measures
transportation rates in the bulk business—has surged nearly 50 percent since the end of May. This is in response to a push by
companies to move manufacturing materials before levies or any escalating tariffs take effect. The prices for commodities like copper
and iron ore have been sliding, largely due to worries that the escalating tariffs will reduce global demand. However, according to a
report by O’Neil Commodity Consulting, grain rates have not seen any significant increase since the beginning of the year because the
movement in the BDI is not often reflected in the physical rates. Grain rates have fluctuated between 1 to 3 percent since the
beginning of the year. The market is still experiencing excess vessel supply, although the gap between vessel supply and demand is
shrinking.
Grain Barge Tonnages Up for Week Despite High Water Conditions on Upper Mississippi River
For the week ending July 7, corn barge tonnages on the locking portions of the Mississippi, Ohio, and Arkansas rivers were 771
thousand tons, 25 percent higher than last week. Soybean tonnages were 300 thousand tons, 20 percent higher than last week. The
increases occurred despite high water conditions on the Upper Mississippi River. Weekly wheat barge tonnages have been increasing
for four weeks, mostly from wheat shipments originating on the Ohio and Arkansas rivers. Ohio River shippers can expect delays,
beginning with the week of July 8, when on-going repair work at Locks and Dam 52 will disrupt traffic.
Tentative Labor Agreement Reached at the Port of New York and New Jersey
The International Longshoremen’s Association (ILA) and the New York Shipping Association (NYSA) announced they have reached
a tentative agreement, on a six-year Local Contract for the Port of New York and New Jersey. The agreement is subject to ratification
by ILA members and by the NYSA membership. In June, the ILA and the U.S. Maritime Alliance (USMX) reached a tentative
agreement on the Master Contract which applies to nearly all container ports, from Maine to Texas. Local port agreements, such as the
one with the Port of New York and New Jersey, are the next step in the process. East Coast ports moved 30 percent of U.S.
containerized grain exports in 2017.
Snapshots by Sector
Export Sales
For the week ending June 28, unshipped balances of wheat, corn, and soybeans totaled 24.8 mmt, up 20 percent from the same time
last year. Net weekly wheat export sales were .440 mmt, down 22 percent from the previous week. Net corn export sales were .441
mmt, down 48 percent from the previous week. Net soybean export sales were .482 mmt, up 35 percent from the previous week.
Rail
U.S. Class I railroads originated 23,433 grain carloads for the week ending June 30, down 3 percent from the previous week,
unchanged from last year, and up 7 percent from the 3-year average.
Average July shuttle secondary railcar bids/offers, per car, were $375 above tariff for the week ending July 5, down $79 from last
week, and $627 higher than last year. There were no non-shuttle bids/offers this week.
Barge For the week ending July 7, barge grain movements totaled 1,157,006 tons, 25 percent higher than the previous week and up 45
percent from the same period last year.
For the week ending July 7, 740 grain barges moved down river, 152 barges more than the previous week. There were 710 grain
barges unloaded in New Orleans, 10 percent lower than the previous week.
Ocean
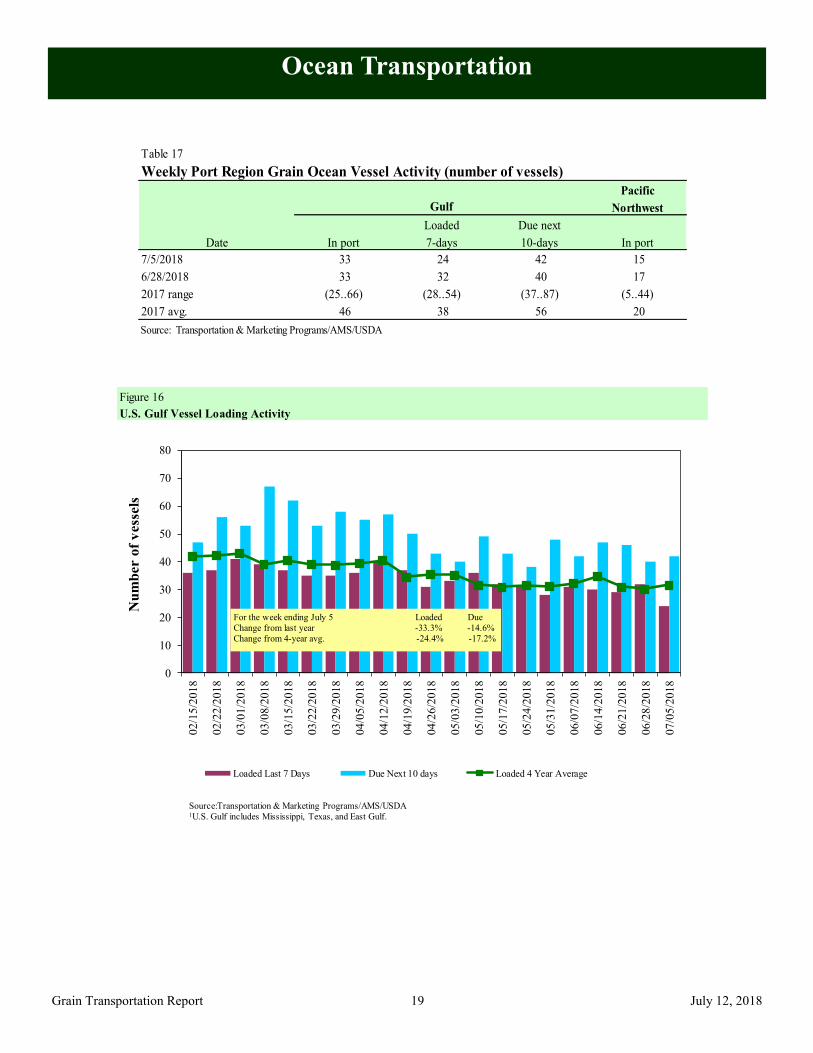
For the week ending July 5, 24 ocean-going grain vessels were loaded in the Gulf, 33 percent less than the same period last year.
Forty-two vessels are expected to be loaded within the next 10 days, 15 percent less than the same period last year.
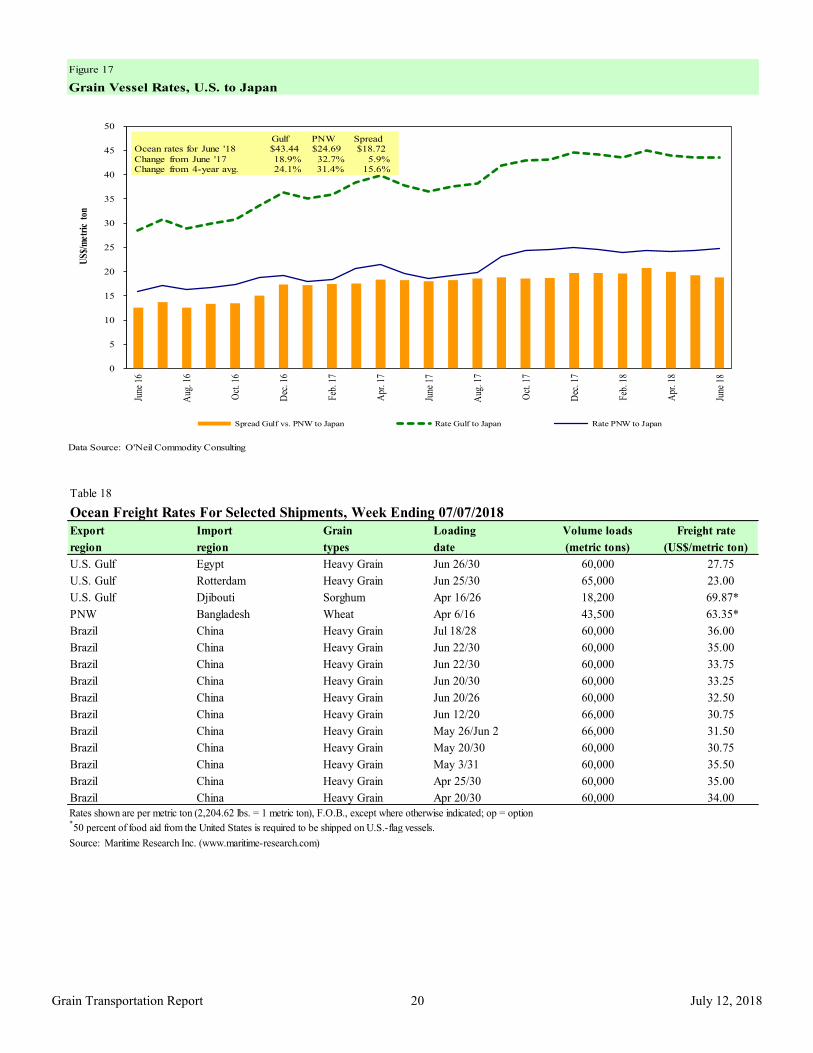
For the week ending July 5, the ocean freight rate for shipping bulk grain from the Gulf to Japan was $43.50 per metric ton, 1 percent
more than the previous week. The cost of shipping from the PNW to Japan was $24.75 per metric ton, 1 percent more than the
previous week.
Fuel
For the week ending July 9, the U.S. average diesel fuel price remained unchanged from the previous week at $3.24 per gallon, 76
cents higher than the same week last year.
Contact Us
July 12, 2018
Grain Transportation Report 2
Feature Article/Calendar
Second Quarter Grain Inspections Reach Record High
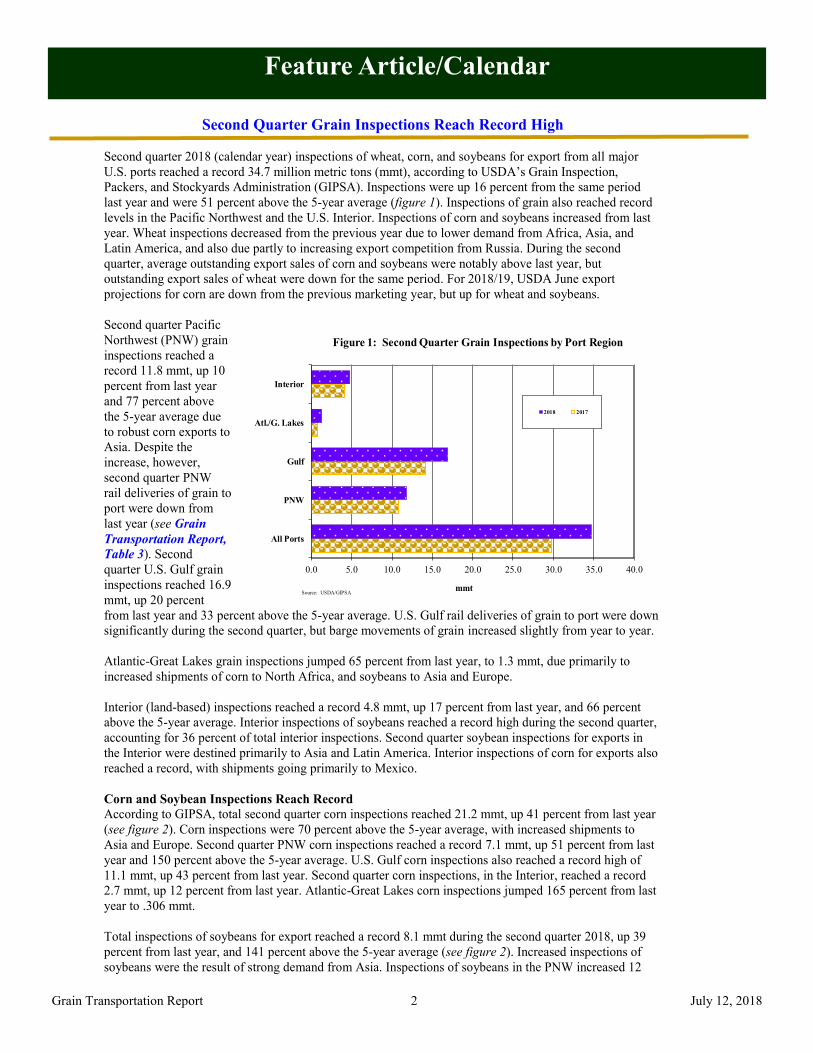
Second quarter 2018 (calendar year) inspections of wheat, corn, and soybeans for export from all major
U.S. ports reached a record 34.7 million metric tons (mmt), according to USDA’s Grain Inspection,
Packers, and Stockyards Administration (GIPSA). Inspections were up 16 percent from the same period
last year and were 51 percent above the 5-year average (figure 1). Inspections of grain also reached record
levels in the Pacific Northwest and the U.S. Interior. Inspections of corn and soybeans increased from last
year. Wheat inspections decreased from the previous year due to lower demand from Africa, Asia, and
Latin America, and also due partly to increasing export competition from Russia. During the second
quarter, average outstanding export sales of corn and soybeans were notably above last year, but
outstanding export sales of wheat were down for the same period. For 2018/19, USDA June export
projections for corn are down from the previous marketing year, but up for wheat and soybeans.
Second quarter Pacific
Northwest (PNW) grain
inspections reached a
record 11.8 mmt, up 10
percent from last year
and 77 percent above
the 5-year average due
to robust corn exports to
Asia. Despite the
increase, however,
second quarter PNW
rail deliveries of grain to
port were down from
last year (see Grain
Transportation Report,
Table 3). Second
quarter U.S. Gulf grain
inspections reached 16.9
mmt, up 20 percent
from last year and 33 percent above the 5-year average. U.S. Gulf rail deliveries of grain to port were down
significantly during the second quarter, but barge movements of grain increased slightly from year to year.
Atlantic-Great Lakes grain inspections jumped 65 percent from last year, to 1.3 mmt, due primarily to
increased shipments of corn to North Africa, and soybeans to Asia and Europe.
Interior (land-based) inspections reached a record 4.8 mmt, up 17 percent from last year, and 66 percent
above the 5-year average. Interior inspections of soybeans reached a record high during the second quarter,
accounting for 36 percent of total interior inspections. Second quarter soybean inspections for exports in
the Interior were destined primarily to Asia and Latin America. Interior inspections of corn for exports also
reached a record, with shipments going primarily to Mexico.
Corn and Soybean Inspections Reach Record
According to GIPSA, total second quarter corn inspections reached 21.2 mmt, up 41 percent from last year
(see figure 2). Corn inspections were 70 percent above the 5-year average, with increased shipments to
Asia and Europe. Second quarter PNW corn inspections reached a record 7.1 mmt, up 51 percent from last
year and 150 percent above the 5-year average. U.S. Gulf corn inspections also reached a record high of
11.1 mmt, up 43 percent from last year. Second quarter corn inspections, in the Interior, reached a record
2.7 mmt, up 12 percent from last year. Atlantic-Great Lakes corn inspections jumped 165 percent from last
year to .306 mmt.
Total inspections of soybeans for export reached a record 8.1 mmt during the second quarter 2018, up 39
percent from last year, and 141 percent above the 5-year average (see figure 2). Increased inspections of
soybeans were the result of strong demand from Asia. Inspections of soybeans in the PNW increased 12
0.0 5.0 10.0 15.0 20.0 25.0 30.0 35.0 40.0
All Ports
PNW
Gulf
Atl./G. Lakes
Interior
mmt
Figure 1: Second Quarter Grain Inspections by Port Region
2018 2017
Source: USDA/GIPSA
July 12, 2018
Grain Transportation Report 3
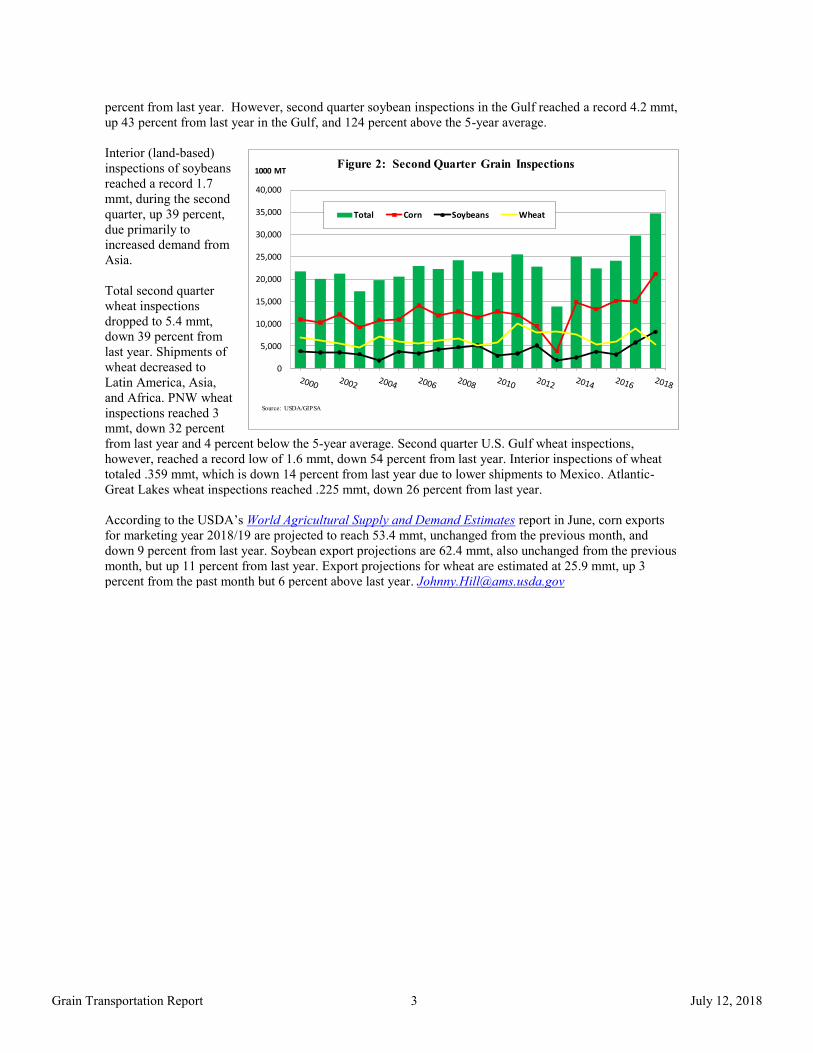
percent from last year. However, second quarter soybean inspections in the Gulf reached a record 4.2 mmt,
up 43 percent from last year in the Gulf, and 124 percent above the 5-year average.
Interior (land-based)
inspections of soybeans
reached a record 1.7
mmt, during the second
quarter, up 39 percent,
due primarily to
increased demand from
Asia.
Total second quarter
wheat inspections
dropped to 5.4 mmt,
down 39 percent from
last year. Shipments of
wheat decreased to
Latin America, Asia,
and Africa. PNW wheat
inspections reached 3
mmt, down 32 percent
from last year and 4 percent below the 5-year average. Second quarter U.S. Gulf wheat inspections,
however, reached a record low of 1.6 mmt, down 54 percent from last year. Interior inspections of wheat
totaled .359 mmt, which is down 14 percent from last year due to lower shipments to Mexico. Atlantic-
Great Lakes wheat inspections reached .225 mmt, down 26 percent from last year.
According to the USDA’s World Agricultural Supply and Demand Estimates report in June, corn exports
for marketing year 2018/19 are projected to reach 53.4 mmt, unchanged from the previous month, and
down 9 percent from last year. Soybean export projections are 62.4 mmt, also unchanged from the previous
month, but up 11 percent from last year. Export projections for wheat are estimated at 25.9 mmt, up 3
percent from the past month but 6 percent above last year. [email protected]
0
5,000
10,000
15,000
20,000
25,000
30,000
35,000
40,000
1000 MTFigure 2: Second Quarter Grain Inspections
Total Corn Soybeans Wheat
Source: USDA/GIPSA
July 12, 2018
Grain Transportation Report 4
Grain Transportation Indicators
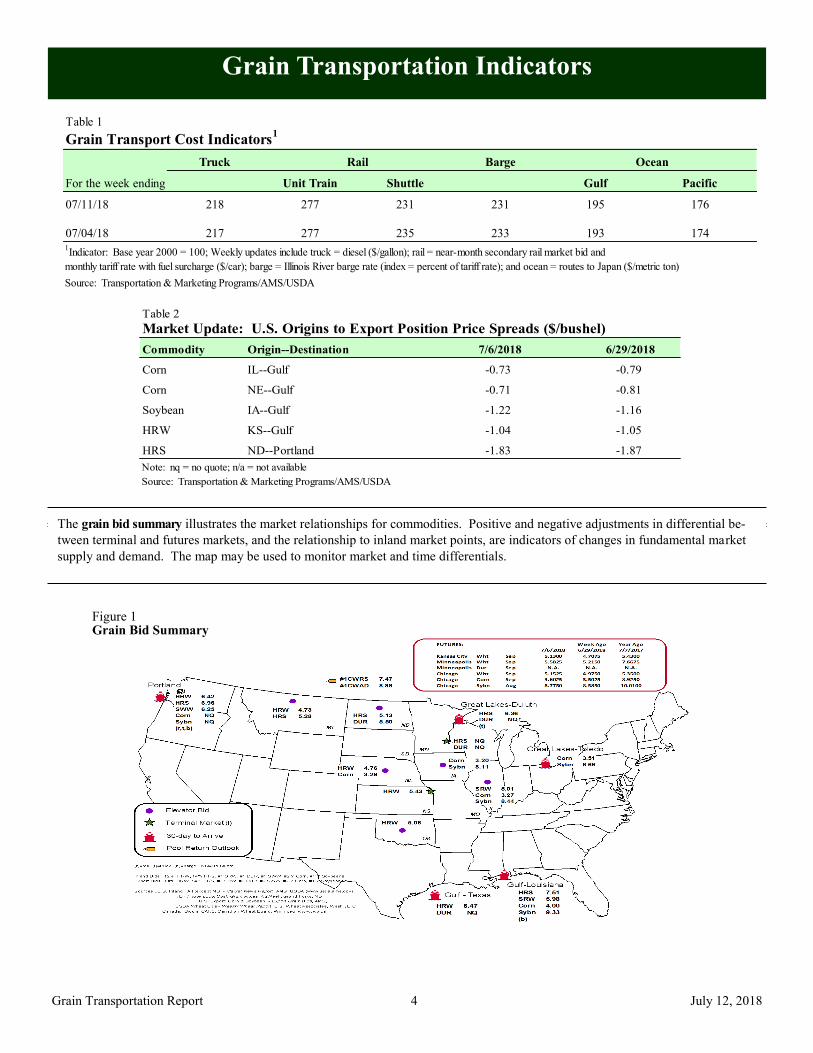
The grain bid summary illustrates the market relationships for commodities. Positive and negative adjustments in differential be-
tween terminal and futures markets, and the relationship to inland market points, are indicators of changes in fundamental market
supply and demand. The map may be used to monitor market and time differentials.
Table 2
Market Update: U.S. Origins to Export Position Price Spreads ($/bushel)
Commodity Origin--Destination 7/6/2018 6/29/2018
Corn IL--Gulf -0.73 -0.79
Corn NE--Gulf -0.71 -0.81
Soybean IA--Gulf -1.22 -1.16
HRW KS--Gulf -1.04 -1.05
HRS ND--Portland -1.83 -1.87
Note: nq = no quote; n/a = not available
Source: Transportation & Marketing Programs/AMS/USDA
Table 1
Grain Transport Cost Indicators1
Truck Barge Ocean
For the week ending Unit Train Shuttle Gulf Pacific
07/11/18 218 277 231 231 195 1760 % # DIV/0 ! -1% 1% 1%
07/04/18 217 277 235 233 193 174
Source: Transportation & Marketing Programs/AMS/USDA
Rail
1Indicator: Base year 2000 = 100; Weekly updates include truck = diesel ($/gallon); rail = near-month secondary rail market bid and
monthly tariff rate with fuel surcharge ($/car); barge = Illinois River barge rate (index = percent of tariff rate); and ocean = routes to Japan ($/metric ton)
Figure 1 Grain Bid Summary
July 12, 2018
Grain Transportation Report 5
Rail Transportation
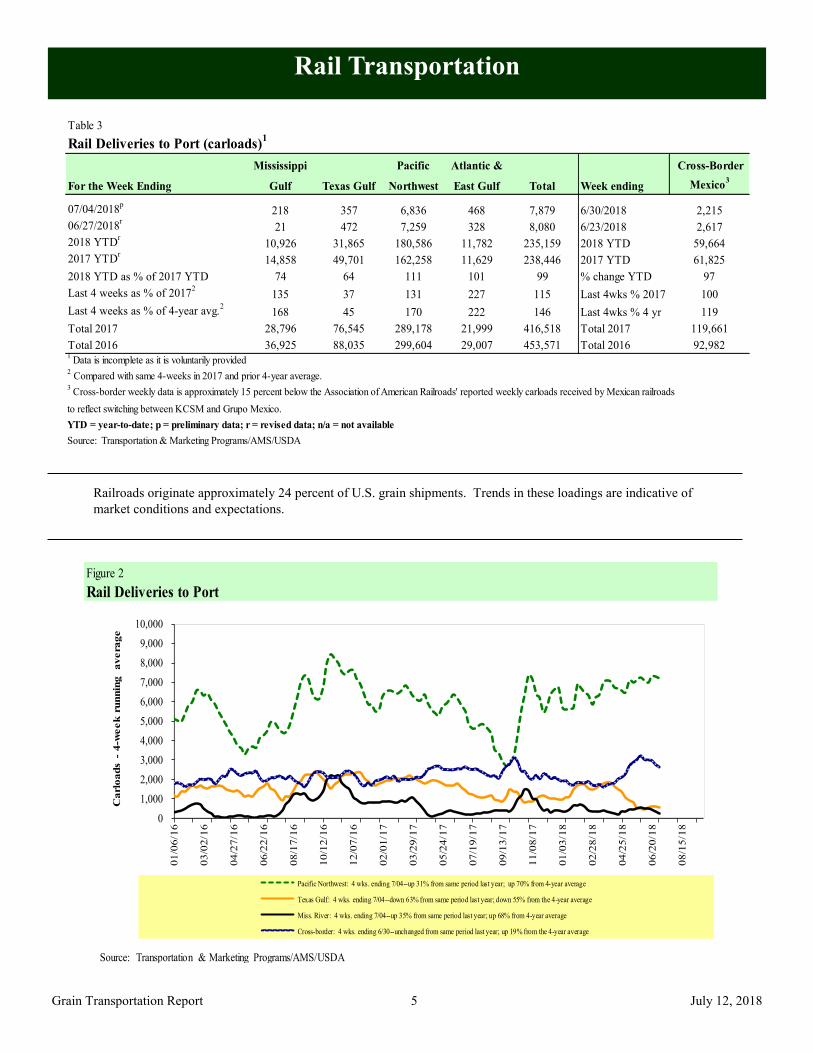
Railroads originate approximately 24 percent of U.S. grain shipments. Trends in these loadings are indicative of
market conditions and expectations.
Figure 2
Rail Deliveries to Port
0
1,000
2,000
3,000
4,000
5,000
6,000
7,000
8,000
9,000
10,000
01
/06
/16
03
/02
/16
04
/27
/16
06/2
2/1
6
08/1
7/1
6
10
/12
/16
12
/07
/16
02
/01
/17
03
/29
/17
05
/24
/17
07/1
9/1
7
09/1
3/1
7
11/0
8/1
7
01
/03
/18
02
/28
/18
04
/25
/18
06
/20
/18
08
/15
/18
Ca
rlo
ad
s -
4-w
eek
ru
nn
ing
a
vera
ge
Pacific Northwest: 4 wks. ending 7/04--up 31% from same period last year; up 70% from 4-year average
Texas Gulf: 4 wks. ending 7/04--down 63% from same period last year; down 55% from the 4-year average
Miss. River: 4 wks. ending 7/04--up 35% from same period last year; up 68% from 4-year average
Cross-border: 4 wks. ending 6/30--unchanged from same period last year; up 19% from the 4-year average
Source: Transportation & Marketing Programs/AMS/USDA
Table 3
Rail Deliveries to Port (carloads)1
Mississippi Pacific Atlantic & Cross-Border
For the Week Ending Gulf Texas Gulf Northwest East Gulf Total Week ending Mexico3
07/04/2018p
218 357 6,836 468 7,879 6/30/2018 2,215
06/27/2018r
21 472 7,259 328 8,080 6/23/2018 2,617
2018 YTDr
10,926 31,865 180,586 11,782 235,159 2018 YTD 59,664
2017 YTDr
14,858 49,701 162,258 11,629 238,446 2017 YTD 61,825
2018 YTD as % of 2017 YTD 74 64 111 101 99 % change YTD 97
Last 4 weeks as % of 20172
135 37 131 227 115 Last 4wks % 2017 100
Last 4 weeks as % of 4-year avg.2
168 45 170 222 146 Last 4wks % 4 yr 119
Total 2017 28,796 76,545 289,178 21,999 416,518 Total 2017 119,661
Total 2016 36,925 88,035 299,604 29,007 453,571 Total 2016 92,9821
Data is incomplete as it is voluntarily provided2 Compared with same 4-weeks in 2017 and prior 4-year average.
3 Cross-border weekly data is approximately 15 percent below the Association of American Railroads' reported weekly carloads received by Mexican railroads
to reflect switching between KCSM and Grupo Mexico.
YTD = year-to-date; p = preliminary data; r = revised data; n/a = not available
Source: Transportation & Marketing Programs/AMS/USDA
July 12, 2018
Grain Transportation Report 6
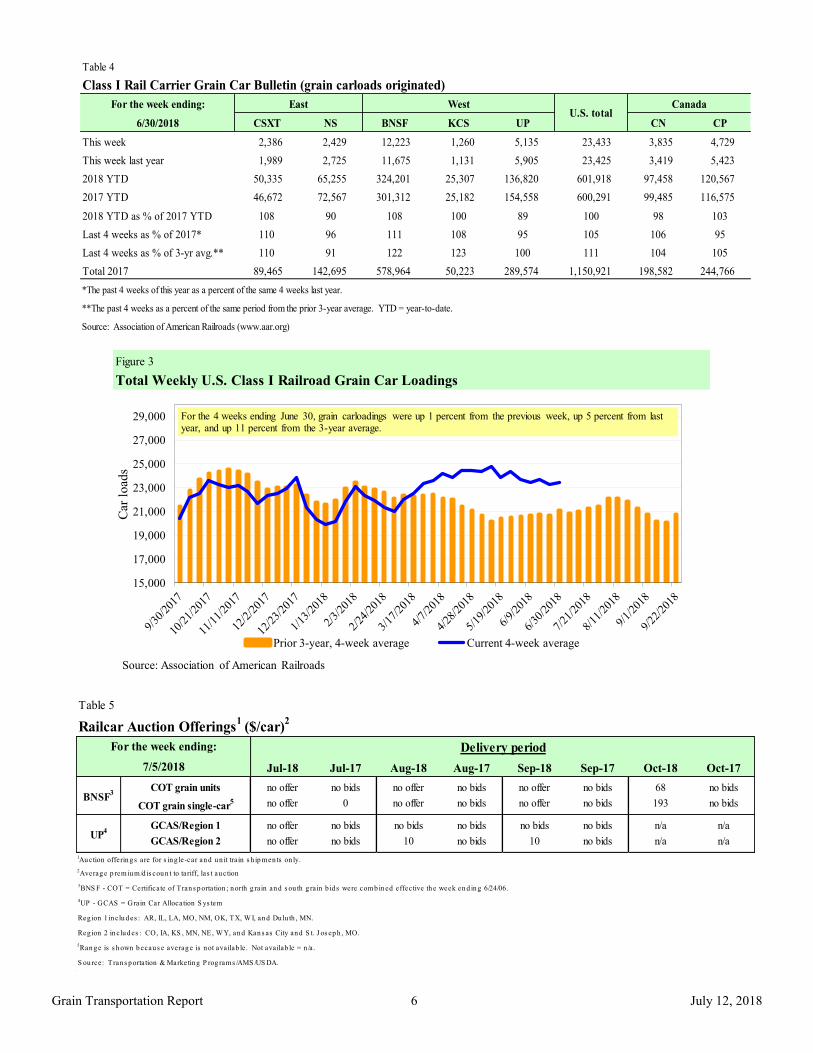
Table 4
Class I Rail Carrier Grain Car Bulletin (grain carloads originated)
For the week ending:
6/30/2018 CSXT NS BNSF KCS UP CN CP
This week 2,386 2,429 12,223 1,260 5,135 23,433 3,835 4,729
This week last year 1,989 2,725 11,675 1,131 5,905 23,425 3,419 5,423
2018 YTD 50,335 65,255 324,201 25,307 136,820 601,918 97,458 120,567
2017 YTD 46,672 72,567 301,312 25,182 154,558 600,291 99,485 116,575
2018 YTD as % of 2017 YTD 108 90 108 100 89 100 98 103
Last 4 weeks as % of 2017* 110 96 111 108 95 105 106 95
Last 4 weeks as % of 3-yr avg.** 110 91 122 123 100 111 104 105
Total 2017 89,465 142,695 578,964 50,223 289,574 1,150,921 198,582 244,766
*The past 4 weeks of this year as a percent of the same 4 weeks last year.
**The past 4 weeks as a percent of the same period from the prior 3-year average. YTD = year-to-date.
Source: Association of American Railroads (www.aar.org)
East WestU.S. total
Canada
Table 5
Railcar Auction Offerings1
($/car)2
Jul-18 Jul-17 Aug-18 Aug-17 Sep-18 Sep-17 Oct-18 Oct-17
COT grain units no offer no bids no offer no bids no offer no bids 68 no bids
COT grain single-car5 no offer 0 no offer no bids no offer no bids 193 no bids
GCAS/Region 1 no offer no bids no bids no bids no bids no bids n/a n/a
GCAS/Region 2 no offer no bids 10 no bids 10 no bids n/a n/a
1Au ction offerin g s are for s in g le-car an d u n it train s h ip m en ts on ly.
2Averag e p rem iu m /d is cou n t to tariff, las t au ction
3BNS F - COT = Certificate of Tran s p ortation ; n orth g rain an d s ou th g rain b id s were com b in ed effective th e week en d in g 6/24/06.
4UP - GCAS = Grain Car Allocation S ys tem
Reg ion 1 in clu d es : AR, IL, LA, MO, NM, OK, TX, W I, an d Du lu th , MN.
Reg ion 2 in clu d es : CO, IA, KS , MN, NE, W Y, an d Kan s as City an d S t. J os ep h , MO.
5Ran g e is s h own b ecau s e averag e is n ot availab le . Not availab le = n /a .
S ou rce: Tran s p ortation & Marketin g P rog ram s /AMS /US DA.
UP4
Delivery period
BNSF3
For the week ending:
7/5/2018
Figure 3
Total Weekly U.S. Class I Railroad Grain Car Loadings
15,000
17,000
19,000
21,000
23,000
25,000
27,000
29,000
Car
loads
Prior 3-year, 4-week average Current 4-week average
For the 4 weeks ending June 30, grain carloadings were up 1 percent from the previous week, up 5 percent from last year, and up 11 percent from the 3-year average.
Source: Association of American Railroads
July 12, 2018
Grain Transportation Report 7
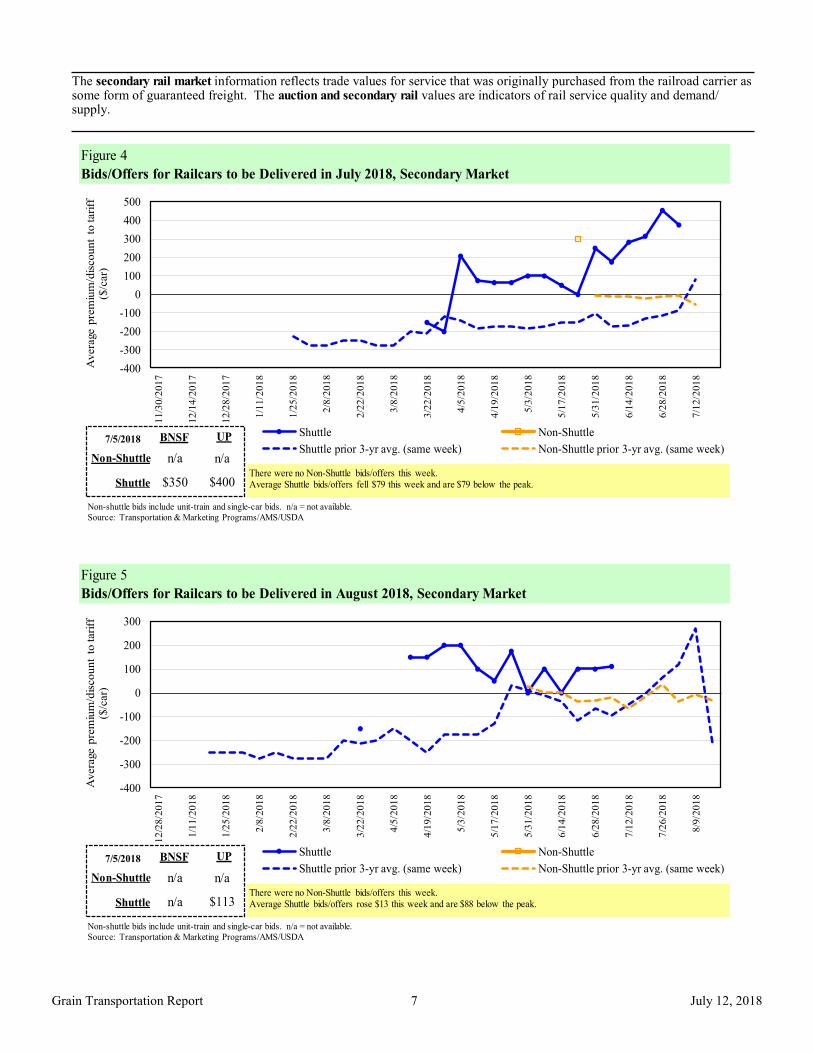
The secondary rail market information reflects trade values for service that was originally purchased from the railroad carrier as some form of guaranteed freight. The auction and secondary rail values are indicators of rail service quality and demand/supply.
Figure 4
Bids/Offers for Railcars to be Delivered in July 2018, Secondary Market
-400
-300
-200
-100
0
100
200
300
400
500
11/3
0/2
01
7
12/1
4/2
017
12/2
8/2
01
7
1/1
1/2
018
1/2
5/2
018
2/8
/20
18
2/2
2/2
018
3/8
/20
18
3/2
2/2
018
4/5
/20
18
4/1
9/2
018
5/3
/20
18
5/1
7/2
018
5/3
1/2
01
8
6/1
4/2
018
6/2
8/2
01
8
7/1
2/2
018
Av
era
ge p
rem
ium
/dis
co
un
t to
tari
ff
($/c
ar)
Shuttle Non-Shuttle
Shuttle prior 3-yr avg. (same week) Non-Shuttle prior 3-yr avg. (same week)7/5/2018
Non-shuttle bids include unit-train and single-car bids. n/a = not available.
Source: Transportation & Marketing Programs/AMS/USDA
n/a
UPBNSF
$350
n/a
$400Shuttle
Non-Shuttle
There were no Non-Shuttle bids/offers this week.Average Shuttle bids/offers fell $79 this week and are $79 below the peak.
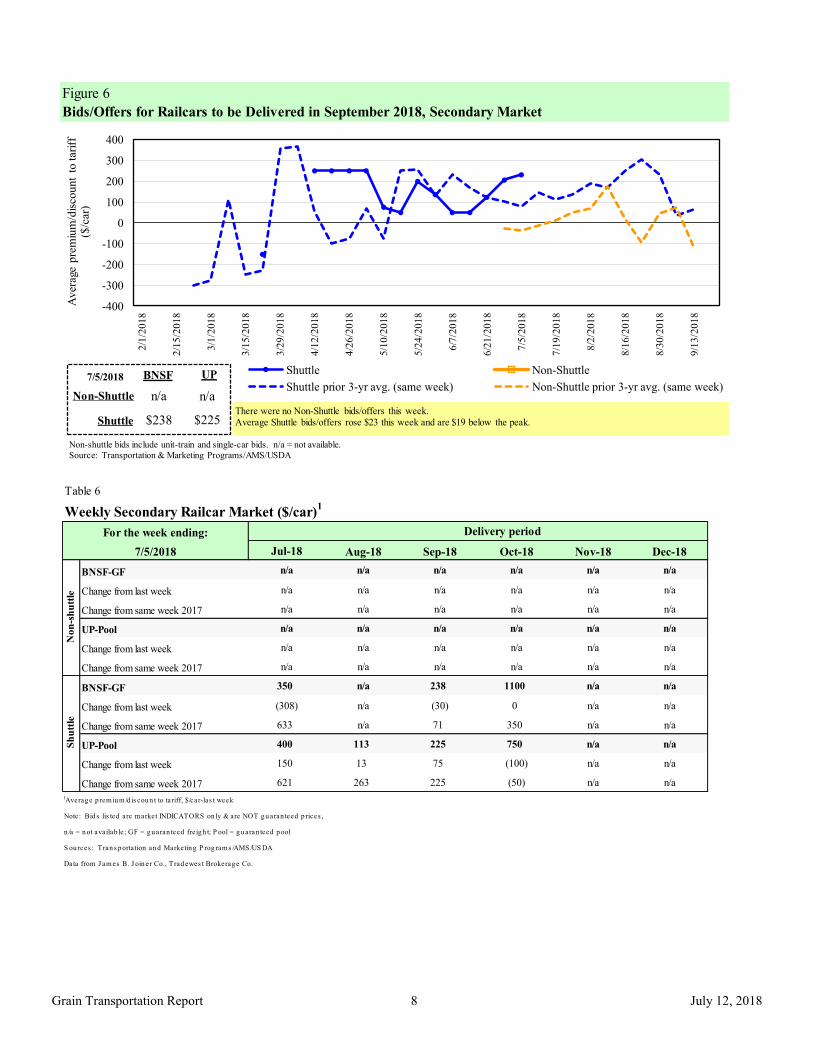
Figure 5
Bids/Offers for Railcars to be Delivered in August 2018, Secondary Market
-400
-300
-200
-100
0
100
200
300
12/2
8/2
01
7
1/1
1/2
018
1/2
5/2
01
8
2/8
/20
18
2/2
2/2
018
3/8
/20
18
3/2
2/2
018
4/5
/20
18
4/1
9/2
018
5/3
/20
18
5/1
7/2
018
5/3
1/2
01
8
6/1
4/2
018
6/2
8/2
01
8
7/1
2/2
018
7/2
6/2
01
8
8/9
/20
18
Av
era
ge p
rem
ium
/dis
co
un
t to
tari
ff
($/c
ar)
Shuttle Non-Shuttle
Shuttle prior 3-yr avg. (same week) Non-Shuttle prior 3-yr avg. (same week)7/5/2018
Non-shuttle bids include unit-train and single-car bids. n/a = not available.
Source: Transportation & Marketing Programs/AMS/USDA
n/a
UPBNSF
n/a
n/a
$113Shuttle
Non-Shuttle
There were no Non-Shuttle bids/offers this week.Average Shuttle bids/offers rose $13 this week and are $88 below the peak.
July 12, 2018
Grain Transportation Report 8
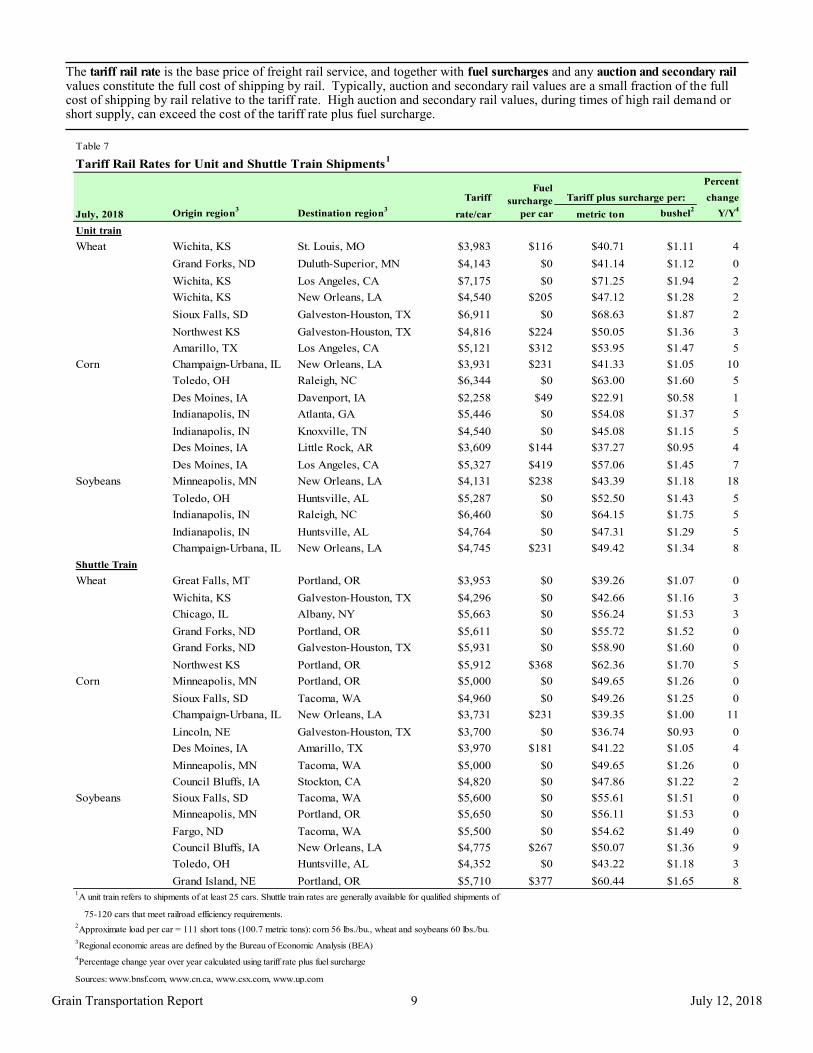
Figure 6
Bids/Offers for Railcars to be Delivered in September 2018, Secondary Market
-400
-300
-200
-100
0
100
200
300
4002
/1/2
01
8
2/1
5/2
01
8
3/1
/201
8
3/1
5/2
01
8
3/2
9/2
01
8
4/1
2/2
01
8
4/2
6/2
01
8
5/1
0/2
01
8
5/2
4/2
01
8
6/7
/2018
6/2
1/2
01
8
7/5
/201
8
7/1
9/2
01
8
8/2
/201
8
8/1
6/2
01
8
8/3
0/2
01
8
9/1
3/2
01
8
Aver
age
pre
miu
m/d
isco
unt
to tar
iff
($/c
ar)
Shuttle Non-Shuttle
Shuttle prior 3-yr avg. (same week) Non-Shuttle prior 3-yr avg. (same week)7/5/2018
Non-shuttle bids include unit-train and single-car bids. n/a = not available.
Source: Transportation & Marketing Programs/AMS/USDA
n/a
UPBNSF
$238
n/a
$225Shuttle
Non-Shuttle
There were no Non-Shuttle bids/offers this week.Average Shuttle bids/offers rose $23 this week and are $19 below the peak.
Table 6
Weekly Secondary Railcar Market ($/car)1
Jul-18 Aug-18 Sep-18 Oct-18 Nov-18 Dec-18
BNSF-GF n/a n/a n/a n/a n/a n/a
Change from last week n/a n/a n/a n/a n/a n/a
Change from same week 2017 n/a n/a n/a n/a n/a n/a
UP-Pool n/a n/a n/a n/a n/a n/a
Change from last week n/a n/a n/a n/a n/a n/a
Change from same week 2017 n/a n/a n/a n/a n/a n/a
BNSF-GF 350 n/a 238 1100 n/a n/a
Change from last week (308) n/a (30) 0 n/a n/a
Change from same week 2017 633 n/a 71 350 n/a n/a
UP-Pool 400 113 225 750 n/a n/a
Change from last week 150 13 75 (100) n/a n/a
Change from same week 2017 621 263 225 (50) n/a n/a
1Averag e p rem iu m /d is cou n t to tariff, $/car-las t week
Note: Bid s lis ted are m arket INDICATORS on ly & are NOT g u aran teed p rices ,
n /a = n ot availab le; GF = g u aran teed freig h t; P ool = g u aran teed p ool
S ou rces : Tran s p ortation an d Marketin g P rog ram s /AMS /US DA
Data from J am es B. J oin er Co., Trad ewes t Brokerag e Co.
Non
-sh
utt
le
For the week ending:
7/5/2018
Sh
utt
le
Delivery period
July 12, 2018
Grain Transportation Report 9
The tariff rail rate is the base price of freight rail service, and together with fuel surcharges and any auction and secondary rail values constitute the full cost of shipping by rail. Typically, auction and secondary rail values are a small fraction of the full cost of shipping by rail relative to the tariff rate. High auction and secondary rail values, during times of high rail demand or short supply, can exceed the cost of the tariff rate plus fuel surcharge.
Table 7
Tariff Rail Rates for Unit and Shuttle Train Shipments1
Percent
Tariff change
July, 2018 Origin region3
Destination region3
rate/car metric ton bushel2
Y/Y4
Unit train
Wheat Wichita, KS St. Louis, MO $3,983 $116 $40.71 $1.11 4
Grand Forks, ND Duluth-Superior, MN $4,143 $0 $41.14 $1.12 0
Wichita, KS Los Angeles, CA $7,175 $0 $71.25 $1.94 2
Wichita, KS New Orleans, LA $4,540 $205 $47.12 $1.28 2
Sioux Falls, SD Galveston-Houston, TX $6,911 $0 $68.63 $1.87 2
Northwest KS Galveston-Houston, TX $4,816 $224 $50.05 $1.36 3
Amarillo, TX Los Angeles, CA $5,121 $312 $53.95 $1.47 5
Corn Champaign-Urbana, IL New Orleans, LA $3,931 $231 $41.33 $1.05 10
Toledo, OH Raleigh, NC $6,344 $0 $63.00 $1.60 5
Des Moines, IA Davenport, IA $2,258 $49 $22.91 $0.58 1
Indianapolis, IN Atlanta, GA $5,446 $0 $54.08 $1.37 5
Indianapolis, IN Knoxville, TN $4,540 $0 $45.08 $1.15 5
Des Moines, IA Little Rock, AR $3,609 $144 $37.27 $0.95 4
Des Moines, IA Los Angeles, CA $5,327 $419 $57.06 $1.45 7
Soybeans Minneapolis, MN New Orleans, LA $4,131 $238 $43.39 $1.18 18
Toledo, OH Huntsville, AL $5,287 $0 $52.50 $1.43 5
Indianapolis, IN Raleigh, NC $6,460 $0 $64.15 $1.75 5
Indianapolis, IN Huntsville, AL $4,764 $0 $47.31 $1.29 5
Champaign-Urbana, IL New Orleans, LA $4,745 $231 $49.42 $1.34 8
Shuttle Train
Wheat Great Falls, MT Portland, OR $3,953 $0 $39.26 $1.07 0
Wichita, KS Galveston-Houston, TX $4,296 $0 $42.66 $1.16 3
Chicago, IL Albany, NY $5,663 $0 $56.24 $1.53 3
Grand Forks, ND Portland, OR $5,611 $0 $55.72 $1.52 0
Grand Forks, ND Galveston-Houston, TX $5,931 $0 $58.90 $1.60 0
Northwest KS Portland, OR $5,912 $368 $62.36 $1.70 5
Corn Minneapolis, MN Portland, OR $5,000 $0 $49.65 $1.26 0
Sioux Falls, SD Tacoma, WA $4,960 $0 $49.26 $1.25 0
Champaign-Urbana, IL New Orleans, LA $3,731 $231 $39.35 $1.00 11
Lincoln, NE Galveston-Houston, TX $3,700 $0 $36.74 $0.93 0
Des Moines, IA Amarillo, TX $3,970 $181 $41.22 $1.05 4
Minneapolis, MN Tacoma, WA $5,000 $0 $49.65 $1.26 0
Council Bluffs, IA Stockton, CA $4,820 $0 $47.86 $1.22 2
Soybeans Sioux Falls, SD Tacoma, WA $5,600 $0 $55.61 $1.51 0
Minneapolis, MN Portland, OR $5,650 $0 $56.11 $1.53 0
Fargo, ND Tacoma, WA $5,500 $0 $54.62 $1.49 0
Council Bluffs, IA New Orleans, LA $4,775 $267 $50.07 $1.36 9
Toledo, OH Huntsville, AL $4,352 $0 $43.22 $1.18 3
Grand Island, NE Portland, OR $5,710 $377 $60.44 $1.65 81A unit train refers to shipments of at least 25 cars. Shuttle train rates are generally available for qualified shipments of
75-120 cars that meet railroad efficiency requirements.
2Approximate load per car = 111 short tons (100.7 metric tons): corn 56 lbs./bu., wheat and soybeans 60 lbs./bu.
3Regional economic areas are defined by the Bureau of Economic Analysis (BEA)
4Percentage change year over year calculated using tariff rate plus fuel surcharge
Sources: www.bnsf.com, www.cn.ca, www.csx.com, www.up.com
Tariff plus surcharge per:Fuel
surcharge
per car
July 12, 2018
Grain Transportation Report 10
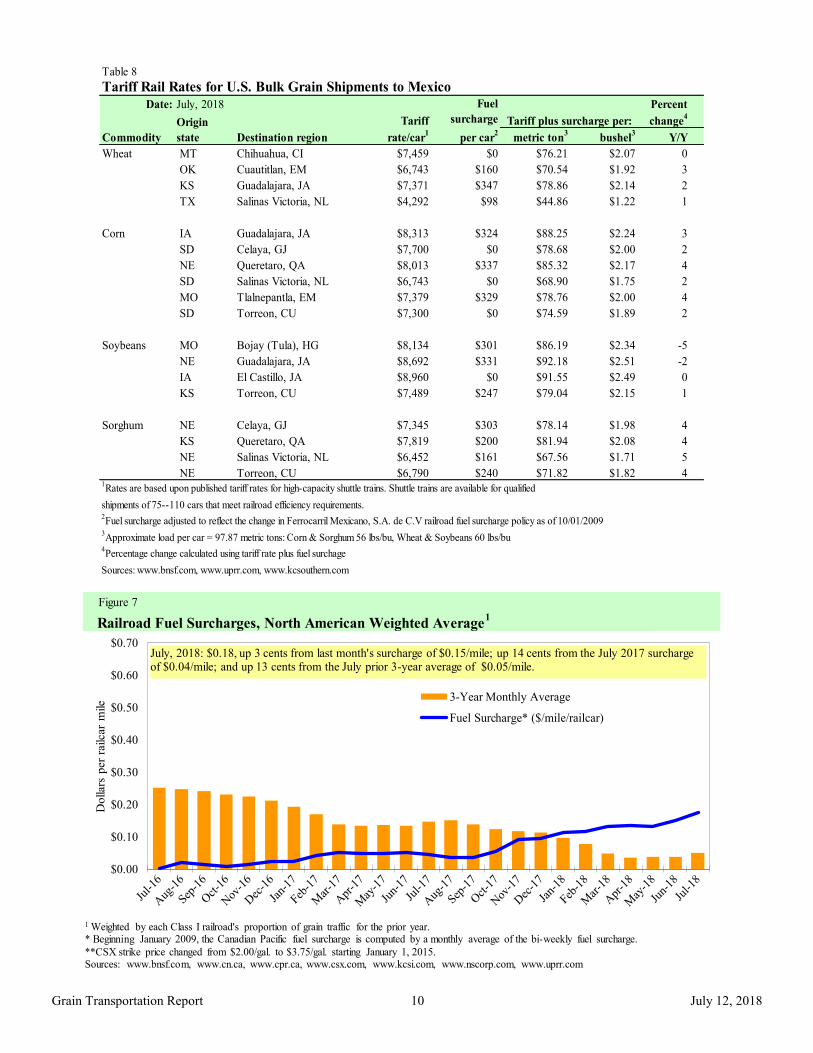
Figure 7
Railroad Fuel Surcharges, North American Weighted Average1
$0.00
$0.10
$0.20
$0.30
$0.40
$0.50
$0.60
$0.70
Dolla
rs p
er r
ailc
ar m
ile
3-Year Monthly Average
Fuel Surcharge* ($/mile/railcar)
July, 2018: $0.18, up 3 cents from last month's surcharge of $0.15/mile; up 14 cents from the July 2017 surcharge of $0.04/mile; and up 13 cents from the July prior 3-year average of $0.05/mile.
1 Weighted by each Class I railroad's proportion of grain traffic for the prior year. * Beginning January 2009, the Canadian Pacific fuel surcharge is computed by a monthly average of the bi-weekly fuel surcharge.
**CSX strike price changed from $2.00/gal. to $3.75/gal. starting January 1, 2015.Sources: www.bnsf.com, www.cn.ca, www.cpr.ca, www.csx.com, www.kcsi.com, www.nscorp.com, www.uprr.com
Table 8
Tariff Rail Rates for U.S. Bulk Grain Shipments to Mexico
Date: Percent
Tariff change4
Commodity Destination region rate/car1
metric ton3
bushel3
Y/Y
Wheat MT Chihuahua, CI $7,459 $0 $76.21 $2.07 0
OK Cuautitlan, EM $6,743 $160 $70.54 $1.92 3
KS Guadalajara, JA $7,371 $347 $78.86 $2.14 2
TX Salinas Victoria, NL $4,292 $98 $44.86 $1.22 1
Corn IA Guadalajara, JA $8,313 $324 $88.25 $2.24 3
SD Celaya, GJ $7,700 $0 $78.68 $2.00 2
NE Queretaro, QA $8,013 $337 $85.32 $2.17 4
SD Salinas Victoria, NL $6,743 $0 $68.90 $1.75 2
MO Tlalnepantla, EM $7,379 $329 $78.76 $2.00 4
SD Torreon, CU $7,300 $0 $74.59 $1.89 2
Soybeans MO Bojay (Tula), HG $8,134 $301 $86.19 $2.34 -5
NE Guadalajara, JA $8,692 $331 $92.18 $2.51 -2
IA El Castillo, JA $8,960 $0 $91.55 $2.49 0
KS Torreon, CU $7,489 $247 $79.04 $2.15 1
Sorghum NE Celaya, GJ $7,345 $303 $78.14 $1.98 4
KS Queretaro, QA $7,819 $200 $81.94 $2.08 4
NE Salinas Victoria, NL $6,452 $161 $67.56 $1.71 5
NE Torreon, CU $6,790 $240 $71.82 $1.82 41Rates are based upon published tariff rates for high-capacity shuttle trains. Shuttle trains are available for qualified
shipments of 75--110 cars that meet railroad efficiency requirements.2Fuel surcharge adjusted to reflect the change in Ferrocarril Mexicano, S.A. de C.V railroad fuel surcharge policy as of 10/01/2009
3Approximate load per car = 97.87 metric tons: Corn & Sorghum 56 lbs/bu, Wheat & Soybeans 60 lbs/bu
4Percentage change calculated using tariff rate plus fuel surchage
Sources: www.bnsf.com, www.uprr.com, www.kcsouthern.com
Fuel
surcharge
per car2
Tariff plus surcharge per:Origin
state
July, 2018
July 12, 2018
Grain Transportation Report 11
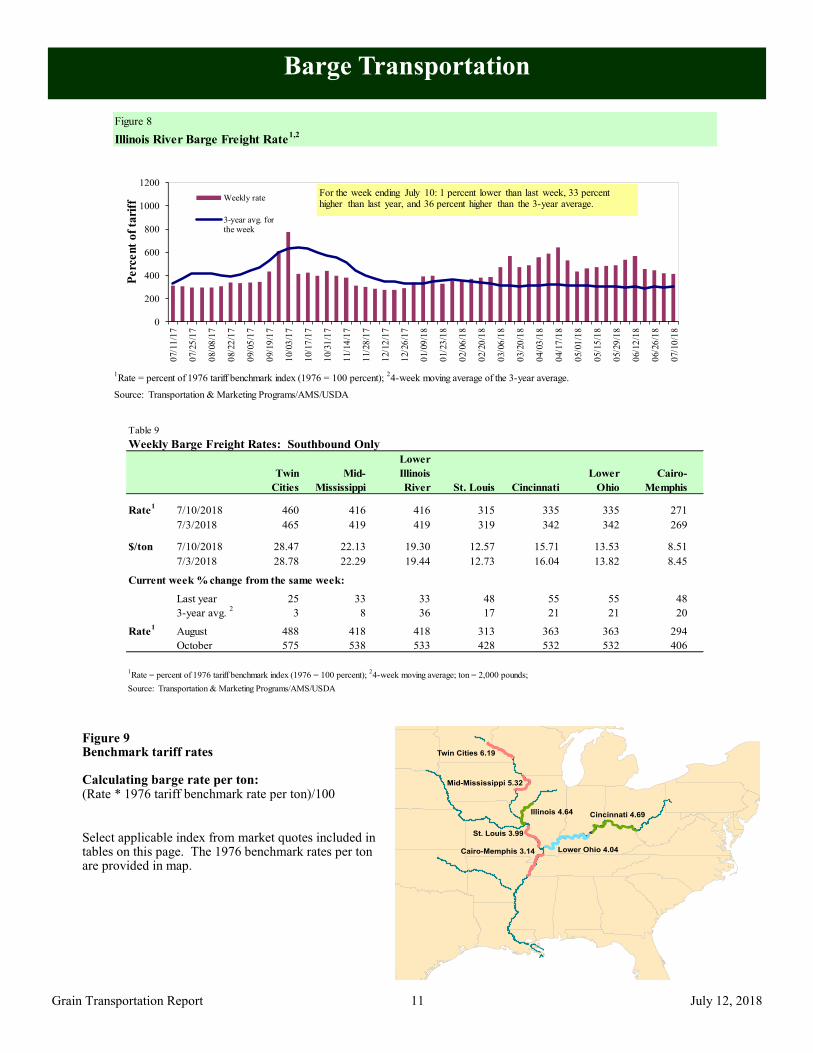
Barge Transportation
Figure 9 Benchmark tariff rates Calculating barge rate per ton: (Rate * 1976 tariff benchmark rate per ton)/100
Select applicable index from market quotes included in tables on this page. The 1976 benchmark rates per ton are provided in map.
Twin Cities 6.19
Mid-Mississippi 5.32
St. Louis 3.99
Cairo-Memphis 3.14
Illinois 4.64 Cincinnati 4.69
Lower Ohio 4.04
Figure 8
Illinois River Barge Freight Rate1,2
1Rate = percent of 1976 tariff benchmark index (1976 = 100 percent);
24-week moving average of the 3-year average.
Source: Transportation & Marketing Programs/AMS/USDA
0
200
400
600
800
1000
12000
7/1
1/1
7
07/2
5/1
7
08/0
8/1
7
08/2
2/1
7
09/0
5/1
7
09/1
9/1
7
10/0
3/1
7
10/1
7/1
7
10/3
1/1
7
11/1
4/1
7
11/2
8/1
7
12/1
2/1
7
12/2
6/1
7
01/0
9/1
8
01/2
3/1
8
02/0
6/1
8
02/2
0/1
8
03/0
6/1
8
03/2
0/1
8
04/0
3/1
8
04/1
7/1
8
05/0
1/1
8
05/1
5/1
8
05/2
9/1
8
06/1
2/1
8
06/2
6/1
8
07/1
0/1
8
Perc
en
t o
f ta
riff
Weekly rate
3-year avg. forthe week
For the week ending July 10: 1 percent lower than last week, 33 percent higher than last year, and 36 percent higher than the 3-year average.
Table 9
Weekly Barge Freight Rates: Southbound Only
Twin
Cities
Mid-
Mississippi
Lower
Illinois
River St. Louis Cincinnati
Lower
Ohio
Cairo-
Memphis
Rate1
7/10/2018 460 416 416 315 335 335 271
7/3/2018 465 419 419 319 342 342 269
$/ton 7/10/2018 28.47 22.13 19.30 12.57 15.71 13.53 8.51
7/3/2018 28.78 22.29 19.44 12.73 16.04 13.82 8.45
Current week % change from the same week:
Last year 25 33 33 48 55 55 48
3-year avg. 2
3 8 36 17 21 21 20-2 6 6
Rate1
August 488 418 418 313 363 363 294
October 575 538 533 428 532 532 406
Source: Transportation & Marketing Programs/AMS/USDA
1Rate = percent of 1976 tariff benchmark index (1976 = 100 percent);
24-week moving average; ton = 2,000 pounds;
July 12, 2018
Grain Transportation Report 12
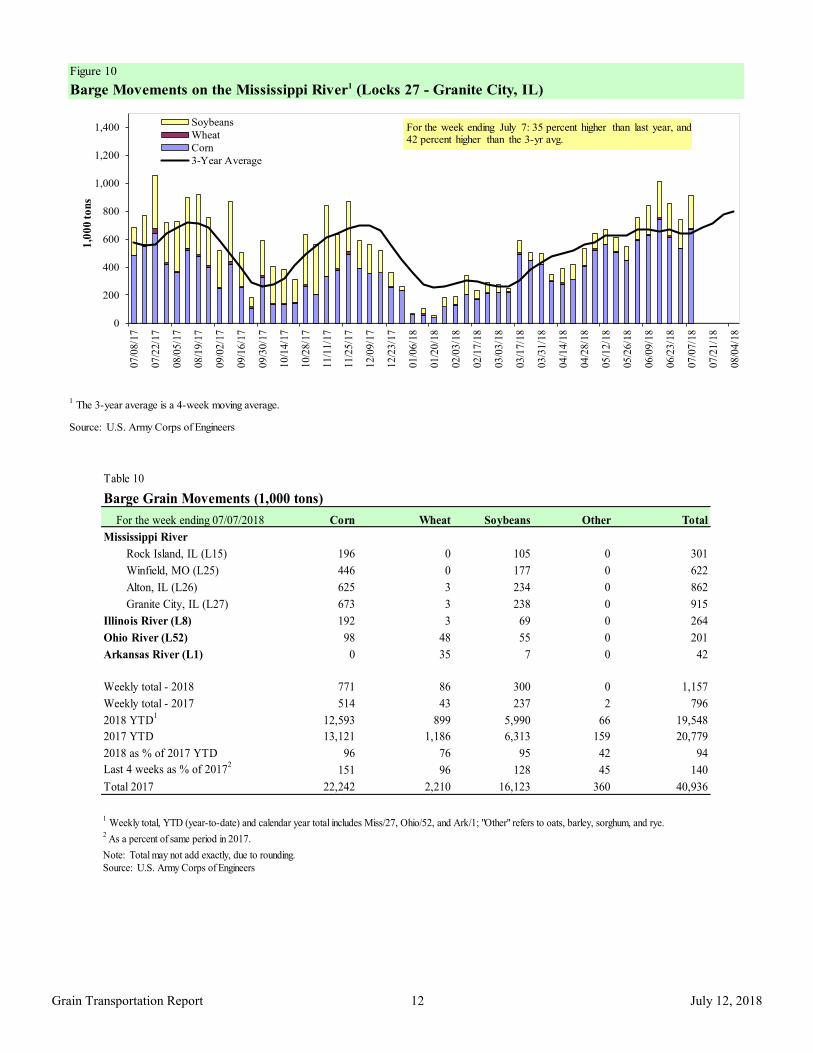
Figure 10
Barge Movements on the Mississippi River1 (Locks 27 - Granite City, IL)
1 The 3-year average is a 4-week moving average.
Source: U.S. Army Corps of Engineers
0
200
400
600
800
1,000
1,200
1,40007/0
8/1
7
07/2
2/1
7
08/0
5/1
7
08/1
9/1
7
09/0
2/1
7
09/1
6/1
7
09/3
0/1
7
10/1
4/1
7
10/2
8/1
7
11/1
1/1
7
11/2
5/1
7
12/0
9/1
7
12/2
3/1
7
01/0
6/1
8
01/2
0/1
8
02/0
3/1
8
02/1
7/1
8
03/0
3/1
8
03/1
7/1
8
03/3
1/1
8
04/1
4/1
8
04/2
8/1
8
05/1
2/1
8
05/2
6/1
8
06/0
9/1
8
06/2
3/1
8
07/0
7/1
8
07/2
1/1
8
08/0
4/1
8
1,0
00
to
ns
Soybeans
Wheat
Corn
3-Year Average
For the week ending July 7: 35 percent higher than last year, and42 percent higher than the 3-yr avg.
Table 10
Barge Grain Movements (1,000 tons)
For the week ending 07/07/2018 Corn Wheat Soybeans Other Total
Mississippi River
Rock Island, IL (L15) 196 0 105 0 301
Winfield, MO (L25) 446 0 177 0 622
Alton, IL (L26) 625 3 234 0 862
Granite City, IL (L27) 673 3 238 0 915
Illinois River (L8) 192 3 69 0 264
Ohio River (L52) 98 48 55 0 201
Arkansas River (L1) 0 35 7 0 42
Weekly total - 2018 771 86 300 0 1,157
Weekly total - 2017 514 43 237 2 796
2018 YTD1
12,593 899 5,990 66 19,548
2017 YTD 13,121 1,186 6,313 159 20,779
2018 as % of 2017 YTD 96 76 95 42 94
Last 4 weeks as % of 20172
151 96 128 45 140
Total 2017 22,242 2,210 16,123 360 40,936
2 As a percent of same period in 2017.
Source: U.S. Army Corps of Engineers
Note: Total may not add exactly, due to rounding.
1 Weekly total, YTD (year-to-date) and calendar year total includes Miss/27, Ohio/52, and Ark/1; "Other" refers to oats, barley, sorghum, and rye.
July 12, 2018
Grain Transportation Report 13
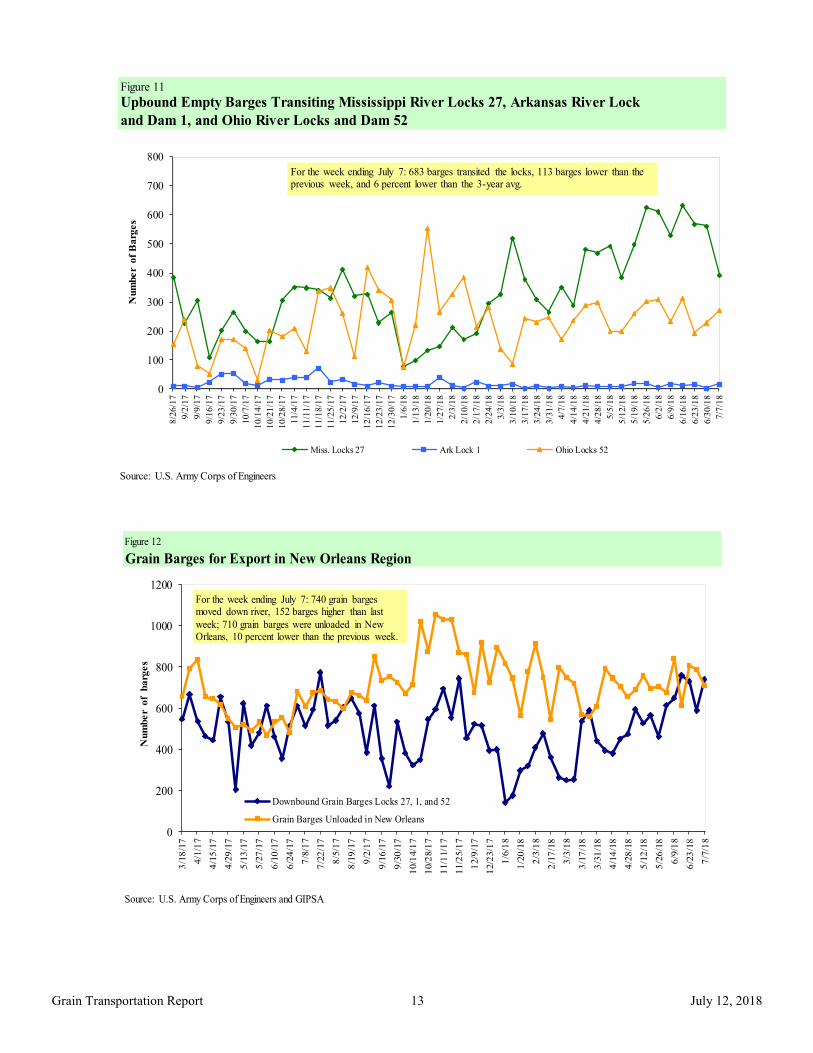
Figure 12
Grain Barges for Export in New Orleans Region
Source: U.S. Army Corps of Engineers and GIPSA
0
200
400
600
800
1000
1200
3/1
8/1
7
4/1
/17
4/1
5/1
7
4/2
9/1
7
5/1
3/1
7
5/2
7/1
7
6/1
0/1
7
6/2
4/1
7
7/8
/17
7/2
2/1
7
8/5
/17
8/1
9/1
7
9/2
/17
9/1
6/1
7
9/3
0/1
7
10/1
4/1
7
10/2
8/1
7
11/1
1/1
7
11/2
5/1
7
12/9
/17
12/2
3/1
7
1/6
/18
1/2
0/1
8
2/3
/18
2/1
7/1
8
3/3
/18
3/1
7/1
8
3/3
1/1
8
4/1
4/1
8
4/2
8/1
8
5/1
2/1
8
5/2
6/1
8
6/9
/18
6/2
3/1
8
7/7
/18
Downbound Grain Barges Locks 27, 1, and 52
Grain Barges Unloaded in New Orleans
Nu
mb
er
of
ba
rge
s
For the week ending July 7: 740 grain bargesmoved down river, 152 barges higher than last
week; 710 grain barges were unloaded in New Orleans, 10 percent lower than the previous week.
Figure 11
Source: U.S. Army Corps of Engineers
Upbound Empty Barges Transiting Mississippi River Locks 27, Arkansas River Lock
and Dam 1, and Ohio River Locks and Dam 52
0
100
200
300
400
500
600
700
800
8/2
6/1
7
9/2
/17
9/9
/17
9/1
6/1
7
9/2
3/1
7
9/3
0/1
7
10/7
/17
10/1
4/1
7
10/2
1/1
7
10/2
8/1
7
11/4
/17
11/1
1/1
7
11/1
8/1
7
11/2
5/1
7
12/2
/17
12/9
/17
12/1
6/1
7
12/2
3/1
7
12/3
0/1
7
1/6
/18
1/1
3/1
8
1/2
0/1
8
1/2
7/1
8
2/3
/18
2/1
0/1
8
2/1
7/1
8
2/2
4/1
8
3/3
/18
3/1
0/1
8
3/1
7/1
8
3/2
4/1
8
3/3
1/1
8
4/7
/18
4/1
4/1
8
4/2
1/1
8
4/2
8/1
8
5/5
/18
5/1
2/1
8
5/1
9/1
8
5/2
6/1
8
6/2
/18
6/9
/18
6/1
6/1
8
6/2
3/1
8
6/3
0/1
8
7/7
/18
Num
ber
of
Barg
es
Miss. Locks 27 Ark Lock 1 Ohio Locks 52
For the week ending July 7: 683 barges transited the locks, 113 barges lower than the previous week, and 6 percent lower than the 3-year avg.
July 12, 2018
Grain Transportation Report 14
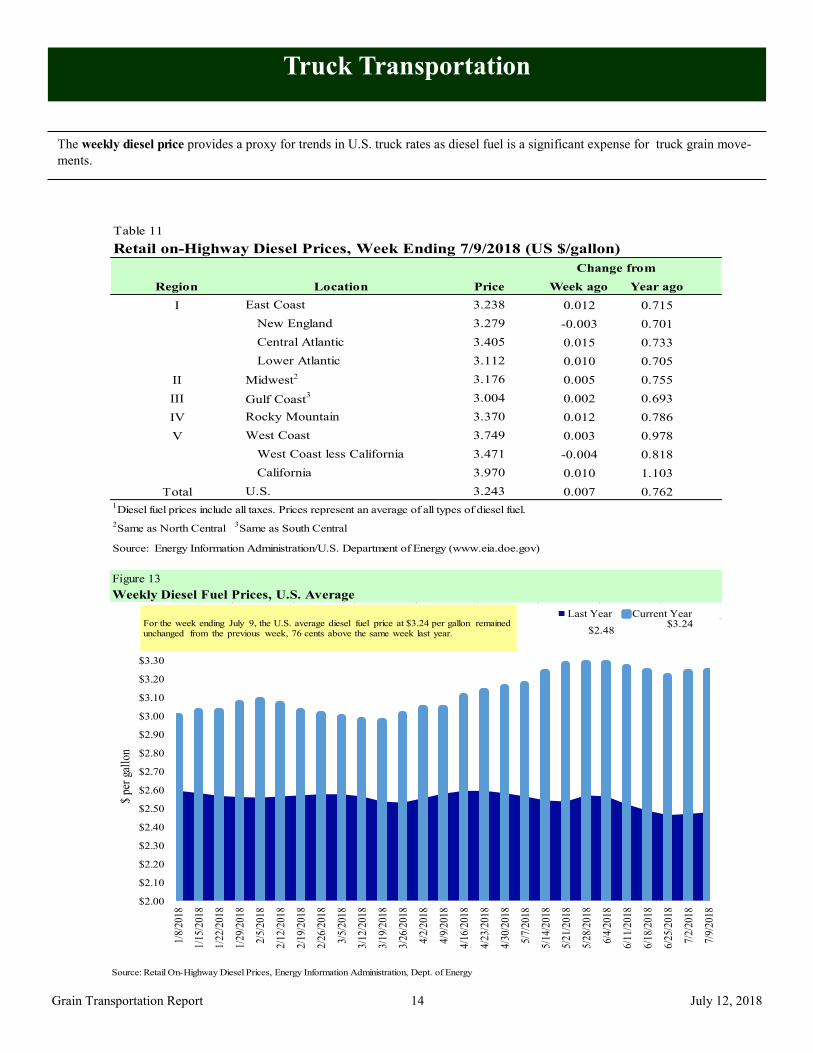
The weekly diesel price provides a proxy for trends in U.S. truck rates as diesel fuel is a significant expense for truck grain move-
ments.
Truck Transportation
Table 11
Change from
Region Location Price Week ago Year ago
I East Coast 3.238 0.012 0.715
New England 3.279 -0.003 0.701
Central Atlantic 3.405 0.015 0.733
Lower Atlantic 3.112 0.010 0.705
II Midwest2 3.176 0.005 0.755
III Gulf Coast3 3.004 0.002 0.693
IV Rocky Mountain 3.370 0.012 0.786
V West Coast 3.749 0.003 0.978
West Coast less California 3.471 -0.004 0.818
California 3.970 0.010 1.103
Total U.S. 3.243 0.007 0.7621Diesel fuel prices include all taxes. Prices represent an average of all types of diesel fuel.
2Same as North Central
3Same as South Central
Source: Energy Information Administration/U.S. Department of Energy (www.eia.doe.gov)
Retail on-Highway Diesel Prices, Week Ending 7/9/2018 (US $/gallon)
Figure 13
Weekly Diesel Fuel Prices, U.S. Average
Source: Retail On-Highway Diesel Prices, Energy Information Administration, Dept. of Energy
$3.24 $2.48
$2.00
$2.10
$2.20
$2.30
$2.40
$2.50
$2.60
$2.70
$2.80
$2.90
$3.00
$3.10
$3.20
$3.30
1/8/
2018
1/15
/201
8
1/22
/201
8
1/29
/201
8
2/5/
2018
2/12
/201
8
2/19
/201
8
2/26
/201
8
3/5/
2018
3/12
/201
8
3/19
/201
8
3/26
/201
8
4/2/
2018
4/9/
2018
4/16
/201
8
4/23
/201
8
4/30
/201
8
5/7/
2018
5/14
/201
8
5/21
/201
8
5/28
/201
8
6/4/
2018
6/11
/201
8
6/18
/201
8
6/25
/201
8
7/2/
2018
7/9/
2018
$ pe
r ga
llon
Last Year Current YearFor the week ending July 9, the U.S. average diesel fuel price at $3.24 per gallon remained unchanged from the previous week, 76 cents above the same week last year.
July 12, 2018
Grain Transportation Report 15
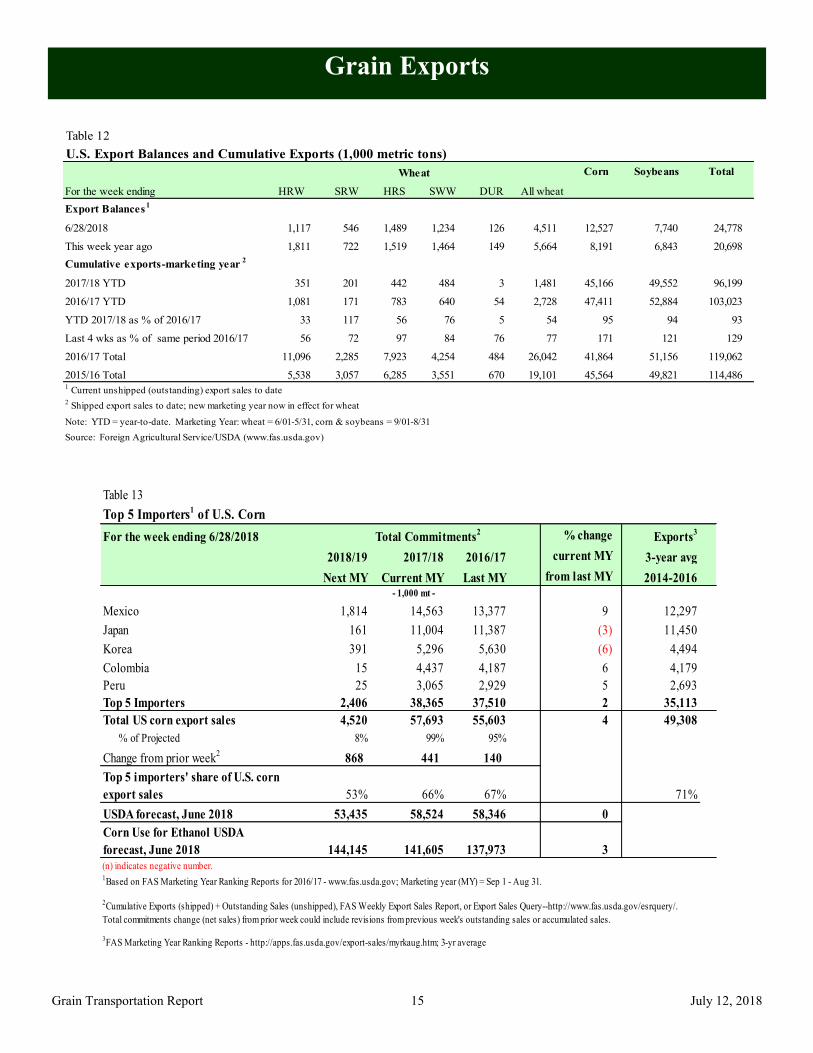
Grain Exports
Table 12
U.S. Export Balances and Cumulative Exports (1,000 metric tons)
Wheat Corn Soybeans Total
For the week ending HRW SRW HRS SWW DUR All wheat
Export Balances1
6/28/2018 1,117 546 1,489 1,234 126 4,511 12,527 7,740 24,778
This week year ago 1,811 722 1,519 1,464 149 5,664 8,191 6,843 20,698
Cumulative exports-marketing year 2
2017/18 YTD 351 201 442 484 3 1,481 45,166 49,552 96,199
2016/17 YTD 1,081 171 783 640 54 2,728 47,411 52,884 103,023
YTD 2017/18 as % of 2016/17 33 117 56 76 5 54 95 94 93
Last 4 wks as % of same period 2016/17 56 72 97 84 76 77 171 121 129
2016/17 Total 11,096 2,285 7,923 4,254 484 26,042 41,864 51,156 119,062
2015/16 Total 5,538 3,057 6,285 3,551 670 19,101 45,564 49,821 114,4861 Current unshipped (outstanding) export sales to date
2 Shipped export sales to date; new marketing year now in effect for wheat
Note: YTD = year-to-date. Marketing Year: wheat = 6/01-5/31, corn & soybeans = 9/01-8/31
Source: Foreign Agricultural Service/USDA (www.fas.usda.gov)
Table 13
Top 5 Importers1 of U.S. Corn
For the week ending 6/28/2018 % change
Exports3
2018/19 2017/18 2016/17 current MY 3-year avg
Next MY Current MY Last MY from last MY 2014-2016
Mexico 1,814 14,563 13,377 9 12,297
Japan 161 11,004 11,387 (3) 11,450
Korea 391 5,296 5,630 (6) 4,494
Colombia 15 4,437 4,187 6 4,179
Peru 25 3,065 2,929 5 2,693
Top 5 Importers 2,406 38,365 37,510 2 35,113
Total US corn export sales 4,520 57,693 55,603 4 49,308
% of Projected 8% 99% 95%
Change from prior week2
868 441 140
Top 5 importers' share of U.S. corn
export sales 53% 66% 67% 71%
USDA forecast, June 2018 53,435 58,524 58,346 0
Corn Use for Ethanol USDA
forecast, June 2018 144,145 141,605 137,973 3
1Based on FAS Marketing Year Ranking Reports for 2016/17 - www.fas.usda.gov; Marketing year (MY) = Sep 1 - Aug 31.
Total Commitments2
- 1,000 mt -
3FAS Marketing Year Ranking Reports - http://apps.fas.usda.gov/export-sales/myrkaug.htm; 3-yr average
2Cumulative Exports (shipped) + Outstanding Sales (unshipped), FAS Weekly Export Sales Report, or Export Sales Query--http://www.fas.usda.gov/esrquery/.
Total commitments change (net sales) from prior week could include revisions from previous week's outstanding sales or accumulated sales.
(n) indicates negative number.
July 12, 2018
Grain Transportation Report 16
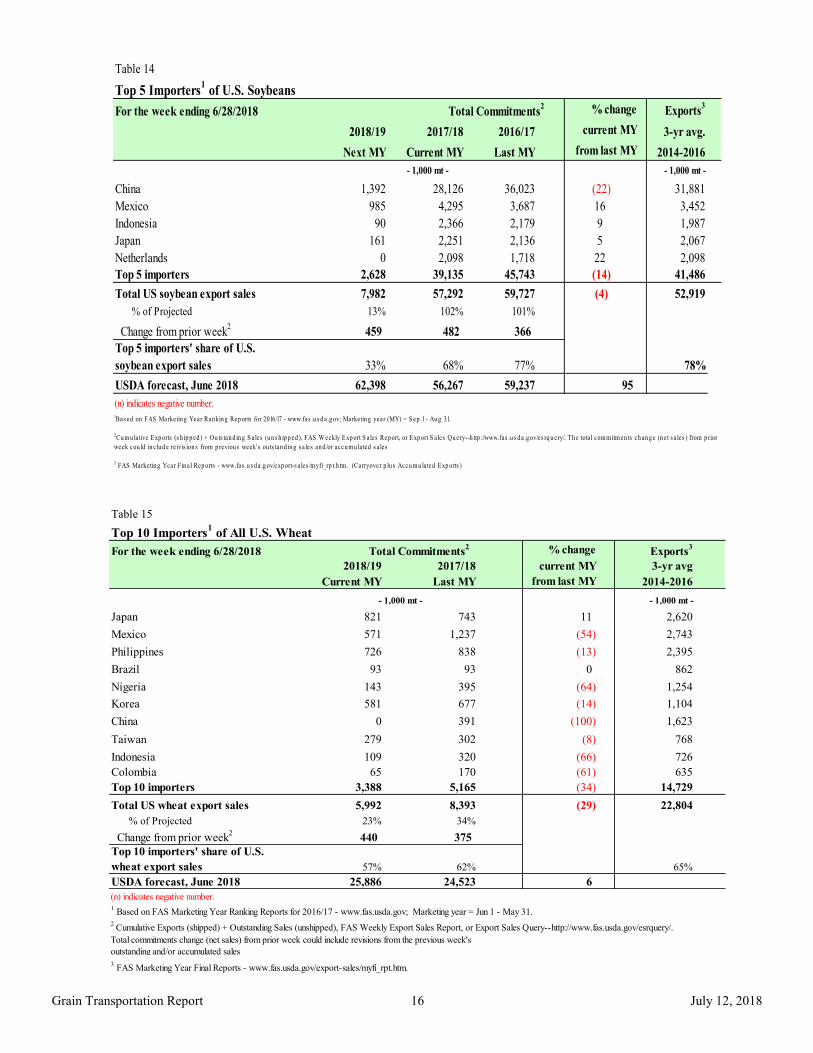
Table 14
Top 5 Importers1 of U.S. Soybeans
For the week ending 6/28/2018 % change
Exports3
2018/19 2017/18 2016/17 current MY 3-yr avg.
Next MY Current MY Last MY from last MY 2014-2016
- 1,000 mt - - 1,000 mt -
China 1,392 28,126 36,023 (22) 31,881
Mexico 985 4,295 3,687 16 3,452
Indonesia 90 2,366 2,179 9 1,987
Japan 161 2,251 2,136 5 2,067
Netherlands 0 2,098 1,718 22 2,098
Top 5 importers 2,628 39,135 45,743 (14) 41,486
Total US soybean export sales 7,982 57,292 59,727 (4) 52,919
% of Projected 13% 102% 101%
Change from prior week2
459 482 366
Top 5 importers' share of U.S.
soybean export sales 33% 68% 77% 78%
USDA forecast, June 2018 62,398 56,267 59,237 95
1Bas ed on FAS Marketin g Year Ran kin g Rep orts for 2016/17 - www.fas .u s d a.g ov; Marketin g year (MY) = S ep 1 - Au g 31.
3 FAS Marketin g Year Fin al Rep orts - www.fas .u s d a.g ov/exp ort-s ales /m yfi_rp t.h tm . (Carryover p lu s Accu m u lated Exp orts )
(n) indicates negative number.
2Cu m u lative Exp orts (s h ip p ed ) + Ou ts tan d in g S ales (u n s h ip p ed ), FAS W eekly Exp ort S ales Rep ort, or Exp ort S ales Qu ery--h ttp ://www.fas .u s d a.g ov/es rq u ery/. Th e total com m itm en ts ch an g e (n et s ales ) from p rior
week cou ld in clu d e reivis ion s from p reviou s week's ou ts tan d in g s ales an d /or accu m u lated s ales
Total Commitments2
Table 15
Top 10 Importers1 of All U.S. Wheat
For the week ending 6/28/2018 % change Exports3
2018/19 2017/18 current MY 3-yr avg
Current MY Last MY from last MY 2014-2016
- 1,000 mt -
Japan 821 743 11 2,620
Mexico 571 1,237 (54) 2,743
Philippines 726 838 (13) 2,395
Brazil 93 93 0 862
Nigeria 143 395 (64) 1,254
Korea 581 677 (14) 1,104
China 0 391 (100) 1,623
Taiwan 279 302 (8) 768
Indonesia 109 320 (66) 726
Colombia 65 170 (61) 635
Top 10 importers 3,388 5,165 (34) 14,729
Total US wheat export sales 5,992 8,393 (29) 22,804
% of Projected 23% 34%
Change from prior week2
440 375
Top 10 importers' share of U.S.
wheat export sales 57% 62% 65%
USDA forecast, June 2018 25,886 24,523 6
1 Based on FAS Marketing Year Ranking Reports for 2016/17 - www.fas.usda.gov; Marketing year = Jun 1 - May 31.
outstanding and/or accumulated sales
Total Commitments2
3 FAS Marketing Year Final Reports - www.fas.usda.gov/export-sales/myfi_rpt.htm.
(n) indicates negative number.
2 Cumulative Exports (shipped) + Outstanding Sales (unshipped), FAS Weekly Export Sales Report, or Export Sales Query--http://www.fas.usda.gov/esrquery/.
Total commitments change (net sales) from prior week could include revisions from the previous week's
- 1,000 mt -
July 12, 2018
Grain Transportation Report 17
The United States exports approximately one-quarter of the grain it produces. On average, this includes nearly 45 percent of U.S.-grown wheat, 50 percent of U.S.-grown soybeans, and 20 percent of the U.S.-grown corn. Approximately 55 percent of the U.S. export grain ship-ments departed through the U.S. Gulf region in 2017.
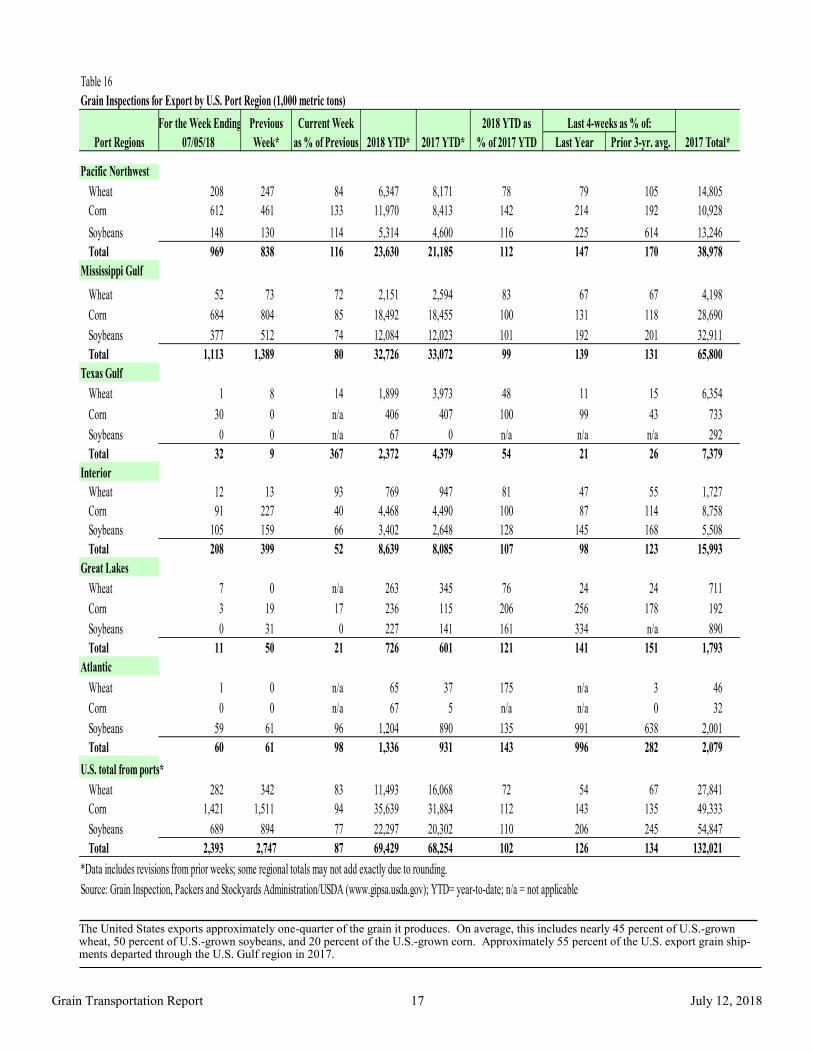
Table 16
Grain Inspections for Export by U.S. Port Region (1,000 metric tons)
For the Week Ending Previous Current Week 2018 YTD as
07/05/18 Week* as % of Previous 2017 YTD* % of 2017 YTD Last Year Prior 3-yr. avg.
Pacific Northwest
Wheat 208 247 84 6,347 8,171 78 79 105 14,805
Corn 612 461 133 11,970 8,413 142 214 192 10,928
Soybeans 148 130 114 5,314 4,600 116 225 614 13,246
Total 969 838 116 23,630 21,185 112 147 170 38,978
Mississippi Gulf
Wheat 52 73 72 2,151 2,594 83 67 67 4,198
Corn 684 804 85 18,492 18,455 100 131 118 28,690
Soybeans 377 512 74 12,084 12,023 101 192 201 32,911
Total 1,113 1,389 80 32,726 33,072 99 139 131 65,800
Texas Gulf
Wheat 1 8 14 1,899 3,973 48 11 15 6,354
Corn 30 0 n/a 406 407 100 99 43 733
Soybeans 0 0 n/a 67 0 n/a n/a n/a 292
Total 32 9 367 2,372 4,379 54 21 26 7,379
Interior
Wheat 12 13 93 769 947 81 47 55 1,727
Corn 91 227 40 4,468 4,490 100 87 114 8,758
Soybeans 105 159 66 3,402 2,648 128 145 168 5,508
Total 208 399 52 8,639 8,085 107 98 123 15,993
Great Lakes
Wheat 7 0 n/a 263 345 76 24 24 711
Corn 3 19 17 236 115 206 256 178 192
Soybeans 0 31 0 227 141 161 334 n/a 890
Total 11 50 21 726 601 121 141 151 1,793
Atlantic
Wheat 1 0 n/a 65 37 175 n/a 3 46
Corn 0 0 n/a 67 5 n/a n/a 0 32
Soybeans 59 61 96 1,204 890 135 991 638 2,001
Total 60 61 98 1,336 931 143 996 282 2,079
U.S. total from ports*
Wheat 282 342 83 11,493 16,068 72 54 67 27,841
Corn 1,421 1,511 94 35,639 31,884 112 143 135 49,333
Soybeans 689 894 77 22,297 20,302 110 206 245 54,847
Total 2,393 2,747 87 69,429 68,254 102 126 134 132,021
*Data includes revisions from prior weeks; some regional totals may not add exactly due to rounding.
Source: Grain Inspection, Packers and Stockyards Administration/USDA (www.gipsa.usda.gov); YTD= year-to-date; n/a = not applicable
Last 4-weeks as % of:
Port Regions 2017 Total*2018 YTD*
July 12, 2018
Grain Transportation Report 18
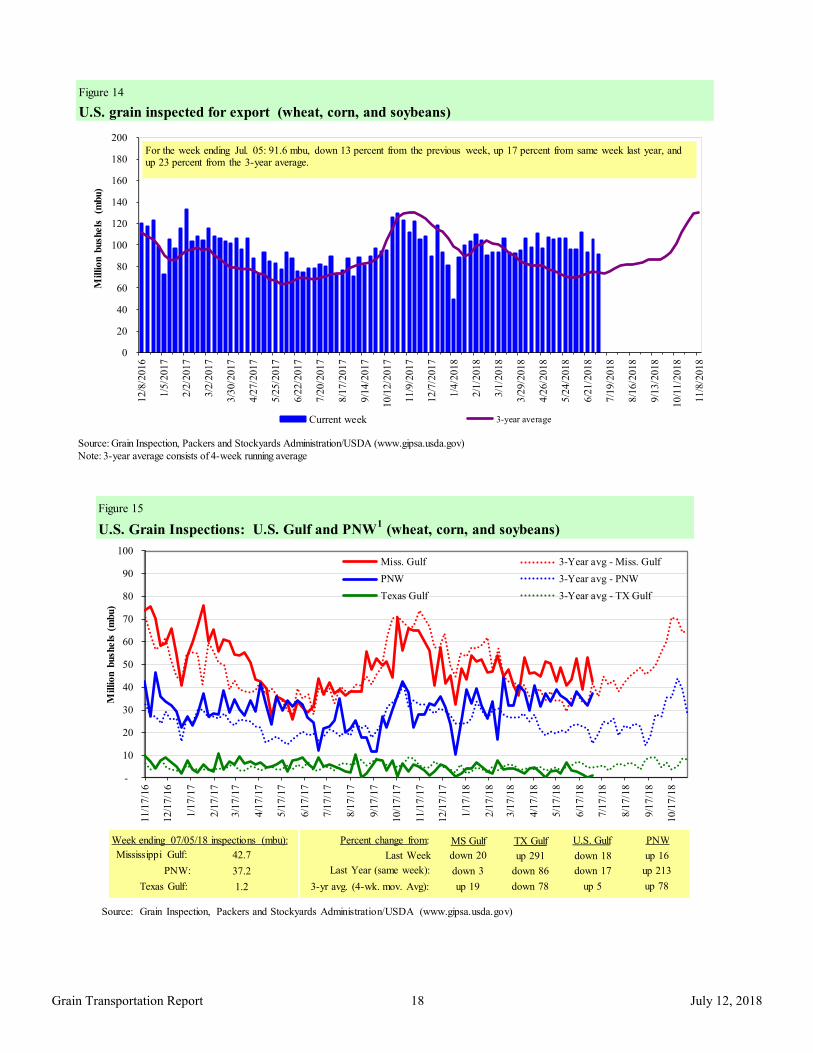
Figure 14
U.S. grain inspected for export (wheat, corn, and soybeans)
Source: Grain Inspection, Packers and Stockyards Administration/USDA (www.gipsa.usda.gov)
Note: 3-year average consists of 4-week running average
0
20
40
60
80
100
120
140
160
180
20012/8
/2016
1/5
/20
17
2/2
/20
17
3/2
/20
17
3/3
0/2
01
7
4/2
7/2
01
7
5/2
5/2
01
7
6/2
2/2
017
7/2
0/2
017
8/1
7/2
01
7
9/1
4/2
01
7
10
/12
/20
17
11
/9/2
01
7
12/7
/2017
1/4
/20
18
2/1
/20
18
3/1
/20
18
3/2
9/2
01
8
4/2
6/2
01
8
5/2
4/2
018
6/2
1/2
018
7/1
9/2
01
8
8/1
6/2
01
8
9/1
3/2
01
8
10
/11
/20
18
11
/8/2
01
8
Million b
ush
els
(m
bu)
Current week 3-year average
For the week ending Jul. 05: 91.6 mbu, down 13 percent from the previous week, up 17 percent from same week last year, and up 23 percent from the 3-year average.
Figure 15
U.S. Grain Inspections: U.S. Gulf and PNW1 (wheat, corn, and soybeans)
-
10
20
30
40
50
60
70
80
90
100
11/1
7/1
6
12/1
7/1
6
1/1
7/1
7
2/1
7/1
7
3/1
7/1
7
4/1
7/1
7
5/1
7/1
7
6/1
7/1
7
7/1
7/1
7
8/1
7/1
7
9/1
7/1
7
10/1
7/1
7
11/1
7/1
7
12/1
7/1
7
1/1
7/1
8
2/1
7/1
8
3/1
7/1
8
4/1
7/1
8
5/1
7/1
8
6/1
7/1
8
7/1
7/1
8
8/1
7/1
8
9/1
7/1
8
10/1
7/1
8
Million b
ush
els
(m
bu)
Miss. Gulf 3-Year avg - Miss. Gulf
PNW 3-Year avg - PNW
Texas Gulf 3-Year avg - TX Gulf
Source: Grain Inspection, Packers and Stockyards Administration/USDA (www.gipsa.usda.gov)
Last Week:
Last Year (same week):
3-yr avg. (4-wk. mov. Avg):
MS Gulf TX Gulf U.S. Gulf PNW
down 20
down 3
up 19
up 291
down 86
down 78
down 18
down 17
up 5
up 16
up 213
up 78
Percent change from:Week ending 07/05/18 inspections (mbu):
Mississippi Gulf:
PNW:
Texas Gulf:
42.7
37.2
1.2
July 12, 2018
Grain Transportation Report 19
Ocean Transportation
Figure 16
U.S. Gulf Vessel Loading Activity
0
10
20
30
40
50
60
70
80
02
/15
/20
18
02
/22
/20
18
03
/01
/20
18
03
/08
/20
18
03
/15
/20
18
03
/22
/20
18
03
/29
/20
18
04
/05
/20
18
04
/12
/20
18
04
/19
/20
18
04
/26
/20
18
05
/03
/20
18
05
/10
/20
18
05
/17
/20
18
05
/24
/20
18
05
/31
/20
18
06
/07
/20
18
06
/14
/20
18
06
/21
/20
18
06
/28
/20
18
07
/05
/20
18
Nu
mb
er
of
vess
els
Loaded Last 7 Days Due Next 10 days Loaded 4 Year Average
Source:Transportation & Marketing Programs/AMS/USDA1U.S. Gulf includes Mississippi, Texas, and East Gulf.
For the week ending July 5 Loaded Due
Change from last year -33.3% -14.6%
Change from 4-year avg. -24.4% -17.2%
Table 17
Weekly Port Region Grain Ocean Vessel Activity (number of vessels)
Pacific
Gulf Northwest
Loaded Due next
Date In port 7-days 10-days In port
7/5/2018 33 24 42 15
6/28/2018 33 32 40 17
2017 range (25..66) (28..54) (37..87) (5..44)
2017 avg. 46 38 56 20
Source: Transportation & Marketing Programs/AMS/USDA
July 12, 2018
Grain Transportation Report 20
Figure 17
Grain Vessel Rates, U.S. to Japan
Data Source: O'Neil Commodity Consulting
0
5
10
15
20
25
30
35
40
45
50
June
16
Aug
. 16
Oct
. 16
Dec
. 16
Feb
. 17
Apr
. 17
June
17
Aug
. 17
Oct
. 17
Dec
. 17
Feb
. 18
Apr
. 18
June
18
US
$/m
etri
c to
n
Spread Gulf vs. PNW to Japan Rate Gulf to Japan Rate PNW to Japan
Gulf PNW Spread Ocean rates for June '18 $43.44 $24.69 $18.72
Change from June '17 18.9% 32.7% 5.9% Change from 4-year avg. 24.1% 31.4% 15.6%
Table 18
Ocean Freight Rates For Selected Shipments, Week Ending 07/07/2018
Export Import Grain Loading Volume loads Freight rate
region region types date (metric tons) (US$/metric ton)
U.S. Gulf Egypt Heavy Grain Jun 26/30 60,000 27.75
U.S. Gulf Rotterdam Heavy Grain Jun 25/30 65,000 23.00
U.S. Gulf Djibouti Sorghum Apr 16/26 18,200 69.87*
PNW Bangladesh Wheat Apr 6/16 43,500 63.35*
Brazil China Heavy Grain Jul 18/28 60,000 36.00
Brazil China Heavy Grain Jun 22/30 60,000 35.00
Brazil China Heavy Grain Jun 22/30 60,000 33.75
Brazil China Heavy Grain Jun 20/30 60,000 33.25
Brazil China Heavy Grain Jun 20/26 60,000 32.50
Brazil China Heavy Grain Jun 12/20 66,000 30.75
Brazil China Heavy Grain May 26/Jun 2 66,000 31.50
Brazil China Heavy Grain May 20/30 60,000 30.75
Brazil China Heavy Grain May 3/31 60,000 35.50
Brazil China Heavy Grain Apr 25/30 60,000 35.00
Brazil China Heavy Grain Apr 20/30 60,000 34.00
Rates shown are per metric ton (2,204.62 lbs. = 1 metric ton), F.O.B., except where otherwise indicated; op = option *50 percent of food aid from the United States is required to be shipped on U.S.-flag vessels.
Source: Maritime Research Inc. (www.maritime-research.com)
July 12, 2018
Grain Transportation Report 21
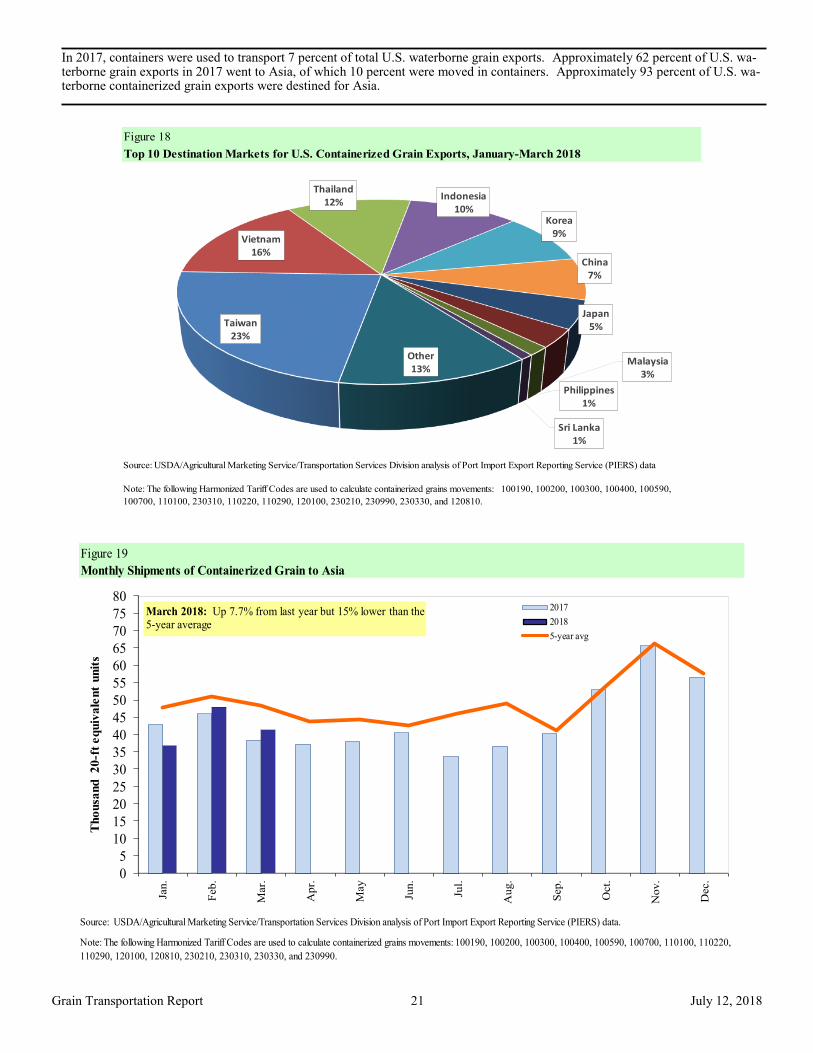
In 2017, containers were used to transport 7 percent of total U.S. waterborne grain exports. Approximately 62 percent of U.S. wa-terborne grain exports in 2017 went to Asia, of which 10 percent were moved in containers. Approximately 93 percent of U.S. wa-terborne containerized grain exports were destined for Asia.
Figure 18
Top 10 Destination Markets for U.S. Containerized Grain Exports, January-March 2018
Source: USDA/Agricultural Marketing Service/Transportation Services Division analysis of Port Import Export Reporting Service (PIERS) data
Note: The following Harmonized Tariff Codes are used to calculate containerized grains movements: 100190, 100200, 100300, 100400, 100590,
100700, 110100, 230310, 110220, 110290, 120100, 230210, 230990, 230330, and 120810.
Taiwan23%
Vietnam16%
Thailand12%
Indonesia10%
Korea9%
China7%
Japan5%
Malaysia3%
Philippines1%
Sri Lanka1%
Other13%
Figure 19
Monthly Shipments of Containerized Grain to Asia
Source: USDA/Agricultural Marketing Service/Transportation Services Division analysis of Port Import Export Reporting Service (PIERS) data.
Note: The following Harmonized Tariff Codes are used to calculate containerized grains movements: 100190, 100200, 100300, 100400, 100590, 100700, 110100, 110220,
110290, 120100, 120810, 230210, 230310, 230330, and 230990.
0
5
10
15
20
25
30
35
40
45
50
55
60
65
70
75
80
Jan.
Feb.
Mar.
Ap
r.
May
Jun.
Jul.
Aug.
Sep.
Oct.
Nov.
Dec.
Tho
usa
nd 20
-ft
equiv
ale
nt
unit
s
2017
2018
5-year avg
March 2018: Up 7.7% from last year but 15% lower than the 5-year average
July 12, 2018
Grain Transportation Report 22
Coordinators Surajudeen (Deen) Olowolayemo [email protected] (202) 720 - 0119 Pierre Bahizi [email protected] (202) 690 - 0992 Adam Sparger [email protected] (202) 205 - 8701
Weekly Highlight Editors Surajudeen (Deen) Olowolayemo [email protected] (202) 720 - 0119 April Taylor [email protected] (202) 720 - 7880 Nicholas Marathon [email protected] (202) 690 - 4430
Grain Transportation Indicators Surajudeen (Deen) Olowolayemo [email protected] (202) 720 - 0119
Rail Transportation Adam Sparger [email protected] (202) 205 - 8701 Johnny Hill [email protected] (202) 690 - 3295 Jesse Gastelle [email protected] (202) 690 - 1144 Peter Caffarelli [email protected] (202) 690 - 3244
Barge Transportation Nicholas Marathon [email protected] (202) 690 - 4430 April Taylor [email protected] (202) 720 - 7880 Matt Chang [email protected] (202) 720 - 0299
Truck Transportation April Taylor [email protected] (202) 720 - 7880 Sergio Sotelo [email protected] (202) 756 - 2577
Grain Exports Johnny Hill [email protected] (202) 690 - 3295 Ocean Transportation Surajudeen (Deen) Olowolayemo [email protected] (202) 720 - 0119 (Freight rates and vessels) April Taylor [email protected] (202) 720 - 7880 (Container movements)
Subscription Information: Send relevant information to [email protected] for an electronic copy (printed copies are also available upon request).
Preferred citation: U.S. Dept. of Agriculture, Agricultural Marketing Service. Grain Transportation Report. July 12, 2018. Web: http://dx.doi.org/10.9752/TS056.07-12-2018
Contacts and Links
In accordance with Federal civil rights law and U.S. Department of Agriculture (USDA) civil rights regulations and policies, the USDA, its Agencies, offices, and employees, and institutions participating in or administering USDA programs are prohibited from discriminating based on race, color, national origin, religion, sex, gender identity (including gender expression), sexual orientation, disability, age, marital status, family/parental status, income derived from a public assistance program, political beliefs, or reprisal or retaliation for prior civil rights activity, in any program or activity conducted or funded by USDA (not all bases apply to all programs). Remedies and complaint filing deadlines vary by pro-gram or incident. Persons with disabilities who require alternative means of communication for program information (e.g., Braille, large print, audiotape, American Sign Language, etc.) should contact the responsible Agency or USDA's TARGET Center at (202) 720-2600 (voice and TTY) or contact USDA through the Federal Relay Service at (800) 877-8339. Additionally, program information may be made available in languages other than English. To file a program discrimination complaint, complete the USDA Program Discrimination Complaint Form, AD-3027, found online at How to File a Program Discrimination Complaint and at any USDA office or write a letter addressed to USDA and provide in the letter all of the infor-mation requested in the form. To request a copy of the complaint form, call (866) 632-9992. Submit your completed form or letter to USDA by: (1) mail: U.S. Department of Agriculture, Office of the Assistant Secretary for Civil Rights, 1400 Independence Avenue, SW, Washington, D.C. 20250-9410; (2) fax: (202) 690-7442; or (3) email: [email protected]. USDA is an equal opportunity provider, employer, and lender.