Embed Size (px)
Citation preview
Juan Pablo Gómez Jáuregui AbdóDepartment of Ecosystems and Environmental InformaticsBrandenburg University of Technology at Cottbus
1
Lehrstuhl Ökosysteme und Umweltinformatik
• Introduction• Definition of the problem• Research questions• Research hypothesis• Objectives• Methodology• Results• Conclusions
2
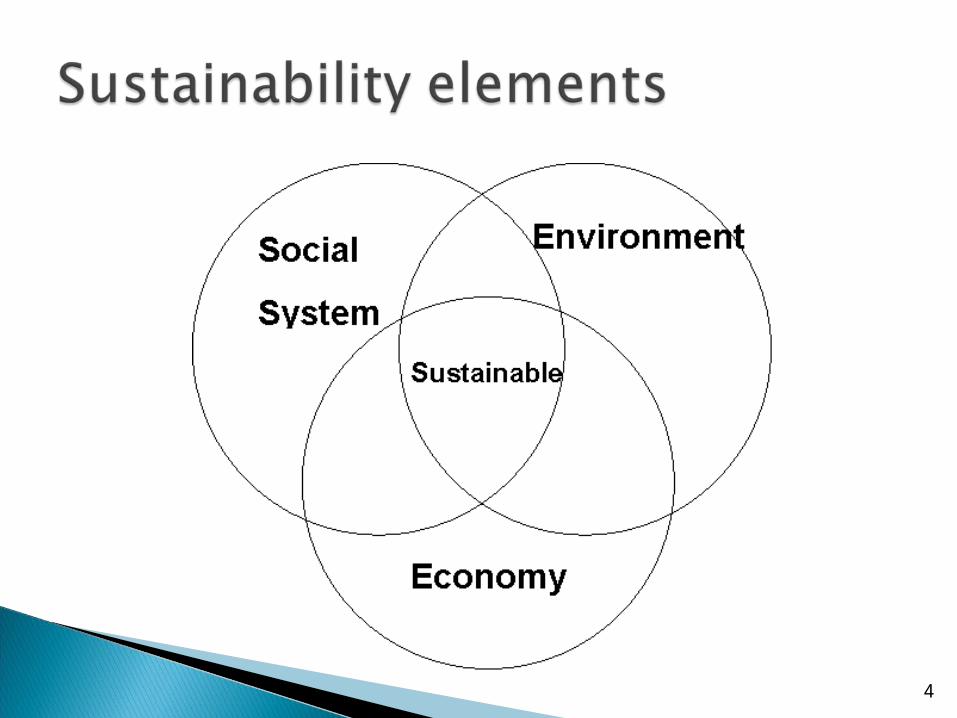
• According to the World Commission on Environment and Development, sustainable development (SD) is defined as: „Development that can meet the needs of the present generation without compromising the ability of future generations to meet their own needs“
• „A nation is achieving SD if it is undergoing a pattern of development that improves the total quality of life of every citizen, both now and into the future, while ensuring its rate of resource use doesn‘t exceed the regenerative and waste assimilative capacities of the natural environment“ (Lawn et al. 2006)
3
4
• Composite indices (CI) are aggregated set of variables into a single value and are used for ranking case studies performances of one location (regions, countries, cities, etc.) against those of others, as well as evaluate performance over time; and for setting policy objectives (Blanc et al. 2008)
• A composite index is able to transform large number of data and other indicators into usable information for decision makers (van Dijk et al. 2004)
5
Selection of indicators
To determine the transformation function
To determine the indicators weights
To determine the aggregation function
6
7
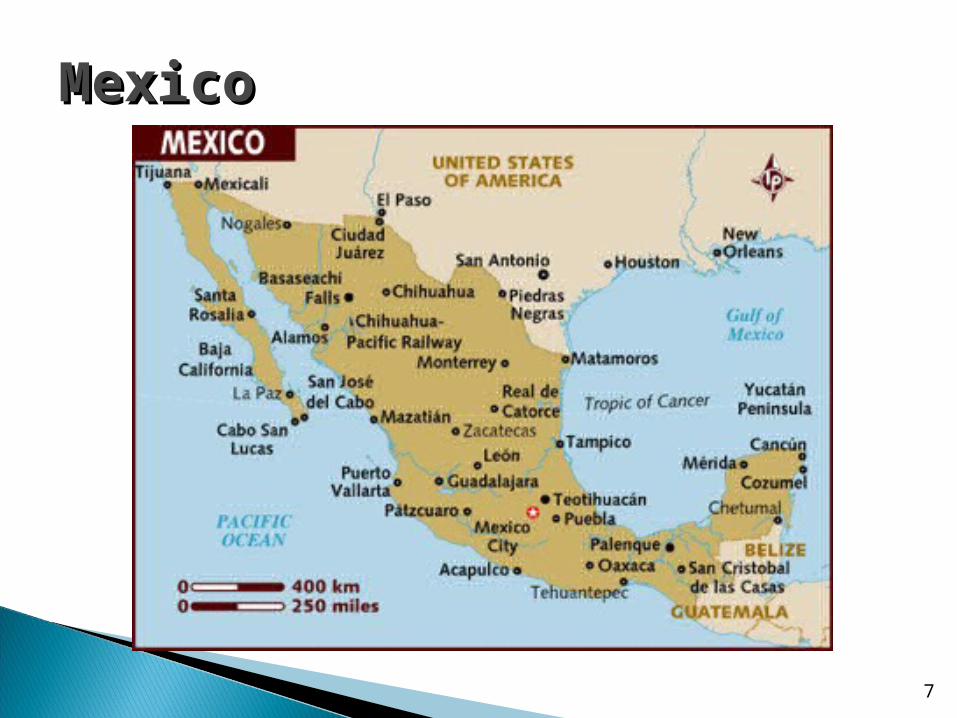
MexicoMexico
8
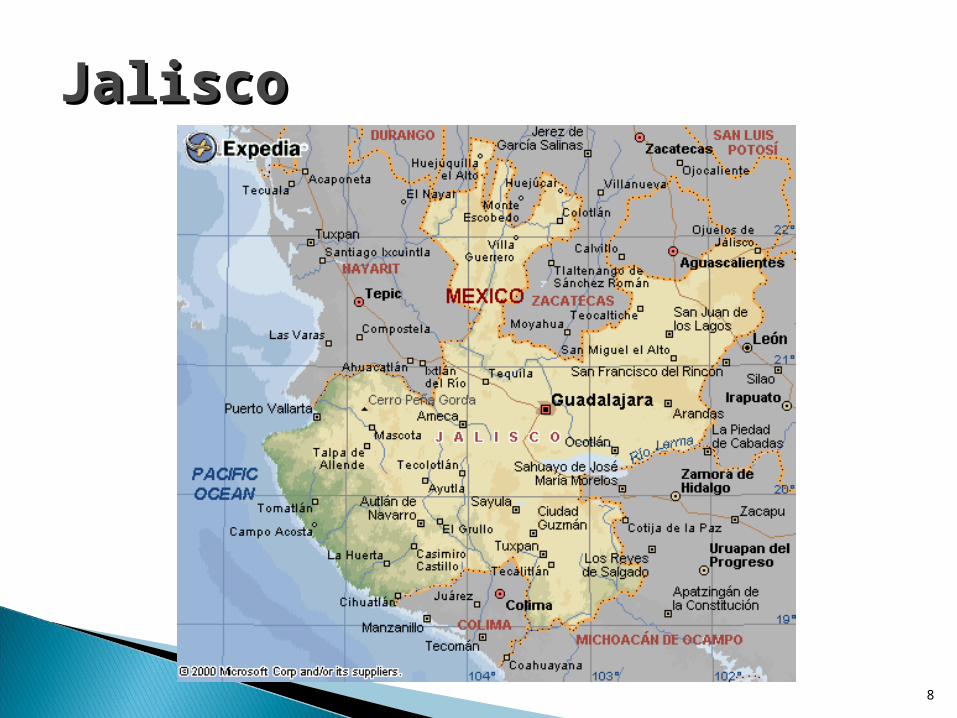
JaliscoJalisco
9
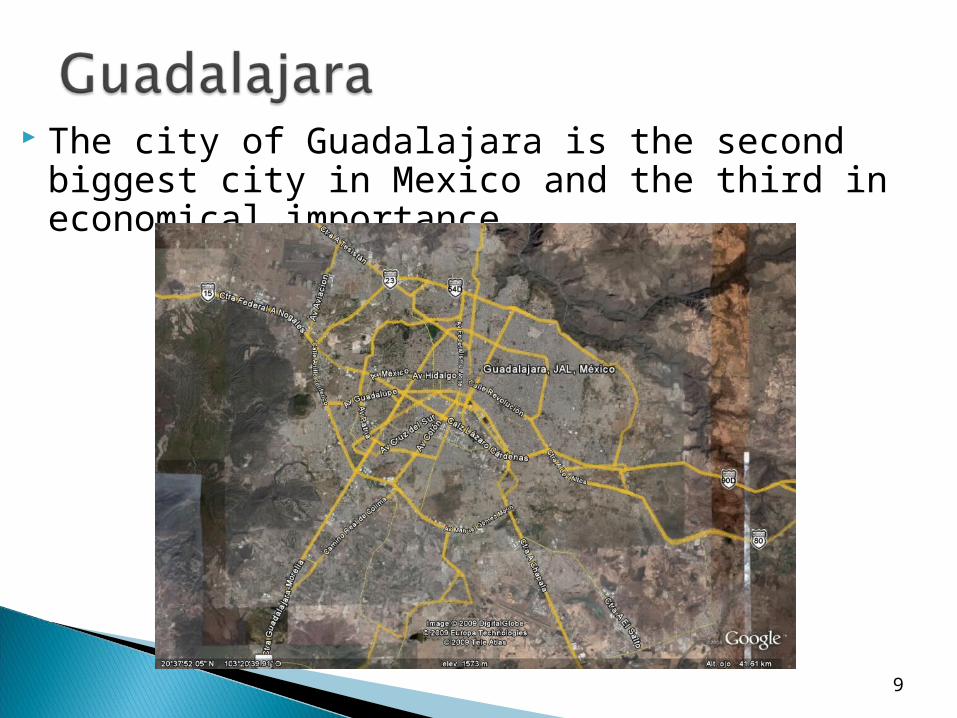
The city of Guadalajara is the second biggest city in Mexico and the third in economical importance.
10
Population: 4,095,853 inhabitants. Surface: 544.7 Km2. The main sources of freshwater supply: ◦Lake Chapala with 5.5 m3/s◦Subterranean wells with 4 m3/s◦Elias Gonzalez Chavez dam with 0.5 m3/s ◦Total supply of the city of 10 m3/s
The MetropolitanThe Metropolitan Zone of Zone of Guadalajara (MZG)Guadalajara (MZG)
11
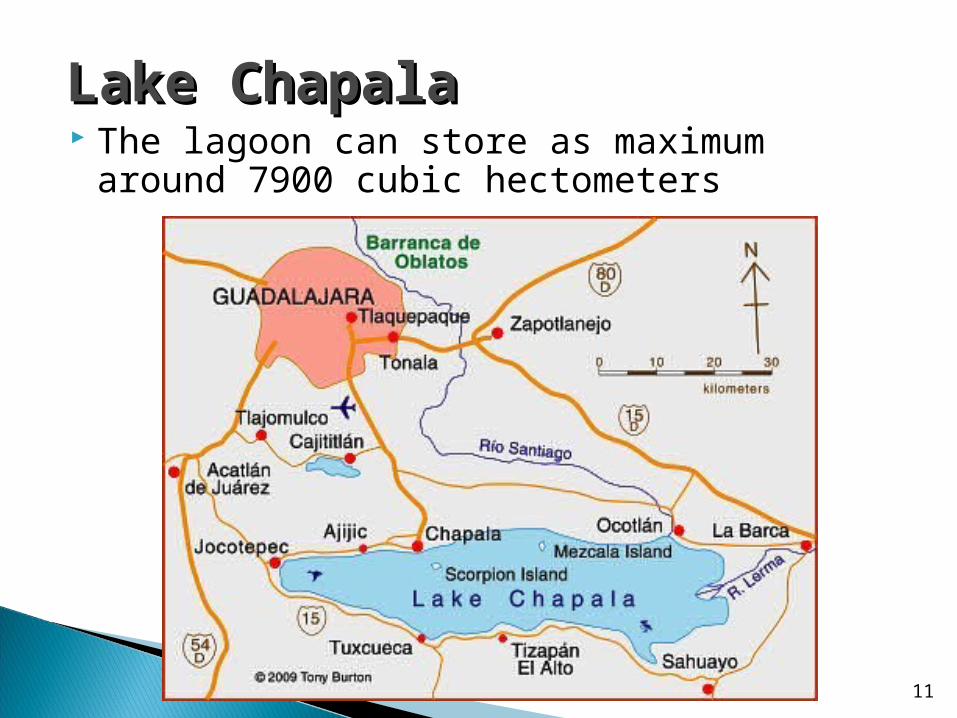
The lagoon can store as maximum around 7900 cubic hectometers
Lake ChapalaLake Chapala
12
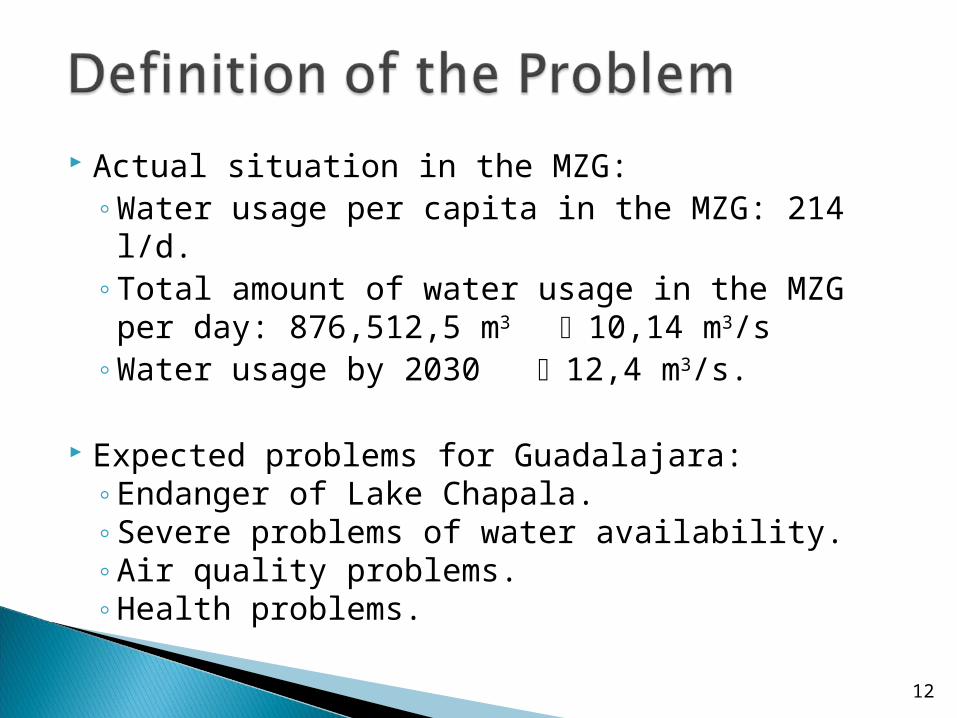
Actual situation in the MZG:◦Water usage per capita in the MZG: 214 l/d.◦Total amount of water usage in the MZG
per day: 876,512,5 m3 10,14 m3/s◦Water usage by 2030 12,4 m3/s.
Expected problems for Guadalajara:◦Endanger of Lake Chapala.◦Severe problems of water availability.◦Air quality problems.◦Health problems.
13
How can a composite index evaluate the sustainability of water usage at a local scale?
It is Guadalajara, nowadays, sustainable in its domestic water usage?
14
A composite index can be generated in order to evaluate the sustainability of an specific resource, in this case domestic water consumption, at a local scale.
Based on the big amount of water consumption per capita and lack of water treatment, Guadalajara is unsustainable in its fresh water consumption.
15
To develop a water composite index for sustainable urban domestic water usage.
To evaluate the sustainability of domestic water consumption in the MZG by a composite index.
To determine the sustainability level of the MZG.
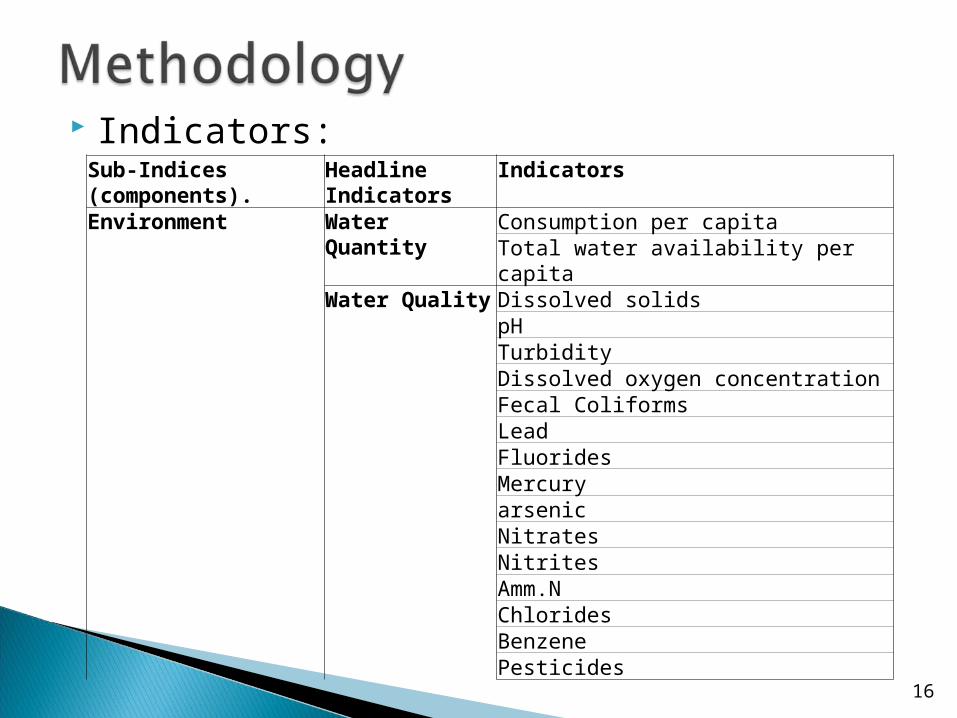
Indicators:
16
Sub-Indices (components).
Headline Indicators
Indicators
Environment Water Quantity Consumption per capitaTotal water availability per capita
Water Quality Dissolved solidspHTurbidityDissolved oxygen concentrationFecal ColiformsLeadFluoridesMercuryarsenicNitratesNitritesAmm.NChloridesBenzenePesticides
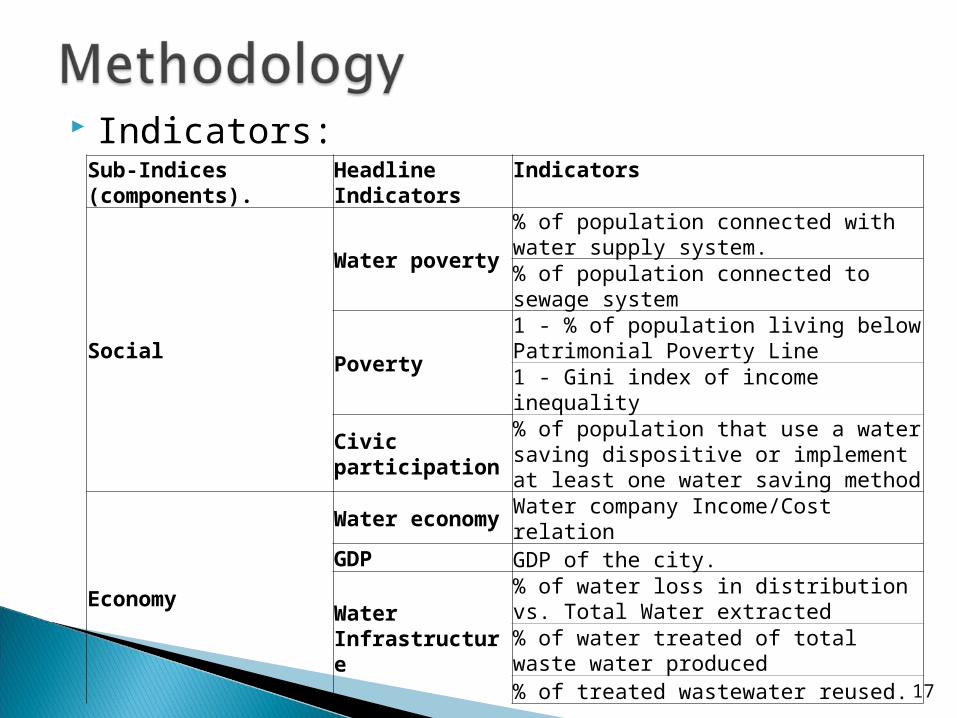
Indicators:
17
Sub-Indices (components).
Headline Indicators
Indicators
Social
Water poverty
% of population connected with water supply system.% of population connected to sewage system
Poverty1 - % of population living below Patrimonial Poverty Line1 - Gini index of income inequality
Civic participation
% of population that use a water saving dispositive or implement at least one water saving method
Economy
Water economy Water company Income/Cost relationGDP GDP of the city.
Water Infrastructure
% of water loss in distribution vs. Total Water extracted% of water treated of total waste water produced% of treated wastewater reused.
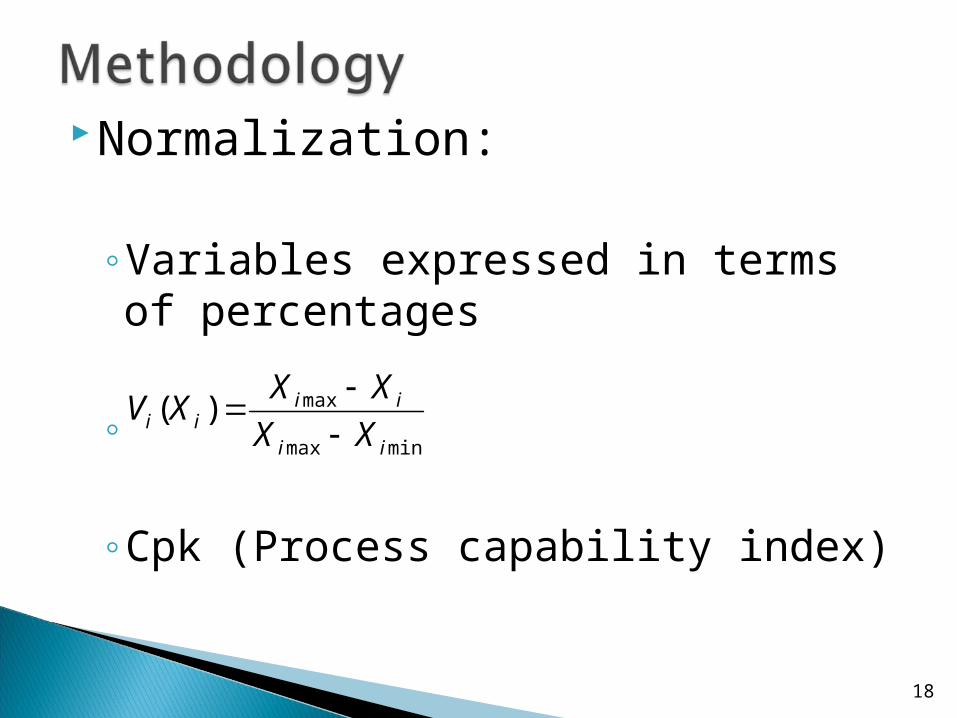
Normalization:
◦Variables expressed in terms of percentages
◦A
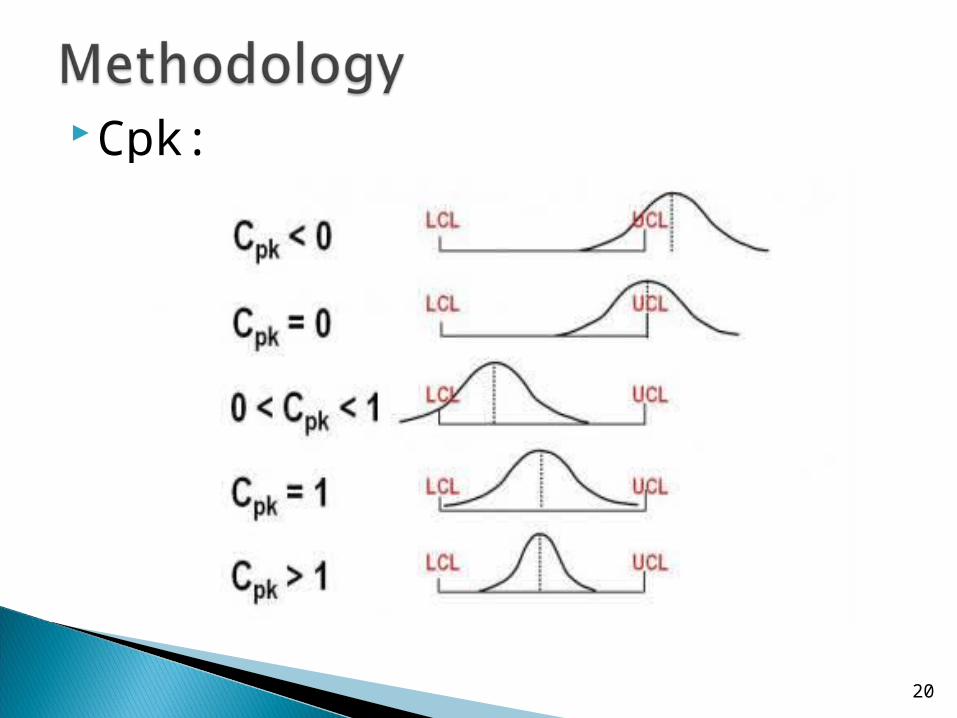
◦Cpk (Process capability index)
18
minmax
max)(ii
iiii XX
XXXV
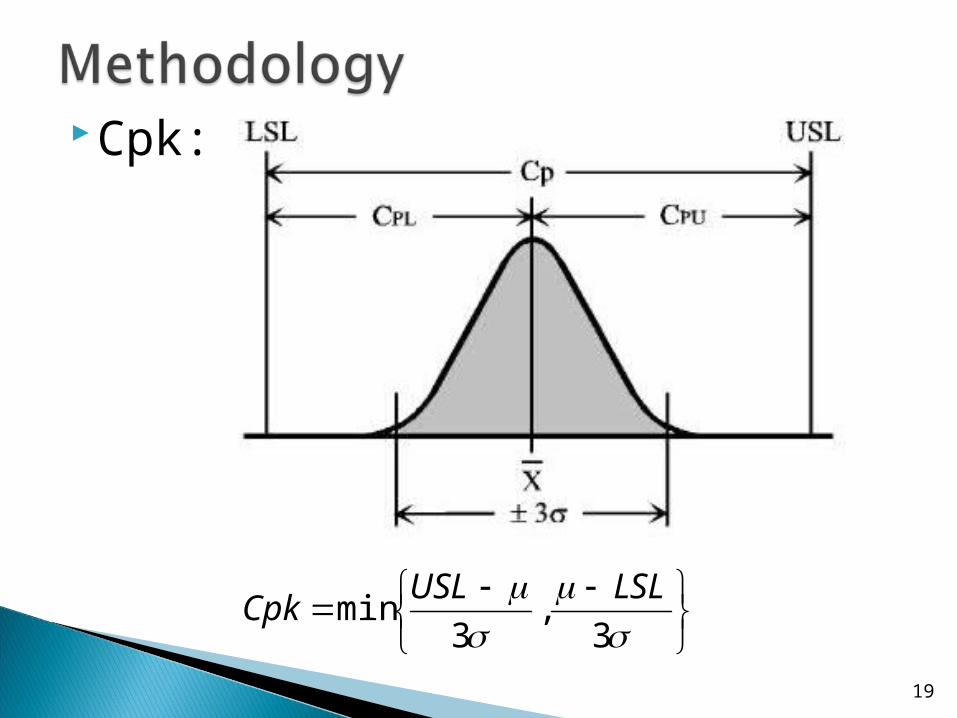
Cpk:
19
3
,3
minLSLUSL
Cpk
Cpk:
20
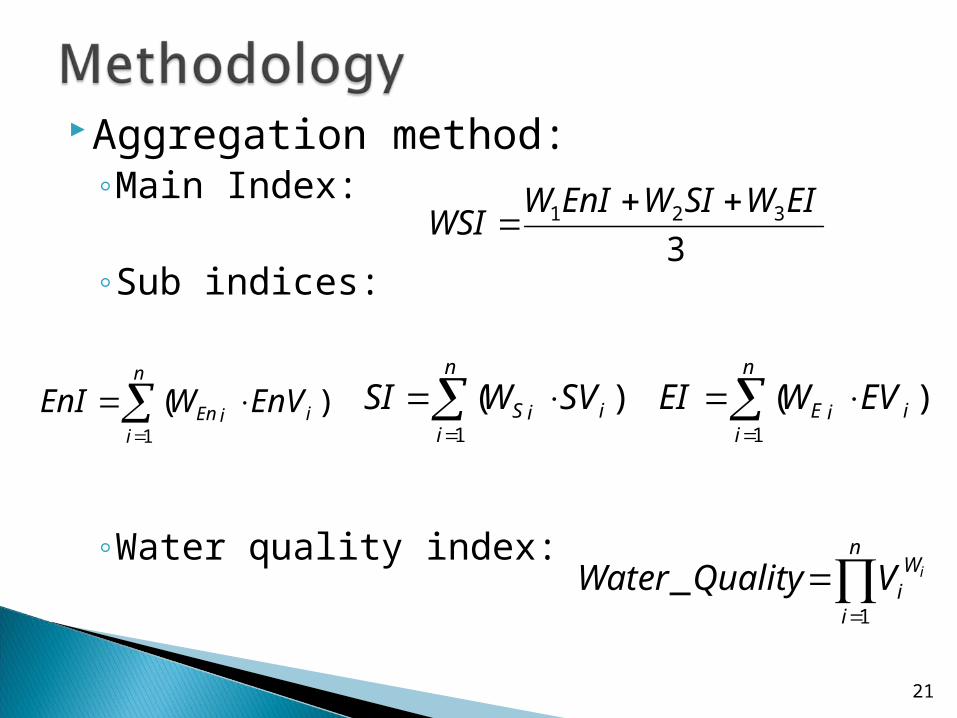
Aggregation method:◦Main Index:
◦Sub indices:
◦Water quality index:
21
3321 EIWSIWEnIW
WSI
n
iiiEn EnVWEnI
1
)(
n
iiiS SVWSI
1
)(
n
iiiE EVWEI
1
)(
n
i
Wi
iVQualityWater1
_

Weighting:
◦Delphi Method:
Academic
NGOs
Water management entities
22
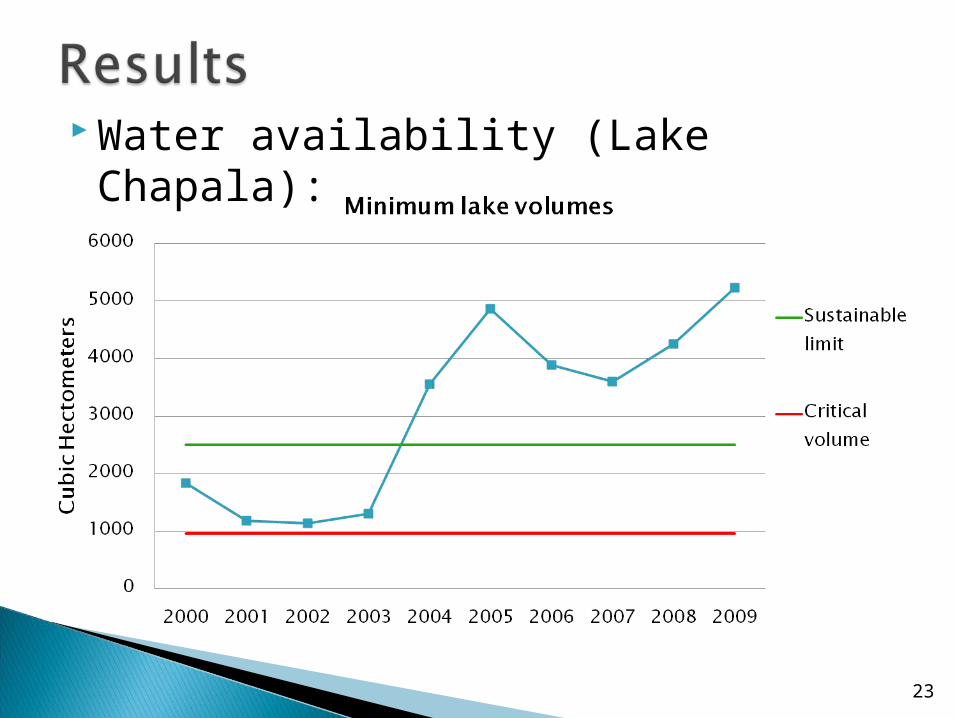
Water availability (Lake Chapala):
23
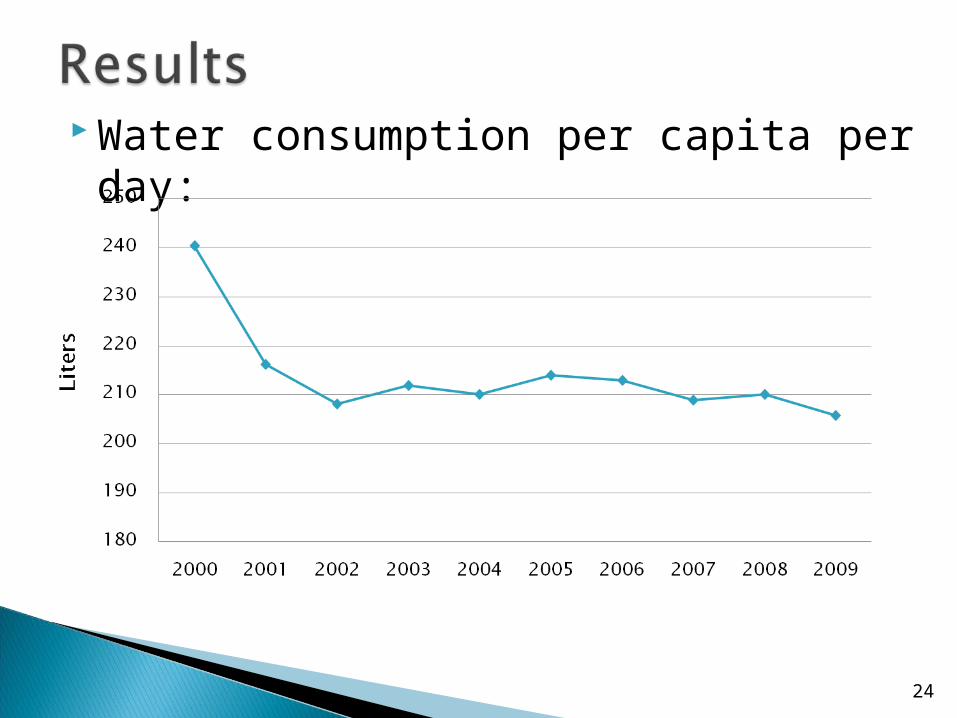
Water consumption per capita per day:
24
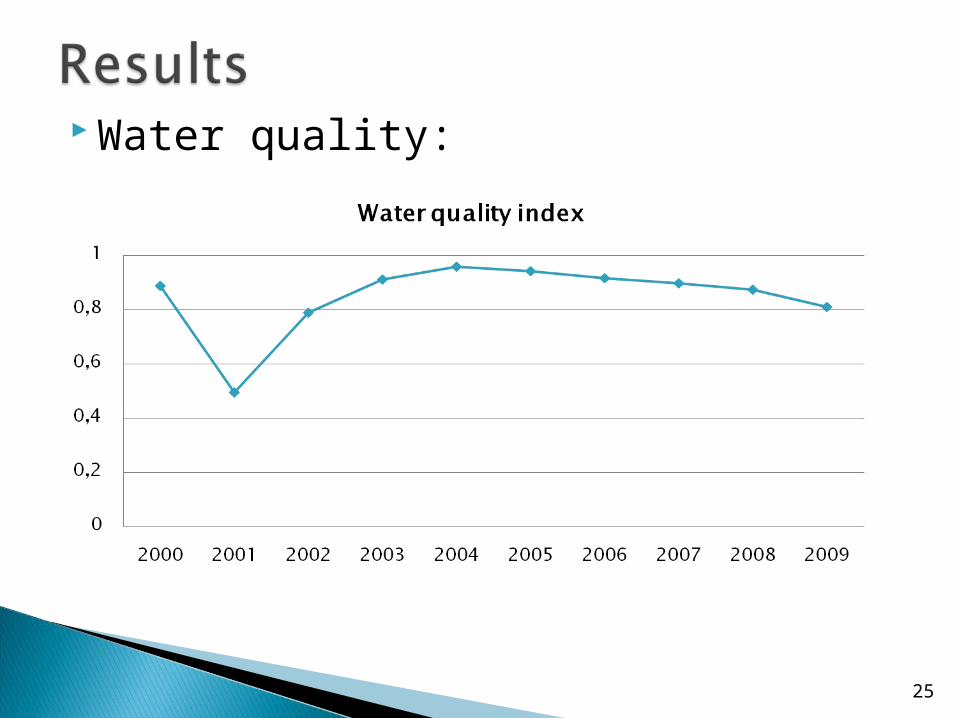
Water quality:
25
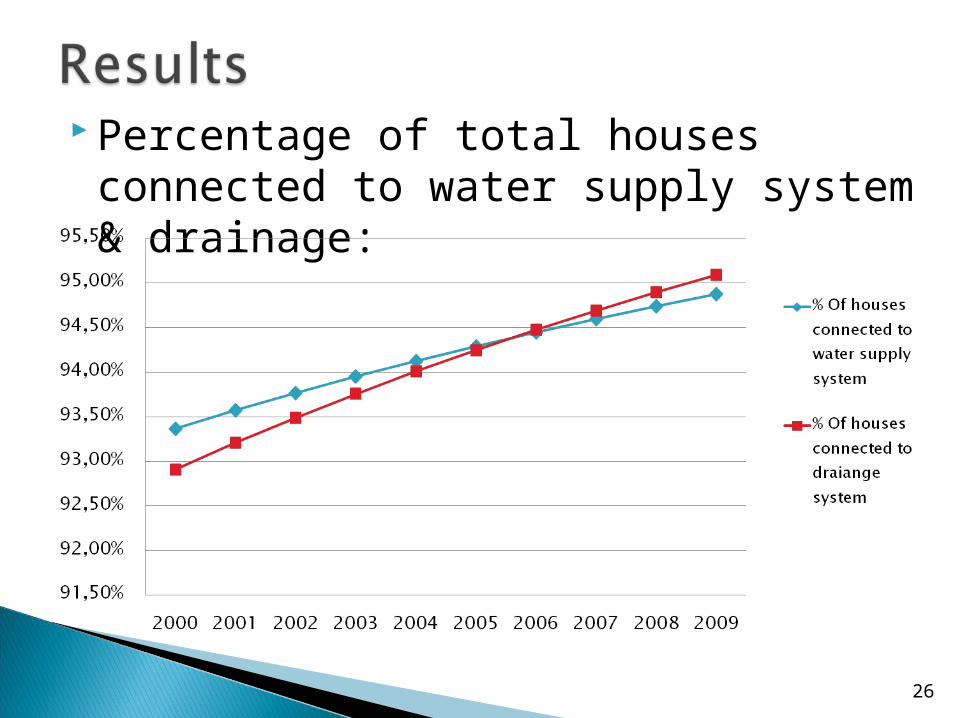
Percentage of total houses connected to water supply system & drainage:
26
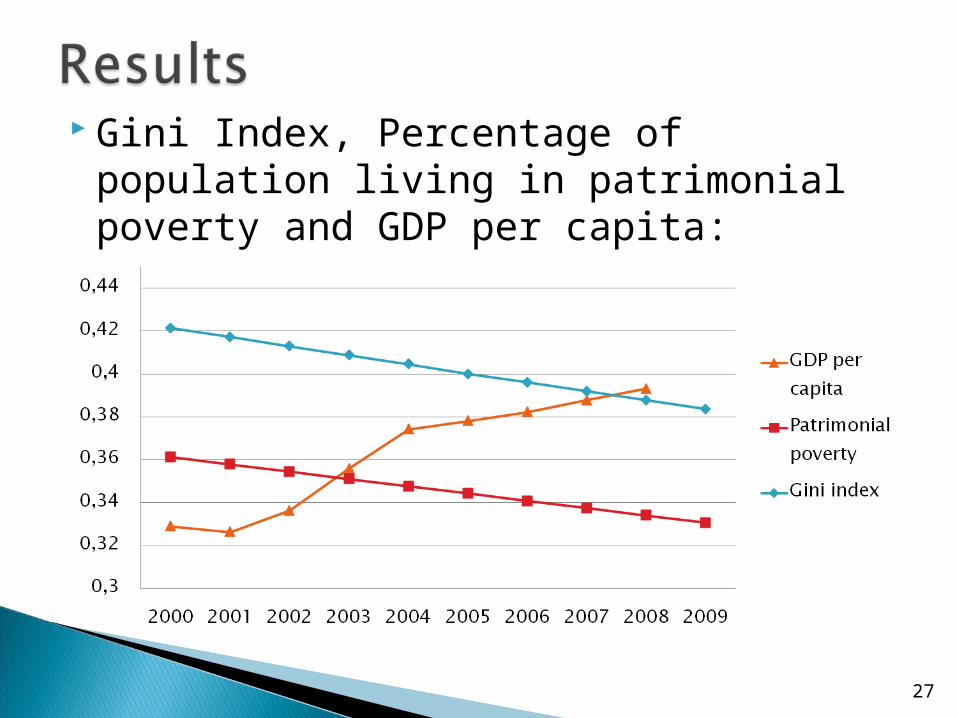
Gini Index, Percentage of population living in patrimonial poverty and GDP per capita:
27
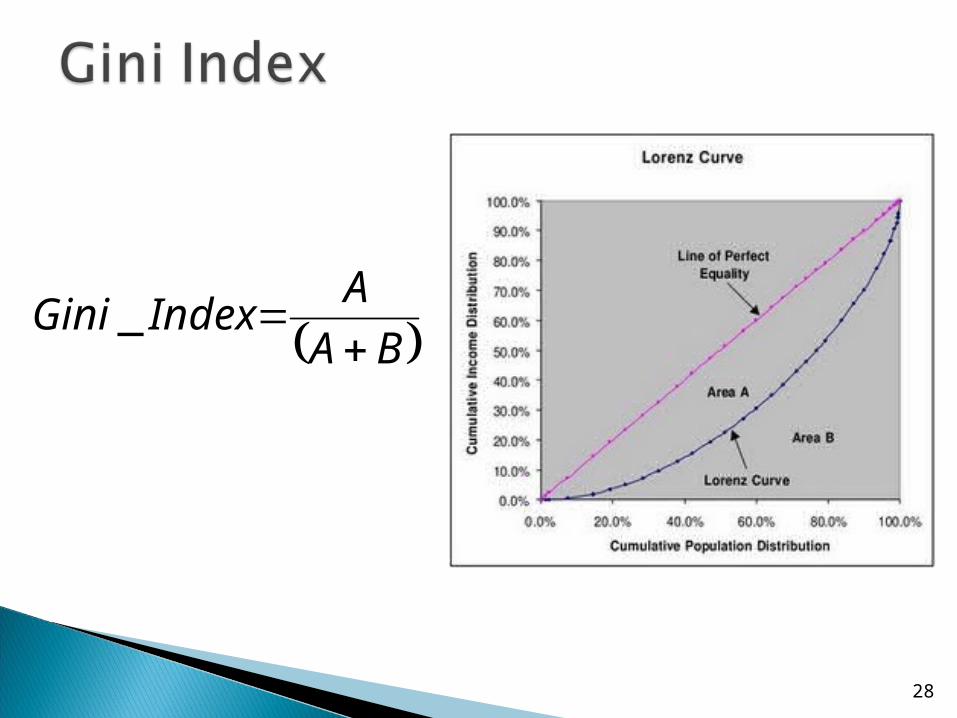
28
BA
AIndexGini
_
29
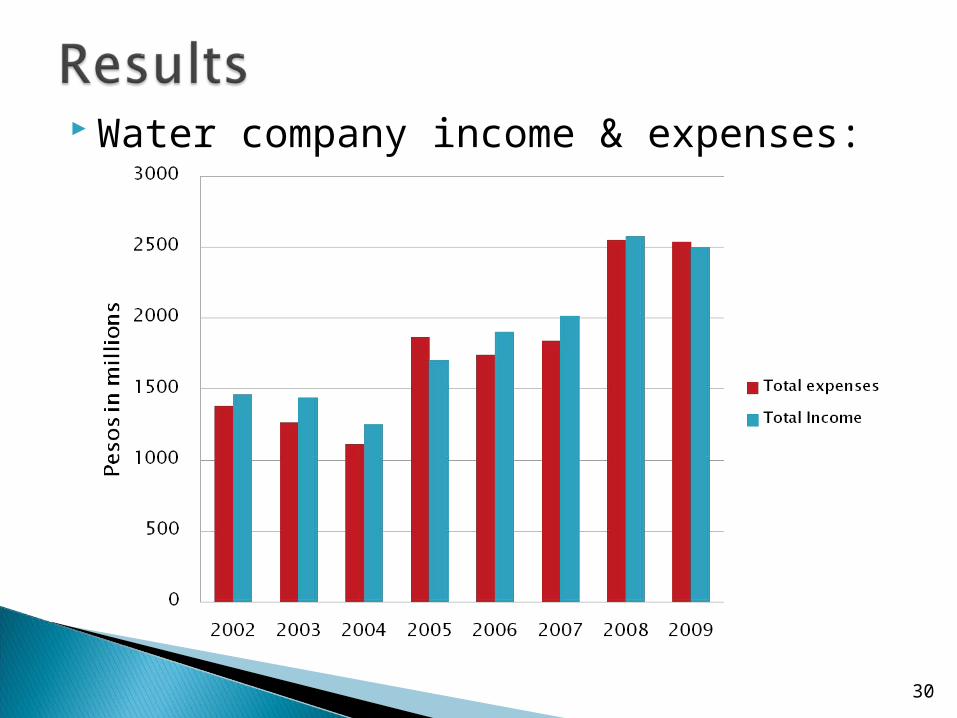
Water company income & expenses:
30
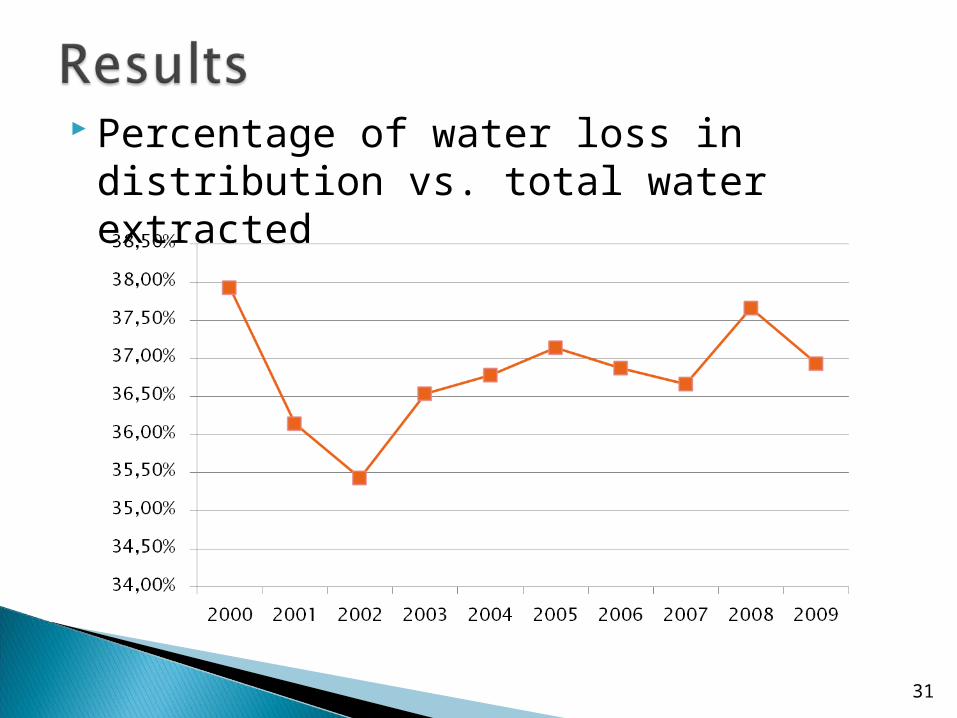
Percentage of water loss in distribution vs. total water extracted
31
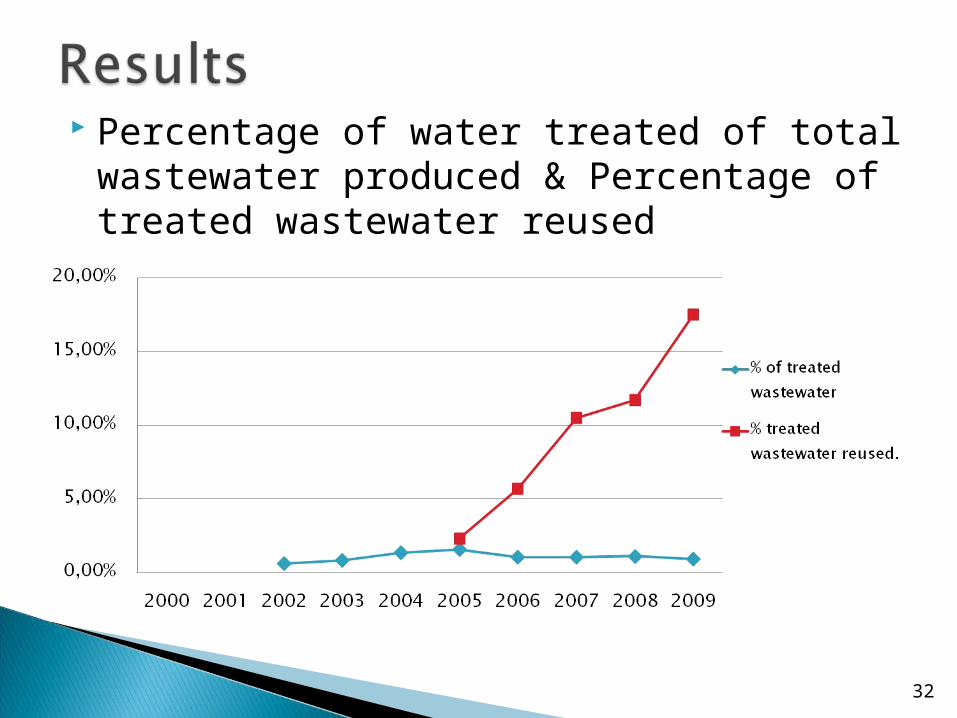
Percentage of water treated of total wastewater produced & Percentage of treated wastewater reused
32
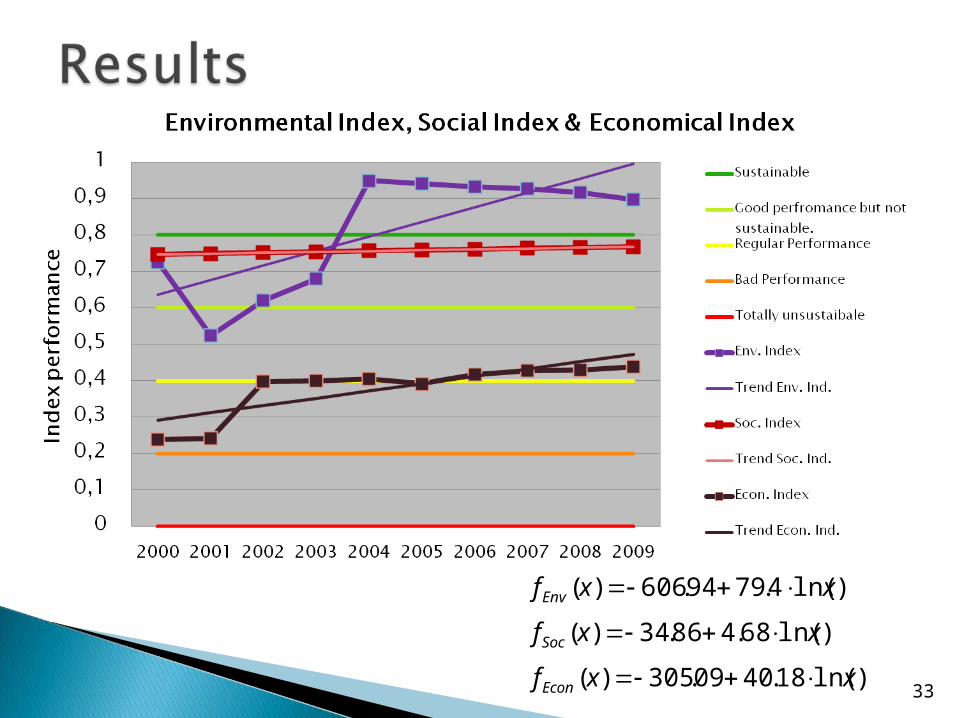
33
)ln(4.7994.606)( xxfEnv
)ln(68.486.34)( xxfSoc
)ln(18.4009.305)( xxfEcon
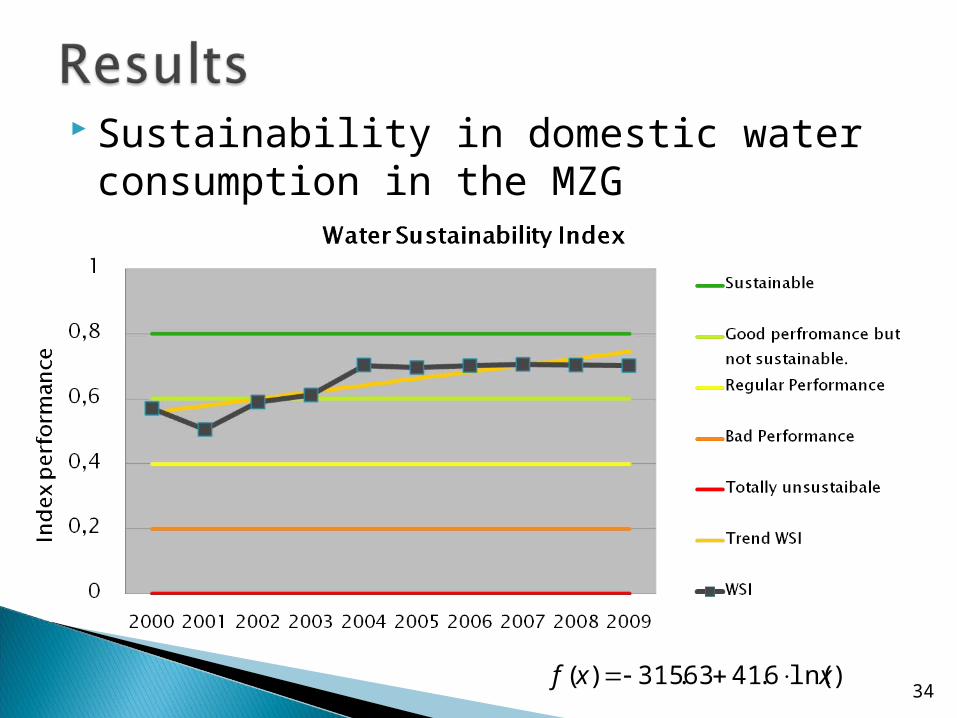
Sustainability in domestic water consumption in the MZG
34)ln(6.4163.315)( xxf
◦The City of Guadalajara can’t be considered sustainable in its domestic water consumption
◦The trend is showing sustainability in Guadalajara is improving
◦The main improvement aspects are: Water treatment. To reduce poverty and increasing equality. To reduce the amount of water lost in the system. To increase the use of water saving dispositives and
methods.
35
◦The model can be used in a local scale; however, some socio-economical indicators are commonly measured for a regional or global scale.
36

37