Embed Size (px)
Citation preview

JPEL Private Equity Limited Unaudited Interim Report and Condensed Financial Statements
for the period ended 31 December 2019
Table of Contents
Financial Summary (Company Information) 1
Overview, Investment Strategy, Investment Policy & Leverage 2
Chairman’s Statement 3
Corporate Actions 6
Statement of Principal Risks and Uncertainties 7
Responsibility Statement 8
Manager’s Report 9
Portfolio Review
Capital Calls and Distributions
Top 20 Funds & Companies Information
Condensed Interim Financial Statements: Unaudited
Condensed Interim Statement of Comprehensive Income 15
Condensed Interim Statement of Financial Position 16
Condensed Interim Statement of Changes in Equity 17
Condensed Interim Statement of Cash Flows 18
Notes to the Condensed Interim Financial Statements 19
Information about the Company 32
Forward looking statements including opinions or expectations about any future events contained in this report are base on a variety of estimates and assumptions. These estimates and assumptions are inherently uncertain and are subject to numerous business, industry, market, regulatory, geopolitical, competitive and financial risks that are outside of the Company’s or the Board’s control. As such, there can be no assurance that any such estimates and assumptions will prove accurate.

Financial Summary (Company Information)
1 JPEL Private Equity Limited Unaudited Interim Report and Condensed Financial Statements 31 December 2019
31 December 2019
US$ Equity Shares
NAV per Share $1.79
Share Price $1.30
Shares in Issuance (excluding shares held in treasury) 151.4m
Statement of Financial Position (extract)
Investments at Fair Value $256.5m
Bank Deposits $15.3m
Other Assets1 $0.1m
Credit Facility -
Other Liabilities2 ($1.2m)
US$ Equity Net Asset Value3 $270.8m
PERFORMANCE AS AT 31 DECEMBER 2019
JPEL Performance Since Inception4
Past performance is not an indication of future performance.
1 Includes accrued interest income and derivative assets.
2 Includes fee accruals and other payables.
3 Numbers may not sum due to rounding. 4 Source: Manager, Bloomberg as at 31 December 2019.

Overview, Investment Strategy, Investment Policy & Leverage
2 JPEL Private Equity Limited Unaudited Interim Report and Condensed Financial Statements 31 December 2019
OVERVIEW
JPEL Private Equity Limited (“JPEL” or the “Company”) is a Guernsey registered and incorporated closed ended investment company with a Premium Listing on the London Stock Exchange (LSE: JPEL).
The investment advisor of the Company is FCF JPEL Management LLC (the “FCF JPEL” or the “Manager”). The Manager is a Delaware limited liability company and an affiliate of Fortress Investment Group LLC (“FIG” or “Fortress”). The Manager is a “relying advisor” of Fortress, pursuant to applicable SEC guidance.
The Company has entered into a management agreement with the Manager, subject to the overall supervision of the Board of Directors (the “Directors” or the “Board”). All Directors are independent of the Manager. The Directors have overall responsibility for the Company’s investment policy and the Company’s activities.
The key measure of performance used by the Board and Shareholders to assess the Company’s performance is the NAV which is prepared on a monthly basis by IQ EQ Fund Services (Guernsey) Limited (formerly called Augentius (Guernsey) Limited) (the “Administrator”) or (“IQ EQ”).
INVESTMENT STRATEGY & INVESTMENT POLICY
Following the retirement of JPEL’s 2017 Zero Dividend Preference Shares in October 2017 and change to the Company’s investment policy, the Manager is effecting an orderly realisation of the investments and other assets comprised in the Company’s Portfolio and will seek to realise such investments and assets in order to maximise returns to US$ Equity Shareholders. This will include the Manager exploring the private equity secondary market for the Company’s legacy fund interests within three years from June 2016 as well as holding the direct investment portfolio until maturity, if the Manager believes that market pricing would be more favourable than realising such investments before their maturity. The Company has not and will not make any new investments save for follow-on investments associated with investments in existence as of June 2016 to meet capital calls with respect to its undrawn commitments to underlying investments or to preserve or protect the value of its existing investments as of June 2016.
LEVERAGE
The Company has the ability to borrow up to 30% of its adjusted total of capital and reserves subject to and in accordance with the limitations and conditions in its Articles of Incorporation (“Articles”). As part of its leverage policy, the Company may borrow for short-term or temporary purposes as is necessary for settlement of transactions, to facilitate the operation of the over-commitment policy or to meet ongoing expenses. The Directors and the Manager will not incur any short-term borrowings to facilitate any tender or redemption of US$ Equity Shares unless such borrowings have a repayment period of 180 days or less. The Company is indirectly exposed to borrowings to the extent that subsidiaries and underlying funds in its portfolio are themselves leveraged.

Chairman’s Statement
3 JPEL Private Equity Limited Unaudited Interim Report and Condensed Financial Statements 31 December 2019
During the last six months, JPEL continued to effect an orderly realisation of the Company’s portfolio and to seek to maximise returns to shareholders.
2019 SEMI ANNUAL HIGHLIGHTS
• US$ Equity Share price decreased 9.5% to $1.295 during the six month period ending 31 December 2019.
• NAV per US$ Equity Share increased $0.09, or 5.3%, to 1.79 from $1.70 over the same period.
• JPEL’s sixth mandatory redemption returned $65 million to US$ Equity Shareholders on 25 October 2019.
REVIEW OF PROGRESS SINCE JANUARY 2014
On 15 January 2014, JPEL announced that it would cease capital distributions to US$ Equity Shareholders and invest up to $150 million in private companies, predominantly in the US and Western Europe, via the secondary and co-investment markets. The goal was to enhance NAV through several targeted secondary direct investments while utilizing cash flows received from JPEL’s mature, legacy portfolio to fund these new investments and to reduce debt.
When JPEL made this announcement, the Company’s US$ Equity Share price and NAV per share was $0.80 and $1.13, respectively and total outstanding debt (including Zero Dividend Preference Shares) was $167.8 million.
The end of the 2019 calendar year marks approximately six years since this announcement:
• In total, $299.2 million was returned to equity shareholders at prevailing NAVs ranging from $1.48 to $1.70
• As discussed in prior reports, a significant portion of JPEL’s performance and volume of cash distributions is directly attributable to the investments made during the two years from 2014-2016 (“The New Portfolio”)
o The New Portfolio (including a late 2013 investment) has produced a MOIC of 2.29x and an IRR of 26.9%1 o The realized and partially realized portfolio performance is approximately 3.05x cost with an IRR of 38.7%1
New Portfolio: Performance through 31 December 20191
NAV AND SHARE PRICE PERFORMANCE
In the six months ending 31 December 2019, JPEL’s NAV per US$ Equity Share increased $0.09 or 5.3 % from $1.70 to $1.79. JPEL’s US$ Equity Share price decreased 9.9% during the six month period from $1.43 to $1.295. Subsequent to the period, amidst turbulent markets, JPEL’s US$ Equity Share price declined to $1.26 on 11 March 2020. As of 11 March 2020, JPEL traded at a 29% discount to prevailing NAV.
RETURN OF CAPITAL
On 22 October 2019, JPEL completed its sixth mandatory redemption and returned $65 million or 20.1% of the September 2019 NAV, representing approximately 38.2 million US$ Equity Shares. During the 2019 calendar year, JPEL returned $90 million to shareholders. Since December 2016, JPEL has returned $299.2 million to US$ Equity Shareholders, or approximately 62% and 79% of the Company’s 31 October 2016 NAV and market capitalization, respectively2.
The Company will continue to review its cash balance and will determine the timing of the next mandatory redemption in due course.
1 IRR and MOIC have been adjusted to exclude the effect of foreign exchange. Returns are net of underlying sponsor fees and gross of JPEL fees.
2 The date 31 October 2016 represents the most current NAV at the time of the Company’s initial mandatory redemption.
Cost Realized Unrealized Total Value MOIC IRR
Realized & Partially Realized $106.5 $261.5 $63.4 $324.9 3.05x 38.7%
Unrealized 76.6 0.3 93.4 93.7 1.22x 4.8%
Total New Investments $183.1 $261.8 $156.9 $418.7 2.29x 26.9%

Chairman’s Statement continued
4 JPEL Private Equity Limited Unaudited Interim Report and Condensed Financial Statements 31 December 2019
CAPITAL POSITION
As of 31 December 2019, the Company did not have any leverage nor any outstanding ZDPs.
JPEL refinanced and extended its existing credit facility with Lloyds through 31 December 2020. The size of JPEL’s facility was reduced to $20 million with interest of LIBOR / EUIROBOR + 250bps.
DISTRIBUTION ACTIVITY
During the six months ended 31 December 2019, the portfolio generated gross distributions of $57.2 million and funded capital calls of $2.1 million. While the portfolio produced distributions from a large number of holdings, notable distributions during the period included: $15.8 million from the sale of RCR Industrial, $8.9 million in the second of two payments from the sale of Grupo Zena, $7.4 million as part of a dividend recapitalization from Swania, $1.4 million from Black Diamond and $1.3 million from Global Buyout Fund. In addition, JPEL exited its investment in Leeds Equity Partners V, L.P. and received $15.0 million in proceeds.
Distributions received during JPEL’s 2019 calendar year represented 23.6% of 31 December 2018 investment portfolio value. This a significant increase from the prior year when JPEL received 10.7% of the prior year’s private equity NAV. On average, over the past 11 years, JPEL has received distributions equating to 17.8% of the prior year’s investment portfolio value during a single calendar year. As JPEL’s portfolio runs off and becomes more concentrated, distribution activity from the underlying portfolio is expected to be increasingly uneven.
Calendar Year Distribution Activity as a Percentage of Prior December Year-End Private Equity Value*
* Source: Manager. As at 31 December 2019.

Chairman’s Statement continued
5 JPEL Private Equity Limited Unaudited Interim Report and Condensed Financial Statements 31 December 2019
POST DECEMBER EXITS AND ONGOING PORTFOLIO MANAGEMENT
On 12 March 2020, JPEL partially realized its investment in its second largest portfolio company, a Tax Advisory Services Company. The partial realization results in an investment return of approximately 4.39x and an IRR of approximately 33% for JPEL. As part of the transaction, JPEL received proceeds of approximately $37.5 million and it will continue to hold approximately 20% of its position in the company, valued at approximately $10.4 million at 31 December 2019. At 31 December 2019, the company represented 18.7% of JPEL’s private equity portfolio value.
The Manager is currently exploring various liquidity options for certain of the Company’s investments and will provide more detail as and when these opportunities materialize.
MARKET OUTLOOK
Given the recent volatility in the global markets as a result of the novel coronavirus (COVID-19), the Manger is actively monitoring the impact of the COVID-19 outbreak on JPEL’s underlying portfolio companies. The Board and Manager will disclose any meaningful impact of the virus on its portfolio on a going forward basis.
JPEL’s current portfolio is fairly mature with a weighted average age of 6.6 years at 31 December 2019.
CONCLUSION
I have had the pleasure of speaking with many JPEL US$ Equity Shareholders and hope to continue to do so in the future. Both JPEL’s Board and Manager are focused on returning capital to US$ Equity Shareholders at prevailing net asset value. In conclusion, I would like to thank US$ Equity Shareholders for the support that they have placed in the Company.
Sean Hurst Chairman 17 March 2020

Corporate Actions
6 JPEL Private Equity Limited Unaudited Interim Report and Condensed Financial Statements 31 December 2019
2019 CORPORATE ACTIONS
• On 8 January 2019, JPEL announced that the fifth mandatory redemption of the Company's US$ Equity Share class announced on 10 December 2018 was completed.
• On 22 October 2019, JPEL announced that the sixth mandatory redemption of the Company's US$ Equity Share class announced on 9 October 2019 was completed.
• On 5 November 2019, JPEL published a circular to Shareholders. o The circular contained a notice of AGM on 25 November 2019. o The following summarises all of the resolutions the Company sought approval for at the Annual General
Meeting.
• Special Resolutions 1. To renew the Company's authority to make purchases of up to 15 per cent. of each class of its own
issued shares pursuant to any proposed Tender Offer. 2. To renew the Company's general authority to make market purchases of up to 14.99 per cent. of
each class of its own issued Shares.
• Ordinary Resolutions 3. To approve and adopt the Annual Report and Financial Statements of the Company for the year
ended 30 June 2019. 4. To re-elect PricewaterhouseCoopers CI LLP as Auditors to the Company. 5. To re-authorise the Directors to determine the Auditors' remuneration. 6. To re-authorise and agree the remuneration of the Directors in accordance with the Articles of
Incorporation. 7. To re-elect Christopher P. Spencer as a non-executive, independent director of the Company, who
retires by rotation. 8. To re-elect John Loudon as a non-executive, independent director of the Company, who retires by
rotation. 9. To re-elect Anthony (Tony) Dalwood as a non-executive, independent director of the Company,
who retires by rotation. 10. To re-elect Sean Hurst as a non-executive, independent director of the Company, who retires by
rotation.
• On 26 November 2019, JPEL announced that at the AGM of the Company held on 25 November 2019, all resolutions put to shareholders at the AGM were duly passed.
Statement of Principal Risks and Uncertainties
7 JPEL Private Equity Limited Unaudited Interim Report and Condensed Financial Statements 31 December 2019
The Company, the Company’s investments and the underlying portfolio companies are materially affected by a variety of risks and uncertainties in the global financial markets and economic conditions throughout the world. The risks described below are the principle risks which are considered by the Board to be material to the shareholders of the Company. Greater detail on these risks is provided in note 3 of the Condensed Interim Financial Statements (the “Financial Statements”). The Directors consider that the principal risks and uncertainties have not changed materially since the year end and are not expected to change materially for the remaining six months of the financial year, except as discussed in the Chairman’s Statement.
• Market risk: Market risk embodies the potential for both gains and losses and includes interest rate risk, currency risk and price risk. The Manager works to mitigate risk by creating a diversified portfolio, focusing on achieving a balance across Manager, investment styles, industrial sectors and geographical focus;
• Interest rate risk: Interest rate risk refers to the Company’s exposure to changes in interest rates, primarily relating to cash and cash equivalents and floating rate debt obligations. External interest bearing liabilities are limited in size by the Company’s internal policies;
• Currency risk: Currency risk arises from the possibility that fluctuations in foreign currency exchange rates will affect the value of the Company’s assets and liabilities, the net asset value and the market price of the US$ Equity Shares. As at 31 December 2019, the Company had two currency hedges in place to partially mitigate fluctuations in its foreign exchange exposure.
• Price risk: Price risk is the risk that the value of the instrument will fluctuate as a result of changes in market prices (other than those arising from interest rate risk or currency risk), whether caused by factors specific to an individual investment, its issuer, or factors affecting all instruments traded in that market;
• Credit risk: Credit risk is the risk that an issuer or counterparty will be unable or unwilling to meet a commitment that it has entered into with the Company. The Company’s exposure to credit risk is managed on an ongoing basis by the Manager and on a quarterly basis by the Board;
• Liquidity risk: The Company’s financial instruments primarily include investments in unlisted equity investments that are not publicly traded and therefore may be illiquid. As a result, the Company may not be able to liquidate some of its investments in these instruments at an amount close to their fair value should such liquidation be necessary to meet liquidity requirements, including the need to meet outstanding undrawn commitments and other obligations as and when these fall due.
• Other risks: The Company is exposed to various other risks with respect to its financial assets including valuation risk, reliance on the Manager, political and regulatory risk.
Related Party Transactions
Related party transactions are reported in note 13 of the Financial Statements.
Going Concern The Directors have examined significant areas of possible credit and liquidity risk and have satisfied themselves that no material uncertainties exist. The Directors have taken into consideration the Company’s expected cash flows for a period exceeding twelve months from the date of approval of the Financial Statements, in respect of follow-on investments and ongoing fees. Given the Company’s current cash position, and the undrawn amounts from the Lloyds facility (see note 9 of the Financial Statements for further details on the credit facility), combined with the expected distributions over the same period, the Directors believe the Company has adequate resources to continue in operational existence for a period of at least twelve months from the date of approval of the Financial Statements. After due consideration of this, the Directors believe it is appropriate to adopt the going concern basis in preparing the Financial Statements.

Responsibility Statement
8 JPEL Private Equity Limited Unaudited Interim Report and Condensed Financial Statements 31 December 2019
The Directors confirm to the best of their knowledge: RESPONSIBLEMARK a. The Financial Statements have been prepared in accordance with International Accounting Standard 34 Interim
Financial Reporting;
b. This report includes a fair review of the information required by the FCA’s Disclosure Guidance and Transparency Rules 4.2.7R; and
c. This report includes a fair review of the information required by the FCA’s Disclosure Guidance and Transparency Rules 4.2.8R.
This report was approved by the Board on 17 March 2020 and the above Responsibility Statement was signed on its behalf by
Sean Hurst Chairman

Manager’s Report
9 JPEL Private Equity Limited Unaudited Interim Report and Condensed Financial Statements 31 December 2019
PORTFOLIO REVIEW With an investment value of $256.5 million, JPEL’s portfolio is diversified globally across multiple investment strategies and industries as at 31 December 2019. Investment Type1
Direct investments comprise 80% of the portfolio, while secondary investments make up 13% of JPEL’s portfolio NAV.
As at 31 December 2019, primary investments comprised 5% of JPEL’s portfolio while funded primaries made up 2% of JPEL’s portfolio NAV.
Investment Strategy1
Buyout Fund Sizes2
Currently, buyout funds constitute approximately 83% of JPEL’s portfolio. Within this strategy, the majority of the Company’s investments are with fund managers that focus on small to medium sized buyouts, which generally utilise less leverage.
JPEL’s exposure to venture capital stands at 7%. JPEL’s exposure to real estate, special situation funds and infrastructure stands at 6%, 3% and 1%, respectively.
1 Based on 31 December 2019 market value of investments, percentages based on underlying fund-level values. 2 Fund classifications for buyout strategy are based on total fund commitments: Small: $0 - $500 million; Medium: $500 - $2,000 million; Large: over $2,000 million. Co-investments allocated by size of underlying sponsor fund.

Manager’s Report continued
10 JPEL Private Equity Limited Unaudited Interim Report and Condensed Financial Statements 31 December 2019
PORTFOLIO REVIEW continued
Portfolio Age1
Average Age of Portfolio
Weighted average age: 6.6 years
Direct investments: 5.5 years
Fund investments: 10.6 years
Buyout investments: 5.9 years
Venture investments: 10.6 years
With a weighted average age of 6.6 years, JPEL’s portfolio is well positioned on the private equity “J-Curve” to continue to receive distributions.
Geographic Footprint2
JPEL’s private equity portfolio is diversified with investments in over 30 countries, helping to mitigate country and regional risk as well as to capitalise on the growth of expanding economies. North America and Europe represent the majority of the Company’s portfolio at 68% and 25% respectively. JPEL’s allocation to Asia stands at 4% while investments in the rest of the world represent 3% of the portfolio.
1 Based on 31 December 2019 market value of investments, percentages based on underlying company-level values. Average age of investments is based on the date in which each individual portfolio company investment was made, subject to availability. Weighting is based on underlying portfolio company level values. Age calculated at 31 December 2019. Average is weighted based on investments at market value as at 31 December 2019 percentages based on underlying company-level values. Direct investment age is based on the date of JPEL’s investment. Fund investment age is based on the date of the Sponsors' original investment. 2 Based on 31 December 2019 market value of investments, percentages based on underlying company-level values.
Manager’s Report continued
11 JPEL Private Equity Limited Unaudited Interim Report and Condensed Financial Statements 31 December 2019
PORTFOLIO REVIEW continued
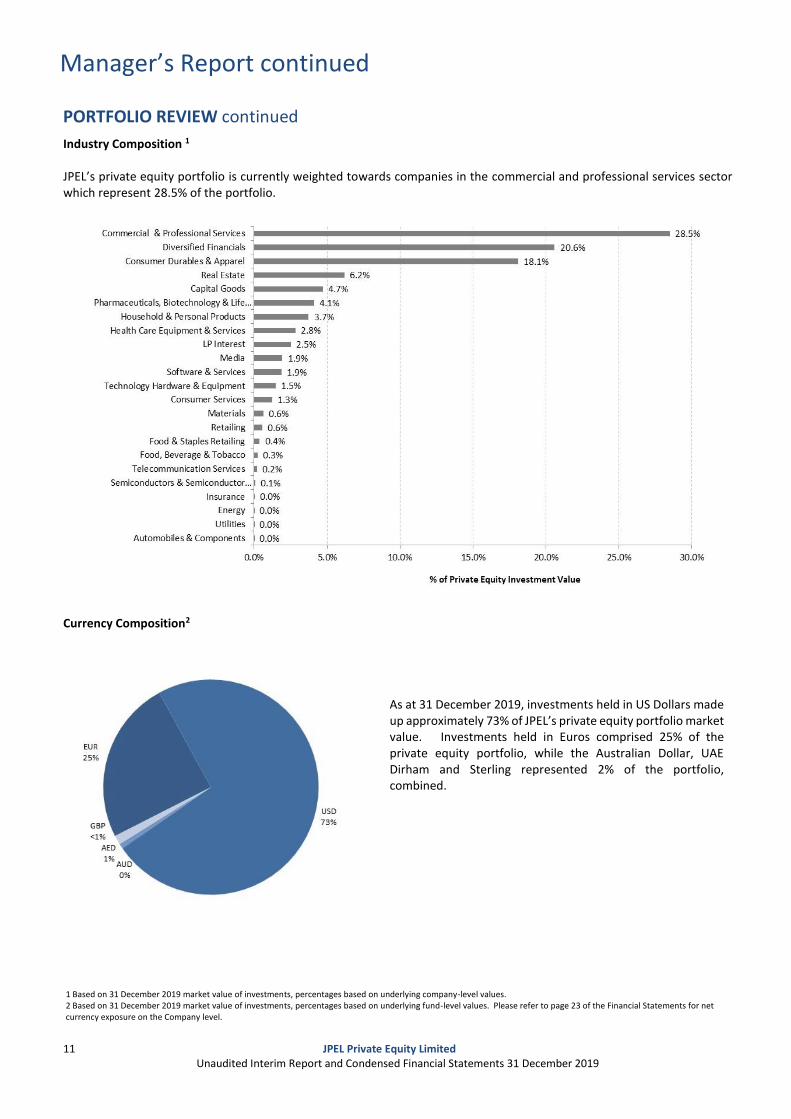
Industry Composition 1 JPEL’s private equity portfolio is currently weighted towards companies in the commercial and professional services sector which represent 28.5% of the portfolio.
Currency Composition2
As at 31 December 2019, investments held in US Dollars made up approximately 73% of JPEL’s private equity portfolio market value. Investments held in Euros comprised 25% of the private equity portfolio, while the Australian Dollar, UAE Dirham and Sterling represented 2% of the portfolio, combined.
1 Based on 31 December 2019 market value of investments, percentages based on underlying company-level values. 2 Based on 31 December 2019 market value of investments, percentages based on underlying fund-level values. Please refer to page 23 of the Financial Statements for net currency exposure on the Company level.

Manager’s Report continued
12 JPEL Private Equity Limited Unaudited Interim Report and Condensed Financial Statements 31 December 2019
CAPITAL CALLS AND DISTRIBUTIONS
Capital Call and Distribution Summary1
2019 generated significantly more distributions that the prior calendar year with $75.5 million in net cash received in contrast to 2018 when the Company received $27.3 million. JPEL’s mature portfolio is well positioned to continue to receive distributions. As the Company’s older fund of funds assets run off, the Manager anticipates that distribution activity will be intermittent with larger cash flows stemming from the sale of direct investments.
1 The above capital calls and distributions are shown above on a cash basis.

Manager’s Report continued
13 JPEL Private Equity Limited Unaudited Interim Report and Condensed Financial Statements 31 December 2019
BUYOUT COMPANY VALUATIONS AND PERFORMANCE The following charts provide an analysis of JPEL’s ten largest traditional buyout companies which comprise more than 72% of the NAV at 31 December 2019. Of JPEL’s 20 largest companies by unrealized value, 12 are traditional buyout companies, three are venture capital, two are real estate and two are special situations and one is a growth equity investment. One of the buyout companies have been excluded from this analysis due to incompatible data.
Top Buyout Company EBITDA Growth1
Top Buyout Company Revenue Growth1
Last twelve months (“LTM“) EBITDA for JPEL’s top investments grew by a weighted average of 8.2%. Includes information for seven companies.
LTM Revenue for JPEL’s top investments grew by a weighted average of 9.0%. Includes information for eight companies.
Top Buyout Company Enterprise Value / EBITDA1
Top Buyout Company Net Debt / EBITDA1
On a weighted average basis, JPEL’s top buyout companies are carried at an Enterprise Value / EBITDA multiple of 8.4x. Includes information for six companies.
JPEL’s top buyout companies have a weighted average Net Debt / EBITDA multiple 1.7x. Includes information for seven companies.
1. Analysis based on LTM information on JPEL’s largest buyout investments and as at 31 December 2019. Of JPEL’s top 20 underlying company exposures, 11 companies are classified as traditional buyout but two of those companies were excluded from this analysis because of incompatible data. Information for all of the companies is as of 30 September 2019 or later.

Manager’s Report continued
14 JPEL Private Equity Limited Unaudited Interim Report and Condensed Financial Statements 31 December 2019
TOP 20 FUNDS & COMPANIES INFORMATION Top20mark Top 20 Funds1,2
Fund Region Fund Strategy % of Private
Equity Investments
1
Life Sciences Holdings SPV I Fund, L.P. Europe Venture Capital 2.4%
2 Global Buyout Fund, L.P. Other Buyout 1.6%
3 Beacon India Private Equity Fund Asia Buyout 1.6%
4 Black Diamond Capital Management North America Special Situations 1.6%
5 Esprit Capital I Fund Europe Venture Capital 1.3%
6 Liberty Partners II, L.P. North America Buyout 0.9%
7 Industry Ventures Fund V, L.P North America Venture Capital 0.8%
8 Blue River Capital I, LLC Asia Buyout 0.8%
9 Global Opportunistic Fund Other Buyout 0.7%
10 Oaktree Ports America Fund (HS III), L.P. North America Infrastructure 0.6%
11 Omega Fund IV, L.P. North America Venture Capital 0.6%
12 Gulf Healthcare International LLC Other Buyout 0.6%
13 Alcentra Euro Mezzanine No1 Fund L.P. Europe Special Situations 0.6%
14 Wellington Partners Ventures III Life Science Fund L.P. Europe Venture Capital 0.6%
15 Omega Fund III, L.P. Europe Venture Capital 0.5%
16 Trumpet Feeder Ltd North America Buyout 0.5%
17 Strategic Value Global Opportunities Fund I-A North America Special Situations 0.5%
18 Private Equity Access Fund II Ltd North America Buyout 0.4%
19 Industry Ventures Fund IV, L.P North America Venture Capital 0.3%
20 Cerberus Institutional Partners, LP (Series 4) North America Special Situations 0.3%
Top 20 Companies1,2
Company Country Industry Group % of Private
Equity Investments
1 Mr. Bult's, Inc. North America Commercial & Professional Services 27.6%
2 Tax Advisory Services Company North America Diversified Financials 18.7%
3 Swania Europe Consumer Durables & Apparel 17.5%
4 Polo Holdings S.à.r.l. Europe Capital Goods 4.5%
5 Back Bay (Guernsey) Limited North America Real Estate 3.9%
6 Corsicana Bedding Inc. North America Household & Personal Products 3.7%
7 Genuine Idea Asia Real Estate 2.0%
8 FibroGen North America Pharmaceuticals, Biotechnology & Life Sciences 2.0%
9 ION Media North America Media 1.8%
10 SaaS Company North America Software & Services 1.5%
11 Paratek Pharmaceutical Inc North America Pharmaceuticals, Biotechnology & Life Sciences 1.2%
12 DisplayLink North America Technology Hardware & Equipment 1.1%
13 Concorde Career Colleges, Inc. North America Consumer Services 0.9%
14 Gulf Healthcare International LLC Other Health Care Equipment & Services 0.7%
15 National Stock Exchange Asia Diversified Financials 0.7%
16 HHH Ports America North America LP Interest 0.6%
17 Diaverum Europe Health Care Equipment & Services 0.6%
18 Kloeckner Pentaplast Europe Materials 0.4%
19 The Lenox Group, Inc. North America Consumer Durables & Apparel 0.4%
20 Bicakcilar Group Other Health Care Equipment & Services 0.4%
1 Top 20 Funds and Top 20 Companies include underlying funds and companies indirectly owned through the purchase of secondary interest in Private Equity Access Fund II Ltd, Bear Stearns Global Turnaround Fund, L.P., BoS Mezzanine Partners Fund, L.P. (BoS company-level exposure includes estimated pro rated fund-level leverage), and ROC Capital Trust. 2 Percentages are calculated based on 31 December 2019 unaudited market value of investments.

Condensed Interim Statement of Comprehensive Income - Unaudited for the period ended 31 December 2019
15 JPEL Private Equity Limited Unaudited Interim Report and Condensed Financial Statements 31 December 2019
01/07/2019 01/07/2018
to to
31/12/2019 31/12/2018
Notes $'000 $'000
Income
Interest and distribution income 4 1,975 1,201
Other net changes in fair value of financial assets and financial
l iabilities through profit or loss 7 12,752 (11,023)
Realised gain on forward currency contracts 1,920 2,340
Total net income/(loss) 16,647 (7,482)
Expenses
Investment management fees (1,476) (1,847)
Accounting and administration fees (378) (398)
Audit fees (79) (111)
Directors' fees (82) (84)
Other expenses 6 (437) (514)
Total expenses (2,452) (2,954)
Profit/(loss) before finance costs 14,195 (10,436)
Finance costs
Credit facil ity costs 5 (143) (150)
Net foreign exchange gain 53 7
Profit/(loss) before tax 14,105 (10,579)
Withholding taxes (923) (223)
Profit/(loss) for the period 13,182 (10,802)
Other comprehensive income - -
Total comprehensive income/(loss) for the period 13,182 (10,802)
Earnings per share
Earnings/(losses) per US$ Equity Share $0.09 $(0.05) All items in the above statement are derived from continuing operations. The accompanying notes on pages 19 to 31 form an integral part of the Financial Statements.

Condensed Interim Statement of Financial Position - Unaudited as at 31 December 2019
16 JPEL Private Equity Limited Unaudited Interim Report and Condensed Financial Statements 31 December 2019
31 December 30 June
2019 2019
Notes $'000 $'000
Non-current assetsFinancial assets at fair value through profit or loss
- Investment portfolio 8 256,529 298,746
Current assets
Cash and cash equivalents 15,304 25,741
Receivables 124 117
15,428 25,858
Current liabilities
Payables and accruals (605) (1,398)
Financial l iabilities at fair value through profit or loss
- Derivative financial l iabilities 8 (586) (622)
Net current assets 14,237 23,838
Net Assets 270,766 322,584
Represented by:
Share capital 10 203,097 254,372
Accumulated gain 67,669 68,212
Total equity 270,766 322,584
Number of US$ Equity Shares in issue 10 151,447,719 189,682,752
NAV per US$ Equity Share $1.79 $1.70 The Financial Statements on pages 15 to 31 are approved by the Board of Directors on 17 March 2020 and were signed on its behalf by: Sean Hurst Chris Spencer Director Director The accompanying notes on pages 19 to 31 form an integral part of the Financial Statements.
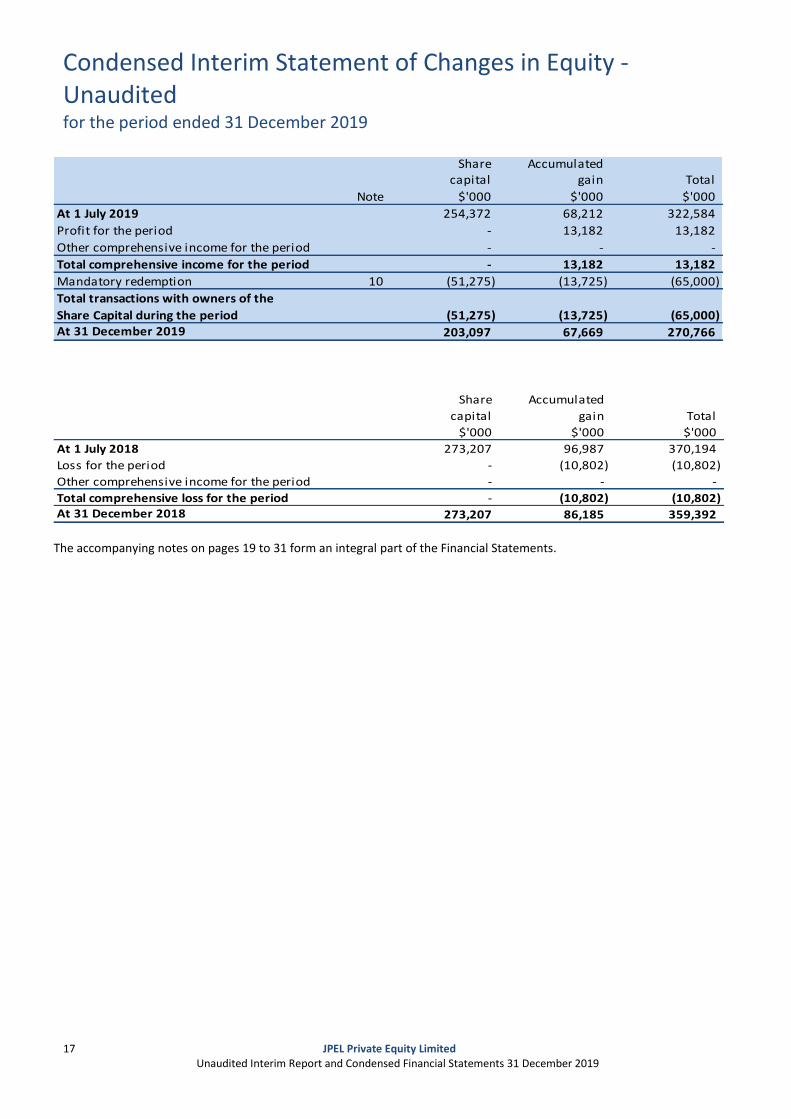
Condensed Interim Statement of Changes in Equity - Unaudited for the period ended 31 December 2019
17 JPEL Private Equity Limited Unaudited Interim Report and Condensed Financial Statements 31 December 2019
Share Accumulatedcapital gain Total
Note $'000 $'000 $'000
At 1 July 2019 254,372 68,212 322,584
Profit for the period - 13,182 13,182
Other comprehensive income for the period - - -
Total comprehensive income for the period - 13,182 13,182
Mandatory redemption 10 (51,275) (13,725) (65,000)
Total transactions with owners of the
Share Capital during the period (51,275) (13,725) (65,000) At 31 December 2019 203,097 67,669 270,766
Share Accumulated
capital gain Total
$'000 $'000 $'000
At 1 July 2018 273,207 96,987 370,194
Loss for the period - (10,802) (10,802)
Other comprehensive income for the period - - -
Total comprehensive loss for the period - (10,802) (10,802) At 31 December 2018 273,207 86,185 359,392
The accompanying notes on pages 19 to 31 form an integral part of the Financial Statements.

Condensed Interim Statement of Cash Flows - Unaudited for the period ended 31 December 2019
18 JPEL Private Equity Limited Unaudited Interim Report and Condensed Financial Statements 31 December 2019
01/07/2019 01/07/2018
to to
31/12/2019 31/12/2018
Notes $'000 $'000
Operating activities
Profit/(loss) for the period 13,182 (10,802)
Adjustments for:
Interest income 4 (289) (178)
Net unrealised gains on derivative financial instruments 7 (35) (619)
Net (gains)/losses on investment portfolio 7 (12,717) 11,642
Net unrealised foreign exchange gain (42) (7)
Purchase of investments and funding of capital calls 2,767 (18)
Proceeds from disposal of investments and distribution receipts 51,624 15,780
Interest received 289 178
Operating cash flows before changes in working capital 54,779 15,976
(Increase)/decrease in receivables (34) 13
Decrease in payables and accruals (224) (1,340)
Cash from operations 54,521 14,649
Financing activities
Equity share redemption 11 (65,000) -
Cash used in financing activities (65,000) -
Net (decrease)/increase in cash and cash equivalents (10,479) 14,649
Cash and cash equivalents at the beginning of the period 25,741 16,284
Effects of exchange differences arising from cash and cash equivalents 42 10
Cash and cash equivalents at the end of the period 15,304 30,943
The accompanying notes on pages 19 to 31 form an integral part the Financial Statements.

Notes to the Condensed Interim Financial Statements
19 JPEL Private Equity Limited Unaudited Interim Report and Condensed Financial Statements 31 December 2019
1. SIGNIFICANT ACCOUNTING POLICIES
JPEL Private Equity Limited (“JPEL” or the “Company”) is a closed ended investment fund incorporated as a limited liability company in Guernsey under The Companies (Guernsey) Law, 2008. As at 31 December 2019, the Company’s capital structure consisted of one class of US$ Equity Shares which are listed on the London Stock Exchange.
The primary objective of the Company is to effect an orderly realisation of the investments and other assets comprised in the Company’s portfolio and seek to realise such investments and assets in order to maximise returns to US$ Equity Shareholders.
The accounting policies set out below have been applied consistently by the Company to all periods presented in these Financial Statements.
Statement of compliance The Financial Statements have been prepared using accounting policies consistent with International Financial Reporting (“IFRS”) and in accordance with the requirement of International Accounting Standards (“IAS”) 34 Interim Financial Reporting.
They do not include all of the information required for full annual financial statements, and should be read in conjunction with the financial statements of the Company as at and for the year ended 30 June 2019.
The Financial Statements were approved by the Board of Directors on 17 March 2020.
Standards and amendments to existing standards effective for annual periods beginning on or after 1 July 2019 that are relevant and have been adopted by the Company
Amendments to IFRS 9: Prepayment Features with Negative Compensation (effective for accounting periods beginning on or after 1 January 2019)
The IASB issued a narrow scope amendment to IFRS 9 in October 2017 which updates the solely payments of principal and interest test: certain borrowings that include a contractual term under which an early repayment results in a settlement discount may now be deemed to have cashflows of solely principal and interest and are consequently measured at amortised cost or fair value through other comprehensive income rather than at fair value through profit or loss. This has been termed ‘negative compensation’, as in effect the lender is paying the borrower compensation for early settlement.
The Company’s borrowings have no prepayment features with negative compensation and therefore adoption of these amendments has had no material impact on the financial statements.
New standards and amendments to existing standards that are relevant but have not yet been adopted by the Company
A number of new standards, amendments to standards and interpretations in issue are not yet effective for the period ended 31 December 2019, and have not been applied in preparing these financial statements. The Directors are considering the potential effect of the implementation of the new standards. Definition of Material (Amendments to IAS 1 and IAS 8) The IASB has made amendments to IAS 1 Presentation of Financial Statements and IAS 8 Accounting Policies, Changes in Accounting Estimates and Errors to clarify and align the definition of materiality throughout IFRS and the Conceptual Framework for Financial Reporting. The amendments clarify when information is material and provide some guidance in IAS 1 about immaterial information.
The amendments address the following:
• ‘Obscuring’ was added to the definition of materiality and clarifies that obscuring information
• has a similar effect to omitting or misstating that information;
• An entity must assesses materiality in the context of the financial statements as a whole; and
• The ‘primary users of general-purpose financial statements’ are defined as ‘existing and potential investors, lenders and other creditors’ who rely on general purpose financial statements for the financial information they need.
The amendment is effective for accounting periods beginning on or after 1 January 2020. The Company will adopt this amendment when it becomes effective.

Notes to the Condensed Interim Financial Statements continued
20 JPEL Private Equity Limited Unaudited Interim Report and Condensed Financial Statements 31 December 2019
1. SIGNIFICANT ACCOUNTING POLICIES continued
Segmental information The Board of Directors has considered the requirements of IFRS 8 – “Operating Segments”. The Board of Directors is of the view that the Company’s operations comprise a single segment of business. The Board of Directors, as a whole, has been determined as constituting the chief operating decision maker of the Company.
As at 31 December 2019, three shareholders have more than 10% ownership in the total number of US$ Equity Shares in issue with holdings of approximately 18.4%, 14.0% and 10.6% (30 June 2019: 18.4%, 14.0% and 10.7%).
The Board is charged with setting the Company’s investment strategy. They have delegated the day-to-day implementation of this strategy to the Manager but retain responsibility to ensure that adequate resources of the Company are directed in accordance with their decisions. The Manager has been given full authority to act on behalf of the Company in the management of the Company’s assets in accordance with the Amended and Restated Investment Management Agreement on behalf of the Company and to carry out other actions as appropriate to give effect thereto.
Whilst the Manager may take investment decisions on a day-to-day basis regarding the allocation of funds to different investments, any changes to the investment strategy or major allocation decisions have to be approved by the Board of Directors, even though they may be proposed by the Manager. The Board of Directors therefore retain full responsibility as to the major allocation decisions made on an ongoing basis. The Manager will act under the terms of the Amended and Restated Investment Management Agreement which cannot be changed without the approval of the parties to the agreement.
The key measure of performance used by the Board of Directors to assess the Company’s performance and to allocate resources is the Net Asset Value (“NAV”) which is prepared on a monthly basis by IQ EQ. The NAV reported by the Administrator is prepared on a basis consistent with IFRS.
The Company’s investments held as of the period end, and their geographical areas (included as supplementary information only) are presented in the table below. The Company does not hold any non-current assets other than financial assets at fair value through profit or loss.
Region $'000 % $'000 %
North America 163,616 64% 183,205 61%
Europe 72,660 28% 92,695 31%
Asia 12,308 5% 14,358 5%
Other 7,945 3% 8,488 3%
Total 256,529 100% 298,746 100%
31 December 2019 30 June 2019
2. KEY ESTIMATES AND ASSUMPTIONS
Estimates and judgements used in preparing the financial information are continually evaluated and are based on historical experience and other factors, including expectations of future events that are believed to be reasonable. The resulting estimates will, by definition, seldom equal the related actual results.
The only estimates and assumptions that the Company considers to have a significant risk of causing a material adjustment to the carrying amounts of assets and liabilities relate to the valuation of unquoted investments.
In preparing the Financial Statements, the significant judgements made in applying the accounting policies and the key sources of estimation uncertainty were the same as those that applied to the annual financial statements for the year ended 30 June 2019.
Valuation of investments The Company has interests in various different types of investments including: investments in subsidiaries, investments in unquoted funds and direct investments in unquoted companies.

Notes to the Condensed Interim Financial Statements continued
21 JPEL Private Equity Limited Unaudited Interim Report and Condensed Financial Statements 31 December 2019
2. KEY ESTIMATES AND ASSUMPTIONS continued
Valuation of investments continued
Investments in subsidiaries Investments in subsidiaries are valued at fair value of the Company’s percentage holding based on the latest available net asset values of the subsidiaries. The Company reviews the net asset values and considers the liquidity of the subsidiaries or its underlying investments, value date of the net asset values and any restrictions on dividends from the subsidiaries. If necessary, the Company makes adjustments to net asset values of the subsidiaries to obtain the best estimate of its fair value.
Investments in unquoted funds The investments in unquoted funds are valued in accordance with IPEVCG as set out in the financial assets policy above. Investments in unquoted private equity funds do not have a readily available market and are generally valued based on the fair value of each private equity fund as reported by the respective general partner or sponsor (“Sponsor”) as per the capital statement, which necessarily incorporates estimates made by those Sponsors. The Company believes that this value, in most cases, represents fair value as of the relevant statement date, although, if other factors lead the Company to conclude that the value provided by the Sponsor does not represent fair value, the Directors and Manager will adjust the value of the investment from Sponsor's estimate. The Company estimates fair value based on publicly available information and the most recent financial information provided by the Sponsors, as adjusted for cash flows since the date of the most recent financial information.
Where no valuation is available from the Sponsor or an independent valuation agent, the Directors and Manager will estimate the fair value in accordance with IPEVCG. The public equity securities known to be owned within the purchased private equity fund are based on the most recent information reported to the Company by the Sponsors. Where such securities have publically available stock prices, these may be adjusted by applying the appropriate discount to reflect limited marketability and illiquidity. Direct investments in unquoted companies Direct investments in unquoted companies are generally valued based on the fair value of each investment as reported by the respective management.
Direct investments in unquoted companies where no fair value is being provided to the Company by the management or Sponsor are carried at fair value, as estimated by the Directors and Manager. In estimating fair value, the Directors and Manager consider the value assigned to each investment by the lead investor (if any) with which the Company has co-invested, to the extent known.
The Directors and Manager also consider the estimated fair value based on the projected enterprise value at which the underlying company could be sold in an orderly disposition over a reasonable period of time and in a transaction between willing parties other than in a forced sale or liquidation. In these instances, market multiples considering specified financial measures (such as EBITDA, adjusted EBITDA, cash flow, net income, revenues or NAV) and/or a discounted cash flow or liquidation analysis can be used.
Consideration may also be given to such factors as the company's historical and projected financial data, valuations given to comparable companies, the size and scope of the company's operations, the company's strengths, weaknesses, applicable restrictions on transfer, industry information and assumptions, general economic and market conditions and other factors deemed relevant. The Directors and Manager may also engage the services of a third party valuation firm to assist with valuing the asset.

Notes to the Condensed Interim Financial Statements continued
22 JPEL Private Equity Limited Unaudited Interim Report and Condensed Financial Statements 31 December 2019
2. KEY ESTIMATES AND ASSUMPTIONS continued
Valuation of investments continued
Direct investments in unquoted companies continued The below table shows the effect of a change in valuation for fund investments and direct investments in which a Sponsor provides an estimated NAV. For the direct investments in which a Sponsor does not provide an estimated NAV, the table shows the effect of changing the assumptions behind the valuation technique adopted by the Manager. The Directors and the Manager believe that the 5% change in unobservable inputs is the best estimate of a reasonable possible shift for all the categories listed below.
Description
Fair Value
($000's) Valuation Technique
Unobservable
Inputs Input
Reasonable
possible shift
+/- (%)
Change in
Valuation and
impact on Profit
or Loss +/-
($000's)
Fund Investments 49,370 NAV - Adjusted NAV N/A 5% 2,469/(2,469)
Direct Investments - NAV provided
by the Sponsors 207,159 NAV - Adjusted NAV N/A 5% 10,358/(10,358)
Direct Investments - NAV estimated
by the Board and Managers -
Comparable Trading
Multiples EBITDA 5.1x 5% -
31 December 2019
Description
Fair Value
($000's) Valuation Technique
Unobservable
Inputs Input
Reasonable
possible shift
+/- (%)
Change in
Valuation and
impact on Profit
or Loss +/-
($000's)
Fund Investments 80,412 NAV - Adjusted NAV N/A 5% 4,020/(4,020)
Direct Investments - NAV provided
by the Sponsors 218,333 NAV - Adjusted NAV N/A 5% 10,917/(10,917)
Direct Investments - NAV estimated
by the Board and Managers -
Comparable Trading
Multiples EBITDA 5.1x 5% -
30 June 2019
Valuation processes The Manager performs the valuation of financial assets required for financial reporting purposes, including Level 3 fair values. The Manager reports to the Board of Directors and the Audit Committee. Discussions of the valuation process and results are held between the Manager and the Board of Directors at least once every quarter.
The Company’s activities expose it to a variety of financial risks: market risk (including currency risk, fair value interest rate risk, cash flow interest rate risk and price risk), credit risk and liquidity risk.
The Financial Statements do not include all financial risk management information and disclosures required in the annual financial statements; they should be read in conjunction with the Company’s annual financial statements as at 30 June 2019.
There have been no changes in the risk management function since year end or in any risk management policies.

Notes to the Condensed Interim Financial Statements continued
23 JPEL Private Equity Limited Unaudited Interim Report and Condensed Financial Statements 31 December 2019
3. FINANCIAL INSTRUMENTS AND FINANCIAL RISK MANAGEMENT OBJECTIVES
Exposure to interest rate risk The Company’s credit facility has been reduced to and remained undrawn at $20 million (30 June 2019: $35 million). This capital is a floating rate debt with the interest expenses incurred from this facility based on the US Dollar London Interbank Offer Rate (“LIBOR”) or Euro Interbank Offered Rate (“EURIBOR”) as applicable. Exposure to currency risk At the reporting date, the carrying value of the Company’s financial assets and financial liabilities held in individual foreign currencies as a percentage of its net assets were as follows:
31 December 30 June
Currency 2019 2019
Euro 24% 28%
Sterling 1% 1%
UAE Dirham 1% -
Australian Dollar 1% - Exposure to other price risk As at 31 December 2019, the Company had no direct exposure to assets that are publicly traded on equity markets. (30 June 2019: Nil).
The impact on net assets of increasing/decreasing the unobservable inputs used in the Company’s valuation of direct investments in unquoted companies where the value is estimated by the Directors and Manager is presented in note 2.
Liquidity risk As of 31 December 2019, the Company had unfunded commitments to private equity funds of $26 million (30 June 2019: $32.1 million) that may be called by the underlying limited partnerships. Approximately 94.60% (30 June 2019: 95%) of the Company’s unfunded commitments, or approximately $24.7 million (30 June 2019: $30.6 million), represents funds with vintage years of 2008 and earlier and are unlikely to be called.
During the period the Company’s credit facility has been reduced and remained undrawn. The undrawn amount of the credit facility as of 31 December 2019 was $20 million (30 June 2019: $35 million).
Credit risk In respect of credit risk arising from cash and cash equivalents and derivative financial instruments, the Company continues to mitigate such risks by maintaining substantially all of the Company's cash and forward currency contracts with Lloyds Bank plc and Bank of America Merrill Lynch International. As at 31 December 2019, Moody’s has given the long term credit ratings for Lloyds Bank plc as Aa3 (30 June 2019: Aa3), Standard & Poor’s has given the same for Bank of America Merrill Lynch International as A+ (30 June 2019: A+).
All other aspects of the Company's financial risk management objectives and policies are consistent with those described in the annual report for the year ended 30 June 2019.
4. INTEREST AND DISTRIBUTION INCOME 01/07/2019 01/07/2018
to to
31/12/2019 31/12/2018
$'000 $'000
Interest income from cash and cash equivalents 289 178
Dividend income 1,491 607
Interest income from investments 195 416
1,975 1,201

Notes to the Condensed Interim Financial Statements continued
24 JPEL Private Equity Limited Unaudited Interim Report and Condensed Financial Statements 31 December 2019
5. CREDIT FACILITY COSTS
01/07/2019 01/07/2018
to to
31/12/2019 31/12/2018
$'000 $'000
Undrawn commitment fees 143 143
Credit facility fees - 7
143 150
6. OTHER EXPENSES 01/07/2019 01/07/2018
to to
31/12/2019 31/12/2018
$'000 $'000
Legal and professional fees 196 251
Sundry expenses 112 62
Portfolio management fees from limited partnerships 61 118
Travel expenses 33 39
Fil ing and regulatory fees 27 31
Bank charges 8 13
437 514
7. OTHER NET CHANGES IN FAIR VALUE OF FINANCIAL ASSETS AND FINANCIAL LIABILITIES THROUGH PROFIT OR LOSS
The following table summarises the net losses from financial assets and liabilities at fair value through profit or loss for the period:
01/07/2019 01/07/2018
to to
31/12/2019 31/12/2018
$'000 $'000
Mandatorily at fair value through profit or loss
- Investment portfolio 12,717 (11,642)
- Derivative financial instruments 35 619
12,752 (11,023)
Net gains/(losses) from financial assets and liabilities at fair value through
profit or loss
The Company does not experience seasonality or cyclicality in its investing activities.
8. FINANCIAL ASSETS AND LIABILITIES AT FAIR VALUE THROUGH PROFIT OR LOSS
All investments are classified as at fair value through profit or loss at initial recognition, therefore all gains and losses arise on investments classified as at fair value through profit or loss. Given the nature of the Company’s investments the fair value losses recognised in the Financial Statements are not considered to be readily convertible to cash in full at the reporting date and therefore the movements in these fair values are treated as unrealised.
Commitments The Company has committed to invest in certain private equity funds and investments. Such commitments are payable upon demand at the request of the fund’s administrator or general partner. As of 31 December 2019, the Company had unfunded commitments to private equity funds of $26 million (30 June 2019: $32.1 million) that may be called by the underlying limited partnerships. Approximately 94.60% (30 June 2019: 95%) of the Company’s unfunded commitments, or approximately $24.7 million (30 June 2019: $30.6 million), represents funds with vintage years of 2008 and earlier and are unlikely to be called.
Notes to the Condensed Interim Financial Statements continued
25 JPEL Private Equity Limited Unaudited Interim Report and Condensed Financial Statements 31 December 2019
8. FINANCIAL ASSETS AND LIABILITIES AT FAIR VALUE THROUGH PROFIT OR LOSS continued
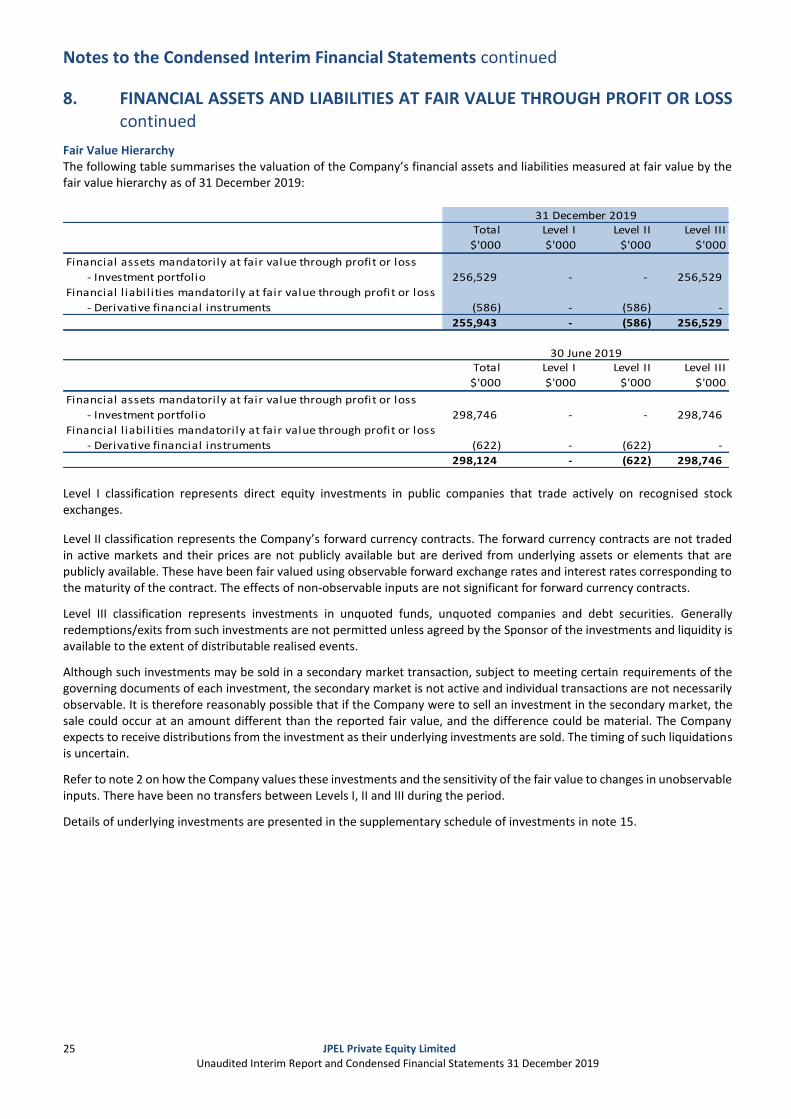
Fair Value Hierarchy The following table summarises the valuation of the Company’s financial assets and liabilities measured at fair value by the fair value hierarchy as of 31 December 2019: PUBMARKETEXPOSURE
Total
$'000
Level I
$'000
Level II
$'000
Level III
$'000
Financial assets mandatorily at fair value through profit or loss
- Investment portfolio 256,529 - - 256,529
Financial l iabilities mandatorily at fair value through profit or loss
- Derivative financial instruments (586) - (586) -
255,943 - (586) 256,529
Total
$'000
Level I
$'000
Level II
$'000
Level III
$'000
Financial assets mandatorily at fair value through profit or loss
- Investment portfolio 298,746 - - 298,746
Financial l iabilities mandatorily at fair value through profit or loss
- Derivative financial instruments (622) - (622) -
298,124 - (622) 298,746
31 December 2019
30 June 2019
Level I classification represents direct equity investments in public companies that trade actively on recognised stock exchanges.
Level II classification represents the Company’s forward currency contracts. The forward currency contracts are not traded in active markets and their prices are not publicly available but are derived from underlying assets or elements that are publicly available. These have been fair valued using observable forward exchange rates and interest rates corresponding to the maturity of the contract. The effects of non-observable inputs are not significant for forward currency contracts.
Level III classification represents investments in unquoted funds, unquoted companies and debt securities. Generally redemptions/exits from such investments are not permitted unless agreed by the Sponsor of the investments and liquidity is available to the extent of distributable realised events.
Although such investments may be sold in a secondary market transaction, subject to meeting certain requirements of the governing documents of each investment, the secondary market is not active and individual transactions are not necessarily observable. It is therefore reasonably possible that if the Company were to sell an investment in the secondary market, the sale could occur at an amount different than the reported fair value, and the difference could be material. The Company expects to receive distributions from the investment as their underlying investments are sold. The timing of such liquidations is uncertain.
Refer to note 2 on how the Company values these investments and the sensitivity of the fair value to changes in unobservable inputs. There have been no transfers between Levels I, II and III during the period.
Details of underlying investments are presented in the supplementary schedule of investments in note 15.
Notes to the Condensed Interim Financial Statements continued
26 JPEL Private Equity Limited Unaudited Interim Report and Condensed Financial Statements 31 December 2019
8. FINANCIAL ASSETS AND LIABILITIES AT FAIR VALUE THROUGH PROFIT OR LOSS continued
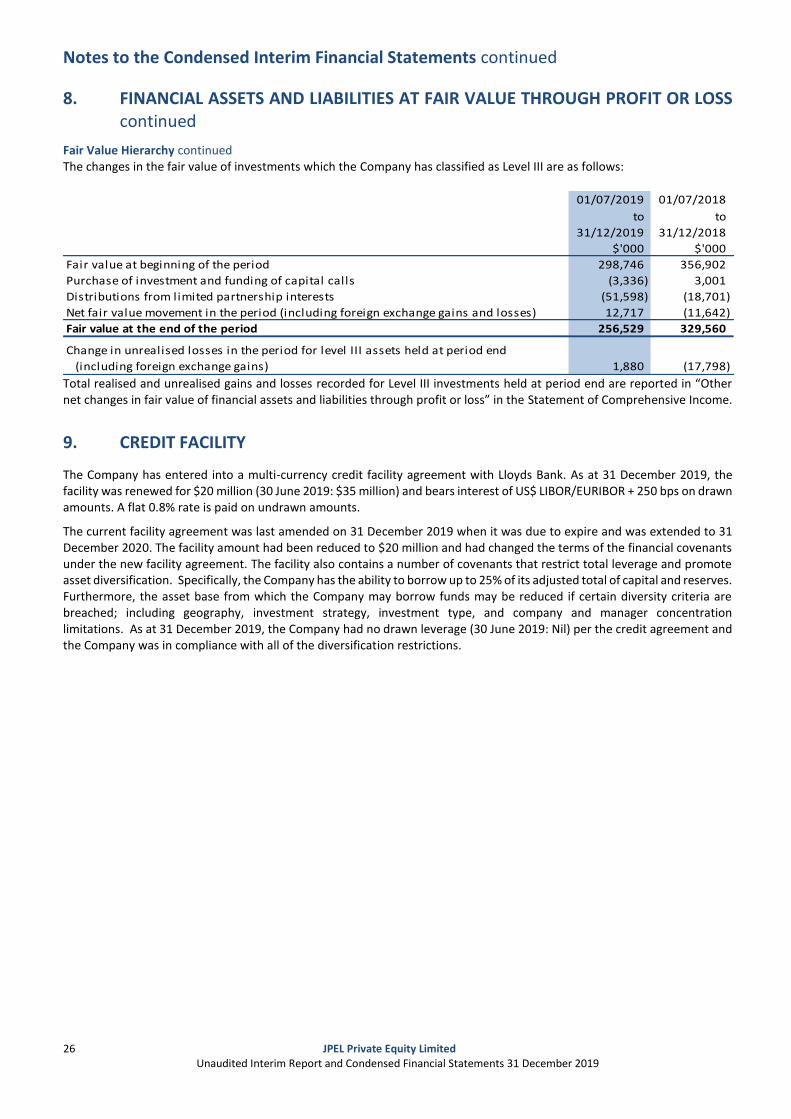
Fair Value Hierarchy continued The changes in the fair value of investments which the Company has classified as Level III are as follows:
01/07/2019 01/07/2018
to to
31/12/2019 31/12/2018
$'000 $'000
Fair value at beginning of the period 298,746 356,902
Purchase of investment and funding of capital calls (3,336) 3,001
Distributions from limited partnership interests (51,598) (18,701)
Net fair value movement in the period (including foreign exchange gains and losses) 12,717 (11,642)
Fair value at the end of the period 256,529 329,560
1,880 (17,798)
Change in unrealised losses in the period for level III assets held at period end
(including foreign exchange gains)
Total realised and unrealised gains and losses recorded for Level III investments held at period end are reported in “Other net changes in fair value of financial assets and liabilities through profit or loss” in the Statement of Comprehensive Income.
9. CREDIT FACILITY
The Company has entered into a multi-currency credit facility agreement with Lloyds Bank. As at 31 December 2019, the facility was renewed for $20 million (30 June 2019: $35 million) and bears interest of US$ LIBOR/EURIBOR + 250 bps on drawn amounts. A flat 0.8% rate is paid on undrawn amounts.
The current facility agreement was last amended on 31 December 2019 when it was due to expire and was extended to 31 December 2020. The facility amount had been reduced to $20 million and had changed the terms of the financial covenants under the new facility agreement. The facility also contains a number of covenants that restrict total leverage and promote asset diversification. Specifically, the Company has the ability to borrow up to 25% of its adjusted total of capital and reserves. Furthermore, the asset base from which the Company may borrow funds may be reduced if certain diversity criteria are breached; including geography, investment strategy, investment type, and company and manager concentration limitations. As at 31 December 2019, the Company had no drawn leverage (30 June 2019: Nil) per the credit agreement and the Company was in compliance with all of the diversification restrictions.
Notes to the Condensed Interim Financial Statements continued
27 JPEL Private Equity Limited Unaudited Interim Report and Condensed Financial Statements 31 December 2019
10. ISSUED SHARE CAPITAL ZT
Capital management The Company’s approach to capital management remained the same as described in the annual financial statements for the year ended June 2019. There were no changes in the Company’s approach to capital management during the period.
The balance of shares held in treasury at the period end was 17,750,000 (30 June 2019: 17,750,000) all of which was US$ Equity Shares. Shares held in treasury remain at less than 10% of total assets as at period end. Authorised share capital The authorised share capital of the Company is £100 divided into 100 founder shares of £1 each, and an unlimited number of redeemable participating preference shares of no par value each, which may be issued and designated as US$ Equity Shares, Sterling Equity Shares, Euro Equity Shares, ZDP shares or any other shares (denominated in any currency) as may be determined by the Board of Directors from time to time in accordance with Article 3(4)(d) of the Company’s Articles of Incorporation.
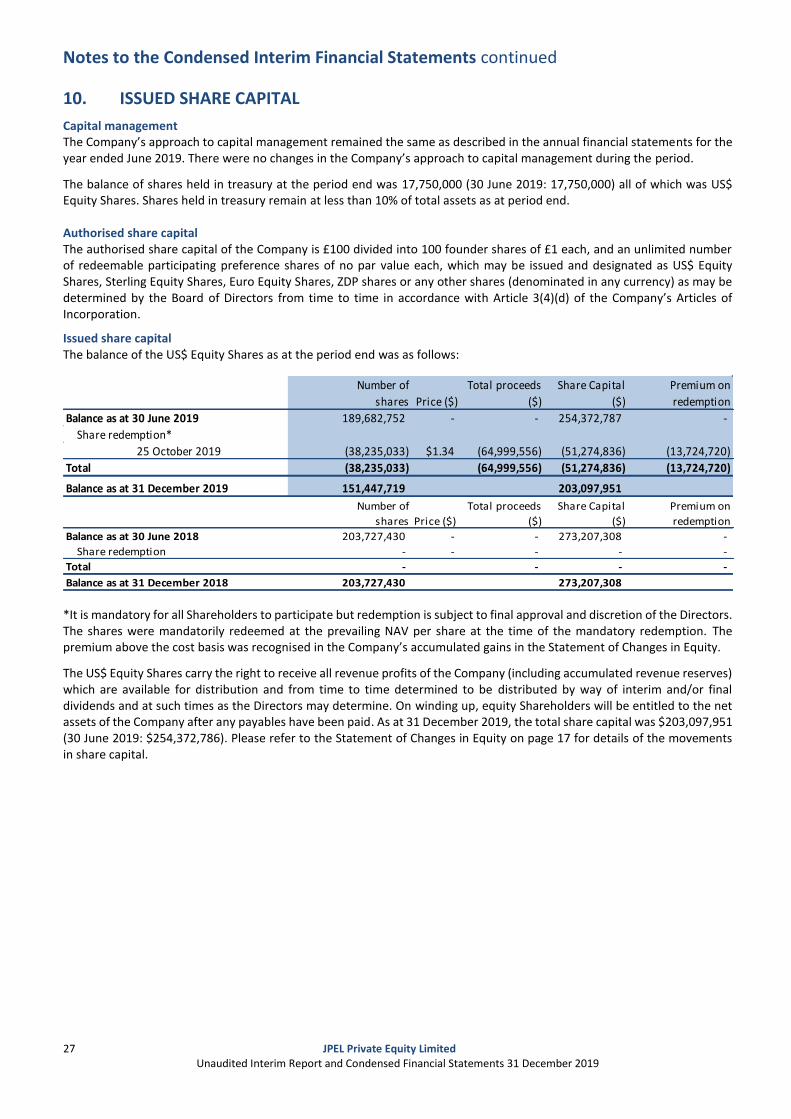
Issued share capital The balance of the US$ Equity Shares as at the period end was as follows:
Number of
shares Price ($)
Total proceeds
($)
Share Capital
($)
Premium on
redemption
Balance as at 30 June 2019 189,682,752 - - 254,372,787 -
Share redemption*
25 October 2019 (38,235,033) $1.34 (64,999,556) (51,274,836) (13,724,720)
Total (38,235,033) (64,999,556) (51,274,836) (13,724,720)
Balance as at 31 December 2019 151,447,719 203,097,951 Number of
shares Price ($)
Total proceeds
($)
Share Capital
($)
Premium on
redemption
Balance as at 30 June 2018 203,727,430 - - 273,207,308 -
Share redemption - - - - -
Total - - - -
Balance as at 31 December 2018 203,727,430 273,207,308
*It is mandatory for all Shareholders to participate but redemption is subject to final approval and discretion of the Directors. The shares were mandatorily redeemed at the prevailing NAV per share at the time of the mandatory redemption. The premium above the cost basis was recognised in the Company’s accumulated gains in the Statement of Changes in Equity.
The US$ Equity Shares carry the right to receive all revenue profits of the Company (including accumulated revenue reserves) which are available for distribution and from time to time determined to be distributed by way of interim and/or final dividends and at such times as the Directors may determine. On winding up, equity Shareholders will be entitled to the net assets of the Company after any payables have been paid. As at 31 December 2019, the total share capital was $203,097,951 (30 June 2019: $254,372,786). Please refer to the Statement of Changes in Equity on page 17 for details of the movements in share capital.

Notes to the Condensed Interim Financial Statements continued
28 JPEL Private Equity Limited Unaudited Interim Report and Condensed Financial Statements 31 December 2019
11. UNCONSOLIDATED SUBSIDIARIES
The Company has established a number of investment holding vehicles that are held purely for the purposes of holding the underlying investment in private equity funds and direct investments. These special purpose entities are presented in detail below:
Country of
Incorporation % Holding Principal activity
BSPEL Mezzanine Funding Limited ("BMFL") Guernsey 100.0 Holding company
BSPEL/Migdal Mezzanine Limited ("BMML") Guernsey 80.0 Holding company
BSPEL Australia Limited ("BSPEL Aus") Guernsey 100.0 Holding company
Bear Stearns Global Turnaround Fund L.P. ("GTF") Delaware 100.0 Limited Partnership
Iberian Acquisition Holdings LLC ("Iberian Acq") Delaware 100.0 Holding company
Back Bay (Guernsey) Limited ("Back Bay") Guernsey 78.8 Holding company
JPEL Holdings Limited ("JPEL Holdings") Guernsey 100.0 Holding company
Name of subsidiary
The subsidiaries above are considered to be Investment entities under IFRS 10 and information about the investments that are controlled by the subsidiaries is presented below;
BMFL owns 80% of the issued share capital of BMML, a Guernsey registered company whose principal activity is that of a holding company.
BMML holds a 50% interest in BoS Mezzanine Partners, LP (“BoS Mez”), a Scotland registered LP whose principal activity is that of a limited partnership. BoS Mez holds six fund investments.
BSPEL Aus owns 100% of the issued trust units in ROC Private Capital Trust, an Australia registered trust whose principal activity is that of an investment trust and holds 9 fund investments.
GTF is a limited partnership and holds non-controlling interests in nine fund investments.
Iberian Acq holds a non-controlling interest in Alia Capital Fund I CV, a Dutch limited partnership.
Back Bay holds 100% of Back Bay (Cayman) Ltd which holds 100% of the issued debt of Stoneleigh Back Bay Associates LLC, a US registered company whose principal activity in that of real estate investment and holds one investment. JSOF Holdings Ltd holds the non-controlling interest of 21.2% in Back Bay.
JPEL Holdings owns 60% of Corsicana Feeder Co-Investors, LLC, a US registered company whose principal activity is that of a holding company and holds one investment in a household products company. JPEL Holdings also holds non-controlling interests in 11 other companies and fund investments.
Details of the names and values as of 31 December 2019 of all the investments held by the subsidiaries are disclosed in note 15.

Notes to the Condensed Interim Financial Statements continued
29 JPEL Private Equity Limited Unaudited Interim Report and Condensed Financial Statements 31 December 2019
12. MATERIAL AGREEMENTS
The Manager, FCF JPEL Management LLC, is entitled to a base management fee, payable monthly in arrears of 1.0% per annum of the Company’s Total Assets. The total management fee due for the period was $1,475,574 (six months to 31 December 2018: $1,847,198). The amount payable to the Manager at the end of the period was $230,161 (30 June 2019: $265,356).
The Manager is also entitled to a performance fee if the aggregate Net Asset Value of the US$ Equity Shares and the ZDP Shares at the end of the performance period exceeds (i) the aggregate Net Asset Value at the start of the performance period by more than 8% and (ii) the highest previously recorded aggregate Net Asset Value of Equity and ZDP Shares as at the end of performance period of which the fees was paid.
The amount of such fee will be 7.5% of the total increase in aggregate Net Asset Value above the performance hurdle. The performance fee recognised during the period was $NIL (six months to 31 December 2018: $NIL).
The Administrator is entitled to an annual fee in respect of accounting, company secretarial, administration and investment tracking services. Total fees for the period were $377,979 (six months to 31 December 2018: $397,707). At 31 December 2019, $65,685 (30 June 2019: $128,340) was outstanding in respect of administration fees.
13. RELATED PARTY TRANSACTIONS
The Manager is a related party of the Company. Refer to note 12 for a breakdown of fees paid during the period.
Mr. Spencer owned 13,475 US$ Equity Shares, Mr. Hurst owned 11,169 US$ Equity Shares and Mr. Dalwood owned 57,244 US$ Equity Shares at 31 December 2019.
Mr. Hurst is entitled to receive Directors fees of £40,000 per annum, Mr. Loudon, Mr. Spencer and Mr. Dalwood are each entitled to receive Directors fees of £30,000 per annum. In addition, during the period the Company paid $14,639 (six months to 31 December 2018: $12,948) to the Directors in travel expenses. The cap on total Directors remuneration was unchanged at £250,000 as at 31 December 2019.
14. POST BALANCE SHEET EVENTS
On 12 March 2020, JPEL partially realized its investment in its second largest portfolio company, a Tax Advisory Services Company. The partial realization results in an investment return of approximately 4.39x and an IRR of approximately 33% for JPEL. As part of the transaction, JPEL received proceeds of approximately $37.5 million and it will continue to hold approximately 20% of its position in the company, valued at approximately $10.4 million at 31 December 2019. At 31 December 2019, the company represented 18.7% of JPEL’s private equity portfolio value.
Notes to the Condensed Interim Financial Statements continued
30 JPEL Private Equity Limited Unaudited Interim Report and Condensed Financial Statements 31 December 2019
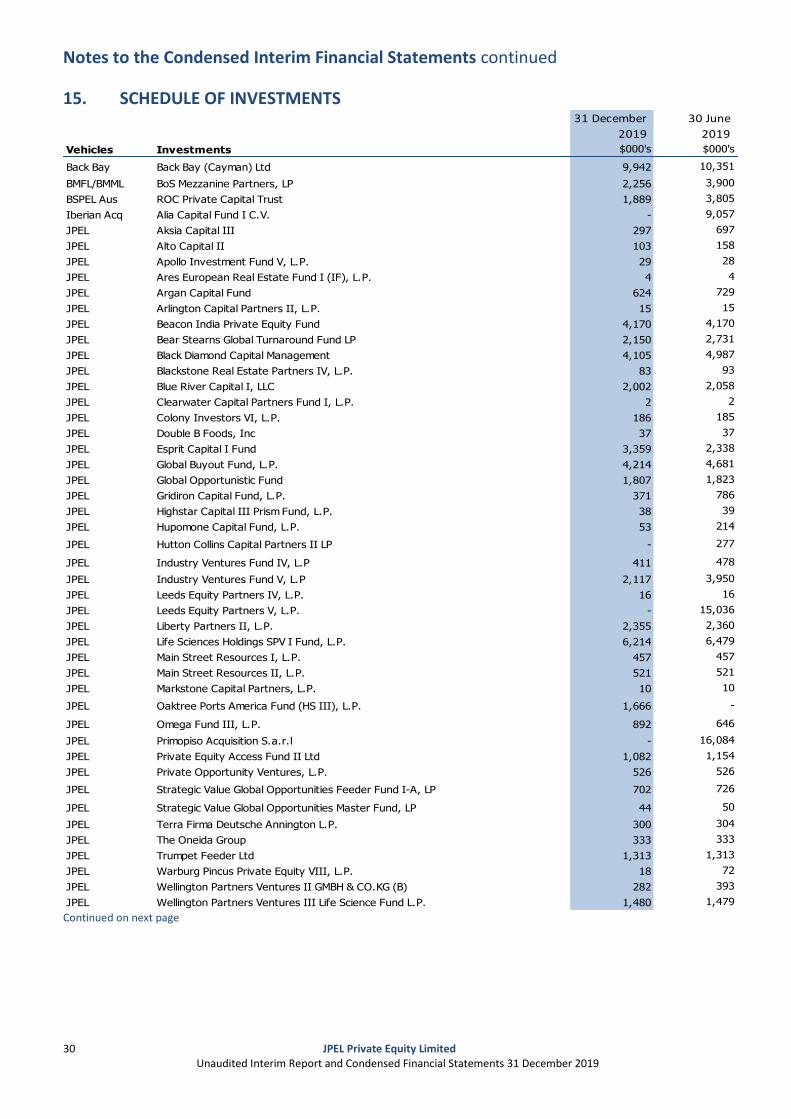
15. SCHEDULE OF INVESTMENTST 31 December 30 June
2019 2019$000's $000's
Back Bay Back Bay (Cayman) Ltd 9,942 10,351
BMFL/BMML BoS Mezzanine Partners, LP 2,256 3,900
BSPEL Aus ROC Private Capital Trust 1,889 3,805
Iberian Acq Alia Capital Fund I C.V. - 9,057
JPEL Aksia Capital III 297 697
JPEL Alto Capital II 103 158
JPEL Apollo Investment Fund V, L.P. 29 28
JPEL Ares European Real Estate Fund I (IF), L.P. 4 4
JPEL Argan Capital Fund 624 729
JPEL Arlington Capital Partners II, L.P. 15 15
JPEL Beacon India Private Equity Fund 4,170 4,170
JPEL Bear Stearns Global Turnaround Fund LP 2,150 2,731
JPEL Black Diamond Capital Management 4,105 4,987
JPEL Blackstone Real Estate Partners IV, L.P. 83 93
JPEL Blue River Capital I, LLC 2,002 2,058
JPEL Clearwater Capital Partners Fund I, L.P. 2 2
JPEL Colony Investors VI, L.P. 186 185
JPEL Double B Foods, Inc 37 37
JPEL Esprit Capital I Fund 3,359 2,338
JPEL Global Buyout Fund, L.P. 4,214 4,681
JPEL Global Opportunistic Fund 1,807 1,823
JPEL Gridiron Capital Fund, L.P. 371 786
JPEL Highstar Capital III Prism Fund, L.P. 38 39
JPEL Hupomone Capital Fund, L.P. 53 214
JPEL Hutton Collins Capital Partners II LP - 277
JPEL Industry Ventures Fund IV, L.P 411 478
JPEL Industry Ventures Fund V, L.P 2,117 3,950
JPEL Leeds Equity Partners IV, L.P. 16 16
JPEL Leeds Equity Partners V, L.P. - 15,036
JPEL Liberty Partners II, L.P. 2,355 2,360
JPEL Life Sciences Holdings SPV I Fund, L.P. 6,214 6,479
JPEL Main Street Resources I, L.P. 457 457
JPEL Main Street Resources II, L.P. 521 521
JPEL Markstone Capital Partners, L.P. 10 10
JPEL Oaktree Ports America Fund (HS III), L.P. 1,666 -
JPEL Omega Fund III, L.P. 892 646
JPEL Primopiso Acquisition S.a.r.l - 16,084
JPEL Private Equity Access Fund II Ltd 1,082 1,154
JPEL Private Opportunity Ventures, L.P. 526 526
JPEL Strategic Value Global Opportunities Feeder Fund I-A, LP 702 726
JPEL Strategic Value Global Opportunities Master Fund, LP 44 50
JPEL Terra Firma Deutsche Annington L.P. 300 304
JPEL The Oneida Group 333 333
JPEL Trumpet Feeder Ltd 1,313 1,313
JPEL Warburg Pincus Private Equity VIII, L.P. 18 72
JPEL Wellington Partners Ventures II GMBH & CO.KG (B) 282 393
JPEL Wellington Partners Ventures III Life Science Fund L.P. 1,480 1,479
Vehicles Investments
Continued on next page

Notes to the Condensed Interim Financial Statements continued
31 JPEL Private Equity Limited Unaudited Interim Report and Condensed Financial Statements 31 December 2019
15. SCHEDULE OF INVESTMENTS continued 31 December 30 June
2019 2019$000's $000'sVehicles Investments
JPEL Holdings Saas Company 3,828 3,923
JPEL Holdings Tax Advisory Services Company 47,894 37,474
JPEL Holdings Corsicana Feeder Co-Investors, LLC 9,509 7,764
JPEL Holdings Genuine Idea Investments Ltd 5,207 4,453
JPEL Holdings Gulf Healthcare International LLC 1,637 1,583
JPEL Holdings Industry Ventures Fund VI, L.P. 630 957
JPEL Holdings MBI Holding, Inc. 70,773 70,773
JPEL Holdings Milestone Investisseurs 2014 SLP 44,802 38,227
JPEL Holdings Omega Fund IV, L.P. 1,648 1,801
JPEL Holdings Placid Holdings 678 3,139
JPEL Holdings Polo Holdings S.à.r.l. 11,448 10,100
JPEL Holdings Prosper Marketplace, Inc. - 13,000
Total market value of Investments held by the Company 256,529 298,746
Investment Vehicles A bbreviat io n
JPEL Private Equity Limited JPEL
Back Bay (Guernsey) Limited Back Bay
BSPEL Australia Limited BSPEL Aus
BSPEL M ezzanine Funding Limited BM FL
BSPEL/M igdal M ezzanine Limited BM M L
Iberian Acquisition Holdings LLC Iberian Acq
JPEL Holdings Limited JPEL Holdings

Information about the Company
32 JPEL Private Equity Limited Unaudited Interim Report and Condensed Financial Statements 31 December 2019
DIRECTORS: Sean Hurst (Chairman) (re-elected 25 November 2019) John Loudon (re-elected 25 November 2019) Christopher Spencer (re-elected 25 November 2019) Anthony Dalwood (re-elected 25 November 2019)
MANAGER (as to the Private Equity Portfolio):
FCF JPEL MANAGEMENT LLC c/o Fortress Investment Group LLC 1345 Avenue of the Americas 46th floor, New York, New York 10105 United States of America
ADMINISTRATOR AND COMPANY SECRETARY:
IQ EQ FUND SERVICES (GUERNSEY) LIMITED (formerly AUGENTIUS (GUERNSEY) LIMITED) Ground Floor Cambridge House Le Truchot, St Peter Port Guernsey GY1 4BF
INDEPENDENT AUDITOR: PRICEWATERHOUSECOOPERS CI LLP
Royal Bank Place 1 Glategny Esplanade St Peter Port Guernsey GY1 4ND
SOLICITORS (as to English and US law):
HERBERT SMITH FREEHILLS LLP Exchange House Primrose Street London EC2A 2HS United Kingdom
TRAVERS SMITH LLP 10 Snow Hill London EC1A 2AL United Kingdom
LEGAL ADVISERS (as to Guernsey Law):
CAREY OLSEN 7 New Street St Peter Port Guernsey GY1 4BZ
REGISTRAR:
LINK MARKET SERVICES (Guernsey) Limited Mont Crevelt House Bulwer Avenue St Sampson Guernsey GY2 4LH
REGISTERED OFFICE: Ground Floor
Cambridge House Le Truchot, St Peter Port Guernsey GY1 1WD