Embed Size (px)
Citation preview
ISSN 1464-0325
Cutting-Edge Research on Environmental Processes & Impacts
Journal of Environmental Monitoring
1464-0325(2012)14:4;1-M
www.rsc.org/jem Volume 14 | Number 4 | April 2012 | Pages 1109–1284
Vo
lum
e 1
4
| N
um
be
r 4
| 2
01
2
Journ
al of E
nviro
nm
ental M
onito
ring
P
ag
es
11
09
–1
28
4
PAPERKim et al.Characterization and environmental implications of nano- and larger TiO2 particles in sewage sludge, and soils amended with sewage sludge
www.rsc.org/publishingRegistered Charity Number 207890
Affordable, high impact scienceFree access to these journals is ending. You can continue to
access high quality, high impact science through discounted
packages or affordable institutional subscriptions.
Ask for a quote: [email protected]
*online only price quoted
Buy online www.rsc.org/buycs Buy online www.rsc.org/buyees Buy online www.rsc.org/buypc
Buy online www.rsc.org/buyfood Buy online www.rsc.org/buymet Buy online www.rsc.org/buyam
Buy online www.rsc.org/buyib Buy online www.rsc.org/buynano Buy online www.rsc.org/buymed
£2,280$3,648
£1,110$2,115
£1,990$3,601
£2,109$3,937
£1,124$2,034
£1,197$2,227
£1,235$1,976
£1,092$1,975
£1,068$2,034
ALPSPBest New Journal 2011
Publ
ishe
d on
20
Febr
uary
201
2. D
ownl
oade
d by
Duk
e U
nive
rsity
on
08/0
9/20
13 0
4:35
:07.
View Article Online / Journal Homepage / Table of Contents for this issue
Dynamic Article LinksC<Journal ofEnvironmentalMonitoringCite this: J. Environ. Monit., 2012, 14, 1129
www.rsc.org/jem PAPER
Publ
ishe
d on
20
Febr
uary
201
2. D
ownl
oade
d by
Duk
e U
nive
rsity
on
08/0
9/20
13 0
4:35
:07.
View Article Online
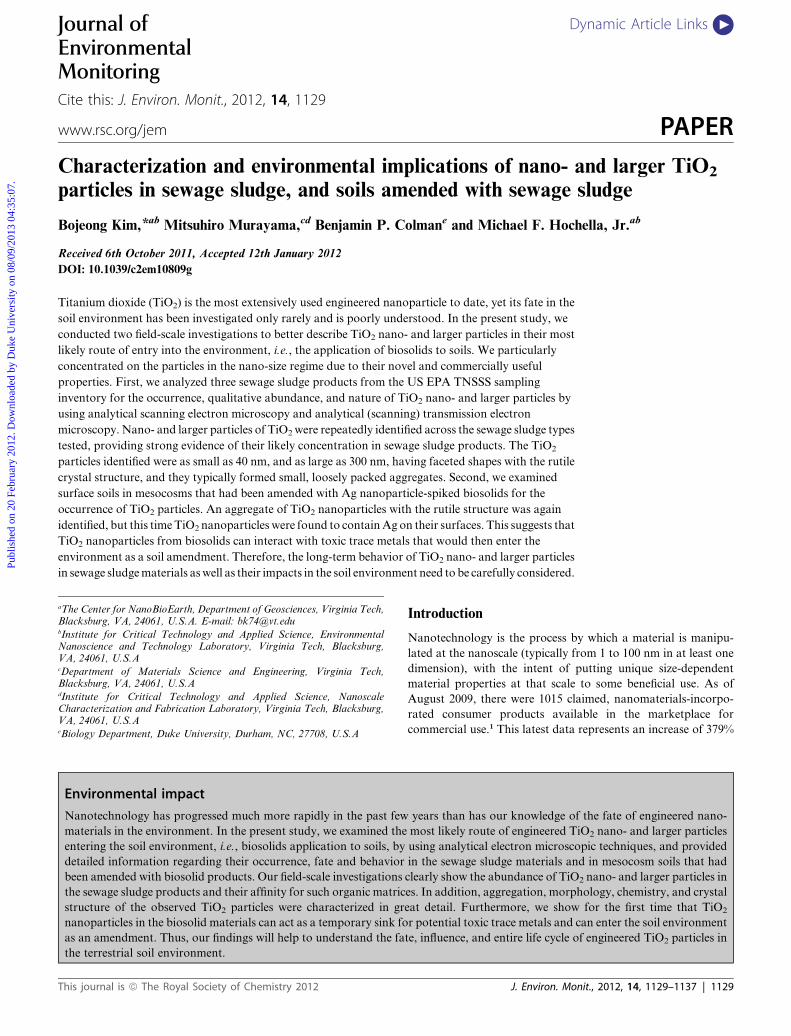
Characterization and environmental implications of nano- and larger TiO2
particles in sewage sludge, and soils amended with sewage sludge
Bojeong Kim,*ab Mitsuhiro Murayama,cd Benjamin P. Colmane and Michael F. Hochella, Jr.ab
Received 6th October 2011, Accepted 12th January 2012
DOI: 10.1039/c2em10809g
Titanium dioxide (TiO2) is the most extensively used engineered nanoparticle to date, yet its fate in the
soil environment has been investigated only rarely and is poorly understood. In the present study, we
conducted two field-scale investigations to better describe TiO2 nano- and larger particles in their most
likely route of entry into the environment, i.e., the application of biosolids to soils. We particularly
concentrated on the particles in the nano-size regime due to their novel and commercially useful
properties. First, we analyzed three sewage sludge products from the US EPA TNSSS sampling
inventory for the occurrence, qualitative abundance, and nature of TiO2 nano- and larger particles by
using analytical scanning electron microscopy and analytical (scanning) transmission electron
microscopy. Nano- and larger particles of TiO2 were repeatedly identified across the sewage sludge types
tested, providing strong evidence of their likely concentration in sewage sludge products. The TiO2
particles identified were as small as 40 nm, and as large as 300 nm, having faceted shapes with the rutile
crystal structure, and they typically formed small, loosely packed aggregates. Second, we examined
surface soils in mesocosms that had been amended with Ag nanoparticle-spiked biosolids for the
occurrence of TiO2 particles. An aggregate of TiO2 nanoparticles with the rutile structure was again
identified, but this timeTiO2 nanoparticles were found to containAg on their surfaces. This suggests that
TiO2 nanoparticles from biosolids can interact with toxic trace metals that would then enter the
environment as a soil amendment. Therefore, the long-term behavior of TiO2 nano- and larger particles
in sewage sludgematerials aswell as their impacts in the soil environment need to be carefully considered.
aThe Center for NanoBioEarth, Department of Geosciences, Virginia Tech,Blacksburg, VA, 24061, U.S.A. E-mail: [email protected] for Critical Technology and Applied Science, EnvironmentalNanoscience and Technology Laboratory, Virginia Tech, Blacksburg,VA, 24061, U.S.AcDepartment of Materials Science and Engineering, Virginia Tech,Blacksburg, VA, 24061, U.S.AdInstitute for Critical Technology and Applied Science, NanoscaleCharacterization and Fabrication Laboratory, Virginia Tech, Blacksburg,VA, 24061, U.S.AeBiology Department, Duke University, Durham, NC, 27708, U.S.A
Environmental impact
Nanotechnology has progressed much more rapidly in the past few
materials in the environment. In the present study, we examined the
entering the soil environment, i.e., biosolids application to soils, by
detailed information regarding their occurrence, fate and behavior
been amended with biosolid products. Our field-scale investigations
the sewage sludge products and their affinity for such organic matric
structure of the observed TiO2 particles were characterized in gr
nanoparticles in the biosolid materials can act as a temporary sink fo
as an amendment. Thus, our findings will help to understand the fa
the terrestrial soil environment.
This journal is ª The Royal Society of Chemistry 2012
Introduction
Nanotechnology is the process by which a material is manipu-
lated at the nanoscale (typically from 1 to 100 nm in at least one
dimension), with the intent of putting unique size-dependent
material properties at that scale to some beneficial use. As of
August 2009, there were 1015 claimed, nanomaterials-incorpo-
rated consumer products available in the marketplace for
commercial use.1 This latest data represents an increase of 379%
years than has our knowledge of the fate of engineered nano-
most likely route of engineered TiO2 nano- and larger particles
using analytical electron microscopic techniques, and provided
in the sewage sludge materials and in mesocosm soils that had
clearly show the abundance of TiO2 nano- and larger particles in
es. In addition, aggregation, morphology, chemistry, and crystal
eat detail. Furthermore, we show for the first time that TiO2
r potential toxic trace metals and can enter the soil environment
te, influence, and entire life cycle of engineered TiO2 particles in
J. Environ. Monit., 2012, 14, 1129–1137 | 1129
Publ
ishe
d on
20
Febr
uary
201
2. D
ownl
oade
d by
Duk
e U
nive
rsity
on
08/0
9/20
13 0
4:35
:07.
View Article Online
in the total number of nanotechnology products since March
2006 when the Project on Emerging Nanotechnologies at the
Woodrow Wilson International Center for Scholars first
compiled an on-line inventory of the products that claim to
contain some form of engineered nanomaterial.1 (Caution is
advised when using this database to extract such information as
it is incomplete, yet this is by far the most extensive public
database that is available for commercial nanomaterials.) Most
present existing and future applications of nanotechnology can
be found in various fields including electronics, cosmetics,
biomedical and pharmaceutical sciences, energy technologies,
catalytic and material applications, and environmental remedi-
ation.2–14 The market size of nanotechnology has been growing
rapidly and is projected to be worth a trillion dollars in the
United States by 2015.15
Among the commercially available engineered nanoparticles
(NPs), titanium dioxide (TiO2) is one of the most widely used to
date. TiO2 NPs are used in paints, pigments, lacquers, plastics,
papers, catalysts, cosmetics, fabric coatings, ceramics, printing
inks, roofing granules, welding fluxes, and glass.16 For some of
the traditional uses such as paints and coatings, TiO2 NPs are
incorporated into the bulk material where their tight size control
provides a material with enhanced hardness and contrast ratio.17
For other uses such as sunscreens and lacquers, TiO2 NPs
provide effective UV radiation filtering but also have the benefit
of being invisible unlike larger particles which affect the liquid’s
opacity. Higher photocatalytic activity of TiO2 NPs is also
advantageous in applications of water treatment processes and
self-cleaning surfaces. While allowing for considerable uncer-
tainty in the estimates of potential TiO2 sources, a recent study
suggested that the lower and upper bounds for the TiO2 NPs
production in the United States is 7800 and 38 000 metric tons
per year, respectively.18 It is also important to note that these
amounts are relatively small compared to conventional (larger)
TiO2 particles that have been used in industrial and commercial
applications for many decades. The size of these commercial
particles is well over the nano-size regime (a few hundred
nanometers to a few microns), but their size distribution is broad
and does extend into the nano-regime; that is, even conventional
TiO2 sources contain TiO2 NPs.
The proliferation of nanotechnology and the extensive, exist-
ing and new uses of TiO2 NPs, however, is of concern; recent risk
assessments predict that the environmental concentration of
TiO2 NPs may be high enough to cause toxicity in aquatic
organisms.19,20 As such, recent research on TiO2 NPs has focused
on determining and monitoring their occurrence and fate in the
aquatic environment through various environmental exposure
scenarios. For example, transport of synthetic TiO2 NPs from
exterior facade paints into surface waters was successfully
demonstrated in urban settings by both microscopic and bulk
chemical analyses.21 Another example involves the effects of
laboratory aging and degradation processes on TiO2–containing
sunscreen nanocomposites, and how that in turn affects the fate
and toxicity of the TiO2 core in aquatic systems.22,23 Finally,
aggregates of Ti nanomaterials were identified from wastewater
effluents and sewage sludge materials in the United States as well
as from bay sediments offshore of urban and industrial areas in
China where Ti concentration was significantly elevated due to
high population and pollution.24,25 On the other hand, there have
1130 | J. Environ. Monit., 2012, 14, 1129–1137
been no studies that have determined the exact compositional,
morphological, and structural characteristics of residual TiO2
NPs in sewage sludge products, nor its potential presence in the
terrestrial environment.
In an attempt to remedy the knowledge gap described above,
first we investigated residual sewage sludge materials for the
occurrence of TiO2 NPs. In this regard, it should be noted that
a high removal efficiency of metal oxide NPs, including TiO2, has
already been reported during wastewater treatment.24,26 Sewage
sludge is also one of the primary sources of TiO2 NPs entering the
soil environment, this through direct application as an agricul-
tural soil amendment, but TiO2 can also enter the soil environ-
ment through incineration and landfilling practices. We chose to
examine three sewage sludge samples out of the 84 (including
replicates) that were used for the United States Environmental
Protection Agency (USEPA) Targeted National Sewage Sludge
Survey (TNSSS) report.27,28Total Ti concentrations in these three
materials span two orders ofmagnitude, covering nicely the entire
set of samples in the TNSSS report.29 Scanning electron micros-
copy (SEM), transmission electron microscopy (TEM), and
scanning TEM (STEM) were combined with energy dispersive
X-ray spectroscopy (EDX) to determine the morphology and
chemistry of the TiO2 NPs. TEM nanobeam diffraction tech-
niques and high-resolution TEM (HRTEM) analyses provided
information of the crystal structure of selected TiO2 particles.
Second, we conducted a terrestrial mesocosm experiment
where soils were amended with Ag NPs-spiked biosolid mate-
rials. After eight weeks in the field, we sampled the surface
biosolid crusts and examined the occurrence of TiO2 nano-
particles and their potential association with the exogenous Ag.
Our investigation is the first to provide TEM evidence of TiO2
nanoparticles in biosolid materials scavenging added Ag, which
suggests its dynamic role as a temporary sink for potentially toxic
trace metals in the soil environment.
Materials and methods
USEPA sewage sludge samples
The USEPA conducted an extensive field-scale study to monitor
the quality of sewage sludge products generated by the nation’s
publicly owned treatment works (POTWs). In brief, the agency
collected the final products of sewage sludge (84 including
replicated samples) from 74 POTWs in 35 states, a representative
subset of the nation’s largest 3 337 POTWs, and then analyzed
them for 145 analytes of concern, including Ti. Each POTWs is
a full-scale municipal wastewater treatment plant, and treats
more than 3.8 million liters of wastewater per day, with
secondary or better treatment (physical, biological, and/or
chemical processes). Data collected from these samples were then
extrapolated to cover the entire target population by using
appropriate statistical methods. The selection criteria for the
POTWs and list of toxic pollutants in the final sewage sludge
samples are provided in detail in the USEPA Targeted National
Sewage Sludge Survey (TNSSS) Overview Report and the
accompanying TNSSS Sampling and Analysis Technical
Report.27,28 The presence of Ti was identified in all of the sewage
sludge samples collected, with its concentration ranging from
11.6 to 7020 mg kg�1 (on a dry weight basis).29
This journal is ª The Royal Society of Chemistry 2012
Publ
ishe
d on
20
Febr
uary
201
2. D
ownl
oade
d by
Duk
e U
nive
rsity
on
08/0
9/20
13 0
4:35
:07.
View Article Online
Among the 84 samples, we chose to study the sewage sludge
materials collected from one POTW located in the Midwest
(plant ID 27, sample ID 68349) and two POTWs in the West
region of the USA (plant ID 3, sample ID 68336; plant ID 21,
sample ID 68353, respectively). This is because (1) there is no
identified major industrial user that might discharge large
amounts of Ti in these geographic areas (USEPA; personal
communication) and (2) the total Ti concentrations in the sewage
sludge materials show two orders of magnitude difference (on
a dry weight basis), covering a wide range of the samples in the
TNSSS report. For convenience, we have labeled sewage sludge
materials from plants ID 27, 3, and 21, as SS I, SS II, and SS III,
respectively, throughout the manuscript.
Mesocosms experiment
For our field-scale mesocosms experiment, we used soil from the
surface layer of the Sandy Creek floodplain (Durham County,
North Carolina, USA), and class A biosolid pellets from the
South CaryWastewater Treatment Plant (Apex, North Carolina,
USA). Measured characteristics of the starting soils (uncon-
taminated, control) were as follows: soil pH was 4.82 � 0.18
(1 : 1 soil:de-ionized water). Organic matter contents of the soils
were estimated to be 1.83% by weight loss on ignition.30 Texture
analysis by the pipette method revealed that the soils had 63.5 �0.7% sand, 26.2 � 0.5% silt, and 10.5 � 0.3% clay.31 The pH of
biosolid pellets (1 : 4 solid:de-ionized water) was measured to be
6.11 � 0.04 and the organic contents to be 75.9% by weight loss
on ignition.
For the total metal concentration in the biosolid pellets, the
EPA-approved, microwave-assisted nitric acid digestion in the
MARS system (SW 846-3051-Mars, CEM Corp.) was
employed.32 This technique involves high temperature and
pressure during digestion. Refractive mineral phases in the
biosolid, such as TiO2, dissolve under these conditions. The
recovered nitric acid solution was then diluted and analyzed for
metal concentrations by inductively coupled plasma atomic
emission spectroscopy (ICP-AES). The total Ti content in the
biosolid pellets was estimated to be 810 mg kg�1 (on a dry weight
basis). Total biosolid Cl concentration was 700 mg kg�1, esti-
mated by the SM 4500CL-D method.33
The biosolid slurry solution was prepared by mixing 200 grams
of dry biosolid pellets with 1500 mL of de-ionized water by
blending with an immersion blender at a medium speed for 6
min. On the day of dosing, these slurries were stirred with 44 mL
of 250 mg Ag L�1 polyvinylpyrrolidone (PVP)-coated (Ag) NPs
(Ag–NPs). The Ag–NPs were purchased from a commercial
supplier in powder form (Nanostructured & Amorphous Mate-
rials, Inc., Houston, TX, USA), and were dispersed according to
published methods.34 The size distribution of the Ag–NPs
determined by TEMwas 21� 17 nm.34 The biosolid slurries were
poured on the soil surface to achieve the target amount of
11.5 mg Ag per mesocosm, which is equivalent to 57.7 mg Ag
per kg of biosolid, and to 0.14 mg Ag per kg of soil, respectively.
We chose this Ag–NPs concentration because it fell within the
95% confidence interval of the Ag concentration in the final
sewage sludge products in the USEPA TNSSS report which
presented Ag concentrations of between 2 and 195 mg kg�1, with
a mean� SD of 20� 22 mg Ag kg�1 (the highest concentration in
This journal is ª The Royal Society of Chemistry 2012
the report was 856 mg Ag kg�1). It is therefore considered to be
a realistic target level for Ag to test the quality of soil ecosystems.
Mesocosms were planted with local wet meadow plants on June
23rd, 2009 (3 individuals of each of 5 different species, total 15),
and plants were allowed to establish prior to being dosed on Aug
25th, 2009. The mesocosms were then exposed to ambient envi-
ronmental conditions for eight weeks. After harvesting the
plants, biosolid crusts were sampled from the surface of the Ag
NPs-treated biosolid-amended mesocosms and were preserved
on-site by immediate immersion in a primary fixative solution
(2% glutaraldehyde in 0.1 M sodium (Na) cacodylate buffer, pH
adjusted to 7.0) in a 2-mL centrifuge tube for the microtomed
TEM sample.
Whole mount TEM sample preparation
The USEPA TNSSS sewage sludge samples were received frozen
and sealed in glass jars from one of the EPA’s repositories
(Baltimore, Maryland, USA). They had been kept in this
condition since collection. Subsamples of the frozen sewage
sludge materials were taken from the glass jars and were freeze-
dried, then gently ground with a mortar and pestle. A half-gram
of the sewage sludge powder was then added to a 30-mL glass
centrifuge tube with 5 mL of de-ionized water. The sewage sludge
slurry solution was mixed thoroughly, and sonicated in a water
bath (UltraSonic Bath Model 2510, Branson Ultrasonics,
maximum frequency at 42 kHz) for one hour. One mL of the
slurry solution was diluted 200-fold with methanol (acetone-free,
Fisher Scientific), and the concentrations of Ti in the methanol
extracts were measured by ICP-AES. Although the result of the
ICP analysis was semi-quantitative due to the non-aqueous
nature of the methanol matrix, it confirmed the presence of Ti in
the diluted methanol suspension before the TEM work. A drop
of the methanol suspension was then placed onto a 200-mesh
copper (Cu) TEM grid with lacey carbon support film (Electron
Microscopy Sciences, PA) and allowed to evaporate.
Microtomed TEM sample preparation
The surface biosolid crusts that were preserved with the primary
fixative solution at the site were washed at least twice with 0.1 M
Na cacodylate buffer for 15 min each. The samples were then
post-fixed in 1% osmium tetroxide (OsO4) in 0.1 M Na cacody-
late buffer for 1 h. After discarding the OsO4 solution with
caution, the resulting samples were washed twice for 10 min each
with 0.1 M Na cacodylate buffer. Then, they were dehydrated by
applying a series of ethanol solutions starting at 15% and going
to 100% ethanol. After the ethanol solutions, the samples were
submersed in 100% propylene oxide for 15 min, followed by
overnight infiltration with a mixture solution of propylene oxide
and Poly/Bed 812 (50 : 50 (v:v)). On the following day, the
samples were again subjected to overnight infiltration with 100%
Poly/Bed 812. The samples are then embedded in a flat embed-
ding mold using freshly prepared 100% Poly/Bed 812. Molds
were placed in an oven set at 60 �C for at least 48 h to cure. Ultra-
thin sections were obtained by ultramicrotomy using a diamond
knife (Leica Ultracut UCT, Australia) and sections approxi-
mately 60–90 nm thick sections were collected on the 200-mesh,
formvar-coated Cu TEM grid for TEM analysis.35
J. Environ. Monit., 2012, 14, 1129–1137 | 1131
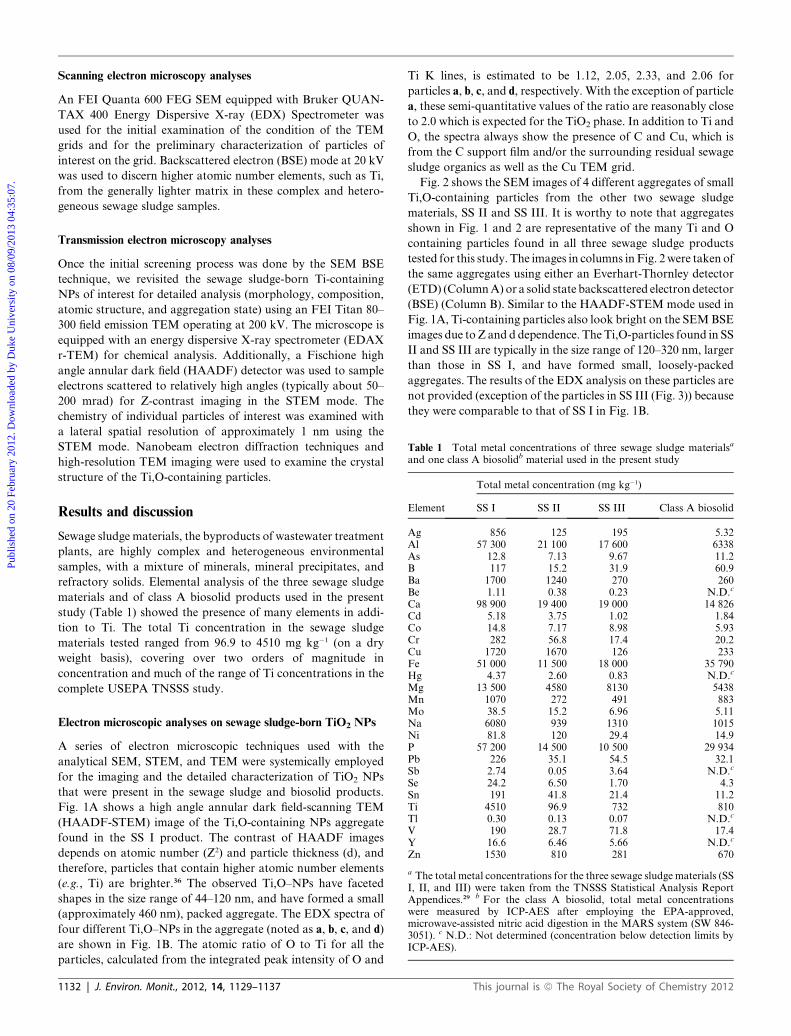
Table 1 Total metal concentrations of three sewage sludge materialsa
and one class A biosolidb material used in the present study
Element
Total metal concentration (mg kg�1)
SS I SS II SS III Class A biosolid
Ag 856 125 195 5.32Al 57 300 21 100 17 600 6338As 12.8 7.13 9.67 11.2B 117 15.2 31.9 60.9Ba 1700 1240 270 260Be 1.11 0.38 0.23 N.D.c
Ca 98 900 19 400 19 000 14 826Cd 5.18 3.75 1.02 1.84Co 14.8 7.17 8.98 5.93Cr 282 56.8 17.4 20.2Cu 1720 1670 126 233Fe 51 000 11 500 18 000 35 790Hg 4.37 2.60 0.83 N.D.c
Mg 13 500 4580 8130 5438Mn 1070 272 491 883Mo 38.5 15.2 6.96 5.11Na 6080 939 1310 1015Ni 81.8 120 29.4 14.9P 57 200 14 500 10 500 29 934Pb 226 35.1 54.5 32.1Sb 2.74 0.05 3.64 N.D.c
Se 24.2 6.50 1.70 4.3Sn 191 41.8 21.4 11.2Ti 4510 96.9 732 810Tl 0.30 0.13 0.07 N.D.c
V 190 28.7 71.8 17.4Y 16.6 6.46 5.66 N.D.c
Zn 1530 810 281 670
a The total metal concentrations for the three sewage sludge materials (SSI, II, and III) were taken from the TNSSS Statistical Analysis ReportAppendices.29 b For the class A biosolid, total metal concentrationswere measured by ICP-AES after employing the EPA-approved,microwave-assisted nitric acid digestion in the MARS system (SW 846-3051). c N.D.: Not determined (concentration below detection limits byICP-AES).
Publ
ishe
d on
20
Febr
uary
201
2. D
ownl
oade
d by
Duk
e U
nive
rsity
on
08/0
9/20
13 0
4:35
:07.
View Article Online
Scanning electron microscopy analyses
An FEI Quanta 600 FEG SEM equipped with Bruker QUAN-
TAX 400 Energy Dispersive X-ray (EDX) Spectrometer was
used for the initial examination of the condition of the TEM
grids and for the preliminary characterization of particles of
interest on the grid. Backscattered electron (BSE) mode at 20 kV
was used to discern higher atomic number elements, such as Ti,
from the generally lighter matrix in these complex and hetero-
geneous sewage sludge samples.
Transmission electron microscopy analyses
Once the initial screening process was done by the SEM BSE
technique, we revisited the sewage sludge-born Ti-containing
NPs of interest for detailed analysis (morphology, composition,
atomic structure, and aggregation state) using an FEI Titan 80–
300 field emission TEM operating at 200 kV. The microscope is
equipped with an energy dispersive X-ray spectrometer (EDAX
r-TEM) for chemical analysis. Additionally, a Fischione high
angle annular dark field (HAADF) detector was used to sample
electrons scattered to relatively high angles (typically about 50–
200 mrad) for Z-contrast imaging in the STEM mode. The
chemistry of individual particles of interest was examined with
a lateral spatial resolution of approximately 1 nm using the
STEM mode. Nanobeam electron diffraction techniques and
high-resolution TEM imaging were used to examine the crystal
structure of the Ti,O-containing particles.
Results and discussion
Sewage sludge materials, the byproducts of wastewater treatment
plants, are highly complex and heterogeneous environmental
samples, with a mixture of minerals, mineral precipitates, and
refractory solids. Elemental analysis of the three sewage sludge
materials and of class A biosolid products used in the present
study (Table 1) showed the presence of many elements in addi-
tion to Ti. The total Ti concentration in the sewage sludge
materials tested ranged from 96.9 to 4510 mg kg�1 (on a dry
weight basis), covering over two orders of magnitude in
concentration and much of the range of Ti concentrations in the
complete USEPA TNSSS study.
Electron microscopic analyses on sewage sludge-born TiO2 NPs
A series of electron microscopic techniques used with the
analytical SEM, STEM, and TEM were systemically employed
for the imaging and the detailed characterization of TiO2 NPs
that were present in the sewage sludge and biosolid products.
Fig. 1A shows a high angle annular dark field-scanning TEM
(HAADF-STEM) image of the Ti,O-containing NPs aggregate
found in the SS I product. The contrast of HAADF images
depends on atomic number (Z2) and particle thickness (d), and
therefore, particles that contain higher atomic number elements
(e.g., Ti) are brighter.36 The observed Ti,O–NPs have faceted
shapes in the size range of 44–120 nm, and have formed a small
(approximately 460 nm), packed aggregate. The EDX spectra of
four different Ti,O–NPs in the aggregate (noted as a, b, c, and d)
are shown in Fig. 1B. The atomic ratio of O to Ti for all the
particles, calculated from the integrated peak intensity of O and
1132 | J. Environ. Monit., 2012, 14, 1129–1137
Ti K lines, is estimated to be 1.12, 2.05, 2.33, and 2.06 for
particles a, b, c, and d, respectively. With the exception of particle
a, these semi-quantitative values of the ratio are reasonably close
to 2.0 which is expected for the TiO2 phase. In addition to Ti and
O, the spectra always show the presence of C and Cu, which is
from the C support film and/or the surrounding residual sewage
sludge organics as well as the Cu TEM grid.
Fig. 2 shows the SEM images of 4 different aggregates of small
Ti,O-containing particles from the other two sewage sludge
materials, SS II and SS III. It is worthy to note that aggregates
shown in Fig. 1 and 2 are representative of the many Ti and O
containing particles found in all three sewage sludge products
tested for this study. The images in columns in Fig. 2were taken of
the same aggregates using either an Everhart-Thornley detector
(ETD) (ColumnA) or a solid state backscattered electron detector
(BSE) (Column B). Similar to the HAADF-STEM mode used in
Fig. 1A, Ti-containing particles also look bright on the SEMBSE
images due to Z and d dependence. The Ti,O-particles found in SS
II and SS III are typically in the size range of 120–320 nm, larger
than those in SS I, and have formed small, loosely-packed
aggregates. The results of the EDX analysis on these particles are
not provided (exception of the particles in SS III (Fig. 3)) because
they were comparable to that of SS I in Fig. 1B.
This journal is ª The Royal Society of Chemistry 2012
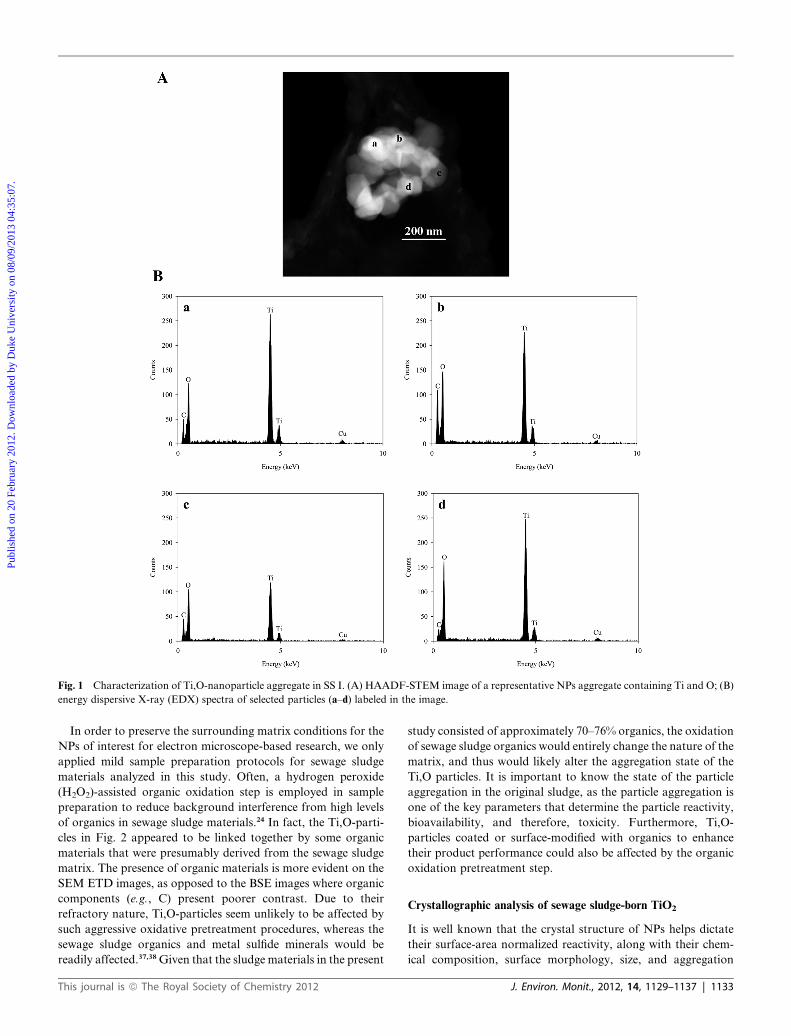
Fig. 1 Characterization of Ti,O-nanoparticle aggregate in SS I. (A) HAADF-STEM image of a representative NPs aggregate containing Ti and O; (B)
energy dispersive X-ray (EDX) spectra of selected particles (a–d) labeled in the image.
Publ
ishe
d on
20
Febr
uary
201
2. D
ownl
oade
d by
Duk
e U
nive
rsity
on
08/0
9/20
13 0
4:35
:07.
View Article Online
In order to preserve the surrounding matrix conditions for the
NPs of interest for electron microscope-based research, we only
applied mild sample preparation protocols for sewage sludge
materials analyzed in this study. Often, a hydrogen peroxide
(H2O2)-assisted organic oxidation step is employed in sample
preparation to reduce background interference from high levels
of organics in sewage sludge materials.24 In fact, the Ti,O-parti-
cles in Fig. 2 appeared to be linked together by some organic
materials that were presumably derived from the sewage sludge
matrix. The presence of organic materials is more evident on the
SEM ETD images, as opposed to the BSE images where organic
components (e.g., C) present poorer contrast. Due to their
refractory nature, Ti,O-particles seem unlikely to be affected by
such aggressive oxidative pretreatment procedures, whereas the
sewage sludge organics and metal sulfide minerals would be
readily affected.37,38Given that the sludge materials in the present
This journal is ª The Royal Society of Chemistry 2012
study consisted of approximately 70–76% organics, the oxidation
of sewage sludge organics would entirely change the nature of the
matrix, and thus would likely alter the aggregation state of the
Ti,O particles. It is important to know the state of the particle
aggregation in the original sludge, as the particle aggregation is
one of the key parameters that determine the particle reactivity,
bioavailability, and therefore, toxicity. Furthermore, Ti,O-
particles coated or surface-modified with organics to enhance
their product performance could also be affected by the organic
oxidation pretreatment step.
Crystallographic analysis of sewage sludge-born TiO2
It is well known that the crystal structure of NPs helps dictate
their surface-area normalized reactivity, along with their chem-
ical composition, surface morphology, size, and aggregation
J. Environ. Monit., 2012, 14, 1129–1137 | 1133
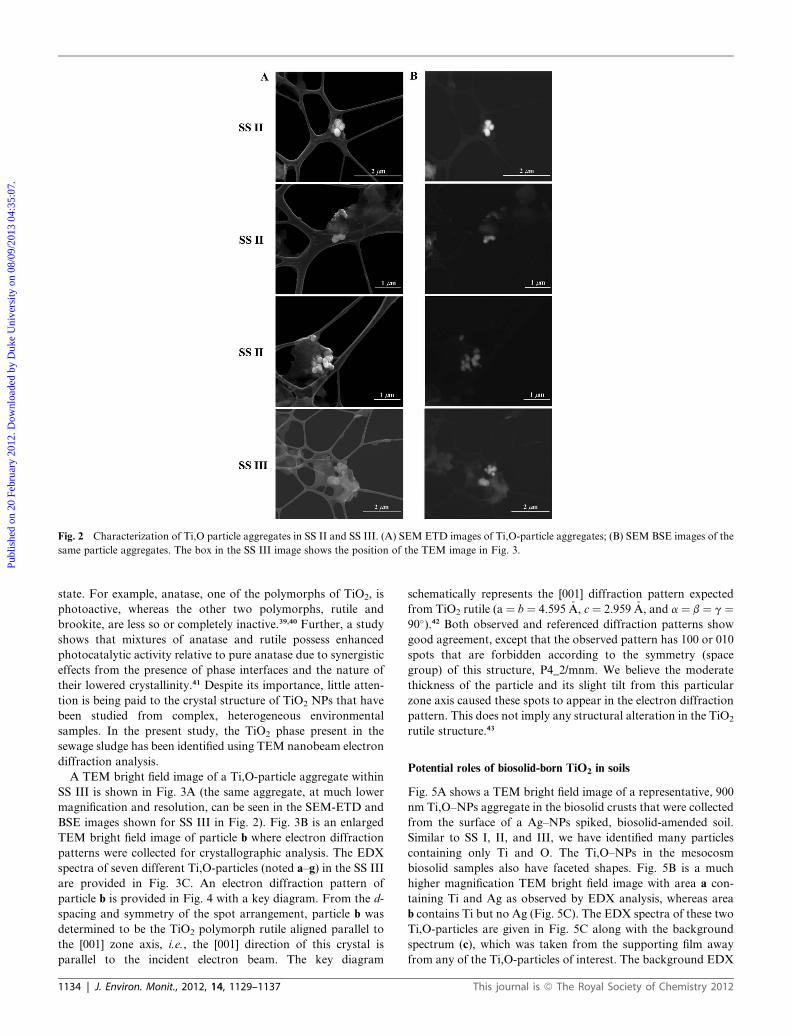
Fig. 2 Characterization of Ti,O particle aggregates in SS II and SS III. (A) SEM ETD images of Ti,O-particle aggregates; (B) SEM BSE images of the
same particle aggregates. The box in the SS III image shows the position of the TEM image in Fig. 3.
Publ
ishe
d on
20
Febr
uary
201
2. D
ownl
oade
d by
Duk
e U
nive
rsity
on
08/0
9/20
13 0
4:35
:07.
View Article Online
state. For example, anatase, one of the polymorphs of TiO2, is
photoactive, whereas the other two polymorphs, rutile and
brookite, are less so or completely inactive.39,40 Further, a study
shows that mixtures of anatase and rutile possess enhanced
photocatalytic activity relative to pure anatase due to synergistic
effects from the presence of phase interfaces and the nature of
their lowered crystallinity.41 Despite its importance, little atten-
tion is being paid to the crystal structure of TiO2 NPs that have
been studied from complex, heterogeneous environmental
samples. In the present study, the TiO2 phase present in the
sewage sludge has been identified using TEM nanobeam electron
diffraction analysis.
A TEM bright field image of a Ti,O-particle aggregate within
SS III is shown in Fig. 3A (the same aggregate, at much lower
magnification and resolution, can be seen in the SEM-ETD and
BSE images shown for SS III in Fig. 2). Fig. 3B is an enlarged
TEM bright field image of particle b where electron diffraction
patterns were collected for crystallographic analysis. The EDX
spectra of seven different Ti,O-particles (noted a–g) in the SS III
are provided in Fig. 3C. An electron diffraction pattern of
particle b is provided in Fig. 4 with a key diagram. From the d-
spacing and symmetry of the spot arrangement, particle b was
determined to be the TiO2 polymorph rutile aligned parallel to
the [001] zone axis, i.e., the [001] direction of this crystal is
parallel to the incident electron beam. The key diagram
1134 | J. Environ. Monit., 2012, 14, 1129–1137
schematically represents the [001] diffraction pattern expected
from TiO2 rutile (a ¼ b ¼ 4.595 �A, c ¼ 2.959 �A, and a ¼ b ¼ g ¼90�).42 Both observed and referenced diffraction patterns show
good agreement, except that the observed pattern has 100 or 010
spots that are forbidden according to the symmetry (space
group) of this structure, P4_2/mnm. We believe the moderate
thickness of the particle and its slight tilt from this particular
zone axis caused these spots to appear in the electron diffraction
pattern. This does not imply any structural alteration in the TiO2
rutile structure.43
Potential roles of biosolid-born TiO2 in soils
Fig. 5A shows a TEM bright field image of a representative, 900
nm Ti,O–NPs aggregate in the biosolid crusts that were collected
from the surface of a Ag–NPs spiked, biosolid-amended soil.
Similar to SS I, II, and III, we have identified many particles
containing only Ti and O. The Ti,O–NPs in the mesocosm
biosolid samples also have faceted shapes. Fig. 5B is a much
higher magnification TEM bright field image with area a con-
taining Ti and Ag as observed by EDX analysis, whereas area
b contains Ti but no Ag (Fig. 5C). The EDX spectra of these two
Ti,O-particles are given in Fig. 5C along with the background
spectrum (c), which was taken from the supporting film away
from any of the Ti,O-particles of interest. The background EDX
This journal is ª The Royal Society of Chemistry 2012
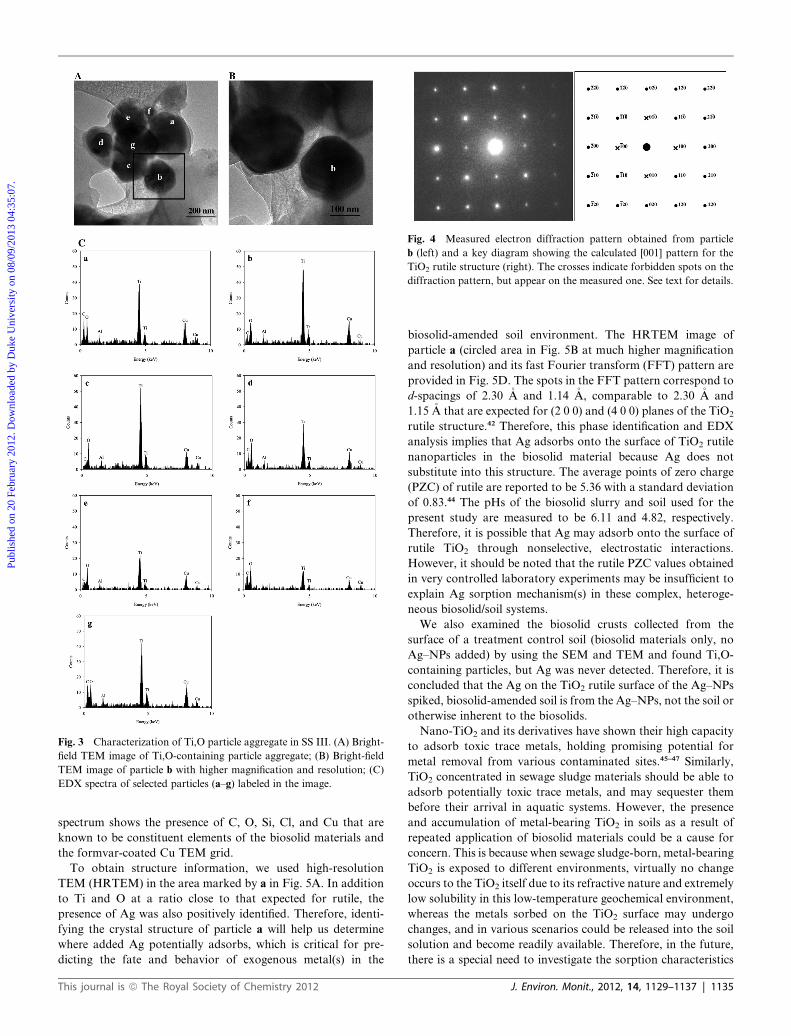
Fig. 3 Characterization of Ti,O particle aggregate in SS III. (A) Bright-
field TEM image of Ti,O-containing particle aggregate; (B) Bright-field
TEM image of particle b with higher magnification and resolution; (C)
EDX spectra of selected particles (a–g) labeled in the image.
Fig. 4 Measured electron diffraction pattern obtained from particle
b (left) and a key diagram showing the calculated [001] pattern for the
TiO2 rutile structure (right). The crosses indicate forbidden spots on the
diffraction pattern, but appear on the measured one. See text for details.
Publ
ishe
d on
20
Febr
uary
201
2. D
ownl
oade
d by
Duk
e U
nive
rsity
on
08/0
9/20
13 0
4:35
:07.
View Article Online
spectrum shows the presence of C, O, Si, Cl, and Cu that are
known to be constituent elements of the biosolid materials and
the formvar-coated Cu TEM grid.
To obtain structure information, we used high-resolution
TEM (HRTEM) in the area marked by a in Fig. 5A. In addition
to Ti and O at a ratio close to that expected for rutile, the
presence of Ag was also positively identified. Therefore, identi-
fying the crystal structure of particle a will help us determine
where added Ag potentially adsorbs, which is critical for pre-
dicting the fate and behavior of exogenous metal(s) in the
This journal is ª The Royal Society of Chemistry 2012
biosolid-amended soil environment. The HRTEM image of
particle a (circled area in Fig. 5B at much higher magnification
and resolution) and its fast Fourier transform (FFT) pattern are
provided in Fig. 5D. The spots in the FFT pattern correspond to
d-spacings of 2.30 �A and 1.14 �A, comparable to 2.30 �A and
1.15 �A that are expected for (2 0 0) and (4 0 0) planes of the TiO2
rutile structure.42 Therefore, this phase identification and EDX
analysis implies that Ag adsorbs onto the surface of TiO2 rutile
nanoparticles in the biosolid material because Ag does not
substitute into this structure. The average points of zero charge
(PZC) of rutile are reported to be 5.36 with a standard deviation
of 0.83.44 The pHs of the biosolid slurry and soil used for the
present study are measured to be 6.11 and 4.82, respectively.
Therefore, it is possible that Ag may adsorb onto the surface of
rutile TiO2 through nonselective, electrostatic interactions.
However, it should be noted that the rutile PZC values obtained
in very controlled laboratory experiments may be insufficient to
explain Ag sorption mechanism(s) in these complex, heteroge-
neous biosolid/soil systems.
We also examined the biosolid crusts collected from the
surface of a treatment control soil (biosolid materials only, no
Ag–NPs added) by using the SEM and TEM and found Ti,O-
containing particles, but Ag was never detected. Therefore, it is
concluded that the Ag on the TiO2 rutile surface of the Ag–NPs
spiked, biosolid-amended soil is from the Ag–NPs, not the soil or
otherwise inherent to the biosolids.
Nano-TiO2 and its derivatives have shown their high capacity
to adsorb toxic trace metals, holding promising potential for
metal removal from various contaminated sites.45–47 Similarly,
TiO2 concentrated in sewage sludge materials should be able to
adsorb potentially toxic trace metals, and may sequester them
before their arrival in aquatic systems. However, the presence
and accumulation of metal-bearing TiO2 in soils as a result of
repeated application of biosolid materials could be a cause for
concern. This is because when sewage sludge-born, metal-bearing
TiO2 is exposed to different environments, virtually no change
occurs to the TiO2 itself due to its refractive nature and extremely
low solubility in this low-temperature geochemical environment,
whereas the metals sorbed on the TiO2 surface may undergo
changes, and in various scenarios could be released into the soil
solution and become readily available. Therefore, in the future,
there is a special need to investigate the sorption characteristics
J. Environ. Monit., 2012, 14, 1129–1137 | 1135
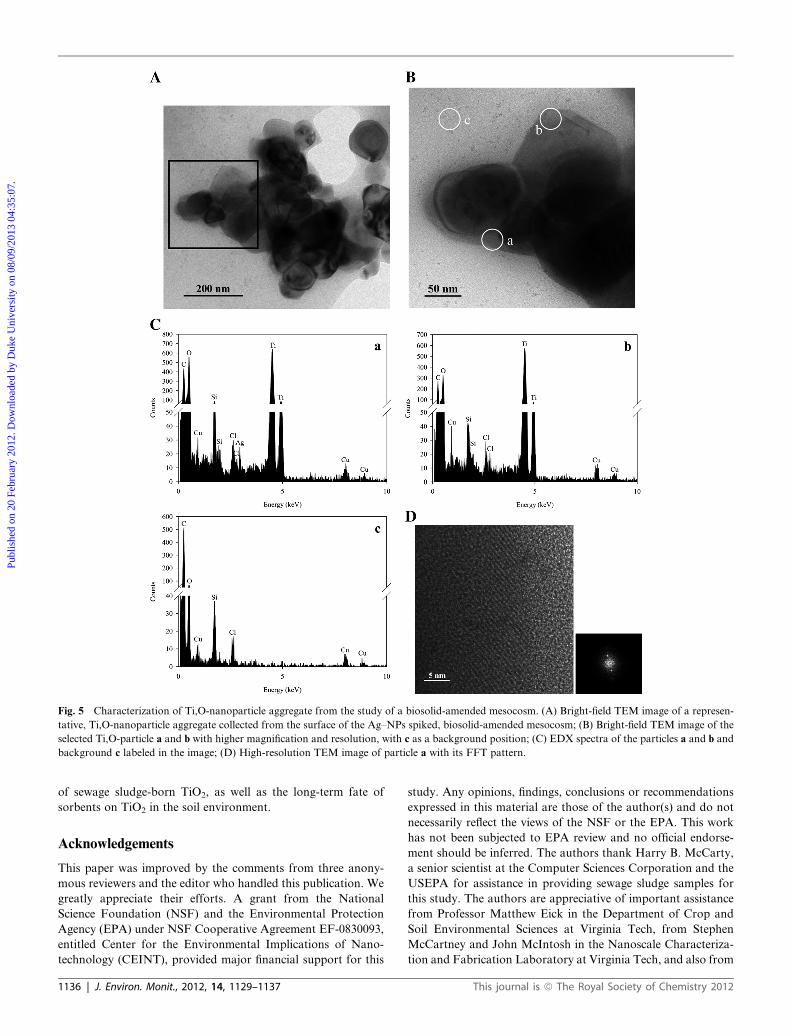
Fig. 5 Characterization of Ti,O-nanoparticle aggregate from the study of a biosolid-amended mesocosm. (A) Bright-field TEM image of a represen-
tative, Ti,O-nanoparticle aggregate collected from the surface of the Ag–NPs spiked, biosolid-amended mesocosm; (B) Bright-field TEM image of the
selected Ti,O-particle a and b with higher magnification and resolution, with c as a background position; (C) EDX spectra of the particles a and b and
background c labeled in the image; (D) High-resolution TEM image of particle a with its FFT pattern.
Publ
ishe
d on
20
Febr
uary
201
2. D
ownl
oade
d by
Duk
e U
nive
rsity
on
08/0
9/20
13 0
4:35
:07.
View Article Online
of sewage sludge-born TiO2, as well as the long-term fate of
sorbents on TiO2 in the soil environment.
Acknowledgements
This paper was improved by the comments from three anony-
mous reviewers and the editor who handled this publication. We
greatly appreciate their efforts. A grant from the National
Science Foundation (NSF) and the Environmental Protection
Agency (EPA) under NSF Cooperative Agreement EF-0830093,
entitled Center for the Environmental Implications of Nano-
technology (CEINT), provided major financial support for this
1136 | J. Environ. Monit., 2012, 14, 1129–1137
study. Any opinions, findings, conclusions or recommendations
expressed in this material are those of the author(s) and do not
necessarily reflect the views of the NSF or the EPA. This work
has not been subjected to EPA review and no official endorse-
ment should be inferred. The authors thank Harry B. McCarty,
a senior scientist at the Computer Sciences Corporation and the
USEPA for assistance in providing sewage sludge samples for
this study. The authors are appreciative of important assistance
from Professor Matthew Eick in the Department of Crop and
Soil Environmental Sciences at Virginia Tech, from Stephen
McCartney and John McIntosh in the Nanoscale Characteriza-
tion and Fabrication Laboratory at Virginia Tech, and also from
This journal is ª The Royal Society of Chemistry 2012
Publ
ishe
d on
20
Febr
uary
201
2. D
ownl
oade
d by
Duk
e U
nive
rsity
on
08/0
9/20
13 0
4:35
:07.
View Article Online
Kathy Lowe in the Morphology Service Laboratory at Virginia-
Maryland Regional College of Veterinary Medicine. Finally, the
authors also thank Brooke Hassett and Professor Emily Bern-
hardt from the Biology Department at Duke University for their
leadership and assistance with the terrestrial mesocosm
experiments.
References
1 WoodrowWilson International Center for Scholars. NanotechnologyConsumer Product Inventory; http://www.nanotechproject.org/inventories/consumer/.
2 R. H. M€uller, M. Radtke and S. A. Wissing, Adv. Drug Delivery Rev.,2002, 54, S131–S155.
3 W.-X. Zhang, J. Nanopart. Res., 2003, 5, 323–332.4 O. V. Salata, J. Nanobiotechnol., 2004, 2, 3.5 W. Tungittiplakorn, L. W. Lion, C. Cohen and J. Y. Kim, Environ.Sci. Technol., 2004, 38, 1605–1610.
6 A. G. Agrios, and K. A. Grey, in Environmental Catalysis, ed. V. H.Grassian, CRC publishing, Boca Raton, FL, 2005.
7 A. G. Agrios and P. Pichat, J. Appl. Electrochem., 2005, 35, 655–663.8 S. Pavasupree, S. Ngamsinlapasathian, M. Nakajima, Y. Suzuki andS. Yoshikawa, J. Photochem. Photobiol., A, 2006, 184, 163–169.
9 B. P. Barnett, A. Arepally, P. V. Karmarkar, D. Qian, W. D. Gilsonand P. Walczak, Nat. Med., 2007, 13, 4227–4233.
10 Y. Dong and S.-S. Feng, Biomaterials, 2007, 28, 4154–4160.11 G. V. Lowry, in Nanomaterials for Groundwater remediation, ed. M.
R. Wiesner and J.-Y. B. Bottero, McGraw-Hill, 2007, pp. 297–336.12 A. V. Kachynski, A. N. Kuzmin, M. Nyk, I. Roy and P. N. Prasad, J.
Phys. Chem. C, 2008, 112, 10721–10724.13 D. Wei, H. E. Unalan, D. X. Han, Q. X. Zhang, L. Niu and
G. Amaratunga, Nanotechnology, 2008, 19.14 M. Lens, Recent Pat. Biotechnol., 2009, 3, 118–123.15 R. J. Aitken, M. Q. Chaudhry, A. B. A. Boxall and M. Hull, Occup.
Med., 2006, 56, 300–306.16 J. Gambogi, inMineral Yearbook: Titanium, U.S. Geological Survey,
Department of the Interior, Washington, DC, 2006, http://minerals.usgs.gov/minerals/pubs/commodity/titanium/.
17 J. Zhang, L.-Y. Shi, W. Zhu andX.Wang, Preparation and propertiesof nano-TiO2 modified interior wall paint, J. Shanghai University(English Edition), 2007, 11(4), 432–436.
18 C. O. Hendren, X. Mesnard, J. Dr€oge and M. R. Wiesner, Environ.Sci. Technol., 2011, 45, 2562–2569.
19 N. C. Mueller and B. Nowack, Environ. Sci. Technol., 2008, 42, 4447–4453.
20 F. Gottschalk, T. Sonderer, R. W. Scholz and B. Nowack, Environ.Sci. Technol., 2009, 43, 9216–9222.
21 R. Kaegi, A. Ulrich, B. Sinnet, R. Vonbank, A. Wichser, S. Zuleeg,H. Simmler, S. Brunner, H. Vonment, M. Burkhardt and M. Boller,Environ. Pollut., 2008, 156, 233–239.
This journal is ª The Royal Society of Chemistry 2012
22 J. Labille, J. Feng, C. Botta, D. Borschneck, M. Sammut, M. Cabie,M. Auffan, J. Rose and J.-Y. Bottero, Environ. Pollut., 2010, 158,3482–3489.
23 M. Auffan, M. Pedeutour, J. Rose, A. Masion, F. Ziarelli,D. Borschneck, C. Chaneac, C. Botta, P. Chaurand, J. Labille andJ.-Y. Bottero, Environ. Sci. Technol., 2010, 44, 2689–2694.
24 P. Westerhoff, G. Song, K. Hristovski and M. A. Kiser, J. Environ.Monit., 2011, 13, 1195–1203.
25 Z. Luo, Z. Wang, Q. Li, Q. Pan, C. Yan and F. Liu, J. Environ.Monit., 2011, 13, 1046–1052.
26 L. K. Limbach, R. Bereiter, E. M€uller, R. Krebs, R. G€alli andW. J. Stark, Environ. Sci. Technol., 2008, 42, 5828–5833.
27 http://epa.gov/waterscience/biosolids/tnsss-stat.pdf.28 http://epa.gov/waterscience/biosolids/tnsss-tech.pdf.29 http://epa.gov/waterscience/biosolids/appendixa.pdf.30 W. E. Dean, J. Sed. Petrol., 1974, 44, 242–248.31 G. W. Gee, J. W. Bauder, and A. Klute. Particle-size analysis.
Methods of soil analysis. Part 1. Physical and mineralogical methods,1986, 383–411.
32 CEM Corporation. Application notes (analytical). http://www.cem.com/index/php.
33 Analytical methods approved for compliance monitoring under theground water rule. http://epa.gov/ogwdw/methods/pdfs/methods/methods_gwr.pdf.
34 J. N. Meyer, C. A. Lord, X. Y. Yang, E. A. Turner, A. R. Badireddy,S. M. Marinakos, A. Chilkoti, M. R. Wiesner and M. Auffan, Aquat.Toxicol., 2010, 100, 140–150.
35 http://www.polysciences.com/SiteData/poly/Assets/DataSheets/233.pdf.
36 S. Utsunomiya and R. C. Ewing, Environ. Sci. Technol., 2003, 37,786–791.
37 B. Kim, C.-S. Park, M. Murayama and M. F. Hochella, Jr, Environ.Sci. Technol., 2010, 44, 7509–7514.
38 B. Kim, C.-S. Park, M. Murayama and M. F. Hochella, Jr, Geochim.Cosmochim. Acta, 2010, 74, A487–A552.
39 J. Augustynski, Electrochim. Acta, 1993, 38, 43–46.40 A. L. Linsebigler, G. Lu and J. T. Yates, Jr, Chem. Rev., 1995, 95,
735–758.41 G. Li, L. Chen, M. E. Graham and K. A. Gray, J. Mol. Catal. A:
Chem., 2007, 275, 30–35.42 R. J. Swope, J. R. Smyth and A. C. Larson, Am. Mineral., 1995, 80,
448–453.43 B. Fultz and J. Howe, in Transmission Electron Microscopy and
Diffractometry of Materials, Springer, New York, 2001; pp. 275–337.
44 M. Kosmulski, Adv. Colloid Interface Sci., 2002, 99, 255–264.45 S. V. Mattigod, G. E. Fryxell, K. Alford, T. Gilmore, K. Parker,
J. Serne and M. Engelhard, Environ. Sci. Technol., 2005, 39, 7306–7310.
46 T. Luo, J. Cui, S. Hu, Y. Huang and C. Jing, Environ. Sci. Technol.,2010, 44, 9094–9098.
47 Y. Gao, R. Wahi, A. T. Kan, J. C. Falkner, V. L. Colvin andM. B. Tomson, Langmuir, 2004, 20, 9585–9593.
J. Environ. Monit., 2012, 14, 1129–1137 | 1137