Embed Size (px)
Citation preview

”“ABSTRACTThis study investigated the relationship between Myers-Briggs Type Indicator® (MBTI®) personality types andcortical activity. Cortical activity was measured byrecording eyes-open EEG across bandwidths from 1 Hzto 39 Hz at 19 cortical sites. The findings in the alphabandwidth were generally congruent with Eysenck’sbiological theory of extraversion–introversion. Further-more, participants showed specific and different patterns of cortical activity associated with each of theother MBTI dimensions in the various bandwidths.
INTRODUCTIONDuring the “decade of the brain,” a major researchthrust was an attempt to link psychological or behav-ioral phenomena to their underlying physiologicalsubstrates. This included attempts to connect variouspersonality constructs with physiological measures,particularly the features of the brain’s electrophysiologic
or EEG activity. EEG has been used by researchersbecause it is extremely reliable within subjects (e.g.,Pollock, Schneider, & Lyness, 1991, obtained intrasub-ject correlations greater than .84 after 4.5 months) andcan be used to measure personality traits and cognitivestyle differences (Dunn & Reddix, 1991). Because of the influence of Eysenck’s (1967, 1976) biologicallybased personality theory, most of the research in thisarea has concentrated on the relationship between EEG activity and the constructs of extraversion andintroversion (E–I). Interestingly, most of the EEGresearch has primarily based the measurement of extra-version on Eysenck’s Personality Inventory (EPI;Eysenck & Eysenck, 1964).
Based on the work of Jung (1921/1971), Eysenckand Rachman (1965) defined extraversion as one end of a bipolar dimension characterized by low levels ofcortical arousal. People high on this trait are sociableand impulsive. Introversion is characterized by high
65Journal of Psychological Type®
Over twenty-five years of publishing research articles related to the theory andapplications of psychological type and the Myers-Briggs Type Indicator® instrument.
Published by the Center for Applications of Psychological TypeThomas G. Carskadon, Ph.D., Editor
C A P T
Issue 5 NOV 05
EEG measurements show that psychological types have an identi-fiable underlying physiological substrate that differs for each type.
®
Relationship Between EEG and Psychological TypePeter C. Gram, Bruce R. Dunn, and Diana EllisUniversity of West Florida

Journal of Psychological Type®, Volume 65, November 2005
levels of cortical arousal and caution. Extraverts seekconditions that bring arousal levels up to a comfortabledegree of stimulation, whereas introverts generallyavoid arousing situations. Therefore,according to Eysenck, introvertsshould display lower amplitude,higher frequency baseline EEGpatterns (typically beta > 12 Hz), andextraverts should display higher-amplitude, lower-frequency activity(typically alpha bandwidth 8–12 Hz)in their baseline EEG records.
Gale and Edwards (1986)reported numerous studies thatyielded equivocal support forEysenck’s theory. The majority ofresearchers obtained results support-ing Eysenck’s theory that extravertsgenerate more alpha bandwidthactivity (and thus are assumed to be less aroused) thanintroverts (e.g., S. M. Baker’s unpublished dissertationcited in Gale, 1981; Gale, Coles, & Blaydon, 1969;Rösler, 1975). However, others found less alpha bandwidth production (more arousal) associated withextraversion, which is the opposite of the theory’sprediction (e.g., Broadhurst & Glass, 1969; Mundy-Castle, 1955; Shagass & Kerenyi, 1958). Still otherresearchers found no differences in alpha bandwidthproduction (e.g., Gale, Coles, Kline, & Penfold, 1971;Henry & Knott, 1941; Strelau & Terelak, 1974).Surprisingly, few studies reported differences in the betabandwidth (> 12 Hz), primarily because few collectedany beta activity. (See Gale & Edwards, 1986). Thesedata are carefully examined in the present study.
Gale (1983) concluded that the ambiguity in thealpha bandwidth activity results across studies wascaused by variations in experimental conditions.Furthermore, he recommended that personality shouldbe measured under conditions that provide the greatestsensitivity for detecting differences, i.e., conditionsrequiring a medium level of cognitive load (e.g.,arousal). The results of a study by Wilson and Languis(1989) reinforced this recommendation. They recordedEEG activity in both eyes-open and eyes-closed baselineconditions. In the eyes-open condition, introverts had lower alpha (8–13 Hz) amplitude than extraverts,supporting Eysenck’s theory. The eyes-closed datayielded the opposite pattern. However, because theeyes-open baseline condition may require a greater
cognitive load than an eyes-closed baseline (Gale,1983), the implication is that the eyes-open conditionwould be a better index of the E–I dichotomy than an
eyes-closed situation. That is, withtheir eyes open, participants wouldbe more compelled to attend to theirsurroundings.
As suggested earlier, one reasonfor the lack of clear support forEysenck’s theory may be methodolog-ically based. One possibility is thatthe E–I dichotomy based on theMBTI measure may be a more validindex of Eysenck’s notion of arousalthan the more widely studied EPI (Eysenck & Rachman, 1965).Another problem in studying E–I hasbeen a lack of standardization in theplacement of reference electrodes.
Some researchers have used a bipolar reference (Deakin& Exley, 1979; Montgomery, 1975; Morris & Gale,1974), whereas others have used a unipolar referencesuch as linked ears (e.g., Stenberg, 1992). Dunn (1985)and Pfurtscheller (1988) have pointed out that theplacement of reference electrodes makes a difference inthe interpretation of recorded EEG data.
The use of bipolar recordings can cause problemsin assessing bilateral hemispheric activity. Thedifferential amplifiers that are used to record EEG read-ings measure the difference between two electrodes.Consequently, it is possible for two left hemisphericbipolar sites to be producing 50 +v of alpha bandwidthactivity each and homologous bipolar sites on the right hemisphere to be generating 10 +v and 5 +v,respectively. The difference between left hemisphericproduction of alpha bandwidth activity would berecorded as 0 +v and the right hemispheric productionof alpha bandwidth activity as 5 +v. Obviously, theinterpretation that the right hemisphere produced morealpha bandwidth activity would be erroneous. A bettermethod is to use a neutral unipolar reference site, suchas linked ears or linked mastoids, that records little, if any, brain activity.
Another possible methodological problem is thatdifferent researchers do not agree on a specific standardof “EEG arousal.” Some early researchers (e.g., Jaspar,Solomon, & Bradley, 1938) defined “slow” as 2–7 Hz,whereas others (e.g., Ulett, Gleser, Winokur, & Lawler,1953), labeled 3–7 Hz as “very slow,” and “fast” activity
34
”“Extraverts seek
conditions that bringarousal levels up to
a comfortable degree of stimulation,
whereas Introvertsgenerally avoid
arousing situations.

Relationship Between EEG and Psychological Type
as 16–24 Hz. Newman (1985) used 13–30 Hz for “fast wave beta.” Finally, few researchers have reportedstudies of frequencies faster than 30 Hz (e.g., DeFrance& Sheer, 1988). We used the currently acceptedfrequency bandwidths: delta (1–3 Hz), theta (4–7 Hz),and alpha bandwidth (8–12 Hz). Based on Dunn,Hartigan, and Mikulas (1999), we divided the betabandwidth into three segments: beta 1 (13–25 Hz), beta2 (26–30 Hz), and beta 3 (31–39 Hz).
A final problem is related to the placement andnumber of recording electrodes used by differentresearchers. Most researchers have adopted the interna-tional 10/20 electrode placement system that has 19 active recording sites (Jaspar, 1958). However,researchers who have examined personality constructstypically use only some of these sites. For example,Pawlik and Cattell (1965) used sites that approximatedthe current standard frontal cortical sites (Fp1, Fp2, F3,F4), the temporal sites (T3, T4), the parietal sites (P3,P4), and the occipital sites (O1 and O2). Fenton andScotton (1967) used only F3 and a point between O1and O2. Winter, Broadhurst and Glass (1972) used fourpairs of bipolar recording sites (C4/P4, P4/O2, C3/P3,and P3/O1). The solutions to these methodologicalproblems are discussed below.
Because of the EEG personality literature’semphasis on E–I, the examination of the relation of EEG correlates to other personality constructs has beenneglected. One of the more popular personalityindicators, the Myers-Briggs Type Indicator (MBTI)tool, not only measures a preference for E–I, but also contains dichotomies that measure Sensing–Intuition (S–N), Thinking–Feeling (T–F), and Judging–Perceiving (J–P) (Myers & McCaulley, 1985).
Lyons (1985) appears to be the only otherresearcher who has investigated the relationshipbetween other dimensions of the MBTI measure andEEG, as the Wilson and Languis (1989, 1990) studiesconcentrated only on the MBTI’s E–I dichotomy. Lyons analyzed EEG data for 20 participants who had taken the MBTI instrument but calculated only arough measure of hemispheric processing (laterality).Although Lyons reported hemispheric differences (acorrelation between the T–F scale and right hemisphericprocessing), she used only bipolar recording sites(P3/T3 and P4/T4). As explained above, the use ofbipolar recordings makes any definitive statement aboutdifferential hemispheric processing impossible.
The present study addressed the methodological
35
problems inherent in most EEG-based personalitystudies, namely a) the dependence on the EPI ratherthan on other measures of E–I, like the MBTI measure;b) the reliance of some studies on bipolar, rather thanunipolar recordings, the latter of which use a relatively“neutral” reference electrode; c) an absence of standardbandwidths used to reflect a person’s state of corticalarousal; and d) a lack of sufficient recording sites toprovide a complete picture of cortical activity related tovarious personality traits. Like Wilson and Languis(1989, 1990), we handled these four methodologicalproblems by using the MBTI instrument as our index ofpersonality differences, by using a unipolar (linked ears)reference, by analyzing the data into standard frequencybandwidths ranging from 1 to 39 Hz, and by using all19 active recording sites of the standard 10–20 system(Jaspar, 1958).
This study also examined possible relationshipsbetween the EEG and the other subscales of the MBTIinstrument. It is hoped that these descriptive data will generate interest in further investigations ofrelationships between the EEG and these other Jungianpersonality dichotomies.
METHOD AND PROCEDUREThirty-five students (29 females and 6 males) ranging inage from 18 to 36 years (median = 24) volunteered toparticipate. All were recruited from introductorypsychology classes and received extra credit as well astheir results on the MBTI instrument.
Volunteers reported individually to the laboratory,where their baseline EEGs were recorded as they lookedat a blank screen for 5 minutes. All were asked to gazeat the screen in front of them but to be aware of theirsurroundings. They were also told to avoid makingexcessive muscle and eye movements. All participantswere run in the afternoon (from 12:30 to 4:00). Thesurroundings and instructions added a small cognitiveload as suggested by Gale (1983). During the last 2minutes of the recording period, eyes-open baselineEEG data were collected. Eleven of the participants werepart of a pilot study of memory. However, collection oftheir baseline EEG occurred before the memory task.After the EEG data were recorded, each participantcompleted the MBTI Form G instrument.
EEG data were recorded from 19 brain sitesaccording to the standard international 10/20 system,using a fitted nylon ECI Electro-cap™. A PDP 11/73computer-based brain-imaging system controlled the
Journal of Psychological Type®, Volume 65, November 2005
data collection. The EEG signals were amplified using a gain of 50,000 via 21 Grass Model JP511 seriespreamplifiers, with the 1/2 amplitude low-frequencycutoff set at 0.1 Hz and the 1/2 amplitude high-frequency cutoff set at 100 Hz, with the 60 Hz notchfilter engaged. Eye movements and blinks wererecorded from an electrode placed on the infraorbitalridge of the left eye, which was referred to anotherelectrode placed above the right eye of the supraorbitalridge. All data were edited off-line for eye movementand muscle artifacts. Only 5% of theEEG records were rejected. All activebrain sites were referred to linked ears,and the midline frontal-parietal site(Fpz) served as the subjects’ ground.EEG records were sampled at 256 Hz.
RESULTSEEG Data. Each artifact-free EEGrecord was subjected to a Fast FourierTransform (FFT), producing ampli-tude spectra using a Hanningwindow. The resultant amplitude datawere then converted into six fre-quency bandwidths (i.e., delta: 1–3Hz; theta: 4–7 Hz; alpha: 8–12 Hz; beta 1: 13–25 Hz;beta 2: 26–30 Hz; beta 3: 31–39 Hz).
MBTI preferences were determined for males and females based on the standard scoring system for Form G. TABLE 1 (SEE PAGE 37) shows the typedistribution of our total sample.
Although separate bandwidths (e.g., alpha 8–12Hz) were studied, the relationship of each individualfrequency from a given bandwidth (e.g., 10 Hz activity)to a given personality dichotomy also was investigated.That is, frequency was treated as an independentvariable. Using the alpha bandwidth as an example, thiswould result in a 2 (personality type) by 19 (electrodesite) by 6 (individual frequencies; 8–12 Hz) mixeddesign. The groups’ EEG data across frequency andrecording site were then compared using separateMANOVAs for each personality dichotomy.
All the MANOVAs showed that individualfrequencies did not contribute to any statisticallysignificant interaction, i.e., only the entire bandwidthdid. This left the significant two-way (personality typeby recording site) interactions to directly answer thequestions posed by this study. Wilks’ λ was used to
determine the overall significance of each MANOVA.Differences between personality types were tested ateach separate recording electrode using Tukey’scontrasts at a .05 level of significance to determinewhich personality types were significantly different fromeach other (for a given frequency bandwidth) at each ofthe 19 recording sites. For brevity, the means for thesesignificant contrasts between site means are notreported here but are available from the authors.
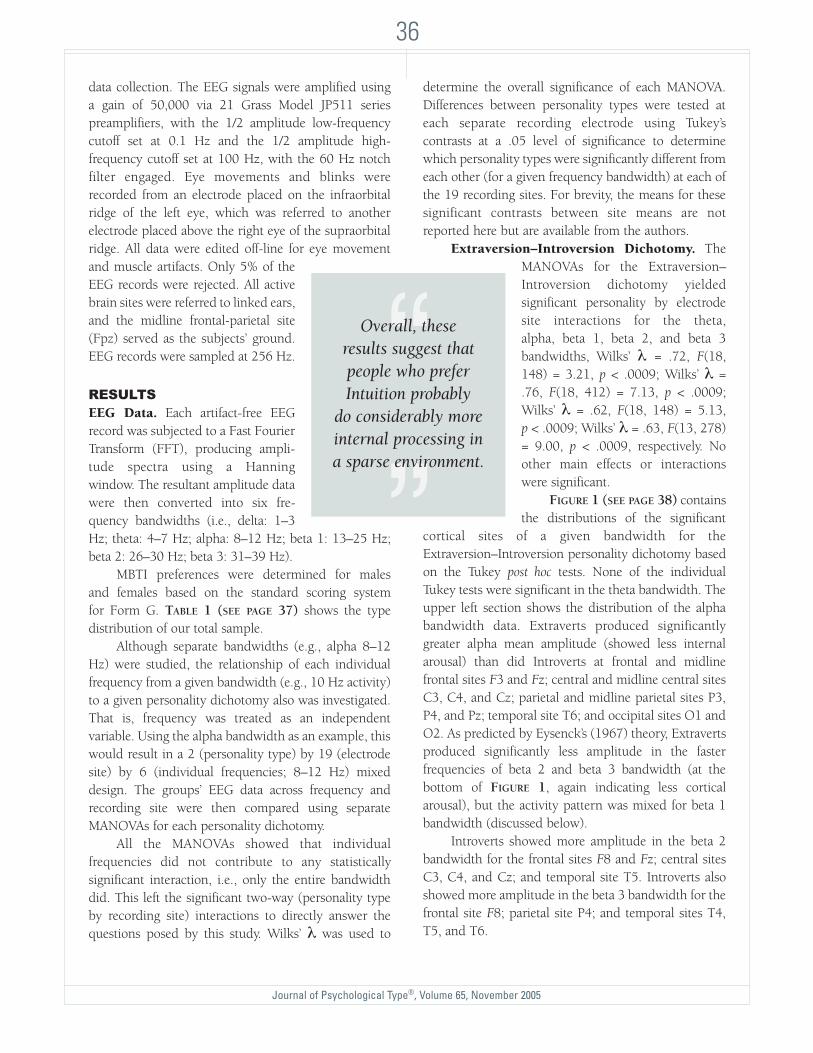
Extraversion–Introversion Dichotomy. TheMANOVAs for the Extraversion–Introversion dichotomy yieldedsignificant personality by electrodesite interactions for the theta, alpha, beta 1, beta 2, and beta 3bandwidths, Wilks’ λ = .72, F(18,148) = 3.21, p < .0009; Wilks’ λ =.76, F(18, 412) = 7.13, p < .0009;Wilks’ λ = .62, F(18, 148) = 5.13, p < .0009; Wilks’ λ = .63, F(13, 278)= 9.00, p < .0009, respectively. Noother main effects or interactionswere significant.
FIGURE 1 (SEE PAGE 38) containsthe distributions of the significant
cortical sites of a given bandwidth for theExtraversion–Introversion personality dichotomy basedon the Tukey post hoc tests. None of the individualTukey tests were significant in the theta bandwidth. Theupper left section shows the distribution of the alphabandwidth data. Extraverts produced significantlygreater alpha mean amplitude (showed less internalarousal) than did Introverts at frontal and midlinefrontal sites F3 and Fz; central and midline central sitesC3, C4, and Cz; parietal and midline parietal sites P3,P4, and Pz; temporal site T6; and occipital sites O1 andO2. As predicted by Eysenck’s (1967) theory, Extravertsproduced significantly less amplitude in the fasterfrequencies of beta 2 and beta 3 bandwidth (at thebottom of FIGURE 1, again indicating less corticalarousal), but the activity pattern was mixed for beta 1bandwidth (discussed below).
Introverts showed more amplitude in the beta 2bandwidth for the frontal sites F8 and Fz; central sitesC3, C4, and Cz; and temporal site T5. Introverts alsoshowed more amplitude in the beta 3 bandwidth for thefrontal site F8; parietal site P4; and temporal sites T4,T5, and T6.
36
”“Overall, these
results suggest thatpeople who preferIntuition probably
do considerably moreinternal processing in a sparse environment.

Relationship Between EEG and Psychological Type
37
The Sixteen Complete Types
ISTJ ISFJ INFJ INTJn = 1 n = 2 n = 0 n = 2(2.9%) (5.7%) (0.0%) (5.7%)+ + + + + + + + + + + + +
+ +
ISTP ISFP INFP INTPn = 1 n = 1 n = 2 n = 2(2.9%) (2.9%) (5.7%) (5.7%)+ + + + + + + + + + + + + + + +
+ +
ESTP ESFP ENFP ENTPn = 1 n = 1 n = 5 n = 2(2.9%) (2.9%) (14.3%) (5.7%)+ + + + + + + + + + + + + + + +
+ + + + + ++ + + +
ESTJ ESFJ ENFJ ENTJn = 3 n = 5 n = 5 n = 2(8.6%) (14.3%) (14.3%) (5.7%)+ + + + + + + + + + + + + + + + + + + ++ + + + + + + + + + + + + + +
+ + + + + + + +
Dichotomous Preferences
E n = 24 (68.6%)I n = 11 (31.4%)
S n = 15 (42.9%)N n = 20 (57.1%)
T n = 14 (40.0%)F n = 21 (60.0%)
J n = 20 (57.1%)P n = 15 (42.9%)
Pairs and Temperaments
IJ n = 15 (14.3%)IP n = 16 (17.1%)EP n = 19 (25.7%)EJ n = 15 (42.9%)
ST n = 16 (17.1%)SF n = 19 (25.7%)NF n = 12 (34.3%)NT n = 18 (22.9%)
SJ n = 11 (31.4%)SP n = 14 (11.4%)NP n = 11 (31.4%)NJ n = 19 (25.7%)
TJ n = 18 (22.9%)TP n = 16 (17.1%)FP n = 19 (25.7%)FJ n = 12 (34.3%)
IN n = 16 (17.1%)EN n = 14 (40.0%)IS n = 15 (14.3%)ES n = 10 (28.6%)
ET n = 18 (22.9%)EF n = 16 (45.7%)IF n = 15 (14.3%)IT n = 16 (17.1%)
Peter C. Gram, Bruce R. Dunn, and Diana Ellis, Relationship Between EEG and Psychological Type.
Jungian Types (E) Jungian Types (I) Dominant Typesn % Index n % Index n % Index
E–TJ 5 14.3 n.a. I–TP 3 8.6 n.a. Dt. T 8 22.9 n.a.E–FJ 10 28.6 n.a. I–FP 3 8.6 n.a. Dt. F 13 37.1 n.a.ES–P 2 5.7 n.a. IS–J 3 8.6 n.a. Dt. S 5 14.3 n.a.EN–P 7 20.0 n.a. IN–J 2 5.7 n.a. Dt. N 9 25.7 n.a.
Table 1. MBTI® Type Distribution of Total Sample.
N = 35 + = 1% of N I = Selection Ratio Index *p<.05 **p<.01 ***p<.001
Journal of Psychological Type®, Volume 65, November 2005
38
Peter C. Gram, Bruce R. Dunn, and Diana Ellis, Relationship Between EEG and Psychological Type.
Figure 1. Extraversion–Introversion
Significant site differences based on a Tukey at .05 for the different bandwidths for the personality dichotomy of Extraversion–Introversion (E–I).

Relationship Between EEG and Psychological Type
The mixed activity pattern of the beta 1 band-width revealed that Introverts had greater meanamplitude than Extraverts at the F8 frontal site, whereasExtraverts had greater mean amplitude at frontal siteF7. With the exception of the beta 1 data, the analysesof the bandwidth activity of alpha and beta 2 and beta3 data support Eysenck’s theory and will be addressedin the discussion.
Sensing–Intuition Dichotomy. The MANOVAsfor the Sensing–Intuition dichotomy resulted insignificant personality by electrode site interactions forthe theta, beta 1, beta 2, and beta 3 bandwidths: Wilks’λ = .74, F(18, 115) = 2.07, p < .01; Wilks’ λ = .71, F(18, 379) = 8.65, p < .0009; Wilks; λ = .57, F(18, 181)= 7.47, p < .0009, and Wilks’ λ = .58, F(18, 278) =11.18, p < .0009, respectively. No other main effects orinteractions were significant.
FIGURE 2 (SEE PAGE 40) contains the distributionsof the significant cortical sites of a given bandwidth for the S–N personality dichotomy based on the Tukey post hoc tests. The upper left portion shows that at every site, individuals who preferred Sensing producedgreater mean theta amplitude than did individuals who preferred Intuition. It should be recalled that theta activity occurs during sleep and states of deeprelaxation. Thus, the theta data suggest that with littleenvironmental stimulation (i.e., the EEG recordingroom), people preferring Sensing had little to process,hence generating high levels of theta activity.
The pattern differed in the beta 1 bandwidth, forwhich Intuitive types produced greater mean amplitudethan Sensing types at frontal sites Fp1, F3, F4, and Fz;central sites C3, C4, and Cz; parietal sites P3 and P4;temporal site T6; and occipital sites O1 and O2. Ns alsoproduced greater mean amplitude in beta 2 and beta 3bandwidths, but only at site T4. These latter results areprobably spurious, since these were not found in othersites. Overall, these results suggest that people whoprefer Intuition probably do considerably more internalprocessing in a sparse environment.
Thinking–Feeling Dichotomy. Significant per-sonality by electrode site interactions for the delta,theta, alpha, beta 1, beta 2, and beta 3 bandwidths wereobtained by MANOVAs for the Thinking–Feelingdichotomy: Wilks’ λ = .59, F(18, 82) = 3.20, p < .0009;Wilks’ λ = .50, F(18, 115) = 6.35, p < .0009; Wilks’ λ= .58, F(18, 148) = 5.88, p < .0009; Wilks’ λ = .56,F(18, 412) = 17.87, p < .0009; Wilks’ λ = .55, F(18,
148) = 6.82, p < .0009; and Wilks’ λ = .55, F(18, 278)= 12.48, p < .0009, respectively. No other main effectsor interactions were significant. Although the personal-ity type by recording sites interactions were significantfor delta bandwidth, none of the individual post hoc testsat any site were significant at the .05 level, so these datawill not be discussed further.
The distribution of significant sites based on the Tukey post hoc tests for the Thinking–Feelingdichotomy is found in FIGURE 3 (SEE PAGE 41).Individuals preferring Feeling produced significantlygreater mean theta amplitude than did individuals whopreferred Thinking, primarily at frontal sites Fp1, Fp2,and F4. The alpha data, like all the other remainingbandwidths, also showed that Feeling individualsproduced greater mean amplitude than Thinkingindividuals. For the alpha bandwidth data, this held for frontal sites Fp1, Fp2, F7, F3, and F4; temporal sites T3, T5, and T6; parietal sites P3, P4, and Pz; andoccipital site O2. The beta 1 bandwidth revealed thatFeeling types produced greater mean amplitude atfrontal sites Fp1, Fp2, F3, Fz, F4, and F8; temporal sitesT3, T5, and T6; parietal sites P3, Pz, and P4; and bothoccipital sites O1 and O2. Significant differences in thebeta 2 bandwidth were found at frontal sites Fp1 andFp2, temporal sites T5 and T6, and both occipital sites.Beta 3 data were somewhat similar to the beta 1 data in that Feeling types also produced greater mean beta 3amplitude than Thinking types at frontal sites Fp1, Fp2,and F4; temporal sites T5 and T6; parietal sites Pz andP4; and both occipital sites.
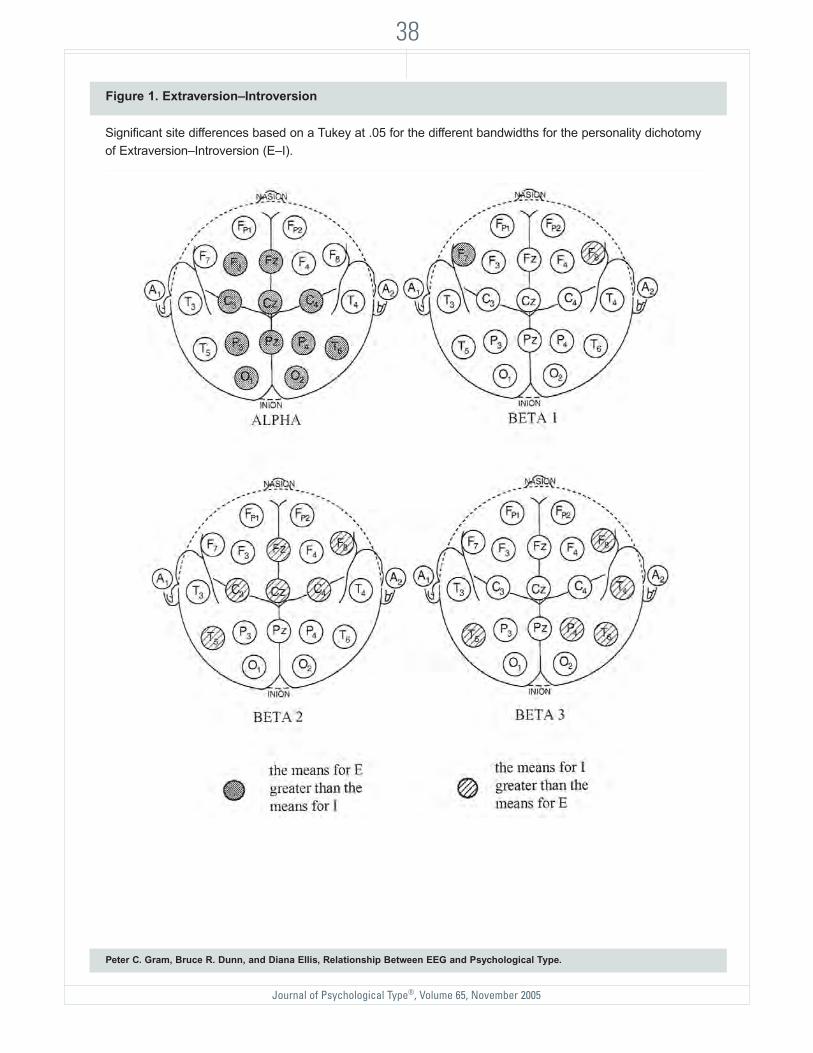
Judging–Perceiving Dichotomy. The MANOVAsfor the Judging-Perceiving dichotomy yielded signifi-cant personality by electrode site interactions for thetheta, alpha, beta 1, beta 2, and beta 3 bandwidths:Wilks’ λ = .77, F(18, 115) = 1.92, p < .03; Wilks’ λ =.71, F(18, 148) = 3.31, p < .0009; Wilks’ λ = .67, F(18,412) = 11.07, p < .0009; Wilks’ λ = .65, F(18, 148) =4.51, p < .0009; and Wilks’ λ = .73, F(18, 278) = 5.85, p < .0009, respectively. No other main effects or interac-tions were significant. Although the personality type byrecording sites were significant for the theta bandwidth,none of the individual post hoc tests at any site wassignificant at the .05 level, so these data will not bediscussed further.
FIGURE 4 (SEE PAGE 42) shows the remainingsignificant sites for the Judging–Perceiving dichotomy.Judging types produced greater mean alpha bandwidth
39

Journal of Psychological Type®, Volume 65, November 2005
Peter C. Gram, Bruce R. Dunn, and Diana Ellis, Relationship Between EEG and Psychological Type.
Significant site differences based on a Tukey at .05 for the different bandwidths for the personality dichotomy of Sensing–Intuition (S–N).
Figure 2. Sensing–Intuiting
40

Relationship Between EEG and Psychological Type
Peter C. Gram, Bruce R. Dunn, and Diana Ellis, Relationship Between EEG and Psychological Type.
Significant site differences based on a Tukey at .05 for the different bandwidths for the personality dichotomy of Thinking–Feeling (T–F).
Figure 3. Thinking–Feeling
41
Journal of Psychological Type®, Volume 65, November 2005
Peter C. Gram, Bruce R. Dunn, and Diana Ellis, Relationship Between EEG and Psychological Type.
Significant site differences based on a Tukey at .05 for the different bandwidths for the personality dichotomy of Judging–Perceiving (J–P).
Figure 4. Judging–Perceiving
42

Relationship Between EEG and Psychological Type
amplitude than did Perceiving types at two frontal sites,Fp2 and F8, all temporal sites, all central sites, andparietal sites Pz and P4.
Js also produced greater mean beta 1 amplitudebilaterally at frontal sites F7 and F8; temporal sites T3,T4, and T6; as well as the central site C4. A similarpattern occurred in beta 2 data, in which Judging types generated greater mean beta 2 amplitude thanPerceiving types at frontal sites Fp2 and F7, all temporal sites, parietal sites P3 and P4, and bothoccipital sites. With the exception of frontal site Fp1,central site C3, parietal site Pz, and occipital site O1,Judging types produced greater mean beta 3 amplitudethan Perceiving types at all sites.
DISCUSSIONOur data strongly support the basic tenets of
Eysenck’s (1967) biological theory of personalityconcerning arousal and suggest that, at a minimum, theExtraversion–Introversion scale of the MBTI tool ismeasuring these constructs at least as well as Eysenck’sown EPI index (Eysenck & Eysenck, 1964). Unlikemuch of the past research, which only examinedchanges in alpha bandwidth activity (see Gale &Edwards, 1986), we found differences in the beta 2 andbeta 3 bandwidths as well. Specifically, we obtained theEEG differences proposed by Eysenck. Extravertsproduced greater mean alpha bandwidth amplitude,whereas Introverts produced more amplitude in thehigher frequency beta bandwidths.
If past researchers based the discrimination ofExtraverts and Introverts on data that primarilyincluded beta 1 activity (e.g., Gale et al., 1969; Gale etal., 1971), it might explain why equivocal results wereobtained. Our data show that the beta 1 bandwidth(13–25 Hz) is a mixture of both greater mean amplitudefor Introverts at one frontal site and for Extraverts atanother. As mentioned above, the beta 2 and beta 3bandwidth data were more definitive. Introvertsgenerated more activity in the beta 2 and beta 3 band-widths than Extraverts at all significant recording sites.
It is difficult to compare the differences betweenExtraverts and Introverts in Gale et al. (1969) and thepresent study for a number of reasons: First, their dataare problematic because they used a bipolar reference in the occipital area only, with the inherent problemsassociated with this type of reference. Second, the band-widths they used were not the same as the ones weused; their filters included both high alpha and low beta
in one bandwidth (11.5–14.5 Hz), and they used onlyone other beta bandwidth (14.5–20 Hz). The latter issimilar to our beta 1 bandwidth and includes theconcomitant problems with using that bandwidth.
In contrast to Rösler (1975), we did not findsignificant differences between Extraverts and Introvertsin either the delta or the theta bandwidths. In Rosler’sstudy, the delta and theta bandwidths just barelyreached statistical significance and only occurred in atriple interaction of task, frequency, and Extraversion,and specifically appeared only when the subjects were in a stressful task situation (e.g., calculation underpressure). Their tasks did not correspond to our eyes-open baseline condition, which was not as stress-inducing.
The other purpose of this study was to explore thepossibility that each of the other MBTI dichotomies may have unique EEG distribution patterns acrosscortical recording sites. When participants were dividedaccording to the S–N dichotomy, analysis of the EEGbandwidth data showed that Sensing types displayedsignificantly more mean amplitude at every cortical sitein the theta bandwidth than Intuitive types. No otherpersonality dichotomy showed such strong differencesin the theta bandwidth than Intuitive types. No otherpersonality dichotomy showed such strong differencesin the theta bandwidth, and in no other bandwidth wasthe number of significant recording sites as pervasive.Because there was little activity in the relatively sparseexperimental room, participants having a preference forSensing apparently were able to quiet their minds, asindexed by the high levels of theta activity. In the caseof the beta 1 bandwidth, this pattern was reversed, sothat Intuitive types had greater mean amplitude thanSensing types. This implies that Intuitive types weredoing more internal processing than Sensing types inthe relatively quiet experimental room.
The data for the Thinking–Feeling dichotomyindicated that Feeling types produced greater meanamplitude in theta through beta 3 bandwidthscompared to Thinking types. This pattern was mostpronounced for the bandwidths from alpha throughbeta 3 amplitude data.
Finally, when the Judging–Perceiving dichotomywas considered, Judging types generated greater meanamplitude in the alpha bandwidth through beta 3 band-widths than Perceiving types. Future research is neededto determine if the Thinking–Feeling and Judging–Perceiving dichotomies’ EEG patterns are truly unique.
43

Journal of Psychological Type®, Volume 65, November 2005
44
In conclusion, our data provide additional strongevidence for Eysenck’s (1967) basic notions concerningExtraversion and Introversion and suggest that theExtraversion–Introversion scale of the MBTI instrumentmay be a more reliable measure of this dichotomy than the widely used EPI. Although our study of
the remaining MBTI factors was descriptive andexploratory, the results suggest that differential EEGfrequency patterns are related to personality variablesother than Extraversion–Introversion, particularly tothe Sensing–Intuition dichotomy, and therefore furtherstudy is warranted.
Henry, L. E., & Knott, J. R. (1941). A note on the relationshipbetween “personality” and the alpha rhythm of the electroen-cephalogram. Journal of Experimental Psychology, 28,362–366.
Jaspar, H. H. (1958). The ten-twenty electrode system of theinternational federation. Electroencephalography and clinicalneuropsychology, 10, 371–375.
Jaspar, H. H., Solomon, P., & Bradley, C. (1938).Electroencephalographic analogues of behavior problemchildren. American Journal of Psychiatry, 95, 641–658.
Jung, C. G. (1971). Psychological types (H. G. Baynes, Trans.,revised by R. F. C. Hull). Volume 6 of The collected works ofC. G. Jung. Princeton, NJ: Princeton University Press.(Original work published 1921)
Lyons, C. A. (1985). The relationship between prospective teach-ers’ learning preference style and teaching preference style.Educational and Psychological Research, 5(4), 275–297.
Montgomery, P. S. (1975). EEG alpha as an index of hysteroid andobsessoid personalities. Psychological Reports, 86, 431–436.
Morris, P., & Gale, A. (1974). A correlational study of variablesrelated to imagery. Perceptual and Motor Skills, 38, 659–665.
Mundy-Castle, A. C. (1955). The relationship between primary-secondary function and the alpha rhythm of the electroen-cephalogram. Journal of the National Institute of PersonnelResearch, 6, 95–102.
Myers, I. B., & McCaulley, M. H. (1985). Manual: A guide to thedevelopment and use of the Myers-Briggs Type Indicator. PaloAlto, CA: Consulting Psychologists Press.
Newman, J. B. (1985). Hemispheric specialization and Jungiantypology: Evidence for a relationship. (Doctoral dissertation,Pacific Graduate School of Psychology, 1985). DissertationAbstracts International, 46, 761–762.
Pawlik, K., & Cattell, R. B. (1965). The relationship betweencertain personality factors and measures of cortical arousal.Neuropsychologia, 3, 128–151.
Pfurtscheller, G. (1988). Mapping of event-related desynchroniza-tion and type of derivation. Electroencephalography andClinical Neurophysiology, 70, 190–193.
Pollock, V. E., Schneider, L. S., & Lyness, S. A. (1991). Reliabilityof topographic quantitative EEG amplitude in healthy late-middle-aged and elderly subjects. Electroencephalography andClinical Neurophysiology, 79, 20–26.
Rösler, F. (1975). Die abhangigkeit des electroenzephalogrammsvon den person lichkeitsdimentionen E und N sensuEysenck und unterschiedlich aktivierenden situationen (The relationship of electroencephalograms of the person-ality dimensions E [extraversion] and N [neuroticism] of
REFERENCES
Broadhurst A., & Glass, A. (1969). Relationship of personalitymeasures to the alpha rhythm of the electroencephalogram.British Journal of Psychiatry, 115, 199–204.
Deakin, J. F. W., & Exley, K. A. (1979). Personality and male-femaleinfluences on the EEG alpha rhythm. Biological Psychology, 8,285–290.
DeFrance, J., & Sheer, D. E. (1988). Focused arousal, 40-Hz EEG,and motor programming. In M. Giannitrapani (Ed.), TheEEG of mental activities (pp. 153–168). Karger: Basel.
Dunn, B. R. (1985). Bimodal processing and memory from text. InV. M. Rentel, S. Corson, & B. R. Dunn (Eds.),Psychophysiological aspects of reading and learning (pp. 37–93).New York: Gordon and Breach Science Publishers.
Dunn, B. R., Hartigan, J., & Mikulas, W. (1999). Concentration andmindfulness meditations: Unique forms of consciousness?Applied Psychophysiological and Biofeedback, 24, 147–165.
Dunn, B. R., & Reddix, M. (1991). Modal processing style differ-ences in the recall of expository text and poetry. Learning andIndividual Differences, 3, 265–293.
Eysenck, H. J. (1967) The biological basis of personality. Springfield,IL: Charles C. Thomas.
Eysenck, H. J. (1976). The measurement of personality. Lancaster,England: Medical & Technical Publishers.
Eysenck, H. J., & Eysenck, S. G. B. (1964). Manual of the EysenckPersonality Inventory. London: University of London Press.
Eysenck, H. J., & Rachman, S. (1965). The causes and cures ofneurosis. London: Routledge & Kegan Paul.
Fenton, G. W., & Scotton, L. (1967). Personality and the alpharhythm. British Journal of Psychiatry, 113, 1283–1289.
Gale, A. (1981). EEG studies of extraversion-introversion: What’sthe next step? In R. Lynn (Ed.), Dimensions of personality:Papers in honour of H. J. Eysenck (pp. 181–208). Oxford:Pergamon.
Gale, A. (1983). Electroencephalographic studies of extraversion-introversion: A case study in the psychophysiology of indi-vidual differences. Personality and Individual Differences, 4,371–380.
Gale, A., Coles, M., & Blaydon, J. (1969). Extraversion-introver-sion and the EEG. British Journal of Psychology, 60, 209–223.
Gale, A., Coles, M., Kline, P., & Penfold, V. (1971). Extraversion-introversion, neuroticism and the EEG: Basal and responsemeasures during habituation of the orienting response.British Journal of Psychology, 62, 533–548.
Gale, A., & Edwards, J. A. (1986). Individual differences. In M. G. H. Coles, E. Donchin, & S. W. Porges (Eds.),Psychophysiology, systems, processes and applications (pp.431–507). New York: Guilford Press.

Relationship Between EEG and Psychological Type
Eysenck and different activating situations). Zeitschrift fürExperimentell und Angewandte Psychologie, 12, 630–667.
Shagass, C., & Kerenyi, A. B. (1958). Neurophysiologic studies ofpersonality. Journal of Nervous and Mental Disease, 126,141–147.
Stenberg, G. (1992). Personality and the EEG: Arousal andemotional arousability. Personality and Individual Differences,13(10), 1097–1113.
Strelau, J., & Terelak, J. (1974). The alpha-index in relation totemperamental traits. Studia Psychologica, 16, 40–50.
Ulett, G. A., Glester, G., Winokur, G., & Lawler, A. (1953). TheEEG and reaction to photic stimulation as an index of
anxiety proneness. Electroencephalography and ClinicalNeurophysiology, 5, 23–32.
Wilson, M. A., & Languis, M. L. (1989). Differences in brainelectrical activity patterns between introverted andextraverted adults. Journal of Psychological Type, 18, 14–23.
Wilson, M. A., & Languis, M. L. (1990). A topographic study inthe P300 between introverts and extraverts. BrainTopography, 2(4), 269–274.
Winter, K., Broadhurst, A., & Glass, A. (1972). Neuroticism, extra-version, and EEG amplitude. Journal of Experimental Researchin Personality, 6, 444–451.
45

C O N TA C T
Journal of Psychological Type®, Volume 65, November 2005
46
Peter Gram received his Ph.D. in 1973 from the University of Georgia. He is currently Professor of Psychology at Pensacola Junior College and teaches part time at the University of West Florida. He has been studying thephysiological correlates of cognition for the past 20 years.
Bruce Dunn received his Ph.D. in 1973 from Cornell University. He was Professor of Psychology at the University ofWest Florida, where he was Director of the Laboratory for Studies in Neurocognition and also Associate Director of the Institute for Machine and Human Cognition. He studied the relationship between the brain’s EEG patterns andhuman cognition for more than 25 years before his untimely death.
Diana Ellis received her M.A. in psychology with an emphasis on neurocognition from the University of West Floridain 1988. She subsequently pursued doctoral studies in psychology at Auburn University.
Dr. Peter C. GramDepartment of Behavioral Sciences
Pensacola Junior CollegePensacola, FL 32504
This Journal is being made available through the collaborative efforts of Dr. Tom Carskadon, Editor of the Journal of Psychological Type, andthe Center for Applications of Psychological Type, Inc., CAPT, worldwide publisher.
Journal of Psychological Type is a trademark or registered trademark of Thomas G. Carskadon in the United States and other countries.
CAPT is a not-for-profit organization dedicated to the meaningful application and ethical use of psychological type as measured through theMyers-Briggs Type Indicator instrument.
Myers-Briggs Type Indicator, Myers-Briggs, and MBTI are trademarks or registered trademarks of the Myers-Briggs Type Indicator Trust inthe United States and other countries.
Copyright © 2005 by Thomas G. Carskadon, Editor.
Center for Applications of Psychological Type, Inc. and CAPT are trademarks or registered trademarks of the Center for Applications ofPsychological Type in the United States and other countries.