Embed Size (px)
Citation preview
Palavan Chinnaiah /J Compr Phar 2015;2(3):71-83
71
NEW VALIDATED RP-HPLC METHOD FOR IDENTIFICATION AND QUANTITATION OF PROCESS AND DEGRADATION RELATED
IMPURITIES IN THE COMBINED DOSAGE TABLETS OF ATAZANAVIR AND RITONAVIR
Palavan Chinnaiah *, a, Appala R Lanka b, Srinivasu Pamidi c, Palapatla PR Govada d, Venkata LNSR Jillella e
a Research Scholar, Andhra University College of Pharmaceutical Sciences, Visakhapatnam-530003, A.P, India.
b Assistant General Manager, Analytical Development, Hetero Labs Limited, Unit-III, Jeedimetla, Hyderabad-500055, Telangana, India.
c General Manager, Analytical Development, Hetero Labs Limited,Unit-III, Jeedimetla, Hyderabad-500055, Telangana, India. d Director, Hetero Labs Limited, Unit-III, Jeedimetla, Hyderabad-500055, Telangana, India.
e Principal, Srinivasarao College of Pharmacy, P. M. Palem, Visakhapatnam-530041, A.P, India.
INTRODUCTION
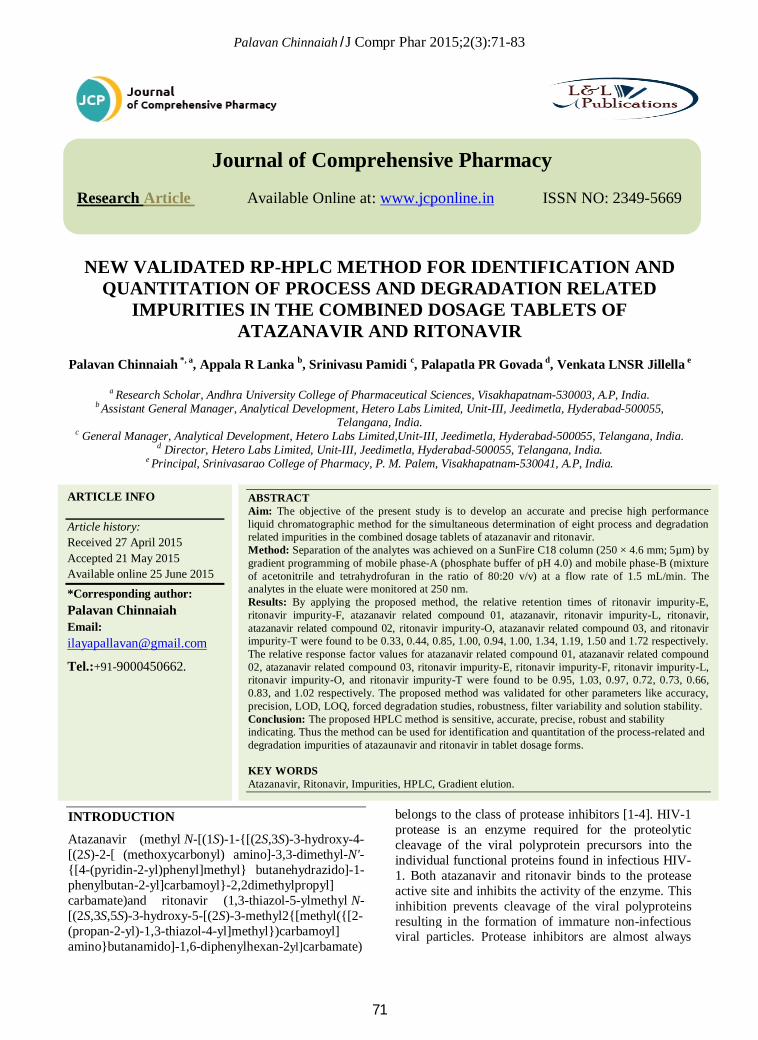
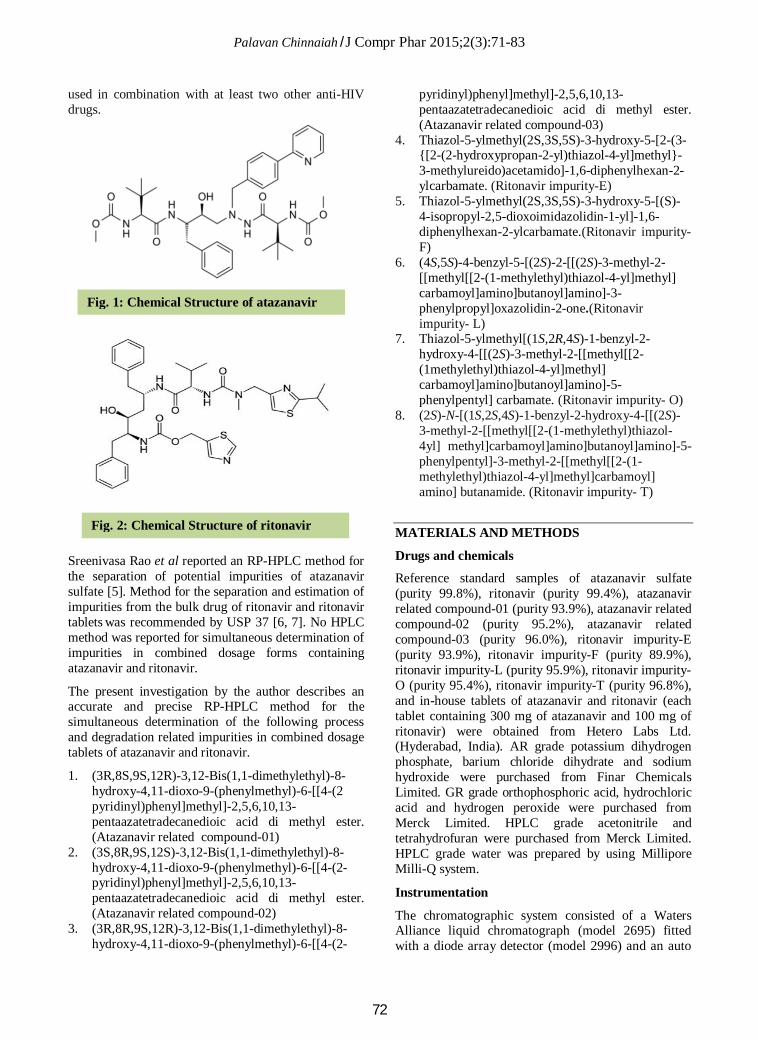
Atazanavir (methyl N-[(1S)-1-{[(2S,3S)-3-hydroxy-4-[(2S)-2-[ (methoxycarbonyl) amino]-3,3-dimethyl-N'-{[4-(pyridin-2-yl)phenyl]methyl} butanehydrazido]-1-phenylbutan-2-yl]carbamoyl}-2,2dimethylpropyl] carbamate)and ritonavir (1,3-thiazol-5-ylmethyl N-[(2S,3S,5S)-3-hydroxy-5-[(2S)-3-methyl2{[methyl({[2-(propan-2-yl)-1,3-thiazol-4-yl]methyl})carbamoyl] amino}butanamido]-1,6-diphenylhexan-2yl]carbamate)
belongs to the class of protease inhibitors [1-4]. HIV-1 protease is an enzyme required for the proteolytic cleavage of the viral polyprotein precursors into the individual functional proteins found in infectious HIV-1. Both atazanavir and ritonavir binds to the protease active site and inhibits the activity of the enzyme. This inhibition prevents cleavage of the viral polyproteins resulting in the formation of immature non-infectious viral particles. Protease inhibitors are almost always
Journal of Comprehensive Pharmacy
Research Article Available Online at: www.jcponline.in ISSN NO: 2349-5669
ARTICLE INFO Article history: Received 27 April 2015 Accepted 21 May 2015 Available online 25 June 2015 *Corresponding author: Palavan Chinnaiah
Email: [email protected]
Tel.:+91-9000450662.
ABSTRACT Aim: The objective of the present study is to develop an accurate and precise high performance liquid chromatographic method for the simultaneous determination of eight process and degradation related impurities in the combined dosage tablets of atazanavir and ritonavir. Method: Separation of the analytes was achieved on a SunFire C18 column (250 × 4.6 mm; 5µm) by gradient programming of mobile phase-A (phosphate buffer of pH 4.0) and mobile phase-B (mixture of acetonitrile and tetrahydrofuran in the ratio of 80:20 v/v) at a flow rate of 1.5 mL/min. The analytes in the eluate were monitored at 250 nm. Results: By applying the proposed method, the relative retention times of ritonavir impurity-E, ritonavir impurity-F, atazanavir related compound 01, atazanavir, ritonavir impurity-L, ritonavir, atazanavir related compound 02, ritonavir impurity-O, atazanavir related compound 03, and ritonavir impurity-T were found to be 0.33, 0.44, 0.85, 1.00, 0.94, 1.00, 1.34, 1.19, 1.50 and 1.72 respectively. The relative response factor values for atazanavir related compound 01, atazanavir related compound 02, atazanavir related compound 03, ritonavir impurity-E, ritonavir impurity-F, ritonavir impurity-L, ritonavir impurity-O, and ritonavir impurity-T were found to be 0.95, 1.03, 0.97, 0.72, 0.73, 0.66, 0.83, and 1.02 respectively. The proposed method was validated for other parameters like accuracy, precision, LOD, LOQ, forced degradation studies, robustness, filter variability and solution stability. Conclusion: The proposed HPLC method is sensitive, accurate, precise, robust and stability indicating. Thus the method can be used for identification and quantitation of the process-related and degradation impurities of atazaunavir and ritonavir in tablet dosage forms. KEY WORDS Atazanavir, Ritonavir, Impurities, HPLC, Gradient elution.
Palavan Chinnaiah /J Compr Phar 2015;2(3):71-83
72
used in combination with at least two other anti-HIV drugs.
Sreenivasa Rao et al reported an RP-HPLC method for the separation of potential impurities of atazanavir sulfate [5]. Method for the separation and estimation of impurities from the bulk drug of ritonavir and ritonavir tablets was recommended by USP 37 [6, 7]. No HPLC method was reported for simultaneous determination of impurities in combined dosage forms containing atazanavir and ritonavir.
The present investigation by the author describes an accurate and precise RP-HPLC method for the simultaneous determination of the following process and degradation related impurities in combined dosage tablets of atazanavir and ritonavir.
1. (3R,8S,9S,12R)-3,12-Bis(1,1-dimethylethyl)-8-hydroxy-4,11-dioxo-9-(phenylmethyl)-6-[[4-(2 pyridinyl)phenyl]methyl]-2,5,6,10,13-pentaazatetradecanedioic acid di methyl ester. (Atazanavir related compound-01)
2. (3S,8R,9S,12S)-3,12-Bis(1,1-dimethylethyl)-8-hydroxy-4,11-dioxo-9-(phenylmethyl)-6-[[4-(2-pyridinyl)phenyl]methyl]-2,5,6,10,13-pentaazatetradecanedioic acid di methyl ester. (Atazanavir related compound-02)
3. (3R,8R,9S,12R)-3,12-Bis(1,1-dimethylethyl)-8-hydroxy-4,11-dioxo-9-(phenylmethyl)-6-[[4-(2-
pyridinyl)phenyl]methyl]-2,5,6,10,13-pentaazatetradecanedioic acid di methyl ester. (Atazanavir related compound-03)
4. Thiazol-5-ylmethyl(2S,3S,5S)-3-hydroxy-5-[2-(3-{[2-(2-hydroxypropan-2-yl)thiazol-4-yl]methyl}-3-methylureido)acetamido]-1,6-diphenylhexan-2-ylcarbamate. (Ritonavir impurity-E)
5. Thiazol-5-ylmethyl(2S,3S,5S)-3-hydroxy-5-[(S)-4-isopropyl-2,5-dioxoimidazolidin-1-yl]-1,6-diphenylhexan-2-ylcarbamate.(Ritonavir impurity-F)
6. (4S,5S)-4-benzyl-5-[(2S)-2-[[(2S)-3-methyl-2-[[methyl[[2-(1-methylethyl)thiazol-4-yl]methyl] carbamoyl]amino]butanoyl]amino]-3-phenylpropyl]oxazolidin-2-one.(Ritonavir impurity- L)
7. Thiazol-5-ylmethyl[(1S,2R,4S)-1-benzyl-2-hydroxy-4-[[(2S)-3-methyl-2-[[methyl[[2-(1methylethyl)thiazol-4-yl]methyl] carbamoyl]amino]butanoyl]amino]-5-phenylpentyl] carbamate. (Ritonavir impurity- O)
8. (2S)-N-[(1S,2S,4S)-1-benzyl-2-hydroxy-4-[[(2S)-3-methyl-2-[[methyl[[2-(1-methylethyl)thiazol-4yl] methyl]carbamoyl]amino]butanoyl]amino]-5-phenylpentyl]-3-methyl-2-[[methyl[[2-(1-methylethyl)thiazol-4-yl]methyl]carbamoyl] amino] butanamide. (Ritonavir impurity- T)
MATERIALS AND METHODS
Drugs and chemicals
Reference standard samples of atazanavir sulfate (purity 99.8%), ritonavir (purity 99.4%), atazanavir related compound-01 (purity 93.9%), atazanavir related compound-02 (purity 95.2%), atazanavir related compound-03 (purity 96.0%), ritonavir impurity-E (purity 93.9%), ritonavir impurity-F (purity 89.9%), ritonavir impurity-L (purity 95.9%), ritonavir impurity-O (purity 95.4%), ritonavir impurity-T (purity 96.8%), and in-house tablets of atazanavir and ritonavir (each tablet containing 300 mg of atazanavir and 100 mg of ritonavir) were obtained from Hetero Labs Ltd. (Hyderabad, India). AR grade potassium dihydrogen phosphate, barium chloride dihydrate and sodium hydroxide were purchased from Finar Chemicals Limited. GR grade orthophosphoric acid, hydrochloric acid and hydrogen peroxide were purchased from Merck Limited. HPLC grade acetonitrile and tetrahydrofuran were purchased from Merck Limited. HPLC grade water was prepared by using Millipore Milli-Q system.
Instrumentation
The chromatographic system consisted of a Waters Alliance liquid chromatograph (model 2695) fitted with a diode array detector (model 2996) and an auto
Fig. 1: Chemical Structure of atazanavir
Fig. 2: Chemical Structure of ritonavir
Palavan Chinnaiah /J Compr Phar 2015;2(3):71-83
73
sampler using Empower2 data handling system. A SunFire C18 column (250 × 4.6 mm; 5µm) was used for the separation of the analytes. Solubility of all the compounds was enhanced by sonication on an ultrasonicator. All the weighings in the experiments were done with Sartorius balances (model CPA225D and model ME36S). Bandelin Sonorex was used for ultrasonication. PVDF and nylon membrane filters were purchased from Merck Millipore.
Preparation of the buffer (pH 4.0; Mobile phase-A)
2.72 g of potassium dihydrogen phosphate was weighed and dissolved in a beaker containing 1000 mL of water (0.02M potassium dihydrogen phosphate solution). The pH of the solution was adjusted to 4.0 with 10% orthophosphoric acid and was filtered through a 0.45 µ membrane filter followed by sonication. This solution was used as mobile phase-A.
Preparation of mobile phase - B
A mixture of acetonitrile and tetrahydrofuran in the ratio of 80:20 v/v was used as mobile phase-B.
Preparation of the diluent
Mobile phase - A and acetonitrile were mixed in the ratio of 50:50 v/v and was used as the diluent for preparation of various drug solutions.
Preparation of mixed working standard solution of the drugs About 69 mg of atazanavir sulfate and 40 mg of ritonavir were weighed and transferred into a 100 mL volumetric flask. 60 mL of the diluent was added and sonicated to dissolve. The contents were made up to volume with the diluent and mixed. This solution was filtered through a 0.45 µm membrane filter (The first few mL the filtrate was discarded). 5.0 mL of the above solution was transferred into a 200 mL volumetric flask and diluted to volume with the diluent to make a mixed working standard solution containing 17.25 µg/mL of atazanavirsulfate (15.14 µg/mL of atazanavir) and 10 µg/mL of ritonavir.
Preparation of placebo solution
Ten typical placebo tablets were crushed and finely powdered. From this, a quantity equivalent to the weight of a tablet was a transferred into a 100 mL volumetric flask containing 60 mL of diluent. The contents were mixed well and sonicated for 30 minutes with occasional shaking (The temperature of water-bath of thesonicator was maintained at 20-25°C). The volume of the mixture was made up to the volume with the diluent and mixed. A portion of this mixture was filtered through a 0.45 µm membrane filter (The first few mLof the filtrate was discarded). This placebo solution was later used for the testing the interference of the excipients used in tablets.
Preparation of formulation sample solution
Ten tablets (Each tablet contains 300 mg of atazanavir and 100mg of ritonavir) were crushed and ground to a fine powder. The tablet powder equivalent to 100 mg of ritonavir was accurately weighed and transferred into a 100 mL volumetric flask. About 60 mL of diluent was added into it and sonicated for 30 minutes with occasional shaking. The contents were made up to volume with the diluent, mixed well and filtered through a 0.45 µm membrane filter (The first few mLof the filtrate was discarded). This solution was used as the formulation sample solution (3000 µg/mL of atazanavir and 1000 µg/mL of ritonavir).
Preparation of individual standard solutions of related compounds and impurities
About 3 mg of each of atazanavir related compound 01, atazanavir related compound 02, atazanavir related compound 03, ritonavir impurity-E and ritonavir impurity-L and 2 mg of each of ritonavir impurity-O and ritonavir impurity-T were weighed separately and transferred into four separate 10 mL volumetric flasks. About 13 mg of ritonavir impurity-F was weighed and transferred into a 20 mL volumetric flask. 5.0 mL of the diluent was added into each of the above volumetric flasks and sonicated for 10 min. The volumes were made up with the diluent and mixed well. These solutions were used as stock solutions of impurities.
Using the above stock solutions, dilutions containing 6 µg/mL each of atazanavir related compound 01, atazanavir related compound 02 and atazanavir related compound 03, 30 µg/mL of ritonavir impurity-F, 3 µg/mL each of ritonavir impurity-E and ritonavir impurity-L and 2 µg/mL each of ritonavir impurity-O and ritonavir impurity-T were prepared. These solutions were used as individual working standard solutions of related compounds and impurities (100% concentration level).
Preparation of the resolution solution
100 mg of ritonavir was accurately weighed and transferred in to a 100 mL volumetric flask. About 60 mL of diluent was added into it and sonicated for 30 minutes with occasional shaking. 1.0 mL of stock solution of ritonavir impurity-L was transferred in to the flask and the contents were made up to volume with the diluent, mixed well and filtered through a 0.45 µm membrane filter (The first few mL of the filtrate was discarded). This solution was used as the resolution solution.
Optimization of the chromatographic conditions
Mobile phase-A and mobile phase-B were pumped through the column in gradient proportions at a flow
Palavan Chinnaiah /J Compr Phar 2015;2(3):71-83
74
rate of 1.5 mL/min. The gradient time program was set as T/%B: 0/40, 40/40, 60/70, 65/70, 67/40, and 75/40. The injection volume was 20µL and the column was kept at 40°C. The detector wavelength was set at 250 nm. Prior to injection of the drug solution, the column was equilibrated with the initial composition of the mobile phase for 30 minutes.
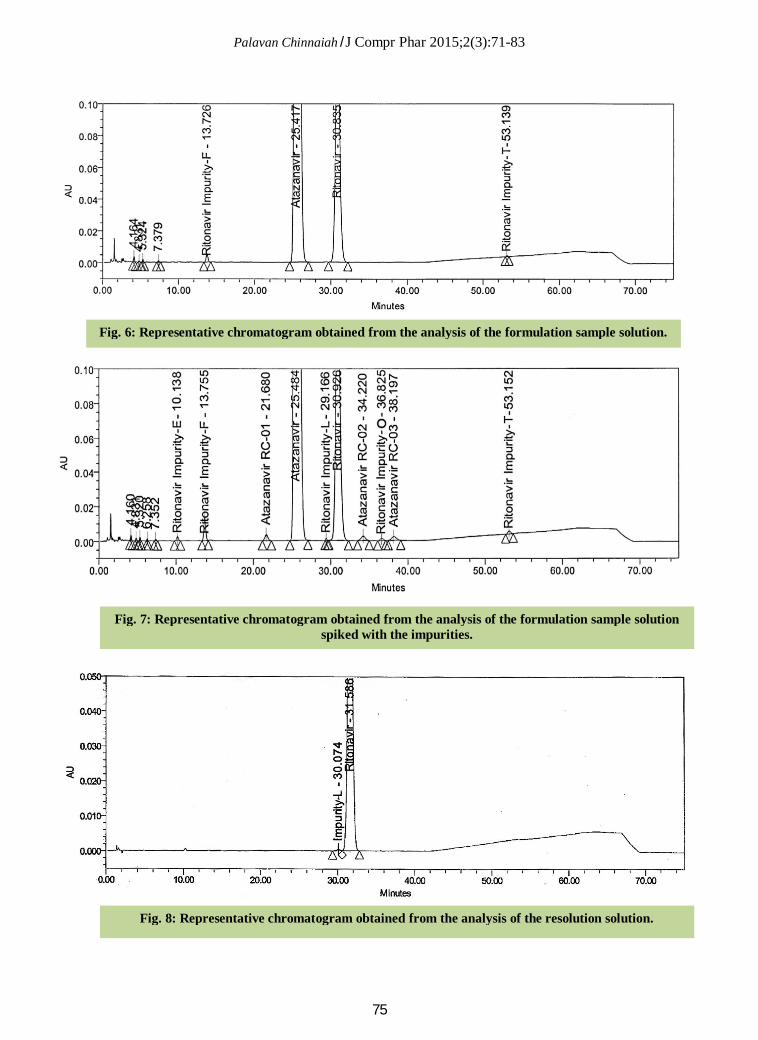
Typical chromatograms obtained from the analysis of the blank solution, mixed working standard solution, placebo sample solution, formulation sample solution, formulation sample solution spiked with impurities, and resolution solution are shown in the Fig. 3, 4, 5, 6, 7, and 8, respectively.
RESULTS AND DISCUSSION
The described method has been extensively validated was according to ICH guideline Q2 (R1) for specificity, linearity, accuracy, precision, LOD, LOQ, and robustness [8]. Solution stability studies and forced degradation studies were also performed.
Specificity
Individual reference solutions of atazanavir sulfate, ritonavir and impurities at standard working concentration level, mixed standard solution, formulation sample solution and formulation sample solution spiked with known impurities at standard
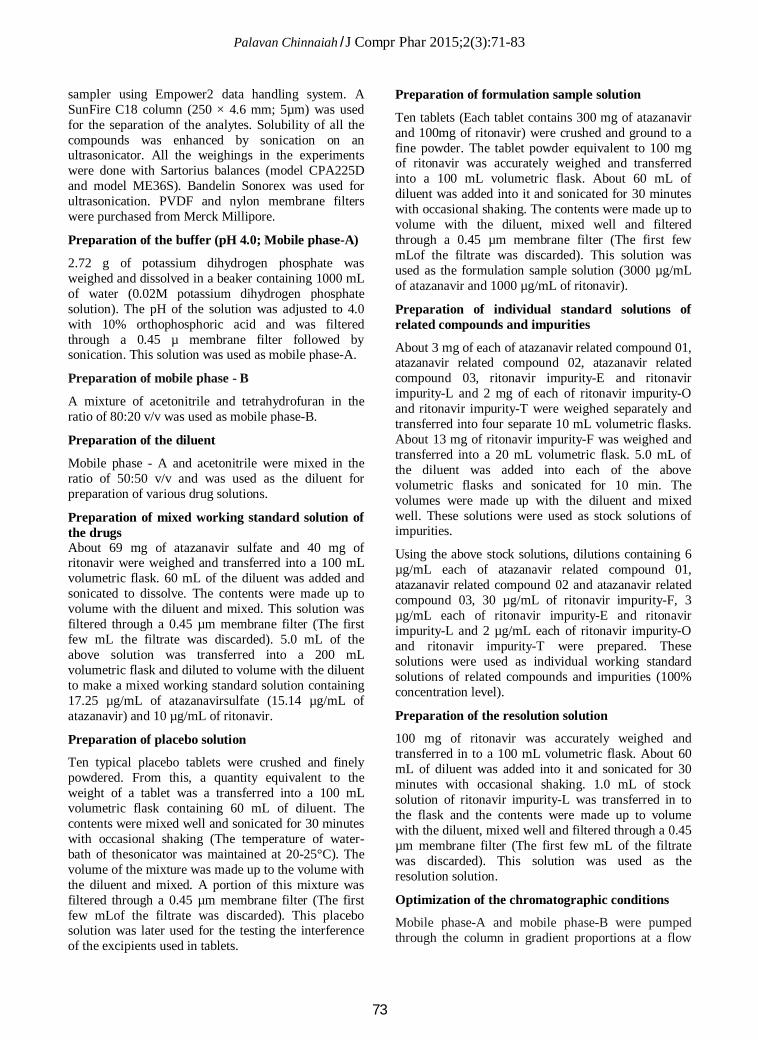
Fig. 3: Representative chromatogram of the blank solution.
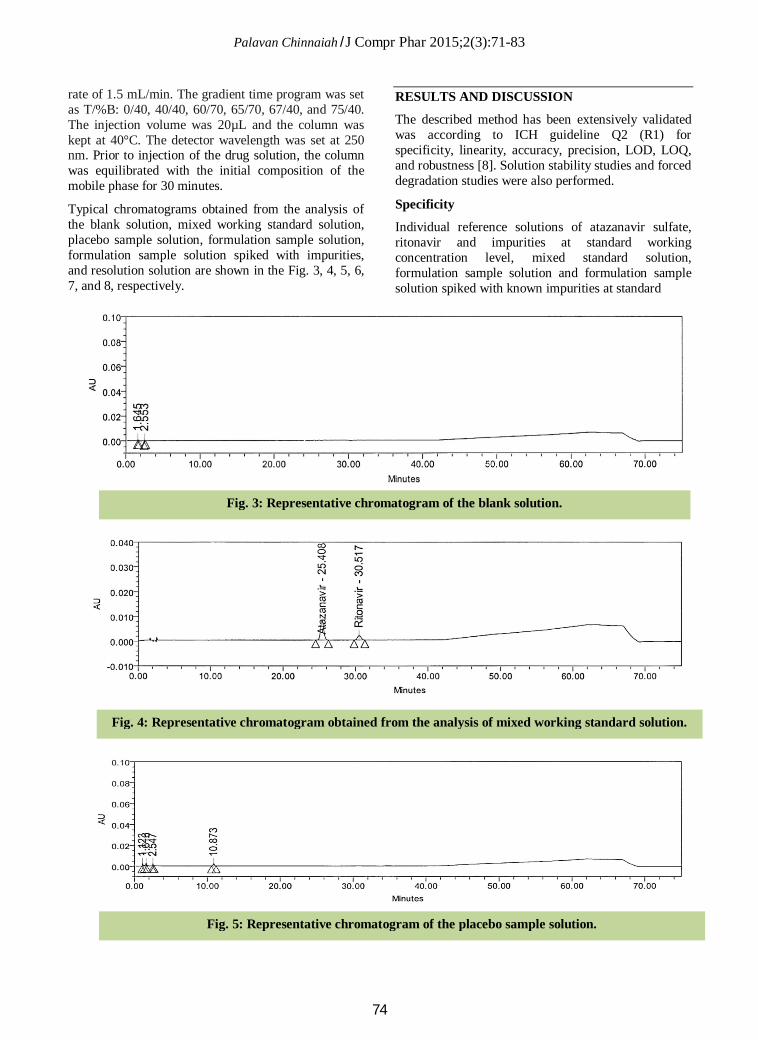
Fig. 4: Representative chromatogram obtained from the analysis of mixed working standard solution.
Fig. 5: Representative chromatogram of the placebo sample solution.
Palavan Chinnaiah /J Compr Phar 2015;2(3):71-83
75
Fig. 6: Representative chromatogram obtained from the analysis of the formulation sample solution.
Fig. 7: Representative chromatogram obtained from the analysis of the formulation sample solution spiked with the impurities.
Fig. 8: Representative chromatogram obtained from the analysis of the resolution solution.
Palavan Chinnaiah /J Compr Phar 2015;2(3):71-83
76
working concentration levels were analyzed in six replicates by HPLC. The retention times obtained for the drugs and impurities for the mixed working standard solution, formulation sample solution and formulation sample solution spiked with known impurities were compared with those of the respective reference compounds.
The blank (diluent) and placebo solutions were injected into the chromatographic system. No interfering peaks were observed at the retention times of the analytes and the known impurities due to the presence of excipients.
System suitability
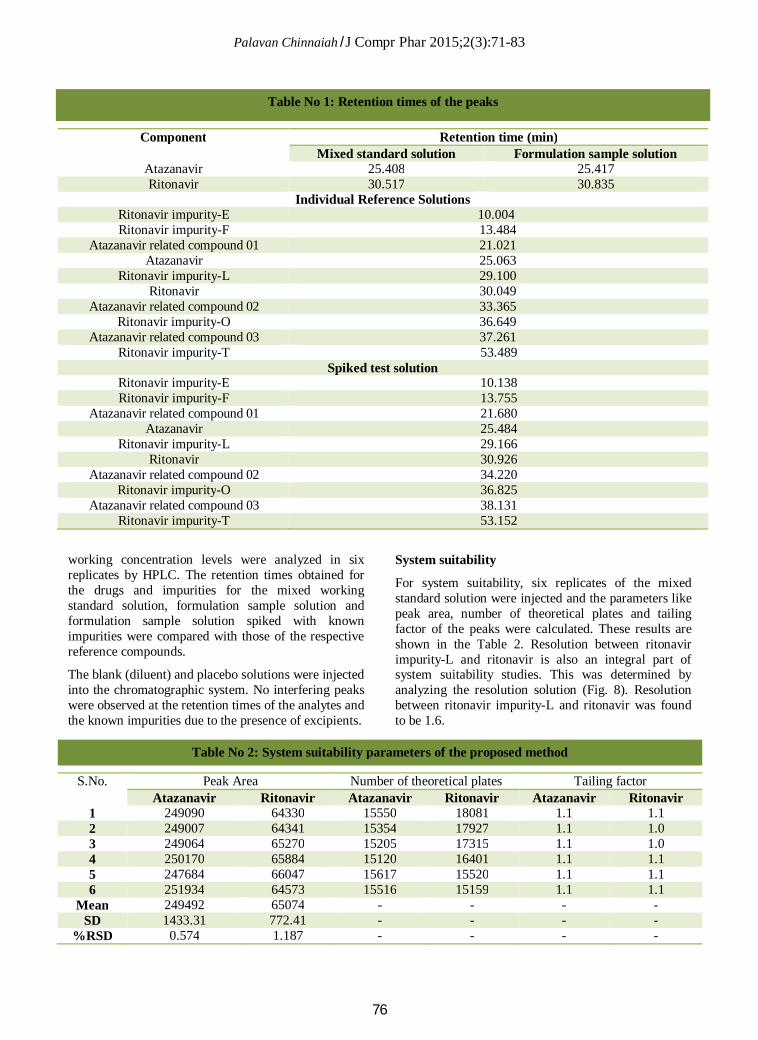
For system suitability, six replicates of the mixed standard solution were injected and the parameters like peak area, number of theoretical plates and tailing factor of the peaks were calculated. These results are shown in the Table 2. Resolution between ritonavir impurity-L and ritonavir is also an integral part of system suitability studies. This was determined by analyzing the resolution solution (Fig. 8). Resolution between ritonavir impurity-L and ritonavir was found to be 1.6.
Component Retention time (min) Mixed standard solution Formulation sample solution
Atazanavir 25.408 25.417 Ritonavir 30.517 30.835
Individual Reference Solutions Ritonavir impurity-E 10.004 Ritonavir impurity-F 13.484
Atazanavir related compound 01 21.021 Atazanavir 25.063
Ritonavir impurity-L 29.100 Ritonavir 30.049
Atazanavir related compound 02 33.365 Ritonavir impurity-O 36.649
Atazanavir related compound 03 37.261 Ritonavir impurity-T 53.489
Spiked test solution Ritonavir impurity-E 10.138 Ritonavir impurity-F 13.755
Atazanavir related compound 01 21.680 Atazanavir 25.484
Ritonavir impurity-L 29.166 Ritonavir 30.926
Atazanavir related compound 02 34.220 Ritonavir impurity-O 36.825
Atazanavir related compound 03 38.131 Ritonavir impurity-T 53.152
Table No 1: Retention times of the peaks
S.No. Peak Area Number of theoretical plates Tailing factor Atazanavir Ritonavir Atazanavir Ritonavir Atazanavir Ritonavir
1 249090 64330 15550 18081 1.1 1.1 2 249007 64341 15354 17927 1.1 1.0 3 249064 65270 15205 17315 1.1 1.0 4 250170 65884 15120 16401 1.1 1.1 5 247684 66047 15617 15520 1.1 1.1 6 251934 64573 15516 15159 1.1 1.1
Mean 249492 65074 - - - - SD 1433.31 772.41 - - - -
%RSD 0.574 1.187 - - - -
Table No 2: System suitability parameters of the proposed method
Palavan Chinnaiah /J Compr Phar 2015;2(3):71-83
77
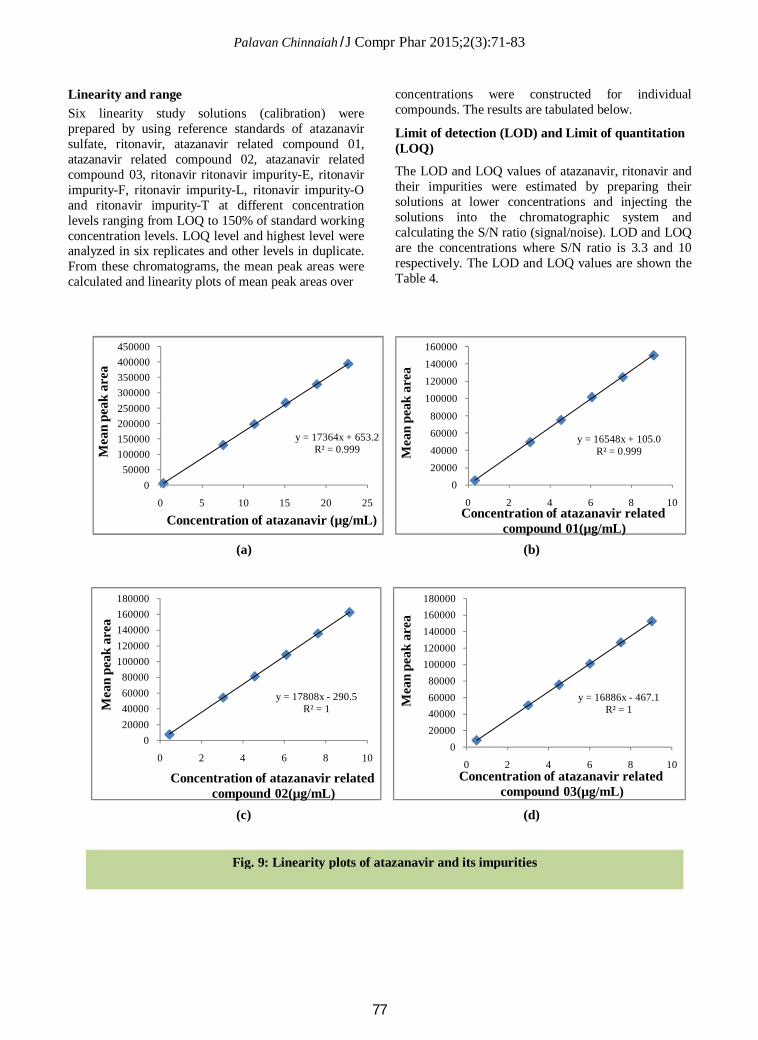
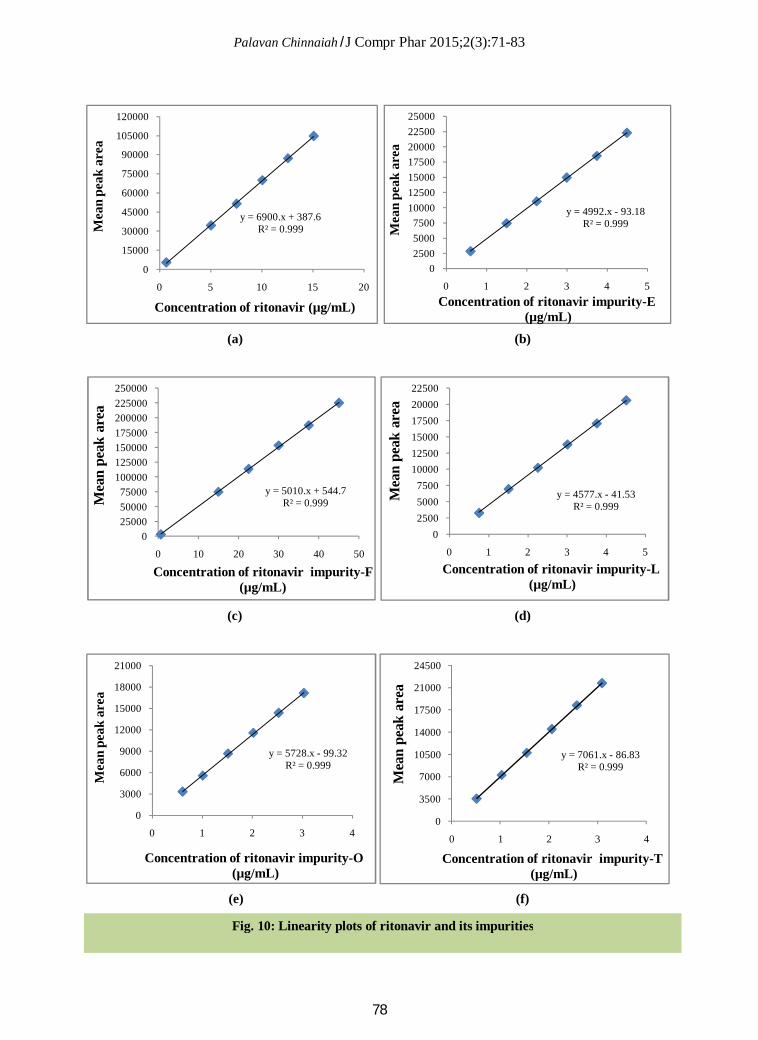
Linearity and range Six linearity study solutions (calibration) were prepared by using reference standards of atazanavir sulfate, ritonavir, atazanavir related compound 01, atazanavir related compound 02, atazanavir related compound 03, ritonavir ritonavir impurity-E, ritonavir impurity-F, ritonavir impurity-L, ritonavir impurity-O and ritonavir impurity-T at different concentration levels ranging from LOQ to 150% of standard working concentration levels. LOQ level and highest level were analyzed in six replicates and other levels in duplicate. From these chromatograms, the mean peak areas were calculated and linearity plots of mean peak areas over
concentrations were constructed for individual compounds. The results are tabulated below.
Limit of detection (LOD) and Limit of quantitation (LOQ)
The LOD and LOQ values of atazanavir, ritonavir and their impurities were estimated by preparing their solutions at lower concentrations and injecting the solutions into the chromatographic system and calculating the S/N ratio (signal/noise). LOD and LOQ are the concentrations where S/N ratio is 3.3 and 10 respectively. The LOD and LOQ values are shown the Table 4.
(a) (b)
(c) (d)
y = 17364x + 653.2R² = 0.999
050000
100000150000200000250000300000350000400000450000
0 5 10 15 20 25
Concentration of atazanavir (µg/mL)
Mea
n pe
ak a
rea
y = 16548x + 105.0R² = 0.999
020000400006000080000
100000120000140000160000
0 2 4 6 8 10Concentration of atazanavir related
compound 01(µg/mL)
Mea
n pe
ak a
rea
y = 17808x - 290.5R² = 1
020000400006000080000
100000120000140000160000180000
0 2 4 6 8 10
Concentration of atazanavir related compound 02(µg/mL)
Mea
n pe
ak a
rea
y = 16886x - 467.1R² = 1
020000400006000080000
100000120000140000160000180000
0 2 4 6 8 10Concentration of atazanavir related
compound 03(µg/mL)
Mea
n pe
ak a
rea
Fig. 9: Linearity plots of atazanavir and its impurities
Palavan Chinnaiah /J Compr Phar 2015;2(3):71-83
78
(a) (b)
(c) (d)
(e) (f)
y = 6900.x + 387.6R² = 0.999
0
15000
30000
45000
60000
75000
90000
105000
120000
0 5 10 15 20
Concentration of ritonavir (µg/mL)
Mea
n pe
ak a
rea
y = 4992.x - 93.18R² = 0.999
0250050007500
10000125001500017500200002250025000
0 1 2 3 4 5Concentration of ritonavir impurity-E
(µg/mL)
Mea
n pe
ak a
rea
y = 5010.x + 544.7 R² = 0.999
0250005000075000
100000125000150000175000200000225000250000
0 10 20 30 40 50
Concentration of ritonavir impurity-F(µg/mL)
Mea
n pe
ak a
rea
y = 4577.x - 41.53R² = 0.999
0250050007500
100001250015000175002000022500
0 1 2 3 4 5
Concentration of ritonavir impurity-L (µg/mL)
Mea
n pe
ak a
rea
y = 5728.x - 99.32R² = 0.999
0
3000
6000
9000
12000
15000
18000
21000
0 1 2 3 4
Concentration of ritonavir impurity-O (µg/mL)
Mea
n pe
ak a
rea
y = 7061.x - 86.83R² = 0.999
0
3500
7000
10500
14000
17500
21000
24500
0 1 2 3 4
Concentration of ritonavir impurity-T (µg/mL)
Mea
n pe
ak a
rea
Fig. 10: Linearity plots of ritonavir and its impurities
Palavan Chinnaiah /J Compr Phar 2015;2(3):71-83
79
Accuracy
Accuracy was performed by spiking the impurities to the placebo solution at 50%, 100% and 150% of working concentration level in triplicate at each level. These solutions were injected into the chromatographic system and the percent recovery was calculated. Accuracy at LOQ was also performed similarly by spiking the known impurities to the placebo in triplicate and analyzing these solutions. The percent recoveries of impurities at all the levels were between the limits of 85.0 and 115.0. Hence the method is very accurate.
Precision
System precision was studied by preparing working standard solution and analyzing them in six replicates. Peak areas of atazanavir and ritonavir were measured and their percent relative standard deviations were found to be 0.57 and 1.19 respectively. Repeatability and intermediate precision was studied by preparing formulation sample solution and formulation sample solution spiked with known impurities at specification level and analyzed in six replicates. A very small % RSD value of recoveries describes that the method is
very precise. The results of repeatability and intermediate precision studies are shown in the Table 6 and Table 7.
Forced degradation studies
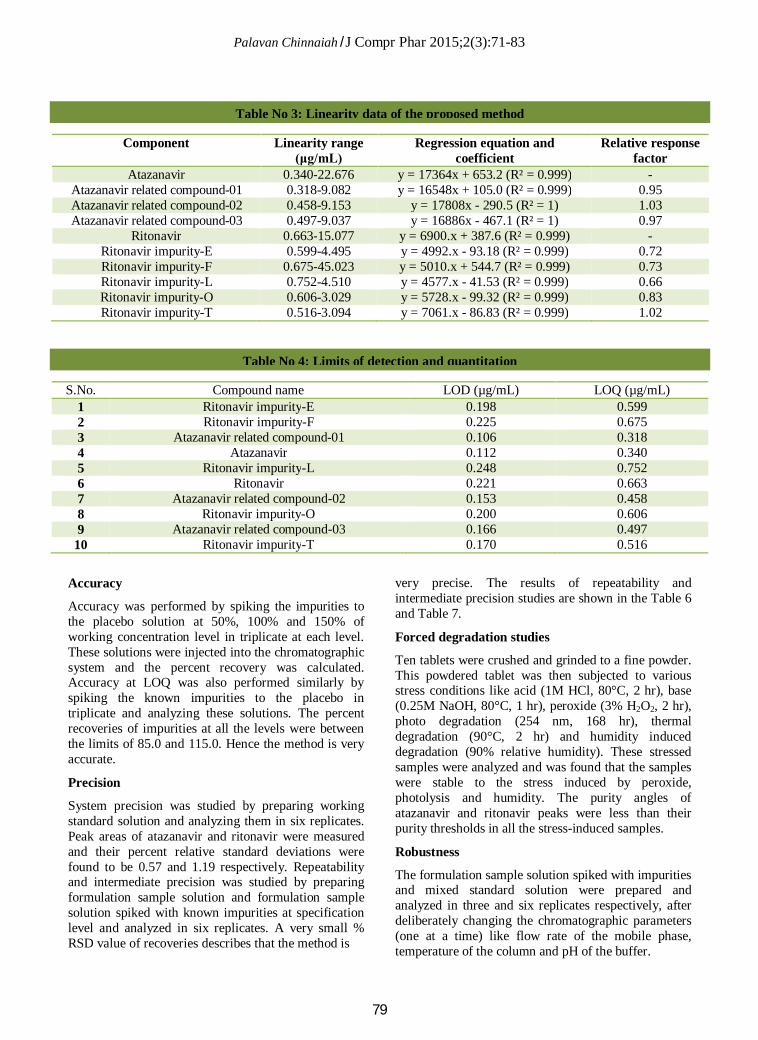
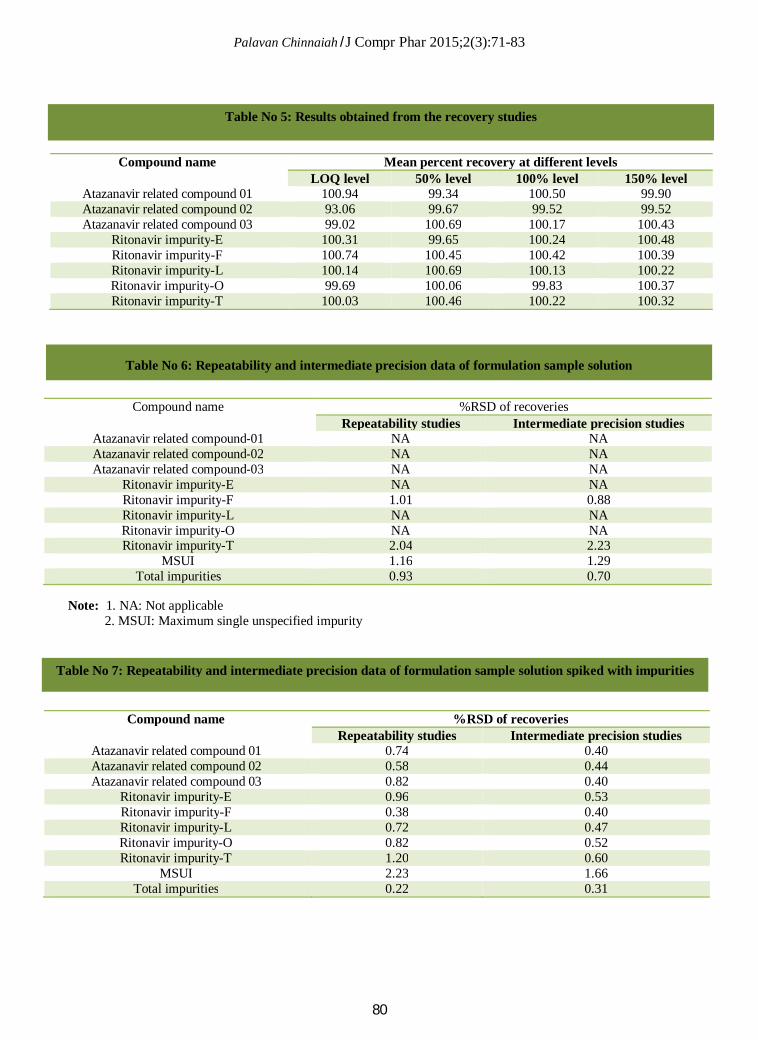
Ten tablets were crushed and grinded to a fine powder. This powdered tablet was then subjected to various stress conditions like acid (1M HCl, 80°C, 2 hr), base (0.25M NaOH, 80°C, 1 hr), peroxide (3% H2O2, 2 hr), photo degradation (254 nm, 168 hr), thermal degradation (90°C, 2 hr) and humidity induced degradation (90% relative humidity). These stressed samples were analyzed and was found that the samples were stable to the stress induced by peroxide, photolysis and humidity. The purity angles of atazanavir and ritonavir peaks were less than their purity thresholds in all the stress-induced samples.
Robustness
The formulation sample solution spiked with impurities and mixed standard solution were prepared and analyzed in three and six replicates respectively, after deliberately changing the chromatographic parameters (one at a time) like flow rate of the mobile phase, temperature of the column and pH of the buffer.
Component Linearity range (μg/mL)
Regression equation and coefficient
Relative response factor
Atazanavir 0.340-22.676 y = 17364x + 653.2 (R² = 0.999) - Atazanavir related compound-01 0.318-9.082 y = 16548x + 105.0 (R² = 0.999) 0.95 Atazanavir related compound-02 0.458-9.153 y = 17808x - 290.5 (R² = 1) 1.03 Atazanavir related compound-03 0.497-9.037 y = 16886x - 467.1 (R² = 1) 0.97
Ritonavir 0.663-15.077 y = 6900.x + 387.6 (R² = 0.999) - Ritonavir impurity-E 0.599-4.495 y = 4992.x - 93.18 (R² = 0.999) 0.72 Ritonavir impurity-F 0.675-45.023 y = 5010.x + 544.7 (R² = 0.999) 0.73 Ritonavir impurity-L 0.752-4.510 y = 4577.x - 41.53 (R² = 0.999) 0.66 Ritonavir impurity-O 0.606-3.029 y = 5728.x - 99.32 (R² = 0.999) 0.83 Ritonavir impurity-T 0.516-3.094 y = 7061.x - 86.83 (R² = 0.999) 1.02
S.No. Compound name LOD (µg/mL) LOQ (µg/mL) 1 Ritonavir impurity-E 0.198 0.599 2 Ritonavir impurity-F 0.225 0.675 3 Atazanavir related compound-01 0.106 0.318 4 Atazanavir 0.112 0.340 5 Ritonavir impurity-L 0.248 0.752 6 Ritonavir 0.221 0.663 7 Atazanavir related compound-02 0.153 0.458 8 Ritonavir impurity-O 0.200 0.606 9 Atazanavir related compound-03 0.166 0.497
10 Ritonavir impurity-T 0.170 0.516
Table No 3: Linearity data of the proposed method
Table No 4: Limits of detection and quantitation
Palavan Chinnaiah /J Compr Phar 2015;2(3):71-83
80
Note: 1. NA: Not applicable 2. MSUI: Maximum single unspecified impurity
Compound name Mean percent recovery at different levels LOQ level 50% level 100% level 150% level
Atazanavir related compound 01 100.94 99.34 100.50 99.90 Atazanavir related compound 02 93.06 99.67 99.52 99.52 Atazanavir related compound 03 99.02 100.69 100.17 100.43
Ritonavir impurity-E 100.31 99.65 100.24 100.48 Ritonavir impurity-F 100.74 100.45 100.42 100.39 Ritonavir impurity-L 100.14 100.69 100.13 100.22 Ritonavir impurity-O 99.69 100.06 99.83 100.37 Ritonavir impurity-T 100.03 100.46 100.22 100.32
Table No 5: Results obtained from the recovery studies
Compound name %RSD of recoveries Repeatability studies Intermediate precision studies
Atazanavir related compound-01 NA NA Atazanavir related compound-02 NA NA Atazanavir related compound-03 NA NA
Ritonavir impurity-E NA NA Ritonavir impurity-F 1.01 0.88 Ritonavir impurity-L NA NA Ritonavir impurity-O NA NA Ritonavir impurity-T 2.04 2.23
MSUI 1.16 1.29 Total impurities 0.93 0.70
Table No 6: Repeatability and intermediate precision data of formulation sample solution
Compound name %RSD of recoveries Repeatability studies Intermediate precision studies
Atazanavir related compound 01 0.74 0.40 Atazanavir related compound 02 0.58 0.44 Atazanavir related compound 03 0.82 0.40
Ritonavir impurity-E 0.96 0.53 Ritonavir impurity-F 0.38 0.40 Ritonavir impurity-L 0.72 0.47 Ritonavir impurity-O 0.82 0.52 Ritonavir impurity-T 1.20 0.60
MSUI 2.23 1.66 Total impurities 0.22 0.31
Table No 7: Repeatability and intermediate precision data of formulation sample solution spiked with impurities
Palavan Chinnaiah /J Compr Phar 2015;2(3):71-83
81
Fig. 11: Representative chromatogram of the formulation sample subjected to acid hydrolysis.
Fig. 12: Representative chromatogram of the formulation sample subjected to base hydrolysis.
Fig. 13: Representative chromatogram of the formulation sample subjected to oxidation.
Fig. 14: Representative chromatogram of the formulation sample subjected to thermal.
Palavan Chinnaiah /J Compr Phar 2015;2(3):71-83
82
Fig. 15: Representative chromatogram of the formulation sample subjected to photo degradation.
Fig. 16: Representative chromatogram of the formulation sample subjected to humidity degradation.
Variation in chromatographic
condition
Peak area %RSD Minimum theoretical plates
Maximum tailing factor
Atazanavir Ritonavir Atazanavir Ritonavir Atazanavir Ritonavir Unchanged condition 0.57 1.19 15120 15159 1.10 1.10 Flow rate
(1.5 mL/min) 1.35
mL/min 0.32 1.38 16045 15953 1.08 1.09
1.65 mL/min
0.92 1.79 14442 15013 1.06 1.06
Column oven temperature
(40°C)
35°C 0.87 2.17 14501 14209 1.08 1.12 45°C 0.37 0.43 16289 16629 1.04 1.03
Change in pH of buffer
(4.0)
3.8 0.63 1.37 15672 15278 1.05 1.05 4.2 0.56 0.90 15848 15764 1.05 1.06
Table No 8: Summary of results obtained after analyzing mixed standard solution (n=6)
Palavan Chinnaiah /J Compr Phar 2015;2(3):71-83
83
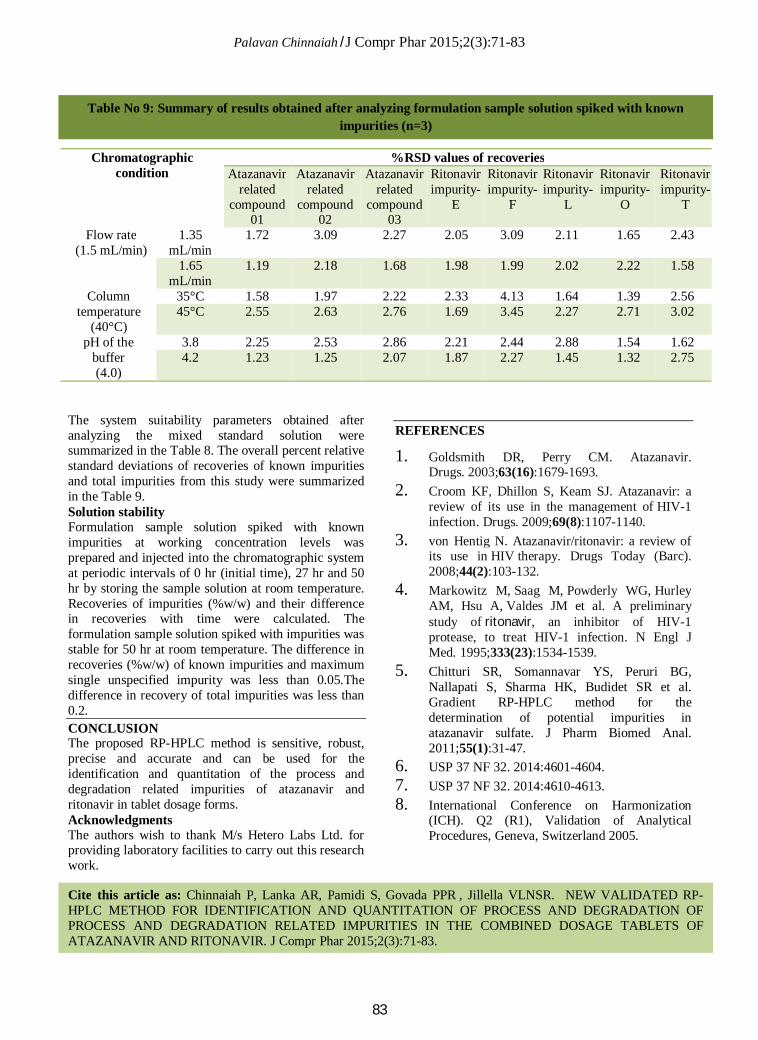
The system suitability parameters obtained after analyzing the mixed standard solution were summarized in the Table 8. The overall percent relative standard deviations of recoveries of known impurities and total impurities from this study were summarized in the Table 9. Solution stability Formulation sample solution spiked with known impurities at working concentration levels was prepared and injected into the chromatographic system at periodic intervals of 0 hr (initial time), 27 hr and 50 hr by storing the sample solution at room temperature. Recoveries of impurities (%w/w) and their difference in recoveries with time were calculated. The formulation sample solution spiked with impurities was stable for 50 hr at room temperature. The difference in recoveries (%w/w) of known impurities and maximum single unspecified impurity was less than 0.05.The difference in recovery of total impurities was less than 0.2. CONCLUSION The proposed RP-HPLC method is sensitive, robust, precise and accurate and can be used for the identification and quantitation of the process and degradation related impurities of atazanavir and ritonavir in tablet dosage forms. Acknowledgments The authors wish to thank M/s Hetero Labs Ltd. for providing laboratory facilities to carry out this research work.
REFERENCES
1. Goldsmith DR, Perry CM. Atazanavir. Drugs. 2003;63(16):1679-1693.
2. Croom KF, Dhillon S, Keam SJ. Atazanavir: a review of its use in the management of HIV-1 infection. Drugs. 2009;69(8):1107-1140.
3. von Hentig N. Atazanavir/ritonavir: a review of its use in HIV therapy. Drugs Today (Barc). 2008;44(2):103-132.
4. Markowitz M, Saag M, Powderly WG, Hurley AM, Hsu A, Valdes JM et al. A preliminary study of ritonavir, an inhibitor of HIV-1 protease, to treat HIV-1 infection. N Engl J Med. 1995;333(23):1534-1539.
5. Chitturi SR, Somannavar YS, Peruri BG, Nallapati S, Sharma HK, Budidet SR et al. Gradient RP-HPLC method for the determination of potential impurities in atazanavir sulfate. J Pharm Biomed Anal. 2011;55(1):31-47.
6. USP 37 NF 32. 2014:4601-4604. 7. USP 37 NF 32. 2014:4610-4613. 8. International Conference on Harmonization
(ICH). Q2 (R1), Validation of Analytical Procedures, Geneva, Switzerland 2005.
Chromatographic condition
%RSD values of recoveries Atazanavir
related compound
01
Atazanavir related
compound 02
Atazanavir related
compound 03
Ritonavir impurity-
E
Ritonavir impurity-
F
Ritonavir impurity-
L
Ritonavir impurity-
O
Ritonavir impurity-
T
Flow rate (1.5 mL/min)
1.35 mL/min
1.72 3.09 2.27 2.05 3.09 2.11 1.65 2.43
1.65 mL/min
1.19 2.18 1.68 1.98 1.99 2.02 2.22 1.58
Column temperature
(40°C)
35°C 1.58 1.97 2.22 2.33 4.13 1.64 1.39 2.56 45°C 2.55 2.63 2.76 1.69 3.45 2.27 2.71 3.02
pH of the buffer (4.0)
3.8 2.25 2.53 2.86 2.21 2.44 2.88 1.54 1.62 4.2 1.23 1.25 2.07 1.87 2.27 1.45 1.32 2.75
Table No 9: Summary of results obtained after analyzing formulation sample solution spiked with known impurities (n=3)
Cite this article as: Chinnaiah P, Lanka AR, Pamidi S, Govada PPR , Jillella VLNSR. NEW VALIDATED RP-HPLC METHOD FOR IDENTIFICATION AND QUANTITATION OF PROCESS AND DEGRADATION OF PROCESS AND DEGRADATION RELATED IMPURITIES IN THE COMBINED DOSAGE TABLETS OF ATAZANAVIR AND RITONAVIR. J Compr Phar 2015;2(3):71-83.


![National Institute Of Science & Technology Mobile IP Jiten Mishra (EC200117327) [1] MOBILE IP Under the guidance of Mr. N. Srinivasu By Jiten Mishra EC200117327](https://img.pdfslide.us/doc/110x75/56649e745503460f94b75690/national-institute-of-science-technology-mobile-ip-jiten-mishra-ec200117327.jpg)