Embed Size (px)
Citation preview

ELSEVIER Journal of Accounting and Economics 21 (1996) 107-138
JOURNAL OF Accounting &Economids
The capitalization, amortization, and value-relevance of R&D
Baruch Lev*'", Theodore Sougiannis b
"Haas School of Business and Boalt School of Law, University of California, Berkeley, CA 94720, USA bDepartment of Accountancy, University of Illinois, Champaiffn, IL 61820, USA
(Received March 1993; final version received April 1995)
Abstract
G A A P mandates the full expensing of R & D in financial statements, presumably because of concerns with the reliability, objectivity, and value-relevance of R & D capital- ization. To address these concerns, we estimate the R & D capital of a large sample of public companies and find these estimates to be statistically reliable and economically meaningful. We then adjust the reported earnings and book values of sample firms for the R & D capitalization and find that such adjustments are value-relevant to investors. Finally, we document a significant intertemporal association between firms' R & D capital and subsequent stock returns, suggesting either a systematic mispricing of the shares of R&D-intensive companies, or a compensation for an extra-market risk factor associated with R&D.
Key words. R&D; Capitalization; Intangibles; Market valuation; Mispricing
J E L classification: M4; 03 ; G14
_ _ L
*Corresponding author.
The comments and suggestions of Bronwyn Hall, Brett Trueman, and Jerold Zimrnerman were particularly helpful. We also acknowledge the assistance of Celal Aksu, Yakov Amihud, Eli Amir, William Beaver, Robert Elliott, George Foster, Zvi Griliches, Trevor Harris, Jagan Krishnan, Joseph Lakonishok, Richard Meese, Jay Ritter, Andrew Rose, Toshi Shibano, Jacob Thomas, and Ross Watts. We thank David Aboody, Moonchul Kim, and Elisabeth Oltheten for their computa- tional assistance. The financial support of the University of Illinois' Research Board is much appreciated.
0165-4101/96/$15.00 c~2~, 1996 Elsevier Science B.V. All rights reserved SSDI 0 1 6 5 - 4 1 0 1 ( 9 5 ) 0 0 4 1 0 - K
108 B. Lev, T. Sougiannis / Journal o f A~counting and Economics 21 (1996) 107 138
1. Introduction
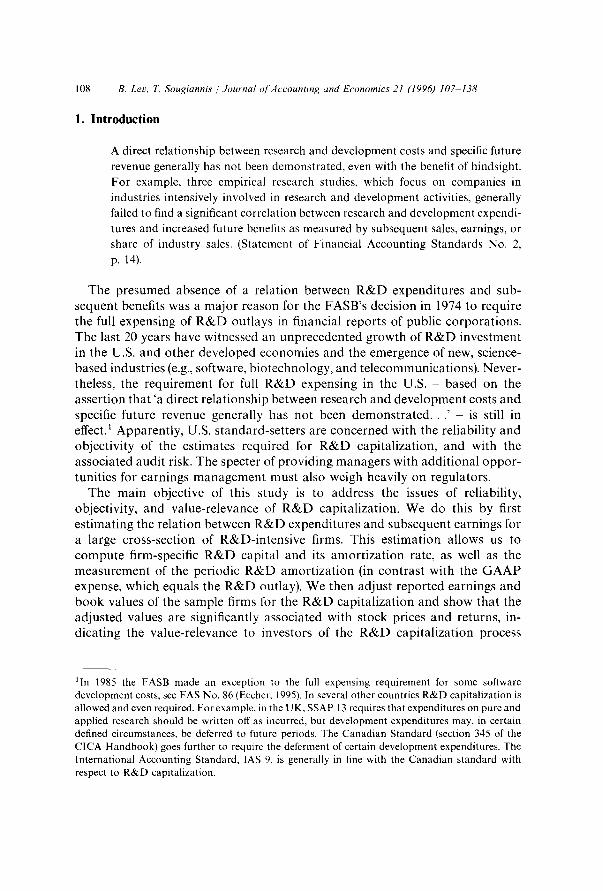
A direct relationship between research and development costs and specific future revenue generally has not been demonstrated, even with the benefit of hindsight. For example, three empirical research studies, which focus on companies in industries intensively involved in research and development activities, generally failed to find a significant correlation between research and development expendi- tures and increased future benefits as measured by subsequent sales, earnings, or share of industry sales. (Statement of Financial Accounting Standards No. 2, p. 14).
The presumed absence of a re la t ion between R & D expendi tures and sub- sequent benefits was a m a j o r reason for the FASB' s decis ion in 1974 to require the full expensing of R & D out lays in f inancial repor ts of publ ic corpora t ions . The last 20 years have witnessed an unpreceden ted growth of R & D inves tment in the U.S. and o ther deve loped economies and the emergence of new, science- based indust r ies (e.g., software, b io technology , and te lecommunicat ions) . Never- theless, the requ i rement for full R & D expensing in the U.S. - based on the asser t ion tha t 'a direct re la t ionship between research and deve lopmen t costs and specific future revenue general ly has not been d e m o n s t r a t e d . . . ' is still in effect. 1 Apparen t ly , U.S. s t andard-se t t e r s are concerned with the re l iabi l i ty and object iv i ty of the es t imates requi red for R & D capi ta l iza t ion , and with the assoc ia ted audi t risk. The specter of p rov id ing manage r s with add i t iona l o p p o r - tunit ies for earnings m a n a g e m e n t must also weigh heavi ly on regulators .
The ma in object ive of this s tudy is to address the issues of rel iabil i ty, object ivi ty , and value-re levance of R & D capi ta l iza t ion . We do this by first es t imat ing the re la t ion between R & D expendi tures and subsequent earnings for a large cross-sect ion of R&D- in tens ive firms. This es t imat ion al lows us to c o m p u t e firm-specific R & D capi ta l and its amor t i za t i on rate, as well as the measu remen t of the per iodic R & D amor t i z a t i on (in con t ras t with the G A A P expense, which equals the R & D outlay). We then adjus t r epor ted earnings and b o o k values of the sample firms for the R & D cap i ta l i za t ion and show tha t the ad jus ted values are signif icantly associa ted with s tock prices and returns, in- d ica t ing the value-re levance to investors of the R & D cap i ta l i za t ion process
1In 1985 the FASB made an exception to the full expensing requirement for some software development costs, see FAS No. 86 (Eccher, 1995). In several other countries R&D capitalization is allowed and even required. For example, in the UK, SSAP 13 requires that expenditures on pure and applied research should be written off as incurred, but development expenditures may, in certain defined circumstances, be deferred to future periods. The Canadian Standard (section 345 of the CICA Handbook) goes further to require the deferment of certain development expenditures. The International Accounting Standard, IAS 9, is generally in line with the Canadian standard with respect to R&D capitalization.
B. Lev, "1~ Sougiannis / Journal o f Accounting and Economics 21 (1996) 107 138 109
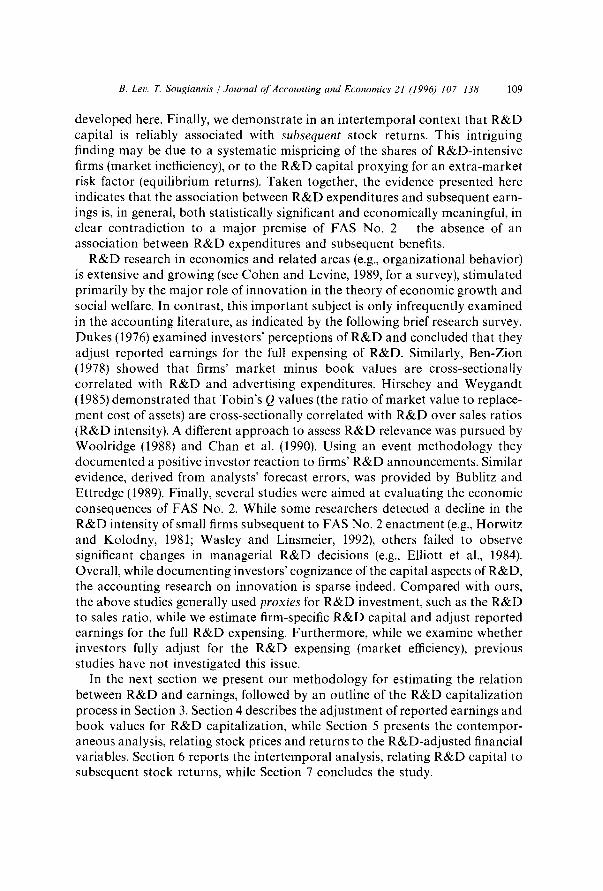
developed here. Finally, we demonstrate in an intertemporal context that R&D capital is reliably associated with subsequent stock returns. This intriguing finding may be due to a systematic mispricing of the shares of R&D-intensive firms (market inefficiency), or to the R&D capital proxying for an extra-market risk factor (equilibrium returns). Taken together, the evidence presented here indicates that the association between R&D expenditures and subsequent earn- ings is, in general, both statistically significant and economically meaningful, in clear contradiction to a major premise of FAS No. 2 the absence of an association between R&D expenditures and subsequent benefits.
R&D research in economics and related areas (e.g., organizational behavior) is extensive and growing (see Cohen and Levine, 1989, for a survey), stimulated primarily by the major role of innovation in the theory of economic growth and social welfare. In contrast, this important subject is only infrequently examined in the accounting literature, as indicated by the following brief research survey. Dukes (1976) examined investors' perceptions of R&D and concluded that they adjust reported earnings for the full expensing of R&D. Similarly, Ben-Zion (1978) showed that firms' market minus book values are cross-sectionally correlated with R&D and advertising expenditures. Hirschey and Weygandt (1985) demonstrated that Tobin's Q values (the ratio of market value to replace- ment cost of assets) are cross-sectionally correlated with R&D over sales ratios (R&D intensity). A different approach to assess R&D relevance was pursued by Woolridge (1988) and Chan et al. (1990). Using an event methodology they documented a positive investor reaction to firms' R&D announcements. Similar evidence, derived from analysts' forecast errors, was provided by Bublitz and Ettredge (1989). Finally, several studies were aimed at evaluating the economic consequences of FAS No. 2. While some researchers detected a decline in the R&D intensity of small firms subsequent to FAS No. 2 enactment (e.g., Horwitz and Kolodny, 1981; Wasley and Linsmeier, 1992), others failed to observe significant changes in managerial R&D decisions (e.g., Elliott et al., 1984). Overall, while documenting investors' cognizance of the capital aspects of R&D, the accounting research on innovation is sparse indeed. Compared with ours, the above studies generally used proxies for R&D investment, such as the R&D to sales ratio, while we estimate firm-specific R&D capital and adjust reported earnings for the full R&D expensing. Furthermore, while we examine whether investors fully adjust for the R&D expensing (market efficiency), previous studies have not investigated this issue.
In the next section we present our methodology for estimating the relation between R&D and earnings, followed by an outline of the R&D capitalization process in Section 3. Section 4 describes the adjustment of reported earnings and book values for R&D capitalization, while Section 5 presents the contempor- aneous analysis, relating stock prices and returns to the R&D-adjusted financial variables. Section 6 reports the intertemporal analysis, relating R&D capital to subsequent stock returns, while Section 7 concludes the study.

110 B. Lev, T. Sougiannis / Journal o[Accounting and Economics 21 (1996) 107-138
2. Estimating the R&D-earnings relation
O u r es t imat ion of R & D capi ta l and its amor t i z a t i on rate is der ived from the fundamen ta l re la t ion between the value of assets and the earnings genera ted by them. Accordingly , we define the earnings of firm i in per iod t, Ei,, as a funct ion of tangible , TA,, and in tangib le assets, IAit, where the la t ter includes the R & D capital : 2
Ei, = g(TAi~, IAi,). (1)
Whi le the values of earnings and tangible assets (at h is tor ical costs) are repor ted in f inancial s ta tements , the in tangib le capi tal , IA, is not r epor ted and therefore has to be es t imated.
Given our focus on R & D , we single it ou t of in tangib le assets and define its value, RDCi,, as the sum of the unamortized pas t R & D expendi tures . Those are the expendi tu res that are expected to genera te cur rent and future earnings:
RDCi, = ~ ~ik RDi., k, (2) k
where C~ik is the con t r ibu t ion of a do l l a r R & D expendi ture in year t - k (k = 0 . . . . . N) to subsequent earnings (i.e., the p r o p o r t i o n of the R & D expendi- ture in year t - k that is still p roduc t ive in year t).
Subs t i tu t ing express ion (2) into (1) yields:
Ei,=(J(TAU,~kOqkRDi.,_k, OlAi,), (3)
where OIAit are o ther ( than R&D) in tangible assets. (Ei, is the R & D - a d j u s t e d earnings, namely repor ted earnings plus current R & D expendi tures minus the amor t i z a t i on of R & D capital .)
No te tha t we derive the value of R & D capi ta l f rom the firm's earnings. An a l te rna t ive is to es t imate that value from the difference between the firm's m a r k e t and b o o k (or rep lacement cost) values (e.g., C o c k b u r n and Gri l iches, 1988; Hall , 1993a). 3 We prefer to derive R & D capi ta l f rom its direct benefits - earnings - over its es t imat ion from marke t values, since the former avoids the no to r ious c i rcular i ty in the use of marke t prices to es t imate values of assets or
2This formulation accords with production function estimations (e.g., Mairesse and and Sassenou, 1991; Hall, 1993a), where gross output (e.g., sales) is related to labor and material inputs, as well as to the stocks of physical and intangible capital. Our dependent variable, earnings, proxies for output minus labor and material inputs, leaving the values of tangible and intangible assets as the independent variables.
3Market values were also used in prior accounting research (e.g., Ben-Zion, 1978; Hirshey and Weygandt, 1985) to estimate R&D amortization rates.

B. Lev, T Sougiannis / Journal o f Accounting and Economics 21 (1996) 1 0 ~ 1 3 8 l I 1
liabilities. This circularity arises from the general presumption that market prices are determined by reported financial variables, and therefore such prices cannot be logically used to determine the values of financial variables. Further- more, the estimation of fundamental variables (e.g., R&D capital or an environ- mental liability) from market values precludes one from investigating the extent of market efficiency with respect to the examined variables. Such an investiga- tion is conducted below. 4
2.1. Estimation of expression (3) and data sources
The variables in relation (3) are defined thus. Earnings, Ei~, is measured as operating income before depreciation and the expensing of R&D and advert- ising. Operating income is used as a measure of R&D benefits, since R&D investment and its consequences seem largely unrelated to nonoperating items, such as administrative expenses and financing charges. Depreciation, R&D, and advertising expenses were excluded from (added back to) operating income since they represent, largely ad hoc, writeoffs of the independent variables in (3) tangible and intangible assets. 5
Tangible assets, TAi~ in (3), consist of three components: plant and equipment, inventories, and investment in unconsolidated subsidiaries and purchased intan- gibles. Each of these asset items has been separately adjusted for inflation in the data source we use (to be described below). Across our sample firms and years examined (1975-1991), the average shares of tangible assets, inventories, and other investments are: 0.70, 0.23, and 0.07, respectively. The major intangible asset, R&D capital, is represented here by the lag structure of annual R&D expenditures, expression (2), where these expenditures, RDi.~_k, are adjusted for inflation to reflect current-year dollars.
Advertising expenditures on product promotion and brand development may create an additional intangible asset for some sample firms. This may raise an omitted variable problem in expression (3), if R&D capital were the only intangible asset included. Conceptually, advertising capital can be estimated from its lag structure, similarly to the procedure applied to R&D (2). However, inspection of our data source, which focuses on R&D firms, revealed that annual advertising expenditures were occasionally missing for many sample firms,
4It should also be noted that we estimate the value of R&D capital by relating an input measure (R&D expenditures) to an output indicator earnings. There are various attempts in the economic literature to estimate the value of R&D capital by other output measures, such as the number of patents granted, the number of inventions resulting from the R&D process, or the frequency of citations in scientific publications and in patent requests (e.g., Pakes, 1985).
5 Replication of our estimates with net income (before extraordinary items) as the dependent variable yielded very similar results to those based on operating income.
112 B. Lev, T. Sougiannis / Journal o f Accounting and Economics 21 (1996) 107-138
straining the requirement for a reasonable length of lag structure for reliable estimation. We therefore employed a procedure frequently used by economists (e.g., Hall, 1993b), in which the advertising intensity (advertising expenses over sales) is substituted for advertising capital. Empirical evidence (e.g., Bublitz and Ettredge, 1989; Hall, 1993b), indicates that, in contrast to R&D, the effect of advertising expenditures on subsequent earnings is short-lived, typically one to two years only. Accordingly, an advertising proxy based on annual expenditures may account reasonably well for the omit ted variable in expression (3). 6
The estimated expression, scaled by total sales to mitigate heteroscedasticity, is
(OI/S)it = O~o + cq(TA/S) i , t_ 1 + ~, ct2.k(RD/S)i., k k
+ ~3(AD/S) i . t -1 + eit, (4)
OI = annual operat ing income, before depreciation, advertising and R & D expenses, of firm i in year t,
S = annual sales, T A = the value of plant and equipment, inventory, and investment in uncon-
solidated subsidiaries and goodwill, in current dollars, measured at the beginning-of-year values,
R D = annual R & D expenditures in current dollars, A D = annual advertising expenses, measured at the beginning-of-year values.
Note that if expression (4) is subject to correlated omitted variables problem, then the estimated values of the :~ coefficients may be overstated.
Three data bases are used in this study: (1) the 1993 C R S P daily file, (2) the 1993 C O M P U S T A T file, and (3) the NBER' s R & D Master File (described in detail in Hall et al., 1988). 7 The R & D Master File was constructed from consecutive C O M P U S T A T tapes, starting with the 1978 tape. Accordingly, the earliest da ta on the Master File relate to the year 1959. The C O M P U S T A T tapes used as sources for the R & D Master File are: the Industrial (NYSE, AMEX, and large O T C firms), O T C (the remaining O T C firms), Full Coverage ( n o n - N A S D A Q firms), and the Research (deleted firms) tapes. The R & D Master File includes about 2,600 manufactur ing companies which reported R & D ex- penditures. It is thus a subset of merged C O M P U S T A T tapes, focusing on R & D
~'Peles (1970), in one of the earliest studies on advertising amortization, also documents the short life (impact on subsequent sales) of advertising capital. His estimated annual amortization rates for advertising were: 100 percent for the car industry, 40 50 percent for beer advertising (i.e., roughly two-year life), and 35~45 percent for cigarettes. 7The Master File was updated to 1991.

B. Lev, T. Sougiannis / Journal of Accounting and Economics 21 (1996) 107 138 113
firms. This file has several attractive features for our study. In particular, asset values and expenses (e.g., R&D) are adjusted to current dollars, and given the frequent use of this data base in time-series analyses, key variables (e.g., plant, sales, R&D expenditures) were scanned to identify large yearly jumps in the data and locate missing values. In such cases, the original annual reports and 10-Ks were examined and the data were completed and corrected when possible (for a detailed discussion of these quality checks, see Hall et al., 1988). 8
2.2. Simultaneity
Models, such as (4), relating output to capital, generally raise simultaneity issues. Specifically, when a shock to the regression residual affects both the dependent (output) and one or more independent variables (capital), the latter will be correlated with the residual term, leading to inconsistent regressions estimates. For example, an exogenous shock enhancing demand for the firm's products will generally increase both current earnings and the marginal return to capital, the latter leading to increased investment in R&D. In this case, R&D expenditures cannot be considered an exogenous variable, and OLS estimation of (4) will yield inconsistent estimates. This calls for estimating expression (4) in a simultaneous equation context.
To account for simultaneity, we use the instrumental variable method, where an instrument (another variable) is chosen to substitute for the explanatory variable [RDit in expression (4)] which may be correlated with the residual. A successful instrument is one which is correlated with the substituted explana- tory variable, yet is uncorrelated with the residual. We chose as the instrument for firm i the average level of R&D expenditures (deflated by sales) of the other firms in its four-digit SIC code. 9 The industry R&D instrument is appealing on both theoretical and empirical grounds. Industry R&D level is obviously un- affected by firm idiosyncratic shocks (e.g., a specific managerial strategy or a corporate control change affecting the firm's cost of capital), thereby consider- ably limiting its correlation with the original regression (4) residual. At the same time, there are strong reasons to believe that the correlation between a given firm's R&D expenditures (the original variable) and the industry average (the instrument) is generally high. Corporate activities are often evaluated by inves- tors and financial analysts against industry norms, deterring managers from significantly deviating from them.
81n addition to the checks made in the R&D database we eliminated from the sample firms that had large mergers (those contributing 50% or more to annual sales), since such mergers seriously disrupted the time series examined. The total number of firms eliminated due to mergers was 121.
9We require at least four other firms in the four-digit SIC group. If less than four firms are available~ the industry is defined at the three-digit level in which firm i is classified.

114 B. Lev, T. Sougiannis / Journal o[' Accounting and Economics 21 (1996) 107 138
More fundamentally, an association between a firm's R&D expenditures and those of the industry is induced by the well-known 'spillover' phenomenon, namely by firms' efforts to learn of and benefit from the innovative activities of other firms. Obviously, in order to benefit from others' knowledge, one has to develop a capacity to exploit that knowledge, achieved by increasing one's own R&D (e.g., hiring scientists who will follow other firms' activities). Indeed, economists have observed that firms that invest more in their own R&D are better able to exploit externally-generated knowledge than firms with lower R&D expenditures (e.g., Evenson and Kislev, 1973; Mowery, 1983). Cohen and Levinthal (1989) found that firms invest in R&D for two purposes: to generate new knowledge and to develop 'absorptive capacity' - the ability to recognize, assimilate, and exploit others' knowledge. R&D spillover will thus contribute to a positive association between a firm's R&D expenditures and those of related firms (the industry).
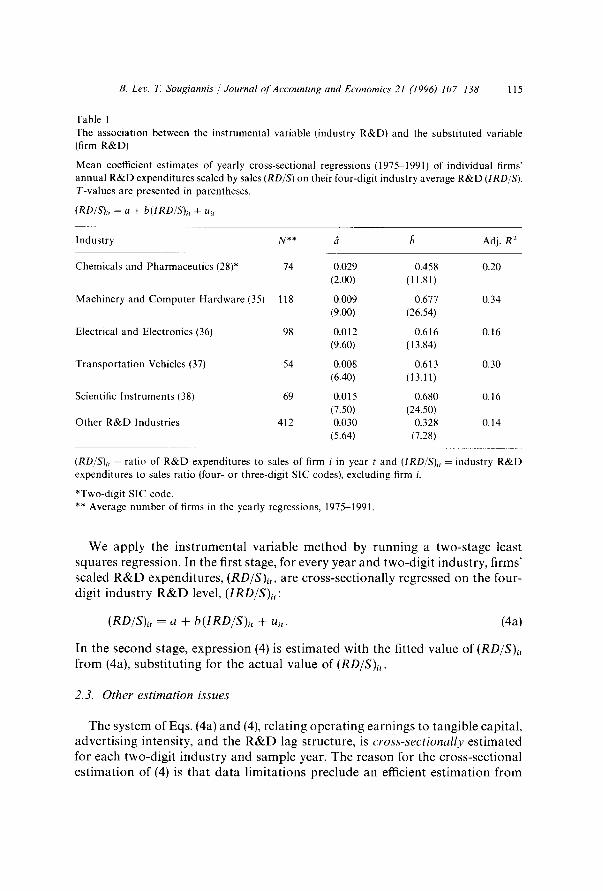
The positive association between firm-specific R&D expenditures and those of the industry (the instrument) is corroborated by the data in Table 1. These are mean coefficient estimates, over the years 1975-1991, from regressing cross- sectionally individual firms' R&D expenditures on the corresponding four-digit industry R&D level (both variables scaled by sales). Note that the regressions are estimated by pooling over firms in two-digit industries (e.g., SIC codes 28, 35...), where each of those two-digit industries includes multiple four-digit industry means. 1° For example, the two-digit industry no. 28 (Chemicals and Pharmaceutics) includes 12 four-digit industry groups. Moreover, for each observation of the dependent variable, (RD/S)it, we exclude the firm's R&D expenditure from the corresponding four-digit industry average (independent variable). Accordingly, in each cross-section of two-digit industry, the indepen- dent variable takes a different value for each observation. It is evident from Table 1 that for all industries, the industry R&D level coefficient,/~, is positive, highly statistically significant, and quite stable (around 0.65 for four of the six industries). There thus exists the desired association between our instrumental variable the industry R & D - and the substituted explanatory variable, RDit, in expression (4). 11
1°The industry classification in Table l (two-digit codes 28, 35, 36, 37, 38, and 'Other R&D Industries') is also used in the rest of the study. The individual two-digit industries resulted from our requirement that each one will have at least 20 firms in each year examined (1975 1991). All industries with less than 20 firms in at least one year were grouped into 'Other R&D Industries'. We also required that each sample firm has at least 10 annual lags of R&D data and its R&D/Sales ratio is at least 2 percent.
11The industry R&D was also found by Berger (1993) to be the most significant variable in explaining firm-specific R&D expenditures (the other variables were: cash flow, GNP, Tobin 's Q ratio, last year's R&D expenditures, and the R&D tax credit).
B. Lev, T. Sougiannis / Journal o f Accounting and Economics 21 (1996) 107 138 115
Table 1 The association between the instrumental variable (industry R&D) and the substituted variable (firm R&D)
Mean coefficient estimates of yearly cross-sectional regressions (1975 1991) of individual firms" annual R&D expenditures scaled by sales (RD/S) on their four-digit industry average R&D (IRD/S). T-values are presented in parentheses.
(RD/S)it = a + b(IRD/S)i, + ul,
Industry N** cJ ~ Adj. R 2
Chemicals and Pharmaceutics (28)* 74 0.029 0.458 0.20 (2.00) (11.81)
Machinery and Computer Hardware (35) 118 0.009 0.677 0.34 (9.00) (26.54)
Electrical and Electronics (36) 98 0.012 0.616 0.16 (9.60) (13.84)
Transportation Vehicles (37) 54 0.008 0.613 0.30 (6.40) (13.11)
Scientific Instruments (38) 69 0.015 0.680 0.16 (7.50) (24.50)
Other R&D Industries 412 0.030 0.328 0.14 (5.64) (7.28)
(RD/S)i, = ratio of R&D expenditures to sales of firm i in year t and (IRD/S)I, - industry R&D expenditures to sales ratio (four- or three-digit SIC codes), excluding firm i.
*Two-digit SIC code. ** Average number of firms in the yearly regressions, 1975-1991.
W e app ly the i n s t r u m e n t a l va r i ab le m e t h o d by r u n n i n g a two-s tage least squares regress ion. In the first stage, for every year a n d two-d ig i t i ndus t ry , f i rms ' scaled R & D expend i tu res , ( R D / S ) i , , are c ross - sec t iona l ly regressed o n the four- digi t i n d u s t r y R & D level, ( I R D / S ) I t :
( R D / S ) i t = a + b ( I R D / S ) i , + uit. (4a)
In the second stage, express ion (4) is e s t ima ted wi th the fi t ted va lue of ( R D / S ) i ,
f rom (4a), s u b s t i t u t i n g for the ac tua l va lue of ( R D / S ) i t .
2.3. O t h e r e s t i m a t i o n i s s u e s
T h e sys tem of Eqs. (4a) a n d (4), r e la t ing o p e r a t i n g e a r n i n g s to t ang ib l e capi ta l , adve r t i s ing in tens i ty , a n d the R & D lag s t ruc ture , is c r o s s - s e c t i o n a l l y es t ima ted for each two-d ig i t i n d u s t r y a n d sample year. T he r eason for the c ross - sec t iona l e s t i m a t i o n of (4) is tha t d a t a l i m i t a t i o n s p rec lude an efficient e s t i m a t i o n f rom

116 B. Lev, 72 Sougiannis / Journal ~['Accounting and Economics 21 (1996) 107-138
individual firms' time series. Our estimates of R&D amortization rates [derived from the 0~2k coefficients in expression (4)] are thus industry-wide estimates which are then applied to individul firms.
A multicolinearity problem is encountered in the estimation of the R&D lag structure, ~k~2.k(RD/S)i.,- k, in expression (4), since annual R&D expenditures for most companies are relatively stable over time. A frequently used approach to address this problem, which is particularly serious in relatively short time series, is 'reduced parameterization' , namely the estimation of fewer parameters than the number of lags, k, in the time series. This is achieved by assuming a priori that the lag coefficients, ~=.~, reflecting the R&D benefits, behave according to some general structure, such as a polynomial. The increased efficiency results from the need to estimate a small number of parameters, relative to the number of lags in the series. The efficiency comes, of course, at the expense of assuming an a priori structure of coefficients. The specific estimation technique we used is the Almon lag procedure (for details see, e.g., Johnston, 1984, pp. 352 358; Maddala, 1992, pp. 424 429). The Almon procedure has a flexibility advantage over several competitors (e.g., the Koyck lag or the binomial lag), since it allows experimentation with polynomials of various degrees and the consequent fitting of a suitable polynomial to the data. In contrast, the Koyck lag imposes a strictly declining pattern on the coefficients, while the binomial and Pascal lag procedures impose quadratic patterns.
3. The R&D capitalization
The system of Eqs. (4a) and (4), relating earnings to assets, was run cross- sectionally, with the instrumental wtriable (industry R&D level) and the Almon lag procedure, for each two-digit sample industry and year. Table 2 provides an example of the estimation procedure for industry 36 Electrical and Electronics Manufacturers covering the early part of the sample period: 1975 1981. These estimates are used to adjust reported earnings and book values of the sample companies in the subsequent year, 1982. Similarly, the 1983 reported earnings and book values were adjusted from R&D capitalization estimates based on data of the preceding years 1975-1982. This is an important feature of our analysis: the adjustment of reported earnings and book values in any sample year is based on estimates derived from expression (4) run over the preceding years, starting with 1975 (the year FAS No. 2 came into effect). 12 Thus, all information used in the R&D adjustment process was ex ante known.
121975 was the first year for the estimation of expression (4). Note, however, that the R&D lagged data for the 1975 regression (as well as those for succeeding years) extend back to 1959, the first year on the R&D Master File.

B. Lev, 7~ Sougiann& / Journal of Accounting and Economics 21 (1996) 10~138 117
In the industry-wide estimates from expression (4) we ignore the statistically insignificant R & D lag coefficient estimates, ~2,k. For example, in the first row of Table 2 (year 1975), the coefficients of lags 6 to 10, az. 6 to a2.10, were insignifi- cant and therefore not reported in the table, while in 1980 and 1981, the lags 6 and 7 coefficients were significant (perhaps due to the larger sample size in those years or to a shift in R&D benefits). The horizontal sum of the significant R&D coefficients, 2~2.k (second column from the right), reflects the total (undiscounted) effect of $1 invested in R&D on current and future operating income. For example, based on the 1975 estimation (first row in Table 2), the average contribution to operating income of $1 invested in R&D by Electrical and Electronics manufacturers was $2.328. While total benefits of $2.328 from $1.00 R&D expenditure may appear to be large, it should be recalled that these benefits refer to operating income before R&D amortization, and before major expense items, such as selling, general and administrative expenses, as well as financing expenses and income taxes. Furthermore, these benefits accrue over five years but are not discounted.
The estimated regression coefficients for each of the years 1975 1981 are averaged and reported in the second to bot tom row in Table 2. These averages are used to compute a key R&D capitalization parameter - the annual amorti- zation rates of the R&D capital, 6k (reported in the bot tom line of Table 2),
(~k=~2,k/~k~2, k . (5)
The R&D amortization in year k is thus the ratio of that year's benefits expired, ~2,k, to total benefits, ~k~2,k. For example, the amortization rate of current (year 0) R&D expenditures, 60, is 0.268/2.348 = 0.114. Thus, on average, in the Electrical and Electronics industry (over the period 1975 1981), the amortiza- tion rate of current R&D expenditures was 11.4%. The amortization rate of the peceding year's (year 1) R&D expenditures was 17.7%. Accordingly, the amorti- zation of the R&D capital in 1982 (the proper R&D expense, rather than the GAAP expense) consists of 11.4% of the 1982 R&D expenditure, plus 17.7% of the 1981 R&D expenditure, plus 19.7% of the 1980 R & D expenditure, and so on back in time over all R&D vintages that are still contributing to year t earnings. The annual amortization rates, bot tom line of Table 2, are used to compute both the R&D capital and its amortization for 1982, as will be demonstrated in Section 4. Note that prior to 1975 (the year FAS No. 2 came into effect) some firms capitalized part of their R&D expenditures. This introduces noise into our data and increases measurement error, particularly in the early sample years (the 1970s) which rely heavily on pre-FAS No. 2 data. This may explain the apparent shift (nonstationarity) of the R&D coefficients (~2,0; ~2.1;--') in Table 2, occurring in 1980.
Table 2 demonstrates the estimation of the R&D amortization rates for firms in the Electrical and Electronics industry in 1982. Similar estimations were made

2,,t
Tab
le 2
~_
Exa
mpl
e: D
eriv
atio
n of
ann
ual
amor
tiza
tion
rat
es o
f R
&D
for
198
2, i
ndus
try
36 (
Ele
ctri
cal
and
Ele
ctro
nics
)
Coe
ffic
ient
est
imat
es o
f reg
ress
ion
(4),
run
cros
s-se
ctio
nall
y fo
r eac
h of
the
year
s 19
75 1
981,
usi
ng in
stru
men
tal
vari
able
s an
d th
e A
lmon
lag
proc
edur
e (t
-val
ues
in
pare
nthe
ses)
: .~
:aa
{O
ilS)
i,
=
Y.o
+
~.I
(TA
/S)i
.t
1 +
~
:2.k
(RD
/S}i
.,
k +
9:
3(A
D'S
)I,
1 +
ei
t e~
k
No.
of
~ A
dj.
Yea
r fi
rms
~o
~1
~3
~2,0
~2
,1
~2.2
~2
.3
~2,4
{~
2.5
~2,b
~2
,7
~2.k
R2
k=
0
1975
44
0.
266
0.13
6 1.
833
0.36
1 0.
536
0.56
1 0.
471
0.30
4 0.
095
- 2.
328
0.91
(0
.73)
(6
.01)
(1
.61)
(4
.19)
(3
.74)
(3
.73)
(3
.21)
(2
.41)
(2
.04)
5.
1976
49
-0
.346
0.
181
0.85
6 0.
342
0.51
4 0.
547
0.47
6 0.
331
0,14
6 --
--
2.
356
0.91
,,,
, (
- 0.
84)
(7.4
0)
(0.6
9)
(5.1
8)
(5.2
4)
(5.2
6)
(5.2
8)
(4.9
4)
(2.8
6)
- 1.
143
0.19
1 1.
543
0.35
6 0.
543
0.59
3 0.
535
0.40
2 0.
226
0.03
7 2.
692
0.89
,~
19
77
52
( -
4.50
) (7
.51)
(2
.06)
(5
.08)
(5
,22)
(5
.54)
(6
.08)
(7
.30)
(5
.14)
(2
.13)
1978
66
0.
943
0.23
6 0.
048
0.29
3 0.
451
0.49
8 0.
458
0.35
6 0.
218
0.06
7 2.
341
0.86
"~
(
- 3.
14)
(7.9
2)
(0.0
8)
(3.6
6)
(3.7
5)
(3.8
9)
(4.0
8)
(4.2
3)
(3.6
3)
(2.3
6)
1979
69
-
1.07
4 0.
249
0.52
7 0.
318
0.49
0 0.
542
0.50
1 0.
393
0.24
4 0.
082
--
2.57
0 0.
88
( -
3.41
) (7
.88)
(0
.87)
(3
.74)
(3
.82)
(3
.98)
(4
.17)
(4
.41)
(4
.06)
(2
.94)

1980
68
-
1.06
9 0.
189
1.30
3 0.
099
0.18
0 0.
243
0.28
9 0.
316
0.32
5 0.
302
0.26
9 2.
023
0.82
(
- 2.
52)
(6.5
3)
(1.5
7)
(4.9
5)
(5.0
0)
(5.0
6)
(5.0
7)
(5.0
1)
(5.0
7)
(4.7
9)
(4.7
1)
1981
70
-
0.38
7 0.
217
0.90
6 0.
104
0.18
8 0.
254
0.30
1 0.
330
0.33
9 0.
316
0.28
7 2.
119
0.85
(
- 0.
89)
(7.4
0)
(1.7
8)
(4.0
0)
(4.0
8)
(4.0
3)
(4.0
6/
(4.0
7)
(4.0
3t
(3.9
0)
(3.8
7)
Mea
n -
0.67
1 0.
200
1.00
2 0.
268
0.41
5 0.
463
0.43
3 0.
347
0.22
8 0.
115
0.07
9 2.
348
0.87
R&
D a
mor
tiza
tion
, 6~
" 0.
114
0.17
7 0.
197
0.18
4 0.
148
0.09
7 0.
049
0.03
4
*The
R&
D a
nnua
l am
orti
zati
on
rate
s ar
e ca
lcul
ated
fro
m t
he m
ean
R&
D c
oeff
icie
nts
:~2.
~ (k
= 0
....
. 7)
as
foll
ows:
(~k
= h
2,k/
~
a2,k
- ~.
/
k=O
(OI/S
)~, =
ope
rati
ng i
ncom
e (b
efor
e de
prec
iati
on,
R&
D a
mor
tiza
tion
, an
d ad
vert
isin
g ex
pens
es)
over
sal
es, o
f fi
rm i
in y
ear
t, (T
A/S)
~.,_
~ =
tan
gibl
e as
sets
(pl
ant
and
equi
pmen
t, i
nves
tmen
t in
unc
onso
lidi
arie
s su
bsid
iari
es,
and
inve
ntor
y),
in c
urre
nt d
olla
rs,
over
sal
es, (
RD/S
)~.,
k =
annu
al R
&D
exp
endi
ture
s ov
er s
ales
, in
~ cu
rren
t do
llar
s, o
f fi
rm i
for
k l
ag y
ears
, (A
D/S
)~.t
~ =
adve
rtis
ing
expe
nses
ove
r sa
les,
of
firm
i. T
he i
nstr
umen
tal
vari
able
for
the
(RD
/S)~
.t te
rm i
s th
e fo
ur-d
igit
~
indu
stry
-ave
rage
R&
D o
ver
sale
s, e
xpre
ssio
n (4
a).
'~
txa
,.,..,

120 B. Lev, T. Sougiannis / Journal o['Accounting and Economics 21 (1996) 107 138
for all sample years and industries, allowing the adjustment of reported earnings and book values of all sample firms and years (1975-1991). An overview of these estimates is provided in Table 3 which reports for each sample industry the mean coefficients of the yearly regressions. The amortization rates, 6k, in Table 3, were computed from the 16 yearly regressions, 1975 1990, and were used in the earnings and book value adjustments made for the last sample year, 1991. Note that in Table 3, the coefficients of tangible capital, cq, indicating the contribution of the beginning-of-year tangible assets to operating income, range from 0.084 (Other Industries) to 0.155 (Electrical and Electronics). These values indicate the industry-aveage annual return on tangible assets, and they are in line with the estimates of Griliches and Mairesee (1990), ranging from 0.11 to 0.15. The coefficients of advertising intensity, c~3 (a flow variable), range between 0.906 (Transportation Vehicles) to 1.639 (Scientific Instruments). Thus, a $1 advertising expenditure is associated with an operating income (before advert- ising) increase of roughly $1.00 1.60.
The length of the statistically significant lagged R&D coefficients, ~2.k, in Table 3 indicates the average duration of R&D benefits (useful life of R&D capital). Thus, in Chemicals and Pharmaceutics, the average useful life of R&D is the longest - nine years (~2.s is the last significant coefficient), while in Scientific Instruments the average R&D life is the shortest - five years. These results are generally consistent with Nadiri and Prucha (1992), whose estimates of the useful life of R&D range between seven and nine years. The different durations of R&D capital are mainly related to the ability of innova- tors to appropriate the benefits of innovations, namely to prevent others from copying or imitating them. Benefit appropriation is primarily achieved by patents, but industries differ widely in the effectiveness of patent protection. Both Mansfield (1986) and Levin et al. (1987) argue that patents are highly effective in appropriating returns in the chemicals and drug industries, moder- ately effective for mechanical equipment and machinery manufacturers, and least effective (i.e., it is relatively easy for competitors to 'invent around' the patents) in instruments and motor vehicles. 13 This ranking generally accords with Table 3 estimates regarding the cross-industry differences in the useful life of the R&D investment.
The estimated total benefits of $1 investment in R&D, ~'~k~Z.k, are reported on the next to bottom line of Table 3. These benefits range from $2.628 for
3Levin et al. (1987) suggest that patents are particularly effective in the chemical and drug industries because of the clear standards that can be applied to assess a patent's validity, e.g., a specific molecular structure. In contrast, it is more difficult to demonstrate and defend the novelty of a new component of a mechanical system. Patents are the major, but not the only means of appropriating R&D benefits. Investment in complementary sales and service efforts and secrecy of the innovative process are other appropriability means (Cohen and Levin, 1989, Sec. 4.3).

Tab
le 3
R&
D a
mor
tiza
tion
rat
es o
f al
l sa
mpl
e in
dust
ries
for
199
1
Mea
n co
effi
cien
t es
tim
ates
of
regr
essi
on (
4), o
ver
the
year
s 19
75
1990
, us
ing
inst
rum
enta
l va
riab
les
and
the
Alm
on l
ag p
roce
dure
. 9~
Mac
hine
ry &
C
hem
ical
s &
C
ompu
ter
Ele
ctri
cal
&
Tra
nspo
rtat
ion
Scie
ntif
ic
All
Oth
er R
&D
In
dust
ry
Pha
rmac
euti
cs
Har
dwar
e E
lect
roni
cs
Veh
icle
s In
stru
men
ts
Indu
stri
es
(28)
(3
51
(36)
(3
7)
(38)
No.
of
~.
firm
-yea
rs
1106
17
5l
1375
75
7 99
0 56
53
Coe
ffic
ient
z2
6*
~
(')k
~ 6k
7
Ok
~ Ok
~
6k
z~ o
0.81
2 -
0.65
8 -
0.51
7 1.
487
0.27
8 -
0.51
7 a~
fi
l 0.
137
0.13
5 0.
155
0.10
9 0.
132
0.08
4 ~3
1.
234
1.49
3 1.
055
0.90
6 1.
639
1.01
5 3~
2, 0
0.21
5 0.
082
0.17
7 0.
106
0.22
4 0.
114
0.14
6 0.
072
0.23
2 0.
135
0.20
1 0.
110
~ ~2
.1 0.
350
0.13
3 0.
279
0.16
8 0.
347
0.17
6 0.
249
0.12
3 0.
355
0.20
7 0.
322
0.17
6 ~2
,2 0.
415
0.15
8 0.
319
0.19
2 0.
386
0.19
6 0.
313
0.15
5 0.
413
0.24
0 0.
376
0.20
5 ~2
.3 0.
424
0.16
1 0.
309
0.18
6 0.
360
0.18
3 0.
344
0.17
0 0.
419
0.24
4 0.
376
0.20
5 ~2
,4
0.38
7 0.
147
0.26
2 0.
157
0.28
8 0.
146
0.34
7 0.
171
0.29
9 0.
174
0.32
4 0.
177
0.31
7 0.
121
0.19
2 0.
115
0.18
6 0.
095
0.32
7 0,
162
0.23
3 0.
127
~.
~ 2
~ ~
~2,6
0.
226
0.08
6 0.
125
0.07
6 0.
098
0.05
0 0.
298
0.14
7 ~2
,7 0.
158
0.06
0 0.
079
0.04
0 ~2
,8
0.13
6 0.
052
~az
,k
2.62
8 1.
663
1.96
8 2.
024
1.71
8 1.
832
k=0
~q
Adj
. R
2
0.89
0.
68
0.73
0.
73
0.80
0.
59
/
*Ann
ual
R&
D a
mor
tiza
tion
rat
e =
ak =
a2.
k/~
a2.k
. /
k A
ll th
e ~
coef
fici
ents
, ex
cept
for
the
int
erce
pt,
are
stat
isti
call
y si
gnif
ican
t at
the
0.0
5 le
vel
or b
ette
r (t
wo-
tail
t-t
est)
.
122 B. Let, T. Sougiannis / Journal of Accounting and Economics 21 (1996) 107 138
Chemica ls and Pha rmaceu t i c s to 1.663 in Mach ine ry and C o m p u t e r Hard- ware. 14 Note tha t these und i scoun ted benefits accrue over a relat ively long per iod of t ime five to nine years. Based on the es t imated flow of benefits (the :~2,k in Table 3), assumed to accrue at year-end, the annua l in ternal rate of re turn of a $1 R & D inves tment in chemicals and pharmaceu t i cs is 28%. Simi lar ly computed , the es t imated annual rates of re turn on a $1 inves tment in R & D in the remain ing indust r ies are: Mach ine ry and C o m p u t e r H a r d w a r e 15%, Electr ical and Electronics 2 2 % , T r a n s p o r t a t i o n Vehicles - 19%, Scientific Ins t ruments - 20%, and Other Indust r ies 20%. Recall, that these are benefits in terms of ope ra t ing income, namely before deprec ia t ion and amor t i za t ion , general expenses, and taxes. In terms of after tax net income, our re turn es t imates accord well with the G r a b o w s k i and Muel ler (1978) re turn es t imates of 16.7 percent for chemicals and pha rmaceu t i c s and 11.7 percent over all R & D industr ies , as well as with the Lich tenberg and Siegel (1989) more recent es t imates of 13 percent re turn on R & D inves tment across all indust r ies (for the per iod 1972 1985).
4. Adjusting reported earnings and book values
The indus t ry-wide amor t i za t i on rates, (Sk, are used to c ompu te for each sample firm the annual R & D amortizat ion, R A , ,
RAi , = Y" #ikRDi., k. (6) k
The per iod ic R & D amor t i za t i on (different, of course, from the G A A P expense, which is the current R & D ou t lay R D . ) is thus the sum of current and past R & D outlays, RDi., k, each mul t ip l ied by the a p p r o p r i a t e amor t i za t i on rate, 6k.
Earn ings adjus ted for the R & D capi ta l iza t ion , X~, are equal to r epor ted ( G A A P ) earnings, X~, plus the expensed R & D out lay, R D . , minus the R & D amor t i z a t i on (6):
X i c = X~, + R D , , - RA,,. (7)
To avoid compl ica t ing the analysis , we do not ad jus t earnings under R & D capi ta l iza t ion , X~ c, for deferred taxes. Is The assoc ia t ion doc ume n te d be low
l~When expression (4) was run without the instrumental variable (industry level R&D), the estimated lagged R&D coefficients were, in general, smaller and somewhat less significant. For example, for the Chemicals and Pharmaceutics industry (SIC code 28), the total R&D benefits of $1.00 investment estimated without the instrumental variable was $2.383, while the estimate with the instrumental variable was $2.628 (Table 3).
l SNote, however, Daley's (1995) finding that the deferred tax component of the reported tax expense is considered an expense by investors.
B. Lev, ~ Sougiannis / Journal t~/'Accounting and Economics 2l (1996) 107-138 123
between returns and the R&D-adjusted data would have been strengthened by adding deferred taxes.
The R&D capital at year-end, RDCi,, of each sample firm is obtained by cumulating for each year, starting with 1975 (the year FAS No. 2 became effective), the unamortized portion of the annual R&D expenditures:
R D C i t = ~ RDi., k 1 - 6j , (8) k=O j = 0
where N is useful life or duration of R&D (e.g., nine years in the chemicals and pharmaceutics industry). The R&D capital is thus the sum of the unamortized portion of the current year R&D outlay, RDi.z x (1 -- 6o), plus the unamortized portion of last year's R&D outlay which is amortized twice, RDi.,-t x (1 -- 60 -- 6t), and so on back to the end of the useful R&D life. A detailed example of the computation of earnings under R&D capitalization (xC), the R&D amortization (RAit), and the R&D capital (RDCiz), for Merck & Co. is provided in the Appendix.
The impact of the above adjustments on the sample firms' reported data is substantial. The average (over firms and years) understatement of reported earnings due to R&D expensing (i.e., the percentage difference between adjusted, Xi~i, and reported, Xi~, earnings) ranges from 26.8 percent in Electrical and Electronics to 9.7 percent for 'Other Industries'. The average earnings under- statement for all sample firms and years is 20.55 percent. The understatement of reported equity, resulting from the absence of the R&D capital, ranges from 24.6 percent for both Scientific Instruments and Machinery and Computer Hard- ware to 12.3 percent in 'Other Industries'. The mean book value understatement for all sample firms and years is 22.2 percent.
The relation between adjusted and reported return on equity (ROE) is more complicated, being a function of the growth rate in R&D expenditures, the amortization rate of the R&D capital, and its duration. Holding other things equal, ROE based on R&D capitalization will be higher than reported ROE for firms with a sufficiently high growth rate of R&D expenditures. This is corrob- orated by a regression run across all sample firms and years, of the difference between capitalized and reported ROE on the five-year geometric growth rate of R&D expenditures, which yielded a coefficient of 0.115 (t-value = 6.49) for the R&D growth rate.
5. Contemporaneous analysis: Stock prices, returns, and R&D capitalization
We wish to examine the value-relevance of the variables derived from the R&D capitalization process described above. This can be done by examining, in a contemporaneous setting, the association between stock prices (or returns) and
124 B. Lee, 72 Sougiannis / Journal o/'Accounting and Economics 2l (1996) 107 138
the R&D capitalization estimates, as well as evaluating the intertemporal associ- ation between R&D-adjusted variables and subsequent stock returns. The former, contemporaneous analysis, indicates the extent of current recognition of R&D relevance by investors, while the intertemporal analysis may suggest market inefficiency (i.e., investors failing to fully recognize the value-relevance of R&D).
Kothari and Zimmerman (1995) evaluate the adequacy of price and return models for accounting research and conclude that the 'use of both return and price models has the potential to yield more convincing evidence'. We adopt this recommendation and examine the following return and price models:
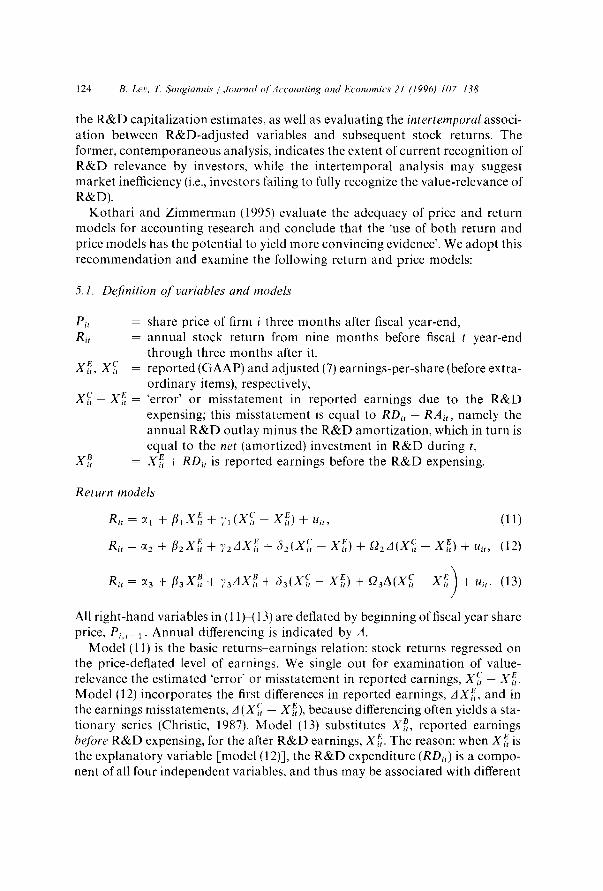
5.1. Definition of variables and models'
Pit
Rit
x ~ , x~; =
x , ' ; - x ~ =
x/", =
share price of firm i three months after fiscal year-end, annual stock return from nine months before fiscal t year-end through three months after it, reported (GAAP) and adjusted (7) earnings-per-share (before extra- ordinary items), respectively, 'error' or misstatement in reported earnings due to the R&D expensing; this misstatement is equal to RD~ -- R A , , namely the annual R&D outlay minus the R&D amortization, which in turn is equal to the net (amortized) investment in R&D during t, X~ + RD, is reported earnings before the R&D expensing.
Return models
R . = ~, + fl, x f , + ~,,,(xf; - x f ) + . . , (11)
Rit = ,9~ 2 q- f12 X E -4- ] , 2 A X ~ 4- (~2(X[i - X E) Jr • 2 A ( X C - X E) q- uit , (12)
n . = ~ + & X ~ + ~,~AX~ + ,~ (Xi , - X~) + ~ a ( X ~ ; - X,~ + u . . (13)
All right-hand variables in (11)413) are deflated by beginning of fiscal year share price, Pi, 1. Annual differencing is indicated by A.
Model (11) is the basic returns earnings relation: stock returns regressed on the price-deflated level of earnings. We single out for examination of value- relevance the estimated 'error' or misstatement in reported earnings, X~ - X~. Model (12) incorporates the first differences in reported earnings, AXe, and in the earnings misstatements, A (X~ - X~), because differencing often yields a sta- tionary series (Christie, 1987). Model (13) substitutes X~, reported earnings before R&D expensing, for the after R&D earnings, X~. The reason: when X~ is the explanatory variable [model (12)], the R&D expenditure (RDi,) is a compo- nent of all four independent variables, and thus may be associated with different

B. Lev, ~ Sougiannis / Journal of Accounting and Economics 21 (1996) 107-138 125
estimated coefficients. In model (13), on the other hand, the R & D expenditure is only present in the two right-most independent variables.
Pr ice mode l s
P,, = ~4 + ~ 4 X [ + 7 4 ( X c - X [ ) + u , , (14)
P,, = ~5 + 135X~ + 7 5 ( X c - X ~ ) + t 2 5 ( B V c - B V ~ ) + u , . (15)
Expression (14) is the pars imonious price model, with the 'error ' in reported earnings singled out. Model (15) accounts for both the misstatements in reported earnings and in book value. The latter, B V c - B V ~ , equals the total capitalized value of R&D, R D C , (8). Since the price regressions are not deflated, we applied White 's correct ion for heteroscedasticity. We expect positive values for all the coefficients (except the intercepts) in both the returns and price regressions. The reason: earnings are expected to be positively correlated with stock prices and returns, while the misstatements in reported earnings and book value, which equal the net annual investment in R & D and the total R & D capital, respective- ly, should on average be associated with market value increases (assuming managers follow the net present value rule in their R & D decisions).
5.2. F i n d i n g s
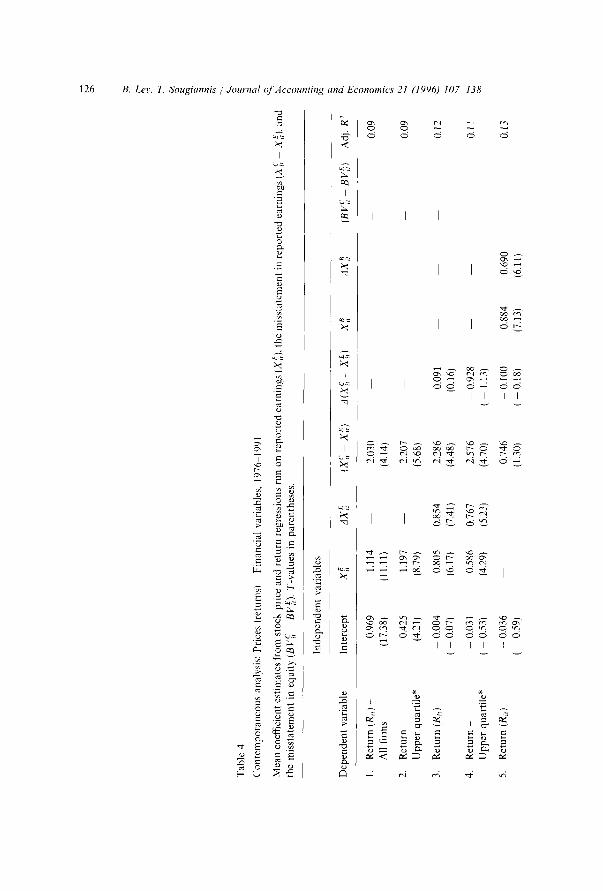
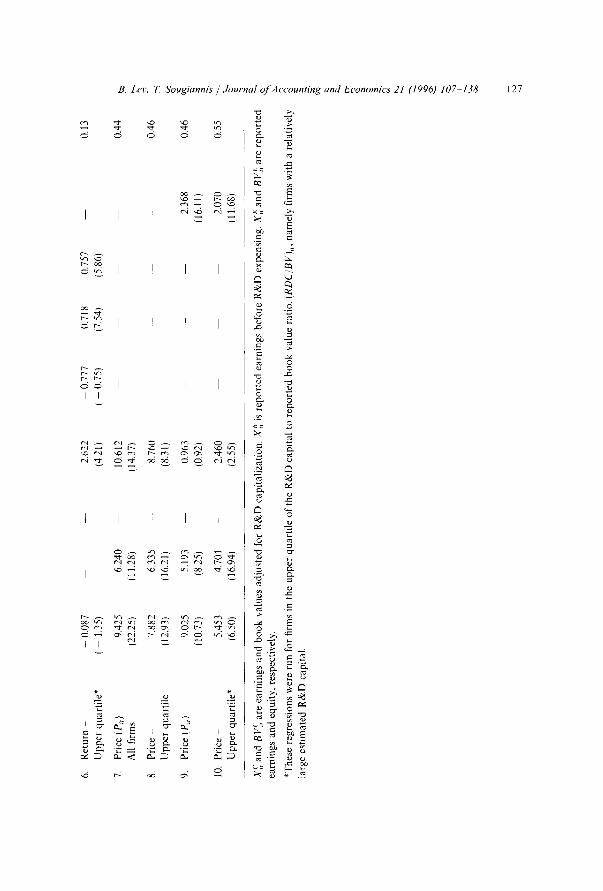
Table 4 presents estimates of the con temporaneous price and return regres- sions outlined above. Specifically, for each sample firm and year we adjusted earnings, book values, and R & D capital (expressions 6-8), from data publicly available prior to the year of adjustment. For example, the 1982 adjusted earnings, book values and R & D capital of the sample firms are based on R & D amort iza t ion rates computed from 1975 1981 data, as demonst ra ted in Table 2 for the Electric and Electronics industry. The values reported in Table 4 are mean regression coefficients and corresponding t-values derived from the 16 individual-year regressions, 1976-1991.16
It is evident from Table 4 that in all the return and price configurat ions (except for rows 5 and 9), our adjustment to reported earnings, X c - X~ (the difference between earnings under R & D capitalization and G A A P earnings), is as expected positive and highly statistically significant. 17 Fur thermore , the
~OWe estimate R&D amortization rates for every industry and year, 1975 1990. These estimates enable us to adjust reported data from 1976 (1975 is 'lost' in the differencing of earnings) to 1991, the year subsequent to the end of amortization rate estimation. ~VThe change in this variable, A (X~I -- X~), is not significant, probably due to the relative stability for most firms of R&D expenditures in successive years. Indeed, the standard deviation of X c - X~ is about 50 percent larger than that of A(X c -- X~).
P.
Tab
le 4
Con
tem
pora
neou
s an
alys
is:
Pric
es (
retu
rns)
Fi
nanc
ial
vari
able
s.
1976
19
91
Mea
n co
effi
cien
t es
tim
ates
fro
m s
tock
pri
ce a
nd r
etur
n re
gres
sion
s ru
n on
rep
orte
d ea
rnin
gs (
X~)
, th
e m
isst
atem
ent
in r
epor
ted
earn
ings
(X
~I
X~)
, an
d th
e m
isst
atem
ent
in e
quit
y (B
V c
-
BV
~).
T-v
alue
s in
par
enth
eses
.
Inde
pend
ent
vari
able
s
Dep
ende
nt v
aria
ble
Inte
rcep
t X
~
AX
~
(X~I
-
X~
) A
(X~I
-
X~
) X
~
AX
~
(BV
~; -
B
V~
) A
dj.
R 2
~"
1.
Ret
urn
(R.)
-
0.96
9 1.
114
2.03
0 0.
09
All
firm
s (1
7.38
) (1
1.1
l)
(4.1
4)
~.
2.
Ret
urn
0.42
5 1.
197
--
2.20
7 --
0.
09
--.~
Upp
er q
uart
ile*
(4
.21)
(8
.79)
(5
.68)
3.
Ret
urn
(R,)
-
0.00
4 0.
805
0.85
4 2.
286
0.09
1 0.
12
( 0.
07)
(6.1
7)
(7.4
1)
(4.4
8)
(0.1
6)
,~
4.
- 0.
031
0.58
6 0.
767
2.57
6 -
0.92
8 0.
l l
( -
0.53
) (4
.29)
(5
.23)
(4
.70)
(
1.13
)
5.
- 0.
036
0.74
6 -
0.10
0 0.
884
0.69
0 0.
13
( -
0.59
) (1
.30)
(
- 0.
18)
(7.1
3)
(6.1
1)
Ret
urn
- U
pper
qua
rtil
e*
Ret
urn
(Ri,)
6.
Ret
urn
- 0.
087
--
2.62
2 0.
777
0.71
8 0.
757
--
0.13
U
pper
qua
rtil
e*
I -
1.35
) (4
.21)
(
- 0.
75)
(7.5
4)
(5.8
6)
7.
Pric
e (P
/t)
9.42
5 6.
240
10.6
12
--
0.44
A
ll fi
rms
(22.
25)
(11.
28)
(14.
37)
8.
Pric
e -
7.88
2 6.
335
8.76
0 --
--
0.
46
Upp
er q
uart
ile
(12.
93)
(16.
21)
(8.3
1)
9.
Pric
e (P
~,)
9.02
5 5.
193
0.96
3 2.
368
0.46
(1
0.73
) (8
.25)
(0
.92)
(1
6.11
)
10.
Pric
e 5.
453
4.70
1 2.
460
--
2.07
0 0.
55
Upp
er q
uart
ile*
(6
.50)
(1
6.94
) (2
.55)
(1
1.68
)
X c
and
BV
c ar
e ea
rnin
gs a
nd b
ook
valu
es a
djus
ted
for
R&
D c
apit
aliz
atio
n.
X~
is r
epor
ted
earn
ings
bef
ore
R&
D e
xpen
sing
. X
~ an
d B
V~
are
rep
orte
d ea
rnin
gs a
nd e
quit
y, r
espe
ctiv
ely.
*The
se r
egre
ssio
ns w
ere
run
for
firm
s in
the
upp
er q
uart
ile
of t
he R
&D
cap
ital
to
repo
rted
boo
k va
lue
rati
o, (
RD
C/B
V),
, na
mel
y fi
rms
wit
h a
rela
tive
ly
larg
e es
tim
ated
R&
D c
apit
al.
t~

128 B. Lev, 72 Sougiannis / Journal ()['Accounting and Economics 21 (1996) 107 138
coefficients of the earnings misstatement, X c - Xie~, are substantially larger than those of reported earnings. For example, in row 1, the mean coefficient of X c - X~ is 2.030, almost twice as large as the earnings level coefficient, 1.114. In the price regressions (rows 7 and 8), the coefficients of X c - X~ are roughly 50 percent larger than the earnings coefficients. Since X~I - X~ is equal to the net (of amort izat ion) annual investment in R&D, the large regression coefficients attest to the high value placed on this investment by investors. Such a high value accords with a major theme of this study, namely that R & D investment contributes, on average, to future earnings and cash flows. When the estimated R & D capital (RDCi, = BV~I -- BV~,) is included in the price regressions (rows 9-10), it too is highly statistically significant. Thus, both the annual net invest- ment in R & D and the cumulated R & D capital are value-relevant to investors. 18
Our sample is large (about 1,300 companies in Table 4) and therefore contains a fair number of firms with relatively small R & D expenditures, potentially distort ing the above findings. Accordingly, we add a focus on firms with relatively large R & D investment by ranking all sample firms in every year by their R & D capital- to-equity values (i.e., R D C , / B V ~ ) , and running the price and return regressions over firms in the upper quartile of this ranking. Estimates of these regressions are reported in rows 2, 4, 6, 8, and 10 in Table 4. It is evident that, in the returns regressions (rows 2, 4, 6), the coefficients of the earnings misstatement, X~I - X~, for intensive R & D capital firms are larger and more significant than the corresponding total sample coefficients. Furthermore, in the two cases where the coefficient of X c - X~ for the total sample are statistically insignificant (regressions 5 and 9), the coefficients of the same variable for firms with large R & D capital (rows 6 and 10) are highly significant.
5.3. A survivorship bias?
Can the positive and statistically significant association between the R & D capitalization values and both stock prices and returns (Table 4) be driven by a sample selection bias? Could these results be due to our sample consisting of firms which were ex post successful in their R & D activities'? We think not.
First, our main source of data, the R & D Master File (Section 2) was compiled from successive C O M P U S T A T tapes, starting with 1978. Accordingly, firms
~STo examine whether the earnings and book value adjustments for R&D capitalization just proxy for expected growth, we reran the regressions in Table 4, adding to the independent variables the beginning-of-year market-to-book ratio, which reflects investors' expected growth (used by Collins and Kothari, 1989). The addition of this ratio decreases to some extent the coefficient of the earnings misstatement, c X~, Xi,, but the latter remains statistically significant (at the 0.01 level). For example, in regression 1 (Table 4), the earnings misstatement coefficient is 2.030 (t - 4.14). When the market-to-book ratio is added to that regression, the earnings misstatement coefficient is 1.294 (t 3.07).
B. Lev, "12 Sougiannis / Journal o f Accounting and Economics 21 (1996) 107 138 129
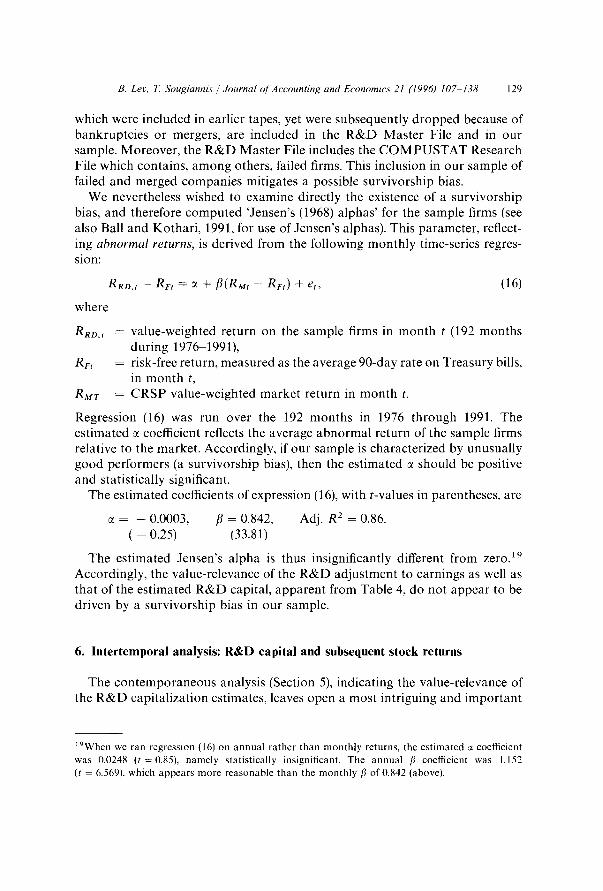
which were included in earlier tapes, yet were subsequently dropped because of bankruptcies or mergers, are included in the R&D Master File and in our sample. Moreover, the R&D Master File includes the C O M P U S T A T Research File which contains, among others, failed firms. This inclusion in our sample of failed and merged companies mitigates a possible survivorship bias.
We nevertheless wished to examine directly the existence of a survivorship bias, and therefore computed 'Jensen's (1968) alphas' for the sample firms (see also Ball and Kothari , 1991, for use of Jensen's alphas). This parameter, reflect- ing a b n o r m a l re turns , is derived from the following monthly time-series regres- sion:
where
RRD.t
Rv t
RRD. t -- RFt = ~ + fl(R.~tt -- RFt ) + et , (16)
= value-weighted return on the sample firms in month t (192 months during 1976 1991),
= risk-free return, measured as the average 90-day rate on Treasury bills, in month t,
RMT = CRSP value-weighted market return in month t.
Regression (16) was run over the 192 months in 1976 through 1991. The estimated ~ coefficient reflects the average abnormal return of the sample firms relative to the market. Accordingly, if our sample is characterized by unusually good performers (a survivorship bias), then the estimated ~ should be positive and statistically significant.
The estimated coefficients of expression (16), with t-values in parentheses, are
= -- 0.0003, /~ = 0.842, Adj. R 2 = 0.86. ( - 0 .25 ) (33 .81 )
The estimated Jensen's alpha is thus insignificantly different from zero. 19 Accordingly, the value-relevance of the R & D adjustment to earnings as well as that of the estimated R&D capital, apparent from Table 4, do not appear to be driven by a survivorship bias in our sample.
6. Intertemporal analysis: R&D capital and subsequent stock returns
The contemporaneous analysis (Section 5), indicating the value-relevance of the R & D capitalization estimates, leaves open a most intriguing and important
19When we ran regression (16) on annual rather than monthly returns, the estimated ~ coefficient was 0.0248 (t =0.85), namely statistically insignificant. The annual fl coefficient was 1.152 (t - 6.569), which appears more reasonable than the monthly fi of 0.842 (above).

130 B. Let, 7~ Sougiannis / Journal of Accounting and Economics 21 (1996) 107-138
question: Do investors fully recognize the value-relevance of R&D information, when reported or do they only adjust partially for the R&D expensing under GAAP? Such partial adjustment is analogous to the 'post earnings announce- ment drift' (e.g., Bernard and Thomas, 1990), indicating that while investors generally react to unexpected earnings at the announcement date, such reaction is incomplete (an underreaction), as evidenced by the systematic return drifts subsequent to the earnings announcements. The extent (completeness) of inves- tor reaction to new information bears on the efficiency of capital markets and may also have important regulatory implications. For example, if investors are found to over- or underreact to current R&D information, a case can he made for changing the disclosure environment to improve investors' comprehension of the information.
The extent of investors' reaction to R&D information can be examined in an in ter temporal setting, where R&D capitalization estimates based on currently available information are associated with subsequent stock returns. A signifi- cant association may suggest an incomplete contemporaneous adjustment to R&D information. We examine this association within a model recently used by Fama and French (1992), where stock returns were regressed on lag.qed values of the following fundamentals: systematic risk (fl), firm size (market capitalization), the book- to-market ratio, financial leverage, and the earnings-to-price ratio. We add to these fundamentals the firm's estimated R&D capital scaled by its market value. Evaluating the relation between returns and lagged R&D capital within this model assures that the R&D variable does not proxy for other risk or mispricing variables (e.g., the book- to-market or the price-to-earnings ratios) present in the analysis. Accordingly, we estimate the following cross-sectional regression:
Ri. t+j = Co,j + cl.~[3i.t + c2 . i l n (M) i . , + c3 .~ ln (B /M) i . t + c4 , j l n (A /B) i , ,
+ cs . j (E ( + ) /m)i , t + c 6 . ) ( E / M dummy)i , t
+ c 7 , ; l n ( R D C / M ) i t + ei,t+j, (17)
where
Ri, t+j
mi , t
(B /M) , , ,
= returns: monthly stock returns of firm i, starting with the 7th month after fiscal t year-end, j = 1, . . . , 12,
= risk: CAPM-based beta of firm i, estimated from 60 monthly stock returns up to month t (one month preceding the return calculation); a minimum of 24 months is required,
= size: market value of firm i, calculated as price times number of shares outstanding at t,
= book- to-marke t : ratio of book value of common equity plus deferred taxes to market value of equity of firm i at fiscal year-end,
B. Lev. 7~ Sougiannis / Journal of Accounting and Economics 21 (1996) 107 138 131
( A / B k t = leverage: ratio of book value of total assets to book value of c o m m o n equity of firm i at fiscal year-end,
[E( + )/M]i. t = earnings~price ratio: ratio of positive earnings before extra- ordinary items (plus income-statement deferred taxes, minus preferred dividends), to the market value of equity of firm i at fiscal year-end; this variable is set equal to 0 when earnings are negative,
( E l M dummy)i,t = 1 if earnings of firm i for fiscal t are negative, and 0 otherwise, ( R D C / M k ~ = R & D capital: estimated R & D capital [expression (8)] over
market value of equity at year-end.
The following time-line clarifies the inter temporal regressions:
Disclosure Fiscal of Subsequent year t financials returns
I I I I 1 12 18 30
Months
The account ing fundamentals book value, earnings, total assets, and R & D capital (RDC) pertain to fiscal year t (months 1-12). Six months (13 18) are then allowed for the public disclosure of fiscal t annual financial statements by all sample firms, followed by 12 month ly stock returns, Ri,,+j (months 19 30). For each of the 15 fiscal years examined in this analysis (1975 1989), we run regression (17) cross-sectionally for each of the subsequent 12 return months. 2° In total, 180 cross-sectional regressions were computed (15 years x 12 regres- sions per year). 21
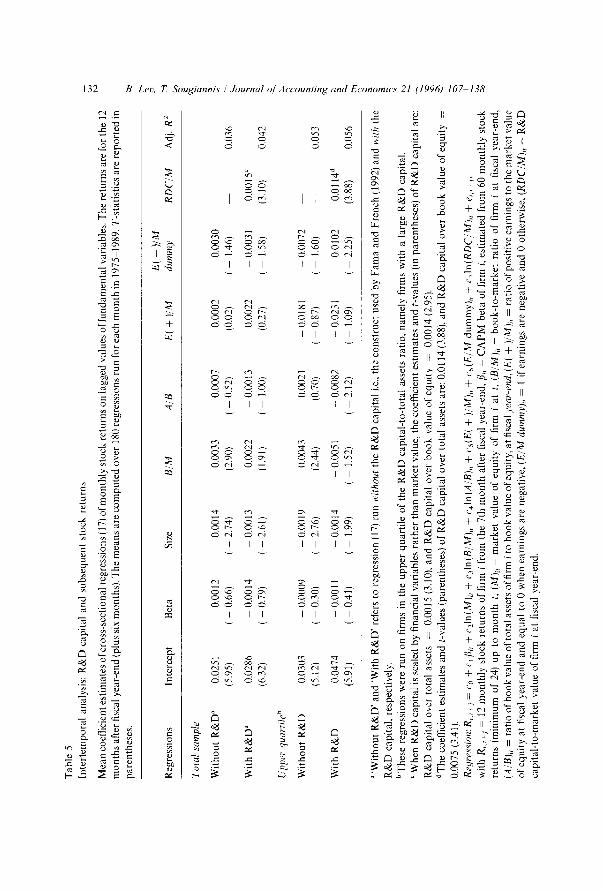
Table 5 reports mean coefficient estimates of expression (17) over the 180 months, for the total sample (top panel) and for the firms in the upper quartile of the R & D capital- to-total assets ranking (i.e., firms with a relatively large R & D investment). The first row of coefficients in each panel is generated by a replica- tion of the F a m a - F r e n c h (1992) analysis, namely regression (17) without the R & D variable. This was aimed at examining the conformity of our sample of R & D firms with the C O M P U S T A T popula t ion ( F a m a - F r e n c h sample), with respect to the returns fundamentals ' relation. It is evident from Table 5 that
2°In the preceding analyses we examined the years 1975 1991. Here we stop in 1989, since we need stock returns for 1 1/2 years subsequent to each fiscal year. 2~Note that these regressions are not run on overlapping months. For example, for the fiscal year ending in December 1980, the returns range from July 1981 through June 1982. The following fiscal year, ending December 1981, is associated with the nonoverlapping returns starting in July 1982 and ending in June 1983. The numbers of sample firms in each cross-sectional regression ranges between roughly 900 in the earlier sample years (the 1970s) to 1,500 in the latter period.
Tab
le 5
In
tert
empo
ral
anal
ysis
: R
&D
cap
ital
and
sub
sequ
ent
stoc
k re
turn
s
Mea
n c
oeff
icie
nt e
stim
ates
of c
ross
-sec
tion
al r
egre
ssio
ns (1
7) o
f m
on
thly
sto
ck r
etur
ns o
n la
gged
val
ues
of f
unda
men
tal
vari
able
s. T
he r
etur
ns a
re f
or t
he 1
2
mo
nth
s af
ter
fisc
al y
ear-
end
(plu
s si
x m
onth
s).
The
mea
ns a
re c
om
pu
ted
ove
r 18
0 re
gres
sion
s ru
n fo
r ea
ch m
on
th i
n 19
75
1989
. T
-sta
tist
ics
are
repo
rted
in
pare
nthe
ses.
E(
- )/
M
Reg
ress
ions
In
terc
ept
Bet
a Si
ze
B/M
A
/B
E(
+ )
/M
dum
my
RD
C/M
A
dj.
R 2
Tot
al s
ampl
e
Wit
ho
ut
R&
D"
Wit
h R
&D
~
Upp
er q
uart
ile b
Wit
ho
ut
R&
D
Wit
h R
&D
0.02
51
-0.0
01
2
(5.9
5)
- 0.
66)
0.02
86
-0.0
01
4
(6.3
2)
-0.7
9)
0.03
03
--0.
0009
(5
.12)
-0
.30
)
0.04
74
- 0.
0011
(5.9
1)
- 0.
41)
-0.0
01
4
0.00
33
-2.7
4)
(2.9
0)
- 0.
0013
0.
0022
-2.6
1)
(1.9
1)
- 0.
0007
0.
0002
- 0.
52)
(0.0
2)
- 0.
0013
0.
0022
-
1.00
) (0
.27)
- 0.
0030
-
1.46
) 0.
036
0.00
31
0.00
15 ~
1.58
) (3
.10)
0.
042
-0.0
01
9
0.00
43
0.00
21
-2.7
6)
(2.4
4)
(0.7
0)
-0.0
01
4
- 0.
0051
-0
.00
82
( -
1.99
) (
- 1.
52)
- 2.
12)
- 0.
0181
(
- 0.
87)
- 0.
0231
( -
1.09
)
- 0.
0072
-
1.60
) --
0.
053
0.01
02
0.01
14 d
2.25
) (3
.88)
0.
056
"'W
ith
ou
t R
&D
' an
d 'W
ith
R&
D'
refe
rs t
o re
gres
sion
(17
) ru
n w
itho
ut t
he R
&D
cap
ital
i.e
., th
e co
nstr
uct
used
by
Fam
a an
d F
renc
h (1
992)
an
d w
ith
the
R&
D c
apit
al,
resp
ecti
vely
. bT
hese
reg
ress
ions
wer
e ru
n on
fir
ms
in t
he u
pper
qua
rtil
e of
the
R&
D c
apit
al-t
o-to
tal
asse
ts r
atio
, na
mel
y fi
rms
wit
h a
larg
e R
&D
cap
ital
.
Wh
en R
&D
cap
ital
is
scal
ed b
y fi
nanc
ial
vari
able
s ra
ther
th
an m
ark
et v
alue
, th
e co
effi
cien
t es
tim
ates
an
d t
-val
ues
(in
pare
nthe
ses)
of
R&
D c
apit
al a
re:
R&
D c
apit
al o
ver
tota
l as
sets
=
0.00
15 (
3.10
), a
nd R
&D
cap
ital
ove
r b
oo
k v
alue
of
equi
ty
= 0.
0014
(2.
95).
d T
he c
oeff
icie
nt e
stim
ates
and
t-v
alue
s (p
aren
thes
es)
of R
&D
cap
ital
ove
r to
tal
asse
ts a
re:
0.0l
14
(3.8
8),
and
R&
D c
apit
al o
ver
book
val
ue o
f eq
uity
=
0.00
75 (
3.41
).
Reg
ress
ion:
Ri.
t+j
- Co
+ c
xfli
, +
c21
n(M
)it
+ c
31n(
B/M
)i,
+ c
41n(
A/B
)ir
+ %
(E(
+ )
/M)i
t --
c6(
E/M
dum
my)
i, +
cT
In(R
DC
/M),
+ e
i.t.
j,
wit
h R
~.,+
j =
12 m
on
thly
sto
ck r
etur
ns o
f fi
rm i
fro
m t
he 7
th m
on
th a
fter
fis
cal
year
-end
, ft
, =
CA
PM
be
ta o
f fi
rm i
, est
imat
ed f
rom
60
mo
nth
ly s
tock
re
turn
s (m
inim
um o
f 24
) up
to
mo
nth
t,
(M)~
, =
mar
ket
va
lue
of e
quit
y of
fir
m i
at
t, (B
/M)~
, -
bo
ok
-to
-mar
ket
ra
tio
of f
irm
i
at
fisc
al y
ear-
end.
(A/B
)~,
= ra
tio
of b
oo
k v
alue
of
tota
l as
sets
of
firm
i t
o b
oo
k v
alue
of
equi
ty,
at f
isca
l fea
r-en
d. (
E(
+ )
/M)~
, =
rati
o of
pos
itiv
e ea
rnin
gs t
o th
e m
ark
et v
alue
of
equ
ity
at f
isca
l ye
ar-e
nd a
nd e
qual
to
0 w
hen
earn
ings
are
neg
ativ
e. (
E/M
dum
my)
~, =
1
if e
arni
ngs
are
nega
tive
an
d 0
oth
erw
ise.
(R
DC
/M)~
, =
R&
D
capi
tal-
to-m
arke
t va
lue
of f
irm
i a
t fi
scal
yea
r-en
d.
B. Lev, T. Sougiannis / Journal of Accounting and Economics 21 (1996) 107-138 133
a close conformity indeed exists: as in Fama-French, the only two variables that are statistically significant are size and the book-to-market ratio. The systematic risk, /~, is in each regression statistically insignificant, as are the remaining fundamentals. Our results are close to Fama-French 's in terms of coeffi- cient sizes. For example, Fama and French report that the average risk premium for the book-to-market factor (the premium per unit of the regression slope of book-to-market), is 0.40 percent per month, while our estimated book-to- market (B/M) coefficient (upper panel of Table 5) is 0.33 percent. Thus, in terms of the returns-fundamentals relation, our sample of science-based companies does not differ much from the total C O M P U S T A T sample.
When the R&D capital-to-market (RDC/M) ratio is included in the regres- sion (second row of each panel), its coefficient is positive and statistically significant (0.0015, t = 3.10) at better than the 0.01 level. This finding is even more pronounced for firms in the upper quartile of the R&D capital-to-total assets ratio, namely those with relatively large R&D capital. The coefficient of R&D capital, 0.0114 (Table 5 bottom row), is about eight times larger than the R&D coefficient for the total sample (0.0015). Given the mean value of RDC/M, 0.327, the regression coefficient of 0.0114 (monthly) translates to an annual return of 4.57%. This is our estimate of the average market mispricing of R&D capital in R&D-intensive companies.
Note that for the upper-quartile firms, the statistical significance of the book- to-market ratio vanishes with the introduction of the R&D capital, while leverage (A/B) and the negative earnings dummy, E( - )/M, become significant. It should also be noted that the association between R&D capital and subsequent returns does not depend on the scaling of the R&D variable by market value. As footnotes c and d to Table 5 indicate, when we scale R&D capital by book value of total assets (A), or by the book value of equity (B), the regression coefficients of R&D capital and their significance level are remarkably close to those in the table} 2
22The R&D capital in expression (17) is based on our estimation procedures described in Sections 2~4. As a comparison, we replaced in (17) that estimate with the sum of R&D outlays in the current and the preceding two years (i.e., RD~t + RDI,,-~ + RDi,,-2). Over our entire sample and time period, this substitution made little difference with respect to the estimated R&D capital (RDC/M) coefficient and its statistical significance. However, when we focus on firms with relatively large R&D capital we obtain substantial differences.
For example, for the firms in the upper quartile of the R&D capital-to-total assets ratio, the estimated RDC/M coefficient based on the sum of the recent three years R&D is 0.0078 (t = 3.01), while the RDC/M coefficient based on the capitalization procedure (Table 5) is 0.114 (t = 3.88). When we focus on the firms in the top decile of the R&D capital-to-total assets ratio, the difference is even more striking. The RDC/M coefficient based on the three-year R&D is statistically insignificant (0.0105, t = 1.20), while that based on the capitalization procedure is large and significant (0.0165, t = 1.85). It appears, therefore, that our R&D estimation procedure yields different and improved results, compared with a mechanistic capitalization, such as the sum of R&D expenditures in the last three years.
134 B. Lev, T Sougiannis / Journal of Accounting and Economics 21 (1996) 10~138
Summarizing, firms' R&D capital was found to be associated with subsequent stock returns. Given the analysis and discussion of Section 5.3, this association does not appear to be due to a survivorship bias. Similarly to other findings of this type (e.g., the book-to-market association with returns in Fama and French, 1992), this association may result from a mispricing of securities, namely inves- tors' underreaction to R&D information, or it may reflect an extra-market risk factor associated with R&D capital (i.e., equilibrium returns). Disentangling these alternative explanations is a major endeavor, obviously beyond the boundaries of this study. Whether the R&D association with subsequent returns indicates mispricing or the existence of an extra-market risk factor, it enhances our conclusion concerning the value-relevance of R&D capitalization.
7. Summary
The following major conclusions can be drawn from the evidence presented above:
1. The R&D capitalization process developed here yields statistically reliable estimates of the amortization rate of the R&D capital. These amortization rates are used to compute firm-specific R&D capital and adjust reported earnings and equity (book) values to reflect the capitalization of R&D.
2. The major outcomes of these adjustments the corrections to reported earnings and book values for R&D capitalization were found to be strongly associated with stock prices and returns, indicating that the R&D capitalization process yields value-relevant information to investors.
3. The estimated R&D capital does not appear to be fully reflected contem- poraneously in stock prices, since R&D capital is associated with subsequent stock returns. This suggests either a systematic mispricing of the shares of R&D-intensive firms (underreaction to R&D information), estimated at an annual rate of 4.57 percent, or that the subsequent excess returns are compensat- ing for an extra-market risk factor associated with R&D.
Taken together, these findings suggest that R&D capitalization yields statis- tically reliable and economically relevant information, contradicting a major tenet of FASB Statement No. 2: 'A direct relationship between research and develop- ment costs and specific future revenue generally has not been demonstrated'.
Appendix
Merck & Co.: Example of the adjustment of earnings and book values for R&D capitalization
Table 6 presents Merck's reported (GAAP) and R&D-adjusted values for the years 1975 1991. The four left-hand columns are derived from Merck's annual
B. Lev, 7~ Sougiannis / Journal of Accounting and Economics 21 (1996) 10 ~138 135
financial reports, while the five columns on the right are the adjusted values reflecting R&D capitalization. These adjustments are based on the procedures described in Sections 2-4 above, and are detailed in the footnotes to Table 6. The detailed computation of Merck's 1991 R&D amortization and its R&D capital, using the Chemicals and Pharmaceutics amortization rates (6k in Table 3) is presented on the bottom part of Table 6.
As expected, Merck's reported earnings and equity values are in every year lower than the corresponding R&D-adjusted values. However, Merck's return on equity (ROE) based on the capitalized numbers (right column) is substan- tially lower than its reported ROE (e.g., 0.40 vs. 0.55 in 1991). This is mainly due to Merck's relatively low growth rate of R&D expenditures less than 20 percent a year during 1987 1991 - compared with about 35 percent average annual growth rate in earnings over that period. In general, R&D-adjusted ROE will be higher than reported (GAAP) ROE when the growth rate of R&D expenditures is sufficiently large.
References
Ball, R. and S.P. Kothari, 1991, Security returns around earnings announcements, The Accounting Review 66, 718 738.
Ben Zion, U., 1978, The investment aspect of nonproduction expenditures: An empirical test, Journal of Economics and Business 30, 224-229.
Berger, P., 1993, Explicit and implicit tax effects of the R&D tax credit, Journal of Accounting Research 31, 131 171.
Bernard, V. and J. Thomas, 1990, Evidence that stock prices do not fully reflect the implications of current earnings for future earnings, Journal of Accounting and Economics 13, 305 340.
Bublitz, B. and M. Ettredge, 1989, The information in discretion outlays: Advertising, research and development, The Accounting Review 64, 108-124.
Chan, S., J. Martin, and J. Kensinger, 1990, Corporate research and development expenditures and share value, Journal of Financial Economics 26, 255 276.
Christie, A., 1987, On cross-sectional analysis in accounting research, Journal of Accounting and Economics 9, 231 258.
Cockburn, 1. and Z. Griliches, 1988, Industry effects and appropriability measures in the stock market's valuation of R&D and patents, American Economic Review 78, 419~423.
Cohen, W. and R. Levin, 1989, Empirical studies of innovation and market structure, in: R. Schmalensee and R. Willig, eds., Handbook of industrial organization, Vol. II (Elsevier Science B.V., Amsterdam).
Cohen, W. and D. Levinthal, 1989, Innovation and learning: The two faces of R&D - Implications for the analysis of R&D investment, Economic Journal 99, 569 596.
Collins, D.W. and S.P. Kothari, 1989, An analysis ofintertemporal and cross-sectional determinants of earnings response coefficients, Journal of Accounting and Economics 12, 143-181.
Daley, M., 1995, The impact of deferred tax allocation on earnings as a measure of firm performance, Ph.D. dissertation (University of Rochester, Rochester, NY).
Dukes, R., 1976, An investigation of the effects of expensing research and development costs on security prices, in: Proceedings of the conference on topical research in accounting (New York University, New York, NY).
Eccher, E., 1995, The value relevance of capitalized software development costs (Northwestern University, Kellogg School of Management, Evanston, IL).
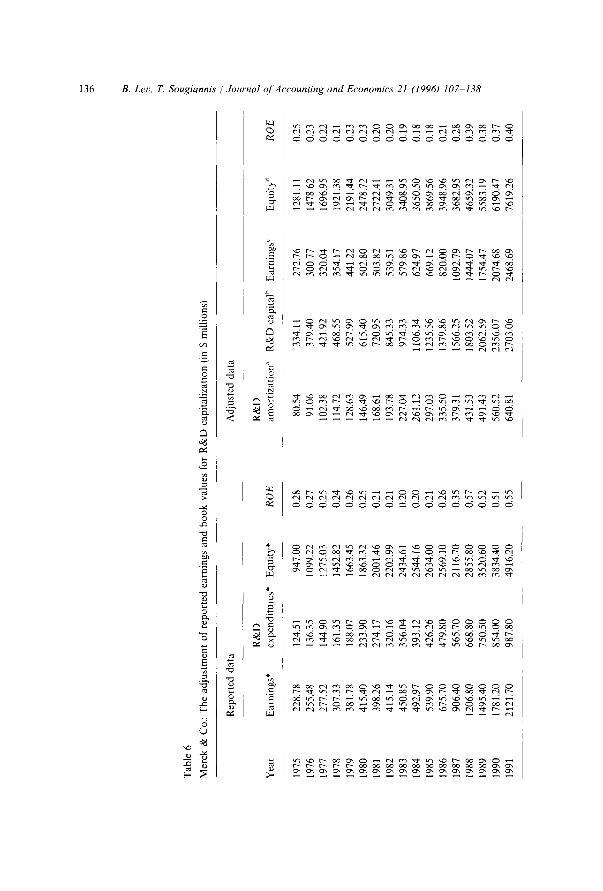
Tab
le 6
Mer
ck &
Co.
: T
he a
djus
tmen
t of
rep
orte
d ea
rnin
gs a
nd b
ook
valu
es f
or R
&D
cap
ital
izat
ion
(in
$ m
illi
ons)
Rep
orte
d da
ta
Adj
uste
d da
ta
R&
D
R&
D
Yea
r E
arni
ngs*
ex
pend
itur
es*
Equ
ity*
R
OE
am
orti
zati
on ~
R
&D
cap
ital
~
Ear
ning
s ~
Equ
ity
d R
OE
1975
22
8.78
12
4.51
94
7.00
0.
28
80.5
4 33
4.11
27
2.76
19
76
255.
48
136.
35
1099
.22
0.27
91
.06
379.
40
300.
77
1977
27
7.52
14
4.90
12
75.0
3 0.
25
102.
38
421.
92
320.
04
1978
30
7.33
16
1.35
14
52.8
2 0.
24
114.
72
468.
55
354.
17
1979
38
1.78
18
8.07
16
63.4
5 0.
26
128.
63
527.
99
441.
22
1980
41
5.40
23
3.90
18
63.3
2 0.
25
146.
49
615.
40
502.
80
1981
39
8.26
27
4.17
20
01.4
6 0.
21
168.
61
720.
95
503.
82
1982
41
5.14
32
0.16
22
03.9
9 0.
21
193.
78
845.
33
539.
51
1983
45
0.85
35
6.04
24
34.6
1 0.
20
227.
04
974.
33
579.
86
1984
49
2.97
39
3.12
25
44.1
6 0.
20
261.
12
1106
.34
624.
97
1985
53
9.90
42
6.26
26
34.0
0 0.
21
297.
03
1235
.56
669.
12
1986
67
5.70
47
9.80
25
69.1
0 0.
26
335.
50
1379
.86
820.
00
1987
90
6.40
56
5.70
21
16.7
0 0.
35
379.
31
1566
.25
1092
.79
1988
12
06.8
0 66
8.80
28
55.8
0 0.
57
431.
53
1803
.52
1444
.07
1989
14
95.4
0 75
0.50
35
20.6
0 0.
52
491.
43
2062
.59
1754
.47
1990
17
81.2
0 85
4.00
38
34.4
0 0.
51
560.
52
2356
.07
2074
.68
1991
21
21.7
0 98
7.80
49
16.2
0 0.
55
640.
81
2703
.06
2468
.69
1281
.11
1478
.62
1696
.95
1921
.38
2191
.44
2478
.72
2722
.41
3049
.31
3408
.95
3650
.50
3869
.56
3948
.96
3682
.95
4659
.32
5583
.19
6190
.47
7619
.26
0.25
0.
23
0.22
0.
21
0.23
0.
23
0.20
0.
20
0.19
0.
18
0.18
0.
21
0.28
0.
39
0.38
0.
37
0.40
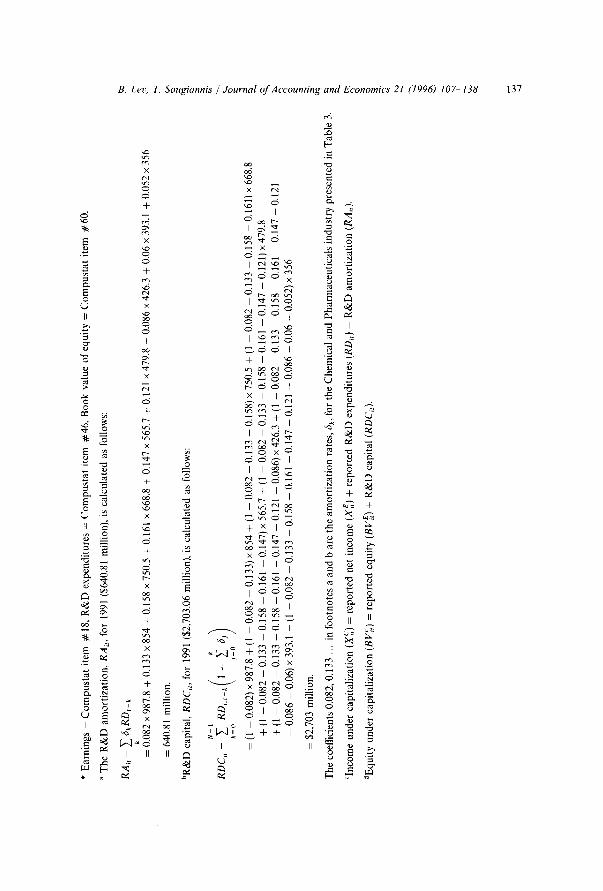
* E
arn
ing
s =
C
om
pu
sta
t it
em
#
18,
R&
D
ex
pe
nd
itu
res
=
Co
mp
ust
at
ite
m
#4
6,
Bo
ok
v
alu
e o
f e
qu
ity
=
Co
mp
ust
at
ite
m
#6
0.
a T
he
R
&D
a
mo
rtiz
ati
on
, R
A,,
fo
r 19
91 (
$6
40
.81
m
illi
on
), i
s c
alc
ula
ted
as
foll
ow
s:
RA
~r =
~
6kR
Dr
k "~
k
t",
=
0.0
82
x 9
87
.8 +
0
.13
3 x
85
4 +
0
.15
8 x
75
0.5
+
0.1
61
x 6
68
.8 +
0
.14
7 x
56
5.7
+
0.1
21
x 4
79
.8 +
0
.08
6 x
42
6.3
+
0.0
6 x
393
.1
+
0.0
52
x 3
56
=
64
0.8
1
mil
lio
n.
bR
&D
cap
ital
, R
DC
,, f
or
1991
($
2,7
03
.06
m
illi
on
), i
s c
alc
ula
ted
as
foll
ow
s:
~.
RD
Ci,
=
~ R
DI,,
k
1--
6;
k=
O
j=O
=
(1 -
0
.08
2)
x 9
87
.8 +
(1
-
0.0
82
-
0.1
33
) x
85
4 +
(1
-
0.0
82
-
0.1
33
--
0.1
58
) x
75
0.5
+
(1 -
- 0
.08
2 -
0
.13
3 -
0
.15
8 -
- 0
.16
1)
x 6
68
.8
+
(1 -
0
.08
2 -
0
.13
3 -
0
.15
8 -
0
.16
1
-- 0
.14
7)
x 5
65
.7 +
(1
-
0.0
82
--
0.1
33
-
0.1
58
-
0.1
61
--
0.1
47
--
0.1
21
) x
47
9.8
+
(1 -
- 0
.08
2 -
0
.13
3 -
0
.15
8 -
0
.16
1
- 0
.14
7 -
0
.12
1
- 0
.08
6)
x 4
26
.3 +
(1
--
0.0
82
-
0.1
33
-
0.1
58
--
0.1
61
-
0.1
47
--
0.1
21
~-
- 0
.08
6 -
0
.06
) x
393.
1 +
(1
-
0.0
82
-
0.1
33
-
0.1
58
-
0.1
61
-
0.1
47
-
0.1
21
-
0.0
86
-
0.0
6 -
0
.05
2)
x 3
56
!
=
$2
,70
3
mil
lio
n.
5"
c~
Th
e c
oef
fici
ents
0.0
82
, 0
.13
3
...
in f
oo
tno
tes
a a
nd
b a
re t
he
am
ort
iza
tio
n r
ates
, 6 k
, fo
r th
e C
he
mic
al
an
d
Ph
arm
ac
eu
tic
als
in
du
stry
pre
sen
ted
in
Ta
ble
3.
Cln
com
e u
nd
er
ca
pit
ali
za
tio
n (
X c
) =
re
po
rte
d
net
in
co
me
(X
~)
+
rep
ort
ed
R
&D
e
xp
en
dit
ure
s (R
D,)
-
R&
D
am
ort
iza
tio
n (R
A,)
.
dE
qu
ity
un
de
r c
ap
ita
liz
ati
on
(B
V~t
) =
rep
ort
ed
e
qu
ity
(B
V~)
+ R
&D
c
ap
ita
l (R
DC
,).
Ixa 2, -...1

138 B. Lev, T. Sougiannis / Journal of Accounting and Economics 21 (1996) 107-138
Elliott, J., G. Richardson, T. Dyckman, and R. Dukes, 1984, The impact of SFAS No. 2 on firm expenditures on research and development: Replications and extensions, Journal of Accounting Research 22, 85--102.
Evenson, R. and Y. Kislev, 1976, A stochastic model of applied research, Journal of Political Economy 84, 265 281.
Fama, E. and K. French, 1992, The cross-section of expected stock returns, Journal of Finance 47, 427 465.
FASB (Financial Accounting Standards Board), 1974, Accounting for research and development costs, Statement of Financial Accounting Standards No. 2.
FASB, 1985, Accounting for the costs of computer software to be sold, leased, or otherwise marketed, Statement of Financial Accounting Standard No. 86.
Grabowski, H. and D. Mueller, 1978, Industrial research and development, intangible capital stocks, and firm profit rates, Bell Journal of Economics 9, 328 343.
Griliches, Z. and J. Mairesse, 1990, R&D and productivity growth: comparing Japanese and U.S. manufacturing firms, in: C. Hulten, ed., Productivity growth in Japan and the United States (University of Chicago Press, Chicago, lk) 317-348.
Hall, B., 1993a, New evidence on the impacts of research and development (University of California, Berkeley, CA).
Hall, B., 1993b, The stock market value of R&D investment during the 1980s, American Economic Review 83, 259 264.
Hall, B., C. Cummins, E. Laderman, and J. Mundy, 1988, The R&D master file documentation, NBER technical working paper no. 72, updated to 1990 in NBER working paper no. 3366, May 1990.
Hirschey, M. and J. Weygandt, 1985, Amortization policy for advertising and research and develop- ment expenditures, Journal of Accounting Research 23, 326 335.
Horwitz, B. and R. Kolodny, 1981, The FASB, the SEC and R&D, Bell Journal of Economics 12, 249-262.
Johnston, J. 1984, Econometric methods, 3rd ed. (McGraw-Hill, New York, NY). Kothari, S. and J. Zimmerman, 1995, Price and return models, Journal of Accounting and Eco-
nomics 20, forthcoming. Lev, B. and R. Thiagarajan, 1993, Fundamental information analysis, Journal of Accounting
Research 31, 190-215. Levin, R., K. Klevorick, R. Nelson, and S. Winter, 1987, Appropriating the returns from industrial
R&D, Brookings Papers on Economic Activity, 783 820. Lichtenberg, F. and D. Siegel, 1989, The impact of R&D investment on productivity: New evidence
using linked R&D LED data, NBER working paper no. 2901. Maddala, G., 1992, Introduction to econometrics, 2nd ed. (Macmillan, New York, NY). Mairesse, J. and M. Sassenou, 1991, R&D and productivity: A survey of econometric studies at the
firm level, NBER working paper no. 3666. Mansfield, E., 1986, Patents and innovation: An empirical study, Management Science 32, 173 181. Mowery, D., 1983, The relationship between intrafirm and contractual form of industrial research in
American manufacturing, 190(~1940, Explorations in Economic History 20, 351 374. Nadiri, I. and I. Prucha, 1992, Estimation of the depreciation rate of physical and R&D capital in the
U.S. total manufacturing sector (New York University, New York, NY). Pakes, A., 1985, On patents, R&D, and the stock market rate of return, Journal of Political
Economy 93, 39(L409. Peles, Y., 1970, Amortization of advertising expenditures in the financial statements, Journal of
Accounting Research 8, 128137. Wasley, C. and T. Linsmeier, 1992, A further examination of the economic consequences of SFAS
No. 2, Journal of Accounting Research 30, 156 164. Woolridge, R., 1988, Competitive decline and corporate restructuring: Is a myopic stock market to
blame?, Journal of Applied Corporate Finance 1, 26 36.