Embed Size (px)
Citation preview

Spillovers from public intangibles
C. Corrado, (The Conference Board), New YorkJ. Haskel, (Imperial College Business School, CEPR and IZA), London
C. Jona-Lasinio, (LUISS Lab and ISTAT), Rome
OECD Blue Skies Conference, September 2016. All papers referred to atwww.spintan.net
www.spintan.net has received funding from the European Union's Seventh Framework
Programme for research, technological development and demonstration under grant agreement
No. 612774
Corrado, Haskel, Jona-Lasinio SPINTAN 1 / 12
Background and non-technical summary
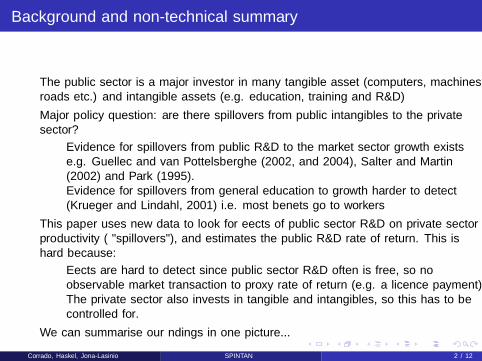
• The public sector is a major investor in many tangible asset (computers, machines,roads etc.) and intangible assets (e.g. education, training and R&D)
• Major policy question: are there spillovers from public intangibles to the privatesector?
• Evidence for spillovers from public R&D to the market sector growth existse.g. Guellec and van Pottelsberghe (2002, and 2004), Salter and Martin(2002) and Park (1995).
• Evidence for spillovers from general education to growth harder to detect(Krueger and Lindahl, 2001) i.e. most bene�ts go to workers
• This paper uses new data to look for e�ects of public sector R&D on private sectorproductivity ( "spillovers"), and estimates the public R&D rate of return. This ishard because:
• E�ects are hard to detect since public sector R&D often is free, so noobservable market transaction to proxy rate of return (e.g. a licence payment)
• The private sector also invests in tangible and intangibles, so this has to becontrolled for.
• We can summarise our �ndings in one picture...
Corrado, Haskel, Jona-Lasinio SPINTAN 2 / 12
TFP growth and Non-market R&D
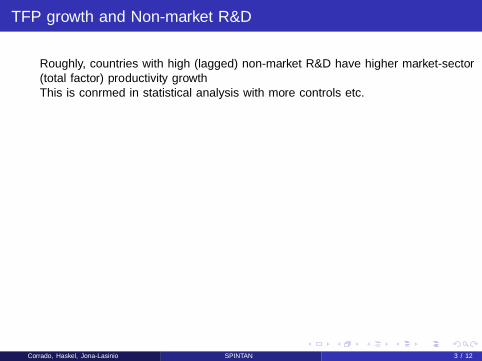
• Roughly, countries with high (lagged) non-market R&D have higher market-sector(total factor) productivity growth
• This is con�rmed in statistical analysis with more controls etc.
ATDE
ES
FI
FR IT
NLSE
UK
US
AT
DE
ES
FI
FR
IT
NL
SE
UK
US
AT
DE
ES
FIFRIT
NL
SE
UKUS
-.01
0.0
1.0
2.0
3
-.06
-.04
-.02
0
-.005
0.0
05.0
1.0
15
0 .005 .01 .015
0 .005 .01 .015
2004-07 2008-09
2010-13
Dln
TFP,
mar
ket s
ecto
r
(Non-market R&D/PqQ) in previous periodGraphs by period
Market sector TFP growth and non-market R&D
Corrado, Haskel, Jona-Lasinio SPINTAN 3 / 12
Exploring spillovers, some details
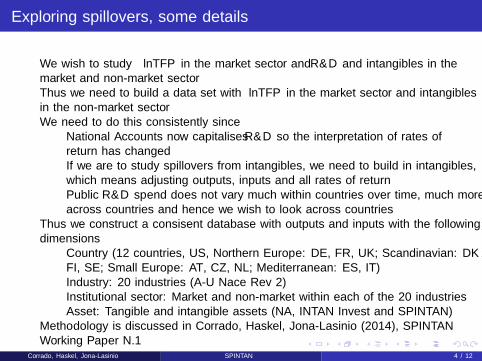
• We wish to study ∆lnTFP in the market sector and R&D and intangibles in themarket and non-market sector
• Thus we need to build a data set with ∆lnTFP in the market sector and intangiblesin the non-market sector
• We need to do this consistently since• National Accounts now capitalises R&D so the interpretation of rates ofreturn has changed
• If we are to study spillovers from intangibles, we need to build in intangibles,which means adjusting outputs, inputs and all rates of return
• Public R&D spend does not vary much within countries over time, much moreacross countries and hence we wish to look across countries
• Thus we construct a consisent database with outputs and inputs with the followingdimensions
• Country (12 countries, US, Northern Europe: DE, FR, UK; Scandinavian: DKFI, SE; Small Europe: AT, CZ, NL; Mediterranean: ES, IT)
• Industry: 20 industries (A-U Nace Rev 2)• Institutional sector: Market and non-market within each of the 20 industries• Asset: Tangible and intangible assets (NA, INTAN Invest and SPINTAN)
• Methodology is discussed in Corrado, Haskel, Jona-Lasinio (2014), SPINTANWorking Paper N.1
Corrado, Haskel, Jona-Lasinio SPINTAN 4 / 12
Exploring spillovers, some details, contd
• To do this we
• Collect output and investment data by year-country-industry-institutionalsector-asset from
national accounts (for output and tangibles) andown-calculations (for non-national accounts intangibles plus splits bysector)
• Build capital stocks and consistent capital rental prices
• Link with EU-KLEMS labour composition data
• Calculate growth accounts
• Look at ∆lnTFP in the market sector and R&D and intangibles in the market andnon-market sector
Corrado, Haskel, Jona-Lasinio SPINTAN 5 / 12
Tangible and intangible investment:(adjusted) value added shares (2013)
There are substantial di�erences in intangible spending between countries...
Corrado, Haskel, Jona-Lasinio SPINTAN 6 / 12
Tangible and intangible investment before and after the crisis:EU vs US
..and intangible spend varies across the cycle..6
.81
1.2
1995 2000 2005 2010 20151995 2000 2005 2010 2015
EU US
Tangible Intangible
Year
Graphs by Country_group
Summed using PPPs, 2007=1Tangible and intangible real investment, EU v US
Corrado, Haskel, Jona-Lasinio SPINTAN 7 / 12
Theory and model
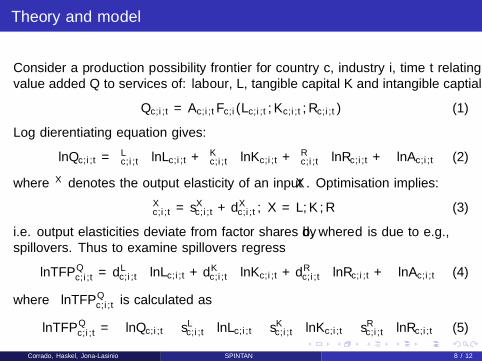
Consider a production possibility frontier for country c, industry i, time t relatingvalue added Q to services of: labour, L, tangible capital K and intangible captial R:
Qc,i,t = Ac,i,tFc,i (Lc,i,t ,Kc,i,t ,Rc,i,t) (1)
Log di�erentiating equation gives:
∆lnQc,i,t = εLc,i,t∆lnLc,i,t + εKc,i,t∆lnKc,i,t + εRc,i,t∆lnRc,i,t + ∆lnAc,i,t (2)
where εX denotes the output elasticity of an input X . Optimisation implies:
εXc,i,t = sXc,i,t + dXc,i,t , X = L,K ,R (3)
i.e. output elasticities deviate from factor shares by d , where d is due to e.g.,spillovers. Thus to examine spillovers regress
∆lnTFPQc,i,t = dL
c,i,t∆lnLc,i,t + dKc,i,t∆lnKc,i,t + dR
c,i,t∆lnRc,i,t + ∆lnAc,i,t (4)
where ∆lnTFPQc,i,t is calculated as
∆lnTFPQc,i,t = ∆lnQc,i,t − sLc,i,t∆lnLc,i,t − sKc,i,t∆lnKc,i,t − sRc,i,t∆lnRc,i,t (5)
Corrado, Haskel, Jona-Lasinio SPINTAN 8 / 12
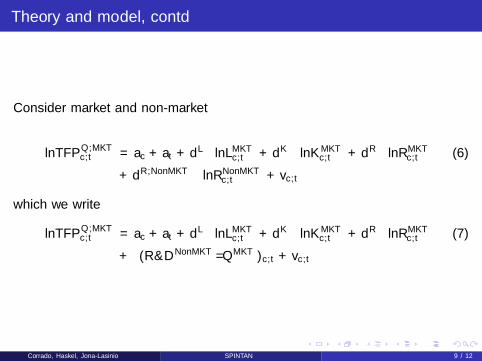
Theory and model, contd
Consider market and non-market
∆lnTFPQ,MKTc,t = ac + at + dL∆lnLMKT
c,t + dK∆lnKMKTc,t + dR∆lnRMKT
c,t (6)
+ dR,NonMKT∆lnRNonMKTc,t + vc,t
which we write
∆lnTFPQ,MKTc,t = ac + at + dL∆lnLMKT
c,t + dK∆lnKMKTc,t + dR∆lnRMKT
c,t (7)
+ ρ(R&DNonMKT/QMKT )c,t + vc,t
Corrado, Haskel, Jona-Lasinio SPINTAN 9 / 12
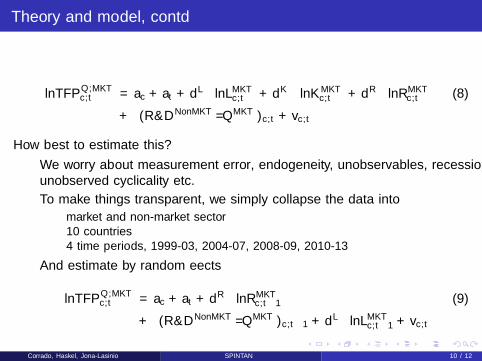
Theory and model, contd
∆lnTFPQ,MKTc,t = ac + at + dL∆lnLMKT
c,t + dK∆lnKMKTc,t + dR∆lnRMKT
c,t (8)
+ ρ(R&DNonMKT/QMKT )c,t + vc,t
How best to estimate this?
• We worry about measurement error, endogeneity, unobservables, recession,unobserved cyclicality etc.
• To make things transparent, we simply collapse the data into
• market and non-market sector• 10 countries• 4 time periods, 1999-03, 2004-07, 2008-09, 2010-13
• And estimate by random e�ects
∆lnTFPQ,MKTc,t = ac + at + dR∆lnRMKT
c,t−1(9)
+ ρ(R&DNonMKT/QMKT )c,t−1 + dL∆lnLMKTc,t−1
+ vc,t
Corrado, Haskel, Jona-Lasinio SPINTAN 10 / 12
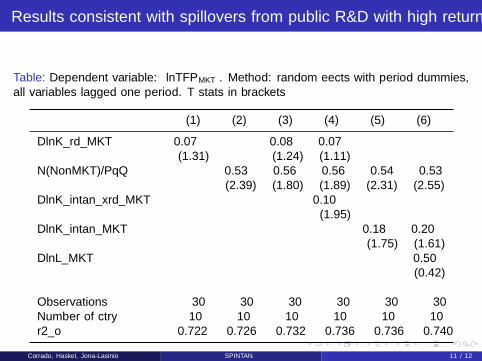
Results consistent with spillovers from public R&D with high return
Table: Dependent variable: ∆lnTFPMKT . Method: random e�ects with period dummies,all variables lagged one period. T stats in brackets
(1) (2) (3) (4) (5) (6)
DlnK_rd_MKT 0.07 0.08 0.07(1.31) (1.24) (1.11)
N(NonMKT)/PqQ 0.53 0.56 0.56 0.54 0.53(2.39) (1.80) (1.89) (2.31) (2.55)
DlnK_intan_xrd_MKT 0.10(1.95)
DlnK_intan_MKT 0.18 0.20(1.75) (1.61)
DlnL_MKT 0.50(0.42)
Observations 30 30 30 30 30 30Number of ctry 10 10 10 10 10 10r2_o 0.722 0.726 0.732 0.736 0.736 0.740
Corrado, Haskel, Jona-Lasinio SPINTAN 11 / 12
Conclusion
• New dataset to look at spillovers from all public intangibles to private sector
• This paper looks for spillovers from public R&D using cross-country data,pooled over 4 year time periods
• Spillovers from market intangibles to market productivity, in line with otherresults
• Spillovers from non-market R&D to market productivity, rates of return arevery high!
• Spillovers take time• Broad thrust of work backed up by time series work
• Further work will make data available and look for more e�ects and rates ofreturn
Corrado, Haskel, Jona-Lasinio SPINTAN 12 / 12