Embed Size (px)
Citation preview

Spillovers from public intangibles
C. Corrado, (The Conference Board), New YorkJ. Haskel, (Imperial College, CEPR and IZA), London
C. Jona-Lasinio, (LUISS Lab and ISTAT), Rome
Society for Economic Measurement Annual Conference6-8 July 2016, Thessaloniki, Greece
This project has received funding from the European Union’s Seventh Framework Programme forresearch, technological development and demonstration under grant agreement No. 612774
Corrado, Haskel, Jona-Lasinio SPINTAN 1 / 20

Background
• The public sector is a major investor in many intangible assets (e.g. education,training and R&D), as well as more tangible assets such as roads and telecomsinfrastructure. The analysis of possible public sector spillovers to the private sectortypically looks (in isolation) at three main public sector investments, in
• (a) R&D• (b) education• (c) infrastructure, but there are of course many other assets.
• Spillovers from public R&D to the market sector has been studied for Europe by forexample Guellec and van Pottelsberghe (2002, and 2004), Salter and Martin (2002)and Park (1995).
• One area of spillovers from the Public Sector that has attracted much attention isspillovers from general education to growth (Krueger and Lindahl, 2001; Bassaniniand Scarpetta, 2002; Arnold et al. 2007; Inklaar, Timmer and van Ark, 2008;Dearden, Reed and van Reenen, 2006)
• ......but there are very few studies of possible spillovers from a wider set of publicintangibles to productivity growth.
Corrado, Haskel, Jona-Lasinio SPINTAN 2 / 20

Knowledge based capital in the total economy
2.1 CHS-type Assets
Table 3 summarizes the CHS list of intangibles assets (on the left) and maps them to the public
or nonmarket sector (on the right). As may be seen, two broad categories of public intangible
assets are proposed. One consists of information, scientific, and cultural assets, and the second
is societal competencies. Before we discuss what’s di↵erent across the two columns, let us make
a few points about the similarities. First, while the character of some assets are rather di↵erent
when produced by public institutions, e.g., R&D, brands, and mineral exploration, one may
still draw a correspondence between these assets across sectors. For example, Jarboe (2009)
defines public investments in brand as expenditures for export promotion, tourism promotion,
and consumer product and food and drug safety (i.e, investments in product reputation). The
correspondence for computer software, purchased investments in organizational capital, and
function-specific worker capital (employer-provided training) is of course far closer.
Table 3: Knowledge Capital in a Total Economy
Market Sector Nonmarket Sector
Computerized Information Information, Scientific, and Cultural Assets1 Software 1 Software
2 Databases 2 Open data
Innovative Property3 R&D, broadly defined to 3 R&D, basic and applied science
include all NPD costs
4 Entertainment & artistic originals 4 Cultural and heritage, including
5 Design arch. & eng. design6 Mineral exploration 5 Mineral exploration
Economic Competencies Societal Competencies7 Brands 6 Brands
8 Organizational capital 7 Organizational capital
(a) Manager capital (a) Professional and manager capital(b) Purchased organizational services (b) Purchased organizational services
9 Firm-specific human capital 8 Function-specific human capital(employer-provided training) (employer-provided training)
Note—NPD=New Product Development, including testing and spending for new financial productsand other services development not included in software or conventional science-based R&D.
The circled items are rather di↵erent in a public sector context. Open data refers to in-
formation assets in the form of publicly collected data issued and curated for public use. This
runs the gamut from patent records to demographic statistics and national accounts to geo-
14
Source: Corrado, Haskel, Jona-Lasinio (2014), SPINTAN Working Paper N.1Corrado, Haskel, Jona-Lasinio SPINTAN 3 / 20
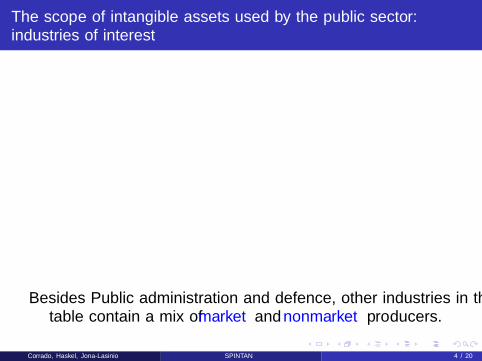
The scope of intangible assets used by the public sector:industries of interest
because these industries contain significant nonmarket production (e.g., federally-run research
laboratories, public parks and museums) in many countries; see table 1 below. The use of “mar-
ket” vs. “nonmarket” groupings of industries is thus not precise because an industry can reflect
activity carried out by a mix of producers, as is evident with NACE Section R and the larger
section of which NACE Section MB is a part.4
Table 1: SPINTAN Industries of Interest
nace nacesection Industry title number
MB Scientific research and development 72O Public administration and defence; compulsory social security 84P Education 85
QA Human health activities 86QB Residential care and social work activities 87-88R Creative, arts and entertainment activities;
libraries, archives, museums and other cultural activities 90-91Gambling and betting activities;
sports activities and amusement and recreation activities 92-93
Note—NACE Rev. 2.
Before we leave the subject of NACE-defined industries, it must be said that in some countries
there are industries with significant government or nonmarket production besides those listed
in table 1. These tend to be industries that engage in activities not germane to our topic areas,
e.g., transportation and homebuilding. On the other hand, there are industries of interest to our
work in SPINTAN that are not listed, e.g., those receiving government R&D subsidies, but such
industries tend to have little nonmarket production other than their own-produced intangible
assets for which we have already accounted.
Industries vs. Institutional Sector. National accountants classify economic activity according
to institutional sectors, not industries. Figure 2 illustrates the relationship between national
account sectors and the nonmarket/market conceptual distinction in a simplified way. The
national accounts nonmarket sector is found above the horizontal line in figure 2 and consists
of general government (GG) and nonprofit institutions serving households (NPISH). The public
sector is found to the left of the vertical line in figure 2 and consists of general governments and
government sponsored enterprises (GSEs).
Investment activities of the general government and nonprofit institutions (NPI) are the
focus of SPINTAN. It is important to recognize that many nonprofit institutions are considered
4Appendix table A1 (page 45) shows the full intermediate structure of NACE Rev. 2.
5
Besides Public administration and defence, other industries in thetable contain a mix of market and nonmarket producers.
Corrado, Haskel, Jona-Lasinio SPINTAN 4 / 20

Aim
The analysis of spillovers from public Non R&D intangibles is a new territory tobe explored looking at all the possible channels trough which market andnonmarket sectors interact. Thus we start investigating:
• the synergies between nonmarket intangibles and business sector productivityperformance and their impact on country’s economic growth.
• complementarity/substitutability between market and nonmarket intangibles• the mechanisms through which nonmarket intangibles spillover to the private
sector exploring the relation between market sector TFP growth and differentmeasures of public sector knowledge creation using a cross-country-industryeconometric analysis.
Corrado, Haskel, Jona-Lasinio SPINTAN 5 / 20
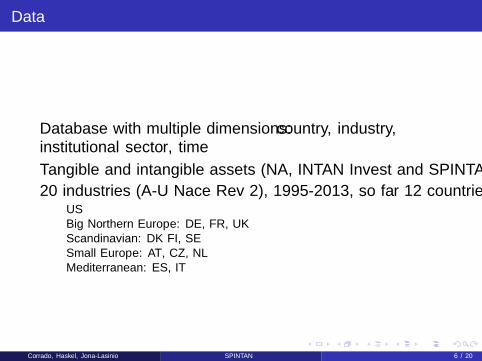
Data
• Database with multiple dimensions: country, industry,institutional sector, time
• Tangible and intangible assets (NA, INTAN Invest and SPINTAN)• 20 industries (A-U Nace Rev 2), 1995-2013, so far 12 countries:
• US• Big Northern Europe: DE, FR, UK• Scandinavian: DK FI, SE• Small Europe: AT, CZ, NL• Mediterranean: ES, IT
Corrado, Haskel, Jona-Lasinio SPINTAN 6 / 20

Labor productivity growth and Market and Nonmarket Intangibles
-.05
0.0
5D
lnH
Q_m
k
-.05 0 .05 .1 .15DlnK_intan_mk
“FR” “DE” “SE” “DK” “FI” “UK” “IT” “ES” “NL” “AT” “US” Fitted values
-.05
0.0
5
-.1 -.05 0 .05 .1DlnK_intan_nm
“FR” “DE” “SE” “DK” “FI” “UK” “IT” “ES” “NL” “AT” “US” Fitted values
-.05
0.0
5D
lnH
Q_m
k
-.05 0 .05 .1DlnK_intan_xrdsf_mk
“FR” “DE” “SE” “DK” “FI” “UK” “IT” “ES” “NL” “AT” “US” Fitted values
-.05
0.0
5
-.2 -.1 0 .1 .2DlnK_intan_xrdsf_nm
“FR” “DE” “SE” “DK” “FI” “UK” “IT” “ES” “NL” “AT” “US” Fitted values
Labor productivity vs Market and Nonmarket Intangibles
Corrado, Haskel, Jona-Lasinio SPINTAN 7 / 20
Market and Nonmarket Intangibles and ICT:complements or substitutes?
-.05
0.0
5.1
.15
Dln
K_in
tan_
mk
-.1 -.05 0 .05 .1 DlnK_intan_nm
“FR” “DE” “SE” “DK” “FI” “UK” “IT” “ES” “NL” “AT” “US” Fitted values
-.05
0.0
5.1
Dln
K_in
tan_
xrds
f_m
k
-.2 -.1 0 .1 .2DlnK_intan_xrdsf_nm
“FR” “DE” “SE” “DK” “FI” “UK” “IT” “ES” “NL” “AT” “US” Fitted values
-.05
0.0
5.1
.15
Dln
K_rd
_mk
0 .05 .1 .15DlnK_rd_nm
“FR” “DE” “SE” “DK” “FI” “ES” “IT” (firstnm) DlnK_rd_mk “NL” “AT” “US”
0.0
5.1
.15
.2.2
5D
lnK_
ICT_
isf_
mk
-.1 0 .1 .2 .3DlnK_ICT_isf_nm
“FR” “DE” “SE” “DK” “FI” “UK” “IT” “ES” “NL” “AT” “US” Fitted values
Market and Nonmarket Intangibles
Corrado, Haskel, Jona-Lasinio SPINTAN 8 / 20
TFP vs Market and Nonmarket Intangibles
-.1-.0
50
.05
Dln
_TFP
-.05 0 .05 .1 .15DlnK_intan_mk
“FR” “DE” “SE” “DK” “FI” “UK” “IT” “ES” “NL” “AT” “US” Fitted values
-.1-.0
50
.05
-.1 -.05 0 .05 .1DlnK_intan_nm
“FR” “DE” “SE” “DK” “FI” “UK” “IT” “ES” “NL” “AT” “US” Fitted values
-.1-.0
50
.05
Dln
_TFP
-.05 0 .05 .1DlnK_intan_xrdsf_mk
“FR” “DE” “SE” “DK” “FI” “UK” “IT” “ES” “NL” “AT” “US” Fitted values
-.1-.0
50
.05
-.2 -.1 0 .1 .2(firstnm) DlnK_intan_xrdsf_nm
“FR” “DE” “SE” “DK” “FI” “UK” “IT” “ES” “NL” “AT” “US” Fitted values
TFP vs Market and Nonmarket Intangibles
Corrado, Haskel, Jona-Lasinio SPINTAN 9 / 20
TFP and Market and Nonmarket R&D and ICT
-.1-.0
50
.05
Dln
_TFP
0 .2 .4 .6 .8DlnK_rd_mk
“FR” “DE” “SE” “DK” “FI” “UK” “IT” “ES” “NL” “AT” “US” Fitted values
-.1-.0
50
.05
0 .05 .1 .15DlnK_rd_nm
“FR” “DE” “SE” “DK” “FI” “UK” “IT” “ES” “NL” “AT” “US” Fitted values
-.1-.0
50
.05
Dln
_TFP
0 .05 .1 .15 .2 .25DlnK_ICT_isf_mk
“FR” “DE” “SE” “DK” “FI” “UK” “IT” “ES” “NL” “AT” “US” Fitted values
-.1-.0
50
.05
-.1 0 .1 .2 .3DlnK_ICT_isf_nm
“FR” “DE” “SE” “DK” “FI” “UK” “IT” “ES” “NL” “AT” “US” Fitted values
TFP vs Market and Nonmarket R&D and ICT
Corrado, Haskel, Jona-Lasinio SPINTAN 10 / 20

Empirical strategy 1
• We extend the time span of our previous work about spilloversfrom market sector intangible capital, where we looked at 10major European countries, over the period 1998-2007 (Corrado,Haskel, Jona-Lasinio, 2014).
• We founded evidence of productivity spillovers to increases inmarket sector intangible capital.
• Our finding of growth spillovers to intangible capital wasrobust to whether R&D is included or excluded and with IV,consistently with an underlying mechanism producing agrowth dividend to investments in non-R&D intangibles.
Corrado, Haskel, Jona-Lasinio SPINTAN 11 / 20
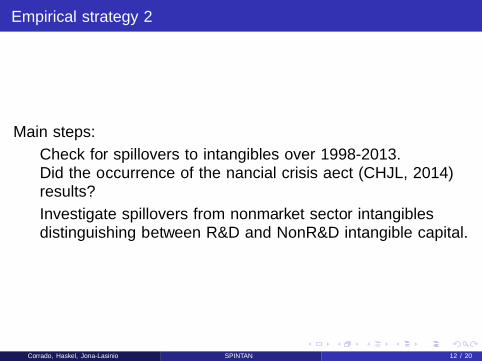
Empirical strategy 2
Main steps:• Check for spillovers to intangibles over 1998-2013.Did the occurrence of the financial crisis affect (CHJL, 2014)results?
• Investigate spillovers from nonmarket sector intangiblesdistinguishing between R&D and NonR&D intangible capital.
Corrado, Haskel, Jona-Lasinio SPINTAN 12 / 20
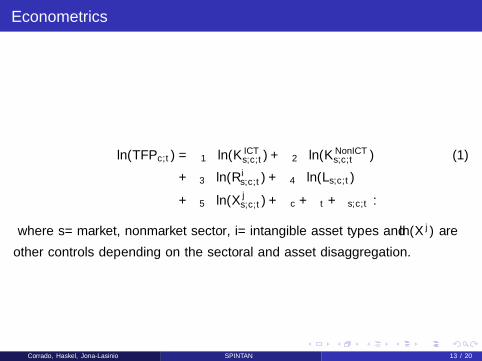
Econometrics
∆ln(TFPc,t) = β1∆ln(K ICTs,c,t) + β2∆ln(KNonICT
s,c,t ) (1)
+ β3∆ln(R is,c,t) + β4∆ln(Ls,c,t)
+ β5∆ln(X js,c,t) + λc + λt + ηs,c,t .
where s= market, nonmarket sector, i= intangible asset types and ∆ln(X j) are
other controls depending on the sectoral and asset disaggregation.
Corrado, Haskel, Jona-Lasinio SPINTAN 13 / 20

Econometric results: 1
(1) (2) (3) (4) (5)VARIABLES
DlnK_NonICT -0.181* -0.207** -0.240** -0.286*** -0.294***(0.108) (0.105) (0.106) (0.104) (0.103)
DlnK_ICT_isf 0.060 0.022 0.021 0.024 0.049(0.042) (0.044) (0.045) (0.042) (0.041)
DlnK_intan 0.177*** 0.172**(0.068) (0.069)
DlnK_intan_xrdsf 0.169*** 0.161***(0.044) (0.043)
DlnK_rd -0.045*(0.023)
LD.DlnK_rd 0.056***(0.021)
D.DlnL -0.066 -0.077(0.065) (0.064)
LD.DlnL 0.023 0.028 0.031(0.063) (0.062) (0.062)
Observations 192 192 192 192 192Numberofctrycode 12 12 12 12 12
Standarderrorsinparentheses***p<0.01,**p<0.05,*p<0.1
DlnTFP
Corrado, Haskel, Jona-Lasinio SPINTAN 14 / 20

Econometric results: 2
(1) (2) (3) (4) (5)
VARIABLES
DlnK_NonICT_mk -0.088 -0.042 -0.038(0.126) (0.161) (0.165)
DlnK_ICT_isf_mk -0.019 -0.060 -0.065 -0.060 -0.059(0.046) (0.051) (0.051) (0.051) (0.052)
DlnK_rd_mk -0.077 -0.114 -0.118 -0.121 -0.118(0.078) (0.086) (0.088) (0.085) (0.086)
DlnK_intan_xrdsf_mk 0.216*** 0.245*** 0.252*** 0.245*** 0.242***
(0.045) (0.047) (0.049) (0.046) (0.047)
DlnL_mk -0.025 -0.005 -0.002 0.005 0.002(0.058) (0.069) (0.069) (0.066) (0.067)
DlnK_rd_nm 0.168** 0.173** 0.165** 0.171**
(0.083) (0.083) (0.083) (0.084)
DlnK_ICT_isf_nm 0.015 0.014 0.014(0.036) (0.035) (0.035)
DlnK_intan_xrdsf_nm -0.025(0.042)
Observations 158 158 158 158 158Numberofctrycode 10 10 10 10 10
Standarderrorsinparentheses
***p<0.01,**p<0.05,*p<0.1
DlnTFP
Corrado, Haskel, Jona-Lasinio SPINTAN 15 / 20
Summing up
• Spillovers from Non R&D market intangibles are identifiedsupporting previous findings (CHJL, 2014)
• Coherently with existing empirical literature (Guellec and vanPottelsberghe (2002, and 2004)) our findings support theexistence of spillovers from nonmarket R&D to market sectorproductivity.
• Correlations between market and nonmarket intangibles arepositive suggesting complementarities more relevant for Non R&Dintangibles.
Corrado, Haskel, Jona-Lasinio SPINTAN 16 / 20

Conclusions Policy challenges
• A primary characteristic of intangible capital, widely supported bygrowth accounting exercises and macroeconomic studies, is to begrowth-promoting.
• This is because intangible investments likely generate spillovers tothe economic system being non-rival and possibly non-excludable.Such spillovers, if they exist, might be within the private sectorand/or between the public and private sector.
• In the light of the prolonged productivity slowdown experienced bymany advanced countries after the financial crisis, it would bevital to know which, if any, public sector intangibles had positivespillovers to the rest of the economy.
Corrado, Haskel, Jona-Lasinio SPINTAN 17 / 20

Backup slides
Corrado, Haskel, Jona-Lasinio SPINTAN 18 / 20
in progress...
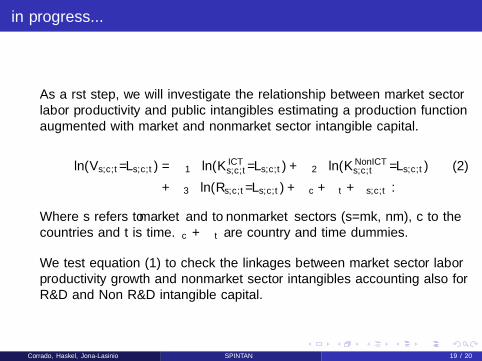
• As a first step, we will investigate the relationship between market sectorlabor productivity and public intangibles estimating a production functionaugmented with market and nonmarket sector intangible capital.
∆ln(Vs,c,t/Ls,c,t) = α1∆ln(K ICTs,c,t/Ls,c,t) + α2∆ln(KNonICT
s,c,t /Ls,c,t) (2)
+ α3∆ln(Rs,c,t/Ls,c,t) + λc + λt + ηs,c,t .
Where s refers to market and to nonmarket sectors (s=mk, nm), c to thecountries and t is time. λc + λt are country and time dummies.
• We test equation (1) to check the linkages between market sector laborproductivity growth and nonmarket sector intangibles accounting also forR&D and Non R&D intangible capital.
Corrado, Haskel, Jona-Lasinio SPINTAN 19 / 20
in progress...
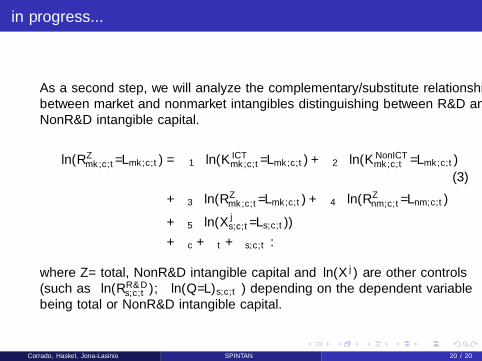
• As a second step, we will analyze the complementary/substitute relationshipbetween market and nonmarket intangibles distinguishing between R&D andNonR&D intangible capital.
∆ln(RZmk,c,t/Lmk,c,t) = β1∆ln(K ICT
mk,c,t/Lmk,c,t) + β2∆ln(KNonICTmk,c,t /Lmk,c,t)
(3)
+ β3∆ln(RZmk,c,t/Lmk,c,t) + β4∆ln(RZ
nm,c,t/Lnm,c,t)
+ β5∆ln(X js,c,t/Ls,c,t))
+ λc + λt + ηs,c,t .
where Z= total, NonR&D intangible capital and ∆ln(X j) are other controls(such as ∆ln(RR&D
s,c,t ),∆ln(Q/L)s,c,t ) depending on the dependent variablebeing total or NonR&D intangible capital.
Corrado, Haskel, Jona-Lasinio SPINTAN 20 / 20