Embed Size (px)
Citation preview

Macroeconomic and Banking Determinants of Financial Intermediation
José Américo Pereira Antunes
Claudio Oliveira de Moraes
Central Bank of Brazil, Brazil Central Bank of Brazil, Brazil
E-mail: [email protected]
E-mail: [email protected]
Postal address: Av. Presidente Vargas, 730 15º andar – Centro – Rio de
Janeiro – Brazil – CEP.: 20.071-900
Postal address: Av. Presidente Vargas, 730 19º andar – Centro – Rio de
Janeiro – Brazil – CEP.: 20.071-900
ABSTRACT This paper investigates the behavior of financial intermediation through the analysis of a panel
of 101 Brazilian banks. For that, we develop a measure that expresses the financ ial intermediation and analyze macroeconomic and banking determinants of financial intermediation. The results indicate an increase in non-performing loans and a tight monetary policy increases financial friction, and then leads to a reduction in financial intermediation.
The results indicate an increase in non-performing loans and a tight monetary policy increases financial friction, and then leads to a reduction in financial intermediation. We also find a negative reaction of financial intermediation to depreciation of exchange. The results remain when the sample is segmented into three non-overlapping periods to isolate the global financial
crisis. Therefore, the financial intermediation measure developed in this study offers the policymakers a possibility to monitor financial stability. Key words : Financial Intermediation; Financial Friction; Financial Stability.
JEL Classification: E44, E58, G38
RESUMO Este trabalho investiga o comportamento da intermediação financeira através da análise de um painel de 101 bancos brasileiros. Para isso, desenvolvemos uma medida que expressa a intermediação financeira e analisa os determinantes macroeconômicos e bancários da
intermediação financeira. Os resultados indicam que um aumento do crédito vencido e a política monetária restritiva aumenta a fricção financeira e, por conseguinte, leva a uma redução na intermediação financeira. Também encontramos uma reação negativa da intermediação financeira à depreciação de câmbio. Os resultados permanecem quando a amostra é segmentada em três períodos de forma a isolar a crise financeira global. Portanto, a medida de intermediação
financeira desenvolvida neste estudo oferece aos formuladores de políticas a possibilidade de monitorar a estabilidade financeira.
Palavras-Chave : Intermediação financeira; Fricção financeira; estabilidade financeira.

1. Introduction
The behavior of financial intermediation is crucial to the understanding of economic
performance (King and Levine, 1993). The global financial crisis (GFC) revealed that the behavior of financial intermediation also plays a central role in maintaining financial stability (Woodford, 2010). The sudden stop of the financial flows to the economy and the consequent credit crunch are aspects that have amplified the effect of the crisis (Calvo, Izquierdo and Talvi, 2006; Mendoza, 2010). Nowadays, one of the
concerns of policymakers is to monitor the behavior of financial intermediation, in order to avoid the outbreak of financial instability events.
Financial intermediation is a solution to the informational problem between the surplus and deficit income units (Leland and Pile, 1977). The absorption by the financial intermediaries of the
information asymmetry in the lender-borrower relationship gives rise to credit risk, which is the potential loss arising from the possibility that a business will fail to fully meet its contractual obligations on time (Guo, 2013). Thus, it is expected that credit default will affect the behavior of financial intermediation performed by banks.
Credit default is also related to financial frictions due to the deterioration of the creditworthiness of borrowers (Adrian, Colla and Shin, 2013). Therefore, increasing credit defaults affect negatively the risks associated to new lending, damaging financial intermediation through the supply of credit. When that happens, banks fail to efficiently intermediate funds for investment and consumption, compromising financial stability. Since financial stability is associated with the continuous process of financial
intermediation carried out by banks, financial frictions pose a threat to the continued process of financial intermediation.
One of the causes of the GFC was the increase in the amount of problem credits in the banks' portfolio. Previously to the crisis, credit risk transfer carried out through financial innovations was believed
to mitigate the impact of delinquency on financial intermediation (Brunnermeier, 2009). The outbreak of the crisis revealed that defaults amplified it and affected financial intermediation to the point where a credit crunch was established (Drehmann, Borio and Tsatsaronis, 2011). Although financial intermediation is the cornerstone of financial stability (Schinasi, 2004; BCBS, 2010), studies that measure financial
intermediation are still rare. The objective of this study is to measure the process of financial intermediation and analyze
the effect of financial frictions on financial intermediation through empirical evidence from the Brazilian experience. In the Brazilian financial system, the main institutions are constituted as universal banks, which
provide a wide range of banking services and with assets exceeding 100 percent of GDP. Relatively to other emerging countries and other Latin American peers, the Brazilian banking system is less globally integrated. Foreign banks control around 17 percent of total assets and 16 percent of deposits, while domestic banks have limited foreign lending and borrowing, around 6 percent of their assets and liabilit ies (IMF, 2012, p. 5). Moreover, to maintain financial stability, the Central Bank of Brazil (CBB) needs to
monitor the regular operation, over time and in any economic scenario, of the system responsible for the financial intermediation among households, non-financial corporations and the government 1 . In this context, the architecture of the Brazilian banking system, as well as the role performed by the CBB in monitoring financial stability, present features that can be useful to analyze the behavior of financial
intermediation and allow one to use variables present in the banking literature (non-performing loan, credit growth, liquidity and bank size) and macroeconomic measures as interest rates, exchange rates and output gap.
In this study, we develop a new variable, financial intermediation flow (FIF) and a new
indicator, financial intermediation (FI), both measures of financial intermediation, using data gathered from the Central Bank of Brazil's (CBB) financial analysis report. Using a dynamic panel data framework that draws on 101 banks (December 2000 to December 2015), we find that a depreciation of exchange rate and an increase in non-performing loans leads to a reduction in financial intermediation. This result holds in
different time frames, such as the pre-crisis period, the crisis period and the post-crisis period. Moreover,
1 For more information, see the Financial Stability Report, October 2017, available at http://www.bcb.gov.br/ingles/estabilidade/2017_10/fsrFullRep.pdf
we also find that a tight monetary policy increases financial friction. This result adds to the debate about the effects of monetary policy on the stability of the financial system (Smets, 2014).
The present study is organized as follows. Section 2 presents a brief literature review. Section
3 describes the data, including the development of the financial intermediation measures, and presents the methodology. In section 4, the results of estimates of the effect of credit risk on financial intermediation are discussed. Section 5 presents the robustness checks. Section 6 concludes.
2 Financial intermediation and credit risk According to Dewatripont and Tirole (1994) and Freixas and Rochet (1997), capital markets
imperfections allow for the emergence of the financial intermediary. The financial intermediary absorbs the frictions arising from information asymmetry and transaction costs present in the lender-borrower relationship. As a consequence, adverse selection and moral hazard arises, as well as credit risk, a central element in the financial intermediation activity.
As Mishkin (1992) points out, adverse selection occurs before the transaction is completed, while moral hazard occurs after the transaction is completed. Adverse selection takes place when bad potential borrowers (worst credit risks) are those most likely to borrow. In such a hostile environment, the lender may choose not to grant credit, even though there are good potential borrowers in the market place.
Another consequence of the difficulty in determining good and bad credit risks is the pricing of projects by the average risk of borrowers. In this case, good potential borrowers will have their projects undervalued and may choose not to borrow. On the other hand, bad potential borrowers will have their projects overvalued and will be stimulated to borrow.
Moral hazard unfolds when the borrower chooses to conduct the business in a way that increases
the likelihood of default after the credit is granted. The borrower has incentives to incur in higher risk activities since, in case of failure, the loss will be shared with the lender. As for the lender, information asymmetry makes it hard to anticipate such behavior and avoid the risk.
Mishkin (2000) resumes the argument of financial intermediation to relate it to crises. Financial intermediation is made possible because it addresses information asymmetry better than capital markets. Therefore a financial crisis is the exacerbation of information asymmetry to such an extent that financial
intermediation is severely compromised or even disrupted. Gertler and Karadi (2011) describe financial intermediation as a process subject to frictions and provide evidence that shocks in the prices of assets reduce the intensity of financial intermediation and may result in bank crises.
In general, the literature on financial intermediation uses balance measures such as the credit-to-GDP ratio as proxies for financial intermediation (Levine, Loayza and Beck, 2000; Beck and Levine
2004). After the GFC, the work of De Moraes and De Mendonça (2016) seeks to express financial intermediation from financial flows.
Regarding the credit risk behavior, Borio, Furfine and Lowe (2001) and Brunnermeier et al. (2009) argue that credit risk is pro-cyclical and amplifies banks' expectations for the economy and the credit market. Thus, the worsening in the expectations of financial intermediaries for the credit market, and the consequent increase in credit risk, may lead to a reduction in financial intermediation.
Previous works in financial stability show a preference for the non-performing loans (NPL) as the credit risk measure (Cardone-Riportella, Samaniego-Medina, and Trujillo-Ponce, 2010 and Barcellos and De Mendonça, 2015). Besides this, Klein (2013) and Horváth and Vasko (2016) establish a direct relationship between NPL and financial instability. However, none of these works analyze the relation between financial intermediation and NPL. This study adds to this debate by proposing a measure of
financial intermediation derived from financial flows. This measure allows one to estimate the role of NPL as a financial friction that can pose a threat to financial intermediation.

3 Data and methodology
3.1 Measuring financial intermediation
There is extensive literature about financial crises. A challenge for that literature is to develop indicators which capture financial overheating and signal potential banking distress over medium-term horizons (BIS, 2016). However, this study focus on day-by-day financial regulators (Central Banks) and
their task to monitor financial intermediation and financial instability risk. As pointed out by De Moraes and De Mendonça (2016), financial instability does not mean crisis, but the process of deviation in the behavior of financial intermediation from the equilibrium, which can build up and cause a disruption in the intermediation system, leading to a crisis. This study builds on this argument and develops a financial intermediation measure which manages to capture the effective financial flows that constitute financial
intermediation. Differently from the extant literature, financial intermediation is not proxied by its consequences, but measured out of its very constituents, namely the financial flows derived from the process of intermediation.
In this study financial intermediation is represented by the actual exchange of financial flows between economic units and financial intermediaries. The measure of financial intermediation used derives
the financial intermediation flow (FIF) from the financial flows of assets and liabilities. From the liabilit ies standpoint, the net cash flow resulting from the entry of new funding and the redemption of existing funding gives rise to the liabilities cash flow (LCF). To determine the LCF, the entry of new funding presents a positive sign, while the redemption of existing funding assumes a negative sign. When the entry of new
funding exceeds the redemption of existing funding, LCF is positive, meaning financial intermediation. Conversely, when the redemption of existing funding exceeds the entry of new funding, the LCF assumes negative values, meaning financial disintermediation, as shown below.
LCF = entry of new funding - redemption of existing funding LCF > 0, financial intermediation
LCF < 0, financial disintermediation
On the other hand, the credit cash flow (CCF) is the net cash flow produced by the proceedings of existing loans and the granting of new loans. To determine the CCF, the proceedings of existing loans present a positive sign, while the granting of new loans assume a negative sign. When proceedings exceed granting, CCF is positive, meaning financial disintermediation. Conversely, when granting exceeds proceedings, CCF assumes negative values, meaning financial intermediation, as shown below.
CCF = proceedings of existing loans - granting of new loans CCF > 0, financial disintermediation CCF < 0, financial intermediation
Because they assume opposite positions in the balance sheet of the financial intermediaries,
since they derive from assets and liabilities, CCF and LCF present opposite signs for financial intermediation and financial disintermediation, as shown in Fig. 1 below.
Assets Liabililities
Financial
Disintermediation
Financial Intermediation
CCF > 0
CCF < 0
LCF > 0
LCF < 0
Financial
Intermediation
Financial Disintermediation
Fig. 1. Graphic scheme of credit cash flow (CCF) and liabilities cash flow (LCF)

The variables CCF and LCF are calculated following the same procedure adopted in the preparation of the statement of cash flows using the indirect method. The statement of cash flows is a mandatory financial statement for all public companies, according to IASB's2 IAS 7 and FASB's3 (SFAS
95). The rationale used assumes that changes in the book balance of any account between two subsequent periods are the result of accounting events (revenues and expenses) and cash flow events (cash flows), according to equation I below.
𝐵𝑜𝑜𝑘 𝐵𝑎𝑙𝑎𝑛𝑐𝑒𝑡 − 𝐵𝑜𝑜𝑘 𝐵𝑎𝑙𝑎𝑛𝑐𝑒𝑡 −1 = +/− 𝐴𝑐𝑐𝑜𝑢𝑛𝑡𝑖𝑛𝑔 𝐸𝑣𝑒𝑛𝑡𝑠𝑡 +/− 𝐶𝑎𝑠ℎ 𝐹𝑙𝑜𝑤 𝐸𝑣𝑒𝑛𝑡𝑠𝑡 (I)
Table 1 below presents the most common accounting and cash flow events used to calculate CCF and LCF.
Table 1
Common accounting and cash flow events used to calculate CCF and LCF
Variable Accounting events Cash flow events
CCF - Accrual of interest - Loan loss provisioning - Loan loss provisions reversals
- Recovery of write-off
- Credit proceedings - Credit granting
LCF - Accrual of interest - Entries of new funding - Redemptions of existent funding
After removing the effects of accounting events on the variation of the book balance, the remaining variation corresponds to the effects of cash flow events (cash flows). Thus, by rewriting equation
I for CCF, the book balance is replaced with credit operations (COp), accounting events are replaced with revenues and expenses, and cash flow events are replaced with credit proceedings and credit granting:
𝐶𝑂𝑝𝑡 − 𝐶𝑂𝑝𝑡 −1 = 𝑅𝑒𝑣𝑒𝑛𝑢𝑒𝑠𝑡 − 𝐸𝑥𝑝𝑒𝑛𝑠𝑒𝑠𝑡 + 𝐺𝑟𝑎𝑛𝑡𝑖𝑛𝑔𝑡 − 𝑃𝑟𝑜𝑐𝑒𝑒𝑑𝑖𝑛𝑔𝑠𝑡 (II)
Rewriting equation II to isolate the cash flow events:
𝑃𝑟𝑜𝑐𝑒𝑒𝑑𝑖𝑛𝑔𝑠𝑡 − 𝐺𝑟𝑎𝑛𝑡𝑖𝑛𝑔𝑡 = − (𝐶𝑂𝑝𝑡 − 𝐶𝑂𝑝𝑡−1) + 𝑅𝑒𝑣𝑒𝑛𝑢𝑒𝑠𝑡 − 𝐸𝑥𝑝𝑒𝑛𝑠𝑒𝑠𝑡 (III)
Finally, replacing the cash flow events with CCF in equation III:
𝐶𝐶𝐹𝑡 = − (𝐶𝑂𝑝𝑡 − 𝐶𝑂𝑝𝑡−1) + 𝑅𝑒𝑣𝑒𝑛𝑢𝑒𝑠𝑡 − 𝐸𝑥𝑝𝑒𝑛𝑠𝑒𝑠𝑡 (IV)
Applying the same procedure to LCF, the book balance in equation I is replaced with liabilit ies,
accounting events with expenses and cash flow events with entries of new funding and redemptions of existing funding.
𝐿𝐶𝐹𝑡 = (𝐿𝑖𝑎𝑏𝑖𝑙𝑖𝑡𝑖𝑒𝑠𝑡 − 𝐿𝑖𝑎𝑏𝑖𝑙𝑖𝑡𝑖𝑒𝑠𝑡−1) − 𝐸𝑥𝑝𝑒𝑛𝑠𝑒𝑠𝑡 (V)
2 International Accounting Standards Board. 3 Financial Accounting Standards Board.

The financial intermediation flow (FIF) 4 combines the credit cash flow (CCF) and the liabilit ies cash flow (LCF), as expressed in equation VI:
𝐹𝐼𝐹𝑡 = (𝐿𝐶𝐹𝑡 − 𝐶𝐶𝐹𝑡 )/2 (VI)
As a result of the rationale adopted, FIF may assume positive, negative or zero values. The situations in which LCF exceeds CCF form the financial intermediation zone, characterized by positive FIF. Conversely, the cases in which CCF exceeds LCF form the financial disintermediation zone,
characterized by negative FIF. When LCF equals CCF, there is a border, a financial non-intermediat ion frontier, where there is neither financial intermediation nor financial disintermediation. Fig. 2 below shows the graphic scheme of the financial intermediation model.
Fig. 2. Financial Intermediation Scheme
Fig. 3 shows the performance of financial intermediation in Brazil, from the perspective of the
financial intermediation flow (FIF), from December 2000 to December 2015. These are aggregate data for
the Brazilian Financial System (BFS) displayed in a six-month moving average. The highlights are events that significantly affected financial intermediation, such as: (1) the period of expansion of the credit market as a result of macroeconomic stability; (2) the global financial crisis, which quickly reversed the trend of expanding financial intermediation; (3) the rapid recovery of the crisis with the government stimulus to
credit through countercyclical policies; and (4) the fall in the GDP and the political crisis that culminated in the impeachment of President Dilma Roussef, and intense financial disintermediation.
In order to convert the FIF measure into an index to be used in the empirical analysis, we divided it by the funding balance and created the financial intermediation index (FI). The funding balance
4 The division by two in equation VI avoids the double counting of the flow of resources in the financial intermediary, since the assumption of financial intermediation is that the funds raised from the surplus units are the same that will be granted to d eficit units.

was used as the denominator of the ratio because it represents the conventional channel through which the resources subject to financial intermediation are taken.
Fig. 3. Performance of the financial intermediation flow (FIF) in Brazil, from December 2000 to December 2015
Note: aggregate monthly data for the Brazilian Financial System, accumulated in a six -month moving average, values in R$
billions. The highlights refer to: (1) t he period of expansion of the credit market as a result of macroeconomic stability; (2)
the great financial crisis, which quickly reversed the trend of expanding financial intermediation; (3) the rapid recovery of
the crisis with the government stimulus to credit through countercyclical policies; and (4) the fall in the GDP and the political
crisis that culminated in the impeachment of President Dilma Roussef, and intense financial disintermediation
3.2 Data
After presenting FI and NPL, this section describes the expected relationship between FI and other variables that most studies take into consideration to explain financial intermediation5.
Regarding the baseline model, the credit portfolio rate of growth (CRED) captures the effects
of the behavior of the credit portfolio on financial intermediation, in accordance with Kasselaki and Tagkalakis (2013). Krishnan and Largay (2000) and Cheng and Holie (2005) point out the high persistence in the behavior of cash flow-based variables, which implies that the present behavior of variables expressing financial flows is not independent of their past behavior. In order to capture this effect, the one-period
lagged dependent variable (FI) was added to the model. Thus, to evaluate the effects of credit risk (NPL) on financial intermediation (FI), the following
general specification was used.
𝐹𝐼𝑖,𝑡 = 𝑓(𝑁𝑃𝐿𝑖,𝑡 , 𝐶𝑅𝐸𝐷𝑖,𝑡 , 𝐹𝐼𝑖,𝑡−1 ,𝑍𝑖,𝑡), (1)
where Z covers mostly financial institutions’ individual characteristics and other stimuli to financial intermediation and sub-index i refers to financial institutions and t to the time periods.
In order to investigate the impact of financial frictions on financial intermediation, panel data models are used. The sample consists of 6161 observations extracted from the balance sheets of 101 banks
for the period from December 2000 to December 2015 (61 quarters). Such information is made available from the CBB through the IF.data system (Selected Information on Supervised Institutions). The analysis ponders well-accepted variables observed in the literature on financial intermediation. As most studies take into account the influence of the interest rate, liquidity and size in the analysis of financial intermediation
we included the following variables in the empirical model:
. 5 See Table A1 (appendix) for sources of data and description of the variables.
- IR (monetary policy interest rate) - It is expected that monetary policy influences on financial intermediation through the risk-taking channel, that is, changes in monetary policy rates affect either risk perceptions or risk-tolerance (Gambacorta, 2009; Borio and Zhu, 2012). The monetary policy interest rate
in Brazil is the Selic interest rate (IR). Following Tabak, Laiz and Cajueiro (2013), we included the Selic rate in the model, to evaluate the effect of monetary policy on financial intermediation and consequently the relationship between monetary policy and financial stability. - SIZE - the natural logarithm of the total assets was used as a proxy for size. The size of financial
intermediaries eases access to funding. As a consequence, larger banks are expected to be more capable of engaging in financial intermediation (Bhagat, Bolton and Lu, 2015). - LIQ (Liquidity) - the variable used to evaluate the effects of liquidity on financial intermediation is the ratio of liquid assets to total assets. The classical theories of microeconomics of banking support the understanding that liquidity risk and financial intermediation are closely linked (Bryant, 1980; Diamond
and Dybvig, 1983). Thereby, keeping a high proportion of liquid assets is compatible with a lower risk appetite and, therefore, with lower financial intermediation (Berrospide, 2013).
As pointed out by Gadanecz and Jayaram (2009), many emerging markets’ banks rely on external funding to support their lending activities, being then important to track the influence of the foreign
sector on domestic financial intermediation. Additionally, the financial intermediation activity is subject to prociclicality. A booming economy leads to a reduction in non-performing loans and spurs financial intermediation. On the other hand, a depressed economy can hinder financial intermediation. Hence to address the effects of the foreign sector and economic activity on financial intermediation, we included the
following variables in the empirical model: - USD - the rate of growth of the US Dollar – Brazilian Real exchange rate captures the effect of the foreign sector on financial intermediation. A devaluation of the domestic currency can harm companies that resort to foreign currency to fund their activities, leading to a reduction in financial intermediation.
- OGAP – this indicator was built from the series of GDP accumulated in 12 months, provided by the CBB. The output gap is obtained by the difference between the GDP series and its long-term trend (Hamilton, 2017). Variations in the economic cycle are expected to affect the financial intermediation activity positively.
Data is gathered from Central Bank of Brazil (financial analysis report) regarding information
of 101 banks from December 2000 to December 2015 with quarterly frequency (Table A2 – appendix – presents the descriptive statistics).
3.3 Methodology
Based on the variables described above, we consider a baseline model and six additional variations to observe a possible effect caused by credit risk on financial intermediation. The baseline model, which is given by
𝐹𝐼𝑖,𝑡 = 𝛽0 + 𝛽1𝑁𝑃𝐿𝑖,𝑡 + 𝛽2𝐶𝑅𝐸𝐷𝑖,𝑡 + 𝛽3𝐹𝐼𝑖,𝑡−1 + 𝜀𝑖,𝑡 (1a)
Where the subscript i = 1, 2, . . ., 101 is the financial institution; t = 1, 2, . . ., 61 is the period,
and εi,t is the disturbance.
The next six models include the variables IR, LIQ, SIZE, USD and OGAP individually and collectively (𝛺i,t , 𝜑i,t , 𝜓i,t,, 𝜃i,t , 𝛷i,t , 𝜐i,t are the disturbances). As a consequence:
𝐹𝐼𝑖,𝑡 = 𝛽4 + 𝛽5𝑁𝑃𝐿𝑖,𝑡 + 𝛽6𝐶𝑅𝐸𝐷𝑖,𝑡 + 𝛽7𝐹𝐼𝑖,𝑡−1+𝛽8𝐼𝑅𝑡 + 𝛺𝑖,𝑡 (1b)
𝐹𝐼𝑖,𝑡 = 𝛽9 + 𝛽10𝑁𝑃𝐿𝑖,𝑡 + 𝛽11𝐶𝑅𝐸𝐷𝑖,𝑡 + 𝛽12𝐹𝐼𝑖,𝑡−1 + 𝛽13𝐿𝐼𝑄𝑖,𝑡 + 𝜑𝑖 ,𝑡 (1c)
𝐹𝐼𝑖,𝑡 = 𝛽14 + 𝛽15𝑁𝑃𝐿𝑖,𝑡 + 𝛽16𝐶𝑅𝐸𝐷𝑖,𝑡 + 𝛽17𝐹𝐼𝑖,𝑡−1 + 𝛽18𝑆𝐼𝑍𝐸𝑖,𝑡 + 𝜓𝑖,𝑡 (1d)
𝐹𝐼𝑖,𝑡 = 𝛽19 + 𝛽20𝑁𝑃𝐿𝑖,𝑡 + 𝛽21𝐶𝑅𝐸𝐷𝑖,𝑡 + 𝛽22𝐹𝐼𝑖,𝑡−1 + 𝛽23𝑈𝑆𝐷𝑖,𝑡 + 𝜃𝑖 ,𝑡 (1e)
𝐹𝐼𝑖,𝑡 = 𝛽24 + 𝛽25𝑁𝑃𝐿𝑖,𝑡 + 𝛽26𝐶𝑅𝐸𝐷𝑖,𝑡 + 𝛽27𝐹𝐼𝑖,𝑡−1 + 𝛽28𝑂𝐺𝐴𝑃𝑖,𝑡 + 𝛷𝑖,𝑡 (1f)
And
𝐹𝐼𝑖,𝑡 = 𝛽29 + 𝛽30𝑁𝑃𝐿𝑖,𝑡 + 𝛽31𝐶𝑅𝐸𝐷𝑖,𝑡 + 𝛽32𝐹𝐼𝑖,𝑡−1+𝛽33𝐼𝑅𝑡 + 𝛽34𝐿𝐼𝑄𝑖,𝑡 + 𝛽35𝑆𝐼𝑍𝐸𝑖,𝑡
+ 𝛽36𝑈𝑆𝐷𝑖,𝑡 + 𝛽37𝑂𝐺𝐴𝑃𝑖,𝑡 + υ𝑖,𝑡
(1g)
Considering that financial intermediation may also influence credit risk, the risk of simultaneity
problem in the analysis and consequently the possibility of endogeneity in the regressions must be
addressed. To account for that, this study does not limit the analysis to the usual OLS methods found in the literature, making use of dynamic panel data analysis (D-GMM and S-GMM). Resorting to instrumental variables and lagged dependent variables lead to the estimation of parameters more consistently, even when endogeneity is present in explanatory variables (Bond, Hoeffler and Temple, 2001).
Blundell and Bond (1998) argue that first-difference GMM presents a bias and low accuracy and Arellano and Bover (1995) agree that the use of lagged levels can generate weak instruments. To deal with that, we used S-GMM to improve the efficiency of the analysis by mitigating the weakness problem in the D-GMM. It’s worth noting that we reported analysis making use of all methods to the extent of
stressing our hypothesis that NPL affects financial intermediation . Finally, in order to confirm the validity of the estimations reported, the test of over-identifying
restrictions (J-test) was used as suggested by Arellano (2003) and tests of first-order (AR1) and second-order (AR2) serial correlation were carried out.
4. Results With the purpose of observing the relationship between the variables used in the model
concerning financial intermediation (FI) and credit risk (NPL), the correlation matrix is presented in Table A3 (see appendix). In particular, it is worth noting that the correlation between the credit risk measure and
the financial intermediation measure indicates opposite behavior. In other words, the negative correlation found between NPL and FI suggests that an increase in the credit risk leads banks to a conservative behavior and reduces financial intermediation.
We present empirical results in Tables 2 and 3. In a general way, the signs and statistical
significance obtained for credit risk remain unchanged in all models. In addition, all GMM regressions accepted the null hypothesis in the Sargan tests (J statistic), which means that the overidentification constraints are valid. Finally, the serial autocorrelation tests (AR (1) and AR (2)) rejected the hypothesis of serial autocorrelation.
The negative sign and statistical significance in all models indicate that an increase in credit risk reduces financial intermediation. This result suggests that deterioration of the credit risk scenario and the consequent increase in non-performing loans reduce the process of financial intermediation and work as a financial friction. An increase in the financial friction of the intermediation activity can be explained
by the banks' forward-looking behavior in view of deterioration in the credit scenario. In addition, the contraction of financial intermediation can result in a liquidity hoarding that leads to a financial crisis (Cornett et al., 2011).
Regarding the credit portfolio behavior, financial intermediation is intensified in the presence of positive changes in the credit portfolio. This result is expected since an increase in credit granting reflects
bank's engagement in financial intermediation activity through the risk-taking channel (Foos, Norden and Weber, 2010).
As for the one-period lagged financial intermediation, the positive sign and the statistical significance reflect the persistence of the financial intermediation activity. The decision to engage in the
credit market is a strategic one, which is materialized by the financial intermediation activity. The result agrees with Cheng and Hollie (2005) who argue that the persistence of cash flows depends on the persistence of the activities from which they result.
The observed result for the FI reaction to monetary policy is consistent with the broad literature
on the subject. The negative sign and the significance of the IR coefficients suggest that the adoption of a more restrictive monetary policy, which implies an increase in the basic interest rate, reduces financial intermediation. The implications of this result reinforce the arguments of Poloz (2015) and Osiński, Seal
and Hoogduin (2013) on the need to articulate monetary policy and financial stability. In a general way, the relationship between liquidity and financial intermediation presents the
expected sign. Entities with a lower proportion of liquid assets engage more intensely in financial intermediation. The result agrees with De Haan and Van den End (2013) who conclude that, in the presence
of a deposit-taking shock, banks react by reducing the origination of new loans, which is equivalent to reducing financial intermediation, and increasing liquid assets.
The positive and significant sign for the relationship between the size of financial institutions (SIZE) and financial intermediation is expected and compatible with the easier access to funding that larger entities enjoy.
The influence of the foreign sector on the financial intermediation activity, captured by the variable USD, presents the expected sign and significance. The devaluation of the domestic currency harms financial intermediation for it makes it difficult for banks to access external funding as well as increases the indebtedness of those companies that rely on foreign funding.
Moreover, the influence of the economic activity on financial intermediation presents the expected sign and significance. The economic cycle affects financial intermediation positively once a booming economy leads to a wider output gap and intensifies financial intermediation.
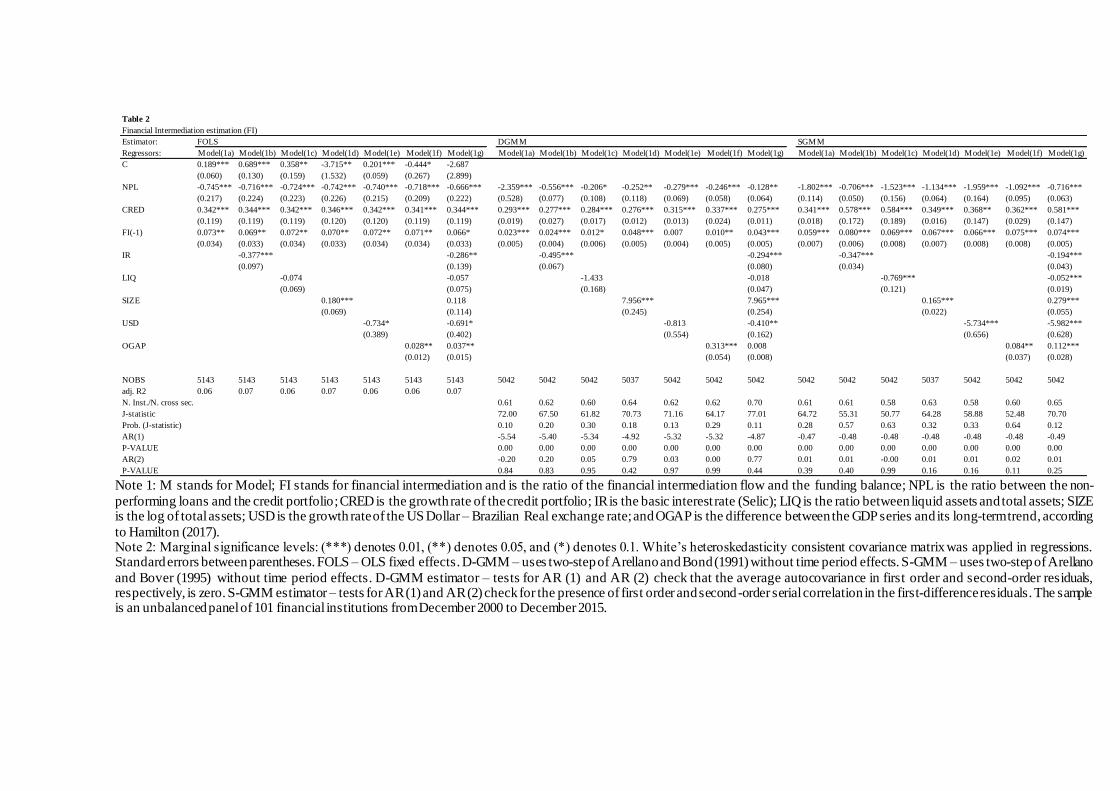
Note 1: M stands for Model; FI stands for financial intermediation and is the ratio of the financial intermediation flow and the funding balance; NPL is the ratio between the non-
performing loans and the credit portfolio; CRED is the growth rate of the credit portfolio; IR is the basic interest rate (Selic); LIQ is the ratio between liquid assets and total assets; SIZE is the log of total assets; USD is the growth rate of the US Dollar – Brazilian Real exchange rate; and OGAP is the difference between the GDP series and its long-term trend, according
to Hamilton (2017). Note 2: Marginal significance levels: (***) denotes 0.01, (**) denotes 0.05, and (*) denotes 0.1. White’s heteroskedasticity consistent covariance matrix was applied in regressions. Standard errors between parentheses. FOLS – OLS fixed effects. D-GMM – uses two-step of Arellano and Bond (1991) without time period effects. S-GMM – uses two-step of Arellano
and Bover (1995) without time period effects. D-GMM estimator – tests for AR (1) and AR (2) check that the average autocovariance in first order and second-order residuals, respectively, is zero. S-GMM estimator – tests for AR (1) and AR (2) check for the presence of first order and second-order serial correlation in the first-difference residuals. The sample is an unbalanced panel of 101 financial institutions from December 2000 to December 2015.
Table 2
Financial Intermediation estimation (FI)
Estimator:
Regressors: Model(1a) Model(1b) Model(1c) Model(1d) Model(1e) Model(1f) Model(1g) Model(1a) Model(1b) Model(1c) Model(1d) Model(1e) Model(1f) Model(1g) Model(1a) Model(1b) Model(1c) Model(1d) Model(1e) Model(1f) Model(1g)
C 0.189*** 0.689*** 0.358** -3.715** 0.201*** -0.444* -2.687
(0.060) (0.130) (0.159) (1.532) (0.059) (0.267) (2.899)
NPL -0.745*** -0.716*** -0.724*** -0.742*** -0.740*** -0.718*** -0.666*** -2.359*** -0.556*** -0.206* -0.252** -0.279*** -0.246*** -0.128** -1.802*** -0.706*** -1.523*** -1.134*** -1.959*** -1.092*** -0.716***
(0.217) (0.224) (0.223) (0.226) (0.215) (0.209) (0.222) (0.528) (0.077) (0.108) (0.118) (0.069) (0.058) (0.064) (0.114) (0.050) (0.156) (0.064) (0.164) (0.095) (0.063)
CRED 0.342*** 0.344*** 0.342*** 0.346*** 0.342*** 0.341*** 0.344*** 0.293*** 0.277*** 0.284*** 0.276*** 0.315*** 0.337*** 0.275*** 0.341*** 0.578*** 0.584*** 0.349*** 0.368** 0.362*** 0.581***
(0.119) (0.119) (0.119) (0.120) (0.120) (0.119) (0.119) (0.019) (0.027) (0.017) (0.012) (0.013) (0.024) (0.011) (0.018) (0.172) (0.189) (0.016) (0.147) (0.029) (0.147)
FI(-1) 0.073** 0.069** 0.072** 0.070** 0.072** 0.071** 0.066* 0.023*** 0.024*** 0.012* 0.048*** 0.007 0.010** 0.043*** 0.059*** 0.080*** 0.069*** 0.067*** 0.066*** 0.075*** 0.074***
(0.034) (0.033) (0.034) (0.033) (0.034) (0.034) (0.033) (0.005) (0.004) (0.006) (0.005) (0.004) (0.005) (0.005) (0.007) (0.006) (0.008) (0.007) (0.008) (0.008) (0.005)
IR -0.377*** -0.286** -0.495*** -0.294*** -0.347*** -0.194***
(0.097) (0.139) (0.067) (0.080) (0.034) (0.043)
LIQ -0.074 -0.057 -1.433 -0.018 -0.769*** -0.052***
(0.069) (0.075) (0.168) (0.047) (0.121) (0.019)
SIZE 0.180*** 0.118 7.956*** 7.965*** 0.165*** 0.279***
(0.069) (0.114) (0.245) (0.254) (0.022) (0.055)
USD -0.734* -0.691* -0.813 -0.410** -5.734*** -5.982***
(0.389) (0.402) (0.554) (0.162) (0.656) (0.628)
OGAP 0.028** 0.037** 0.313*** 0.008 0.084** 0.112***
(0.012) (0.015) (0.054) (0.008) (0.037) (0.028)
NOBS 5143 5143 5143 5143 5143 5143 5143 5042 5042 5042 5037 5042 5042 5042 5042 5042 5042 5037 5042 5042 5042
adj. R2 0.06 0.07 0.06 0.07 0.06 0.06 0.07
N. Inst./N. cross sec. 0.61 0.62 0.60 0.64 0.62 0.62 0.70 0.61 0.61 0.58 0.63 0.58 0.60 0.65
J-statistic 72.00 67.50 61.82 70.73 71.16 64.17 77.01 64.72 55.31 50.77 64.28 58.88 52.48 70.70
Prob. (J-statistic) 0.10 0.20 0.30 0.18 0.13 0.29 0.11 0.28 0.57 0.63 0.32 0.33 0.64 0.12
AR(1) -5.54 -5.40 -5.34 -4.92 -5.32 -5.32 -4.87 -0.47 -0.48 -0.48 -0.48 -0.48 -0.48 -0.49
P-VALUE 0.00 0.00 0.00 0.00 0.00 0.00 0.00 0.00 0.00 0.00 0.00 0.00 0.00 0.00
AR(2) -0.20 0.20 0.05 0.79 0.03 0.00 0.77 0.01 0.01 -0.00 0.01 0.01 0.02 0.01
P-VALUE 0.84 0.83 0.95 0.42 0.97 0.99 0.44 0.39 0.40 0.99 0.16 0.16 0.11 0.25
FOLS DGMM SGMM

The results of the analysis indicate that the worsening in the expectations associated
with the credit market, as evidenced by the non-performing loans (NPL), induce banks to reduce the process of financial intermediation. Hence, a segmented analysis of the sample, in order to isolate the global financial crisis, allows one to assess whether the effect of credit risk on financial intermediation remains unchanged during periods of different risk aversion.
In order to conduct this investigation, the sample was segmented into three non-
overlapping periods: pre-crisis, crisis and post-crisis. In agreement with Antunes, De Moraes and Montes (2016), the crisis period ranges from October 2008 to December 2010, delimit ing the pre-crisis period from December 2000 to September 2008 and the post-crisis period from January 2011 to December 2015.
The analysis adopts the same specifications used previously. The results are presented in Table 3 and indicate that there are no problems of overidentification and serial autocorrelation in the models (observe the statistics J, AR (1) and AR (2)). Considering the relevance of the System Generalized Method of Moments (S-GMM) for this kind of analysis,
the results were limited to this method. The results of the estimation for the pre- and post-crisis periods are similar and
agree broadly with those obtained in the previous analysis. These results are expected because the pre- and post-crisis periods represent the largest subsamples and are characterized by the
predominance of low risk aversion. Therefore it is not surprising that they corroborate the behavior of the whole period.
Crises periods can evolve into financial contagion and involve the break of correlations, according to Kenourgios, Samitas and Paltadilis (2011). Such events are characterized by extreme risk aversion, which leads to a rapid change in the behavior of
correlations. As a consequence, the crisis period is expected to behave differently from the others.

Note 1: M stands for Model; FI stands for financial intermediation and is the ratio of the financial intermediation flow and the funding balance; NPL is the ratio between the non-performing
loans and the credit portfolio; CRED is the growth rate of the credit portfolio; IR is the basic interest rate (Selic); LIQ is the ratio between liquid assets and total assets; SIZE is the log of total assets; USD is the growth rate of the US Dollar – Brazilian Real exchange rate; and OGAP is the difference between the GDP series and its long-term trend, according to Hamilton (2017).
Note 2: The pre-crisis period ranges from December 2000 to September 2008, the crisis period ranges from October 2008 to December 2010 and the post-crisis period ranges from January 2011 to December 2015. Note 3: Marginal significance levels: (***) denotes 0.01, (**) denotes 0.05, and (*) denotes 0.1. Standard errors between parentheses. S-GMM – uses two-step of Arellano and Bover
(1995) without time period effects. S-GMM estimator – tests for AR (1) and AR (2) check for the presence of first order and second-order serial correlation in the first-difference residuals. The sample is an unbalanced panel of 101 financial institutions from December 2000 to December 2015.
Table 3
Financial Intermediation estimation (FI)
Estimator:
Regressors: Model(1a) Model(1b) Model(1c) Model(1d) Model(1e) Model(1f) Model(1g) Model(1a) Model(1b) Model(1c) Model(1d Model(1e) Model(1f) Model(1g) Model(1a) Model(1b) Model(1c) Model(1d) Model(1e) Model(1f) Model(1g)
NPL -0.167** -0.213** -0.245** -1.562*** -2.821*** -1.482*** -1.523** -1.950*** -2.129*** -1.933*** -1.011* -2.111** -1.670** -1.405** -1.258*** -1.199*** -1.038*** -1.202*** -1.054*** -0.987*** -0.831***
(0.076) (0.102) (0.112) (0.289) (0.446) (0.301) (0.281) (0.614) (0.620) (0.594) (0.569) (0.953) (0.751) (0.696) (0.186) (0.192) (0.197) (0.179) (0.178) (0.171) (0.165)
CRED 0.891*** 0.850*** 0.975*** 0.923*** 0.599** 0.832*** 0.939*** 0.066 0.084 0.078 0.205 0.056 0.468 0.355** 0.541** 0.544** 0.625** 0.551** 0.433* 0.525** 0.504*
(0.155) (0.179) (0.148) (0.173) (0.268) (0.304) (0.348) (0.196) (0.206) (0.192) (0.169) (0.200) (0.436) (0.155) (0.266) (0.268) (0.297) (0.263) (0.251) (0.220) (0.263)
FI(-1) 0.099*** 0.080*** 0.091*** 0.063*** 0.031** 0.036* 0.020 0.016 0.011 0.022 0.033 0.024 0.123 0.050 0.078** 0.078** 0.089** 0.082** 0.106** 0.091** 0.097**
(0.012) (0.010) (0.011) (0.015) (0.014) (0.019) (0.019) (0.059) (0.053) (0.056) (0.057) (0.059) (0.089) (0.071) (0.037) (0.037) (0.041) (0.035) (0.043) (0.037) (0.044)
IR -0.814*** -0.046 -2.263*** -4.916 -0.390** -0.116
(0.220) (0.313) (0.743) (6.628) (0.192) (0.384)
LIQ -0.219*** -0.583** -0.127 -2.774 -1.233*** -0.505***
(0.046) (0.272) (0.272) (2.036) (0.144) (0.138)
SIZE 1.205*** 1.057*** 2.644*** 1.539 0.323* 0.414*
(0.140) (0.408) (0.584) (1.424) (0.167) (0.240)
USD -7.466*** -4.262** -2.628* -6.006 -3.020** -0.748
(2.654) (2.172) (1.408) (2.561) (1.360) (2.867)
OGAP 0.704*** 0.279*** 0.240 0.055 0.040*** 0.056***
(0.105) (0.089) (0.544) (0.583) (0.011) (0.014)
NOBS 2352 2352 2352 2352 2352 2352 2352 613 613 613 613 613 613 613 1734 1734 1734 1734 1734 1734 1734
adj. R2
N. Inst./N. cross sec. 0.38 0.40 0.41 0.36 0.35 0.35 0.41 0.10 0.13 0.12 0.11 0.11 0.16 0.17 0.22 0.24 0.24 0.24 0.25 0.26 0.31
J-statistic 32.26 31.26 35.72 28.44 32.50 28.03 36.44 7.35 8.26 7.78 7.37 7.22 15.83 5.98 18.54 18.38 17.95 18.65 18.87 19.43 19.29
Prob. (J-statistic) 0.30 0.40 0.25 0.38 0.17 0.35 0.10 0.28 0.40 0.35 0.28 0.30 0.10 0.54 0.35 0.36 0.39 0.34 0.39 0.42 0.50
AR(1) -0.50 -0.49 -0.49 -0.45 -0.43 -0.43 -0.44 -0.46 -0.46 -0.46 -0.47 -0.47 -0.49 -0.44 -0.49 -0.49 -0.48 -0.49 -0.51 -0.49 -0.50
P-VALUE 0.00 0.00 0.00 0.00 0.00 0.00 0.00 0.00 0.00 0.00 0.00 0.00 0.00 0.00 0.00 0.00 0.00 0.00 0.00 0.00 0.00
AR(2) 0.03 0.02 0.02 -0.01 0.00 -0.00 -0.01 0.02 0.02 0.02 0.04 0.03 0.07 -0.07 -0.00 -0.00 0.02 0.00 0.01 0.00 0.01
P-VALUE 0.10 0.18 0.30 0.48 0.69 0.75 0.35 0.62 0.67 0.66 0.33 0.50 0.14 0.13 0.97 0.98 0.39 0.96 0.51 0.82 0.49
SGMM-PRE-CRISIS SGMM-CRISIS SGMM-POST-CRISIS

The results partially reflect this expectation. The relationships between financial
intermediation and the variables CRED, LIQ, FI(-1) and OGAP maintain the expected sign, but lose significance in the crisis period, revealing the loss of explanatory power of these variables. The relationships between financial intermediation and IR, SIZE and USD maintain the expected sign, but partially lose significance, keeping it just in the individual specification. These results indicate that even in periods of high risk aversion, the behavior of financial
intermediation remains somewhat sensitive to monetary policy, the size of banks and the foreign sector.
In particular, the relationship between financial intermediation and NPL holds even in a period of exacerbation of risk aversion and change of correlations. Indeed, for the models
1a to 1c the magnitude of the NPL coefficients in the crisis period increases sharply in relation to the pre- and post-crisis periods, corroborating the expected amplification of financial frictions during crisis. This result highlights the strength of the relationship between these variables, as well as the importance of monitoring the financial intermediation measure
developed in this study as an additional financial stability management instrument.
5. Robustness analysis The confirmatory analysis of the results excludes state-owned banks from the
sample. After removing the 13 state-owned banks, the sample is reduced to the remaining 88 private banks. The same specifications and methodology of the analysis performed in the previous section are used and the results are presented in Table 4.
The results obtained in the analysis corroborate those presented in the previous section. The relationships between financial intermediation and the explanatory variables
present the same signs and significance. In particular, the relationship between financial intermediation and credit risk is negative and significant when restricting the analysis to private-owned banks. Therefore, the removal of state-owned banks does not affect the analysis.
6. Conclusions This paper investigates the effect of financial frictions on financial intermediation.
Hence, we develop a measure of financial intermediation, which captures the financial flows involved in the intermediation process, and empirically test the effect of non-performing loans
(NPL) on the behavior of financial intermediation (FI) performed by banks. Through the estimation of a dynamic panel of 101 Brazilian banks from December 2000 to December 2015, there is evidence of significant effects between non-performing loans and financial intermediation. Thus, the worsening of the credit risk scenario and the consequent increase in
credit defaults induce the financial system to reduce the financial intermediation activity. Moreover, we identify a relationship between monetary policy and financial intermediation. A tight monetary policy reduces financial intermediation while a loose monetary policy amplifies it.
The results of this study suggest a novel variable, the financial intermediation flow
(FIF), as well as the financial intermediation index (FI), as measures capable of revealing the behavior of financial intermediation. In particular, the effect of the financial friction caused by non-performing loans on the financial intermediation was captured under different time frames and risk aversion scenarios. Therefore, such measures can be used as additional instruments for
the management of financial stability.

Note 1: M stands for Model; FI stands for financial intermediation and is the ratio of the financial intermediation flow and the funding balance; NPL is the ratio between the non-performing
loans and the credit portfolio; CRED is the growth rate of the credit portfolio; IR is the basic interest rate (Selic); LIQ is the ratio between liquid assets and total assets; SIZE is the log of total assets; USD is the growth rate of the US Dollar – Brazilian Real exchange rate; and OGAP is the difference between the GDP series and its long-term trend, according to Hamilton (2017).
Note 2: Marginal significance levels: (***) denotes 0.01, (**) denotes 0.05, and (*) denotes 0.1. White’s heteroskedasticity consistent covariance matrix was applied in regressions. Standard errors between parentheses. FOLS – OLS fixed effects. D-GMM – uses two-step of Arellano and Bond (1991) without time period effects. S-GMM – uses two-step of Arellano and Bover (1995) without time period effects. D-GMM estimator – tests for AR (1) and AR (2) check that the average autocovariance in first order and second-order residuals, respectively, is zero. S-
GMM estimator – tests for AR (1) and AR (2) check for the presence of first order and second-order serial correlation in the first-difference residuals. The sample is an unbalanced panel of 101 financial institutions from December 2000 to December 2015.
Table 4
Financial Intermediation estimation (FI) for the private-owned banks segment
Estimator:
Regressors: Model(1a) Model(1b) Model(1c) Model(1d) Model(1e) Model(1f) Model(1g) Model(1a) Model(1b) Model(1c) Model(1d) Model(1e) Model(1f) Model(1g) Model(1a) Model(1b) Model(1c) Model(1d) Model(1e) Model(1f) Model(1g)
C 0.156** 0.692*** 0.324* -3.937** 0.169*** -0.524* -2.924
(0.061) (0.159) (0.169) (1.655) (0.060) (0.312) (3.110)
NPL -0.765*** -0.761*** -0.744*** -0.781*** -0.760*** -0.736*** -0.715*** -0.254*** -0.529*** -0.215*** -0.234** -0.286*** -0.236*** -0.132* -0.772*** -0.774*** -0.766*** -0.768*** -1.192*** -1.057*** -1.223***
(0.242) (0.255) (0.249) (0.256) (0.240) (0.234) (0.254) (0.058) (0.062) (0.056) (0.107) (0.068) (0.052) (0.068) (0.047) (0.051) (0.051) (0.051) (0.063) (0.091) (0.227)
CRED 0.341*** 0.342*** 0.341*** 0.344*** 0.340*** 0.339*** 0.342*** 0.307*** 0.306*** 0.312*** 0.285*** 0.310*** 0.333*** 0.279*** 0.603*** 0.624*** 0.598*** 0.726*** 0.343*** 0.555** 0.323***
(0.118) (0.118) (0.118) (0.119) (0.119) (0.118) (0.118) (0.016) (0.011) (0.013) (0.009) (0.014) (0.020) (0.008) (0.185) (0.184) (0.178) (0.211) (0.014) (0.222) (0.026)
FI(-1) 0.071** 0.068** 0.070** 0.068** 0.071** 0.070** 0.064* 0.000 0.019*** 0.008* 0.043*** 0.006 0.009* 0.040*** 0.081*** 0.077*** 0.080*** 0.077*** 0.074*** 0.071*** 0.045***
(0.034) (0.033) (0.034) (0.034) (0.034) (0.034) (0.033) (0.004) (0.003) (0.004) (0.004) (0.004) (0.004) (0.004) (0.006) (0.007) (0.006) (0.007) (0.006) (0.008) (0.008)
IR -0.400*** -0.300* -0.576*** -0.371*** -0.387*** -0.733**
(0.113) (0.160) (0.074) (0.088) (0.034) (0.297)
LIQ -0.078 -0.062 -0.328*** -0.004 -0.055*** -0.481***
(0.079) (0.085) (0.058) (0.048) (0.021) (0.081)
SIZE 0.191** 0.129 8.117*** 8.223*** 0.187*** 1.174***
(0.076) (0.123) (0.256) (0.245) (0.030) (0.173)
USD -0.814 -0.766 -2.249*** -0.621*** -0.729*** -7.540***
(0.457) (0.473) (0.559) (0.178) (0.168) (1.046)
OGAP 0.030** 0.038** 0.310*** 0.010 0.123*** 0.382***
(0.014) (0.017) (0.053) (0.009) (0.032) (0.056)
NOBS 4363 4363 4363 4363 4363 4363 4363 4275 4275 4275 4275 4275 4275 4275 4275 4275 4275 4275 4275 4275 4270
adj. R2 0.06 0.06 0.06 0.06 0.06 0.06 0.07
N. Inst./N. cross sec. 0.72 0.73 0.72 0.74 0.72 0.70 0.81 0.68 0.69 0.69 0.69 0.72 0.68 0.70
J-statistic 64.93 70.57 66.85 69.31 70.68 63.37 75.04 54.15 53.58 53.52 54.24 56.96 51.65 55.98
Prob. (J-statistic) 0.30 0.16 0.22 0.21 0.14 0.29 0.14 0.58 0.60 0.60 0.57 0.55 0.63 0.40
AR(1) -5.25 -5.31 -5.29 -4.81 -5.26 -5.27 -4.82 -0.48 -0.48 -0.48 -0.47 -0.49 -0.47 -0.48
P-VALUE 0.00 0.00 0.00 0.00 0.00 0.00 0.00 0.00 0.00 0.00 0.00 0.00 0.00 0.00
AR(2) -0.05 0.12 0.04 0.72 0.10 0.00 0.75 0.01 0.00 0.01 0.00 0.02 0.00 0.02
P-VALUE 0.95 0.90 0.96 0.46 0.91 0.99 0.44 0.47 0.62 0.46 0.97 0.10 0.65 0.18
FOLS DGMM SGMM

Appendix A
Table A.1
Sources of data and description of variables
Variable name Variable description Data source
FI Financial intermediation flow/Liabilities CBB, IF.data, author's calculation
NPL Non-performing loans/Credit portfolio CBB, IF.data, author's calculation
CRED Rate of growth of the credit portfolio CBB, IF.data, author's
calculation
IR Basic interest rate – Selic CBB, SGS
LIQ Liquid assets/Total assets CBB, IF.data, author's
calculation
SIZE Log of total assets CBB, IF.data, author's
calculation
USD Rate of growth of the US Dollar – Brazilian Real exchange rate
CBB, SGS
OGAP Difference between the GDP series and its long-term trend
CBB, SGS
Table A.2
Descriptive statistics
Variables Mean Median Maximum Minimum Standard dev. Observations
FI 0.01 0.02 35.77 -25.81 2.82 5.237
NPL 0.29 0.19 10.00 0.00 0.44 5.237
CRED 0.11 0.03 97.49 -1.12 1.97 5.237
IR 0.13 0.12 0.26 0.07 0.04 5.237
LIQ 0.23 0.20 0.91 0.00 0.15 5.237
SIZE 21.64 21.51 27.96 16.87 2.20 5.237
USD 0.01 -0.00 0.36 -0.15 0.10 5.237
OGAP 0.21 0.21 0.27 0.11 0.03 5.237
Table A.3
Correlation matrix
FI NPL CRED IR LIQ SIZE USD OGAP
FI 1.000
NPL -0.120 1.000
CRED 0.160 -0.039 1.000
IR -0.078 0.063 0.020 1.000
LIQ -0.044 0.080 0.000 0.031 1.000
SIZE 0.036 -0.014 -0.043 -0.184 -0.142 1.000
USD -0.030 0.022 -0.011 -0.052 -0.013 0.028 1.000
OGAP 0.044 -0.097 0.009 0.133 -0.005 -0.056 -0.202 1.000
References
ADRIAN T.; COLLA, P.; SHIN, H. Which Financial Frictions? Parsing the Evidence from the Financial Crisis of 2007 to 2009. NBRE Macroeconomics Annual, v. 27, n. 1, 2013.
ANTUNES, J.A.; DE MORAES, C.; MONTES, G. How does capital regulation react to
monetary policy? New evidence on the risk-taking channel. Economic Modelling, n. 56, p. 177-186, 2016.
ARELLANO, M. Panel data econometrics. Oxford University Press. 2003
ARELLANO, M.; BOND, S. Some tests of specification for panel data: Monte Carlo evidence and an application to employment equations. Review of Economic Studies , v. 58, n. 2, p. 277–297, 1991.
ARELLANO, M.; BOVER, O. Another look at the instrumental variables estimation of error-components models. Journal of Econometrics , v. 68, n. 1, p. 29–51, 1995.
BARCELLOS, V.; DE MENDONÇA, H. Securitization and credit risk: Empirical evidence
from an emerging economy. North American Journal of Economics and Finance , n. 32, p. 12–28, 2015.
BCBS. Guidance for national authorities operating the countercyclical capital buffer, Basel Committee on Banking Supervision. 2010.
BECK, T.; LEVINE, R. Stock markets, banks, and growth: Panel evidence. Journal of Banking & Finance , n. 28, p. 423–442. 2004.
BERROSPIDE, J.M. Bank liquidity hoarding and the financial crises: an empirical evaluation. Fed. Reserve Finance Econ. Discuss. Ser., March 2013. 2013.
BHAGAT, S.; BOLTON, B.; LU, J. Size, leverage, and risk-taking of financial institutions. Journal of Banking & Finance , n. 59, p. 520–537. 2015.
BIS. Bank of International Settlements Quarterly Review, March 2016
BLUNDELL, R.; BOND, S. Initial conditions and moments restrictions in dynamic panel data models. Journal of Econometrics , n. 86, v. 1, p. 115–143. 1998.
BOND, S.; HOEFFLER, A.; TEMPLE, J. GMM estimation of empirical growth models. Economics Papers W21. Economics Group, Nuffield College, University of Oxford. 2001.
BORIO, C.; FURFINE, C.; LOWE. P. Procyclicality of the financial system and financial
stability: issues and policy options. In A. Crockett (coord.). Marrying the macro and micro-prudential dimensions of financial stability. (p. 1-57). Basle: Bank for International Settlements. 2001.
BORIO, C.; ZHU, H. Capital regulation, risk-taking and monetary policy: a missing link in the transmission mechanism? Journal of Financial Stability, v.8, v. 4, n. 236–251. 2012.
BRUNNERMEIER, M. et al. The fundamental principles of financial regulation. Geneva London: International Center for Monetary and Banking Studies Centre for
Economic Policy Research, 2009.
BRUNNERMEIER, M. Deciphering the Liquidity and Credit Crunch 2007–2008. Journal of
Economic Perspectives, v. 23, n. 1, p. 77-100, winter 2009.
BRYANT, J. A Model of Reserves, Bank Runs, and Deposit Insurance. Journal of Banking and Finance , n. 4, p. 335-344. 1980.
CALVO, G.A.; IZQUIERDO, A.; TALVI, E. Sudden Stops and Phoenix Miracles in Emerging Markets. American Economic Review, 96(2), p. 405-410. 2006.

CARDONE RIPORTELLA, C.; SAMANIEGO-MEDINA, R.; TRJILLO-PONCE, A. What
drives bank securitization? The Spanish experience. Journal of Banking and Finance , v. 34, n. 11, p. 2639–2651. 2010.
CHENG, C.S.A.; HOLLIE, D. The Persistence of Cash Flow Components into Future Cash Flows (October 17, 2005).
CORNETT, M.M.; McNUTT, J.J.; STRAHAN, P.E.; TEHRANIAN, H. Liquidity risk
management and credit supply in the financial crisis. J. Financ. Econ., n. 101, p. 297–312, 2011.
DE HAAN, L.; VAN DEN END, J.W. Banks’ responses to funding liquidity shocks: Lending adjustment, liquidity hoarding and fire sales, Journal of International Financial Markets, Institutions and Money, v. 26, issue C, p. 152-174, 2013.
DE MENDONÇA, H.; DE MORAES, C. The bridge between macro and micro banking regulation: a framework from the model of financial flows. Journal of Economic Studies (Bradford), 2016.
DEWATRIPONT, M.; TIROLE, J. The Prudential Regulation of Banks. MIT Press, Cambridge, MA. 1994.
DIAMOND, D.; DYBVIG, P. Bank runs, deposit insurance, and liquidity. Journal of Political Economy, v. 91, n. 3, p. 401–419. 1983.
DREHMANN, M.; BORIO, C.; TSATSARONIS, K. Anchoring countercyclical capital buffers: the role of credit aggregates. International Journal of Central Banking, 189-240. December, 2011.
DREHMANN, M.; JUSELIUS, M. Evaluating early warning indicators of banking crises: Satisfying policy requirements. BIS Working Papers, n. 421, 2014.
FOOS, D.; NORDEN, L.; WEBER, M. Loan growth and riskiness of banks. Journal of Banking & Finance , v. 34. n. 12, p. 2929–2940. 2010.
FREIXAS, X.; ROCHET, J.C. Microeconomics of Banking. MIT Press , Cambridge, MA. 1997.
GAMBACORTA, L. Monetary policy and the risk-taking channel. BIS Quarterly Review, n. 4, p. 43-51, 2009.
GADANECZ, B.; JAYARAM, K. Measures of financial stability – a review. BIS IFC Bulletin, n. 31, p. 365-382, 2009.
GERTLER, M.; KARADI, P. A model of unconventional monetary policy. Journal of Monetary Economics , n. 58, p. 17–34, 2011.
GUO, L. Determinants of credit spreads: The role of ambiguity and information uncertainty. North American Journal of Economics and Finance , n. 24(C), p. 279–297, 2013.
HAMILTON, J. Why you should never use the Hodrick-Prescott Filter. Review of Economics and Statistics . Forthcoming.
HORVÁTH, R.; VASCO, D. Central bank transparency and financial stability. Journal of Financial Stability, 22, 45-56. 2016.
IMF. Brazil: detailed assessment of observance of Basel core principles for effective banking supervision. International Monetary Fund, IMF Country Report No. 12/207, Washington, D.C., April 2012.

KAMINSKY, G.; REINHART, M. The twin crises: The causes of banking and balance-of-payments problems. American Economic Review, v. 89, n. 3, p. 473-500. 1999.
KASSELAKI, M.; TAGKALAKIS, A. Financial soundness indicators and financial crisis episodes. Annals of Finance . DOI 10.1007/s10436-013-0233-6. 2013.
KENOURGIOS, D.; SAMITAS, A.; PALTADILIS, N. Financial crises and stock market contagion in a multivariate time-varying asymmetric framework. Journal of
International Financial Markets, Institutions & Money, n. 21, p. 92-106, 2011.
KING, R.G.; LEVINE, R. Finance and Growth: Schumpeter Might be Right. The Quarterly
Journal of Economics , v. 108, n. 3, p. 717-737, August 1993.
KLEIN, N. Non-Performing Loans in CESEE: Determinants and Impact on Macroeconomic Performance. IMF WP/13/72. 2013.
KRISHNAN, G.V.; LARGAY III, J.A. The Predictive Ability of Direct Method Cash Flow
Information. Journal of Business Finance & Accounting , n. 27, p. 215–245. doi:10.1111/1468-5957.00311. 2000.
LELAND, H. E.; PYLE, D. H. Information asymmetries, financial structure, and financial intermediaries, Journal of Finance , 32, 371-387. 1977.
LEVINE, R.; LOAYZA, N.; BECK, T. Financial intermediation and growth: causality and causes. Journal of Monetary Economics , n. 46, p. 31-77. 2000.
MENDOZA, E. Sudden stops, financial crises, and leverage. American Economic Review, n. 100, p. 1941-1966, 2010.
MISHKIN, F. Anatomy of a financial crisis. Journal of Evolutionary Economics , n. 2, p. 115-130, 1992.
MISHKIN, F. Prudential Supervision: Why is important and what are the issues? National
Bureau of Economic Research, working Paper, n. 7926, 2000.
OSIŃSKI, J.; SEAL, K.; HOOGDUIN, L. Macroprudential and macroprudential policies: toward cohabitation. IMF Staff Discussion Note n.13, May 2013.
POLOZ, S.S. Integrating financial stability into monetary policy. Business Economics, v. 50, n. 4, p. 200-205, 2015.
REINHART C.; ROGOFF, K. From Financial Crash to Debt Crisis. NBER Working Paper 15795. 2010.
SCHINASI, G. Defining Financial Stability. International Monetary Fund Working Papers n. 04/187. 2004.
SMETS, F. Financial Stability and Monetary Policy: How Closely Interlinked? International
Journal of Central Banking, vol. 10, n. 2, p. 263-300, 2014.
TABAK, B.M.; LAIZ, M.T.; CAJUEIRO, D.O. Financial stability and monetary policy – the case of Brazil. Revista Brasileira de Economia, v. 67, n. 4,p. 431-441. 2013.
WOODFORD, M. Financial Intermediation and Macroeconomic Analysis. Journal of
Economic Perspectives, v. 24, n. 4, p. 21-44, 2010.