Embed Size (px)
Citation preview
Jones Lang LaSalle – Investment Outlook – Q4 2013 1
Russian Real Estate Investment Outlook February 2014

Jones Lang LaSalle – Investment Outlook – Q4 2013 2 Economic sentiment is poor
Source: Jones Lang Lasalle, IMF, Rosstat
30
35
40
45
50
55
60
65
Jan-
05
Jun-
05
Nov
-05
Apr
-06
Sep
-06
Feb
-07
Jul-0
7
Dec
-07
May
-08
Oct
-08
Mar
-09
Aug
-09
Jan-
10
Jun-
10
Nov
-10
Apr
-11
Sep
-11
Feb
-12
Jul-1
2
Dec
-12
May
-13
Oct
-13
Index
Russia PMI Services Russia PMI Manufacturing
PMI (Services and Manufacturing)
Cumulative revisions to 2014-15 GDP growth (bps))
-10
-5
0
5
10
15
20
YoY %
Construction Fixed investment
Construction vs Investment
-150
-100
-50
0
50
100
-12
-10
-8
-6
-4
-2
0
2
4
6
8
YoY %
Industrial production Mining
Infrastructure Manufacturing
Industrial production
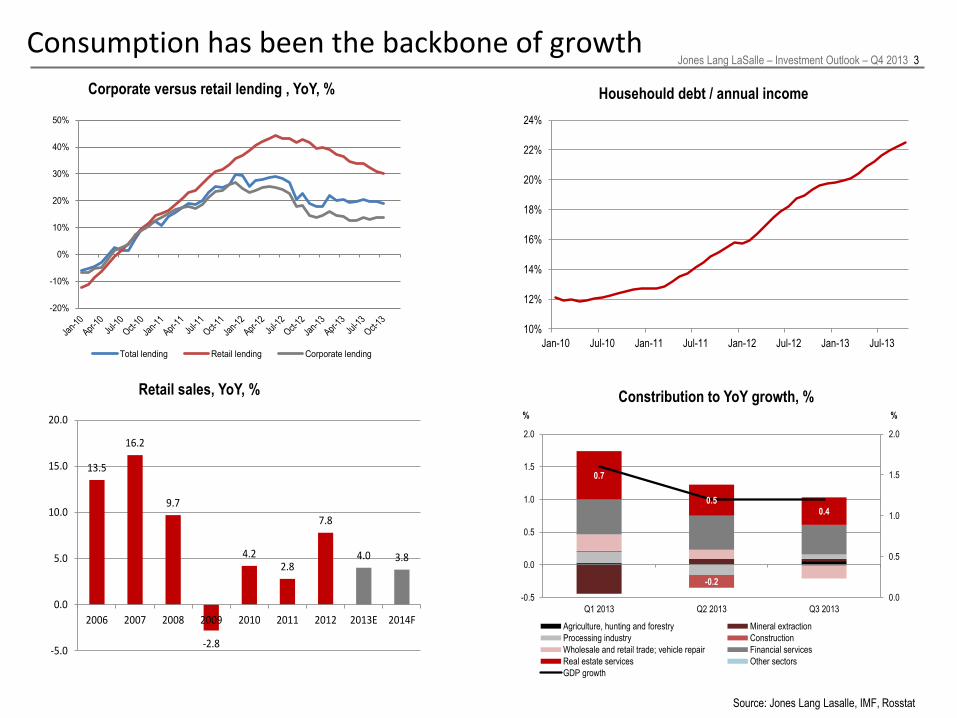
Jones Lang LaSalle – Investment Outlook – Q4 2013 3 Consumption has been the backbone of growth
Source: Jones Lang Lasalle, IMF, Rosstat
Corporate versus retail lending , YoY, %
-20%
-10%
0%
10%
20%
30%
40%
50%
Total lending Retail lending Corporate lending
10%
12%
14%
16%
18%
20%
22%
24%
Jan-10 Jul-10 Jan-11 Jul-11 Jan-12 Jul-12 Jan-13 Jul-13
Househould debt / annual income
13.5
16.2
9.7
-2.8
4.22.8
7.8
4.0 3.8
-5.0
0.0
5.0
10.0
15.0
20.0
2006 2007 2008 2009 2010 2011 2012 2013E 2014F
-0.2
0.7
0.50.4
0.0
0.5
1.0
1.5
2.0
-0.5
0.0
0.5
1.0
1.5
2.0
Q1 2013 Q2 2013 Q3 2013
%%
Agriculture, hunting and forestry Mineral extraction
Processing industry Construction
Wholesale and retail trade; vehicle repair Financial services
Real estate services Other sectors
GDP growth
Retail sales, YoY, %
Constribution to YoY growth, %
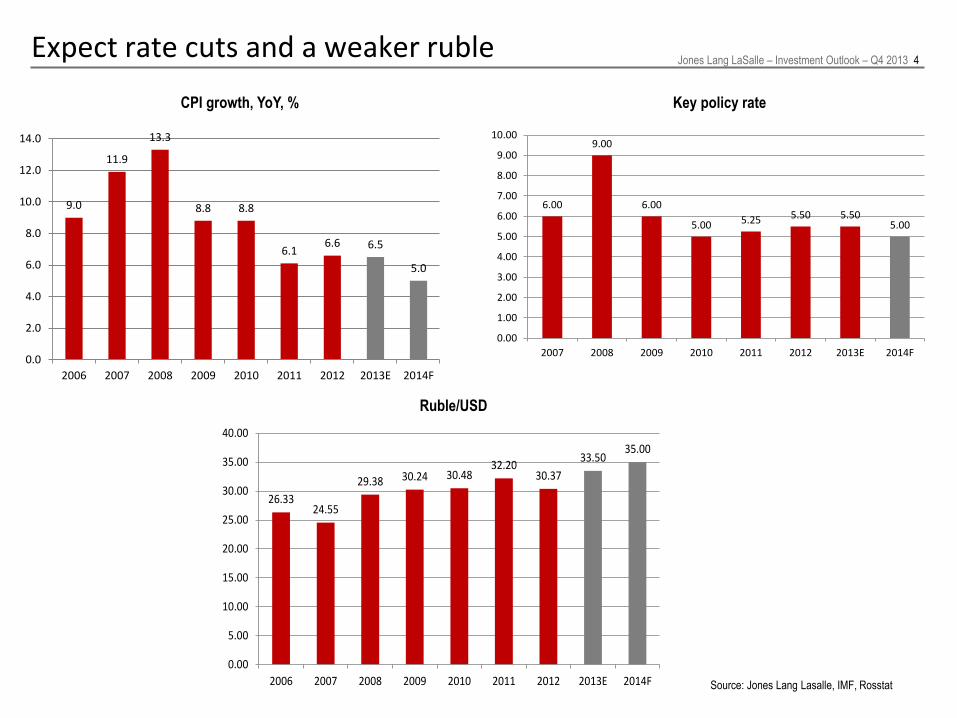
Jones Lang LaSalle – Investment Outlook – Q4 2013 4 Expect rate cuts and a weaker ruble
Source: Jones Lang Lasalle, IMF, Rosstat
9.0
11.9
13.3
8.8 8.8
6.16.6 6.5
5.0
0.0
2.0
4.0
6.0
8.0
10.0
12.0
14.0
2006 2007 2008 2009 2010 2011 2012 2013E 2014F
CPI growth, YoY, %
6.00
9.00
6.00
5.00 5.25 5.50 5.505.00
0.00
1.00
2.00
3.00
4.00
5.00
6.00
7.00
8.00
9.00
10.00
2007 2008 2009 2010 2011 2012 2013E 2014F
Key policy rate
26.3324.55
29.38 30.24 30.4832.20
30.37
33.5035.00
0.00
5.00
10.00
15.00
20.00
25.00
30.00
35.00
40.00
2006 2007 2008 2009 2010 2011 2012 2013E 2014F
Ruble/USD

Jones Lang LaSalle – Investment Outlook – Q4 2013 5 Investment market is strong, despite weak GDP
2011 2012 2013
Real estate investment volume, USD m* 8,499 8,772 8,135
Moscow share 69% 88% 84%
St. Petersburg share 27% 10% 6%
* Investment deals, excluding land acquisitions, JVs, direct residential sales to end-users. Source: Jones Lang LaSalle
Investment volume dynamics, USD bn* Investment volume: European comparison, 2012
2.1%
0.9%0.8%
0.4%
0.7%
0.0%
0.5%
1.0%
1.5%
2.0%
2.5%
0
10
20
30
40
50
60
UK Germany France Russia Poland
Investm
ent vo
lum
e, % o
f GD
P
USD bn
Country Capital8.5
8.1
0.1 0.30.8
4.0 3.9
5.1
3.2
4.9
8.8
7.0
0
2
4
6
8
10
2003 2004 2005 2006 2007 2008 2009 2010 2011 2012 2013 2014F
USD bn
Q4 Q3 Q2 Q1
Jones Lang LaSalle – Investment Outlook – Q4 2013 6
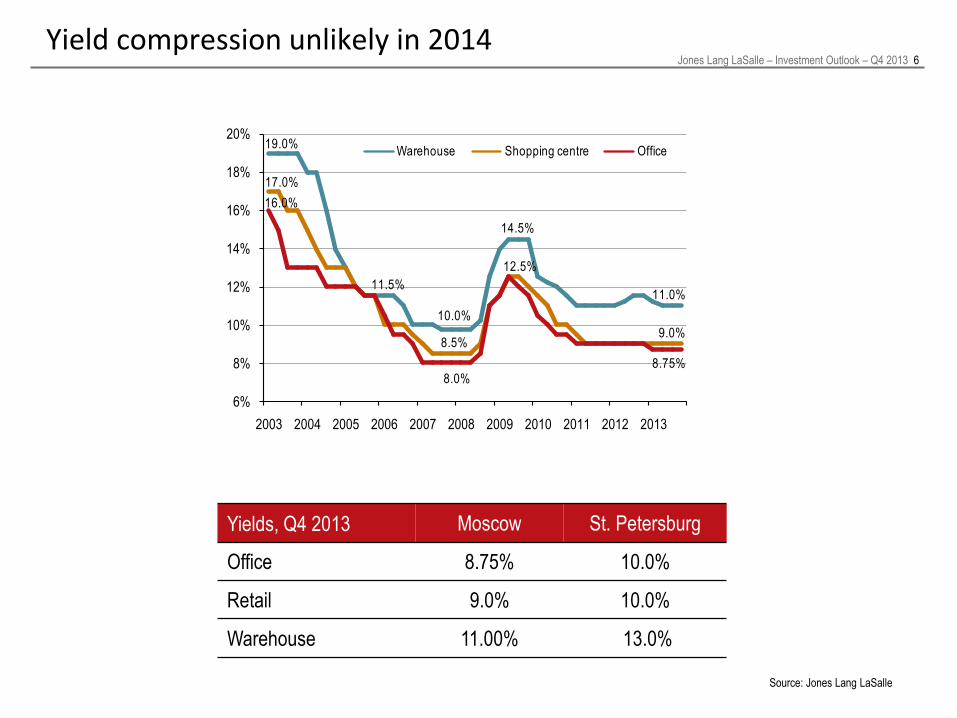
Yield compression unlikely in 2014
Source: Jones Lang LaSalle
Yields, Q4 2013 Moscow St. Petersburg
Office 8.75% 10.0%
Retail 9.0% 10.0%
Warehouse 11.00% 13.0%
8.0%
19.0%
17.0%
11.5%
8.5%
10.0%
12.5%
16.0%
11.0%
14.5%
9.0%
8.75%
6%
8%
10%
12%
14%
16%
18%
20%
2003 2004 2005 2006 2007 2008 2009 2010 2011 2012 2013
Warehouse Shopping centre Office
Jones Lang LaSalle – Investment Outlook – Q4 2013 7
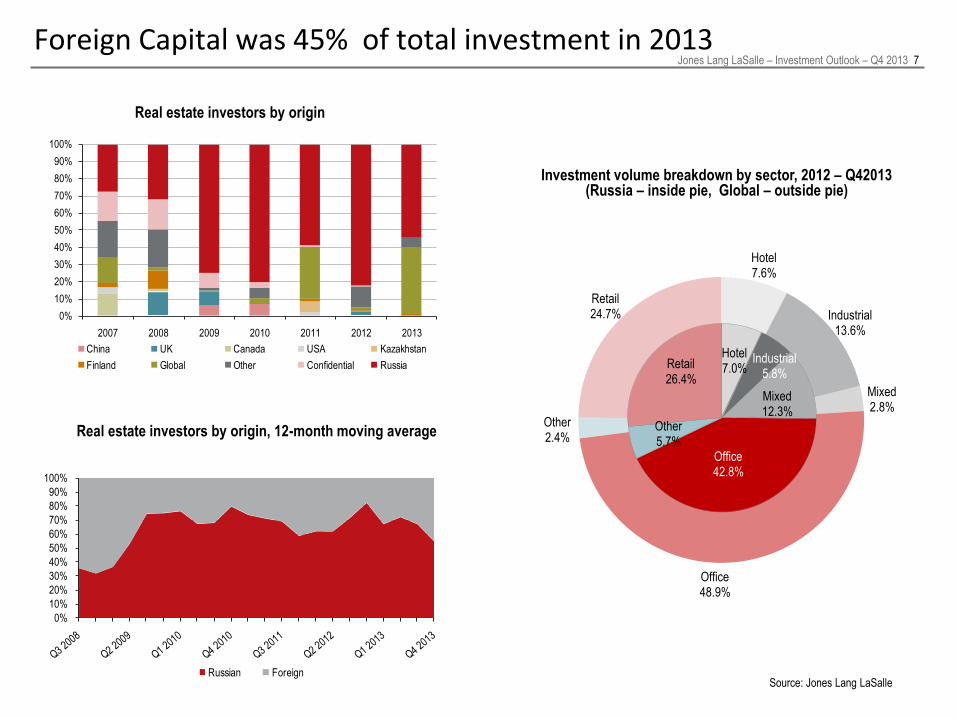
Foreign Capital was 45% of total investment in 2013
Real estate investors by origin
Source: Jones Lang LaSalle
Real estate investors by origin, 12-month moving average
Investment volume breakdown by sector, 2012 – Q42013 (Russia – inside pie, Global – outside pie)
Hotel7.6%
Industrial13.6%
Mixed2.8%
Office48.9%
Other2.4%
Retail24.7%
Hotel7.0%
Industrial5.8%
Mixed12.3%
Office42.8%
Other5.7%
Retail26.4%
0%
10%
20%
30%
40%
50%
60%
70%
80%
90%
100%
2007 2008 2009 2010 2011 2012 2013
China UK Canada USA Kazakhstan
Finland Global Other Confidential Russia
0%
10%
20%
30%
40%
50%
60%
70%
80%
90%
100%
Russian Foreign
Jones Lang LaSalle – Investment Outlook – Q4 2013 8
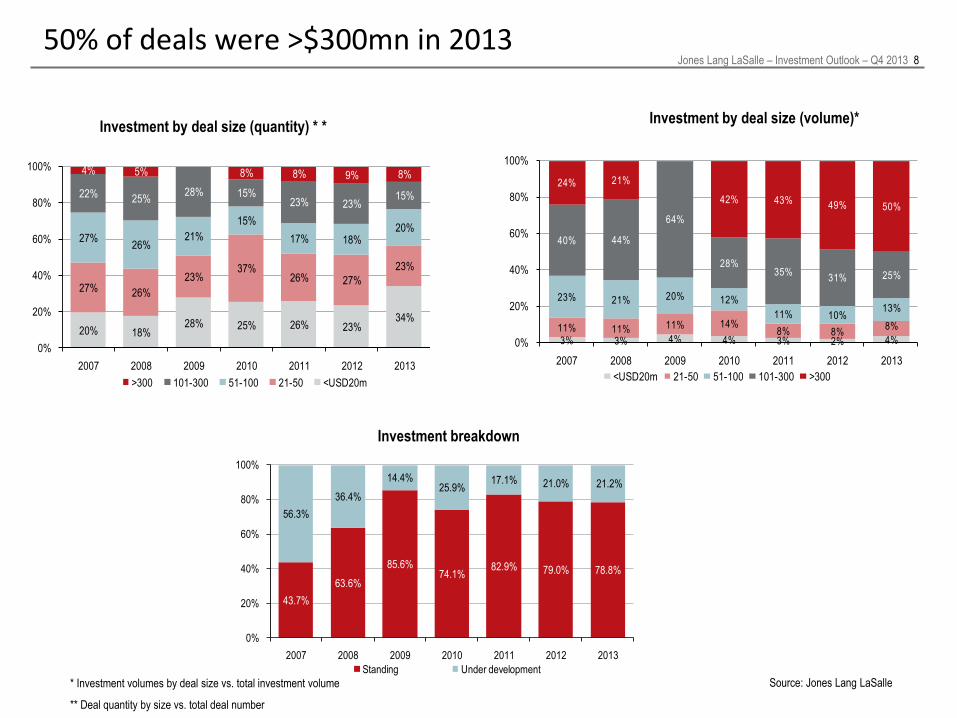
50% of deals were >$300mn in 2013
Source: Jones Lang LaSalle
Investment breakdown
Investment by deal size (volume)* Investment by deal size (quantity) * *
* Investment volumes by deal size vs. total investment volume
** Deal quantity by size vs. total deal number
43.7%
63.6%
85.6%74.1%
82.9% 79.0% 78.8%
56.3%
36.4%
14.4%25.9%
17.1% 21.0% 21.2%
0%
20%
40%
60%
80%
100%
2007 2008 2009 2010 2011 2012 2013
Standing Under development
3% 3% 4% 4% 3% 2% 4%11% 11% 11% 14%
8% 8%8%
23% 21% 20% 12%
11% 10%13%
40% 44%
64%
28%35%
31% 25%
24% 21%
42% 43% 49% 50%
0%
20%
40%
60%
80%
100%
2007 2008 2009 2010 2011 2012 2013
<USD20m 21-50 51-100 101-300 >300
20% 18%28% 25% 26% 23%
34%
27% 26%
23%37%
26% 27%
23%
27%26%
21%
15%
17% 18%20%
22% 25%28% 15%
23% 23%15%
4% 5% 8% 8% 9% 8%
0%
20%
40%
60%
80%
100%
2007 2008 2009 2010 2011 2012 2013
>300 101-300 51-100 21-50 <USD20m
Jones Lang LaSalle – Investment Outlook – Q4 2013 9
215
369
342
297
219225
137
1 150
850
0
200
400
600
800
1,000
1,200
1,400
1,600
1,800
2,000
0
500
1,000
1,500
2,000
2,500
3,000
2007 2008 2009 2010 2011 2012 2013 2014F
USD/sq m/year'000 sq m
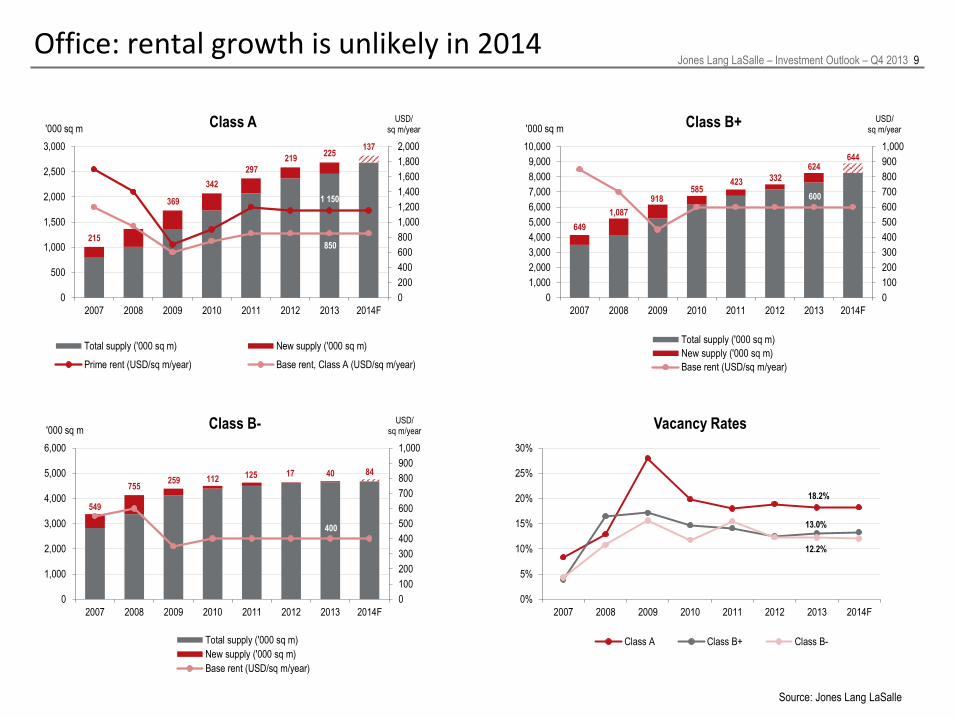
Class A
Total supply ('000 sq m) New supply ('000 sq m)
Prime rent (USD/sq m/year) Base rent, Class A (USD/sq m/year)
649
1,087
918585
423 332
624644
600
0
100
200
300
400
500
600
700
800
900
1,000
0
1,000
2,000
3,000
4,000
5,000
6,000
7,000
8,000
9,000
10,000
2007 2008 2009 2010 2011 2012 2013 2014F
USD/sq m/year'000 sq m
Class B+
Total supply ('000 sq m)
New supply ('000 sq m)
Base rent (USD/sq m/year)
549
755259 112 125 17 40 84
400
0
100
200
300
400
500
600
700
800
900
1,000
0
1,000
2,000
3,000
4,000
5,000
6,000
2007 2008 2009 2010 2011 2012 2013 2014F
USD/sq m/year'000 sq m
Class B-
Total supply ('000 sq m)
New supply ('000 sq m)
Base rent (USD/sq m/year)
18.2%
13.0%
12.2%
0%
5%
10%
15%
20%
25%
30%
2007 2008 2009 2010 2011 2012 2013 2014F
Vacancy Rates
Class A Class B+ Class B-
Office: rental growth is unlikely in 2014
Source: Jones Lang LaSalle
Jones Lang LaSalle – Investment Outlook – Q4 2013 10
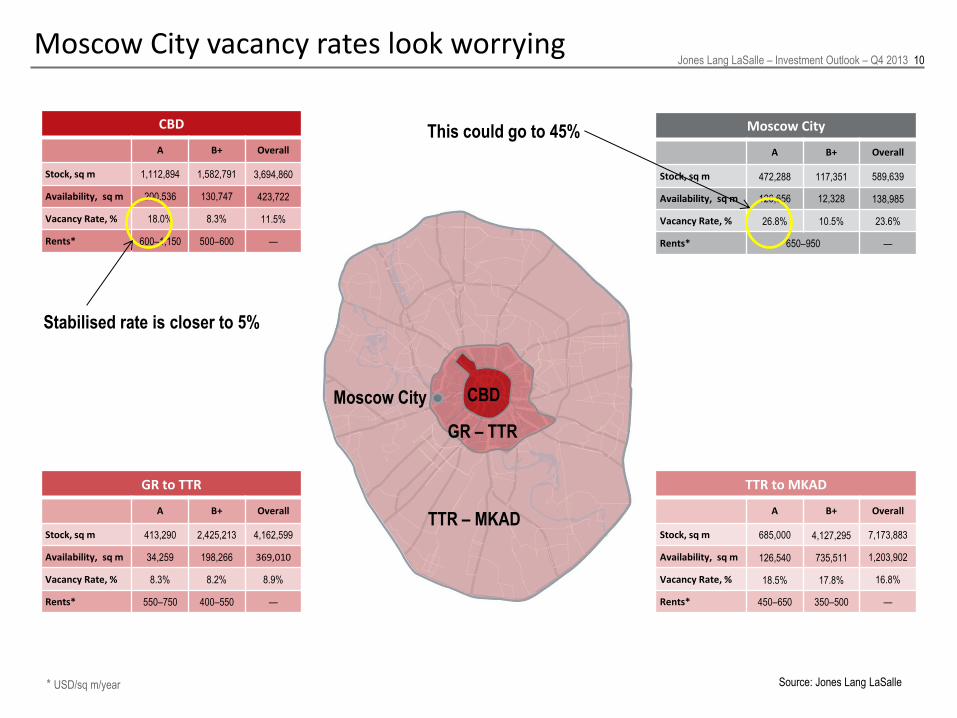
CBD
TTR – MKAD
GR – TTR
Moscow City
CBD
A B+ Overall
Stock, sq m 1,112,894 1,582,791 3,694,860
Availability, sq m 200,536 130,747 423,722
Vacancy Rate, % 18.0% 8.3% 11.5%
Rents* 600–1,150 500–600 —
Moscow City
A B+ Overall
Stock, sq m 472,288 117,351 589,639
Availability, sq m 126,656 12,328 138,985
Vacancy Rate, % 26.8% 10.5% 23.6%
Rents* 650–950 —
GR to TTR
A B+ Overall
Stock, sq m 413,290 2,425,213 4,162,599
Availability, sq m 34,259 198,266 369,010
Vacancy Rate, % 8.3% 8.2% 8.9%
Rents* 550–750 400–550 —
TTR to MKAD
A B+ Overall
Stock, sq m 685,000 4,127,295 7,173,883
Availability, sq m 126,540 735,511 1,203,902
Vacancy Rate, % 18.5% 17.8% 16.8%
Rents* 450–650 350–500 —
Source: Jones Lang LaSalle
Moscow City vacancy rates look worrying
* USD/sq m/year
This could go to 45%
Stabilised rate is closer to 5%
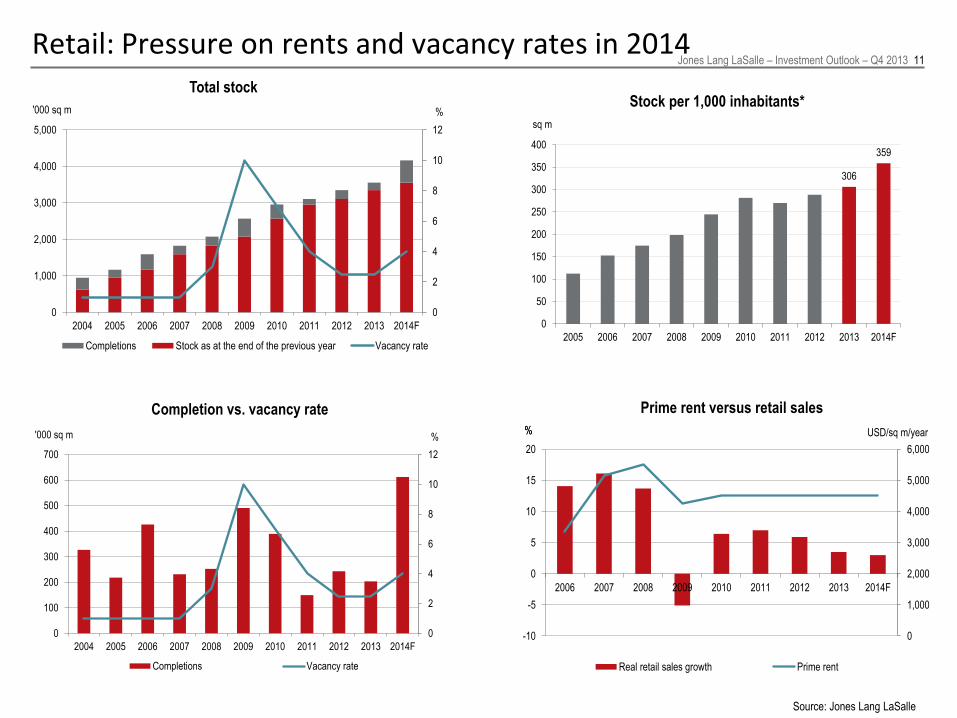
Jones Lang LaSalle – Investment Outlook – Q4 2013 11 Retail: Pressure on rents and vacancy rates in 2014
Source: Jones Lang LaSalle
Total stock Stock per 1,000 inhabitants*
0
2
4
6
8
10
12
0
1,000
2,000
3,000
4,000
5,000
2004 2005 2006 2007 2008 2009 2010 2011 2012 2013 2014F
%'000 sq m
Completions Stock as at the end of the previous year Vacancy rate
306
359
0
50
100
150
200
250
300
350
400
2005 2006 2007 2008 2009 2010 2011 2012 2013 2014F
sq m
0
2
4
6
8
10
12
0
100
200
300
400
500
600
700
2004 2005 2006 2007 2008 2009 2010 2011 2012 2013 2014F
%'000 sq m
Completions Vacancy rate
Completion vs. vacancy rate Prime rent versus retail sales
0
1,000
2,000
3,000
4,000
5,000
6,000
-10
-5
0
5
10
15
20
2006 2007 2008 2009 2010 2011 2012 2013 2014F
Real retail sales growth Prime rent
%% USD/sq m/year
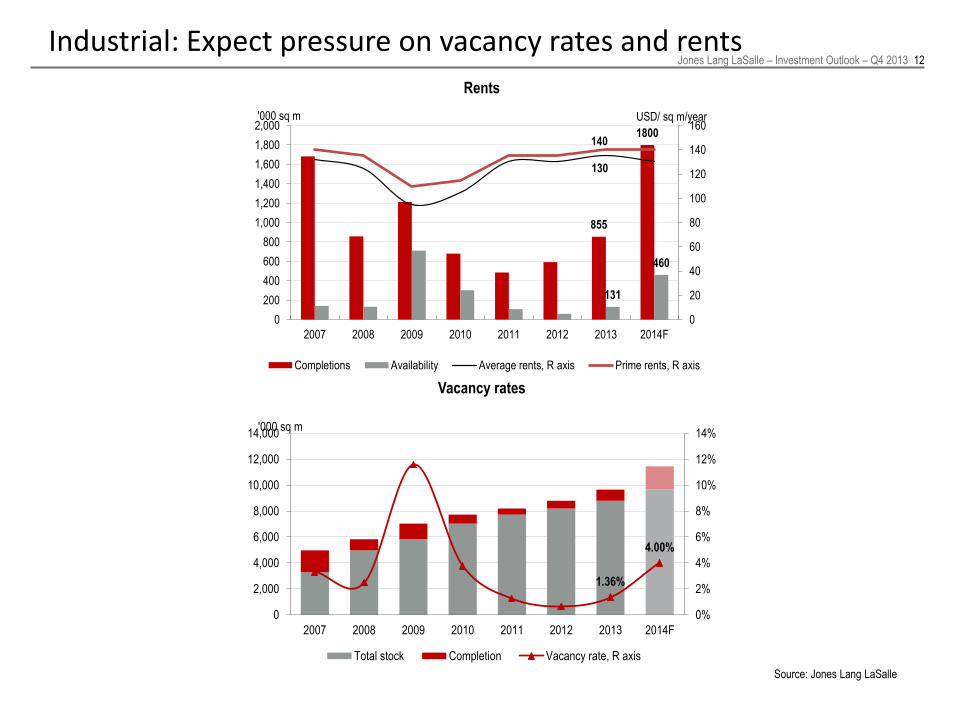
Jones Lang LaSalle – Investment Outlook – Q4 2013 12
Source: Jones Lang LaSalle
Industrial: Expect pressure on vacancy rates and rents
855
1800
131
460
130
140
0
20
40
60
80
100
120
140
160
0
200
400
600
800
1,000
1,200
1,400
1,600
1,800
2,000
2007 2008 2009 2010 2011 2012 2013 2014F
USD/ sq m/year '000 sq m
Completions Availability Average rents, R axis Prime rents, R axis
1.36%
4.00%
0%
2%
4%
6%
8%
10%
12%
14%
0
2,000
4,000
6,000
8,000
10,000
12,000
14,000
2007 2008 2009 2010 2011 2012 2013 2014F
'000 sq m
Total stock Completion Vacancy rate, R axis
Vacancy rates
Rents
Jones Lang LaSalle – Investment Outlook – Q4 2013 13
COPYRIGHT © JONES LANG LASALLE IP, INC. 2014. No part of this publication may be reproduced or transmitted in any form or by any means without prior written consent of Jones Lang LaSalle. It is
based on material that we believe to be reliable. Whilst every effort has been made to ensure its accuracy, we cannot offer any warranty that it contains no factual errors. We would like to be told of any such
errors in order to correct them.
Tom Mundy Head of Research Jones Lang LaSalle, Russia & CIS Office: +7 (495) 737 8000 ext. 441 Fax: +7 (495) 737 8011 Mobile: +7 (903) 213-54-37 Email: [email protected] Web: www.joneslanglasalle.ru Jones Lang LaSalle, Russia voted Consultant of the Year in 2004, 2006-2012 and 2013 at Commercial Real Estate Awards