Embed Size (px)
Citation preview
Vol. 104: 211-226, 1994 MARINE ECOLOGY PROGRESS SERIES Mar. Ecol. Prog. Ser. i Published February 3
Feeding ecology and condition of larval and pelagic juvenile redfish Sebastes spp.
John T. Anderson
Department of Fisheries and Oceans, Science Branch, PO Box 5667, St. John's, Newfoundland, Canada A1C 5x1
ABSTRACT. Eggs and nauplii of Calanus finmarchicus were the preferred prey types of redfish larvae whereas Oithona spp. copepodites were not, even though they were within the preferred size range. Sig- nificant seasonal and annual differences in larval diet of redfish resulted from differences in the avail- ability of preferred prey. Seasonally, feeding was related to the succession of the spring dominance of C. finmarchicus to summer dominance of Oithona spp. Interannually, feeding was related to differences in the timing of spring spawning and temperature-dependent development of C. finmarchicus. Earlier spawning and faster development of C. finmarchicus, dependent on warmer water temperatures, resulted in poorer feeding conditions for redfish larvae. Under these conditions redfish larvae: (1) ate predomi- nantly nauplii and copepodites of Oithona spp.; (2) ate less food by weight; (3) had lower relative body condition; and (4) there was a delayed size at metamorphosis from larvae to pelagic juveniles. Total prey concentrations between years did not determine better feeding and condition of redfish larvae, whereas the availability of preferred prey types did. Specifically, a lower abundance of C. finmarckrcus nauplii re- sulted in better feeding conditions than a higher abundance of Oithona spp. copepodites. These results emphasize that measuring total prey biomass within preferred prey sizes is not sufficient when evaluat- ing larval redfish feeding conditions. There was a switch in diet for pelagic juveniles to include Oithona spp. copepodtes as preferred prey, in addition to copepod eggs and nauplu. T h s switch in diet coincided with changing prey availability due to the seasonal succession of zooplankton on Flemish Cap, Canada. Metamorphosis from larvae to juveniles at smaller sizes and younger ages is hypothesized to be advan- tageous to annual survival of redfish due to an increased foraging ability.
KEY WORDS: Redfish . Sebastes spp. . Diet . Prey preferences . Calanus finmarchicus. Oithona spp. . Metamorphosis
INTRODUCTION
Since Hjort (1914), fisheries research into the causes of recruitment fluctuation has centered on the role of successful feeding by fish larvae. However, it has proven difficult to demonstrate a direct relationship between larval feeding and subsequent recruitment to the fishery (Leggett 1986, Wooster & Bailey 1989). Successful feeding might result from surviving the transition to exogenous feeding, starvation during any point of the larval period, or to different feeding rates throughout the larval period (Anderson 1988). While starvation mortality has been reported in nature dur- ing the larval period, there is no evidence that it sig- nificantly affects recruitment (O'Connell 1980, Fortier & Leggett 1985, Hewitt et al. 1985, McGurk 1985,
1989, Theilacker 1986, Buckley & Lough 1987). Peter- man & Bradford (1987) tested Lasker's (1975, 1981) first feeding hypotheses for northern anchovy, based on 13 yr of data, and found no relationship with year- class strength. However, Fortier & Leggett (1985) demonstrated increased mortality in capelin at the time of first feeding, consistent with Hjort's critical period hypothesis.
Greater feeding rates should result in better condi- tion and increased growth and development rates. Increased growth and development rates are expected to result in higher survival (Ware 1975, Shepherd & Cushing 1980, Houde 1987). Feeding is hypothesized to be directly related to the availability of preferred prey types and sizes. Availability of preferred prey will be dependent on seasonal production of zooplankton,
O Inter-Research 1994
Mar. Ecol. Prog. Ser. 104: 211-226, 1994
but also may be affected by physical processes (Roth- schild & Osborne 1988, Sundby & Fossum 1990). Some studies have examined larval diet in relation to growth and survival, but comprehensive estimates of prey availability were lacking (Cohen & Lough 1983, Ware & Lambert 1985). Estimates of prey selectivity by fish larvae have been reported (Kane 1984, Peterson & Ausubel 1984, Monteleone & Peterson 1986), but these studies were restricted in time and the results were not related to variables such as larval condition, develop- ment, growth or survival. Almost 2 decades after the review of May (1974) the role of feeding by fish larvae and the ways in which feeding variations among years effect differences in fish populations is still unresolved.
The aim of this research was to determine the diet and prey preferences of redfish larvae (Sebastes spp.) and how these varied seasonally with the transition from larvae to pelagic juveniles and between years in relation to prey availability. Interannual differences in feeding are related to fish condition and size at meta- morphosis, as well as to previously published estimates of growth rates. Subsequent work will examine the direct effects of prey concentrations and temperature on larval growth rates and, finally, the relationship of larval growth rate to survival.
STUDY AREA
Flemish Cap is an offshore fishing bank situated east of the Grand Bank of Newfoundland, Canada, with distinct redfish and cod populations and an identifiable oceanographic regime (Templeman 1976, Lilly 1987). During this study redfish accounted for 290% of all ichthyoplankton sampled. Three species of redfish have been reported for Flemish Cap (Templeman 1976, Ni 1982). Comparative analyses of larval mor- phology demonstrated that no single criterion success- fully discriminates among these 3 species (Penney 1985, 1987). Also, it appears that Sebastes mentella and S. marinus larvae are more similar to each other than either of them is to S. fasciatus (Penney 1987). S. mentella and S. marinus spawn primarily during April while peak spawning of S. fasciatus occurs during June (Barsukov & Zakharov 1972, Templeman 1976, Penney 1987). Of these 3 species, S. mentella is the most numerous while S. marinus is always reported in low numbers (Templeman 1976, Ni & McKone 1983, Penney et al. 1984). It was concluded that S. mentella was the predominant specles sampled in this study because of its numerical dominance and peak spawn- ing which occurs in April, as reported elsewhere. Any mixture of species which did occur in these samples should have a negligible effect on interpretation of results.
MATERIALS AND METHODS
Ichthyoplankton used for the feeding analyses were collected with bongo nets towed obliquely from 200 m, or from near the bottom when water depth was <200 m. Samples were collected on a 24 h basls such that the samples for each cruise were collected at all times of the day. A detailed summary of collection methods is contained in Anderson (1984). While 0.333 mm mesh nets were used most often, in some cases 0.505 mm mesh nets were also used. To test the null hypothesis that there were no sampling differ- ences in abundances or lengths of redfish, paired t-test comparisons were made for 4 cruises in which both 0.333 and 0.505 mm mesh nets were fished simultane- ously: GAD01 1, GADO19, GAD020, GAD035 (Table 1). In each case there were no statistical differences in abundances for all 4 cruises (0.4135 5 p I 0.7706). There were no statistical differences in lengths sam- pled for 3 cruises (0.1572 I p I 0.6830). However, in 1 cruise (GADOZO) the paired comparison indicated a statistical difference (p = 0.0417) where redfish aver- aged 0.2 mm larger in the 0.333 mm mesh samples. Therefore, it was concluded that there was no system- atic sampling bias in which 0.505 mm mesh nets cap- tured larger redfish.
Redfish larvae were selected for feeding and mor- phometric analyses from preserved samples (3 to 5 % formalin) collected during 12 research cruises on Flemish Cap (Table 1). Where available, redfish larvae were examined from each station sampled within a cruise. In each case a maximum of 3 fish were ran- domly selected for each mm size class, except in 1979 when more than 3 redfish per mm size group were selected (Table 1).
Prior to examination of stomach contents, each fish was measured for standard length (i.e. to the nearest 1.0 mm) and morphometric measurements (to the near- est 0.1 mm) were made of body height, head width, head height, and maxillary length using a binocular microscope and micrometer. Head width was mea- sured dorsally or ventrally immediately posterior to the eyes, and head height was measured sagitally at the same point as head width. Body height was the maxi- mum body depth measured sagitally at the insertion of the pectoral fin. Maxillary length was measured from the tip of the snout to the posterior end of the maxilla. For cruises near the end of the larval phase, a measure of metamorphosis from the larval to the pelagic juve- nile stage was made based on the degree of notochord flexion. During metamorphosis, involving ossification of body parts, the occurrence of head spines and body pigmentation, the notochord changes from straight to being flexed upwards at its posterior end. Flexion of the notochord occurs due to the formation of the
Anderson: Feeding ecology of redfish
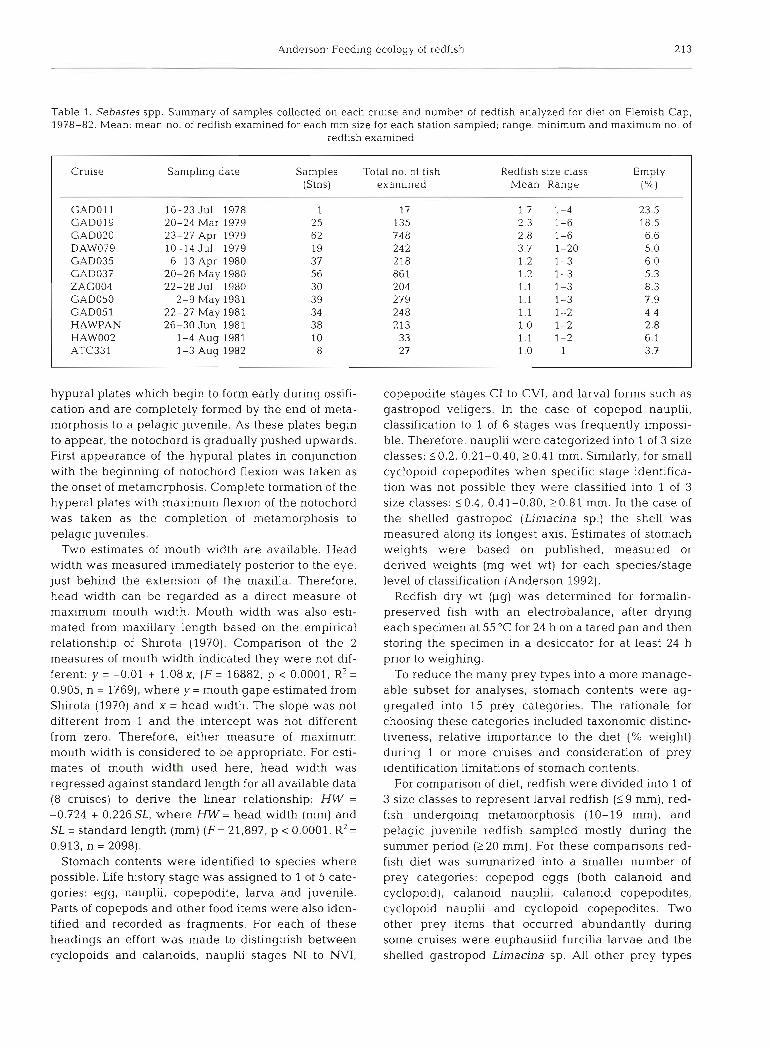
Table 1. Sebastes spp. Summary of samples collected on each cruise and number of redfish analyzed for diet on Flemish Cap, 1978-82. Mean: mean no. of redfish examined for each mm size for each station sampled; range: minimum and maximum no. of
redfish examined
Cruise Sampling date Samples Total no. of fish Redfish size class Empty (Stns) examined Mean Range ("/.l
GAD01 l 16-23 J u ~ 1978 1 17 1.7 1-4 23.5 GAD019 20-24 Mar 1979 25 135 2.3 1-6 18.5 GAD020 23-27 Apr 1979 62 748 2.8 1-6 6.6 DAW079 10-14 Jul 1979 19 242 3.7 1-20 5.0 GAD035 6-13 Apr 1980 37 218 1.2 1-3 6.0 GAD037 20-26 May 1980 56 86 1 1.2 1-3 5.3 ZAG004 22-28 JuI 1980 30 204 1.1 1-3 8.3 GAD050 2-9 May 1981 39 279 1.1 1-3 7.9 GAD051 22-27 May 1981 34 248 1.1 1-2 4.4 HAWPAN 26-30 Jun 1981 38 213 1.0 1-2 2.8 HAW002 1-4 A u ~ 1981 10 33 1.1 1-2 6.1 ATC331 1-3 Aug 1982 8 2 7 1.0 1 3.7
hypural plates which begin to form early during ossifi- cation and are completely formed by the end of meta- morphosis to a pelagic juvenile. As these plates begin to appear, the notochord is gradually pushed upwards. First appearance of the hypural plates in conjunction with the beginning of notochord flexion was taken as the onset of metamorphosis. Complete formation of the hyperal plates with maximum flexion of the notochord was taken as the completion of n~etamorphosis to pelagic juveniles.
Two estimates of mouth width are available. Head width was measured immediately posterior to the eye, just behind the extension of the maxilla. Therefore, head width can be regarded as a direct measure of maximum mouth width. Mouth width was also esti- mated from maxillary length based on the empirical relationship of Shirota (1970). Comparison of the 2 measures of mouth width indicated they were not dif- ferent: y = -0.01 + 1.08x, (F = 16882, p < 0.0001, R2 = 0.905, n = 1769), where y = mouth gape estimated from Shirota (1970) and X = head width. The slope was not different from 1 and the intercept was not different from zero. Therefore, either measure of maximum mouth width is considered to be appropriate. For esti- mates of mouth width used here, head width was regressed against standard length for all available data (8 cruises) to derive the linear relationship: H W =
-0.724 + 0.226SL, where H W = head width (mm) and SL = standard length (mm) (F = 21,897, p < 0.0001, R2 = 0.913, n = 2098).
Stomach contents were identified to species where possible. Life history stage was assigned to 1 of 5 cate- gories: egg, nauplii, copepodite, larva and juvenile. Parts of copepods and other food items were also iden- tified and recorded as fragments. For each of these headings an effort was made to distinguish between cyclopoids and calanoids, nauplii stages NI to NVI,
copepodite stages C1 to CVI, and larval forms such as gastropod veligers. In the case of copepod nauplii, classification to 1 of 6 stages was frequently impossi- ble. Therefore, nauplii were categorized into 1 of 3 size classes: 10.2, 0.21-0.40, 20.41 mm. Similarly, for small cyclopoid copepodites when specific stage identifica- tion was not possible they were classified into l of 3 size classes: L0.4, 0.41-0.80, 20.81 mm. In the case of the shelled gastropod (Limacina sp.) the shell was measured along its longest axis. Estimates of stomach weights were based on published, measured or derived weights (mg wet wt) for each species/stage level of classification (Anderson 1992).
Redfish dry wt (pg) was determined for formalin- preserved fish with an electrobalance, after drying each specimen at 55 "C for 24 h on a tared pan and then storing the specimen in a desiccator for at least 24 h prior to weighing.
To reduce the many prey types into a more manage- able subset for analyses, stomach contents were ag- gregated into 15 prey categories. The rationale for choosing these categories included taxonomic distinc- tiveness, relative importance to the diet (% weight) during l or more cruises and consideration of prey identification limitations of stomach contents.
For comparison of diet, redfish were divided into 1 of 3 size classes to represent larval redfish (1 9 mm), red- fish undergoing metamorphosis (10-19 mm), and pelagic juvenile redfish sampled mostly during the summer period (220 mm). For these comparisons red- fish diet was summarized into a smaller number of prey categories: copepod eggs (both calanoid and cyclopoid), calanoid nauplii, calanoid copepodites, cyclopoid nauplii and cyclopoid copepodites. Two other prey items that occurred abundantly during some cruises were euphausiid furcilia larvae and the shelled gastropod Limacina sp. All other prey types

Mar. Ecol. Prog. Ser. 104: 211-226, 1994
occurred in low proportions and were classified as 'Other'.
Feeding comparisons among years were possible for 4 different periods ranging from late March to early August. In the first comparison (20-24 March 1979 ver- sus 6-13 April 1980) the cruise dates differed by approximately 3 wk. However, both cruises occurred before the seasonal increase in redfish larval abun- dance and the mean and size range of larvae were sim- ilar. The second comparison (23-27 April 1979 versus 2-9 May 1981) occurred just after the time of peak red- fish release (Anderson 1984, Penney & Evans 1985), for 2 cruises that differed in time by only 1.5 wk. However, the mean size of redfish was 6.3 mm in 1979 compared to 8.3 mm in 1981 although the range of lengths was similar: 4 to 12 mm and 6 to 13 mm. respectively. For this comparison redfish were compared for 2 size classes: 5 9 mm and 10-19 mm. For the third compari- son (20-26 May 1980 versus 22-27 May 1981) redfish size was not different. The final comparison which included all 3 redfish size classes was among 4 yr dur- ing the period mid-July to the first week of August (Table 1). Statistical analyses for feeding differences among cruises were based on the Kolmogorov- Smirnov test (Siege1 1956).
As a relative measure of the amount of food redfish ate, stomach weights of redfish were standardized by summing the contents of each fish, dividing by the length of the fish cubed and then computing standard statistics for each cruise. For cruises which occurred later in the season, mean standardized stomach weights were determined for both small (larvae I l l mm) and large Cjuveniles 2 12 mm) length groups. A direct comparison between years of stomach weight to fish weight was possible for 20-26 May 1980 versus 22-27 May 1981. Statistical differences were deter- mined for each mm length group based on Wilcoxon's test (SAS, Inc. 1985).
Diurnal feeding patterns were determined within each cruise by summing the stomach weights of all redfish sampled and then averaging these weights for each 2 h period over the entire cruise. Sunset and sun- rise were based on a standard table used by the St. John's weather station.
Estimates of food preference by redfish were based on Chesson's (1978) a, index. With Chesson's ai, selectivity is standardized for the relative abundance of all prey types, allowing direct comparison among samples when abundance varies (Lechowicz 1982, Pearre 1982). Se- lectivity (ui) for each prey type was calculated as
ri /P, ai = 7
Z r k / ~ k k= l
where ri = proportion of prey type i in the diet and pi =
proportion in the water.
Redfish diet, r;, was calculated from stomach con- tents for all fish examined within each mm size class at each station sampled within a cruise. Calculation of pi for zooplankton prey in the environment was based on 0.080 mm mesh samples for 4 cruises (GAD035, GAD037, GADOSO, GAD051) and 0.165 mm mesh sam- ples for 2 cruises (HAWPAN, ATC331). Prey types were the same 15 prey categories used to describe feeding. Feeding selectivity was based on plankton that were both eaten by redfish and sampled by the plankton nets. An overall estimate of prey preference was calculated for each cruise by averaging the ais for each mm size class. Neutral selection was calculated as %, where n = no. of prey types which occurred in the intersection set for all redfish within each redfish size class for each cruise.
Sampling and processing methods for the zooplank- ton samples are outlined in Anderson (1990). In both cases, diet and environment, samples were based on in- tegrated tows from 0 to 200 m for bongo samples and 0 to 100 m for the ring net samples. However, larval red- fish are known to occur in the upper 50 m of the water column which typically will be above the pycnocline (Kenchington 1991, K. Frank, Bedford Institute of Oceanography, Dartmouth, Nova Scotia, Canada, un- publ. data). In addition, it is known that early stages of copepods (Krause & Trahms 1982, Williams et al. 1987, Williams & Conway 1988) and Limacina sp. (Perry & Neilson 1988) are concentrated in the upper mixed layer as well. Therefore, it is assumed that the fish larvae co- occurred with their prey, at least during the early part of the season from March through June. By July-August the degree of CO-occurrence is less well known. How- ever, it is typical of fish in their first year of life to begin diurnal migrations as they grow, which may put them in association with a greater variety of food items.
Relative condition was based on redfish dry wt mm-' length, comparing redfish sampled during the end of May 1980 and 1981. This allowed a direct comparison between years during the end of the larval period. Wilcoxon's non-parametric test was used to evaluate differences between each mm size category.
RESULTS
Seasonal patterns in diet
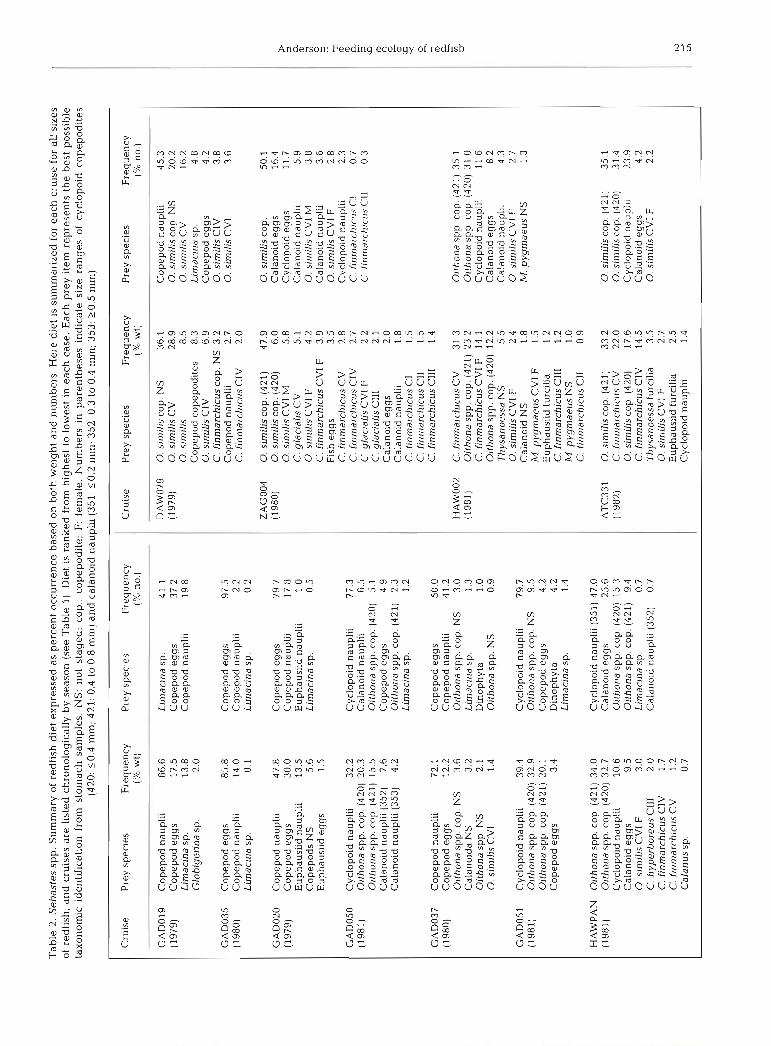
Observations of redfish diet for the period April to August during 1979-81 demonstrated significant dif- ferences with the changing biological season, charac- terized by an increasing number of prey types during all 3 yr. For example, during 20-24 March 1979 and 6-13 April 1980 2 and 3 food types made up 98 and 99.8 % of the diet by weight respectively (Table 2). By
Tab
le 2
. S
ebas
tes
spp
. S
um
mar
y o
f re
df~
sh die
t ex
pre
ssed
as
per
cen
t o
ccu
rren
ce b
ased
on
bo
th w
e~
gh
t an
d n
um
ber
s. H
ere
die
t is
su
mm
ariz
ed f
or e
ac
h c
ruls
e fo
r al
l si
zes
of
red
fish
, a
nd
cru
ises
are
lis
ted
ch
ron
olo
gic
ally
by
seas
on
(se
e T
able
1).
Die
t is
ran
ked
fro
m h
igh
est
to l
ow
est
in e
ac
h c
ase.
Eac
h p
rey
ite
m r
epre
sen
ts t
he
bes
t p
oss
ible
ta
xo
no
mic
id
enti
fica
tio
n f
rom
sto
mac
h s
amp
les.
NS
: n
ot
stag
ed;
cop
.: c
op
epo
dit
e; F
: fe
mal
e. N
um
ber
s in
par
enth
eses
in
dic
ate
size
ran
ges
of
cycl
op
oid
co
pep
od
ites
(4
20
: 10
.4 m
m; 4
21:
0.4
to
0.8
mm
) a
nd
cal
ano
id n
au
ph
(35
1: S
0.2
mm
; 352
: 0
.3 to
0.4
mm
; 35
3: 2
0.5
mm
)
Oit
hona
sp
p c
op
. (42
1) 3
5.1
Olt
hona
sp
p c
op
. (42
0) 3
1.0
Cy
clo
po
~d
naup
lii
11.6
C
alan
oid
egg
s 8
.2
Cal
anoi
d na
upli
i 4
.3
0. s
imil
is C
V1
F
2.7
M. p
yg
mae
us
NS
1
3
Cru
ise
Pre
y sp
ecie
s F
requ
ency
P
rey
spec
ies
Fre
quen
cy
(% w
t)
(Yo n
o,)
-
GA
D01
9 C
opep
od n
aupl
ll
66.6
L
imac
ina
sp.
41
.1
(197
9)
Cop
epod
eg
gs
17
.5
Cop
epod
eg
gs
37.2
L
imac
ina
sp.
13.8
C
opep
od n
au
pll
~
19.8
G
lobi
geri
na s
p.
2.0
GA
D03
5 C
op
epo
d e
gg
s 85
.8
Co
pep
od
eg
gs
97.5
(1
980)
C
opep
od n
aupl
ii
14.0
C
opep
od n
aupl
ii
2.2
Lim
acin
a sp
. 0
.1
L~
mac
ina s
p.
0.2
GA
D02
0 C
opep
od n
aupl
u 4
7.8
C
opep
od e
gg
s 79
.7
(197
9)
Cop
epod
eg
gs
30.0
C
opep
od n
aupl
ii
17.8
E
upha
usii
d na
upli
i 13
.5
Eup
haus
iid
naup
lii
1.0
C
op
epo
ds
NS
5
.6
Lim
acin
a sp
. 0.
5 E
upha
usii
d eg
gs
1.5
GA
D05
0 C
ycl
op
o~
d na
upli
i 3
2.2
C
yclo
poid
nau
plii
77
.3
(198
1)
Oit
hona
sp
p. c
op
. (42
0) 2
0.3
Cal
anoi
d na
upli
i 6
.5
Oit
hona
sp
p. c
op
. (42
1) 1
5.5
Oit
hona
sp
p. c
op
. (42
0)
5.1
C
alan
oid
naup
lii
(352
) 7.
6 C
opep
od e
gg
s 4.
9 C
alan
oid
naup
lii
(353
) 4.
2 O
itho
na s
pp
. cop
. (42
1)
2.3
Lim
acin
a sp
. 1.
2
GA
D03
7 C
opep
od n
aupl
ii
72
.1
Cop
epod
eg
gs
50.0
(1
980)
C
opep
od e
gg
s 1
2.2
C
opep
od n
aup1
11
41.2
O
ilho
na s
pp
. cop
NS
3
.6
Oit
hona
sp
p. c
op
. NS
3.0
C
alan
oida
NS
3
.2
Lim
acin
a sp
. l ,
3 O
itho
na s
pp
. NS
2.
1 D
inop
hyta
1 .
O
0. s
imil
is C
V1
1.4
Oit
hona
sp
p. N
S
0.9
GA
D05
1 C
yclo
poid
nau
plii
39
.4
Cyc
lopo
id n
aupl
ii
79
.7
(198
1)
Oit
hona
sp
p. c
op
. (42
0) 3
2.9
O
itho
na s
pp
. co
p. N
S 9
.5
Oit
hona
sp
p. c
op
(421
) 20
.1
Cop
epod
eg
gs
4.2
C
opep
od e
gg
s 3.
4 D
~n
op
hy
ta
4.2
Lim
acin
a sp
. 1.
4
HA
WP
AN
O
itho
na s
pp
. cop
. (42
1) 3
4.6
Cyc
lopo
id n
aupl
ii (
351)
47.
0 (1
981)
O
itho
na s
pp
. cop
. (42
0) 3
2.7
Cal
anoi
d eg
gs
25.6
C
yclo
poid
nau
plii
1
0.6
O
itho
na s
pp
. co
p. (
420)
15
.3
Cal
anoi
d eg
gs
9.5
O
itho
na s
pp
. cop
. (42
1)
9.4
0. s
imil
is C
V1
F
3.0
Lim
acin
a sp
. 0
.7
C, h
yp
erb
ore
us
C111
2.
0 C
alan
oid
naup
lii
(352
) 0
.7
C, f
inm
arch
lcus
CIV
1.
7 C
. fin
mar
chic
us C
V
1.2
C
alan
us
sp.
0.7
0. s
imil
is c
op. (
42
1)
35.1
0. s
imil
is c
op
. (4
20
) 31
.4
Cyc
lopo
id n
aupl
ii
23.9
C
alan
old
egg
s 4
.2
0, s
imll
is C
V1
F
2.2
Cru
ise
Pre
y sp
ecie
s F
requ
ency
P
rey
spec
ies
Fre
quen
cy
(% w
t)
1% n
o.)
DA
W07
9 0. s
imil
ls c
op
. NS
3
6.1
C
opep
od n
aupl
ii
45
.3
(197
9)
0. s
imil
js C
V
28.9
0. s
lmil
is c
op
. NS
20.2
0. s
inul
is
8.5
0, s
imll
is C
V
16
.2
Cop
epod
cop
epod
ites
8
.3
Lim
acin
a sp
. 4
.8
0. s
irni
tis
CIV
6.
9 C
opep
od e
gg
s 4.
2 C
. fi
nmar
chic
us c
op. N
S
3.2
0. s
imil
is C
IV
3.8
Co
pep
od
nau
plii
2.
7 0
. sim
ilis
CV
1 3.
6 C
. fin
mar
chic
us C
IV
2.0
ZA
G00
4 0. s
imih
s co
p. (
421)
47
.9
0, s
imil
~s co
p.
50.1
(1
980)
0. s
m~
lis
co
p. (
420)
6
.0
Cal
anoi
d eg
gs
16.4
0. s
in~
ilis
CV
1 M
5
.8
Cyc
lopo
id e
gg
s 11
.7
C. g
laci
alis
CV
5
.1
Cal
anoi
d na
upli
i 5
.9
0. s
imil
is C
V1
F
4.2
0
. sim
ilis
CV
1 M
3.
8 C
. fin
mar
chic
us C
V1
F
3.9
Cal
anoi
d na
upli
i 3.
6 F
ish
egg
s 3.
5 0, s
lmll
is C
V1
F
2.8
C h
nnia
rchi
cus
CV
2.
8 C
yclo
pold
nau
plii
2.
3 C
. fin
mar
chic
us C
IV
2.7
C. f
jnm
arch
icus
Cl
0.7
C g
lac~
aljs
CV
1 F
2.2
C, f
rnm
arch
icus
Cl1
0
3 C
gla
ciah
s C
III
2.1
Cal
anoi
d eg
gs
2.0
Cal
anoi
d na
upli
i 1.
8 C
. fin
mar
chic
us C
1 1
.5
C.
finm
arch
icus
C11
1
.5
C. h
nmar
chic
us C
lll
1.4
HA
W00
2 C
. fin
n~
arch
icu
s CV
3
1.3
(1
981)
O
ltho
na s
pp
. co
p. (
421)
23.
2 C
. fin
mar
chic
us C
V1
F
14.1
O
itho
na s
pp
. cop
. (42
0) 1
2.2
Thy
sano
essa
NS
5.
5 0. s
imil
is C
V1
F 2.
4 C
alan
oid
NS
1.8
M
. py
gm
aeu
s C
V1
F
1.5
Eup
haus
lid
furc
ilia
1.
2 C
. fin
mar
chic
us C
l11
1.2
M. p
yg
mae
us
NS
1 .
O C
. fi
nmar
chic
us C
11
0.9
AT
C33
1 0. s
imil
isco
p. (
421)
33
.2
(198
2)
C. f
inm
arch
icus
CV
22
.0
0. s
imil
is c
op
. (42
0)
17
.6
C. f
inm
arch
icus
CIV
1
4.5
T
hysa
noes
sa f
urci
lia
3.5
0. s
lmil
is C
V1
F 2.
7 E
up
hau
sl~
d fu
rcil
ia
2.5
Cyc
lopo
id n
aupl
ii
1.4

216 Mar. Ecol. Prog. Ser. 104: 211-226, 1994
Table 3. Sebastes spp. preylng on Calanus finmarchicus and Oithona similis. Estimates of prey width for selected prey types as a percent of maximum mouth wtdth for different redfish sizes. NI & NVI: nauplii stages I & VI; C1 & CVI: copepodite stages I & VI. Width was estimated for C. finmarchicus nauplii and copepodites as 75 and 33% of total length respectively. For 0, sirmhs nau- phi and copepodites, width was estimated as 67 and 34% of total length respectively. Width estimates approximated inclusion of
folded antennae
Redfish length Mouth width C. finmarchicus 0. similis (mm) Eggs NI NVI C1 CV1 NI NVI C1 CV1 I
the end of May this had increased to 12 food types making up 98.7 % of the diet in 1980 (GAD037) and 9 food types making up 98.7 % of the diet in 1981 (GADO51). By July-August during 1979-1982 there were 12 to 27 food types which made up 98.9 to 99% of the diet by weight. In addition, food types tended to increase in size as the fish grew, with a shift from eggs and nauplii to cyclopoid and later calanoid cope- podites. However, the differences in diet observed in 1981 compared to 1979 and 1980 make it difficult to generalize about the diet of Flemish Cap redfish.
During March-May 1979-80 copepod nauplii domi- nated by weight, except 6-13 April 1980 when eggs accounted for 85.8 % of the diet, compared to 14 % for nauph (Table 2). In 1981, the dominant food item was cyclopoid copepodites followed by nauplii. A detailed examination of diet differences among years is pre- sented in the next section.
Comparison of the diet of redfish larvae (59 mm) demonstrated differences in prey availability both sea- sonally and between years. In March-May 1979 and 1980 copepod eggs and nauplii (primarily calanoid) comprised 78.5 to 99.8 % of the diet by weight. During this period in 1981 copepod eggs and nauplii (primar- ily cyclopoid) comprised 56.1 and 63.3 %, respectively, whereas cyclopoid copepodites accounted for 34.6 to 42.6 % of the diet. The predominance of cyclopoid prey in the diet during 1981, particulary copepodites, demonstrates interannual differences in prey availabil- ity, as prey selectivity did not change (see below). Dur- ing the July-August period eggs and nauplii made up 30.7 to 43.1 % of the diet in 1980-82 and only 4.5 % in 1979. In contrast, Oithona spp. copepodites made up 51.8 to 81.6% of the diet. These results demonstrate a seasonal change in diet from calanoid eggs and nauplii to cyclopoid copepodites for redfish larvae.
Limacina sp. was a component of the diet of small redfish in most cruises. However, in only 2 instances did it constitute a notable proportion of the diet. During 20-24 March 1979 and 1-3 August 1982 it made up 13.8 and 17.5 % of the diet by weight respectively. It is
noteworthy that these 2 cruises represented the earli- est and latest observations available, indicating that Limacina sp. may be relatively more important in the diet both prior to the onset of spring copepod produc- tion and possibly late in the summer period. In all other cruises it ranged from 0 to 2 % of the diet by weight.
Maximum mouth width for redfish 6, 10, 15, 20 and 25 mm in length was compared to sizes of Calanus fin- marchicus eggs, and C. finmarchicus and Oithona sim- ilis nauplii and copepodites (Table 3). The range of preferred prey sizes relative to maximum mouth width ranged from 2 to 73 %, based on the diet and preferred prey types (see below) for larvae of these lengths sam- pled at different times. These values represent the extremes of 6 mm larvae feeding on C, finmarchicus NVI and 25 mm juveniles feeding on 0. similis NI (Table 3). Comparison of mouth width to standard length indicates that mouth width increases at a greater rate. For example, at 6 mm length mouth width is l0 % of body length while at 25 mm it is 20 ?h. A rel- atively rapid increase in mouth size would favour suc- cessful feeding in a changing environment with an ever increasing variety and size of the prey field.
Interannual differences in diet
Among year differences in diet were apparent during April-May 1979-81, while by July most differences had disappeared. The greatest difference was a predomi- nance of cyclopoid nauplii and copepodites during May 1981, and of calanoid eggs and nauphi in 1979 and 1980.
Redfish diets differed significantly between 20-24 March 1979 and 6-13 April 1980 (D,,, = 0.683, p < 0.001, n, = 135, n2 = 218). In March 1979 copepod nau- plii dominated (66.7 % by weight) followed by copepod eggs (17.5%) and Limacina sp. (13.8%). In Apnl 1980 copepod eggs dominated (85.8%) followed by nauplii (14 %) (Fig. 1). Calanus finmarchicus spawning appar- ently was more advanced by the end of March 1979 than in the second week of April 1980.

Anderson: Feeding ecology of redfish 217
Copepod nauplii (47.8 %), copepod eggs (30 %) and euphausiid nauplii (13.5%) dominated the diet dur- ing 23-27 April 1979, whereas Oithona spp. cope- podites (35.8%) and nauplii (32.3%) dominated during 2-9 May 1981 (during which calanoid nauplii comprised only 11.8 %) (Fig. 1). Diets of redfish 1 9 mm and 10-13 mm were significantly different in both cases (D,,, = 0.657, p < 0.001, n, = 692, n2 = 237) and D,,, = 0.313, p < 0.05, n, = 56, n2 = 42, respectively).
Diets also differed between May 1980 and 1981 (D,,, = 0.804, p < 0.001, n, = 861, n2 = 248). During 20-26 May 1980, most redfish ate copepod nauplii (calanoid) (72.1 %), eggs (12.2%) and Oithona spp. copepodites (7.1 %). During 22-27 May 1981 redfish larvae ate rela-
A B C D E F G
PREY TYPE
Fig. 1. Sebastes spp. Direct comparisons of diet differences for redfish larvae sampled in different years at approximately the same time: 20 to 24 March 1979 versus 6-13 April 1980, 23-27 April 1979 versus 2-9 May 1981; 20-26 May 1980 ver- sus 22-27 May 1981. Prey type labels - A: copepod eggs; B: copepod nauplii; C: copepod copepodites; D: cyclopoid naup- lii; E: cyclopoid copepodites; F: euphausiids; G: Limacina spp.
tively older cyclopoid stages (Oithona spp. copepodites, 53 %; cyclopoid nauplii 39.4 %; Fig. 1).
No overall pattern of dietary differences was observed for larvae in the 3 size classes (59, 10-19, 220 mm) among years in July-August. In all 3 years 1 9 mm redfish ate mainly Oithona spp. copepodites, (51.8 to 53.8% by weight). Redfish 10-19 mm ate mainly Oithona spp. copepodites (1980, 72.3 % by weight; 1981, 53.8%; 1982, 89.3%). Only redfish 2 20 mm exhibited a difference among years. Their diet was dominated in all years by copepodites of Oithona spp. and Calanus finmarchicus. However, Oithona spp. dominated by weight in 1980 and C. finmarchicus dominated in 1981 and 1982. The diets were not statis- tically different among years.
Only the diets of redfish 1 9 mm sampled in July 1979 differed statistically from July 1980 (D,, = 0.386, p < 0.01, n, = 232, n2 = 24) and August 1981 (D,,, = 0.354, p < 0.1, n, = 232, n2 = 13). These differences were due to small redfish eating fewer copepod eggs and nauplii ( < 5 % by weight) in 1979 compared to 1980 and 1981 (> 40 % by weight).
Diurnal patterns in feeding
Redfish fed primarily during daylight. Peak stomach weights consistently occurred before sunset (Fig. 2) after which they decreased to a minimum around sun- rise. Some variation occurred among cruises: during 20-26 May 1980 the minimum occurred 0.5 h after sunrise, after which stomach weights began to increase (Fig. 2); during 26-30 June 1981 the minimum occurred 0.5 h after sunrise but no increase occurred until 4 h later (Fig. 2); combined results for the 4 cruises in July-August cruises ylelded a minimum 2 h after sunrise and no increase until 6 h after sunrise (Fig. 2). A steady increase in stomach weight occurred during daylight hours once feeding commenced.
The diurnal pattern was less pronounced on the remaining sampling dates (20-24 March and 23-27 April 1979 and 2-9 May and 22-27 May 1981) which sampled redfish larvae I l l mm (Fig. 2), and in which feeding was generally poorer. It is possible that feed- ing was suboptimal, such that normal diurnal feeding patterns were not established at these times.
Seasonal and interannual differences in feeding
The amount of food redfish ate varied both among years and for different periods within years. In general, the index (based on standardized stomach weights) increased later in the season. This was most apparent in 1981 where the index increased from a low of 0.085

Mar. Ecol. Prog. Ser. 104: 211-226, 1994
1 20-24 Mar 1979
5- 4 m / .
g 0200 0600 1000 1400 l800 2200
I 24: 23-27 Apr 1979 0 a 20:
16- / h l',
//-L/--
P 12:/ = \, 1. \/-d /..m' (I)
4 - 0-- - , , , , , , ,W
6
6-1 3 Apr 1980 .C \
24
20
16
12
8
4
0
0200 0600 1000 1400 1800 2200
] 22-27 May 1981
2-9 May 1981 l"\
Table 4. Sebastes spp. Mean stomach weight (pg) standardized for fish size (mm3) for redfish larvae sampled on Flemish Cap. Mean standardized stomach weights were calculated for each size class within each cruise and then an overall mean was
calculated from these mean estimates. SD: standard deviation; CV: coefficient of variation
- - : -
TIME OF DAY (00:OO h) 1404
Cruise Sampling dates Redfish sizes Mean SD CV (mm) (W mm-3) (X)
GAD019 20-24 Mar 1979 4-7 0.124 0.0441 35.6 GAD020 23-27 Apr 1979 5-11 0 281 0.0836 29.8 DAW079 10-14 Jul 1979 4-11 0.344 0.0749 21.8
GAD035 6-13 Apr 1980 5-7 0.109 0.0040 3.7 GAD037 20-26 May 1980 6-14 0.381 0.0753 19.8 ZAG004 22-28 J u ~ 1980 5-11 0.055 0.0437 79 5
12-24 0.449 0.1581 35 2
GAD050 2-9 May 1981 6-11 0.085 0.0369 43.4 GAD051 22-27 May 1981 6-11 0.109 0.0378 34.7 HAWPAN 26-30 Jun 1981 6-7 0.070 0.0170 24.3
8-16 0.351 0.0378 10.8 HAW002 1-4 A u ~ 1981 7-11 0.088 0.0504 57.3
13-24 0.311 0.1921 61.8 ATC331 1-3 Aug 1982 6-1 1 0.242 0.1839 76.0
16-23 0.642 0.2422 37.7
\ .\ \ /- :,
-,, 26-30 J u n 1981 /-\ \
\ I \-,'--L
\ I I . m . ' 1 . -.\ ' ' \ I /N..-/'
\,B ---,;\4J / / X m \ / , ! l
JULY - AUGUST CRUISES loo-
I \ \
\ 1 \ \ I . \ \ I \ : \ / I \ /-,
\ I I \ ' , ,. Ah,/-,m-' m \
80-'
I 60 0 0 4 2 40- = 20-
/ / D / ,--X'
/ B / \&@-,A ,- - 1
600 l- = 500- g S 5 400 In 300- g 0-.--7
\ ,/
0200 0600 1000 1400 l800 2200
TIME OF DAY (00:OO h)
p
10 Jul-4 Aug, 1979-1982 /-\\-l
1 -/. I \ \ I . '
/ m
9 Fig. 2. Sebastes spp. Diurnal pattern of redfish stomach weight (pg dry wt) 0200 0600 1000 1400 l800 2200 averaged for each cruise, f 2 SE. Interpolation between each 2 h period is
TIME OF DAY (00:Oo h) smoothed using a spline fit to the means. Periods of darkness (diagonal shading) and light (open) are indicated at the bottom of each panel

Anderson: Feeding ecology of redfish 219
1979 and 1980. $ A seasonal increase in the amount of 6 -
food redfish ate per unit size would 2 occur if pelagic juvenile redfish are p 0.3 - better feeders than larvae. There are 3 lines of evidence in support of this g observation. First, the index increased from 0.109 during 22-27 May to 0.351 2 l.
during 26-30 June 1981, which relates 2 to feeding for larvae and juveniles m
00 - respectively. Second, differences in I
I I I
5 6 7 8 S 10 1 1 12 13 l 4
the index were observed among 4 LENGTH (mm)
cruises which sampled both small (lar- vae) and large (juveniles) redfish. In Fig. 3. Sebastes spp. Redfish stomach weights standardized by redfish dry wt each case the index of standardized (f 2 SE) versus redfish length (mm) for 20-26 May 1980 and 22-27 May 1981 stomach weights was considerably less for larvae (range 0.055 to 0.242) than for pelagic juveniles (range 0.311 to 0.642) Limacina sp. was neutrally selected. Prey types clas- (Table 4 ) . Third, comparison between May 1980 and sified as 'Other' generally were not selected by redfish 1981 demonstrated that differences in feeding which larvae (i.e. less than neutral). The 'Other' prey types occurred between larvae were not evident between that occurred in the diet for these 4 cruises were exclu- juveniles (Fig. 3). All length groups from 7 to 11 mm sively Protozoa. The most common food types were had significantly greater standardized stomach tintinnids. Globigerina sp. and radiolarians, although weights in 1980 (Table 5). The mean difference tended radiolarians were only abundant as an 'Other' food to decrease with increasing fish length and by type in the 20-26 May 1980 cruise (73% of 'Other' 12 mm the means were no longer statistically different prey types). Globigerina spp, typically range in size (Table 5). At 12 mm length most redfish had metamor- from 0.270 to 0.800 mm (Newell & Newel1 1977), and phosed to pelagic juveniles. would be retained by both the 0.080 mm and 0.165 mm
In general, standardized stomach weights of juve- nets (see below). Protozoans dominated 'Other' food niles were consistently high, whereas those for larvae types in the diet for all other cruises. Later in the sea- were high only for 20-26 May 1980, when redfish lar- son 'Other' food types which also occurred in the diet vae were growing relatively fast and were in better included Oikopleura spp. (ZAG004), Parathemisto condition. Feeding was relatively poor in redfish lar- spp. (HAWPAN), fish eggs (ZAG004) and Isopoda vae from all other cruises. (HAW002). Prey types classified here as 'Other' were
always a small component of the overall redfish diet by weight (Table 2).
Feeding selectivity
to values >0.3 from 2-9 May to 1-4 0.6 -
August 1981 (Table 4). A similar sea- k j sonal increase was also observed in Q 0 5 -
During 4 cruises which occurred in different years Table 5. Sebastes spp. Wilcoxon's test of difference between and seasons, redfish larvae consistently selected cope- standardized stomach weights (weight of stomach per weight
20-26 May 1980 22-27 May 1981
pod eggs and larvae, but did not select copepodites of redfish) for each mm length group sampled May 1980 (Fig. 4). This observation is based on the mean value of versus 1981. n, and n2: 20-26 May 1980 and 22-27 May 1981
respectively. z: Wilcoxon's test statistic selectivity compared to neutral selection. Mean values of selectivity were greater for copepod nauplii than for eggs in 3 of 4 cruises. During 2-9 May 1981, cyclopoid eggs were not selected by redfish larvae, with all val- ues falling below neutral selection. However, 3 wk later larvae were actively selecting cyclopoid eggs. The larger calanoid copepodites (predominantly Calanus sp.) on average had lower selectivity than small cyclopoid copepodites (predominantly Oithona
SPP.).
Length group (mm) n,, n2 z P
6 44 , 2 -0.9965 0.3190 7 123, 12 -4.0012 0.0001 8 146, 55 -4.2499 0.00001 9 153. 78 -5.3535 0.00001
10 145, 26 -2.7553 0.0059 11 105. 48 -4.8148 0.00001 12 52. 10 -0.2010 0.8407

Mar. Ecol. Prog. Ser. 104: 211-226, 1994
-3
-4
-5
-6 2-9 May 1981
-7,
B C D E F G H I
-6
-7 22-27 May 1981 3
PREY TYPE
-9
C D F E H
PREY TYPE
Fig. 5. Sebastes spp. Redfish feeding selectivity calculated for 8 food types for 2 cruises using 0.165 mm mesh zooplankton samples. a,: Chesson's alpha index for prey species i, plotted here as log e. Redfish analyzed 26-30 June 1981 ranged in length from 9 to 15 mm and 1-4 August 1982 from 16 to 23 mm. The dashed line references the estimate of neutral selectivity. Prey type - A: calanoid eggs; B. cyclopoid nauplii; C . calanoid nauplil; D: Oithona spp. copepodite; E: Limac~na sp., F: euphausuds; G: Calanus finmarchicus copepodite;
H: other copepod copepodites; I: other prey types
Fig. 4. Sebastes spp. Redfish feeding selectivity calculated for 8 food types for 4 cruises using 0.080 mm mesh zooplankton samples. Mean selectivity is plotted with minimum and maxi- mum values calculated for each food type within a cruise. a,: Chesson's alpha index for prey species i, plotted here as log e. The dashed line references the estimate of neutral selectivity. Prey type - A: copepod eggs; B: cyclopoid eggs; C: calanoid eggs; D: cyclopoid nauplii; E: calanoid nauplu; F: Limacina sp.; G: Oithona spp. copepodite; H: Calanus finmarchicus cope-
podite; I: other prey types
It was also possible to calculate prey selectivity for 2 cruises later in the season (26-30 June 1981 and 1-3 August 1982) when zooplankton were collected using 0.165 mm mesh nets. Selectivities calculated from these samples are biased by the fact that 0.165 mm mesh nets will not quantitatively sample copepod eggs and nauplii (Davis 1980). However, these nets will retain at least Pseudocalanus spp. stage C1 (0.4 mm TL), and possibly smaller (Davis 1980). A statistical approximation gave a mean retention of 0.26 f 0.08 mm, which corresponds closely with the size of Oithona spp. C1 of 0.23 f 0.07 mm (Murphy & Cohen 1978). Therefore, prey selectivity would be overesti- mated for copepod eggs and nauplii but not for the copepodite stages which would be quantitatively sam- pled by 0.165 mm mesh nets.
Redfish sampled during June 1981 and August 1982 were predominantly pelagic juveniles ranging in length from 9 to 15 and 16 to 23 mm respectively. Dur- ing June these juvenile redfish were, on average, selecting cyclopoid copepodites, in addition to select- ing copepod eggs and nauplii (Fig. 5). By August all selectivities for cyclopoid copepodites were above the level of neutral selection. However, the larger calanoid copepodites, which were predominantly Calanus fin- marchicus stage CV (Anderson 1990), were not actively selected by juvenile redfish. During both cruises euphausiid furcilia larvae were neutrally selected (Fig. 5) although they were an unimportant component of the diet accounting for < 1 % by both weight and number. During both cruises copepodites dominated the diet (Table 2). Therefore, there appeared to be a switch in prey selectivity to cyclopoid copepodites later in the season after the redfish meta.- morphosed to the pelagic juvenile stage.

Anderson: Feeding ecology of redfish
Redfish larvae (6 to 8 mm) were also captured during the June and August cruises, and were most likely the later spawning species Sebastes fasciatus (Barsukov & Zakharov 1972, Templeman 1976, Penney 1987). Selectivity results for the smaller fish (larvae) differed from those for the larger fish (juveniles), as the larvae did not select Oithona spp. copepodites. These results are similar to those for larval redfish analyzed for the April-May period in 1980 and 1981 where the total size range was 6 to 12 mm (Fig. 4). Therefore, selectiv- ity results were similar for all larval redfish 112 mm for the period spanning early April to early August.
Redfish condition
Redfish were in better condition in 1980 than in 1981, based on a comparison at the end of May each year. Comparison over all length groups demonstrated that redfish 6 to 11 mm in length weighed significantly more in 1980 than in 1981. Only at 12 mm length was there no difference (Table 6). Comparison of percent differences in weight demonstrated that 1980 redfish 6 to 10 mm in length weighed 34.4 to 50.1 % more, after which the difference in weight decreased to 10 to 16 %. Redfish > 10 mm were undergoing, or had under- gone, metamorphosis (see below) indicating that the difference in weight which occurred between these years occurred only for the larval stage. The rapid recovery in weight for larger redfish represents those fish which survived to metamorphosis, which may represent differential size-dependent survival or in- creased growth for these juveniles.
Metamorphosis from larvae to pelagic juveniles
Comparison of size at metamorphosis was made at the end of May, which coincided with the end of the
Table 6. Sebastes spp. Wilcoxon's test of differences in redfish dry wt ( ~ g ) for each length group (mm) between 20-26 May 1980 versus 22-27 May 1981. n, and n2: sample size for 1980 and 1981 respectively. z: Wilcoxon's test statistic; Percent
diff.: difference between years relative to 1980 data
Length group n, , n2 z p Percent (mm) diff.
6 39, 3 -2.3935 0.0167 34.3 7 136, 15 -5.8011 0.00001 50.1 8 155, 58 -8.6939 0.00001 36.6 9 160, 82 -9.5851 0.00001 36.1
10 151, 27 -6.3198 0.00001 34.4 11 110, 49 -4.8624 0.00001 16.3 12 37, 9 -1.4122 0.1579 11.0
22-26 May 1980
6 7 8 9 10 11 12 13
REDFISH LENGTH (mm)
Fig. 6. Sebastes spp. Metamorphosis of redfish from larvae to pre-juveniles determined by the degree of flexion at different lengths (mm) for 20-26 May 1980 and 22-27 May 1981. Pre- flexion, flexion and post-flexion refer to flexion stages 1 to 3
respectively
larval period. In 1980 flexion had begun in 47.5 % of redfish at 8 mm, 77.3 % at 9 mm and was complete by 13 mm (Fig. 6). In 1981 no redfish at 8 mm had begun flexion while only 23.4% of the 9 mm larvae and 55.4 % of the l l mm larvae had begun flexion and all of the 13 mm larvae were in flexion (Fig. 6). Not only did redfish begin flexion at a larger size in 1981 but it occurred over a larger size range compared to 1980. Comparison of the percent of larvae that were in flex- ion as a function of length was statistically different (p < 0.0001, Kolmogorov-Smirnov test). Considering growth and metamorphosis of redfish size as a contin- uous process, then the size at which 50 % of the redfish were in flexion differed by 2.72 mm between 1980 and 1981. Based on growth rates for these fish (Penney & Evans 1985), this equates to a time difference of 17 d at 1980 growth rates and 25 d at 1981 growth rates.
DISCUSSION
Diet and feeding of larvae
Both the maximum prey size and the variety of prey types increased in the diet, as redfish increased in size,

222 Mar. Ecol. Prog. Ser. 104: 211-226, 1994
1. - while the nauplii range from 0.22 to 0.61 mm in length (Ogilvie 1956). By comparison, Oithona similis nauplii range in length from 0.115 to 0.215 (Gibons & Ogilvie 1933) and cope- podites from 0.230 to 0.515 mm total length (Conway & Minton 1975).
Other studies have demonstrated that fish larvae can have strong prey preferences for one or more species selected from a variety of prey types that are all within the same size ranges (Shelbourne 1962, Ryland 1964, Checkley 1982, Gadomski & Boehlert 1984, Monteleone & Peterson 1986). For example, cod and haddock larvae did not select Oithona spp. but pre- ferred eggs, nauplii and copepodites of a small calanoid copepod (Pseudo- calanus spp.) of comparable size (Kane
Fig. 7. Sebastes spp. Schematic representation of prey preferences for a 9.0 mm 1984). Reasons why fish larvae prefer larva and a 12 0 mm pelagic juvenile redfish. The prey are represented as eggs, a particular prey type are not known, nauplii and copepodites for Calanus finrnarchicus (Nos. 2, 4 and 6) and Oithona It has been hypothesized that fish lar- similis (Nos. 1, 3 and 51, with the bars representing their sizes, drawn to scale with respect to the redfish. The dashed Lines enclose the preferred prey types. prefer prey that The figure emphasizes that 0. s W s copepodites are not a preferred prey, even would be easily captured (Drenner et
though they are very similar in size to C. finmarchicus nauplii al. 1978). Alternatively, it has been hypothesized that larvae prefer mov- ing, relatively active prey because
from March to August. These observations are charac- they are easier to see (Peterson & Ausubel 1984). In teristic of fish larvae. Examples include redfish (Bain- studies reporting the avoidance of Oithona spp. as a bridge & McKay 1968, Marak 1974), cod and haddock prey item it was hypothesized that the copepodites of (Kane 1984), flounder, sole and dab (Last 1978), this cyclopoid species hold their antennae at right Atlantic herring (Cohen & Lough 1983), mackerel angles to their body, effectively increasing the prey (Peterson and Ausubel 1984, Ware & Lambert 1985), width thereby making them difficult to ingest (Cohen sandlance (Ryland 1964, Monteleone & Peterson 1986), & Lough 1983, Kane 1984). northern anchovy, Pacific sardine and jack mackerel (Arthur 1976). Only in highly selective feeders such as plaice (Shelbourne 1962, Ryland 1964, Last 1978) and English sole (Gadomski & Boehlert 1984) that feed exclusively on Oikopleura sp. does the variety of prey types not increase with increasing fish size, although the size does.
A change in diet will result from changes in prey availability, when prey selectivity has not changed. Seasonal differences in prey availability were more apparent for redfish larvae (19 mm), as the diet of these larvae differed while prey selectivities did not. Larval diet early in the season was dominated by cope- pod eggs and nauplii whereas by July-August the diet was dominated by Oithona spp. copepodites. Regard- less of the season, larvae always selected copepod eggs and nauplii but did not select Oithona spp. cope- podites, in spite of size ranges which are very similar (Fig. 7). Calanus finmarchicus eggs are approximately 0.135 mm in diameter (Bainbridge & McKay 1968)
Seasonal cycles
The seasonal shift in diet of redfish larvae can be in- terpreted with respect to the seasonal production cy- cles of Calanus finmarchicus and Oithona similis, the 2 dominant copepod species on Flemish Cap (Anderson 1990). The seasonal dynamics of these 2 species are very different. C. finmarchicus is characterized as a large, herbivorous calanoid that spawns in spring in di- rect proportion to the spring bloom of diatoms (Krause & Trahms 1983, Runge 1988). While it may produce more than one generation each year, it is essentially univoltine in terms of its annual production (McLaren & Corkett 1986). It develops rapidly at rates directly dependent on water temperatures (Corkett et al. 1986), and stage development within the nauplii and cope- podite stages results in relatively large increases in biomass at each stage (McLaren & Corkett 1986). On

Anderson: Feeding ecology of redfish
Flemish Cap spawning began in March and peaked sometime in April. By the end of June the spring pro- duction of eggs and nauplii was complete, with cope- podites (CV) predominating (Anderson 1990).
In contrast, Oithona similis is a small, omnivorous cyclopoid. I t spawns independently of the spring bloom and is multivoltine, producing a number of gen- erations with more or less continuous development for at least half the year (McLaren & Corkett 1986). Its relatively small size for all stages result in small bio- mass increases as each stage develops within each generation (op. cit.). While its development rate is tem- perature dependent, the increase in development rate is slow compared to Calanus finmarchicus, based on development rates given by McLaren (1978) for 0 . similis and Corkett et al. (1986) for C. finmarchicus. For example, at ?'C it takes C. finmarchicus 18 d to develop from an egg to stage CI, whereas it takes 0. similis 37 d.
The seasonal diet change of redfish larvae with respect to the zooplankton indicates that available prey in the preferred size range of these larvae typi- cally shifts from eggs and nauplii of Calanus fin- marchicus to nauplii and copepodites of Oithona sim- ilis. Because redfish larvae did not actively select Oithona copepodites, the seasonal replacement in the diet of C. finmarchicus nauplii with Oithona cope- podites may be disadvantageous to feeding, growth, and possibly survival of redfish larvae. This observa- tion is supported, in part, by standardized stomach weights for redfish larvae. Values during April and May were always high compared to values in June-August which ranged from high to low in differ- ent years. Differences in the seasonal timing of the spring production of C. finmarchicus and the release of redfish larvae may result in poor larval feeding condi- tions.
Differences in larval diets, and therefore prey avail- ability, also occurred for 1981 compared to 1980 and 1979. Redfish sampled in May 1981 predominantly ate cyclopoid nauplii and copepodites, compared to redfish in 1979 and 1980 which ate calanoid eggs and nauplii. As noted previously, the size ranges of these prey types are approximately equal. The low selection of Oithona copepodites by redfish larvae, together with the signifi- cantly lower feeding rates and relative condition of lar- vae in 1981, suggests that this food type was an inade- quate replacement for Calanus sp. nauplii.
Prey concentrations
Differences observed between years in larval feed- ing rates and condition did not relate directly to prey concentrations. Densities and total biomass of cope-
pods were greater in May 1981 (Anderson 1990) than May 1980 even though feeding rate was lower. Oithona spp, and Calanus finmarchicus were approxi- mately 3.7 and 2.4 times more abundant in 1981, respectively. While total copepod concentrations were higher in 1981 compared to 1980, Oithona spp, was rel- atively more abundant than C. finmarchicus. In addi- tion, copepod nauplii were 4.2 times more abundant in 1981, although 94 % of these nauplii were classified as cyclopoids. These results indicate that total prey con- centrations were greater in 1981 and this was espe- cially true for Oithona spp. This difference in prey availability was reflected in the diet of redfish larvae that was dominated numerically by small cyclopoid nauplii and in biomass by Oithona spp. copepodites in 1981. However, even though prey concentrations were higher in 1981, the amount of food eaten, as weight per unit fish, was lower than in 1980, as was the relative condition of the redfish larvae. Feeding on many small prey items (cyclopoid nauplii) versus a few large items (calanoid nauplii) is generally considered to be disad- vantageous to growth and survival (Pyke 1984). These results suggest that feeding conditions in 1981 were poor, not because of lower prey concentrations, but because these prey were, on average, one-tenth the size of the predominant prey eaten in 1980.
Metamorphosis
The diet of pelagic juvenile redfish was increasingly dominated by copepodites of Oithona spp. and Calanus finmarchicus as the season progressed and the fish grew. This coincided with an increased selec- tivity for Oithona spp. copepodites. Chronologically, the switch in diet from C. finnmarchicus eggs and nauplii to Oithona spp. copepodites appears to begin sometime in June. This coincides with the metamor- phosis of redfish from larvae to pelagic juveniles, the end of the spring development cycle when C. fin- marchicus reaches stage CV (i.e. diapause), and the increased biomass of Oithona spp. relative to C. fin- marchicus in the zooplankton community (Anderson 1990). Bainbridge & McKay (1968) reported a similar shift in the diet of redfish from Calanus eggs and nau- plii to copepodites at 14 to 16 mm, which corresponds to redfish that have recently metamorphosed. The transition from larva to juvenile is probably an impor- tant phase in the life history of redfish. When they metamorphose redfish acquire fin rays and vertebrae which are expected to increase their swimming perfor- mance. In addition, they also develop gill rakers at this time which should aid in the retention of small food particles (Einarrson 1960, Bainbridge & McKay 1968), such as the nauplii of Oithona spp.

224 Mar. Ecol. Prog. Ser. 104: 211-226, 1994
Coincident with the change in diet at metamorphosis there appeared to be an increase in feeding rate, based on standardized stomach weights. This was true when comparing values for larvae in early and late May 1981 (0.085 and 0.132 yg mm-3 respectively) versus juve- niles sampled in late June and early August (0.351 and 0.311 yg mm-3 respectively) of the same year. During each cruise in 1981, the diet was dominated by cope- podites (Table 2). Improved feeding following meta- morphosis might occur due to an increased ability to capture Oithona spp. copepodites, which dominate the prey field at this time of year.
There was a consistent difference between years, where larval redfish ate more, were in better condition and metamorphosed at smaller sizes in 1980. In addi- tion, these redfish grew significantly faster (Penney & Evans 1985). These results indicate that size at meta- morphosis is adaptive, shortening the larval period when conditions for feeding and growth are favourable. Experimental studies have demonstrated that fish larvae which grew faster went through meta- morphosis earlier, at smaller sizes, and were larger than fish that metamorphosed later, when compared at a common age (Chambers & Leggett 1987, Chambers et al. 1988). Given the seasonal succession of zoo- plankton on Flemish Cap, it is reasonable to hypothe- size that an earlier metamorphosis is generally advan- tageous for feeding, and subsequently growth and survival of redfish.
Match/mismatch of redfish and their prey
Redfish release larvae predominantly in association with the spring spawning of Calanus finmarchicus, when the preferred prey of redfish larvae are plentiful. When the timing of appearance of first-feeding larvae is relatively constant but annual phytoplankton and zooplankton production varies there will be good and poor matches of fish larvae and their food, as outlined by Cushing (1975, 1990). Results of this study indicate that redfish larvae occurred in association with the annual spawning and production cycle of C. finmarchi- cus in 1980, but not in 1981.
Analysis of the zooplankton on Flemish Cap demon- strated that the seasonal production cycle of Calanus finmarchicus was earlier in 1981, a year of significantly warmer temperatures (Anderson 1990). The difference between 1980 and 1981 could be explained by temper- ature-dependent development but also may have been due to an earlier spawning of C. finmarchicus. In con- trast, the time of peak release of redfish larvae was not different in 1980 and 1981 (Penney & Evans 1985). Therefore, it appears a poor match occurred between redfish larvae and their preferred prey in 1981. Such a
mismatch is supported by observations on larval diet and relative feeding rates. Further, these observations suggest that the match of redfish larvae with their pre- ferred prey is dependent on both the onset of copepod spawning and their rate of temperature dependent development during spring. It is also noteworthy that the higher overall concentrations of copepods (primar- ily nauplii and copepodites of Oithona spp.) in 1981 did not compensate for availability of the preferred prey of redfish larvae.
Ellertsen et al. (1989) have reported a similar match/mismatch of cod larvae and their prey. They reported that the time of peak cod spawning only var- ied by 1 wk over many years, in contrast to peak spawning of Calanus finmarchicus which varied by almost 7 wk. Poor matches of cod larvae with their prey occurred during both warmest and coldest years, with early spawning of C. finmarchicus occurring during warm years. Finally, they reported that the food of cod larvae is predominantly eggs and nauplii of C. fin- marchicus but that during the warmest year recorded (1960) cod larvae fed predominantly on Oithona spp. (Sysoeva & Degtyareva 1965) which lead to a poor year-class of cod. The similarity of these observations to those observed for Flemish Cap redfish suggest that the timing of spring spawning of C. finmarchicus and its subsequent temperature dependent development is a critical determinant of larval fish feeding, growth and ultimately survival in marine systems dominated by this large herbivorous zooplankton.
Acknowledgements. Data for this study were collected d u m g several research cruises to Flemish Cap and involved many people over a number of years. Technical assistance was pro- vided by R. Penney, T. Shears, C. Fitzpatrick and others. Par- ticular thanks to the captains and crews of the 'Gadus Atlantica', the primary ship used during the study. This work also formed part of my Ph.D. thesis and benefited from the input and reviews of C. Walters, T Parsons, D. Ware, K. Bai- ley and E. Houde. This paper has been substantially improved in its presentation by reviews from G. Lilly, J. Morgan and 3 anonymous reviewers.
LITERATURE CITED
Anderson, J . T (1984). Early Me history of redfish (Sebastes spp.) on Flemish Cap. Can. J. Fish. Aquat. Sci. 41: 1106-1116
Anderson, J. T. (1988). A review of size dependent survival during pre-recruit stages of fishes in relation to recruit- ment. J. Northw. Atl. Fish. Sci. 8: 55-66
Anderson, J. T (1990). Seasonal development of invertebrate zooplankton on Flemish Cap. Mar. Ecol. Prog. Ser. 67: 127-140
Anderson, J. T (1992). Feeding ecology of larval and juvenile redfish on Flemish Cap. Ph.D. thesis, University of British Columbia, Vancouver
Arthur, D. K. (1976). Food and feedng of larvae of three fishes occurring in the Cahfornia current, Sadinops sagax,

Anderson Feeding ecology of redfish 225
Engraulis mordax, and Trachurus s)rmmetricus. Fish Bull. U.S. 74: 517-530
Bainbndge, V , McKay, B. J . (1968). The feeding of cod and redfish larvae Spec Publ. int. Comm. NW Atlant. Fish. 7 187-217
Barsukov, V V., Zakharov, G. P. (1972). Morphological and biological characteristics of the American redfish Trudy polyar. nauchno-issled lnst morsk. rybn Khoz Okeanogr 28: 143-173 (Fish. Res. Bd Can. Transl. Ser. No 2488, 1973)
Buckley, L. J. , Lough, R G. (1987). Recent growth, biochemi- cal composition and prey field of larval haddock (Melanogrammus aeglefinus) and Atlantic cod (Gadus morhua) on Georges Bank. Can. J . Fish Aquat. Sci. 44: 14-25
Chambers, R. C., Leggett, W. C. (1987). Size and age at meta- morphosis in marine fishes: an analysis of laboratory- reared winter flounder (Pseudopleuronectes americanus) with a review of vanation in other species. Can. J. Fish. Aquat. Sci. 44: 1936-1947
Chambers, R. C., Leggett, W. C., Brown, J . A. (1988). Varia- tion in and among early life history traits of laboratory- reared winter flounder Pseudopleuronectes americanus. Mar. Ecol. Prog. Ser. 47: 1-15
Checkley, D. M. (1982). Selective feeding by Atlantic herring (Clupea harengus) larvae on zooplankton In natural assemblages. Mar. Ecol. Prog. Ser. 9: 245-253
Chesson. J (1978). Measuring preference in selective preda- tion. Ecology 59: 21 1-215
Cohen, R E., Lough, R. G (1983). Prey field of larval herniig Clupea harengus on a continental shelf spawning area Mar. Ecol. Prog. Ser. 10: 21 1-222
Conway, D. V P., Minton, R C. (1975). Identification of the copepodid stages of some common calanoid copepods Dept Agr Fish. Scot. Mar. Lab. New Ser No. 7
Corkett, C. J., McLaren, I . A., Sevigny, J. M. (1986). The rear- ing of the Calanoid copepods Calanus finmarchicus (Gun- nevus), C. glacialis Jaschnov and C. hyperboreus Kroyer with cmment on the equiportional rule. In: Schnever, G., Schminke, H. K. Shlh, C.-T. (eds.) Proceedings of the 2nd international conference on Copepoda. Syllogeus 58, p. 539-546
Cushlng, D. H. (1975). Manne ecology and fisheries. Cam- bndge Univ. Press, Cambridge
Cushing, D. H. (1990). Plankton production and year-class strength in fish populations: an update of the match/mis- match hypothesis. Adv. mar. Biol. 26: 2149-293
Davis, C. S. (1980). P re lmnary estimates of copepod extru- sion from 0.333 mm and 0.165 mm mesh plankton nets. NW Atlant. Fish. Org. scient. Coun. Res. Doc. 80/IX/132 Ser. No. N206, p. 1-17
Drenner, R. W., Strickler, J . R., Obrien, W. J. (1978). Capture probability: the role of zooplankter escape in the selective feeding of planktivorous fish. J . Fish. Res. Bd Can. 35: 1370-1373
Einarrson, H. (1960). The fry of Sebastes in Icelandic waters and adjacent seas. Rit Fiskideildar, 2nd edn. Vol. 11, No. 7, p . 1-67
Ellertson, B., Fossum, P,, Solemdal, P,, Sundby, S. (1989). Relation between temperature and survival of eggs and first-feeding larvae of northeast Arctic cod (Gadus morhua L.). Rapp. P.-v. Reun. Cons. int. Explor. Mer 191: 209-219
Forher, L.. Leggett, W. C. (1985). A drift study of larval fish survival. Mar. Ecol. Prog. Ser. 25: 245-257
Gadomslu, D. M., Boehlert, G. W. (1984). Feeding ecology of pelagic larvae of English sole (Parophrys vetulus) and but- ter sole (Isopsetta isolepis) off the Oregon coast. Mar. Ecol.
Prog. Ser. 20: 1-12 Gibons, S. G., Ogilvie, H. S. (1933). The developmental stages
of O~thona helgolandjca and Oithona spinirostris, with a note on the occurrence of body spines in cyclopoid nauplii J mar. biol. Ass. U.K. 18: 529-550
Houde, E. D. (1987). Fish early life dynamics and recruitment variability. Am Fish. Soc. Symp. No. 2: 17-29
Hewitt, R P., Theilacker, G. H . , Lo, N. C . H. (1985). Causes of mortal~ty in young jack mackerel. Mar. Ecol Prog. Ser. 26: 1-10
Hjort, J . (1914) Fluctuations in the great fisheries of northern Europe reviewed in the light of biological research. Rapp. P,-v. Reun Cons. int. Explor. Mer 20. 1-228
Kane, J. (1984). The feeding habits of CO-occurnng cod and haddock larvae from Georges Bank. Mar. Ecol. Prog. Ser. 16: 9-20
Kenchington, T. J. (1991). Vertical d~stribution and move- ments of larval redfishes (Sebastes spp.) in the southern Gulf of St. Lawrence. J. Northw. Atl. Fish Sci. 11: 43-49
Krause, M,, Trahms, J. (1982). Vertlcal bstribution of cope- pods (all developmental stages) and other zooplankton during spring bloom in the Fladen Ground area of the North Sea. Neth. J . Sea Res. 16: 217-230
Krause, M , Trahms, J (1983) Zooplankton dynamics dunng FLEX'76. In: Sinderman, C. , Lenz, J. (eds.) North Sea dynamics Spnnger-Verlag, Berlin, p . 632-661
Lasker, R (1975). Field cntena for survival of anchovy larvae: the relation between inshore chlorophyll maximum layers and successful first-feebng. Fish. Bull. U.S 73: 453-462
Lasker, R. (1981). Factors contributing to vanable recruitment of the northern anchovy (Engraulis mordax) in the Califor- nia Current: contrasting years, 1975 through 1978. Rapp. P -v Reun. Cons. int. Explor. Mer 178: 375-388
Last, J . M (1978). The food of four species of pleuronectiform larvae in the eastern English Channel and Southern North Sea . Mar. Biol. 45: 359-368
Lechowlcz, M. J. (1982). The sampllng characteristics of elec- tivlty indlces. Oecologia 52: 22-30
Leggett, W. C. (1986). The dependence of fish larval survival on food and predator densities In: Skreslet, S . ( e d ) The role of freshwater outflow in coastal marine ecosystems. Spnnger-Verlag, Berlin, p. 117-137
Lllly, G. R. (1987). Synopsis of research related to recruitment of Atlantic cod (Gadus morhua) and Atlantic Redfishes (Sebastes sp.) on Flemsh Cap. NW Atlant Fish. Org. sci- ent. Coun. Stud. 11: 109-122
Marak, R. R. (1974). Food and feeding of larval redfish in the Gulf of Malne. In Blaxter, J. H. S. (ed.) The early Me his- tory of fish Springer-Verlag, Berlin, p. 267-275
May, R C . (1974). Larval mortality in marine fishes and the critical period concept. In: Blaxter, J. H. S. (ed . ) The early life history of fish. Springer-Verlag, Berlin, p. 3-19
McGurk, M. D. (1985). The role of starvation in the population dynamics of larval Pacific herring, Clupea harengus palasj Ph.D. thesis, Univ. British Columbia, Vancouver
McGurk, M. D. (1989). Advection, diffusion and mortality of Pacific hernng larvae Clupea harenguspallasi in Barnfield Inlet, Bntlsh Colun~bia. Mar. Ecol. Prog. Ser 51: 1-18
McLaren, I. A. (1978). Generation lengths of some temperate nianne copepods: estimation, prediction, and implications. J . Fish. Res. Bd Can. 35: 1330-1342
McLaren, I. A., Corkett, C. J. (1986) Life cycles and produc- tion of two copepods on the Scotlan Shelf, eastern Canada. In. Schnever, G. , Schrninke, H K. Shih, C.-T (eds.) Pro- ceedings of the 2nd international conference on Cope- poda. SyUogeus 58, p. 362-368
Monteleone, D. M., Peterson, W. T. (1986). Feeding ecology of

226 Mar. Ecol Prog. Ser.
American sandlance Ammodytes amencanus larvae from Long Island Sound. Mar. Ecol. Prog. Ser. 30: 133-143
Murphy, J . A., Cohen, R. E. (1978). A guide to the develop- mental stages of common coastal, Georges Bank and Gulf of Maine copepods. NMFS Lab. Ref. No. 78-53: 1-56
Newell, G. E., Newell, R. C. (1977). Marine plankton: a prac- tical guide. Hutchinson, London, 244 p.
Ni, I.-H. (1982). Meristlc variation in beaked redfishes, Sebastes marinus, compared to beaked redfishes of the Northwest Atlantic. Can. J. Fish. Aquat. Sci. 39: 1664-1685
Ni, I.-H., McKone, W. D. (1983). Distribution and concentra- tion of redfishes in Newfoundland and Labrador waters. NAFO Sci. Coun. Stud. 6: 7-14
OtConnell, C. P. (1980). Percentage of starving northern anchovy, Engrauhs mordax, larvae in the sea as estlrnated by histological methods. Fish. Bull. 78: 475-489
Ogilvie, H. S. (1956). Copepod nauplii (I). Cons. int. Explor. Mer Zooplankton Sheet 50: 1-4
Pearre, S. Jr (1982). Estimating prey preference by predators: uses of various indices, and a proposal of another based on X'. Can. J . Fish. Aquat. Sci. 39: 914-923
Penney, R. W (1985). Development of deep-water redfish (Sebastes mentella) larvae, with comparative notes on newly extruded Acadian redfish (Sebasfes fasciatus) from the Flemish Cap. Can. J. Zool. 65: 1167-1180
Penney, R. W. (1987). Comparative morphology of pre-extru- slon larvae of the north Atlantic sharp-beaked redfishes, Sebastes mentella and Sebastes fasciatus (Pisces: Scor- paenidae). Can. J. 2001. 63: 1181-1188
Penney, R. W., Evans, G. T. (1985). Growth histories of larval redfish (Sebastes spp.) on an offshore Atlantic fishing bank determined by otolith increment analysis. Can. J. Fish. Aquat. Sci. 42: 1452-1464
Penney, R. W., Power, D. J., Atkinson, D. B. (1984). Species proportion and some reproduction aspects of three redfish species (Sebastes marinus, S. fasciatus and S. mentella) on the Flemish Cap, March 1983. NW Atlant. Fish. Org. sci- ent. Coun. Res. Doc. 84/VI/22 Ser. No. N797
Perry, R. I., Neilson, J. D. (1988). Vertical distributions and trophic interactions of age-0 Atlantic cod and haddock in mixed and stratified waters of Georges Bank. Mar Ecol. Prog. Ser. 49: 199-214
Peterman, R. M., Bradford, M. J. (1987). Wind speed and mor- tality rate of a marine fish, the northern anchovy (Engraulis mordax). Science 235: 354-356
Peterson, W. T., Ausubel, S. J. (1984). Diets and selective feeding by larvae of Atlantic mackerel Scomber scombrus on zooplankton. Mar. Ecol. Prog. Ser. 17: 65-75
Pyke, G. H. (1984). Optimal foraging theory: a critical review. A. Rev. Ecol. Syst. 15: 523-575
Rothschild, B. J., Osborn, T. R. (1988). Small-scale turbulence and plankton contact rates. J. Plankton Res. 10: 465-474.
Runge, J . A. (1988). Should we expect a relationship between
This article was submitted to the editor
primary production and fisheries? The role of copepod dynamics as a filter of trophic variability. Hydrobiologia 167/168: 61-71
Ryland, J . S. (1964). The feeding of plaice and sandeel larvae in the southern North Sea. J mar. biol. Ass. U.K. 44: 343-364
SAS, Inc. (1985). SAS user's guide: statistics, Version 5 edn. Statistical Analysis Institute, Inc., Cary, NC
Shelbourne, J . E. (1962). A predator-prey size relationship for plaice larvae feedng on Oikopleura. J. mar. biol. Ass. U.K. 42: 243-252
Shepherd, J . G., Cushing, D. H. (1980). A mechanism for den- sity dependent survlval of larval fish as the basis of a stock-recruitment relationshiop. J . Cons. 39: 160-167
Shirota, A. (1970). Studies on the mouth size of fish in the lar- val and fry stages. Bull. Jap. Soc. scient. Fish. 36: 353-368 (Fish. Res. Bd Can. Transl. Ser. No. 1978)
Siegel, S. (1956). Non-parametric statistics for the behavioural sciences. McGraw Hill, Toronto
Sundby, S., Fossum, P. (1990). Feeding conbtions of Arcto- Norwegan cod larvae compared with the Rothschild- Osborn theory on small-scale turbulence and plankton contact rates. J. Plankton Res. 12: 1153-1162
Sysoeva, T. K., Degtyareva, A. A. (1965). The relation between the feeding of cod larvae and pelaglc fry and the distribution and abundance of their principal food organ- isms. ICNAF Spec. Publ. 6: 41 1-416
Templeman, W. T. (1976). Biological and oceanographic background of Flemish Cap as an area for research on the reasons for year-class success and failure in cod and red- fish. ICNAF Res. Bull. 12: 91-11?
Theilacker, G. H. (1986). Starvation-induced mortality of young sea-caught jack mackerel. Trachurus symmetricus, determined with histological and morphological methods. Fish. Bull. U.S. 84: 1-17
Ware. D. M. (1975). Relation between egg size, growth and natural mortality of larval fish. J. Fish. Res. Bd Can. 32: 2503-2512
Ware, D. M,, Lambert, T C. (1985). Early llfe history of Atlantic mackerel (Scomber scombrus) in the southern Gulf of St. Lawrence. Can. J. Fish. Aquat. Sci. 42: 577-592
Williams, R., Conway, D. V. P,, Cohns, N. R. (1987). Vertical distnbutions of eggs, nauplii and copepodites of Calanus helgolandicus (Copepoda: Crustacea) in the Celtic Sea. Mar. Biol. 96: 247-252
Williams, R., Conway, D. V. P (1988). Vertical distribution and seasonal numerical abundance of the Calanidae in oceanic waters to the south-west of the British Isles. Hydrobiologia 167/168: 259-266
Wooster, W. S., Bailey, K. M. (1989). Recruitment of manne fishes revisited, In: Beamlsh, R. J. , McFarlane, G. A. (eds.) Effects of ocean variability on recruitment and an evalua- tion of parameters used in stock assessment models. Can. Spec. Publ. Fish. Aquat Sci. 108: 153-159
Manuscript first received: May 7, 1992 Revised version accepted: November 22, 1993