Embed Size (px)
DESCRIPTION
Understanding Size selectivity Redfish
Citation preview
Understanding the Size Selectivity of Redfish (Sebastes spp.) in North Atlantic Trawl Codends
Bent Herrmann1*‡, Manu Sistiaga2*, Kåre N. Nielsen3 and Roger B. Larsen4
1=Technical University of Denmark (DTU), North Sea Centre, DK-9850 Hirtshals, Denmark.2=SINTEF Fisheries and Aquaculture (SFA), Brattørkaia 17C, N-7010 Trondheim, Norway.3=GenØk – Centre for Biosafety, Forskningsparken in Breivika, N-9294 Tromsø, Norway.
4=University of Tromsø, Breivika, N-9037 Tromsø, Norway.
*equal authorship ‡= corresponding author Email: [email protected]
Herrmann, B., M. Sistiaga, K. N. Nielsen, and R. B. Larsen. 2012. Understanding the size selectivity of redfish (Sebastes spp.) in North Atlantic trawl codends J. Northw. Atl. Fish. Sci., 44: 1–13. doi:10.2960/J.v44.m680
Abstract
The majority of trawl selectivity studies for the three redfish species of particular commercial importance in North Atlantic fisheries: Sebastes marinus, Sebastes mentella and Sebastes fasciatus, are based on data collected from diamond mesh codends with mesh sizes ranging from 88 mm to 147 mm. We demonstrate how results from these studies can be understood by morphological characteristics of the species. We predict codend size selection based on morphological data collected from golden redfish (S. marinus) individuals. Further, consistent with previously reported morphological similarities between the three redfish species, we show the predictions for S. marinus may successfully be extrapolated to understand experimental codend size selectivity results reported for S. mentella and S. fasciatus. In addition to the comparison with previously reported data, we present new experimental results for a codend applied in Northeast Atlantic redfish trawl fishery.
Keywords: redfish, sebastes, FISHSELECT, codend selectivity, mesh size
Introduction
Three of the many redfish species present in the North Atlantic are of major commercial significance: Sebastes marinus, Sebastes mentella and Sebastes fasciatus. These three species of the Sebastes genus are similar in shape and appearance especially at small sizes (Power and Ni, 1985; Pampoulie and Danielsdottir, 2008). In particular, S. mentella and S. fasciatus were grouped together as “beaked redfish” until only a few decades ago (Barsukov, 1968; Ni, 1981).
In the International Council for the Exploration of the Sea (ICES) subareas I and II (Norwegian Sea and Barents Sea), S. marinus and S. mentella are the two most commercially important redfish species. The two species have been continually exploited in these areas in the last decades but the ICES advice for 2012 for both of them recommends closing the directed fishery and limiting bycatch until “a significant increase in the spawning-stock biomass (and a subsequent increase in the number of juveniles) has been verified ” (ICES, 2011a). Around Iceland and East Greenland (Subareas V, VI, XII, and XIV), the situation is a bit better as ICES recommends that total allowable
catches (TACs) for 2012 should not exceed 40 000 tons for S. marinus and 10 000 tons for S. mentella (ICES, 2011b). In the Northwest Atlantic (NAFO Subarea 3), the TAC for redfish (mainly S. mentella and S. fasciatus) in 2011 is set at 36 100 tons (NAFO, 2010).
The incomplete stock differentiation and interspecific hybridization observed within the Sebastes spp. stocks in the north Atlantic evidences close connection between these stocks (Cadrin et al., 2010). Thus, because of the delicate situation of some of these stocks (especially in the Northeast Atlantic) the responsible management authorities are obliged to implement effective measures to maintain or restore stocks to MSY levels (i.e. the objective that UNCLOS (The United Nations Convention on the Law of the Sea) signatories in the 2002 Johannesburg Plan committed themselves to achieve by 2015 (Froese and Proelß, 2010)). Area closures and direct fishery bans can be applied in such situations but size selectivity focused on juvenile preservation is normally the least dramatic alternative for the fishing community. Constructing a size selective trawl requires a proper understanding of the behaviour and/or size selectivity of the fish that need to be selected and rejected.
J. Northw. Atl. Fish. Sci., Vol. 44: 1–13 Publication (Upload) date: 10 01 2012
J. Northw. Atl. Fish. Sci., Vol. 44, 20122
Today, redfish is mainly harvested with diamond mesh codends or combined systems using sorting grids together with diamond mesh codends (NAFO, 2011; Gunnarsson et al., 1998; Jørgensen et al., 2006). The few available published redfish size selectivity studies mainly involve diamond mesh codends; the results from such studies indicate that mesh size can affect size selectivity of this species (Lisovsky, 2001; Lisovsky et al., 2006). Most of the available Sebastes selectivity data have been collected by Russian research institutes and are summarized by Lisovsky (2001), Lisovsky et al. (1995; 2006) and Pavlenko (2009). German and Icelandic data, presented by Bohl (1961) and Thorsteinsson et al., (1979) respectively, are also available in the literature. A study carried out by Hickey et al. (1995) in Canada that examined the effect of lastridge ropes on the selectivity properties on redfish for three different mesh size codends completes the list of studies that to our knowledge are available on redfish diamond mesh codend selectivity (Table 1).
FISHSELECT is a fish morphology data- and simulation-based methodology that can be applied to investigate the basic size selective properties of meshes of different shape and size for individual fish species (Herrmann et al., 2009). The methodology has been successfully applied for cod (Gadus morhua) and haddock (Melanogrammus aeglefinus) in the North Atlantic (Herrmann et al., 2009; Krag et al., 2011; Sistiaga et al., 2011). However, cod and haddock belong to a different fish family (Gadidae) than the redfish (Sebastidae). This difference has potential implications for selectivity studies as the general body shape of the Sebastidae species in question differs substantially from that of the Gadidae species mentioned.
In the present study we applied the FISHSELECT methodology to investigate the size selective properties of diamond mesh codends on redfish. The main objective of the investigation was to improve understanding of redfish diamond mesh codend size selectivity by integrating the available published data for redfish with new sea trial data and FISHSELECT predictions into a single comprehensive quantitative framework. Because of the morphometric differences between redfish and the other species previously investigated using FISHSELECT, the methodology was further developed during this study.
Material and Methods
Existing data for codend size selection of redfish in diamond mesh codends
Most of the size selectivity data available for Sebastes spp. in the north Atlantic have been collected using
diamond mesh codends (e.g. Bohl, 1961; Thorsteinsson et al., 1979; Konstantinov et al., 1982; Gorchinsky et al., 1993; Hickey et al., 1995; Lisovsky et al., 1995; Lisovsky et al., 2006) and have recently been reviewed by an ICES Topic Group (ICES, 2011c). Data are available from the early 1960s and onwards for S. marinus, S. mentella and S. fasciatus (Table 1). The types of trawls and the codend constructions used for data collection differed among these studies. Besides mesh size, other design factors such as twine thickness and the number of meshes in the codend circumference are known to also potentially affect size selection in diamond mesh codends (Herrmann and O’Neill, 2006; O’Neill and Herrmann, 2007; Sala et al., 2007; O’Neill et al., 2008) and these factors likely differed as well between the reported redfish size selectivity studies. Nevertheless, the common focus on mesh size in these studies allows for compilation and integrated analysis of their data in order to determine possible trends in the effect of mesh size on the selection properties of Sebastes species in codends commonly used in trawl fisheries throughout the North Atlantic.
New size selection data from sea trials
Collection of new codend size selectivity data
Codend selectivity data collection took place aboard the RV Jan Mayen (63.8 m LOA and 4080 HP) off the Norwegian coast between the 10th and the 19th of March 2009 using the covered codend method. The trawl used was an Alfredo No. 5 trawl constructed from 155 mm mesh (the top front panel and the wings were built from 200 mm mesh). The selection system installed in the trawl was a Sort-V sorting grid (see Jørgensen et al., 2006) combined with a 135 mm codend. The codend was built with 8 mm braided polyethylene twine (called “Euroline premium”), was 70 meshes long and 70 meshes around. The codend cover was 13 m long and was constructed entirely of 60 mm square meshes (2.2 mm PE twine) based on the design in Grimaldo et al. (2008). Thus, the fish necessary to evaluate the selective properties of the codend used were collected from the fish retained by the codend and the fish retained by the codend cover. Redfish of the species S. marinus were captured during 11 hauls and the individuals collected respectively in the codend and in the cover were for each haul sorted into 1 cm wide length classes for the subsequently data analysis.
Data analysis
To model the size selectivity of S. marinus in the 135 mm codend we used a logistic curve described by the parameters L50(the length of fish having 50% likelihood of being retained by codend given it enters it) and SR –
HERRMANN et al: Size Selectivity of Redfish in North Atlantic Trawl Codends 3
Species Research area Codend mesh size (mm)
L50 (cm) SR (cm) Source
Sebastes marinus Greenland 122 35.3 10 Bohl, 1961Sebastes marinus Greenland 131 33.5 14.5 Bohl, 1961Sebastes marinus Iceland 132 29.9 2.3 Thorsteinsson et al., 1979Sebastes marinus Greenland 139 37.2 13 Bohl, 1961Sebastes marinus Greenland 146 41.2 14.5 Bohl, 1961Sebastes marinus Greenland 147 38.4 15 Bohl, 1961Sebastes mentella NAF0 3N 88 24.6 4.4 Lisovsky et al., 1995Sebastes mentella NAF0 3Ps 90 27.2 5.9 Hickey et al., 1995Sebastes mentella NAF0 3Ps 90* 26.9 3.3 Hickey et al., 1995Sebastes mentella NAF0 3Ps 110 26.8 6.5 Hickey et al., 1995Sebastes mentella NAF0 3Ps 110* 32.1 3.3 Hickey et al., 1995Sebastes mentella NAF0 3Ps 115 31.5 5 Hickey et al., 1995Sebastes mentella NAF0 3Ps 115* 33.2 3 Hickey et al., 1995Sebastes mentella NAF0 3N 118 29.5 6.6 Lisovsky et al., 1995Sebastes mentella NAF0 3M/3N 124 29.8 8.4 Konstantinov et al., 1982Sebastes mentella NAF0 3M 126 36.5 5.6 Gorchinsky et al., 1993Sebastes mentella NAF0 3N 132 34.3 6.6 Lisovsky et al., 1995Sebastes mentella NAF0 3M 137 39.7 4.3 Gorchinsky et al., 1993Sebastes mentellal/fasciatus NAF0 30 96 25.0 5.4 Lisovsky et al., 2006Sebastes mentellal/fasciatus NAF0 30 100 26.0 4.1 Lisovsky et al., 2006Sebastes mentellal/fasciatus NAF0 30 106 27.6 5.5 Lisovsky et al., 2006
Table 1: Redfish (Sebastes spp.) codend selectivity data for the north Atlantic region for the past 50 years.
*Lastridge ropes were used in the codend.
the selection range (= L75–L25). This type of curve has often proved to be appropriate for modelling the length-dependent retention likelihood in diamond mesh codends for many fish species (Wileman et al., 1996). Traditionally, the parameter estimation would follow a two-step procedure. The first step would involve the estimation of L50 and SR and their covariance matrix for individual hauls using the maximum likelihood estimation procedure. The second step would follow an approach described by Fryer (1991) to estimate the mean selection parameters, where both the estimated parameter values and their covariance matrix for the single hauls are used, assuming that the estimated parameter values are observations from a bivariate normal distribution. This method considers both the within- and between-haul variation in the parameter values. However, an initial inspection of the collected haul data revealed that the abundance of S. marinus was very low in at least one of the two compartments (codend or codend cover) in many of the individual hauls. For the majority of hauls it would therefore not be possible to estimate the size selection of the redfish on a single
haul basis. Thus, we had to employ another approach to estimate the size selection of S. marinus in the codend. Our approach involves pooling the data for all hauls to estimate the average L50 and SR for the codend based on fitting a single logistic curve to the average data collected over the hauls, while using bootstrapping to estimate the confidence limits for the average parameter values. This approach avoids underestimation of the confidence limits of the average selection parameters L50 and SR, which according to Fryer (1991) would otherwise occur from simply estimating the average L50 and SR values from pooled data without using bootstrapping to account simultaneously for both within- and between-haul variation in the selection process. The bootstrapping method used is similar to the method described in Sistiaga et al. (2010) except that the model fitted to our data is much simpler. As in Sistiaga et al. (2010), the data analysis was carried out with the software tool SELNET (developed by the first author of this study). Further information on SELNET can be found in Frandsen et al. (2011), Wienbeck et al. (2011) and Sistiaga et al. (2010) or can be obtained by contacting
J. Northw. Atl. Fish. Sci., Vol. 44, 20124
the corresponding author. To be able to estimate the 95% confidence bands for the retention likelihood along the entire selection curve, SELNET was further developed as part of this study. The estimated L50 and SR values in each of the 10 000 bootstrap repetitions were used to estimate the predicted retention likelihood for each length class by inserting the parameter values in the formulas for the logistic curve. This innovation enabled the estimation of the “Efron percentile” 95% confidence limits (Efron, 1982; Chernick, 2007) for the entire average selection curve over hauls. One advantage of this approach is the possibility to estimate confidence bands for the curve without having to rely on the “delta theorem” approximation described by Lehmann (1983).
Selectivity estimation by means of FISHSELECT
The FISHSELECT methodology (Herrmann et al., 2009), which includes procedures, tools and software, determines whether a fish is capable of passing through a certain mesh based on the morphology and compressibility of the fish, and shape and size of the mesh. By means of computer simulation, the method is ultimately used to predict the selective properties of diverse fishing gears. The method has already been applied in a number of studies to estimate the selective properties of towed fishing gears for both round-fish (Herrmann et al., 2009; Krag et al., 2011; Sistiaga et al., 2011) and crayfish (Frandsen et al., 2010). This section describes the different steps needed to apply the methodology to study the selectivity of S. marinus (see Herrmann et al. (2009) for more detailed information)).
Data collection
The FISHSELECT methodology was applied to S. marinus collected on a cruise carried out in the Barents Sea. The data collection took place once again on board R/V Jan Mayen from the 1st to the 10th of December 2008. The application of FISHSELECT requires: measuring the total length for each fish included; determining whether or not each fish can pass through a certain number of mesh templates (Fall-through experiments); measuring the shape of the fish at a number of perpendicular cross-sections (CS) using a mechanical sensing tool (Morphometer). During the cruise the methodology was applied to 100 S. marinus individuals. The individuals were selected and handpicked from a continuous trawl fishing operation in order to cover the widest possible size range.
Measurement of fish shape and application of the fall-through procedure
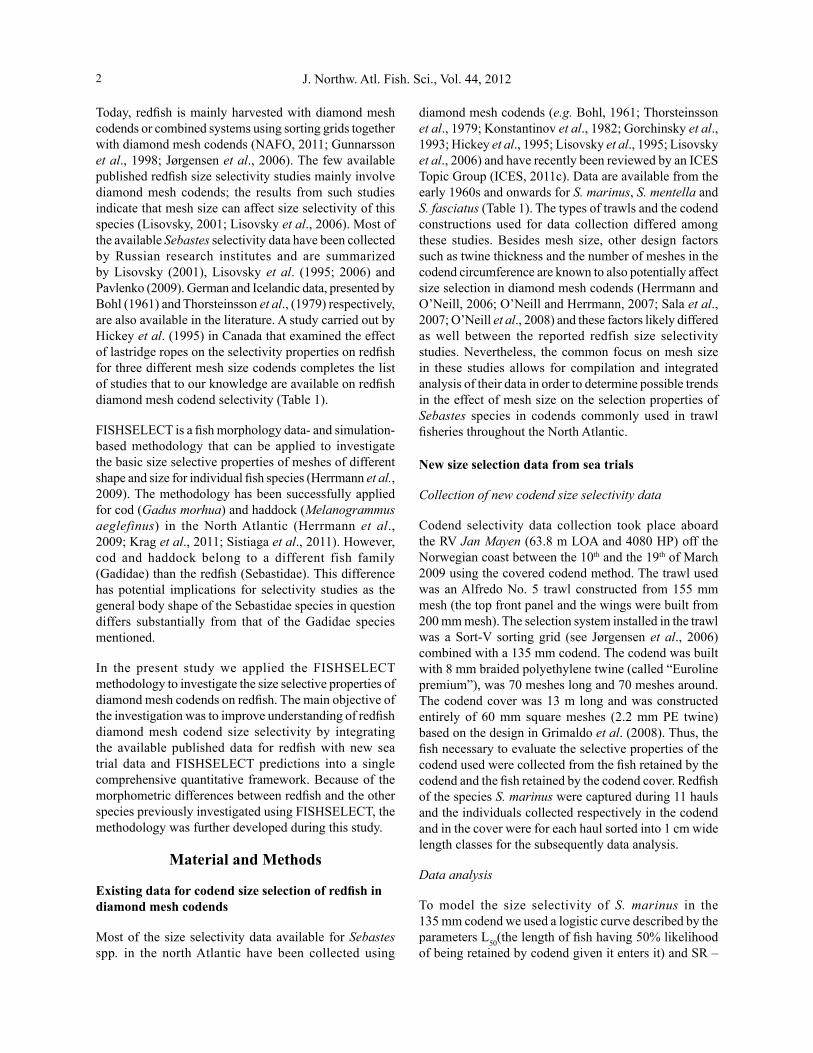
For S. marinus, three cross-sections were carefully identified and chosen by inspection of the shape of the fish
as well as by previous experience with the method. The cross-sections were chosen by their potential to determine fish passage through a mesh (Fig. 1): CS1, located at the end of the head and a spiny structure located in the middle of the opercula; CS2, located at the end of the opercula and the foremost point of the spiny dorsal fin; CS3, located at the point of the maximum transverse perimeter.
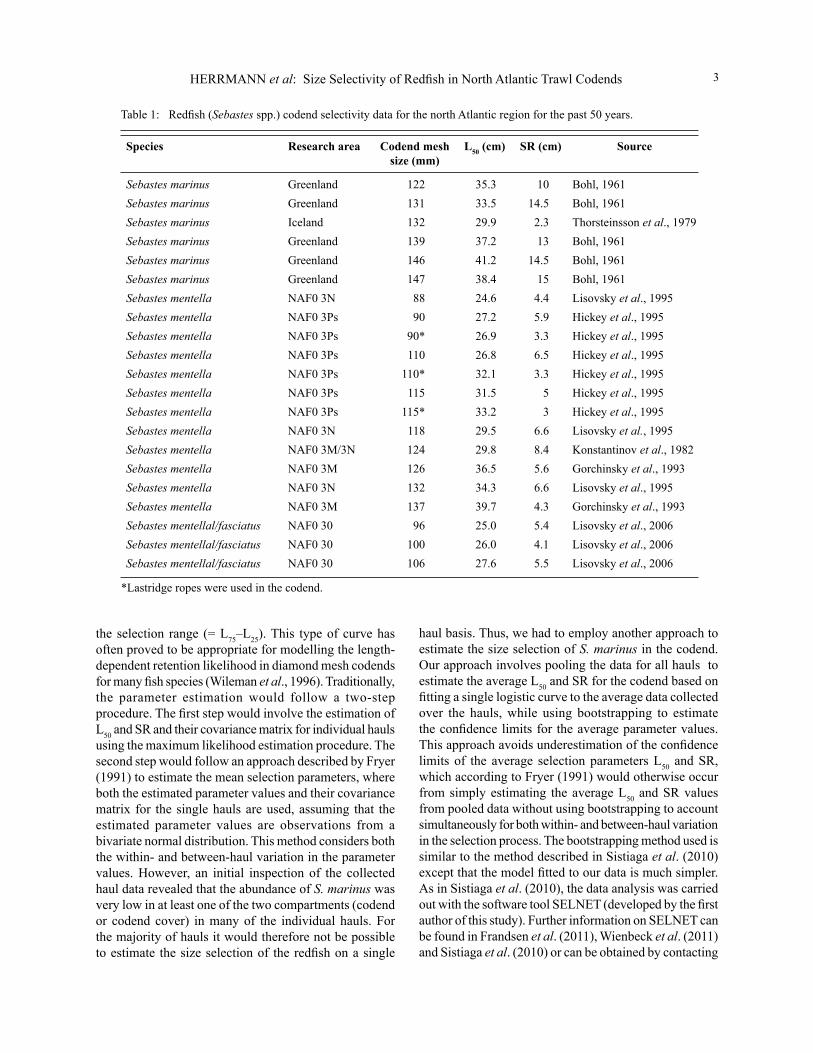
The three cross-sections were measured for each fish using a Morphometer (Fig. 2a–c) and the shapes formed in the Morphometer were scanned and converted into digital images using a flatbed scanner (Fig. 2d–f). The outlines of each digital image were modelled with different defined geometrical shapes that were chosen to describe the contours registered for each of the cross-sections as well as possible.
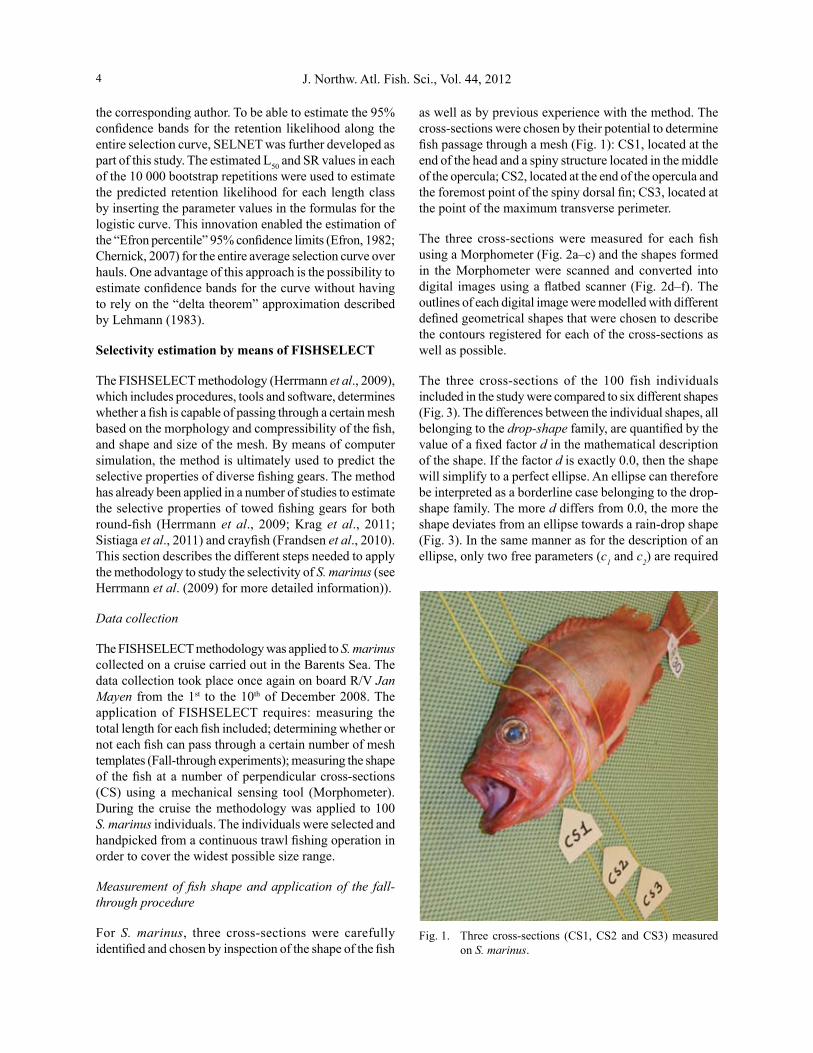
The three cross-sections of the 100 fish individuals included in the study were compared to six different shapes (Fig. 3). The differences between the individual shapes, all belonging to the drop-shape family, are quantified by the value of a fixed factor d in the mathematical description of the shape. If the factor d is exactly 0.0, then the shape will simplify to a perfect ellipse. An ellipse can therefore be interpreted as a borderline case belonging to the drop-shape family. The more d differs from 0.0, the more the shape deviates from an ellipse towards a rain-drop shape (Fig. 3). In the same manner as for the description of an ellipse, only two free parameters (c1 and c2) are required
Fig. 1. Three cross-sections (CS1, CS2 and CS3) measured on S. marinus.
HERRMANN et al: Size Selectivity of Redfish in North Atlantic Trawl Codends 5
to describe the individual members of drop-shape family (the Appendix outlines the mathematical description of the shapes belonging to the drop-shape family).
Using the measurements from the 100 fish, the average r2-value was calculated for each of the six models for CS1, CS2 and CS3 (see appendix for details on the calculation method). The shape model with the highest average r2-value was chosen to represent each cross-section further in the methodology.
Ellipse Super- Super Semi- Soft drop Semi-soft soft drop drop super drop
d = 0 d = 0.05 d = 0.1 d = 0.15 d = 0.25 d = 0.375
Fig. 2. Cross-section estimation process for a randomly selected fish and cross-section. The measurement of the cross-section shape of a S. marinus using a Morphometer (A–C) and the digitalization of the contour using a flatbed scanner (D–F) are shown.
Fig. 3. Shapes belonging to the drop-shape family tested on the CS1, CS2 and CS3 contours of all S. marinus individuals included in the study. The value of the fixed factor d defines the exact shape.
The relationship between total length and cross-section shape parameters (c1 and c2) was assessed for the most suitable shapes found for CS1, CS2 and CS3. Using the morphometric data obtained from the 100 individuals included in the study, we modelled total length vs. c1 and total length vs. c2 considering the between-individual variability by the method described in Herrmann et al. (2009). The relationships total length vs. c1 and total length vs. c2 allowed us to simulate populations of fish with defined CS1, CS2 and CS3 shapes. For the selectivity prediction
J. Northw. Atl. Fish. Sci., Vol. 44, 20126
analyses carried out at later stages of the methodology, a virtual population of 5 000 individuals uniformly distributed between 1 cm and 70 cm was generated based on the results from the regression analysis.
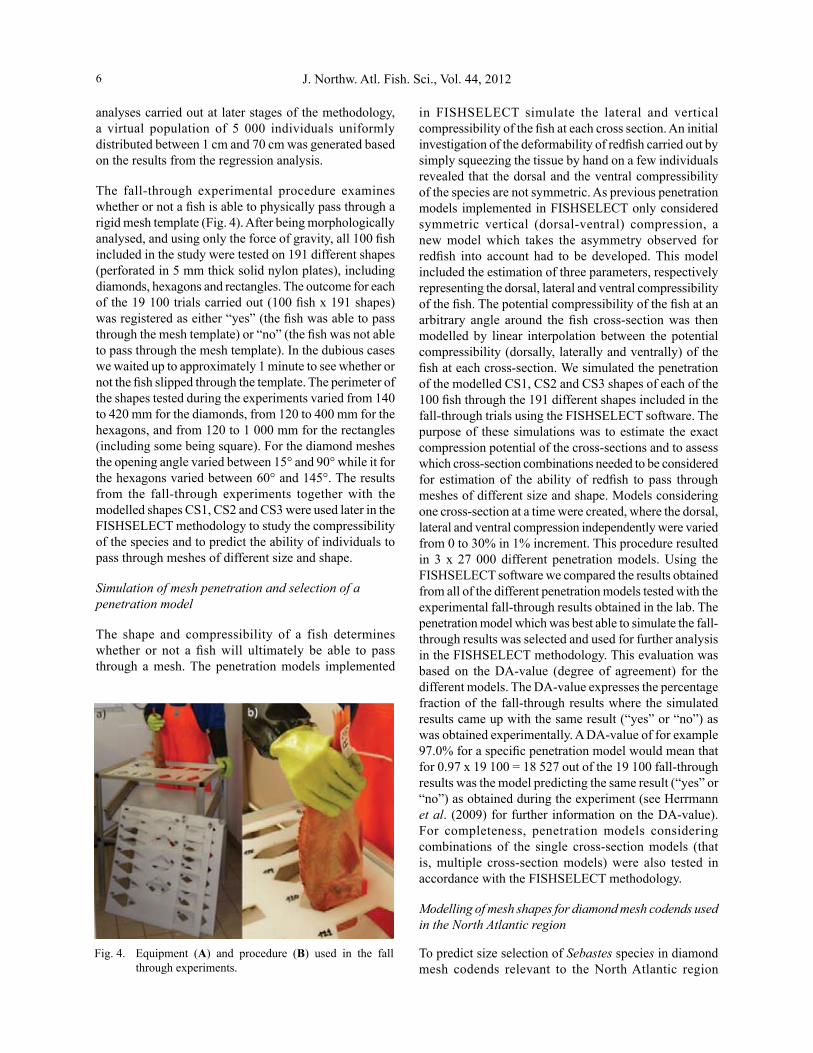
The fall-through experimental procedure examines whether or not a fish is able to physically pass through a rigid mesh template (Fig. 4). After being morphologically analysed, and using only the force of gravity, all 100 fish included in the study were tested on 191 different shapes (perforated in 5 mm thick solid nylon plates), including diamonds, hexagons and rectangles. The outcome for each of the 19 100 trials carried out (100 fish x 191 shapes) was registered as either “yes” (the fish was able to pass through the mesh template) or “no” (the fish was not able to pass through the mesh template). In the dubious cases we waited up to approximately 1 minute to see whether or not the fish slipped through the template. The perimeter of the shapes tested during the experiments varied from 140 to 420 mm for the diamonds, from 120 to 400 mm for the hexagons, and from 120 to 1 000 mm for the rectangles (including some being square). For the diamond meshes the opening angle varied between 15° and 90° while it for the hexagons varied between 60° and 145°. The results from the fall-through experiments together with the modelled shapes CS1, CS2 and CS3 were used later in the FISHSELECT methodology to study the compressibility of the species and to predict the ability of individuals to pass through meshes of different size and shape.
Simulation of mesh penetration and selection of a penetration model
The shape and compressibility of a fish determines whether or not a fish will ultimately be able to pass through a mesh. The penetration models implemented
Fig. 4. Equipment (A) and procedure (B) used in the fall through experiments.
in FISHSELECT simulate the lateral and vertical compressibility of the fish at each cross section. An initial investigation of the deformability of redfish carried out by simply squeezing the tissue by hand on a few individuals revealed that the dorsal and the ventral compressibility of the species are not symmetric. As previous penetration models implemented in FISHSELECT only considered symmetric vertical (dorsal-ventral) compression, a new model which takes the asymmetry observed for redfish into account had to be developed. This model included the estimation of three parameters, respectively representing the dorsal, lateral and ventral compressibility of the fish. The potential compressibility of the fish at an arbitrary angle around the fish cross-section was then modelled by linear interpolation between the potential compressibility (dorsally, laterally and ventrally) of the fish at each cross-section. We simulated the penetration of the modelled CS1, CS2 and CS3 shapes of each of the 100 fish through the 191 different shapes included in the fall-through trials using the FISHSELECT software. The purpose of these simulations was to estimate the exact compression potential of the cross-sections and to assess which cross-section combinations needed to be considered for estimation of the ability of redfish to pass through meshes of different size and shape. Models considering one cross-section at a time were created, where the dorsal, lateral and ventral compression independently were varied from 0 to 30% in 1% increment. This procedure resulted in 3 x 27 000 different penetration models. Using the FISHSELECT software we compared the results obtained from all of the different penetration models tested with the experimental fall-through results obtained in the lab. The penetration model which was best able to simulate the fall-through results was selected and used for further analysis in the FISHSELECT methodology. This evaluation was based on the DA-value (degree of agreement) for the different models. The DA-value expresses the percentage fraction of the fall-through results where the simulated results came up with the same result (“yes” or “no”) as was obtained experimentally. A DA-value of for example 97.0% for a specific penetration model would mean that for 0.97 x 19 100 = 18 527 out of the 19 100 fall-through results was the model predicting the same result (“yes” or “no”) as obtained during the experiment (see Herrmann et al. (2009) for further information on the DA-value). For completeness, penetration models considering combinations of the single cross-section models (that is, multiple cross-section models) were also tested in accordance with the FISHSELECT methodology.
Modelling of mesh shapes for diamond mesh codends used in the North Atlantic region
To predict size selection of Sebastes species in diamond mesh codends relevant to the North Atlantic region
HERRMANN et al: Size Selectivity of Redfish in North Atlantic Trawl Codends 7
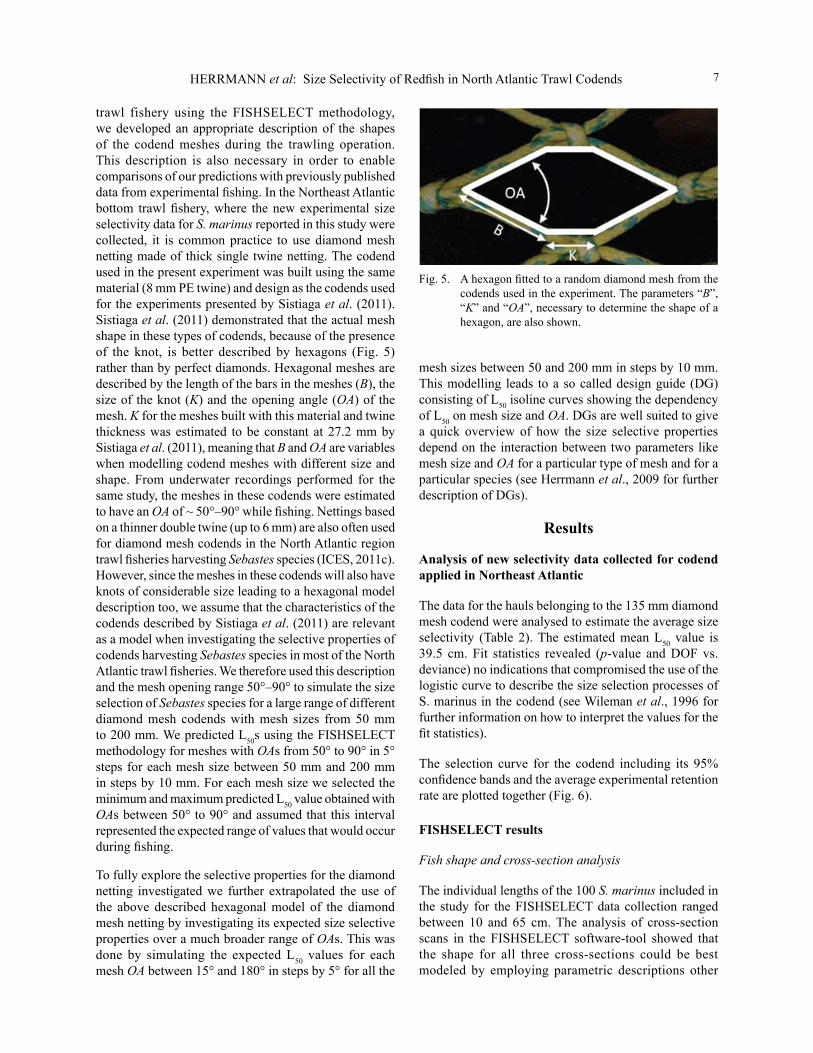
trawl fishery using the FISHSELECT methodology, we developed an appropriate description of the shapes of the codend meshes during the trawling operation. This description is also necessary in order to enable comparisons of our predictions with previously published data from experimental fishing. In the Northeast Atlantic bottom trawl fishery, where the new experimental size selectivity data for S. marinus reported in this study were collected, it is common practice to use diamond mesh netting made of thick single twine netting. The codend used in the present experiment was built using the same material (8 mm PE twine) and design as the codends used for the experiments presented by Sistiaga et al. (2011). Sistiaga et al. (2011) demonstrated that the actual mesh shape in these types of codends, because of the presence of the knot, is better described by hexagons (Fig. 5) rather than by perfect diamonds. Hexagonal meshes are described by the length of the bars in the meshes (B), the size of the knot (K) and the opening angle (OA) of the mesh. K for the meshes built with this material and twine thickness was estimated to be constant at 27.2 mm by Sistiaga et al. (2011), meaning that B and OA are variables when modelling codend meshes with different size and shape. From underwater recordings performed for the same study, the meshes in these codends were estimated to have an OA of ~ 50°–90° while fishing. Nettings based on a thinner double twine (up to 6 mm) are also often used for diamond mesh codends in the North Atlantic region trawl fisheries harvesting Sebastes species (ICES, 2011c). However, since the meshes in these codends will also have knots of considerable size leading to a hexagonal model description too, we assume that the characteristics of the codends described by Sistiaga et al. (2011) are relevant as a model when investigating the selective properties of codends harvesting Sebastes species in most of the North Atlantic trawl fisheries. We therefore used this description and the mesh opening range 50°–90° to simulate the size selection of Sebastes species for a large range of different diamond mesh codends with mesh sizes from 50 mm to 200 mm. We predicted L50s using the FISHSELECT methodology for meshes with OAs from 50° to 90° in 5° steps for each mesh size between 50 mm and 200 mm in steps by 10 mm. For each mesh size we selected the minimum and maximum predicted L50 value obtained with OAs between 50° to 90° and assumed that this interval represented the expected range of values that would occur during fishing.
To fully explore the selective properties for the diamond netting investigated we further extrapolated the use of the above described hexagonal model of the diamond mesh netting by investigating its expected size selective properties over a much broader range of OAs. This was done by simulating the expected L50 values for each mesh OA between 15° and 180° in steps by 5° for all the
Fig. 5. A hexagon fitted to a random diamond mesh from the codends used in the experiment. The parameters “B”, “K” and “OA”, necessary to determine the shape of a hexagon, are also shown.
mesh sizes between 50 and 200 mm in steps by 10 mm. This modelling leads to a so called design guide (DG) consisting of L50 isoline curves showing the dependency of L50 on mesh size and OA. DGs are well suited to give a quick overview of how the size selective properties depend on the interaction between two parameters like mesh size and OA for a particular type of mesh and for a particular species (see Herrmann et al., 2009 for further description of DGs).
Results
Analysis of new selectivity data collected for codend applied in Northeast Atlantic
The data for the hauls belonging to the 135 mm diamond mesh codend were analysed to estimate the average size selectivity (Table 2). The estimated mean L50 value is 39.5 cm. Fit statistics revealed (p-value and DOF vs. deviance) no indications that compromised the use of the logistic curve to describe the size selection processes of S. marinus in the codend (see Wileman et al., 1996 for further information on how to interpret the values for the fit statistics).
The selection curve for the codend including its 95% confidence bands and the average experimental retention rate are plotted together (Fig. 6).
FISHSELECT results
Fish shape and cross-section analysis
The individual lengths of the 100 S. marinus included in the study for the FISHSELECT data collection ranged between 10 and 65 cm. The analysis of cross-section scans in the FISHSELECT software-tool showed that the shape for all three cross-sections could be best modeled by employing parametric descriptions other
J. Northw. Atl. Fish. Sci., Vol. 44, 20128
than a standard elliptical shape. Based on the r2-values obtained, the models belonging to the drop-shape family with d > 0.0 showed better performance than the perfect ellipse (d = 0.0) in describing the cross-sections of S. marinus (Table 3).
For CS1 a drop-shape with d = 0.05 yielded a mean r2-value of 0.8941. For CS2 the best description was obtained with a shape having d = 0.1, resulting in a mean r2-value of 0.9535. Finally, for CS3 a shape with d = 0.15 gave the best description with a mean r2-value at 0.9479. These relatively high mean r2-values demonstrate the ability of models belonging to the drop-shape family to reproduce the characteristics of the cross-section shapes critical for the escapement of this species through trawl meshes. For some of the tested models the difference in mean r2-value based on the 100 measured redfish was so small that the specific model choice would in practice have little influence on the redfish cross-section description (Table 3). However, as these models all are equally complex, for consistency we for each CS chose to use the model having the highest mean r2-value (Fig. 7).
Following the FISHSELECT methodology, the parameters describing how the different cross-sections (CS1 to CS3) depend on the length of the individual fish was modeled with regression models of the power type (see Herrmann et al. (2009) for description of this type of regression models). In the drop-shape family models, the dependency of the two free parameters c1 and c2 on length is estimated by a regression analysis for each cross-section (Table 4). The high r2-values for the results for all the regressions (Table 4) demonstrate that power type models of the length dependencies are able to account for most of the variation in the collected data.
Table 2: Selectivity results from the 135 mm diamond mesh codend tested during the sea trials on board RV Jan Mayen. 95% confidence limits are shown in brackets.
Number of hauls 11
Number in codend 158
Number in codend cover 24
L50 (cm) 39.5 (34.5–42.3)
SR (cm) 6.7 (4.0–11.1)
p-value 0.56
DOF 20
Deviance 18.5
0
5
10
15
20
25
30
0
0.25
0.5
0.75
1
30 40 50 60 70
Num
ber i
n po
pula
tion
ente
ring
code
nd
Ret
entio
n lik
elih
ood
Length (cm)
Fig. 6. Retention likelihood of S. marinus based on the population entering the 135 mm codend tested during the sea trials carried out on board R/V Jan Mayen.
d 0.0 0.05 0.1 0.15 0.25 0.375
CS1 0.8900 0.8941 0.8781 0.8429 0.7275 0.5153
CS2 0.9373 0.9531 0.9535 0.9397 0.8762 0.7542
CS3 0.8878 0.9224 0.9423 0.9479 0.9220 0.8437
Table 3: Mean r2-values for different shape descriptions. The highest r2-value for each cross section is in bold.

HERRMANN et al: Size Selectivity of Redfish in North Atlantic Trawl Codends 9
CS1 CS2 CS3
L 50 (c
m)
L50 vs. mesh size (Sebastes spp.)
0
10
20
30
40
50
60
50 70 90 110 130 150 170 190
Codend mesh size (mm)
Fig. 7. Illustration of the fits of the models selected for CS1 (d = 0.05), CS2 (d = 0.1) and CS3 (d = 0.15) to the digitized cross-sections for a randomly selected S. marinus individual.
Degree of agreement (DA) and penetration model
For the penetration models based on only one cross-section (CS1, CS2 or CS3) the highest DA (97.9%) was found for a model based on CS2. This model had zero dorsal compression, 25% lateral compression and 6% ventral compression. Thus, this model predicted more lateral compression potential for S. marinus at CS2 (as the tissue at the side of the fish is soft) than ventral compression and no dorsal compression (where the tissue is hardest). These results support observations made on a few individual S. marinus that were manually compressed at different locations around the cross-sections. The models combining two cross-sections improved the DA very little (< 0.02%). Considering the gain in simplicity by using a single cross-section model and the high DA value obtained (97.9%), the model with the highest DA based on only CS2 was chosen for subsequent analysis.
Comparing FISHSELECT predictions with sea trial results for North Atlantic codends
The CS2 penetration model was applied to simulate the size selection of the virtual population of 5 000 S. marinus individuals through diamond mesh codends of different mesh sizes. The range of the predicted L50 results for the different codend mesh sizes was compared to the new result from sea trials with the 135 mm codend (including the confidence limits for the mean L50 value) and the previously published results for S. marinus (Table 1, Fig. 8).
The prediction of codend L50 based on the FISHSELECT analysis of data for S. marinus agreed well with previous results from similar sea trials (Fig. 8). Further, we compare the FISHSELECT predictions based on S. marinus with previous results collected from sea trials for S. mentella and S. fasciatus (Table 1; Fig. 8).
Table 4: Values for regression coefficients and fit statistics for CS1, CS2, and CS3. All models are power models, as for example c1 = a x (Length)b (See Herrmann et al. (2009) for details). Input for Length is in mm. Output for c1 and c2 are in mm. The value of fixed factor d defines which shape model was applied to describe the cross section (see appendix).
d Parameter a b sd(a) r2
CS1 0.05 c1 7.0749x10⁻² 1.02 7.2800x10⁻³ 0.9140c2 1.5903x10⁻¹ 0.95 8.3335x10⁻³ 0.9779
CS2 0.1 c1 5.5901x10⁻² 1.06 6.1859x10⁻³ 0.9158c2 1.8879x10⁻¹ 0.94 1.0967x10⁻² 0.9802
CS3 0.15 c1 5.5324x10⁻² 1.06 6.7863x10⁻³ 0.8995c2 2.0181x10⁻¹ 0.93 1.2580x10⁻² 0.9764
Fig. 8. Predicted (stippled curves – based on values for mesh size between 50 mm and 200 mm in steps by 10 mm) and observed (points) L50 vs. mesh size relationships for Sebastes spp.. Predicted values are based on the FISHSELECT analysis of the data collected for S. marinus; diamond with error bars represents the new result from sea trials; previous results for S. marinus presented in Table 1 are squares; previous results for S. mentella are triangles and S. mentella/fasciatus circles.

J. Northw. Atl. Fish. Sci., Vol. 44, 201210
The L50 predictions for mesh sizes between 50–200 mm and OAs between 15°–180° obtained from FISHSELECT were combined in a DG. This DG provides predicted L50 values for fixed combinations of mesh size (x-axis) and OA (y-axis). For example, for mesh sizes of 100 mm and L50 mm for an OA fixed at 50° L50s are predicted to be 24 and 36 cm respectively. The results indicate that for the diamond mesh types used in the North Atlantic, L50 increases with increasing mesh size for a given OA. For mesh size fixed at 150 mm for OA at respectively 50° and 90° the predicted L50-values are 36 and 40 cm. The L50 result range for OAs between 50°–90° varied from ~10 cm for 50 mm meshes to ~53 cm for 200 mm meshes. The separation between the L50 isolines at the OAs observed while fishing (delimited by the stippled lines in Fig. 9) approaches the maximum separation between the lines, implying that large differences in L50 are achievable through changing mesh sizes. For diamond mesh codends the OA-value is not completely fixed as it can vary with location in the codend (Herrmann et al., 2007) and can potentially also be affected by the amount of catch (Herrmann (2005a; 2005b); Herrmann and O’Neill (2005)). The DG (Fig. 9) gives (through the dependency of L50 on OA) an impression of how this mechanism can lead to lack in determinism in the size selection process in the codend for individual fish. For the population of fish
L50 (cm) versus mesh size and mesh opening angle
Mesh size (mm)
OA
(deg
ree)
2 4
6 8 10 12
12
14 16
18 20
22
24
26 28
30 32
34
36
38 40
42
44
46
48
50
52
52
54
50 100 150 200
5010
015
0
Fig. 9. Design guide showing L50 isolines for S. marinus with diamond codend mesh sizes between 50 mm and 200 mm and OAs between 15° and 180°. The stippled horizontal lines mark the range of OAs observed by Sistiaga et al., (2011) during underwater recordings carried out to observe the codends used in the Northeast Atlantic while fishing.
entering the codend during a trawl haul this OA-variation contributes to a bigger SR for the size selection process (Herrmann et al., 2009).
Discussion
Fish morphology affects the size selectivity of towed fishing gears. In the present study we further developed and applied the FISHSELECT methodology and tools (Herrmann et al., 2009) to assess the morphological component of the size selection process of S. marinus in diamond mesh codends. Our results indicate that using FISHSELECT we are able to understand and explain the results obtained from sea trials for S. marinus (Fig. 8). The previously published data for size selection of S. mentella and S. fasciatus also fall within the confidence band for L50 obtained from FISHSELECT for the S. marinus data (Fig. 8). This agreement is found for a very broad band of codend meshes sizes, which could indicate the validity of the extrapolation of our results to make predictions also for these two Sebastes species. The success in our attempt to extrapolate the FISHSELECT predictions for S. marinus to also explain and understand codend size selection of S. mentella and S. fasciatus indicates that the morphometric characteristics with respect to size selection in codends are similar for these species. This finding seems to be in good agreement with previously reported similarities between these species (Power and Ni, 1985; Pampoulie and Danielsdottir, 2008). But for future comparisons between the redfish species, it would be beneficial if comparable morphology data relevant for size selection are available for the different redfish species. Such morphometric data can be collected using the FISHSELECT tools.
Fish behaviour can be important in the capture process of some fish, especially in the trawl mouth (Engås et al., 1998), but our method does not explicitly account for behavioral aspects of redfish. However the strong similarity found regarding the effect of codend mesh size between the FISHSELECT predictions and the different sea trial results (Fig. 8) indicates that the size selection of S. marinus in diamond mesh codends to a large extent can be explained by morphological characteristics of the species. Thus our results imply that the size selectivity of redfish in diamond mesh codend can be regarded as mostly a mechanical process without the need for considering behavioral aspects. In particular, selectivity appears dependent upon the girth and compressibility of a redfish at the cross section located at the end of the opercula and the foremost point of the dorsal fin.
The design guide as seen in Fig. 9, which predicts how L50 for S. marinus depends on mesh size and mesh
HERRMANN et al: Size Selectivity of Redfish in North Atlantic Trawl Codends 11
opening angle (OA), demonstrates the importance of open codend meshes while fishing. This dependency on OA demonstrates that technical measures such as codend lastridge ropes can affect L50 due to a stable OA during the fishing process (Hickey et al., 1995). Diamond mesh codends with less number of open meshes on the around have also been reported to increase L50 for other fish species (Sala et al., 2007; O’Neill et al., 2008) as reduced number of meshes implies increased OAs given a certain circumference. The method and data presented in this study could also form the base for investigating the size selection of redfish species in other fishing gear devices than diamond mesh codends. For example a design guide describing size selection of S. marinus in square mesh codends could be constructed based on the data described in this paper by using the method described in a case study for haddock in Krag et al. (2011).
The ability to reproduce the complex characteristics of the cross-section shapes of S. marinus using the mathematical description for the drop-shape family of models, which requires only two independent parameters to be estimated as function of fish length, highlights the power of this type of parametric description to model the cross-section shapes of fish. This type of mathematical description could in the future be applied to other fish species. Further, it could also be applied as a tool to categorize fish species morphologically according to their mathematical description. The selection of different models to describe the transversal contour of S. marinus at different positions along its length also represents a new way of quantifying how its shape changes along its length.
Acknowledgements
We thank the crew of the RV Jan Mayen and Trond Larsen as well as Lasse Rindahl, Ivan Tatone and Hector Andrade for their valuable help during the data collection periods. Furthermore, we express our gratitude DTU (Technical University of Denmark), SFA (SINTEF Fisheries and Aquaculture) and the Norwegian College of Fisheries Science (University of Tromsø) for making the collaboration between our institutions possible. Finally we would like to express our gratitude to two anonymous reviewers for suggestions and comments which greatly helped improving this paper.
References
BARSUKOV, V. V. 1968. The systematic relationship of redfishes of the genus Sebastes of the Northwest Atlantic Ocean. DokladyAkad. Nauk. SSSR, 183: 479–482. [Trans. from Russian in DokladyBioI. Sci., 183: 734–737.]
BERS, L. and F. KARAL. 1976. Calculus, 2nd edition. Holt, Rinehart and Winston, New York, 783 p.
BOHL, H. 1961. German mesh selection experiments on redfish. Coun. Meet. ICES, Comp. Fish. Comm., Doc. Nr. 88, 1991.
C A D R I N , S . X . , M . B E R N R E U T H E R , A . K . DANÍELSDÓTTIR, E. HJÖRLEIFSSON, T. JOHANSEN, L. KERR, K. KRISTINSSON, S. MARIANI, K. NEDREAAS, C. PAMPOULIE, B. PLANQUE, J. REINERT, F. SABORIDO-REY, T. SIGURDSSON, and C. STRANSKY. 2010. Population structure of beaked redfish, Sebastesmentella: evidence of divergence associated with different habitats. ICES J. of Mar. Sci., 67: 1617–1630. doi.org/10.1093/icesjms/fsq046
CHERNICK, M. R. 2007. Bootstrap methods: a guide for practitioners and researchers. In: Wiley Series in Probability and Statistics, second edition. Wiley, New York.
EFRON, B. 1982. The jackknife, the bootstrap and other resampling plans. SIAM Monograph No. 38, CBSM-NSF. doi.org/10.1137/1.9781611970319
ENGÅS, A., T. JØRGENSEN, and C. W. WEST. 1998. A species-selective trawl for demersal gadoid fisheries. ICES J. Mar. Sci., 55(5): 835–845. doi.org/10.1006/jmsc.1998.0352
FRANDSEN, R. P., B. HERRMANN, and N. MADSEN. 2010. A simulation-based attempt to quantify the morphological component of size selection of Nephrops norvegicus in trawl codends. Fish. Res., 101: 156–167. doi.org/10.1016/j.fishres.2009.09.017
FRANDSEN, R. P., B. HERRMANN, N. MADSEN, and L. A. KRAG. 2011. Development of codend concept to improve size selectivity of Nephrops (Nephrops norvegicus) in a multi-species fishery. Fish. Res., 111: 116–126. doi.org/10.1016/j.fishres.2011.07.003
FROESE, R., and A. PROELß. 2010. Rebuilding fish stocks no later than 2015: will Europe meet the deadline? Fish Fish., 11: 194–202. doi.org/10.1111/j.1467-2979.2009.00349.x
FRYER, R. J. 1991. A model of between-haul variation in selectivity. ICES J. Mar. Sci,. 48: 281–290. doi.org/10.1093/icesjms/48.3.281
GORCHINSKY K. V., S. F. LISOVSKY, and M. K. SADOKHIN. 1993. Selectivity of Bottom Trawls during the Fishery for Redfish on the Flemish Cap Bank. NAFO SCR Doc., 93/100, Serial No 2293, 9 p.
GRIMALDO, E., M. SISTIAGA, and R. B. LARSEN. 2008. Evaluation of codends with sorting grids, exit windows and diamond meshes: Size selection and fish behavior. Fish. Res. 97: 271–280. doi.org/10.1016/j.fishres.2007.12.003
GUNNARSSON, K., G. JÓNSSON, and Ó. K. PÁLSSON. 1998. Sjávarnytjar við Ísland, Mál og menning, Reykjavík (1998), 280 p.
HERRMANN, B. 2005a. Effect of catch size and shape on the selectivity of diamond mesh cod-ends: I. Model development. Fish. Res., 71: 1–15. doi.org/10.1016/j.fishres.2004.08.024. doi.org/10.1016/j.fishres.2004.08.021 2005b. Effect of catch size and shape on the selectivity of diamond mesh cod-ends: II. Theoretical study of haddock selection. Fish. Res., 71: 16–26
HERRMANN, B. and F. G. O’NEILL. 2005. Theoretical study of the between-haul variation of haddock selectivity in a diamond mesh cod-end. Fish. Res., 74: 243–252. doi.org/10.1016/j.fishres.2005.01.022
2006. Theoretical study of the influence of twine thickness on haddock selectivity in diamond mesh cod-ends. Fish. Res., 80: 221–229. doi.org/10.1016/j.
J. Northw. Atl. Fish. Sci., Vol. 44, 201212
fishres.2006.04.008HERRMANN, B., L. A. KRAG, R. P. FRANDSEN, N. MADSEN,
B. LUNDGREN, and K. J. STÆHR. 2009. Prediction of selectivity from morphological conditions: Methodology and a case study on cod (Gadus morhua). Fish. Res., 97: 59–71. doi.org/10.1016/j.fishres.2009.01.002
HERRMANN, B., D. PRIOUR, and L. A. KRAG. 2007.Simulation-based study of the combined effect on cod-end size selection of turning meshes by 90° and reducing the number of meshes in the circumference for round fish. Fish. Res., 84: 222–232. doi.org/10.1016/j.fishres.2006.10.020
HICKEY, W. M., D. L. BOULOS and G. BROTHERS. 1995. A Study of the Influence of Lastridge Ropes on Redfish Selectivity in a Bottom Trawler. Can. Tech. Rep. Fish. Aquat. Sci., 2076: vii+25.
ICES 2011a. ICES Advice 2011 (Book 3). Copenhagen. 2011b. ICES Advice 2011 (Book 2). Copenhagen. 2011c. Report of the ICES-FAO Working Group on
Fishing Technology and Fish Behaviour (WGFTFB), 9–13 May 2011. ICES CM 2011/SSGESST:11.
JØRGENSEN, T., O. A. INGÓLFSSON, N. GRAHAM, and B. ISAKSEN. 2006. Size selection of cod by rigid grids—is anything gained compared to diamond mesh codends only? Fish. Res., 79: 337–348. doi.org/10.1016/j.fishres.2006.01.017
KONSTANTINOV K. G., A. K. CHUMAKOV, K. N. NIKESHIN, and V. G. KOVALENKO. 1982. On Validity of Trawl Mesh Size used in Fishing Areas in the Northwest Atlantic. NAFO SCR Doc. 14/VI/ Serial No 502, 30 p.
KRAG, L . , B . HERRMANN, N. MADSEN, and R. P. FRANDSEN. 2011. Size selection of haddock (Melanogrammus aeglefinus) in square mesh codends: A study based on assessment of decisive morphology for mesh penetration. Fish. Res., 110: 225–235. doi.org/10.1016/j.fishres.2011.03.009
LEHMANN, E. L. 1983. Theory of Point Estimation. New York, John Wiley and Sons.
LISOVSKY, S. F. 2001. On Optimal Mesh Size When Fishing Redfish in the Atlantic. NAFO SCR Doc. 01/21, Serial No. 4389, 16 p.
LISOVSKY, S. F., V. L. TRETJAK, V. M. KISELEVA, and S. M. KOTLJAROV. 1995. On Minimum Mesh-size During Deepwater Redfish Fishery with Mid-water Trawl in NAFO Division 3NO, NAFO SCR Doc., 95/25. Serial No. 2533, 9 p.
LISOVSKY, S. F., A. A. PAVLENKO, A. A. VASKOV. 2006. On the Minimal Trawl Codend Mesh Size in the Fishery of Redfish Species in Division 3O of the NAFO Regulation Area. NAFO SCR Doc. 05/18, Serial No. N5099, 17 p.
NAFO. 2010. Northwest Atlantic Fisheries Organization, Annual report 2010 (www.nafo.int). ISSN-0704-4798, 16 p.
2011. Northwest Atlantic Fisheries Organization Conservation and Enforcement Measures. NAFO/FC Doc. 11/1. Serial No. N5867. 98 p.
NI, I-H. 1981. Separation of sharp-beaked redfishes, Sebastes fasciatus and S. mentella from northeastern Grand Bank by morphology of extrinsic gas bladder musculature. J. Northw. Atl. Fish. Sci., 2: 7–12.
O’NEILL, F. G. and B. HERRMANN. 2007. PRESEMO a predictive model of codend selectivity – a tool for fisheries managers. ICES J. Mar. Sci., 64: 1558–1568.
O’NEILL, F. G., N. GRAHAM, R. J. KYNOCH, R. S. T. FERRO, P. A. KUNZLIK, and R. J. FRYER. 2008. The effect of varying cod-end circumference, inserting a ‘flexi-grid’ or inserting a Bacoma type panel on the selectivity of North Sea haddock and saithe. Fish. Res, 94: 175–183. doi.org/10.1016/j.fishres.2008.06.007
PAMPOULIE, C. and A. K. DANÍELSDÓTTIR. 2008. Resolving species identification problems in the genus Sebastes using nuclear genetic markers. Fish. Res., 93: 54–63. doi.org/10.1016/j.fishres.2008.02.007
PAVLENKO, A. A. 2009. Optimum Mesh Size in Redfish Fisheries in the North Atlantic. NAFO SCR Doc 09/52, Serial No. N5696.
POWER, D. J. and I. H. NI. 1985. Morphometric differences between golden redfish (Sebastes marinus) and beaked redfishes (S. mentella and S. fasciatus). J. Northw. Atl. Fish. Sci., 6: 1–7. SALA, A., A. LUCCHETTI, G. BUGLIONI. 2007. The influence of twine thickness on the size selectivity of polyamide codends in a Mediterranean bottom trawl. Fish. Res., 83: 192–203. doi.org/10.1016/j.fishres.2006.09.013
SISTIAGA, M., B. HERRMANN, R. B. LARSEN, E. GRIMALDO. 2010. Assessment of dual selection in grid based selectivity systems. Fish. Res., 105, 187–199. doi.org/10.1016/j.fishres.2010.05.006
SISTIAGA, M., B. HERRMANN, K. N. NIELSEN, and R. B. LARSEN. 2011. Understanding limits to cod and haddock separation using size selectivity in a multispecies trawl fishery: an application of FISHSELECT. Can. J. Fish. Aquat. Sci., 68: 927–940. doi.org/10.1139/f2011-017
THORSTEINSSON, G., E. P. EINARSSON, H. VILHJÁLMSSON. 1979. Netfrædi, Hafrannsóknir - No 18. HAFRO, Reykjavik, Iceland,
WIENBECK, H., B. HERRMANN, W. MODERHAK, and D. STEPPUTTIS. 2011. Effect of netting direction and number of meshes around on size selection in the codend for Baltic cod (Gadus morhua). Fish. Res., 109: 80–88. doi.org/10.1016/j.fishres.2011.01.019
WILEMAN, D., R. S. T. FERRO, R. FONTEYNE, and R. B. MILLAR. (Eds.), 1996. Manual of methods of measuring the selectivity of towed fishing gears. ICES Coop. Res. Rep. No. 215.
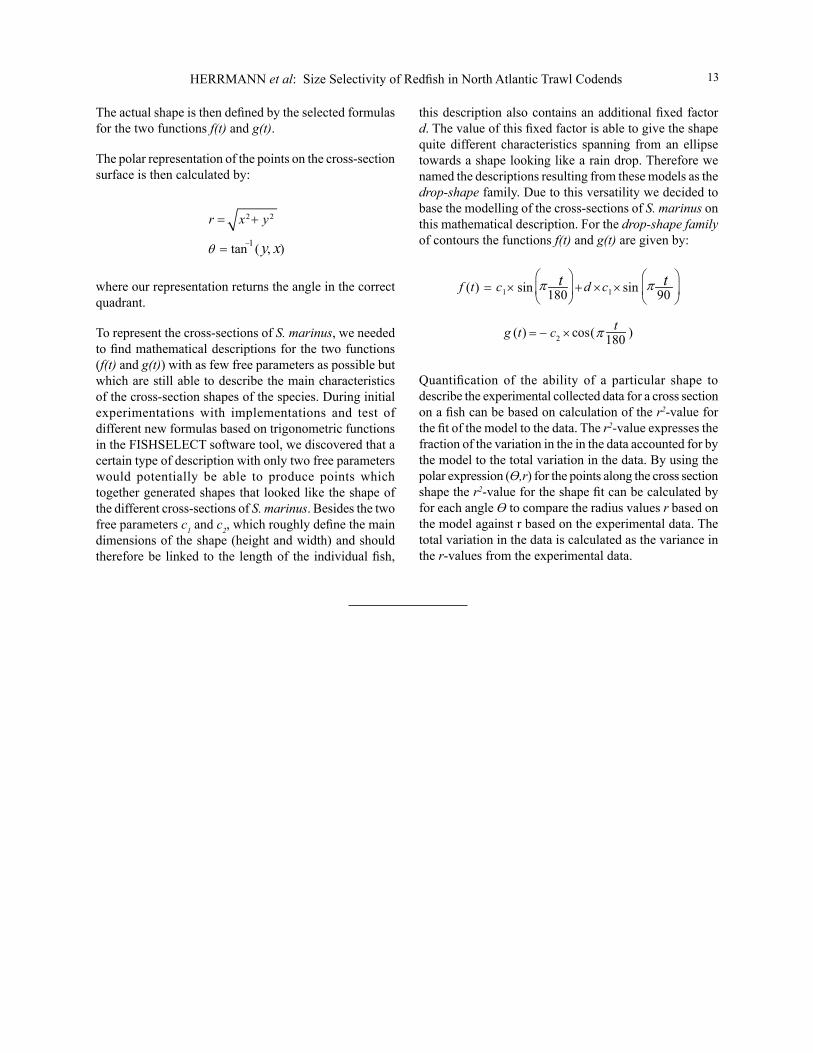
Appendix
Describing the cross-section shapes of S. marinus in FISHSELECT requires a representation in polar coordinates (θ, r), where θ is the angle (0°–360°) and r is the corresponding radius (see appendix in Herrmann et al., 2009). A description that involves only a few parameters is preferred. One flexible method, which enables the modelling of a large family of different shapes by few parameters, is to use a parametric description in Cartesian coordinates of the following form (Bers and Karal, 1976):
[ ]( )
0,360
( )
x f t
t
y g t
=∈
=
HERRMANN et al: Size Selectivity of Redfish in North Atlantic Trawl Codends 13
The actual shape is then defined by the selected formulas for the two functions f(t) and g(t).
The polar representation of the points on the cross-section surface is then calculated by:
2 2
1tan ( , )
r x y
y xθ −
= +
=
where our representation returns the angle in the correct quadrant.
To represent the cross-sections of S. marinus, we needed to find mathematical descriptions for the two functions (f(t) and g(t)) with as few free parameters as possible but which are still able to describe the main characteristics of the cross-section shapes of the species. During initial experimentations with implementations and test of different new formulas based on trigonometric functions in the FISHSELECT software tool, we discovered that a certain type of description with only two free parameters would potentially be able to produce points which together generated shapes that looked like the shape of the different cross-sections of S. marinus. Besides the two free parameters c1 and c2, which roughly define the main dimensions of the shape (height and width) and should therefore be linked to the length of the individual fish,
this description also contains an additional fixed factor d. The value of this fixed factor is able to give the shape quite different characteristics spanning from an ellipse towards a shape looking like a rain drop. Therefore we named the descriptions resulting from these models as the drop-shape family. Due to this versatility we decided to base the modelling of the cross-sections of S. marinus on this mathematical description. For the drop-shape family of contours the functions f(t) and g(t) are given by:
1 1
2
180 90
( ) cos( )180
f t c d c
tg t c π
ππ= × + × ×
= − ×
Quantification of the ability of a particular shape to describe the experimental collected data for a cross section on a fish can be based on calculation of the r2-value for the fit of the model to the data. The r2-value expresses the fraction of the variation in the in the data accounted for by the model to the total variation in the data. By using the polar expression (ϴ,r) for the points along the cross section shape the r2-value for the shape fit can be calculated by for each angle ϴ to compare the radius values r based on the model against r based on the experimental data. The total variation in the data is calculated as the variance in the r-values from the experimental data.