Embed Size (px)
Citation preview

Vol. 67: 127-140, 1990 MARINE ECOLOGY PROGRESS SERIES Mar. Ecol. Prog. Ser.
1 Published October 18
Seasonal development of invertebrate zooplankton on Flemish Cap
John T. Anderson
Department of Fisheries and Oceans, Science Branch, PO Box 5667, St. John's. Newfoundland. Canada A l C 5 x 1
ABSTRACT Flem~sh Cap was dominated by the calanoid copepod Calanus finmarchicus It const~tuted 37 to 69 % of all zooplankton sampled with coarse mesh nets (0 333 and 0 505 mm) and 15 to 33 % In fine mesh nets (0 165 mm) dunng March to August O w ~ n g to its large size, C finmarchjcus dominated the biomass of all specles sampled in both coarse and fine mesh samples The domlnant copepod species in flne mesh samples (0 165 mm) were Oithona s~mll is and 0 atlanOca which together compnsed 20 to 4 2 O/a of all specles sampled C finmarcl~icus formed a d~scre te populahon on Flemish Cap with peak spawning in mid-Aprll beginning first in waters 5 200 m depth Peak biomass occurred In late May and probably early June coincident w ~ t h peak abundance of late-stage copepodites Significant differences were observed in the rate of C finmarchicus developinent and absolute abundance among years sampled on Flemish Cap Differences in development were related to differences in the seasonal hea t~ng of surface waters on Flemish Cap in different years I t is hypothes~zed that these differences in rate of development and absolute abundance of C finmarchlcus and other copepods w ~ l l have a significant effect on larval fish feedlng, growth and survival
INTRODUCTION
Interannual differences in food availability for larval fish stages are believed to be an important determinant of their survival and ultimate recruitment to adult populations. Several hypotheses relate food availability to larval fish survival under varylng conditions (Ander- son 1988). Food availability has been related to vari- able timing of the spring bloom in relation to fish spawning, varying food concentration at the pycno- cline in relation to storm mlxing and to changes in the magnitude of spring production. Emphasis has focused on the importance of the classical marine food chain, consisting of relatively large phytoplankton and her- bivores, to fisheries production in temperate stratified and upwelling systems (Cushing 1989). Recently, the role and response of copepods in such systems have been hypothesized to be a direct link in certain circum- stances between varying environmental events effect- ing survival of larval fish and, by inference, fish recruit- ment (Runge 1988).
The purpose of this paper is to describe the inverte- brate zooplankton community on Flemish Cap (47" N, 45" W) , and to evaluate how the dynamics of dominant community con~ponents may influence fish recruitment in the region; particularly interannual differences in
O Intei--Research/Printed in Germany
the seasonal timing of copepod spawning and develop- ment. Flemish Cap is an offshore bank historically fished for cod and redfish, although at present redfish is dominant. For several years it was the focus of an international study examining possible causes of recruitment variability in these fishes (Lilly 1987). Extrusion of redfish larvae peaks during April; this species constitutes 90 O/O, or more, of all ichthyoplank- ton from March to August (Anderson 1984). Redfish larvae feed predominantly on eggs and nauplii stages of calanoid copepods (Bainbridge & McKay 1968) and, therefore, are highly dependent on the spring produc- tion of copepods. In such a system copepods are expected to have a direct effect on larval fish survival (Runge 1988).
Previous studies of invertebrate zooplankton on Flemish Cap have been carried out during the period from February to September and spanning the years 1958 to 1981 (Vladimirskaya 1967, Konstantinov et al. 1985). However, these studies have been limited by the use of a coarse mesh net (ca 0.5 mm) , irregular sam- pling, contradictory results and lack of comparison of interannual variability. Nevertheless, they have described the general zooplankton community on Flemish Cap, including the time of spring spawning and peak biomass.

128 Mar Ecol. Prog. Ser. 67: 127-140, 1990
MATERIALS AND METHODS
Field collections. Zooplankton was collected during 14 plankton surveys between 1977 and 1983 on Flem- ish Cap (Fig. 1). Each survey lasted 3 to 7 d and com- prised 20 to 56 stations spaced 20 nautical miles (37 km) apart in a grid-like pattern. During 1978 to 1983 sampling dates ranged from the beginning of March to the first week of August, with 1 survey con- ducted in October 1977 (Table 1).
Plankton samples were collected at each station using a 61 cm bongo sampler with two 0.333 mm mesh nets. In 2 cruises 0.505 mm mesh nets were used although this was limited to one side of the bongo sampler during the cruise 25 to 30 Oct 1977 and 31 stations during the cruise 2 to 9 May 1981. During 7 cruises a 20 cm bongo sampler was used simultane- ously with the 61 cm bongo sampler, using 0.165 and 0.253 mm mesh nets. Finally, a 50 cm ring net using a 0.080 mm mesh net was used during 4 cruises. A sum- mary of the number of stations sampled and samples processed for species identifications and plankton bio- mass is given in Table 1.
The bongos were towed obliquely from near the bottom or 200 m depth, whichever was less, at ca 1.25 to 1.5 m S-' (2.5-3.0 knots), following standard tech- niques of Smith & Richardson (1977). Payout and retrieval rates were 0.83 and 0.33 m S-', respectively. Each net was fitted with a GO flow meter and max- imum depth was monitored using a pressure sensor
C O N m - a 4 '39 m 9 - r (U
(UN O N - W ' 9 - 3 '
Fig. 1. Flemish Cap (47" N, 45' W), situated west of the Grand Bank of Newfoundland bounded by the area sampled

Anderson: Seasonal development of zooplankton 129
fitted above the bongo frame. During 2 surveys, 20 to 26 Mar and 10 to 14 Jul 1979, oblique tows were done to 125 m depth only. Ring net samples were towed vertically from 100 m depth. All samples were pre- served in 5 % buffered formalin.
Tow data from the 14 cruises were edited to remove identifiable sources of error. Editing for volume of water filtered was based on a comparison of least squares regressions of water volume versus tow time for the cruise data compared to the modelled relation- ship Y = 29.91 X (Webster & Anderson 1987), where Y = water volume (m3); X = tow time (min). Tow depth was edited based on the regression of tow depth versus edited water volume data compared to the modelled relationship Y = 0.335X, where Y = tow depth; X =
water volume. In each case outliers were corrected if possible based on verification of incorrect data record- ing or coding. There were few cases of low water volume filtered, indicating that clogging of the nets was not a problem. If water volume was missing for a particular sample then water volume was estimated based on the relevant regression equation for that cruise.
Laboratory processing. Plankton volume was mea- sured using methods similar to those outlined by Smith & Richardson (1977). Large fish and gelatinous zoo- plankton (> l cm3) were removed from the sample prior to measurement, usually by use of a coarse mesh net. The remaining sample was then drained using Nitex mesh of the same, or smaller, size as the original sample until drainage diminished to the occasional drop. Plankton volume to the nearest m1 was then measured by displacement of water in a graduated cylinder.
All large animals (e.g. chaetognaths, ctenophores, cnidarians, amphipods, decapods, mysis, larvaceans, euphausiids, fish, ostracods, pteropods, polychaetes) were initially removed and identified to species, if possible, and counted. For large mesh samples (0.505 and 0.333 mm mesh, 61 cm bongo) samples were split using either Folsom or Motoda plankton splitters or the beaker technique of Van Guelpen et al. (1982), and ca 100 individuals of the dominant taxon were iden- tified and counted from the subsample. Less numerous taxa were counted from progressively larger subsam- ples. For samples from 0.165 and 0.080 mm mesh nets, total sample volume was made up to a known amount and 1.0 m1 subsamples were withdrawn. For all sam- ples at least 300 individuals were identified and counted, where ca 100 individuals of the most common taxon were identified. When one species completely dominated the sample, counting was continued to ensure that 30 to 50 of the next most abundant taxa were identified and counted. Taxa were identified as completely as possible using available literature,
and abundant copepod species were staged where possible.
All data were coded according to the method of Foy & Anderson (1986) and extensively edited. All data base management and statistical analyses were done using the Statistical Analysis System (SAS 1985). Abundance (number m-') was calculated as
and density (number m-3) was calculated as
where C = number of plankton collected; D = maxi- mum sampled depth (m); L = length of the tow path (m); r = radius of the net opening (m2).
Statistical analyses for abundance differences were done using parametric techniques on square root trans- formed data whenever possible. The assumption of homogeneity of variances was tested for t-test compari- sons using the F-ratio test and for multiple mean com- parisons using either Bartlett's chi-square test or Leve- ne's test (Brown & Forsythe 1974). When the assump- tion of homogeneity was rejected non-parametric techniques were used. For comparison between 2 means Wilcoxon's test was used (Sokal & Rohlf 1969). For conlparison of more than 2 means tests for differ- ences were done using a standard unbalanced ANOVA on ranked scores of the original data (SAS 1985). The ANOVA on ranked scores is considered to be a more robust analysis than the Kruskal-Wallis test with the advantage that the ranked data can be analyzed using a posteriori techniques routinely available for paramet- ric analyses. In all cases Duncans's multiple range test was used testing for differences a t p < 0.05. For com- parisons of relative stage frequency differences of copepods the Kolmogorov-Smirnov test was used (Siege1 1956).
Estimates of copepod development. Development times of zooplankton are directly dependent on water temperature in which the zooplankton are developing. Predictions of stage duration and peak spawning of Calanus finmarchicus were based on the temperature dependent Belehradek equations of Corkett et al. (1986) which are of the general form
where D = development time (d); T = temperature ("C); a , or and b = fitted parameters. The a parameter is for C, finmarchicus copepodite stages: C1 = 6419, C11 = 8014, CIII = 9816, CIV = 11 601, CV = 13 526 and CV1 = 17 477. For all equations or - -10.60, b = -2.05.
130 Mar. Ecol. Prog. Ser 67: 127-140, 1990
Backcalculations of stage development to estimate peak spawning of Calanus finmarchicus for 1980 and 1981 were based on observations during the last week of May each year. In 1980 copepodite stage C111 domi- nated, in 1981 stage CIV. Development times for stages CIII and CIV were based on average may tem- peratures. For stage C11 copepodites predictions were based on a weighted average of April and May tem- peratures, where April temperatures were weighted by a factor of 2. Finally, estimates for stage C1 were based on average April temperatures as all development was estimated to have occurred during this month. It is assumed that early stages of marine copepods, and specifically C. finmarchicus, occur in the upper water column (Krause & Trahms 1982, Williams et al. 1987, Williams & Conway 1988). Therefore, estimates of development rate were based on surface water tem- peratures. Average monthly temperature at 10 m depth was estimated from Nansen bottle and bathythermo- graph data available from the Marine Environmental Data Service, Ottawa (MEDS). The area chosen to be 5 200 m depth was bounded by 46' 40' to 47' 20' N and 44" 30' to 45O 20' W.
RESULTS
Zooplankton biomass
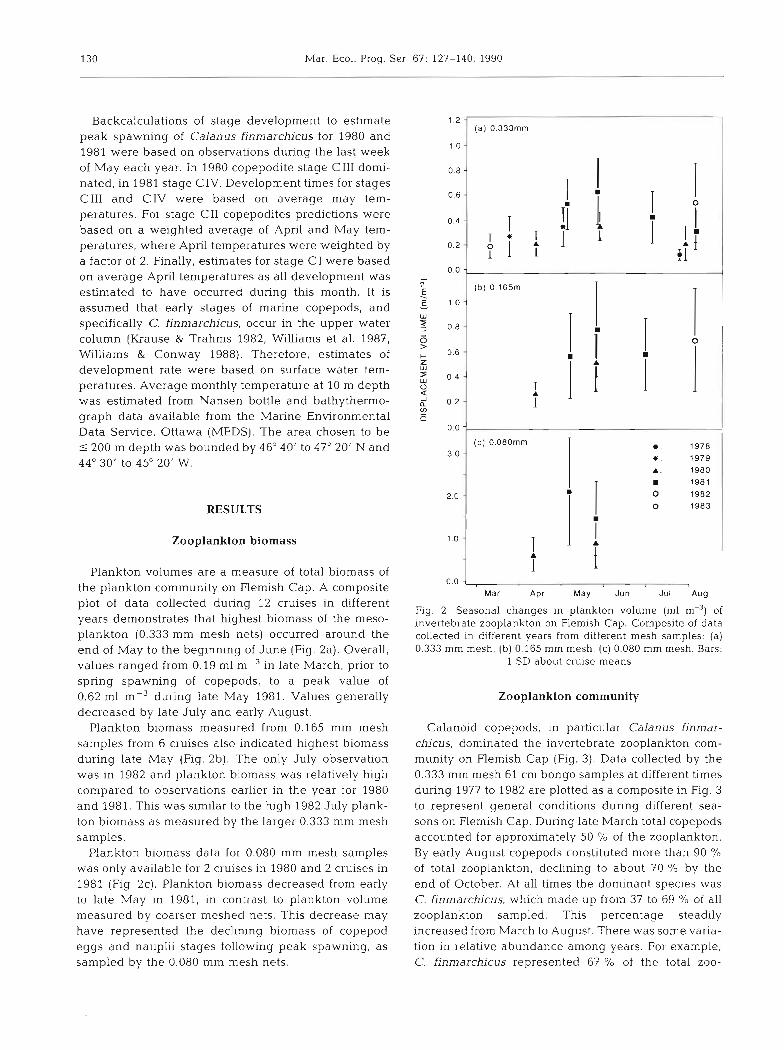
Plankton volumes are a measure of total biomass of the plankton community on Flemish Cap. A composite plot of data collected during 12 cruises in different years demonstrates that highest biomass of the meso- plankton (0.333 mm mesh nets) occurred around the end of May to the beginning of June (Fig. 2a). Overall, values ranged from 0.19 m1 m-3 in late March, prlor to spring spawning of copepods, to a peak value of 0.62 m1 m-3 during late May 1981. Values generally decreased by late July and early August.
Plankton biomass measured from 0.165 mm mesh samples from 6 cruises also indicated highest biomass during late May (Fig. 2b). The only July observation was in 1982 and plankton biomass was relatively high compared to observations earlier in the year for 1980 and 1981. This was similar to the high 1982 July plank- ton biomass as measured by the larger 0.333 mm mesh samples.
Plankton biomass data for 0.080 mm mesh samples was only available for 2 cruises in 1980 and 2 cruises in 1981 (Fig. 2c). Plankton biomass decreased from early to late May in 1981, in contrast to plankton volume measured by coarser meshed nets. This decrease may have represented the declining biomass of copepod eggs and nauplii stages following peak spawning, as sampled by the 0.080 mm mesh nets.
1.2 (a) 0.333mm
(c) O.08Omm
0.0 4 Mar Apr May Jun Jul Aug
Fig. 2. Seasonal changes in plankton volume (m1 m-3) of invertebrate zooplankton on Flemish Cap. Composite of data collected in different years from hfferent mesh samples: (a) 0.333 mm mesh, (b) 0.165 mm mesh, (c) 0.080 mm mesh. Bars:
1 SD about cruise means
Zooplankton community
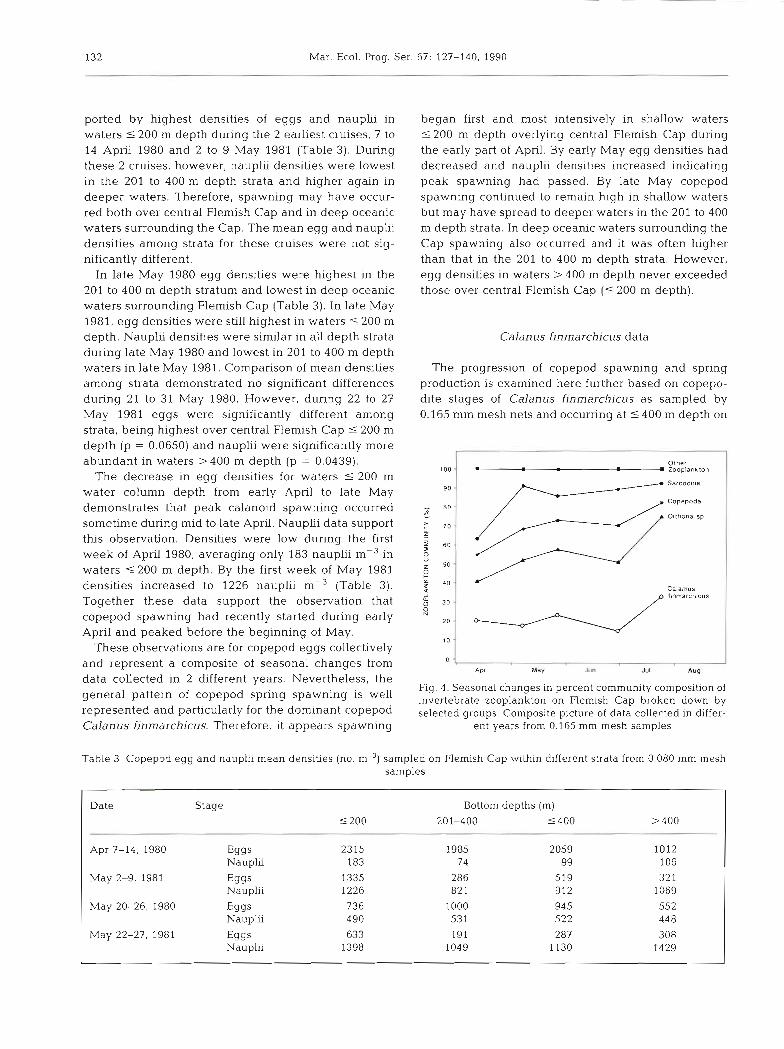
Calanoid copepods, in particular Calanus finmar- chicus, dominated the invertebrate zooplankton com- munity on Flemish Cap (Fig. 3). Data collected by the 0.333 mm mesh 61 cm bongo samples at different times during 1977 to 1982 are plotted as a composite in Fig. 3 to represent general conditions during different sea- sons on Flemish Cap. During late March total copepods accounted for approximately 50 O/Q of the zooplankton. By early August copepods constituted more than 90 '10 of total zooplankton, declining to about 70 % by the end of October. At all times the dominant species was C. finmarchicus, which made up from 37 to 69 % of all zooplankton sampled. This percentage steadily increased from March to August. There was some varia- tion in relative abundance among years. For example, C. finmarchicus represented 67 % of the total zoo-

Anderson: Seasonal d e v ~ llopment of zooplankton 131
EuphauS#!dae
Gastropods
Copepoda
Oithona sp Calanus linrn.mchoc~s
Apr Mar Jun Jul Aug Sep Oct Nov
Fig. 3. Seasonal changes in percent community composition of invertebrate zooplankton on Flemish Cap broken down by selected groups. Composite picture of data collected in differ-
ent years from 0.333 mm mesh samples
plankton 1 to 4 August 1981 and 83 % 1 to 3 August 1982. Other medium-sized copepods (2.0 to 5.5 mm TL) that occurred abundantly were Metridia lucens, M. longa and C. glacialis. The large calanoid copepods (5.0 to 10 mm TL), C. hyperboreus and Euchaeta nor- vegica, were observed in small numbers.
Non-copepod species groups represented in the col- lections were summarized into 12 species groups. In each case 1 or 2 species dominated within each group. The ostracods were dominated by Conchoecia elegans and C. obtusata, gastropods by Limacina sp., larva- ceans by Oikopleura vanhoeffeni and 0. labradorien- sis, and euphausiids by Meganictyphanes norvegica. Other species groups occurring in low relative densities included echinoderm larvae, hyperiid amphipods, chaetognaths (Sagitta spp.), ctenophors (Pleurobrachia spp.), jellyfish (Cnidaria) and polychaetes. The species groups summarized here as 'other' ranged from 9 to 30 O/O abundance of all species observed (Fig. 3).
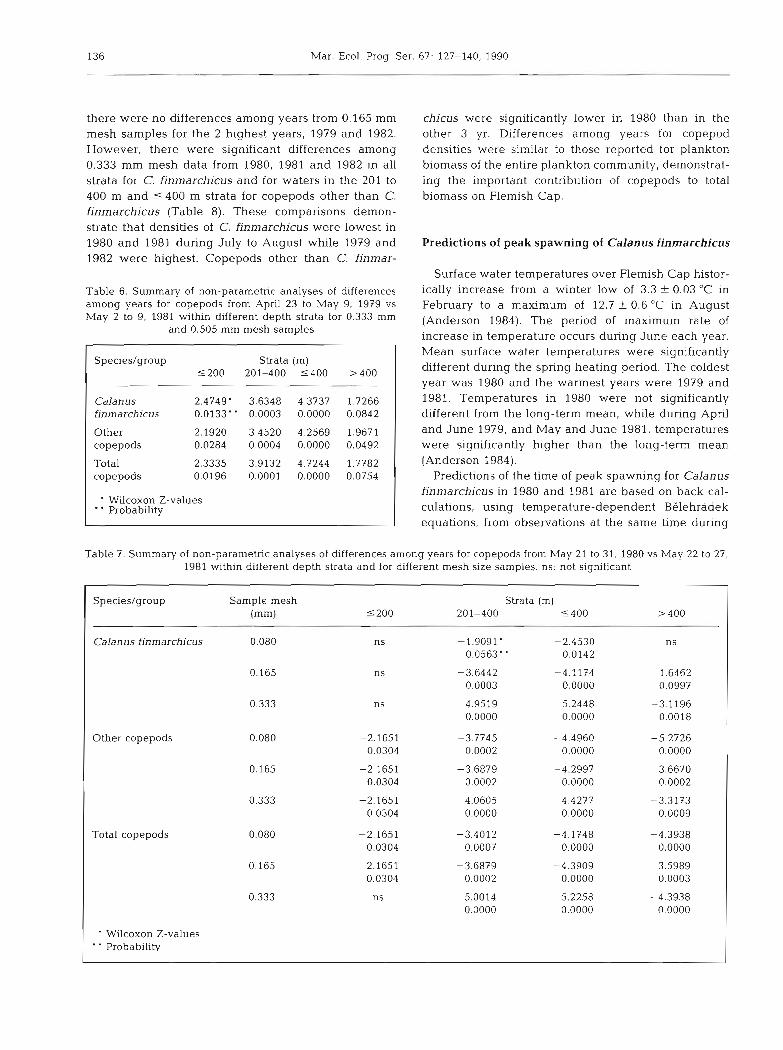
Samples of smaller zooplankton from finer mesh samples (0.165 mm mesh, 20 cm bongos) again indi- cated that copepods numerically dominated the zoo- plankton community, ranging from 55 to 82 % during the period April through July (Fig. 4). The dominant species in these samples were the cyclopoid copepods Oithona similis and 0. atlantica. Together they com- prised from 20 to 42 % of all species sampled by the finer mesh nets, and 37 to 51 % of all copepods. Calanus finmarchicus numerically represented 15 to 43 % of all species sampled. Similar to samples from the coarser mesh nets (0.333 mm) there was an increase in the percent composition of copepods during the period sampled from early April to early August. Other species of small copepods (0.5 to 1.5 mm TL) present in these samples were Microcalanus pygnlaeus, which was very similar in abundance to 0, atlantica, followed
b y Pseudocalanus spp., Scolecithricella minor and Oncaea borealis, in descending order of abundance.
A comparison of abundances of Calanus finmar- chicus and Oithona spp. collected with 0.165 mm mesh nets shows that Oithona spp. were more numerous in 5 of 7 cruises (Table 2). In early April 1980 densities were equal for the Flemish Cap area and during 1 to 3 August 1982 densities of Oithona spp. were lower than C. finmarchicus. At other times, representing the period from May to July, Oithona spp. were 1.1 to 2.5 times more abundant than C. finmarchicus. When com- paring biomass, however, C. finmarchicus dominated in all 7 cruises ranging from 8 to 137 times more in total weight (Table 2). The largest differences in total bio- mass occurred during early April and early August when abundances of C, finmarchicus were equal to or greater than those of Oithona spp., the former domi- nated by copepodite stages CV1 and CV, respectively.
A second notable difference in the finer mesh sam- ples was the abundance of foraminiferans and radiola- rians, of which Globigerina spp. were the dominant species identified. Together these protists accounted for 10 to 43 % of zooplankton enumerated.
Timing of annual copepod spawning on Flemish Cap
Eggs and nauplii data
Copepod spawning on Flemish Cap was examined first based on early copepod stages sampled by the fine mesh nets (0.080 mm) in 1980 and 1981. To compare spatial differences of spawning in waters on and around the Cap, egg and nauplii data were divided into 3 depth strata according to bottom topography: 5 200, 201 to 400 and > 400 m water depth.
Copepod spawning was most concentrated in the shallowest waters overlying Flemish Cap. This is sup-
Table 2. Ratios of Calanus finmarchicus mean density (no. m-3) and weight (mg m-3) to Oithona spp, at different times. Data for Flemish Cap from small mesh samples (0.165 mm). Weights were estimated by the sum of total weight in each copepodite stage for each species for each cruise, standar- dized for the numbers of stations in each cruise. Copepodite
weights from Tremblay (1981)
Date Density Weight
Apr 7-14, 1980 1.01:l 137:l May 2-9, 1981 0.52:l 8: 1 May 22-27, 1981 0.53:l 23: 1 May 21-31. 1980 0.88:l 39: 1 Jun 26-30. 1981 0.40:l 29: 1 Jul 10-14, 1979 0.47:l 34:l Aug 1-3, 1982 1.23:l 78: 1
132 Mar. Ecol. Prog. Ser. 67: 127-140, 1990
ported by highest densities of eggs and nauplii in waters 5 200 m depth during the 2 earliest cruises, 7 to 14 April 1980 and 2 to 9 May 1981 (Table 3). During these 2 cruises, however, nauplii densities were lowest in the 201 to 400 m depth strata and higher again in deeper waters. Therefore, spawning may have occur- red both over central Flemish Cap and in deep oceanic waters surrounding the Cap. The mean egg and nauplii densities among strata for these cruises were not sig- nificantly different.
In late May 1980 egg densities were highest in the 201 to 400 m depth stratum and lowest in deep oceanic waters surrounding Flemish Cap (Table 3). In late May 1981, egg densities were still highest in waters 5 200 m depth. Nauplii densities were similar in all depth strata during late May 1980 and lowest in 201 to 400 m depth waters in late May 1981. Comparison of mean densities among strata demonstrated no significant differences during 21 to 31 May 1980. However, during 22 to 27 May 1981 eggs were significantly different among strata, being highest over central Flemish Cap r 200 m depth (p = 0.0650) and nauplii were significantly more abundant in waters > 400 m depth (p = 0.0439).
The decrease in egg densities for waters 5 200 m water column depth from early April to late May demonstrates that peak calanoid spawning occurred sometime during mid to late April. Nauplii data support this observation. Densities were low during the first week of April 1980, averaging only 183 nauplii m-3 in waters S 2 0 0 m depth. By the first week of May 1981 densities increased to 1226 nauplii m-3 (Table 3). Together these data support the observation that copepod spawning had recently started during early April and peaked before the beginning of May.
These observations are for copepod eggs collectively and represent a composite of seasonal changes from data collected in 2 different years. Nevertheless, the general pattern of copepod spring spawning is well represented and particularly for the dominant copepod Calanus finmarchicus. Therefore, it appears spawning
began first and most intensively in shallow waters 5 200 m depth overlying central Flemish Cap during the early part of April. By early May egg densities had decreased and nauplii densities increased indicating peak spawning had passed. By late May copepod spawning continued to remain high in shallow waters but may have spread to deeper waters in the 201 to 400 m depth strata. In deep oceanic waters surrounding the Cap spawning also occurred and it was often higher than that in the 201 to 400 m depth strata. However, egg densities in waters > 400 m depth never exceeded those over central Flemish Cap (5 200 m depth).
Calanus finmarchicus data
The progression of copepod spawning and spring production is examined here further based on copepo- dite stages of Calanus finmarchicus as sampled by 0.165 mm mesh nets and occurring at 5 400 m depth on
A P ~ Mav Jun Jul hug
Fig. 4. Seasonal changes in percent community composition of invertebrate zooplankton on Flemish Cap broken down by selected groups. Composite picture of data collected in differ-
ent years from 0.165 mm mesh samples
Table 3. Copepod egg and nauplii mean densities (no. m-3) sampled on Flemish Cap within different strata from 0.080 mm mesh samples
Date Stage Bottom depths (m) 5 200 201-400 5 4 0 0 >400
Apr 7-14, 1980 Eggs 2315 1985 2059 1012 Nauplii 183 74 99 106
May 2-9, 1981 Eggs 1335 286 519 32 1 Nauplii 1226 82 1 912 1069
May 20-26, 1980 Eggs 736 1000 945 552 Nauplii 490 53 1 522 448
May 22-27, 1981 Eggs 633 191 287 308 Nauplii 1398 1049 1130 1429
1
Anderson. Seasonal development of zooplankton 133
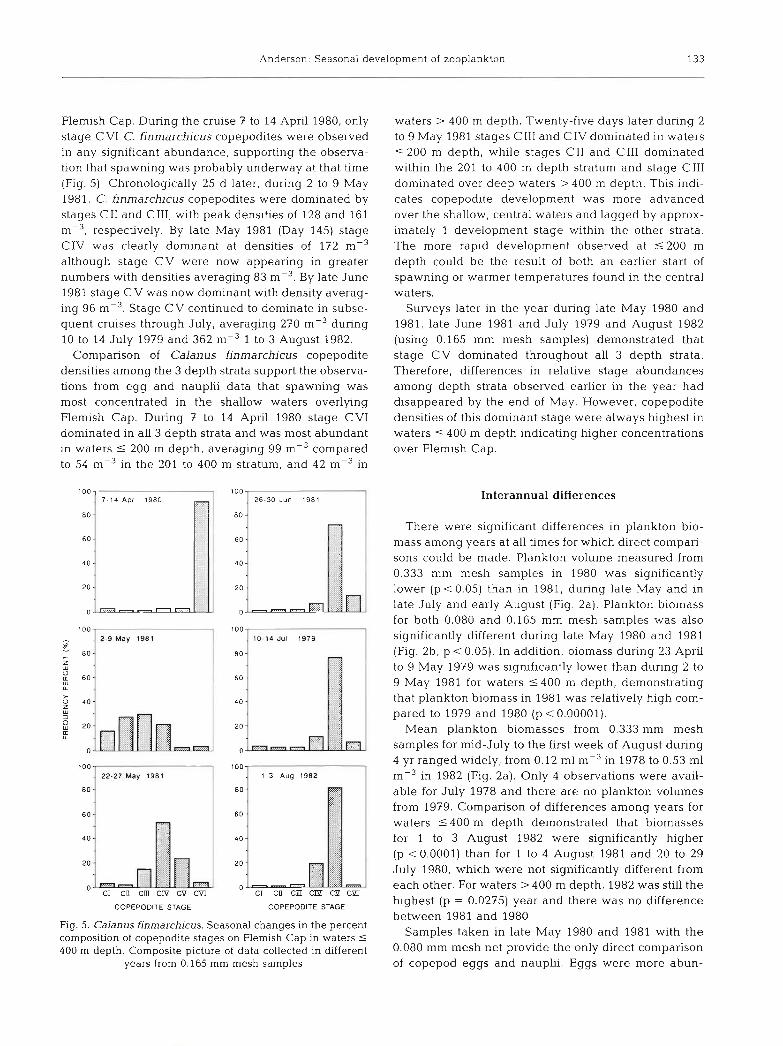
Flemish Cap. During the cruise 7 to 14 April 1980, only stage C V1 C. finmarchicus copepodites were observed in any significant abundance, supporting the observa- tion that spawning was probably undenvay at that time (Fig. 5) . Chronologically 25 d later, during 2 to 9 May 1981, C. finmarchicus copepodites were dominated by stages C11 and CIII, with peak densities of 128 and 161 m-3, respectively. By late May 1981 (Day 145) stage CIV was clearly dominant at densities of 172 m-3 although stage CV were now appearing in greater numbers with densities averaging 83 mP3. By late June 1981 stage CV was now dominant with density averag- ing 96 m-3. Stage CV continued to dominate in subse- quent cruises through July, averaging 270 m-3 during 10 to 14 July 1979 and 362 1 to 3 August 1982.
Comparison of Calanus finmarchicus copepodite densities among the 3 depth strata support the observa- tions from egg and nauplii data that spawning was most concentrated in the shallow waters overlying Flemish Cap. During 7 to 14 April 1980 stage CV1 dominated in all 3 depth strata and was most abundant in waters 5 200 m depth, averaging 99 m-3 compared to 54 m-3 in the 201 to 400 m stratum, and 42 m-3 in
100- 100- -- 7 14 Apr 1980 26 30 J u n 1981
80 n 80:
100 - 100- - . 2-9 May 1981 . 10-14 JuI 1979
loo-- 22-27 May 1981
80 -
100- - p - . 1 . 1-3 Aug 1982
COPEPODlTE STAGE COPEPODITE STAGE
Fig. 5. Calanus finmarchicus. Seasonal changes in the percent composition of copepodite stages on Flemish Cap in waters 5
400 m depth. Composite picture of data collected in different years from 0.165 mm mesh samples
waters > 400 m depth. Twenty-five days later during 2 to 9 May 1981 stages C111 and CIV dominated in waters 5 200 m depth, while stages C11 and C111 dominated within the 201 to 400 m depth stratum and stage C111 dominated over deep waters > 400 m depth. This indi- cates copepodite development was more advanced over the shallow, central waters and lagged by approx- imately 1 development stage within the other strata. The more rapid development observed at 5 200 m depth could be the result of both an earlier start of spawning or warmer temperatures found in the central waters.
Surveys later in the year during late May 1980 and 1981, late June 1981 and July 1979 and August 1982 (using 0.165 mm mesh samples) demonstrated that stage CV dominated throughout all 3 depth strata. Therefore, differences in relative stage abundances among depth strata observed earlier in the year had disappeared by the end of May. However, copepodite densities of this dominant stage were always highest in waters 5 400 m depth indicating higher concentrations over Flemish Cap.
Interannual differences
There were significant differences in plankton bio- mass among years at all times for which direct compari- sons could be made. Plankton volume measured from 0.333 mm mesh samples in 1980 was significantly lower (p < 0.05) than in 1981, during late May and in late July and early August (Fig. 2a). Plankton biomass for both 0.080 and 0.165 mm mesh samples was also significantly different during late May 1980 and 1981 (Fig. 2b, p < 0.05). In addition, biomass during 23 April to 9 May 1979 was significantly lower than during 2 to 9 May 1981 for waters 5 4 0 0 m depth, demonstrating that plankton biomass in 1981 was relatively high com- pared to 1979 and 1980 (p < 0.00001).
Mean plankton biomasses from 0.333 mm mesh samples for mid-July to the first week of August during 4 yr ranged widely, from 0.12 m1 rnp3 in 1978 to 0.53 m1 m-3 in 1982 (Fig. 2a). Only 4 observations were avail- able for July 1978 and there are no plankton volumes from 1979. Comparison of differences among years for waters S 4 0 0 m depth demonstrated that biomasses for 1 to 3 August 1982 were significantly higher (p < 0.0001) than for 1 to 4 August 1981 and 20 to 29 July 1980, which were not significantly different from each other. For waters > 400 m depth, 1982 was still the highest (p = 0.0275) year and there was no difference between 1981 and 1980.
Samples taken in late May 1980 and 1981 with the 0.080 mm mesh net provide the only direct con~parison of copepod eggs and nauplii. Eggs were more abun-

134 Mar. Ecol. Prog. Ser. 67. 127-140, 1990
dant and nauplii were less abundant in late May 1980 than in 1981. For waters over Flemish Cap 5 4 0 0 m depth, egg: nauplii ratios were 1.81: 1 in 1980 compared to 0.25:l in 1981. Eggs were significantly more abun- dant in waters 1 4 0 0 m depth in 1980 versus 1981 (p =
0.0154) whereas there was no significant difference in waters >400 m depth. Nauplii were more abundant during 1981 in all depth strata (p <0.00001). These observations suggest that copepod spawning and sea- sonal development was more advanced as the season progressed in 1981 compared to 1980.
Comparison of differences in Calanus finmarchicus copepodites among years reveals significant differences in both the relative rates of copepodite development and in absolute abundances. Direct observations can be made among years for 0.165 and 0.333 mm mesh sam- ples at various times (Table 4). Relative stage densities of C. finmarchicus copepodites from 23 April to 9 May 1979 compared with 2 to 9 May 1981 for large mesh samples indicate that development was more advanced in 1981 (Kolmogorov-Smirnov test, p < 0.01). However, this comparison must be qualified, because stages C1 to C11 were not sampled by the 0.505 mm mesh nets used in 1981 (Anderson & Warren in press). Comparing 0.165 mm mesh samples in late May 1980 and 1981, development of copepods in 1980 significantly lagged that of 1981 by 1 stage (Kolmogorov-Smirnov test, p < 0.01). This was supported by the 0.333 mm mesh data. In both cases stage CIII was dominant in 1980 and stage CIV in 1981 at the time of sampling. The differ- ences between late May 1980 and 1981 were also found among other calanoid species for which stage abun- dance data are available; C, hyperboreus and Micro- calanus spp. were also more advanced in 1981.
Table 4. Calanus finmarchicus. Comparison of copepodite stage Flemish Cap, from 0.165 mm
By mid-July to early August stage CV dominated in all years from 1979 to 1982. Kolmogorov-Smirnov tests among years demonstrated that Calanus finmarchicus copepodites from 0.165 mm mesh samples were more advanced in 1979 than in 1982 (p < 0.01, Table 4). CV dominated both years, but CIV was relatively less abundant and CV1 was more abundant in 1979 than in 1982. Further comparisons of copepodite stage differ- ences based on 0.333 mm mesh samples demonstrated no significant differences between 1980 and 1982, but both years were significantly different from 1981 (p < 0.01). CIV was relatively less abundant in 1981 compared to 1980 and 1982 (Table 4). Therefore. development of C, finmarchicus was more advanced in 1981 than in 1980 and 1982. Given that the time of sampling was identical for 1981 and 1982 and earlier in 1979 than in 1982, these differences in copepodite stages would have resulted from an earlier spawning time, more rapid development rate, or both. The earlier sampling data in 1980 compared to 1981 (7 d) may have contributed to the difference between these years.
A direct comparison could not be made between 1979 and 1980 or 1981 data as mesh sizes were not the same. However, CIV:CV catch ratios were 0.113 in 1979 (0.165 mm mesh data) and 0.026 in 1981 (0.333 mm mesh data), indicating that development in 1979 lagged that of 1981. Given these comparisons it appears that copepodite development was most advanced in 1981, followed by 1979, followed in turn by 1980 and 1982, which were not different form each other.
These observations of relative stage differences in summer (July to August) are supported by comparisons earlier in the season. During late May copepodite development was more advanced in 1981 than in 1980
densities (no. m?) in different years for waters 5400 m depth on and 0.333 mm mesh samples
Date Copepodite density (0.333 mm mesh) Copepodite density (0.165 mm mesh)
C l C11 CIII CIV C V CV1 C 1 C11 C111 CIV C V CV1
Apr 23-May 9, 1979 8.6 13.9 10.8 7 9 6.8 49.5 vs
May 2-9, 1981 - - 36.6 63.1 8.2 7.5
May 21-31, 1980 1.2 8.5 35.8 20 2 6.1 25 1 13.7 25.7 34.8 14.4 3.6 16.7 vs
May 22-27, 1981 - 3.2 50.3 267.2 119.5 22.2 10.4 7.3 57.0 200.3 91.3 17.5
Jul 10-14. 1979 6.9 9.3 9.4 30.7 277.8 54.8 vs
Aug 1-3, 1982 3.8 1.5 5.8 81.3 355 1 4.9
J u ~ 20-29, 1980 - 3.4 10.5 14.4 55.2 8.7 VS
Aug 1-4, 1981 - - 2.3 2.1 74.8 17.8 vs
Aug 1-3, 1982 - - 5.1 93.4 274.9 6.3

Anderson: Seasonal development of zooplankton 135
which was still true in July to August. At the beginning of May development was again more advanced in 1981 than in 1979 and this was still true in summer. The samples are distributed unevenly in time, but overall support the fact that copepodite development differed among years, beginning early in the season.
Comparison of copepod abundances among years must be done with caution due to possible differences among years in the time of spawning, the temperature
dependent rate of copepod development and stage- dependent mortalities. Copepod densities were greater in 1981 for April to May compared to 1979 and 1980 (Table 5). This was true for both Calanus finmarchicus and other copepods for each strata. All comparisons indicated these differences were significant except for C. finmarchicus in late May 1980 vs 1981 for waters 1 2 0 0 m (all meshes) and waters > 400 m for 0.080 mm mesh data only (Tables 6 and 7). For July to August
Table 5. Companson of mean densities (no. n1r3) of Calanus finmarchicus and other copepods among years on Flemish Cap within different depth strata for 0.165 mm and 0.333 mm mesh samples
Species/group Date Strata (m) 5 200 201400 S 400 > 400 Total
Mesh size = 0.165 mm C. finmarchicus May 21-31, 1980 72.0 90.3 86.2 179.1 138.3
VS
May 22-27, 1981 262.9 395.1 367.3 288.7 325.1
Jul 10-14, 1979 413.3 367.1 383.9 271.2 366.6 V S
AUCJ 1-3, 1982 348.5 475.1 447.0 210.8 413.2
Other copepods May 21-31, 1980 100.2 219.6 193.0 265.4 233.7 vs
May 22-27, 1981 1367.2 741.1 872.9 660.7 759.1
Jul 10-14, 1979 1166.2 832.5 953.9 312.9 855.3 VS
Aug 1-3, 1982 504.0 376.0 404.4 179.9 372.3
Mesh size = 0.333 mm C. finmarchicus Apr 23-May 9. 1979 91.1 98.0 95.8 135.2 115.8
vs May 2-9, 1981' 191.7 237.3 225.9 188.2 207.7
May 21-31. 1980 245.1 75.3 95.9 129.5 109.7 vs
May 22-27, 1981 324.3 505.8 467.6 337.1 396.1
Jul 10-14, 1979" 343.5 305.1 319.1 225.4 304.7 vs
Jul 20-29, 1980 157.0 59.8 85.1 57.6 73.1 vs
Aug 1 4 , 1981 168.3 76.0 96.5 37.1 90.5 VS
Aug 1-3, 1982 267.8 411.2 379.3 223.6 357.1
Other copepods Apr 23-May 9, 1979 35.4 61.9 53.6 73.3 63.6 vs
May 2-9, 1981' 96.2 162.3 145.8 105.8 126.4
May 21-31, 1980 21.4 54.2 50.3 50.7 50.4 vs
May 22-27, 1981 76.7 139.3 126.1 110.8 117.7
Jul 10-14, 1979. ' 231.3 165.1 189.2 62.1 169.6 VS
Jul 20-29, 1980 20.1 16.0 17.1 23.2 19.8 VS
Aug 1-4, 1981 31.3 29.0 29.5 39.9 30.6 VS
A u ~ 1-3, 1982 37.9 48.4 46.1 33.9 44.3
505 pm mesh samples ' ' Estimated by predicted catch ratios for 0333:0.165 mm mesh nets for C. finmarchicus = X 0.8311; other copepods = X 0.1983
136 Mar. Ecol. Prog. Ser. 67: 127-140, 1990
there were no differences among years from 0.165 mm mesh samples for the 2 highest years, 1979 and 1982. However, there were significant differences among 0.333 mm mesh data from 1980, 1981 and 1982 in all strata for C, finmarchcus and for waters in the 201 to 400 m and S 4 0 0 m strata for copepods other than C. finmarchicus (Table 8). These comparisons demon- strate that densities of C. finmarchicus were lowest in 1980 and 1981 during July to August while 1979 and 1982 were highest. Copepods other than C. finmar-
Table 6. Summary of non-parametric analyses of differences among years for copepods from April 23 to May 9, 1979 vs May 2 to 9, 1981 within different depth strata for 0.333 mm
and 0.505 mm mesh samples
Species/group Strata (m) 1 2 0 0 2 0 1 4 0 0 5 4 0 0 >400
Calanus 2.4749' 3.6348 4.3737 1.7266 finmarchicus 0.0133* 0.0003 0.0000 0.0842
Other 2.1920 3.4520 4.2569 1.9671 copepods 0.0284 0.0004 0.0000 0.0492
Total 2.3335 3.9132 4.7244 1.7782 copepods 0.0196 0.0001 0.0000 0.0754
Wilcoxon Z-values ' ' Probability
chicus were significantly lower in 1980 than in the other 3 yr. Differences among years for copepod densities were similar to those reported for plankton biomass of the entire plankton community, demonstrat- ing the important contribution of copepods to total biomass on Flemish Cap.
Predictions of peak spawning of Calanus finmarchicus
Surface water temperatures over Flemish Cap histor- ically increase from a winter low of 3.3 + 0.03 "C in February to a maximum of 12.7 f 0.6 "C in August (Anderson 1984). The period of maximum rate of increase in temperature occurs during June each year. Mean surface water temperatures were significantly different during the spring heating period. The coldest year was 1980 and the warmest years were 1979 and 1981. Temperatures in 1980 were not significantly different from the long-term mean, while during April and June 1979, and May and June 1981, temperatures were significantly higher than the long-term mean (Anderson 1984).
Predictions of the time of peak spawning for Calanus finmarchcus in 1980 and 1981 are based on back cal- culations, using temperature-dependent B6lehradek equations, from observations at the same time dunng
Table 7. Summary of non-parametric analyses of differences among years for copepods from May 21 to 31, 1980 vs May 22 to 27, 1981 within different depth strata and for different mesh size samples. ns: not significant
Species/group Sample mesh Strata (m) (mm) 5 200 201-400 5 400 > 400
Calanus finmarchicus 0.080 ns -1.9091' -2.4530 ns 0.0563' ' 0.0142
0.165 ns -3.6442 -4.1174 1.6462 0.0003 0.0000 0.0997
0.333 ns 4.9519 5.2448 -3.1 196 0.0000 0.0000 0.0018
Other copepods 0.080 -2.1651 -3.7745 -4.4960 -5.2726 0.0304 0.0002 0.0000 0.0000
Total copepods 0.080 -2.1651 -3.4012 -4.1748 -4.3938 0.0304 0.0007 0.0000 0.0000
Wilcoxon Z-values ' ' Probabihty

Anderson. Seasonal developn~ent of zooplankton 137
Table 8. Non-parametnc analyses of differences among years for copepods during July to August 1979 to 1982 within different depth strata for 0.333 mm mesh samples [ l -way ANOVA on, rank scores for F-value, p-levels and Duncans multiple range (DMR) test]. Other copepods refers to those other than Calanus finmarchicus. Years refer to the following dates: July 20 to 29, 1980,
August 1 to 4, 1981, August 1 to 3, 1982, ns: not significant
Species/group Strata (m) 5 200 201400 5 400 > 400
F-value DMR Test F-value DMR Test F-value DMR Test F-value DMR Test p-level (p < 0.05) p-level (p < 0.05) p-level (p < 0.05) p-level (p < 0.05)
C. finmarchicus ns 29.99 1982 1 17.05 1982 1 4.24 1982 1 0.0001 0.0001 0.0292
1980 lg8I 1 1980 lg81 1 1981
Other copepods ns 9.13 1982 1 9.12 ns
lg8O 1 0.0005 0.0004 1981
1980 lg81 1 1982 l 1980 1
Total copepods ns 31.60 1982 1 17.32 1982 1 4.26 1982 1 0.0001 0.0001 0.0288
1980 lg81 1 1980 lg81 1 1980 lg81 1 late May each year (Day 145). By late May, peak spawning had past and all regions of Flemish Cap were dominated by a single copepodite stage: stage CIII in 1980 and CIV in 1981. Back calculations predict that peak spawning occurred 36.5 and 38.2 d before Day 145 in 1980 and 1981, respectively (Fig. 6). Thus, in spite of a difference in copepodite stage dominance in late May, predictions of peak spawning are not different (18 April 1980 and 17 April 1981). This indicates that most of the observed interannual difference in stage composition can be explained by differences in temper- ature dependent development rather than an earlier spawning time.
Comparison of Calanus finmarchicus development to that predicted from long-term mean temperatures for Flemish Cap gives some insight into conditions on the Cap during the 3 yr surveyed (1979 to 1981). Develop-
LONGTERM M E A N
l I I I I I I I 3 D A Y 90 100 110 130 140 150 160 170 180
M A Y 1 JUN I Fig. 6. Calanus finmarchicus. Development times predicted in different years based on temperature-dependent Bglehradek equations. C l refers to copepodlte stage Cl , etc. Asterisk: date
from which prolections of stage development were made
ment of C. finmarchicus based on long-term tem- peratures for surface waters overlying Flemish Cap at 5 200 m were scaled relative to an estimated date of peak spawning on Day 107 (15 April). Development during 1979 to 1981 was compared to that predicted from long-term temperatures (Fig. 6). Predictions for 1979 were also scaled to Day 107 as there were no post- peak spawning observations for that year. These com- parisons indicate that development of C. finmarchicus was slower in 1980 than that predicted from the long- term mean, but faster in both 1979 and 1981. In 1980 nauplii development was slowed in April and by stage C1 development lagged the long-term prediction of copepod development by 2.3 d . For stages C11 to C V this lag then remained constant. In 1981 development through all nauplii stages to C1 equalled that predicted for the long-term mean. However, development rate from C1 to C V during May began to increase compared to the long-term mean and by stage C V preceded it by 3.8 d . In 1979 it is estimated that development was faster than the long-term mean for both nauplii and copepodite stages. C1 was 4 d , and C V 5.4 d faster than predicted by long-term mean temperatures.
PEAK SPAWNING Cl CII Clll CIV CV
N A U P L l l I COPEPODITES
l - b
I
t:
. DV
m CV
T
DISCUSSION
i r
* C*
T
I
a,
. m . Cl1
tlll
a
0
D D . . Ul
7 1
I
I
In the invertebrate zooplankton community on Flem- ish Cap, Calanus finmarchicus numerically dominated the larger mesh samples (0.333 and 0.505 mm), was the second most abundant species in small mesh samples (0.165 mm), and was always dominant in terms of biomass. Such dominance of C. finmarchicus has been reported throughout much of the NW Atlantic. Specific areas include Davis Strait (Huntley et al. 1983), seas off East and West Greenland, Irminger Sea and Labrador
&*
* Cl11
Ok
l
I I I
,,
m
Cl
V*

138 Mar. Ecol. Prog. Ser.
Sea (Bainbridge & Corlett 1968), Scotian Shelf (Trem- blay & Roff 1983) and on Georges Bank (Davis 1987). Previous investigations carried out over several years on Flemish Cap demonstrated copepods dominated the plankton from March to July constituting 88 to 98 O/O of the total zooplankton by number (Konstantinov et al. 1985). C. finmarchicus numerically ranged from 39 to 66 % while Oithona similis ranked second, ranging from 28 to 57 % of the total zooplankton. These results were for a 30 cm Juday net using no. 38 gauze (0.500 mm) and are similar to results reported here using the coarser mesh nets.
The timing of spring Calanus finmarchicus spawning reported in this study was mid-April. Peak biomass from 0.165 and 0.333 mm mesh nets occurred during sampling in late May. These observations are sup- ported by previous investigations on Flemish Cap (Vla- dimirskaya 1967, Konstantinov et al. 1985). Both the time of spring spawning and subsequent peak plank- ton biomass occurred approximately 1 mo later on Flemish Cap than in shelf waters to the west and south. On Georges Bank spawning of C. finmarchicus appears to occur in March (Fig. 24.3 in Davis 1987). This also appears to be true of Browns Bank on the southern Scotian Shelf, as McLaren & Corkett (1986) report spawning of C. finmarchicus had not occurred by late February whereas nauplii were abundant by mid-April. Similarly, C. finmarchicus spawning was reported to begin in late February or March on the southern Grand Bank, and by late March nauplii constituted 80 to 90 O/O
of the population (Vladimirskaya 1967), indicating that mass spawning occurred during March. Samples taken between 17 and 31 March 1960 and between 6 April and 2 May 1958 indicated that C. finmarchicus spawn- ing had just started on Flemish Cap, was intensively underway in the Labrador Current (47"N), and was mostly finished on the northern Grand Bank (57 ON) with the plankton being dominated by nauplii at that time (Vladimirskaya 1967).
Therefore, Flemish Cap is characterized as a distinct marine system dominated by Calanus finmarchicus which spawns about l mo later than on the Grand Banks, Scotian Shelf and Georges Bank. Peak plankton biomass probably occurs 1 mo later as well. The timing of C. finmarchicus spring spawning is known to be closely linked to the initiation of the spring bloom (Krauss & Trahms 1983), and the magnitude of produc- bon is dependent on the size of overwintering stock of copepods and the concentration of spring phytoplank- ton (Runge 1988). This would indicate that the spring bloom does not start until April on Flemish Cap, which is supported by chlorophyll observations made during March to May 1979 to 1981 on Flemish Cap (J. Ander- son unpubl.). It is noteworthy that among year differ- ences in abundance and copepodite stages persisted
from early May to August, through the complete development of C. finmarchicus from spawning to stage CV diapause. This indicates the importance of initial conditions during April and May in determining the total production and development of C. finmar- chicus within a year.
This study indicates that there were significant differences in the rate of development among years, but not necessarily in the time of peak spawning. When food is not limiting then development rate of Calanus finmarchicus will vary directly due to water tem- peratures (Landry 1983, Corkett et al. 1986). Differ- ences in water temperatures will be mostly a function of the seasonal heating cycle due to increased solar radiation, but also may vary with advective mixing of cold (Labrador Current) or warm (North Atlantic Current) waters onto Flemish Cap. Analysis of the formation of the mixed layer depth on Flemish Cap indicated measureable differences during 1979 to 1981, with MLD, on average, much deeper early in the year in March and April 1979. However, this did not reduce the surface warming of water in 1979 as temperatures were always high (J. Anderson, J . Booth, R. Keeley, unpubl.).
Advective processes that result in water mass replacement may cause significant movements of plankton on or off Flemish Cap. However, previous studies indicate significant changes in water mass characteristics do not occur on a year-to-year basis. Instead, changes occur cyclically over 3 to 5 yr intervals (Hayes et al. 1977, Keeley 1982). These cycles appear to result from atmospheric forcing of the subarctic gyre and its subsequent interaction with the Labrador and North Atlantic Currents (Hayes et al. 1977). The 3 yr of this study, 1979 to 1981, were characterized by a period of higher temperatures and salinities relative to long- term mean conditions (Keeley 1982). Therefore, there was no apparent shift in oceanographic conditions that might occur coincident with a switch from warm-saline to cold-fresh years.
Flemish Cap waters represent a mixture of Labrador Current and North Atlantic Current water types (Hayes et al. 1977, Keeley 1982). The circulation on Flemish Cap is characterized by a weak anticyclonic circulation (ca 3 to 5 cm S-' residual circulation) that can be dis- rupted by storms (Hill et al. 1975, Hayes et al. 1977, Ross 1980, 1981, Kudlo et al. 1984). Loder et al. (1988) reported a mean annual recirculation time of 67 to 78 d for near-surface waters along the 400 m isobath and a mean residence time of 32 to 40 d for near-surface waters within the 400 m isobath. They concluded there is sufficient residency time to be favourable to biologi- cal processes. In addition, the gyre tends to become more stable with the transition from winter to summer conditions (Kudlo et al. 1984). Therefore, residence

Anderson: Seasonal dev .elopment of zooplankton 139
time would be expected to increase with the seasonal formation of the pycnoline, which is noticeably developed by May (Drinkwater & Trites 1986). The existing oceanographic information supports the fact that the waters over Flemish Cap are retained for
l sufficient periods of time for the growth and mainte- nance of copepod populations.
It is expected that interannual differences observed in both the rate of copepod developn~ent and the mag- nitude of spring spawning would have a significant effect on larval fish feeding. It has long been postulated that the timing of the spring bloom in temperate oceans will have a significant effect on larval fish survival and ultimately fish recruitment (Cushing 1975). However, it has been difficult to demonstrate such a direct relation- ship. More recently, Runge (1988) hypothesized that copepods will act as a direct link between phytoplank- ton and fisheries variability in temperate marine ecosystems dominated by larger copepods. Runge emphasized differences in the timing and magnitude of spring primary production acting through copepod sea- sonal dynamics which will effect differences in larval fish survival among years.
This study demonstrates that significant differences occurred in Calanus finmarchicus development rate among years, even though the date of peak spawning was the same. Previously it has been implied that survival of larval fish is directly linked to the onset of spring production from which other processes follow (Cushing 1975). However, the environment can directly effect changes in the timing of the spring production cycle of copepods among years, independ- ent of the timing of the onset of the spring bloom. It is hypothesized that such inter-annual differences in the rate of copepod development will have a significant effect on larval fish feeding, growth and survival. In this way the copepods act as a direct link between environmental variation and larval fish survival, as proposed by Runge (1988). When copepod develop- ment proceeds too quickly then nauplii, the primary food source of larval fish, would be available for a shorter period of time. This could have a negative impact on larval fish growth and survival. It is impor- tant to emphasize that the difference reported here in copepod development among years is a difference in rates. The absolute difference of one copepodite stage observed in late May in 1980 vs 1981 reflects these differences in rates of change which occurred through- out the spring period. This observation is supported by the eggs and nauplii which show similar differences in the rate of development for the earlier copepod stages.
In addition, changes in the magnitude of production will have a significant effect on growth and survival when larval fish prey is limiting. Density of Calanus finn~archicus in early May was 2.4 X higher in 1981
than in 1979, and in late May was 4.3 X higher than in 1980 for waters 5 400 m depth. From mid-July to the first week of August density varied by a factor of 4.5 in 1979 to 1982. Plankton volume measured during this same period in 1978, 1980 to 1982 ranged from 0.21 to 0.53 m1 m-3, a factor of 2 . 6 ~ . These differences were statistically different and may have had a significant effect on larval fish survival. However, it remains to be demonstrated that such differences in copepod development rate and production do have a significant effect on the feeding, growth and survival of these fish larvae.
Acknowledgements. Many people contributed to the collec- tion and processing of the samples used in this study. Techni- cal assistance through much of the study was provided by C. Fitzpatrick. R. Penney and T. Shears. M. Foy contributed knowledgeably to the taxonomic classifications. Key con- tributors to the Flemish Cap Project include S. Akenhead and G. M y , to whom I attribute constructive input and encourage- ment throughout the study. For thorough and inspiring reviews I thank J. Runge. M. Paranjape and 2 anonymous reviewers.
LITERATURE CITED
Anderson, J. T. (1984). Early life history of redfish (Sebastes spp.) on Flemish Cap. Can. J. Fish. Aquat. Sci. 41: 1106-1116
Anderson, J. T. (1988). A review of size dependent survival during pre-recruit stages of fishes in relation to recruit- ment. J. NW Atl. Fish. Sci. 8: 55-66
Anderson, J. T., Warren. W. G. (1990). Comparison of catch rates among small and large mesh samples for Calanus finmarchicus copepodite stages. Can. J. Fish. Aquat. Sci. (in press)
Bainbridge. V., Corlett, J. (1968). The zooplankton of the Norwestlant surveys. Spec. Publs int. Comrnn NW Atlant. Fish No. 7: 101-122
Bainbridge, V., McKay, B. J. (1968). The feeding of cod and redfish larvae. Spec. Publs int. Cornmn NW Atlant. Fish 7: 187-217
Brown, M. B., Forsythe, A. B. (1974). Robust tests for the equality of variances. J. Am. statist. As. 69: 364-367
Corkett, C. J., McLaren, I. A., Sevigny, J. M. (1986). The rearing of the Calanoid copepods Calanus finmarchicus (Gunnevus), C. glacialis Jaschnov and C. hyperboreus Kroyer with comment on the equiportional rule. In: G. Schriever, Schminke, H. K., Shih, C. T. (eds.) Proc. 2"* Intl. Conf. on Copepoda. Syllogeus 58: 539-546
Cushing, D. H. (1975). Marine ecology and fisheries. Cam- bridge Univ. Press. Cambridge
Cushing, D. H. (1989). A difference in structure between ecosystems in strongly stratified waters in those that are only weakly stratified. J . Plankton Res. 11: 1-13
Davis, C. S. (1987). Zooplankton life cycles. In: Backus, R. H., Bourne, D. W. (eds.) Georges Bank, MIT Press, Cam- bridge, p. 256-267
Drinkwater, K. F., Trites, R. W. (1986). Monthly mean temper- ature and salimty in the Grand Banks reglon. Can. Tech. Rep. Fish. Aquat. Sci. 1450: 1-11 1
Foy, M,, Anderson, J. T. (1986). Marine plankton computer codes for the Northwest Atlantic Fisheries Centre. Can. Data Rep. Fish. Aquat. Sci. No. 585

140 Mar. Ecol. Prog. Ser.
Hayes, R. M,, Mountain, D. G , Wolford, T. C. (1977). Physical oceanography and the abiotic influence on cod recruitment on Flemish Cap. Res. Doc. int. Commn NW Atlant. Fish.
Llly, G. R. (1987). Synopsis of research related to recruitment of Atlantic cod (Gadus morhua) and Atlantic Redfishes (Sebastes sp.) on Flemish Cap. NW Atl. Fish. Org. Sci. Coun. Stud. 11: 109-122
Loder, J . W., Ross, C. K. , Smith, P. C. (1988). A space- and time-scale characterization of circulation and mixing over submarine banks, with application to the northwestern Atlantic continental shelf. Can. J. Fish. Aquat. Sci. 45: 1860-1885
McLaren, I. A., Corkett, C. J. (1986). Life cycles and produc- tion of two copepods on the Scotian Shelf, eastern Canada. In: Schriever. G., Schminke, H. K., Shih, C.-T. (eds.) Proc. of 2"d Intl. Conf. on Copepoda, Syllogeus 58: 362- 368
Ross, C. K. (1980). Moored current meter data from Flemish Cap January-July, 1979, NW Atl. Fish. Org. SCR Doc. 80/ W 1 2 8 . Ser. No. N200: 1-13
Ross, C. K. (1981). Drift of satellite-tracked buoys on Flemish Cap. 1979-1980. NW Atl. Fish. Org. Sci. Coun. Stud. 1: 47-50
Runge, J. A. (1988). Should we expect a relationship between primary production and fisheries? The role of copepod dynamics a s a filter of trophic variability. Hydrobiol. 167/ 168: 61-71
SAS (Statistical Analysis System) (1985). SAS user's guide: statistics version S edition. Statistical analysis Institute Inc., Cary, North Carolina
Siegel, S. (1956). Non-parametric statistics for the behavioural sciences. McGraw Hill, Toronto
This article was presented by Professor R. L. Haedrich, St. John's, Newfoundland, Canada
Sokal, R. R.. Rohlf, F. J. (1969). Biometry. W. H. Freeman and Co. San Francisco
Smith, P. E., Richardson, S. L. (1971). Standard techniques for pelagic fish egg and larval surveys. FAO Tech. Pap. No. 175
Tremblay. M. J. (1981). Zooplankton community structure, biomass and production of the Scotian Shelf, with special reference to Emerald Bank. M. Sc. thesis, University of Guelph
Tremblay, M. J., Roff, J. C. (1983). Production estimates for Scotian Shelf copepods based on mass specific P/B ratios. Can. J. Fish. Aquat. Sci. 40: 749-753
Van Guelpen, L., Markle, D. F., Duggan, D. J. (1982). An evaluation of accuracy, precision, and speed of several zooplankton subsampling techniques. J. Cons. int. Explor. Mer 40: 226-236
Vladimirskaya, E. V. (1967). Seasonal population dynamics of Calanus finmarchicus (Gunner) in the northwestern Atlan- tic, 1958-1961. Res. Bull. int. Commn NW Atlant. Fish. 4: 4 1-52
Webster, I., Anderson, J. T. (1987). A model for simulating the towing performance of the bongo sampler. Deep-Sea Res. 34: 1277-1291
Williams, R., Conway, D. V. P. (1988). Vertical distribution and seasonal numerical abundance of the Calanidae in oceanic waters to the south-west of the British Isles. Hydrobiologia 167/168: 259-266
Williams, R., Conway, D. V. P., Collins, N. R. (1987). Vertical distributions of eggs, nauplii and copepodites of Calanus helgolandicus (Copepoda: Cmstacea) in the Celtic Sea. Mar. Biol. 96: 247-252
Manuscript first received: February 2, 1990 Revised version accepted: July 1 7, 1990